3.1. Measured SWC and Transformation
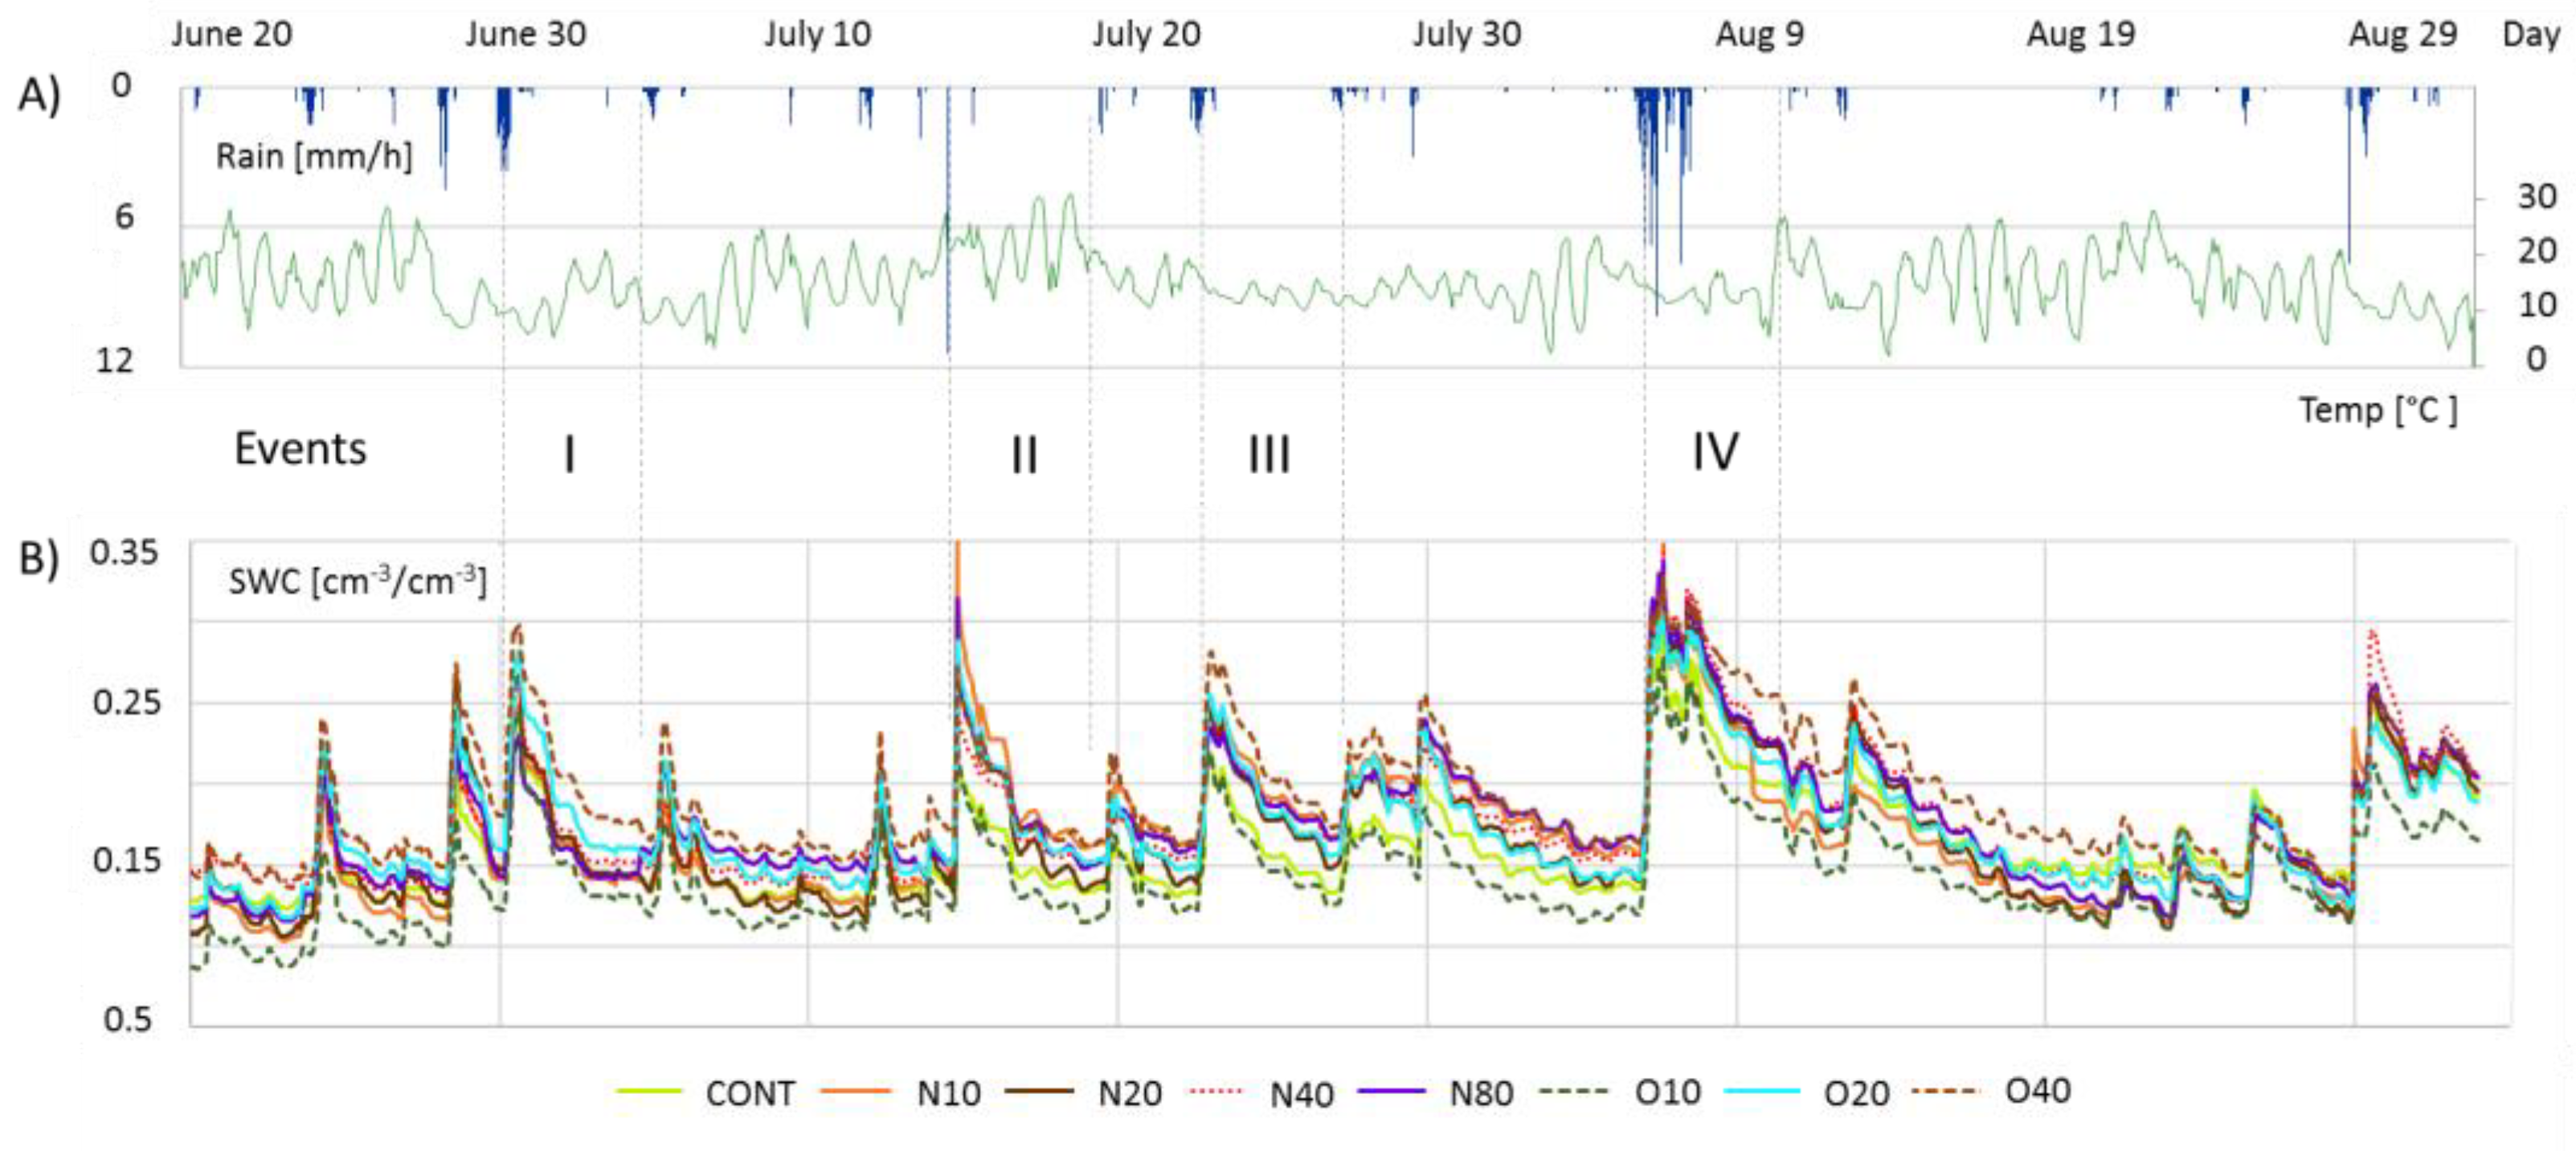
From the entire period, we identified 20 rain events (
Figure 2A), resulting in 580 observations, if all available replicates were used (SWC parameters 1–7), and 160 observations for the averaged SWC values, including the control (SWC parameters 8–13). The ANOVA results for all the plots (
Table 3) provide a clear pattern: while storage parameters SWC
i, SWC
p, and SWC
f (SWC parameters 1–3) and their divergence from the control (SWC parameters 8–10) were highly significant (
p < 0.05), no kinetic parameters were shown to be significantly affected (
p > 0.05) by biochar. The control and O10 had the lowest SWC over the full period, while O40 and N80 had the highest measured SWC (
Figure 2B,
Figure 3). The basic descriptive statistics show correspondingly lower MED, as well as a lower SD for the control and O10, indicating generally low and temporally stable SWC values (Supplementary date,
Table 2). Furthermore, the control had the lowest CV. O40 had the highest MED, followed by N80, as may also be inferred from
Figure 2B and as summarized in
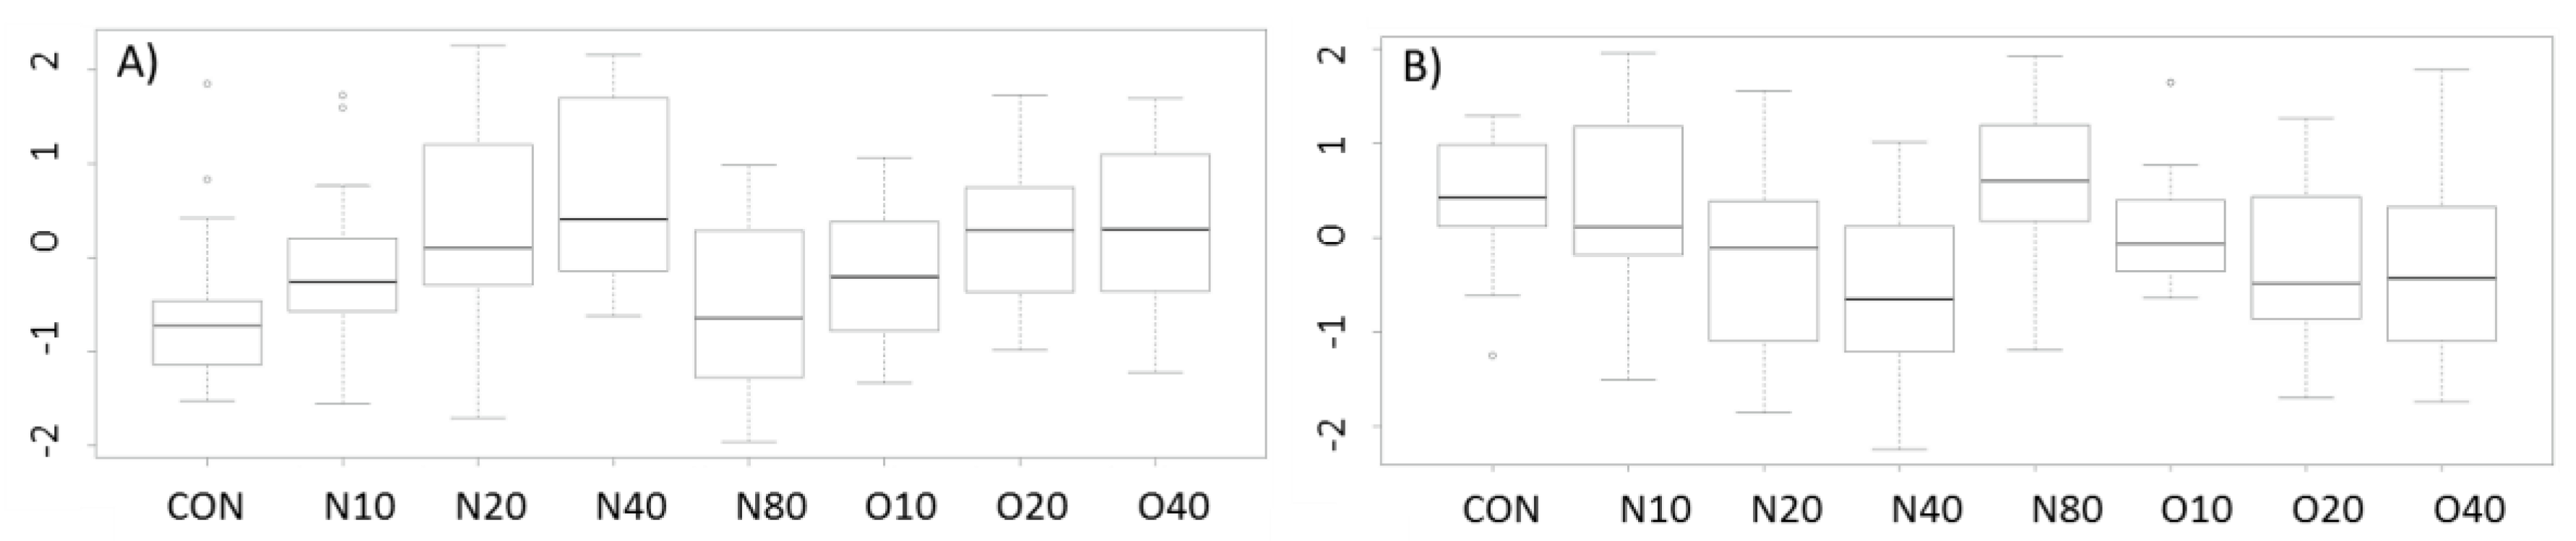
Figure 3. The minimal SWC (MIN) and maximal SWC (MAX) did not exhibit clear trends, indicating rather a complex interaction between biochar rates, rain amplitude and SWC values. Nevertheless, a per-event proportional analysis of the wetting and drying rates showed them to be directly or inversely related to the biochar rate in the 0 to 40 Mg C ha
−1 range, respectively. The 80 Mg C ha
−1 plots, however, did exhibit wetting and drying kinetics statistically similar to the control treatments (
Figure 3), albeit at different SWC ranges (
Figure 2B).
These results indicate that varying biochar rates led to consistent and statistically significant differences among SWC storage parameters (initial, peak, end), and consistent (
Figure 2B), but statistically not significant (
Table 3 parameters 4–7 and 11–12) differences in the actual absolute changes due to wetting and drying. The effects of two different incorporation times (Old vs. New) were statically less uniform: the ANOVA showed no significant effect for any of the considered parameters if all plots were considered (
p > 0.05, data not shown). However, a comparison of individual biochar rates (
Table 3, columns b–d) uncovered a significant application timing (maturity) effects on most storage parameters, with the exception of N20, while the SWC kinetics remained again unaffected. For O40, even the drying rate (parameter 7) was significantly lower than for N40. It is known that biochar can undergo a maturation process after application as a product of various processes. Maturation involves surface oxidation [
49,
50], sorption of soil organic matter rich in oxygen-containing groups [
51,
52] and increase its surface area while decreasing the pore diameter, relative to fresh biochar [
53]. Another possible cause for the different performances of the New vs. Old plots might be related to the initial water repellency characteristics of biochar [
54,
55], which change with aging [
56,
57]. For the tested soil, biochar contact to organic acids and other chemical soil components could have caused the aging and decreasing of the hydrophobicity, as reported by previous studies at similar soils [
56]. However, given the short temporal differences between Old vs. New in our study, it is unclear how much of the differences can be truly explained as being due to maturation. It is further possible that the soil of Old biochar plots might have compacted (over the one-year period), reducing macro- porosity in comparison to the New biochar plots, and enhancing soil water retention, as described by Dokoohaki et al. [
58]. Regarding the measured SWC range (MAX–MIN) for N10 vs. O10 and N40 vs. O40, the New plots provided a larger range which could also be related to changes in total porosity, confirming the assumed maturation/compaction processes. Since granular biochar also contains pore spaces capable of retaining water, at initial stages, water retention in biochar-amended soils can be higher. However, this can be reduced with time due to the temporal decomposition of biochar in soils [
59,
60]. An explanation for the similar responses from N20 and O20 cannot be assumed from the available data. Long-term effects need to be evaluated for clear understanding of the effect of biochar maturity at field scale on the soil hydrology of podzolic soils.
The ANOVA for boundary characteristics for the wetting and drying events (SWC
i, SWC
p, and SWC
f) consistently exposed significant differences (
p < 0.001) between the treatments for all parameters and rain events (data not shown). The statistically significant differences in SWC
i, SWC
p, and SWC
f indicate the influence of biochar on temporal characteristics. However, analyses of individual rain responses (
Appendix A,
Table A2) show complex interactions in relation to biochar rates. Analyses based on absolute SWC data show that higher biochar rates affected wetting kinetics in a manner statistically different from the control (
Appendix A,
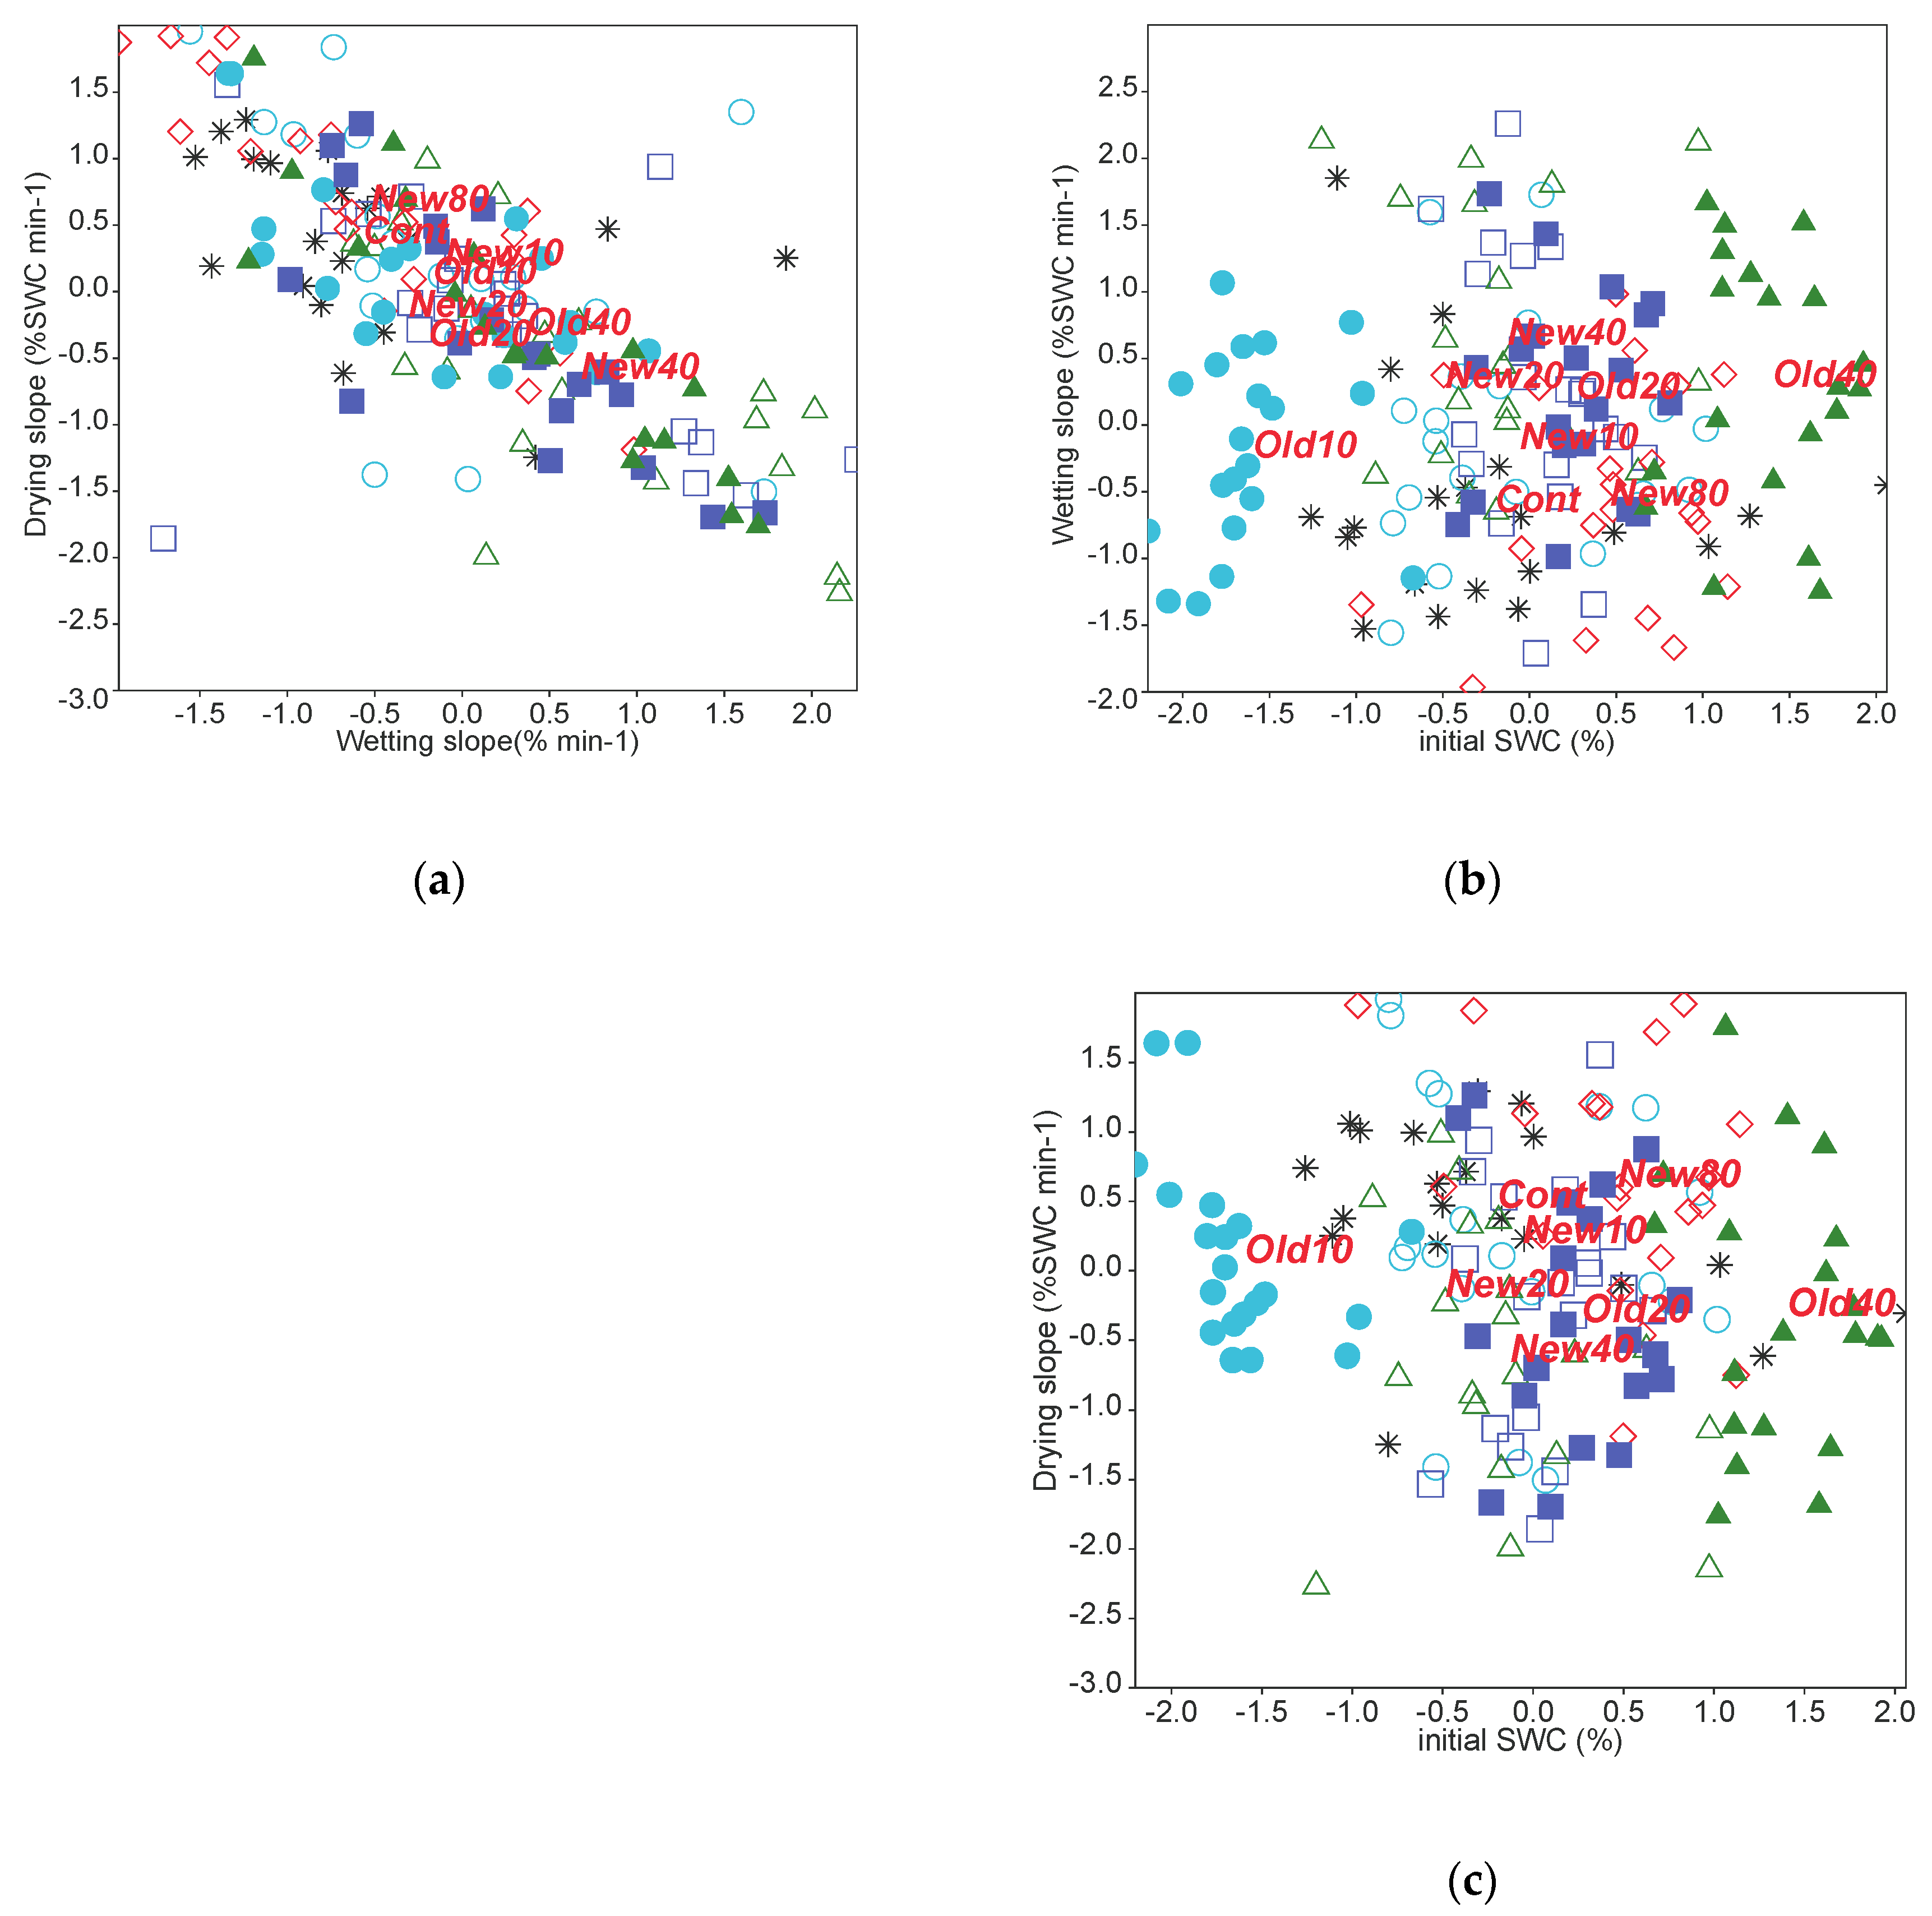
Table A2); this was less clear for the lower biochar rates, i.e., N10, O10 and N20. Nevertheless, the overall trend in wetting and drying, when analysed independently of the rain amount (
Table 4 and
Appendix A,
Figure A1), showed that wetting rates had direct relationships, while drying rates showed inverse relationships to biochar rates for the 0 to 40 Mg C ha
−1 treatments. The initial SWC at the start of each rain did not have a significant role in the wetting rate differences among treatments (see statistics in
Appendix A,
Figure A1). On the other hand, the SWC
p, at the start of drying had a significant (
p < 0.001), albeit minor (r = −0.55; R
2 = 0.3), relationship with the proportional drying rates. The SWC at the end of the drying event was still significantly (
p = 0.03), but even more marginally (r = −0.17; R
2 = 0.03) related to the proportional drying rates (see statistics in
Appendix A,
Figure A1).
The non-uniform relation between biochar rate and application scheduling, and the soil water parameters indicates the complexity of interactions and their effects. This was most obvious for the maximum biochar rate N80, which showed an increase in storage capacity while it has wetting and drying kinetics more akin to the non-treated plot. The differences in drying parameters between biochar and control plots were generally large and statistically significant, suggesting the presence of biochar as a main factor (
Figure 3;
Appendix A,
Table A2 and
Figure A1). Control plots were the slowest to wet and the fastest to dry. Both wetting and drying characteristics were affected by biochar, however, in an inconsistent relationship to the cumulative incorporation rates. The differences in water storage capacity and kinetics after the addition of biochar were clearly described by the inverse relationship between wetting and drying (
Figure 3,
Appendix A Figure A1a). Wetting was always positively associated with the biochar application rate (
Figure 3), albeit not significantly for N80 and O10 (
Table 4), whereas drying was proportionally but inversely related to the biochar rate except for the N80 (
Figure 3,
Table 4). The differences in the wetting and drying rates indicate a hysteresis effect present for all treatments (slope different from 1:1;
Appendix A Figure A1a). In respect to agricultural purposes, the application of 40 Mg C ha
−1 provided the best results to increase and retain soil water.
3.2. Hydrus 1D Simulation
The Hydrus 1D models resulted in good to very good accuracies for SWC predictions, with an average RMSE (cm
3 cm
−3) of 0.015 (ranging from 0.008 to 0.025), and an average correlation (R
2) of 0.836 (ranging from 0.961 to 0.691) (
Table 5). Based on the archived accuracies, we assumed that the Hydrus 1D results provided valuable supporting information.
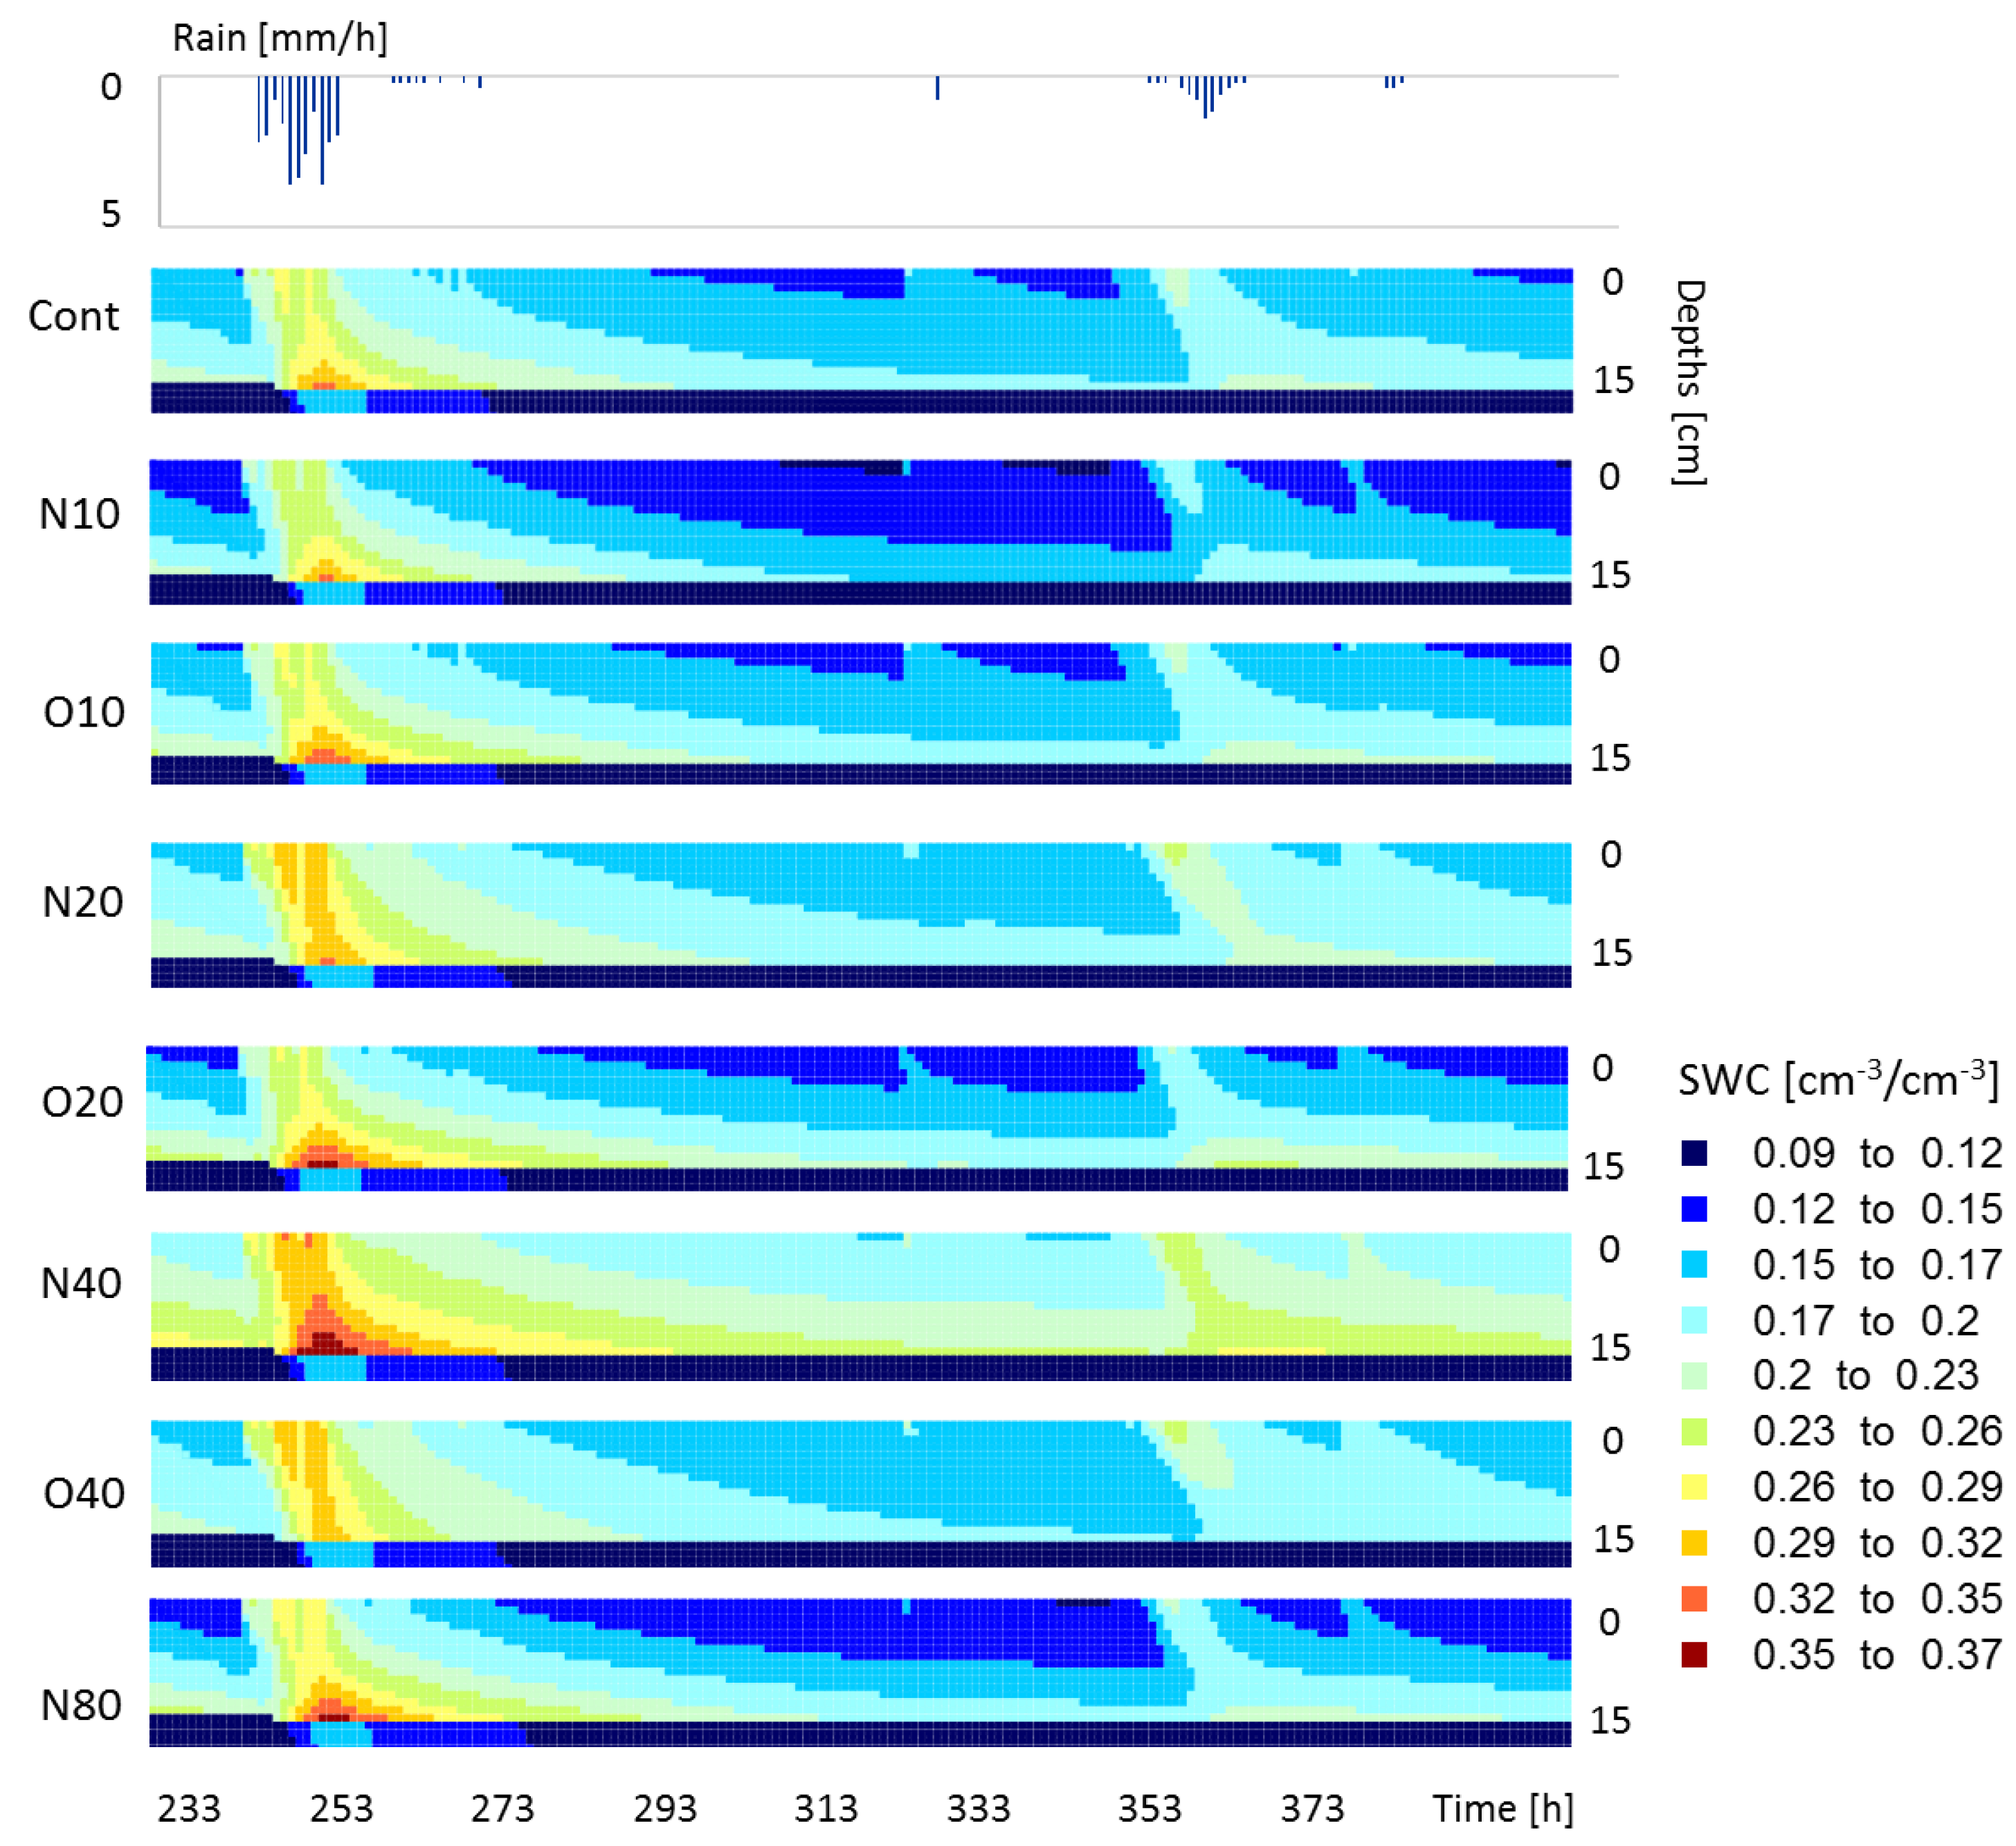
Figure 4 displays the distribution of SWC over a period of 7.5 days (i.e., Event I) as a means to visualise one-dimensional water flow and storage within the soil profile for the different biochar treatments (the simulations for other rain events were very similar).
While the simulation revealed similar initial responses to rainfall, the drying characteristics over the soil column diverged more noticeably, analogous to the measured SWC at a 0–5 cm depth. Biochar increased the WHC, particularly for higher biochar rates (note the difference in drying slopes), an observation supported by previous studies [
7,
8] and confirmed by the measured SWC data. Where higher biochar rates were incorporated, large portions of the upper layer remained wet (SWC > 17%,
Figure 4) over several days between the rain events, while O10, N10 and the control dried relatively quicker. Furthermore, the rain water accumulated at the upper layer boundary, several centimeters above the subjacent sand layer; for the higher biochar rates, the simulated SWC reached values > 30% for several hours after the rain event. A higher SWC availability at a depth of approximately 10–15 cm can facilitate the water uptake by roots and thus, plant growth. This information can be useful for the selection of appropriate crops based on their physiological needs.
Table 5 displays the cumulative water flux values (cm h
−1) calculated from the observation nodes located at 6 and 16 cm under the soil surface. As expected, the flux values show significant attenuations with increasing biochar rate, more distinct at the layer boundary. In comparison to the unamended plots (control), the biochar incorporation reduced leaching up to 22.5 cm h
−1 at 6 cm (N40) and 22.3 cm h
−1 at 16 cm (N80). With respect to WHC, the incorporation rate of 40 Mg C ha
−1 provided the best results within the top layer. Given our data, it is unclear why the WHC of the N40 rate was larger than that for N80. A variability in electrostatically driven parameters, e.g., repellence or interactions from the high amount of new added biochar with charged molecules in soil, might partially explain this result, but the lack of an O80 treatment did not allow for a direct comparison. The lower performance of N80 in respect to WHC might also suggest non-linear changes in soil porosity parameters. However, the effect was limited to WHC and wetting and drying rates only; both leaching potential and median SWC were still highest for the 80 Mg C ha
−1 treatment (
Table A1). Thus, the simulations suggest that biochar could mitigate deep percolation and solute transport in boreal Podzols in a direct relationship to biochar rates. With respect to mitigating the leaching processes of potentially harmful substances from agricultural fields, such as nitrate and pesticides, our findings support previous studies based on other soil types [
14,
15] and could have relevance for other areas of boreal agriculture. However, we emphasize that long-term experiments and simulation exercises both at laboratory and field scales are needed to confirm and expand upon these results, especially as biochar functional parameters change with age [
61,
62].


