Article

Desorption of Arsenic from Calcareous Mine Affected Soils by Phosphate Fertilizers Application in Relation to Soil Properties and As Partitioning

1
Laboratory of Soils and Agricultural Chemistry, Agricultural University of Athens, Iera Odos 75, 11855 Athens, Greece
2
Soil Science Laboratory, Aristotle University of Thessaloniki, 54124 Thessaloniki, Greece
*
Author to whom correspondence should be addressed.
Soil Syst. 2019, 3(3), 54; https://doi.org/10.3390/soilsystems3030054
Submission received: 28 June 2019 / Revised: 13 August 2019 / Accepted: 15 August 2019 / Published: 20 August 2019

Abstract

:
The ability of fertilizer phosphates to desorb arsenates from soils is not yet adequately studied especially in cases of mining lands severely contaminated with arsenic (As). In this study, two soils with different physicochemical properties and heavily contaminated with As equilibrated with solutions containing various rates of phosphates either in the form of triple superphosphate fertilizer (TSP) or as NH4H2PO4 using NaNO3 as background electrolyte. A treatment with TSP in water was also applied to mimic agronomic practices. In general, increased P rates resulted in higher As release and to lower P sorption. Depending on the P rate, desorbed As ranged between 8 and 64.4 mg/kg for soil 1 and between 16.5 and 35.3 mg/kg for soil 2, corresponding to more than 50% of the potentially available As, as defined by the sum of the two first fractions of Wenzel sequential extraction scheme. Arsenic desorption patterns substantially differ between the two soils, mainly affected by active carbonates, organic matter and Fe and Al oxides contents. Though the differences between P treatments were not always significant, the presence of NaNO3 increased the desorbing strength of the solutions. Phosphorus sorption capacity was high for both soils, but excess P addition led to high P concentrations in the equilibrium solutions, implying leaching hazard.

1. Introduction

Mobility and bioavailability of potential toxic elements (PTEs) in contaminated soils, as well as the pedo-environmental factors that affect them, are issues of chief importance for the research community for two main reasons. Firstly, most of PTEs can cause toxicity even at low concentrations jeopardizing human and animal health [1]. Secondly, it is necessary to better understand the geochemical behavior of PTEs in order to develop and apply techniques related to restoration of contaminated soils [2,3].
Arsenic (As) that is ranked as the twentieth most abundant element in the earth crust with average concentration 1.5 mg/kg, is a metalloid with a direct health risk to humans and ecosystems [4]. According to the World Health Organization the maximum tolerable daily intake of inorganic As is 2 μg As/kg body weight [5]. The increased intake of As may lead to various medical problems such as melanosis, hypatomegaly and problems related to the blood system such as heamolysis and bone narrow depression, to the nervous system such as central nervous symptoms, polyneuropathy, encephalopathy, to the cardio system and to gastrointestinal system [5].
High As levels are especially prevalent in mine impacted lands since mining and metal processing operations is a major anthropogenic source of As to the environment. For example, Nriagu and Pacyna [6] have reported that for every ton of copper produced, 1.5 kg of As is released. Moreover, numerous studies have shown high total As concentrations in mine affected soils that can reach up to several thousand mg kg−1, substantially exceeding the intervention value of 55 mg kg−1 according to the Dutch standards [7]. Recently, Kalyvas et al. [8] concluded that in mine affected soils, As was found to be primarily associated with the amorphous/poorly crystallized and the well crystallized Fe, Al, Mn oxides.
In the soil environment, As is found in two distinct chemical species: (i) Arsenite as a hydroxyl species (H3AsO3, H2AsO3) and (ii) arsenate as an oxyanion (H2AsO4−1 or HAsO4−2) [9]. Arsenates and phosphates chemical behavior is considered as similar regarding either biological processes, such as uptake by plants and incorporation in micro-organisms cells, or their interaction with soil constituents as they compete for available sorption sites [10,11]. However, apart from the sorption sites that both oxyanions compete to adsorb there are also specific sites where As or P preferentially sorbed [12]. Indeed, phosphate shows great affinity for organic matter, Fe and Al oxides and carbonates [13,14] while As oxyanions do not bound to organic substances as effectively as phosphates [15,16]. Accordingly, sequential extraction schemes specifically developed for As fractionation in soils do not include a specific step to determine As connected to organic matter [8]. Nevertheless, it has been observed that in the presence of both oxyanions in soil solution, phosphate occupies easier the sorption sites and therefore enables As desorption in soil solution, resulting in increased mobility of As in soil environment and to higher availability for uptake by plants [4].
The geochemical behavior of both P and As and their interactions has been studied extensively, regarding especially As adsorption by synthetic and natural soil minerals in the presence of phosphates [17]. For example, O’Reilly et al. [18] found that arsenate bonds on goethite are stronger than phosphate bonds as arsenate desorption from goethite, using phosphate solutions, accounted only for 35% of the adsorbed arsenate. In contrast, phosphate/arsenate competitive sorption and especially the release of As in the soil solution due to P fertilizers application has not yet been studied in mine affected soils. Following this, risk assessment efforts considering the possible increase of As mobility and availability in the case of soil remediation actions via the proper phosphate fertilization dose, are almost missing from the literature.
In the present work batch experiments were conducted to: (a) comparatively evaluate As mobilization in two highly contaminated calcareous mine soils due to phosphates application, either in the form of a commercial triple superphosphate fertilizer (TSP) or in the form of NH4H2PO4 and (b) to study As desorption and P sorption behavior in the two soils in relation to soil properties.

2. Materials and Methods
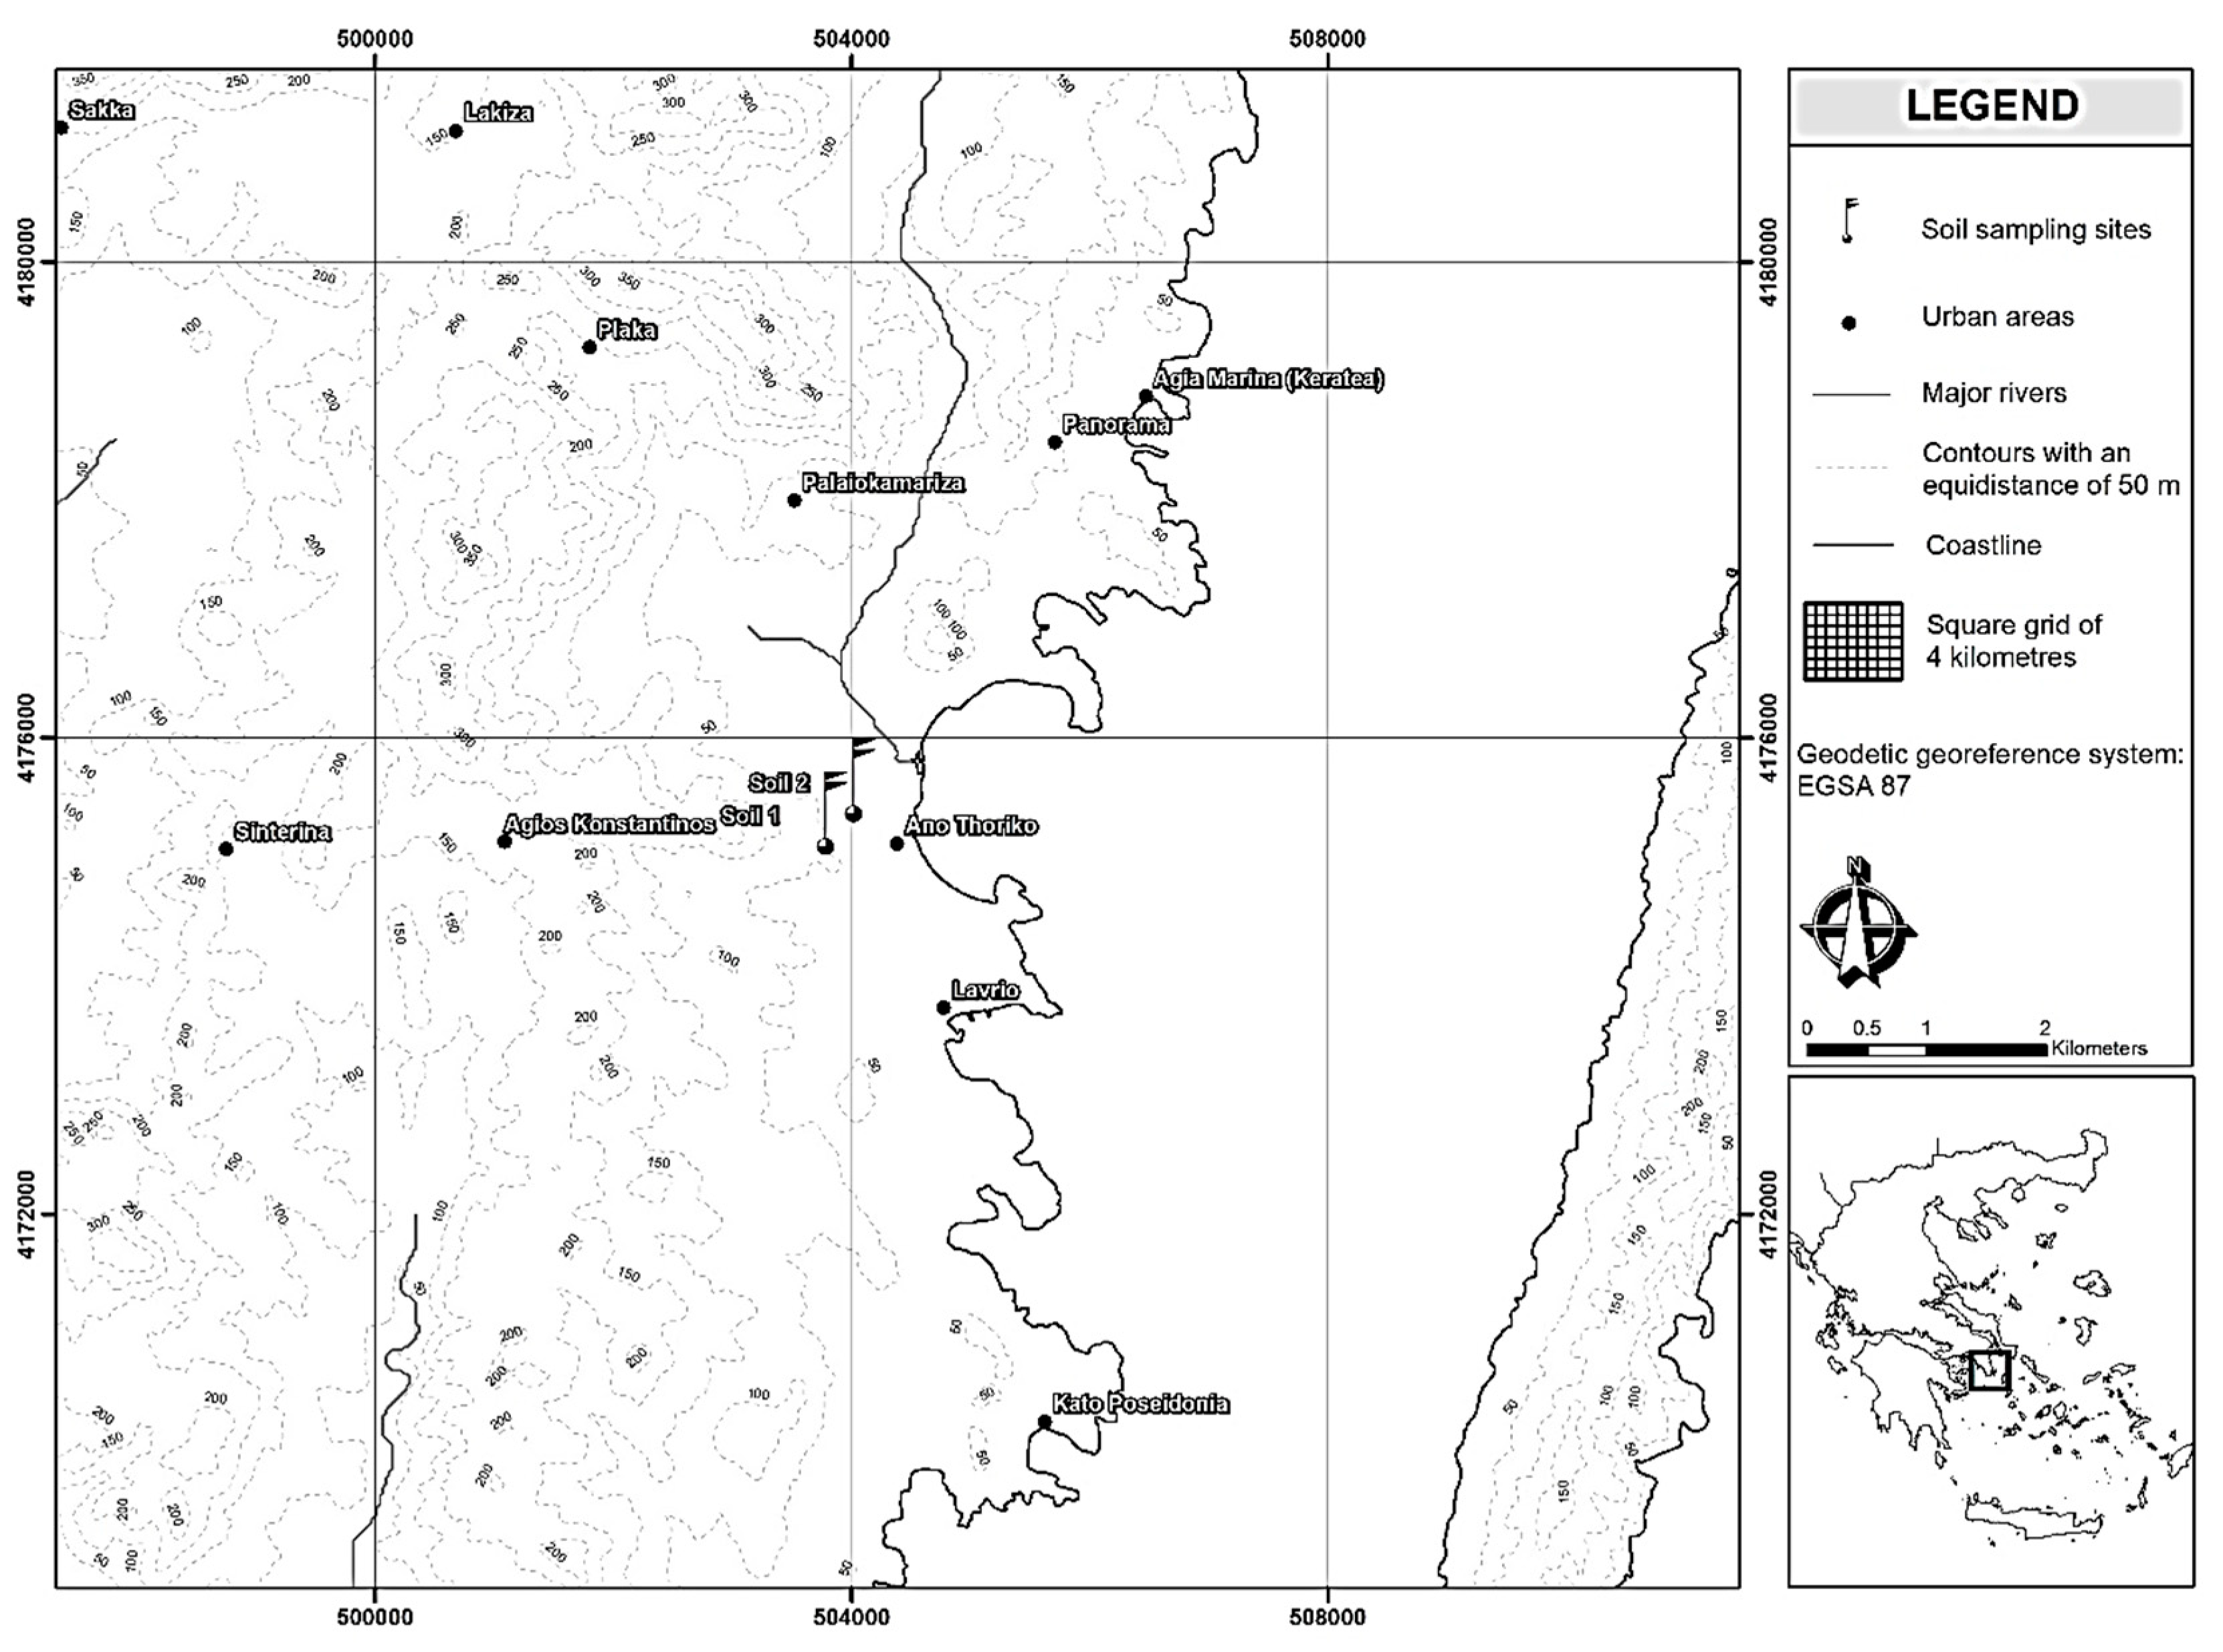
2.1. Soils

Two topsoil samples were used in this study, collected from Lavrion area (Attica, Greece) (Figure 1). The Lavrion greater area is a former mining area from almost 3000 BC, and many soils are heavily contaminated with metals and As. Soil samples were transferred in the laboratory, air-dried, crushed and passed through a 2-mm sieve. pH was measured in a 1:1 (w/v) soil/water ratio, cation exchange capacity (CEC) was determined by the ammonium acetate method [19] and organic carbon (OC) content was obtained by the Walkley-Black’s procedure [20]. Particle size distribution was determined by the hydrometer method [21] while total carbonates content (CaCO3) was calculated by measuring the evolved CO2 following HCl dissolution [22]. Active carbonate fraction was obtained according to the ammonium oxalate method as described by Loeppert and Suarez [23]. Organic phosphorus was determined according to the method proposed by Saunders and Williams [24] as modified by Walker and Adams [25] and available phosphorous (P) was obtained by the Olsen method [26]. Free and amorphous Fe and Al oxides contents were determined by the sodium-bicarbonate-dithionate (CBD) [27] and by the ammonium oxalate buffer methods [28], respectively. Total As concentration was obtained by a single step aqua regia extraction [29]. The sequential extraction protocol (SEP) proposed by Wenzel et al. [30] as modified by Kalyvas et al. [8] was applied to determine As partitioning in soils. In brief, As was sequentially extracted for nonspecifically sorbed As (outer sphere complexes) with (NH4)2 SO4, 0.05 mol L−1, specifically sorbed As (inner sphere complexes) with NH4H2PO4 0.05 mol L−1, As sorbed on amorphous and poorly crystalline hydrous oxides of Fe and Al with NH4+-oxalate buffer 0.2 mol L−1 (pH = 3.25), As sorbed on well-crystallized hydrous oxides of Fe and Al with NH4+–oxalate buffer 0.2 mol L−1 + ascorbic acid 0.1 mol L−1 (pH = 3.25) and residual As with aqua regia (modification of the original protocol).
At all stages of sample preparation and analysis, stringent precautions were taken to minimize contamination through air, glassware and reagents. All glassware were soaked for 24 h in 10% (v/v) HNO3 and then rinsed three times with deionized water.

2.2. Stock Solutions and Reagents

Stock solutions of varying phosphates concentrations were prepared by dilution of appropriate amounts of commercial triple superphosphate fertilizer (0-46-0) (TSP) in deionized water (treatment T1), of TSP in 0.01 M NaNO3 electrolyte solution (treatment T2) and of NH4H2PO4 in 0.01 M NaNO3 electrolyte solution (treatment T3). Phosphorus concentrations in the stock solutions (P rates) were 2.36, 6.77, 11.08, 15.92, 21.96, 40.59 and 88.88 mg L−1. Similarly, Strawn (9) examined the effects of P amendments on As mobilization using P sorption isotherm experiments with a wide range of P concentrations from 0.098 to 198 mg L−1. Prior to dilution, TSP particles pulverized, and multiple tests were run to determine TSP solubility in deionized water alone and in the presence of 0.01 M NaNO3. Accordingly, the mean value for TSP solubility was calculated (96 ± 0.5%) and used as reference for the preparation of stock solutions. To obtain the appropriate P concentrations in all equilibrating solutions, P concentration was checked, and minor adjustments performed where necessary. NH4H2PO4 reagent in the T3 treatment, though in lower solution concentrations, was used to partially simulate the second step of Wenzel et al. SEP [30] and to extract specifically sorbed and presumably most of the easily mobilizable As forms (W2 and W1 fractions of the SEP, respectively).
All reagents used in this study were of analytical grade and supplied from Merck Millipore (Darmstadt, Germany). The reagents used were: Ammonium sulfate [(NH4)2SO4], Ammonium dihydrogen phosphate [(NH4)H2PO4], di-Ammonium oxalate monohydrate [(NH4)2C2O4*H2O], Oxalic acid dihydrate [(COOH)2*2H2O], L(+)-Ascorbic Acid (C6H8O6), Nitric acid (HNO3, 65% w/v), Hydrochloric acid (HCl, 37% w/v), Sulfuric acid (H2SO4, 98% w/v), Potassium dichromate (K2Cr2O7), Iron(II) sulfate heptahydrate (FeSO4*7H2O), Diphenylamine-4-sulfonic acid barium (C₂₄H₂₀BaN₂O₆S₂), Sodium bicarbonate (NaHCO3), Antimony potassium tartrate [K(SbO)C4H4O6*1/2H2O], Ammonium heptamolybdate tetrahydrate [(NH₄)₆Mo₇O₂₄*4H₂O], Ammonium acetate (CH3COONH4), Sodium nitrate (NaNO3), Potassium iodide (KI), Sodium borohydride (NaBH4), Sodium Hydroxide (NaOH), 1000 mg L−1 Phosphate standard solution (KH₂PO₄ in H₂O) and 1000 mg L−1 As, (As2O5 in H2O) Titrisol®.

2.3. Batch Experiments

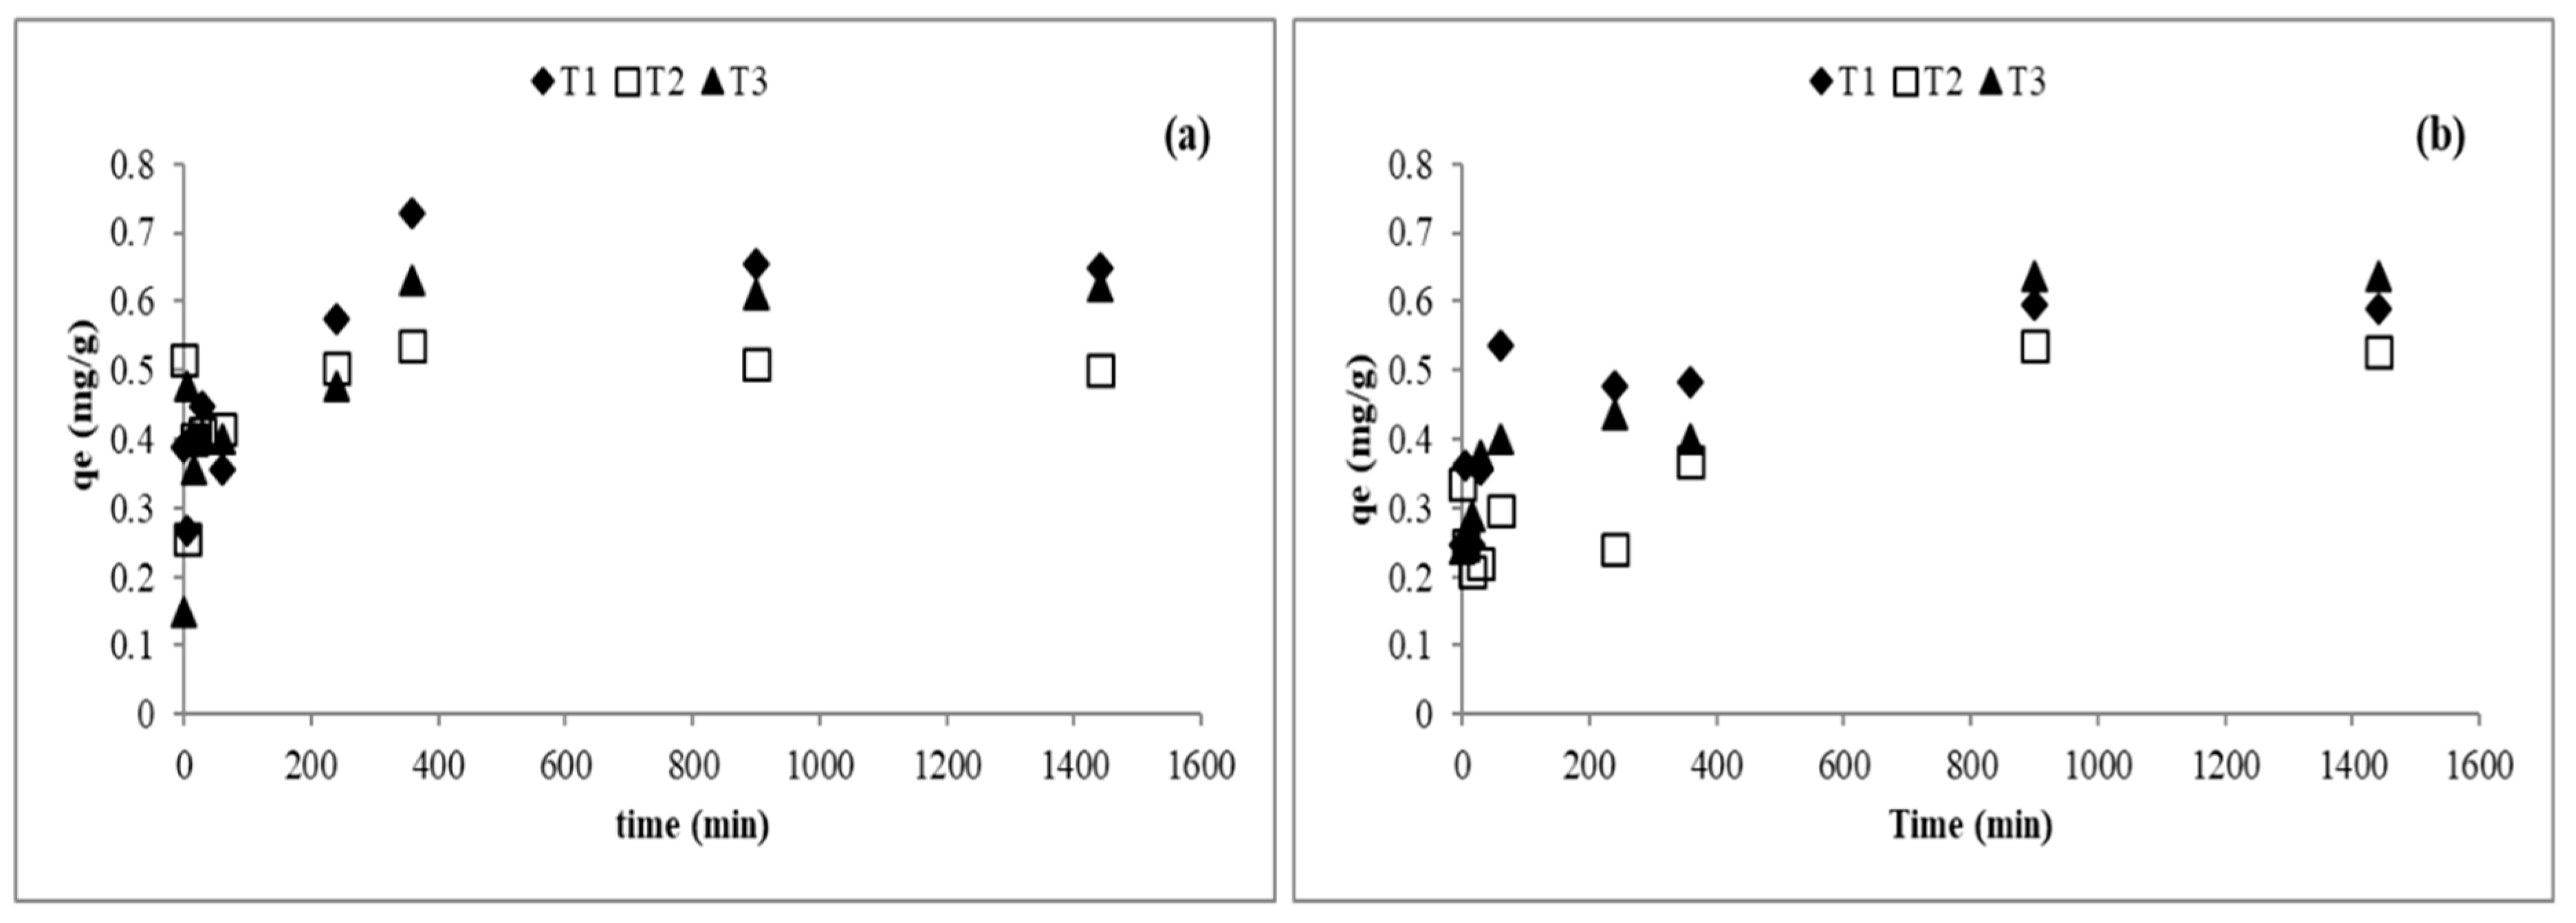
2.3.1. Effect of Contact Time

To estimate equilibration time, a kinetic experiment was conducted at constant temperature of 22 ± 1 °C. An aliquot of 20 mL from the highest P concentration (88.88 mg L−1) of the three initial solutions was added in 1g soil placed in 50 mL falcon tubes and sorbed P was calculated for nine equilibrium times ranging from 1 min to 24 h. The amounts of P retained were calculated from the difference between supernatant concentrations and the initial solutions concentrations according to the following formula:
q t = ( C i C t ) V m
where Ci (mg/L) is the concentration of phosphorus in the initial solution and Ct (mg/L) is the concentration of P in solution at time t. V (L) is the solution volume and m (g) is the dry weight of soil.
The results are presented in Figure 2 and showed that for both soils P sorption was very fast, and the majority of the available sorption sites were covered within 60 min. A similar P equilibration pattern was observed by Shafqat and Pierzynski [31]. However, for all P treatments equilibrium reached between 6 and 15 h and thus the 24 h equilibration time was selected for the conducted batch experiments.

2.3.2. As Desorption—P Sorption Batch Experiments

A two factor (P treatment × P rate) experimental design in three replicates was followed to study the desorption of As in the presence of P as well as P sorption in the studied soils. One gram of air-dried soil was weighed into a series of 50 mL falcon tubes and 20 mL of solution containing the appropriate phosphorus concentrations were added. The bottles were gently shaken at 125 rpm for 24 h in a reciprocal shaker, placed in an incubator with a standard temperature of 22 ± 1 °C. Then, the falcon tubes were centrifuged for 5 min at 2200 rpm and the supernatants were filtered through a Whatman paper No 42 and analyzed for As and P concentrations. Moreover, since pH plays an important role on As speciation in soils, the pH values of the initial P and of the equilibrium solutions were also recorded.

2.3.3. Calculation of As Desorption and P Sorption Percentage

Following the assumption that P additions release As from the first two chemically defined fractions (W1 + W2) as determined by the Wenzel SEP [27], As desorption percentage for each equilibrium solution was calculated as:
As desorbed% = (As desorbed (mg/kg)/As in W1 + W2 (mg/kg)) × 100.
Phosphorus sorption percentage was calculated by the difference between initial and equilibrium solutions P concentrations.

2.4. Analytical Determinations

Arsenic concentrations were determined by atomic absorption spectrophotometry, using a Varian—spectra A300 system. For the determination of As at low concentrations, the hydride generator Varian model VGA 77 was used. Phosphorus concentrations were determined by a Shimadzu UV-1700 spectrophotometer. A control sample was analyzed for every 10 samples and reproducibility was tested by reanalyzing 30% of the samples. The analytical precision, estimated as the relative standard deviation of three measurements, was less than 3% for AAS and spectrophotometer determinations and less than 5% for HGAAS determinations. ERM-CC141 European Reference Material was analyzed to assess the accuracy of aqua regia procedure followed for the total As determination. The results showed that mean As recovery ranged between 96 and 103% [8].

2.5. Statistics

The statistical analysis was carried out by using STATISTICA (Version 10).

3. Results

3.1. Soil Properties
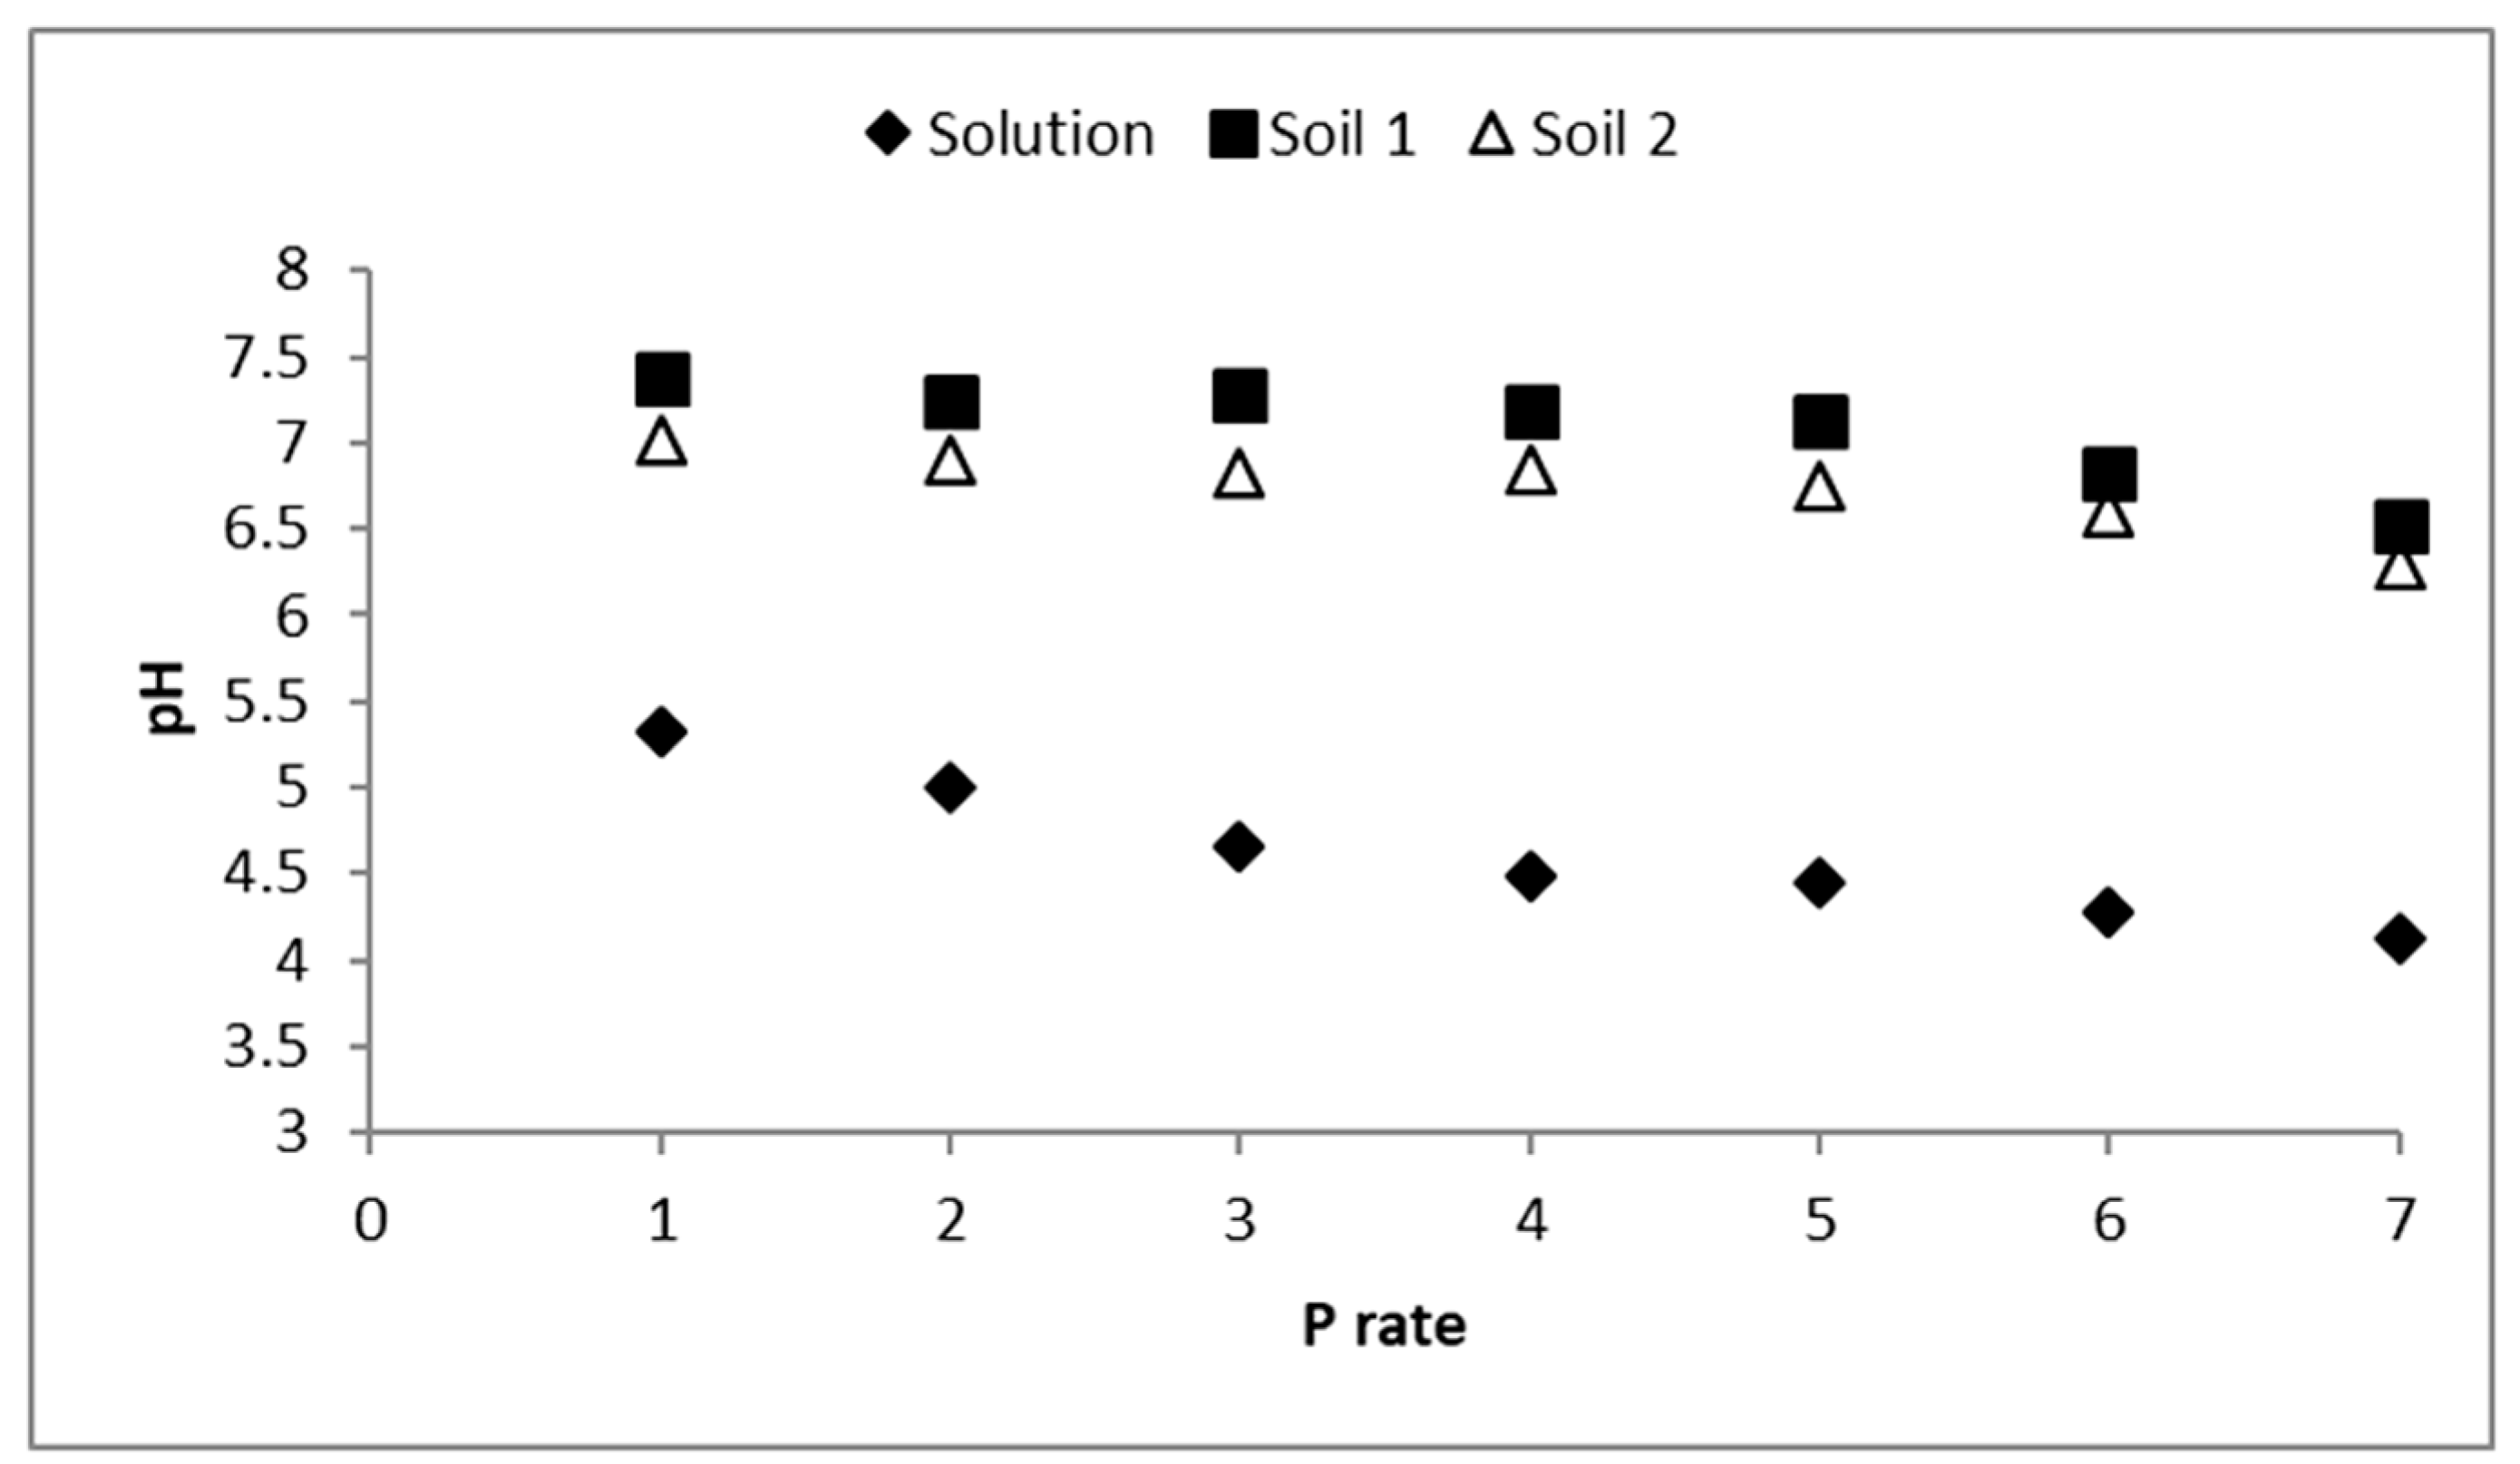
The properties of the two soils are summarized in Table 1 along with the results of As fractionation according to the sequential extraction protocol developed by Wenzel et al. [30] as modified by Kalyvas et al. [8]. The soils are alkaline and medium textured with similar pH values and available P content. However, in soil 1 carbonates, active carbonates and amorphous Al oxides contents are much higher than in soil 2, while soil 2 exhibits higher organic matter and amorphous Fe oxides contents. Compared to soil 2, the concentrations of total and inorganic P are lower in soil 1, whereas organic P content is considerably higher. Total As concentration is very high in both soils but over double in soil 2 (852 vs. 1745 mg/kg). The sum of W1 and W2 fractions of the sequential extraction that is considered as the potentially extractable As forms by phosphates [30], was 108.6 and 68.4 mg/kg for soils 1 and 2, respectively (Table 1). Most of As was found in W3 and W4 fractions showing that As in the studied soils is preferably bound to amorphous and poorly crystalline hydrous oxides of Fe and Al. Details on As partitioning in the mine affected soils of Lavrion and a thorough discussion can be found in Kalyvas et al. [8].

3.2. Solutions pH

The pH of the initial P solutions was acidic and decreased as the P rate increased (Figure 3). The same pH decreasing trend was also observed for the equilibrium solutions. The alkaline pH and the high buffering capacity of the tested soils due to the presence of high CaCO3 eq. contents, did not allow for intense pH fall even with the application of the highest P rate. In fact, from lowest to highest P rate, equilibrium pH values were ranged between 7.4 and 6.5 and 7.0 and 6.3 for soils 1 and 2 respectively, while the corresponding pH values for the initial solutions were ranged between 5.3 and 4.1. The alkaline pH of the soils and the oxidizing conditions indicate that As predominantly occurred as arsenates and this would not substantially change under the experimental conditions of this study [9]. Comparable to our results are the findings reported by Singes-Pastor et al. [32], even though the initial solutions pH values were neutral or alkaline due to the different P treatments used by these authors.

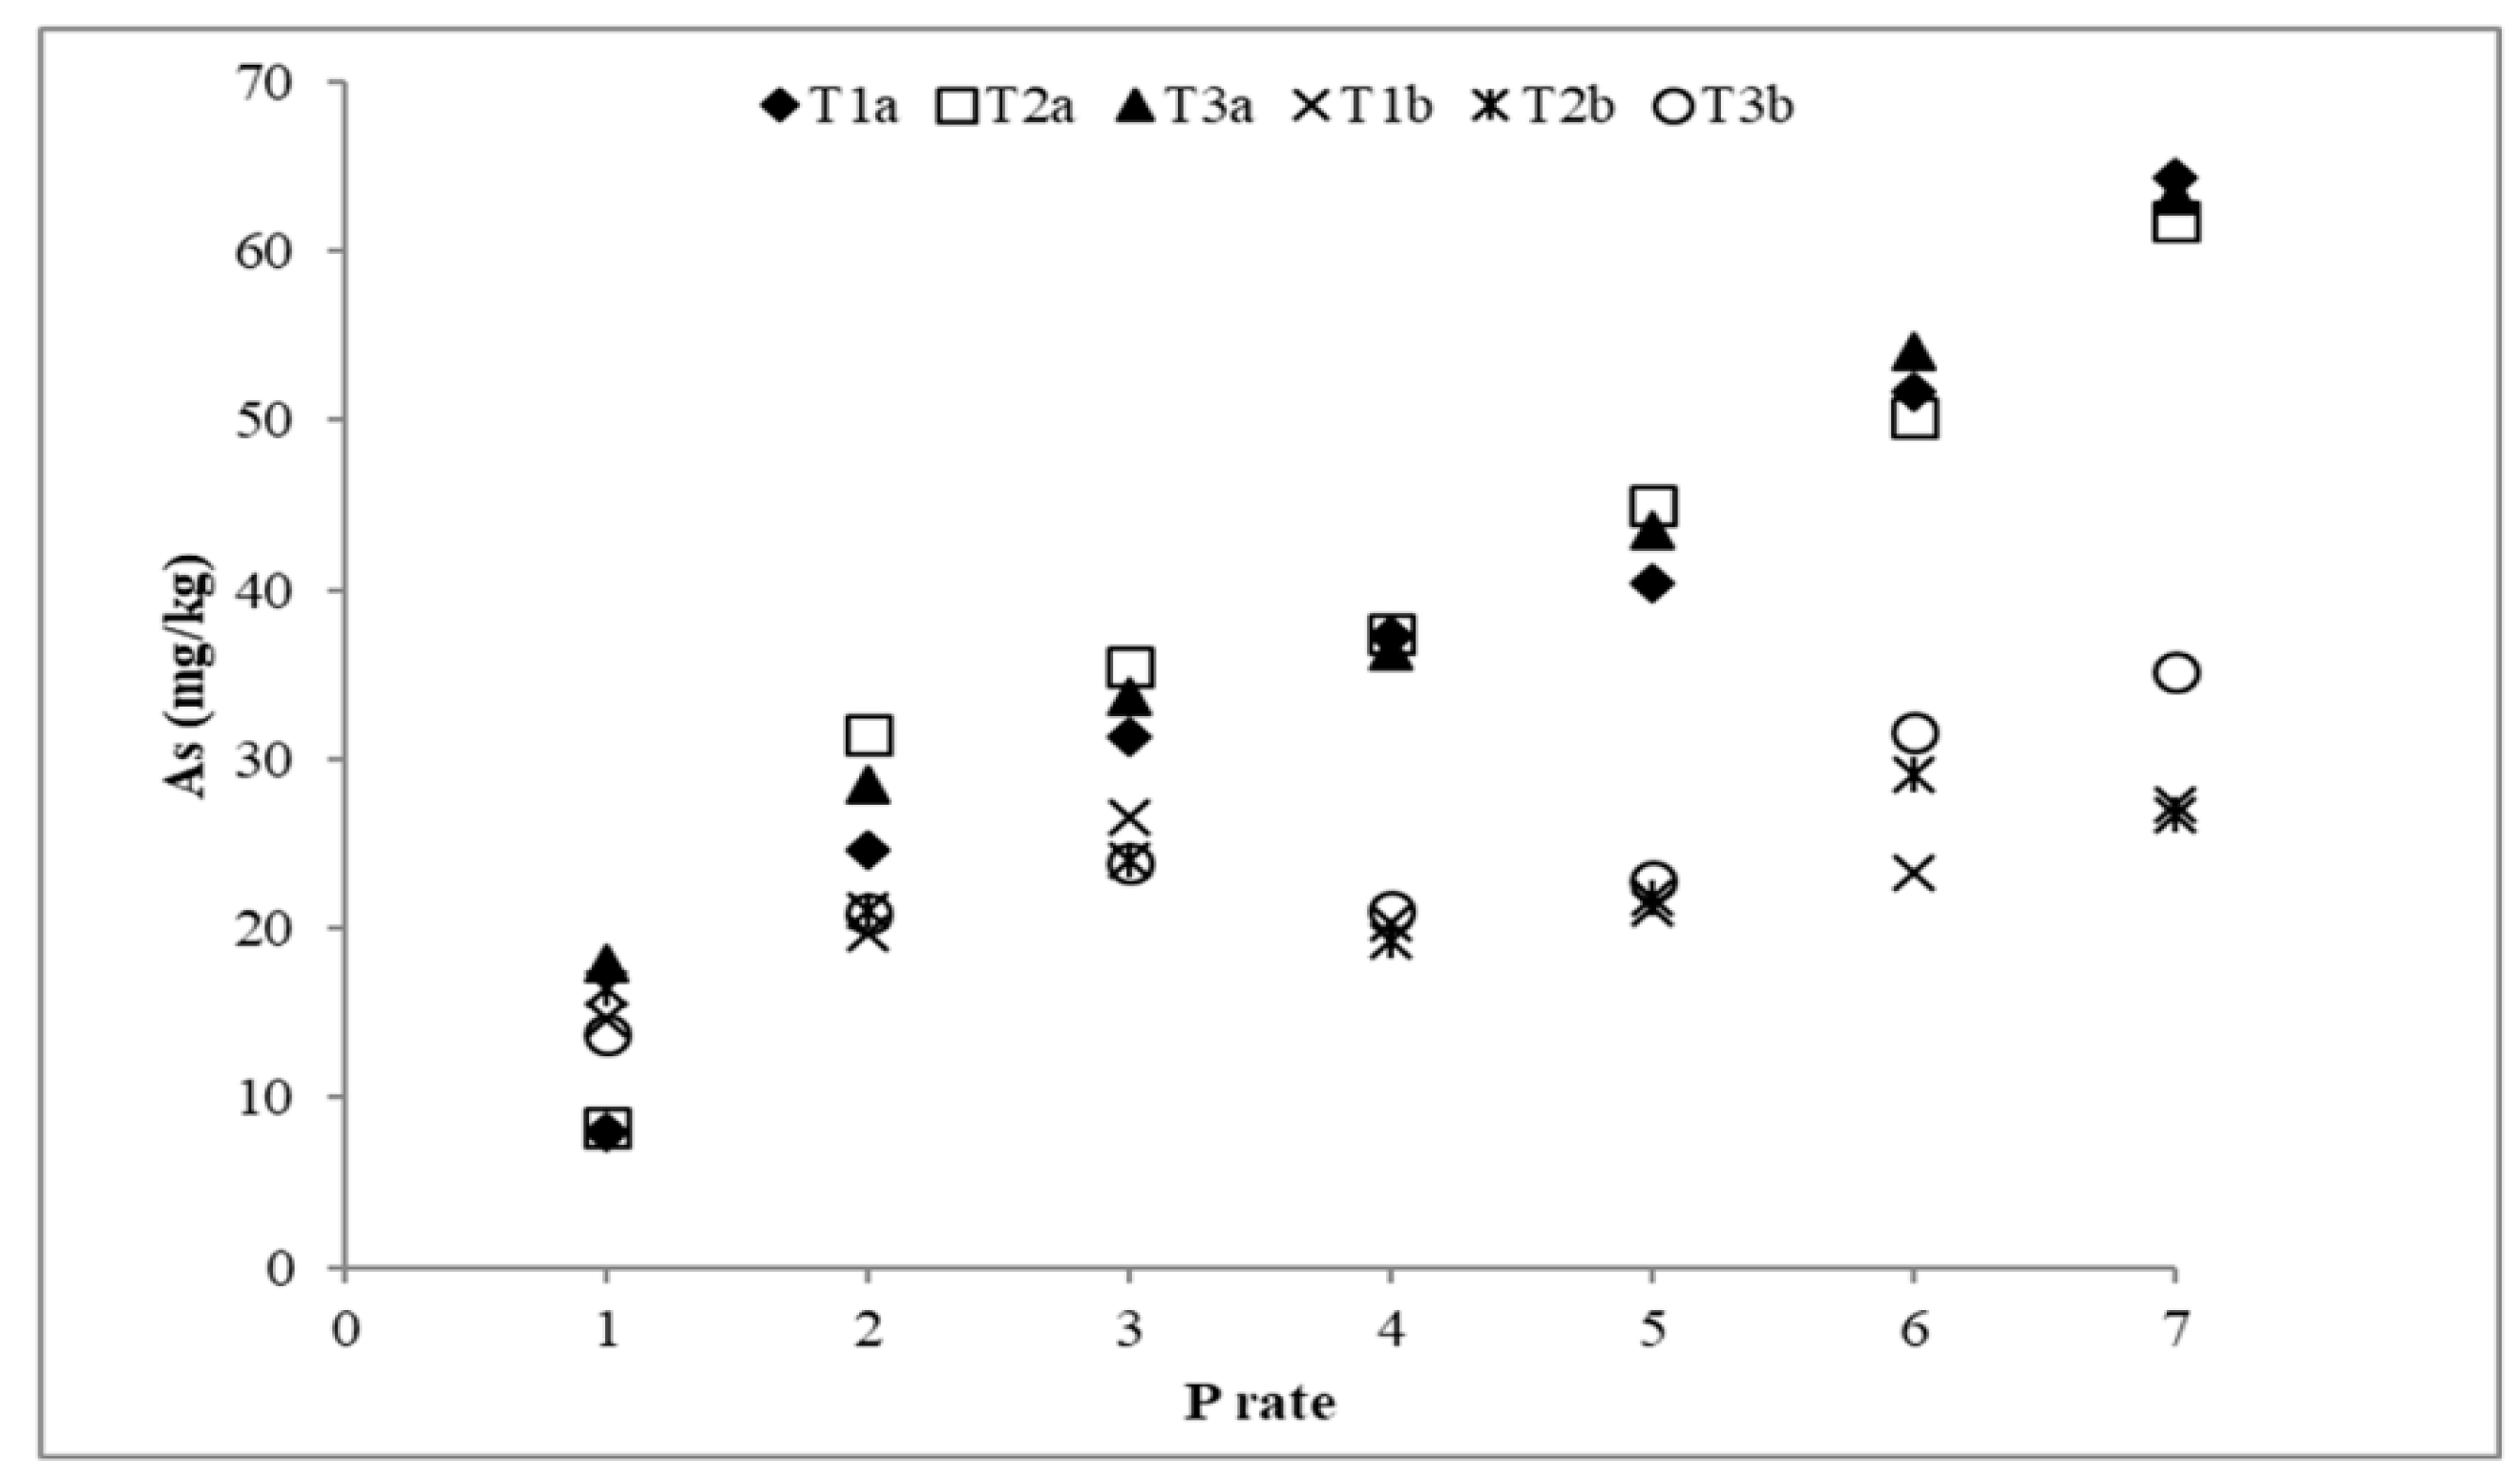
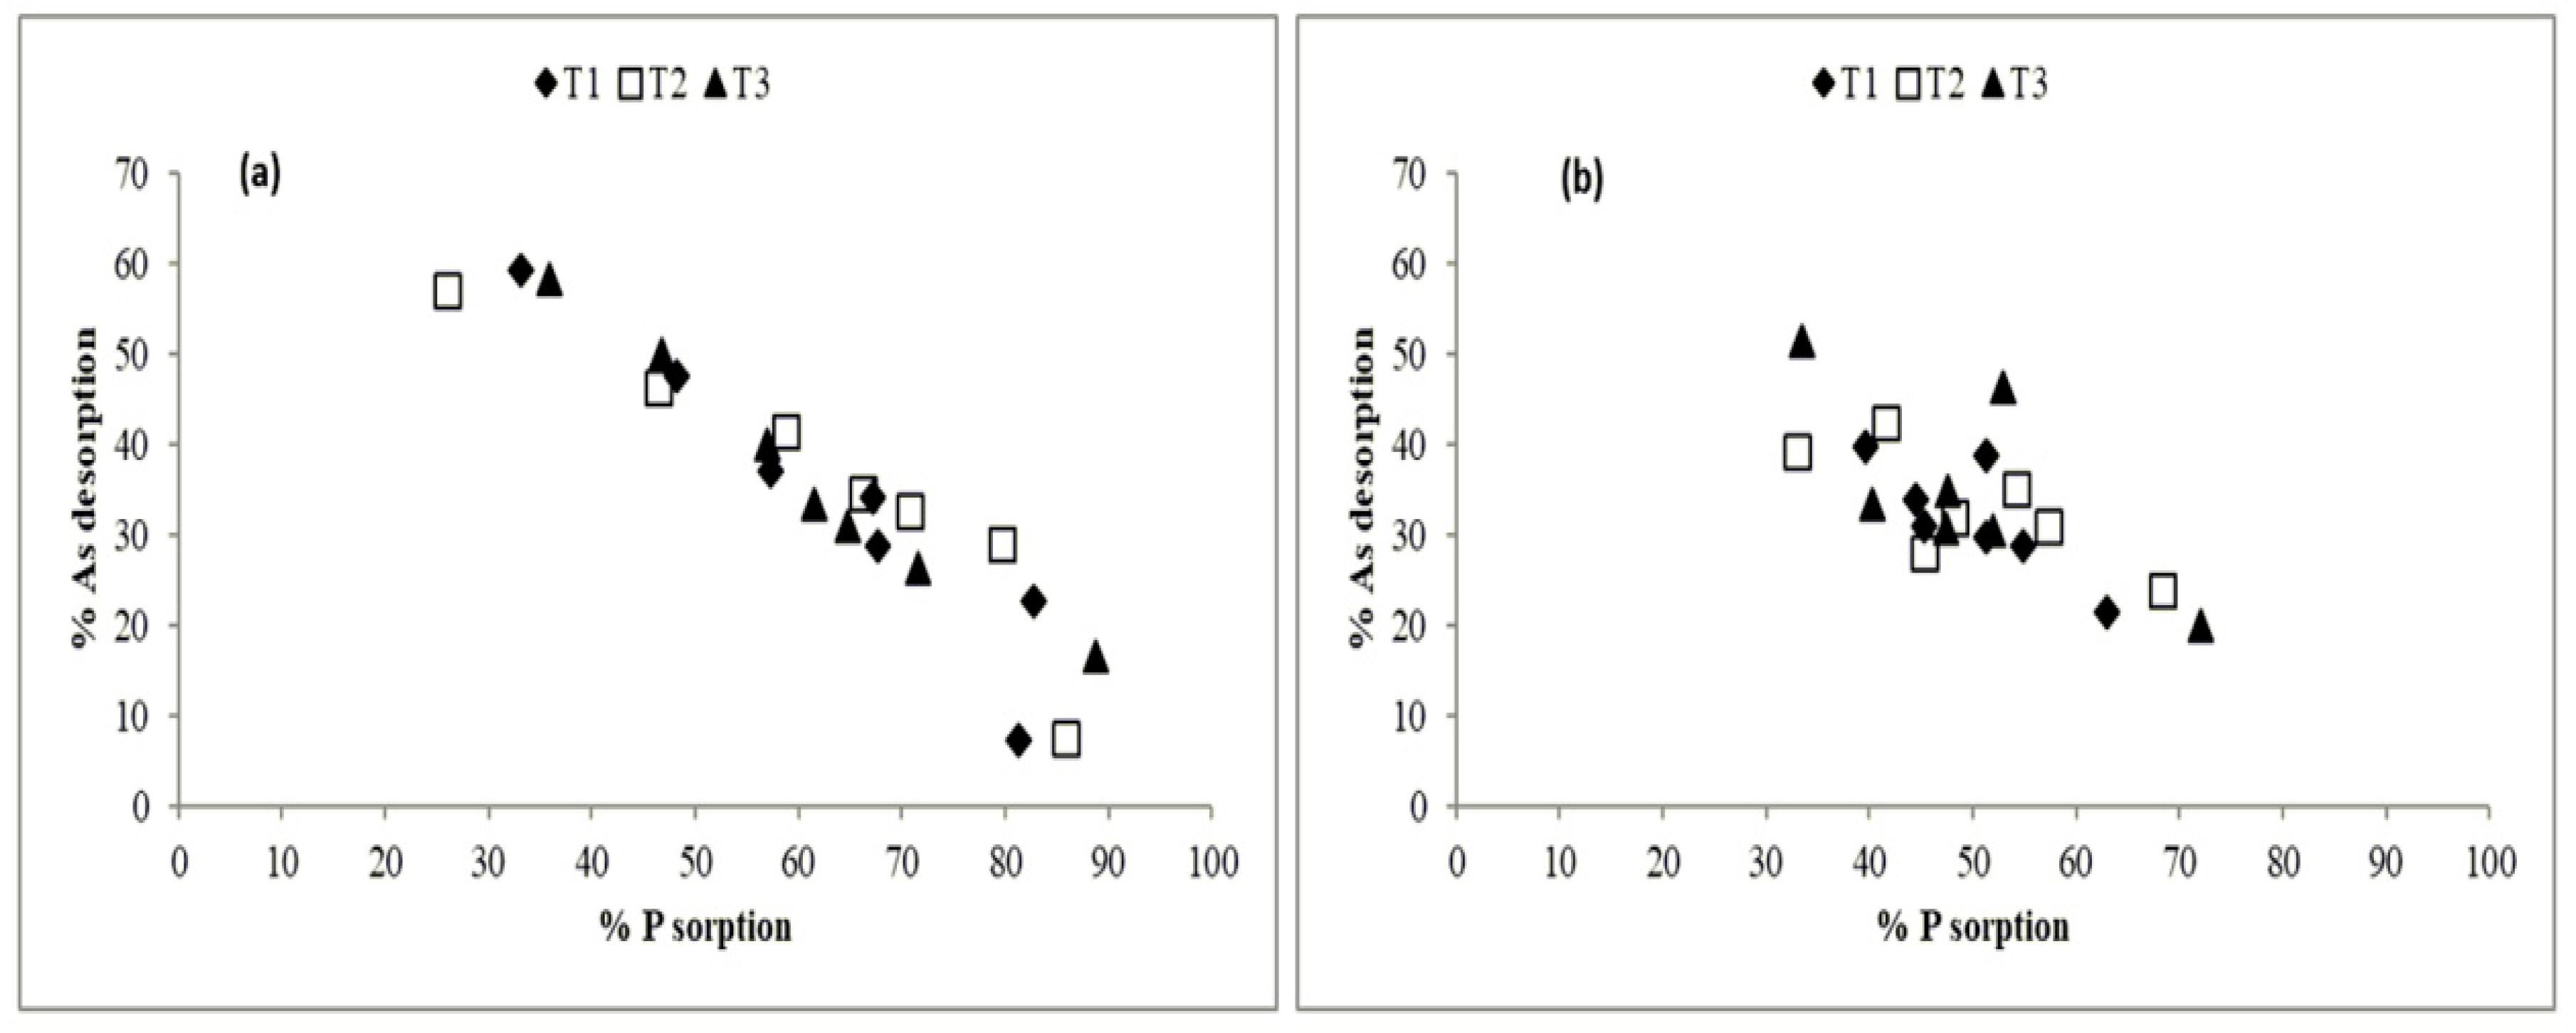
3.3. Arsenic Desorption

The desorbed As concentrations ranged between 8–64.4 mg/kg for soil 1 and between 16.5 and 35.3 mg/kg for soil 2 (Figure 4, Table S1). The lowest As concentrations were obtained by the lowest P rate while the highest by the highest P rate and treatments T1 (soil 1) and T3 (soil 2). Considering that the initial As concentrations that could be extracted by phosphates were 108.6 and 68.4 mg/kg for soils 1 and 2 respectively (sum of W1 and W2 fractions, Table 1), it is clear that within 24 h equilibration more than 50% of non-specifically and specifically sorbed As (highest P rate) was replaced by phosphates.
The results of the performed ANOVA (Table 2), showed that both P treatment and P rate significantly affected As desorption from the tested soils, while significant interaction between the two factors was observed. Thus, the P treatment and the P rate effects were studied within each P rate and within each P treatment respectively (t-test, p < 0.05). In all treatments, increased phosphate rate application was generally resulted in higher As concentrations in the equilibrium solutions but different As desorption patterns were observed for the two soils (Figure 4). For soil 1, increasing P rates desorbed constantly and significantly higher As amounts compared to As released by the preceding P rates. For soil 2 however, increasing P rates did not always produce significant differences in As desorption; for all treatments lowest P rate desorbed the significantly lowest As concentrations but higher P rates did not always succeed to extract higher amounts of As (Table S1).
In most cases, within each P rate, the solutions containing NaNO3 (T2 and T3 treatments) extracted more As than the solutions not containing NaNO3 (T1 treatment), significantly higher for P rates 1, 2, 3, 5 and 6 in soil 1 and for P rates 5 and 7 in soil 2 (Table S1). It seems that the presence of NaNO3 in extracting solutions assisted the ability of phosphates to extract As from both soils, in line with Smith and Naidu [33] who found that 0.03 M NaNO3 increased As desorption from an As spiked soil. However, Smith et al. [34] support that NO3- have limited effect on As(V) mobility in soils, in accordance with Fayiga et al. [35] who report limited effect of nitrates on As plant uptake. According to Vithanage et al. [36] and references therein, NO3- significantly reduced As uptake by plants; on the contrary Fitz et al. [37] support that NO3- as the N source, would potentially increase rhizosphere pH, and thus possibly enhance As accumulation in plant tissues.

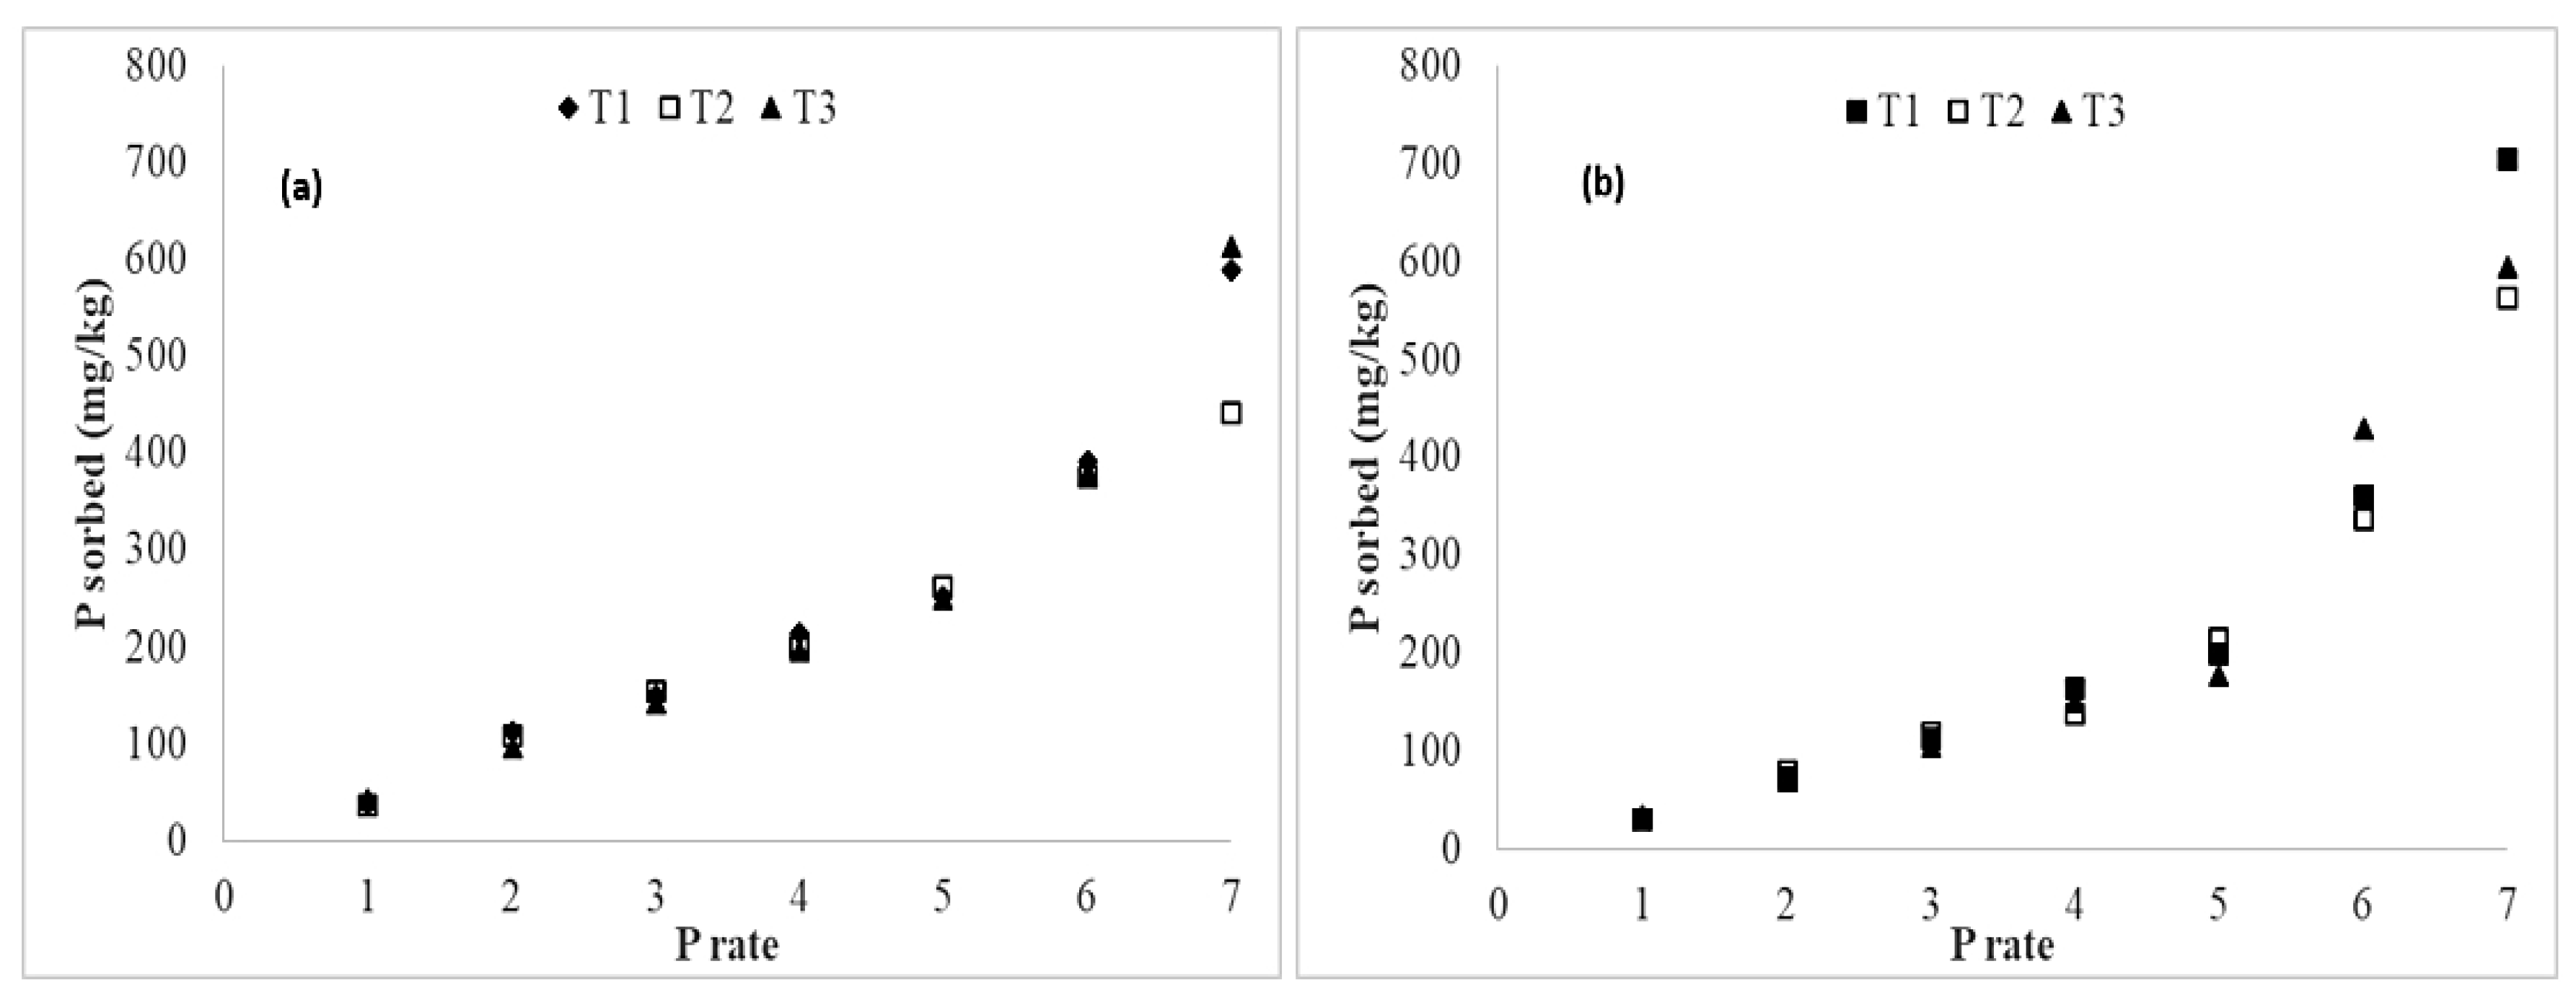
3.4. Added Phosphorus Sorption

In both soils, by increasing solution P concentration, the sorption of P increased and ranged from 37.8 to 613.8 and from 29.7 to 704 mg/kg for soils 1 and 2, respectively (Figure 5, Table S1). Based on the equilibrium adsorption data, Langmuir and Freundlich adsorption isotherms were produced. The estimated qm and bL (Langmuir) and KF and 1/n (Freundlich) constants for the studied soils are included in Table 3.
The calculated coefficients of determination showed that both models adequately described P sorption in the studied soils. Nevertheless, assuming that best fit can be better illustrated by R2 values significant at p-level < 0.001, Langmuir equation well portrayed P sorption only for soil 1. On the other hand, experimental data for both soils were better described by the Freundlich equation (Table 3). For both soils, the Freudlich constant 1/n was lower than 1, 0.468 and 0.762, indicating a favorable process [12]. Though the Freundlich isotherm is largely empirical, Goldberg and Sposito [38] suggested that the parameters of this equation could be applied to describe some characteristics of sorption process. Accordingly, the calculated KF and 1/n values indicate that soil 2 showed greater sorption capacity and increased sorption intensity for phosphorus compared to soil 1. Both Langmuir and Freundlich models have been commonly used to describe P sorption in soils. Zhang et al. [39] found that Langmuir method fitted well to experimental data while Smith and Naidu [33] and Shafqat and Pierzynski [31] showed that Freundlich equation was more suitable to describe P sorption characteristics.

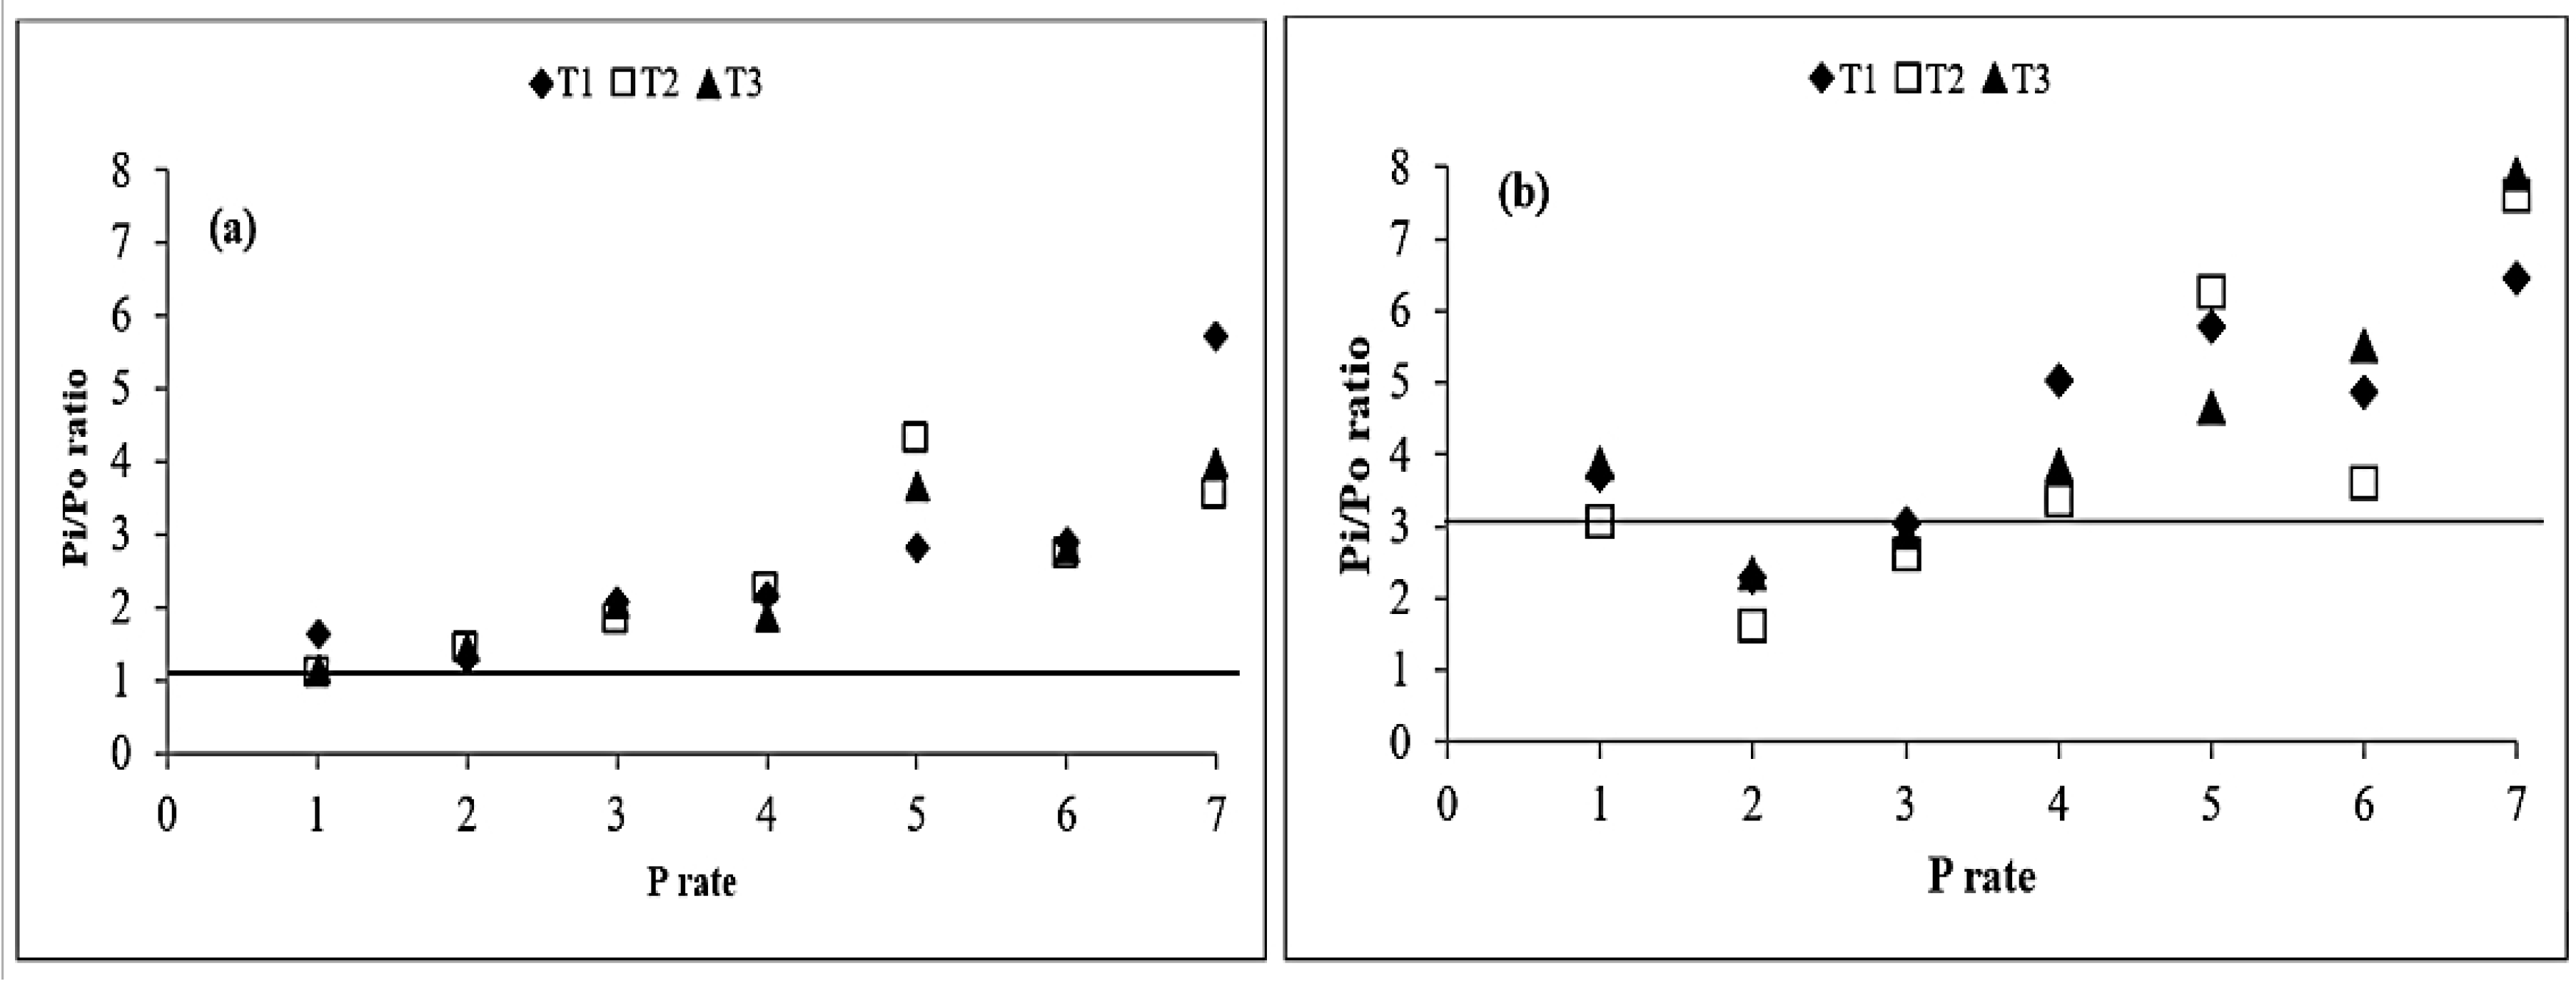
3.5. Distribution of Organic and Inorganic Forms of Added P

Total, inorganic and organic P initial concentrations in soil 1 were 733, 391 and 342 mg/kg while the respective P concentrations in soil 2 were 1061, 796 and 265 mg/kg (Table 1). Soil 1 exhibited lower total and inorganic P concentrations than soil 2 but surprisingly higher organic P concentration, though organic matter content was much lower. In Figure 6, the distribution of organic and inorganic P forms in two soils at equilibrium is presented as the ratio of inorganic P (Pi) to organic P (Po). Pi/Po ratio describes the relation of the two P forms as the result of added P by the three treatments and the seven application rates after 24 h equilibration. For all treatments and for both soils, the application of increasing P rates resulted in higher Pi/Po ratios at equilibrium. The initial Pi/Po ratios were 1.15 and 3 for soils 1 and 2, respectively in accordance to Kruse et al. [40] and raised up to 5.7 for soil 1 (treatment T1) and up to 7.9 for soil 2 (treatment T3). The highest Pi/Po ratio values were observed for the highest P rates showing up to nearly fivefold (soil 1) and threefold (soil 2) increase (Figure 6).

4. Discussion

For both soils, the lowest P rate application resulted in the highest P sorption and the lowest As desorption percentages (Figure 7). Depending on P rate, As percentage desorption ranged between 7–59 and 20–52% for soils 1 and soil 2, respectively, while the corresponding P percentage sorption values ranged between 89–26 and 72–32%. Though for the highest P rate the achieved As extraction was similar for the two soils, the lowest P rate showed much lower As desorption from soil 1. Thus, different desorption patterns were observed indicating that different sites were involved in As-P exchange in the two soils. Higher portion of easily exchangeable As by phosphates was present in soil 2 in spite that the potentially available As concentration was lower compared to soil 1. Strawn [9] suggested that added phosphates can solubilize organic matter that may afterwards compete for exchange sites leading to increased As extraction. Following this, it is possible that partial solubilization of organic matter might have occurred due to P additions that could partially explain the higher As desorption from soil 2 due to the higher organic matter content than soil 1. As it is reported by Feng et al. [12], P and As strongly compete for the same sorption sites in soils due to the very similar chemical characteristics of the phosphate and arsenate anions. However, P is preferentially adsorbed when P and As anions concentrations are equal in solutions [10,16,41] and this is attributed to the smaller size and the higher charge of phosphate anions [9,10]. Moreover, Hongshao and Stanforth, and Smith et al. [34,42] suggested that depending on soil characteristics, three different kind of sites for P and As sorption are distinguished; sites where both As and P can be sorbed, and specific sites where P or As are preferentially sorbed.
The observed As desorption percentage hysteresis in soil 1 compared to soil 2, can be attributed to such differences (Figure 7). Indeed, the considerably higher active carbonate content in soil 1 may had retained some of the phosphates added with the lower P rates, restricting the ability of phosphates to replace As in the soil reactive phases. Although the ability of CaCO3 to immobilize phosphates is well documented [31,43,44], CaCO3 shows minimal affinity for arsenates at soil pH values less than 8.3 [45,46]. Even though the soils pH did not promote the strong involvement of Al oxides in P sorption, the higher amount of Al amorphous oxides in soil 1 may had also assisted the immobilization of some phosphates added with low P rates, behaving in a similar manner as active carbonates. Amorphous Al oxides are expected to be negatively charged at alkaline pH which could facilitate phosphate sorption by cationic bridges [43]. Moreover, As desorption percentage pattern of soil 2 also points to the existence of considerable amounts of As bound on sites easily accessible by phosphates, masking the immobilizing effect of the higher organic matter and amorphous and poorly crystallized Fe oxides contents on added P up to the 3rd P rate. From the 4th P rate and onwards however, As desorption percentage from soil 2 is dramatically reduced compared to soil 1, due to the strong binding of added P on organic matter and Fe oxides surfaces (Figure 7). Phosphorus sorption data support the different As desorption patterns of the two soils. As it is indicated by Figure 5 and Figure 7, at low P rates soil 1 retained more P than soil 2 for reasons discussed above, while at higher P rates the sorbing capacity of the two soils can be considered more or less as similar, pointing however to increased P immobilization in soil 2 probably due to higher Fe oxides and organic matter contents. The significant role of the higher organic matter content in soil 2 is well supported by the lower increase of Pi/Po ratio compared to soil 1, indicating greater involvement of organic matter that provided more sites for the sorption of added P. Furthermore, while in both soils Pi consistently increased as P rate increased, Po showed the opposite trend leading to significant negative correlations between the two P forms (r = −0.58, p < 0.01 and r = −0.45, p < 0.05 for soils 1 and 2 respectively). Zhang et al. [39] studied the effect of the fertilization on the P forms and found that all the Po fractions declined after phosphorus fertilizer application.
The almost neutral pH of the equilibrium solutions (Figure 3) indicates that no significant alterations in As chemical forms that could influence desorption dynamics of As in the tested soils were expected [47].
The results of this study suggest that under field conditions, the application of even P1 and P2 rates that correspond to agronomic P fertilization rates may increase As bioavailability, threatening the wealth of terrestrial ecosystems. This is more pronounced for soil 2 underpinning the crucial role of soil properties on As behavior in cultivated soils. Considering that the two sampling sites located nearby it is obvious that in case of agricultural use, P fertilization should be optimized according to soil characteristics to avoid toxic levels of As in either plants or in soil solution and underground waters. Moreover, low P rates have also led to excess phosphates concentrations in both soils, even though much of the added P adsorbed onto soil colloids (Figure 7, Table S1).
Excess arsenates and phosphates concentrations in soil solution may undergo several processes. Firstly, both oxyanions can be leached and contaminate aquifers. In case of phosphates this can lead to eutrophication and to an extent recycling of an essential nutrient for plant growth through irrigation from surface or drilling/well waters. In case of As however, this will cause contamination of underground waters and will increase As concentration in potable and irrigation water, recycling the contaminant in the terrestrial biota. Secondly, there is always the possibility that an As hyper-accumulating plant will cope with the increased concentrations of both anions in the soil solution and will uptake the excess amounts. According to Signes-Pastor [32], arsenate as a phosphate analogue, enter in plants by phosphate transporters. Some studies report that arsenates and phosphates most probably compete for plant uptake and phosphates are favorably absorbed by plant roots over arsenates [11]. On the contrary, Tu and Ma [48] stating that As and P anions follow the same biochemical paths in plants, concluded that plants are unable to discriminate between the two anions. Thirdly, As and P anions in soil solution depending on ionic composition and Eh/pH alterations can re-adsorb onto soil active phases (clay minerals, organic matter, iron oxides) and/or precipitate, thus, alleviating the leaching hazard. In any case, soil physicochemical and mineralogical properties play a crucial role on P and As interactions determining the mobility and bioavailability of As in the soil system. This applies particularly in mining contaminated soils, which are characterized by the co-occurrence of multiple contaminants and the high spatial variability of soil properties. Therefore, future research should focus on the better understanding of the complex interactions of P with As in mining areas, especially in the case of application of P fertilization as an effective remediation strategy for As-contaminated soils.

5. Conclusions

The results of the contacted batch experiments strongly support that even though increased P rates resulted in higher As desorption from the two soils, distinct differences were observed. Soil properties by controlling P sorption affected As desorption. Active carbonates content played the predominant role in soil 1, whereas organic matter and Fe amorphous oxides controlled the As desorption process in soil 2. The high variability of soil properties at small distances in As contaminated mining lands that are under cultivation, should be of prior consideration to properly organize P fertilization in order to avoid serious implications on the environment due to excess As in soil solution. Extensive sample collection and analysis should be performed including batch As desorption/P sorption experiments and As fractionation to determine the exchangeable fractions in soils. Pot experiments should follow to optimize P fertilization according to soil properties as well as small scale field tests to check and adjust the previous results.

Supplementary Materials

The following are available online at https://www.mdpi.com/2571-8789/3/3/54/s1.

Author Contributions

Conceptualization, I.M.; Investigation, I.Z.; Methodology, I.Z. and G.K.; Resources, G.K.; Supervision, I.M.; Validation, D.G.; Writing—original draft, I.Z. and I.M.; Writing—review & editing, D.G., D.I. and I.M.

Funding

This research received no external funding.

Conflicts of Interest

The authors declare no conflict of interest.

References

  1. Massas, I.; Gasparatos, D.; Ioannou, D.; Kalivas, D. Signs for secondary buildup of heavy metals in soils at the periphery of Athens International Airport, Greece. Environ. Sci. Pollut. Res. 2018, 25, 658–671. [Google Scholar] [CrossRef] [PubMed]
  2. Gasparatos, D. Sequestration of heavy metals from soil with Fe–Mn concretions and nodules. Environ. Chem. Lett. 2013, 11, 1–9. [Google Scholar] [CrossRef]
  3. Kalyvas, G.; Tsitselis, G.; Gasparatos, D.; Massas, I. Efficacy of EDTA and olive mill wastewater to enhance As, Pb, and Zn phytoextraction by pteris vittata L. from a soil heavily polluted by mining activities. Sustainability 2018, 10, 1962. [Google Scholar] [CrossRef]
  4. Anawar, H.M.; Rengel, Z.; Damon, P.; Tibbett, M. Arsenic-phosphorus interactions in the soil-plant-microbe system: Dynamics of uptake, suppression and toxicity to plants. Environ. Pollut. 2018, 233, 1003–1012. [Google Scholar] [CrossRef] [PubMed]
  5. Tuli, R.; Chakrabarty, D.; Trivedi, P.K.; Tripathi, R.D. Recent advances in arsenic accumulation and metabolism in rice. Mol. Breed. 2010, 26, 307–323. [Google Scholar] [CrossRef]
  6. Nriagu, J.O.; Pacyna, J.M. Quantitative assessment of worldwide contamination of air, water and soils by trace metals. Nature 1988, 333, 134–139. [Google Scholar] [CrossRef]
  7. RIVM (National Institute for Public Health and Environmental Protection). Annex A: Target Values, Soil Remediation Intervention Values and Indicative Levels for Serious Contamination, Dutch Target and Intervention Values, (The New Dutch List), Netherlands; RIVM: Bilthoven, The Netherlands, 2000. [Google Scholar]
  8. Kalyvas, G.; Gasparatos, D.; Massas, I. A critical assessment of arsenic partitioning in mine-affected soils by using two sequential extraction protocols. Arch. Agron. Soil Sci. 2018, 64, 1549–1563. [Google Scholar] [CrossRef]
  9. Strawn, D.G. Review of interactions between phosphorus and arsenic in soils from four case studies. Geochem. Trans. 2018, 19, 10. [Google Scholar] [CrossRef]
  10. Lambkin, D.C.; Alloway, B.J. Arsenate-induced phosphate release from soils and its effect on plant phosphorus. Water Air Soil Pollut. 2003, 144, 41–56. [Google Scholar] [CrossRef]
  11. Bolan, N.; Kunhikrishnan, A.; Thangarajan, R.; Kumpiene, J. Remediation of heavy metal(loid)s contaminated soils—To mobilize or to immobilize? J. Hazard. Mater. 2014, 266, 141–166. [Google Scholar] [CrossRef]
  12. Feng, Q.; Zhang, Z.; Chen, Y.; Liu, L.; Zhang, Z.; Chen, C. Adsorption and desorption characteristics of arsenic on soils: Kinetics, equilibrium, and effect of Fe(OH)3 colloid, H2SiO3 colloid and phosphate. Procedia Environ. Sci. 2013, 18, 26–36. [Google Scholar] [CrossRef]
  13. McDowell, R.; Condron, L. Influence of soil constituents on soil phosphorus sorption and desorption. Commun. Soil Sci. Plant Anal. 2001, 32, 2531–2547. [Google Scholar] [CrossRef]
  14. Gasparatos, D.; Massas, I.; Godelitsas, A. Fe-Mn concretions and nodules formation in redoximorphic soils and their role on soil phosphorus dynamics: Current knowledge and gaps. Catena 2019, 182, 104106. [Google Scholar] [CrossRef]
  15. Mukhopadhyay, S.; Hashim, M.A.; Allen, M.; Gupta, B.S. Arsenic removal from soil with high iron content using a natural surfactant and phosphate. Int. J. Environ. Sci. Technol. 2015, 12, 617–632. [Google Scholar] [CrossRef]
  16. Piracha, M.A.; Ashraf, M.; Shahzad, S.M.; Siddiqui, A.R.; Nazeer, S. Arsenic behavior in different textured soils amended with phosphate rock and farm yard manure. J. Environ. Agric. 2016, 1, 55–67. [Google Scholar]
  17. Violante, A.; Pigna, M. Competitive sorption of As(V) and phosphate on different clay minerals and soils. Soil Sci. Soc. Am. J. 2002, 66, 1788–1796. [Google Scholar] [CrossRef]
  18. O’Reilly, S.E.; Strawn, D.G.; Sparks, D.L. Residence time effects on arsenate adsorption/desorption mechanisms on goethite. Soil Sci. Soc. Am. J. 2001, 65, 67–77. [Google Scholar] [CrossRef]
  19. Rhoades, J.D. Cation exchange capacity. In Methods of Soil Analysis, Part 2, Chemical and Microbiological Properties, 2nd ed.; Page, A.L., Miller, R.H., Keeney, D.R., Eds.; ASA-SSSA: Madison, WI, USA, 1982; pp. 149–157. [Google Scholar]
  20. Nelson, D.W.; Sommers, L.E. Total carbon, organic carbon and organic matter. In Methods of Soil Analysis, Part 2, Chemical and Microbiological Properties; Page, A.L., Miller, R.H., Keeney, D.R., Eds.; ASA-SSSA: Madison, WI, USA, 1982. [Google Scholar]
  21. Bouyoucos, G.J. A recalibration of the hydrometer method for making mechanical analysis of soils. Agron. J. 1951, 43, 434–438. [Google Scholar] [CrossRef]
  22. NF ISO 10693. Détermination de la Teneuren Carbonate—Méthode Volumétrique; Qualité des Sols AFNOR: Paris, France, 1995; pp. 177–186. [Google Scholar]
  23. Loeppert, R.H.; Suarez, D.L. Carbonate and gypsum. In Methods of Soil Analysis, Part 3, Chemical Methods; Bigham, J.M., Bartels, J.M., Eds.; ASA-SSSA: Madison, WI, USA, 1982; pp. 437–474. [Google Scholar]
  24. Saunders, W.M.H.; Williams, E.G. Observation on the determination of total organic phosphorus in soils. J. Soil Sci. 1955, 6, 254–267. [Google Scholar] [CrossRef]
  25. Walker, T.; Adams, A. Studies on soil organic matter: I. Influence of phosphorus content of parent materials on accumulations of carbon, nitrogen, sulfur, and organic phosphorus in grassland soils. Soil Sci. 1958, 85, 307–318. [Google Scholar] [CrossRef]
  26. Olsen, S.R.; Cole, C.V.; Watanabe, F.S.; Dean, L.A. Estimation of available phosphorus in soils by extraction with sodium bicarbonate. US Dept. Agric. Circ. 1954, 939, 1–19. [Google Scholar]
  27. Mehra, O.P.; Jackson, M.L. Iron oxide removal from soils and clay by a dithionite-citrate system buffered with sodium bicarbonate. Clays Clay Miner. 2013, 7, 317–327. [Google Scholar] [CrossRef]
  28. Schwertmann, U.; Taylor, R.M. Iron oxides. Minerals in Soil Environments. Dixon, J.B., Weed, S.B., Eds.; 2nd ed. 1989, pp. 379–438. Available online: http://www.scielo.br/scielo.php?script=sci_nlinks&ref=000101&pid=S0103-8478201300060000900024&lng=pt (accessed on 17 August 2019). [CrossRef]
  29. Gasparatos, D.; Haidouti, C. A comparison of wet oxidation methods for determination of total phosphorus in soils. J. Plant Nutr. Soil Sci. 2001, 164, 435–439. [Google Scholar] [CrossRef]
  30. Wenzel, W.; Kirchbaumer, N.; Prohaska, T.; Stingeder, G.; Lombi, E.; Adriano, D. Arsenic fractionation in soils using an improved sequential extraction procedure. Anal Chim Acta. 2001, 436, 309–323. [Google Scholar] [CrossRef]
  31. Shafqat, M.N.; Pierzynski, G.M. The Freudlich adsorption isotherm constants and prediction of phosphorus bioavailability as affected by different phosphorus sources on two Kansas soils. Chemosphere 2014, 99, 72–80. [Google Scholar] [CrossRef] [PubMed]
  32. Singes-Pastor, A.; Burlo, F.; Mitra, K.; Carbonell-Barrachina, A.A. Arsenic biochemistry as affected by phosphorus fertilizer addition, redox potential and pH in a west Bengal (India) soil. Geoderma 2007, 137, 504–510. [Google Scholar] [CrossRef]
  33. Smith, E.; Naidu, R. Chemistry of inorganic arsenic in soils: Kinetics of arsenic adsorption–desorption. Environ. Geochem. Health 2009, 31, 49–59. [Google Scholar] [CrossRef] [PubMed]
  34. Smith, E.; Naidu, R.; Alston, A.M. Chemistry of inorganic arsenic in soils: II. Effect of phosphorus, sodium and calcium on arsenic sorption. J. Environ. Qual. 2002, 31, 557–563. [Google Scholar] [CrossRef]
  35. Fayiga, A.O.; Ma, L.Q.; Zhou, O. Effects of plant arsenic uptake and heavy metals on arsenic distribution in an arsenic-contaminated soil. Environ. Pollut. 2007, 147, 737–742. [Google Scholar] [CrossRef]
  36. Vithanage, M.; Dabrowska, B.B.; Mukherjee, A.B.; Sandhi, A.; Bhattacharya, P. Arsenic uptake by plants and possible phytoremediation applications: A brief overview. Environ. Chem. Lett. 2012, 10, 217–224. [Google Scholar] [CrossRef]
  37. Fitz, W.J.; Wenzel, W.W. Arsenic transformations in the soil–rhizosphere–plant system: Fundamentals and potential application to phytoremediation. J. Biotechnol. 2002, 99, 259–278. [Google Scholar] [CrossRef]
  38. Goldberg, S.; Sposito, G. Chemical model of phosphate adsorption by soils—I. Reference oxide minerals. Soil Sci. Soc. Am. J. 1984, 48, 772–778. [Google Scholar] [CrossRef]
  39. Zhang, W.; Faulkner, J.; Giri, S.; Geohring, L.; Steenhuis, T. Evaluation of two Langmuir models for phosphorus sorption of phosphorus-enriched soils in New York for environmental applications. Soil Sci. 2009, 174, 523–530. [Google Scholar] [CrossRef]
  40. Kruse, J.; Abraham, M.; Amelung, W.; Baum, C.; Bol, R.; Kühn, O.; Santner, J. Innovative methods in soil phosphorus research: A review. J. Plant Nutr. Soil Sci. 2015, 178, 43–88. [Google Scholar] [CrossRef] [PubMed] [Green Version]
  41. Manning, B.A.; Golberg, S. Modeling competitive adsorption of arsenate with phosphate and molybdate on oxide minerals. Soil. Sci. Soc. Am. J. 1996, 60, 121–131. [Google Scholar] [CrossRef]
  42. Hongshao, Z.; Stanforth, R. Competitive adsorption of phosphate and arsenate on goethite. Environ. Sci. Technol. 2001, 35, 4753–4757. [Google Scholar] [CrossRef] [PubMed]
  43. Riva-Perez, I.M.; Paradelo-Nunez, R.; Novoa-Munoz, J.C.; Arias-Estevez, M.; Fernandez-Sanjurjo, M.; Álvarez-Rodríguez, E.; Núñez-Delgado, A. As(V) and P competitive sorption on soils, by-products and waste materials. Int. J. Environ. Res. Public Health 2015, 12, 15706–15715. [Google Scholar] [CrossRef]
  44. Ahmad, M.; Ahmad, M.; El-Naggar, A.H.; Usman, A.R.A.; Abduljabbar, A.; Vithanage, M.; Al-Wabel, M.I. Aging effects of organic and inorganic fertilizers on phosphorus fractionation in a calcareous sandy loam soil. Pedosphere 2018, 28, 873–883. [Google Scholar] [CrossRef]
  45. Yolcubal, I.; Akyol, N.H. Adsorption and transport of arsenate in carbonate-rich soils: Coupled effects of nonlinear and rate-limeted sorption. Chemosphere 2008, 73, 1300–1307. [Google Scholar] [CrossRef]
  46. Alexendratos, V.G.; Elzinga, E.J.; Reeder, R.J. Arsenate uptake by calcite: Macroscopic and spectroscopic characterization of adsorption and incorporation mechanisms. Geochim. Cosmochim. Acta 2007, 71, 4172–4187. [Google Scholar] [CrossRef]
  47. Suriyagoda, L.D.B.; Dittert, K.; Lambers, H. Arsenic in rice soils and potential agronomic mitigation strategies to reduce arsenic bioavailability: A review. Pedosphere 2018, 28, 363–382. [Google Scholar] [CrossRef]
  48. Tu, S.; Ma, L.Q. Effects of arsenate and phosphate on their accumulation by an arsenic-hyperaccumulator Pteris vittata L. Plant Soil 2003, 249, 373–382. [Google Scholar] [CrossRef]
Figure 1. Sampling area—sampling sites. WGS84 coordinates (Latitude/Longitude): 37,7281/24,0446 and 37,7306/24,0473 for soils 1 and 2 respectively.
Soilsystems 03 00054 g001
Figure 2. Effect of contact time on P sorption by soil 1 (a) and soil 2 (b). T1: triple superphosphate in water, T2: triple superphosphate in 0.01 M NaNO3, T3: NH4H2PO4 in 0.01 M NaNO3. Experimental conditions: Initial P concentration 88.88 mg/L, sorbent/solution ratio 1 g/0.02 L, agitation rate 125 rpm, temperature 22 °C.
Soilsystems 03 00054 g002
Figure 3. Mean pH values in the initial and in the equilibrium solutions for the two soils. P rates (mg/L), 1: 2.36, 2: 6.77, 3: 11.08, 4: 15.92, 5: 21.96, 6: 40.59, 7: 88.88.
Soilsystems 03 00054 g003
Figure 4. As desorption from soil 1 (indicated by a) and soil 2 (indicated by b). T1: triple superphosphate in water, T2: triple superphosphate in 0.01 M NaNO3, T3: NH4H2PO4 in 0.01 M NaNO3. P rates (mg/L), 1: 2.36, 2: 6.77, 3: 11.08, 4: 15.92, 5: 21.96, 6: 40.59, 7: 88.88.
Soilsystems 03 00054 g004
Figure 5. P in soil 1 (a) and soil 2 (b). T1: triple superphosphate in water, T2: triple superphosphate in 0.01 M NaNO3, T3: NH4H2PO4 in 0.01 M NaNO3. P rates (mg/L), 1: 2.36, 2: 6.77, 3: 11.08, 4: 15.92, 5: 21.96, 6: 40.59, 7: 88.88.
Soilsystems 03 00054 g005
Figure 6. Pi/Po ratio for soil 1 (a) and soil 2 (b). P rates (mg/L), 1: 2.36, 2: 6.77, 3: 11.08, 4: 15.92, 5: 21.96, 6: 40.59, 7: 88.88. Horizontal lines indicate the initial Pi/Po values (1.15 and 3 for soils 1 and 2 respectively).
Soilsystems 03 00054 g006
Figure 7. Percentage As desorption in relation to percentage P sorption. (a) Soil 1 (b) Soil 2. T1: triple phosphate in water, T2: triple phosphate in 0.01 M NaNO3, T3: NH4H2PO4 in 0.01 M NaNO3.
Soilsystems 03 00054 g007
Table 1. Main physicochemical soil properties and the results of As fractionation following Wenzel et al. (2001) [30] sequential extraction protocol (SEP).
Soil Properties
Soil 1Soil 2
Clay (g kg−1)328230
Silt (g kg−1)214210
Sand (g kg−1)458560
pH (1:1)87.7
CaCO3 (g kg−1)11564
Act. CaCO3 (g kg−1)273
O.C. (g kg−1)1126
CEC (cmolc kg−1)3027
Fed (mg kg−1)41.545.3
Feo (mg kg−1)4.87
Ald (mg kg−1)728.3574.8
Alo (mg kg−1)2389.51098
As total (mg kg−1)8521745
P total (mg kg−1)7331061
P in. (mg kg−1)391796
P org. (mg kg−1)342265
P avail. (mg kg−1)10.711
As fractions obtained by SEP
W1: Nonspecifically sorbed As (mg kg−1)54.1
W2: Specifically sorbed As (mg kg−1)103.664.3
W3: As sorbed on amorphous Fe-Al oxides (mg kg−1)313.3644.9
W4: As sorbed on crystalline Fe-Al oxides (mg kg−1)240.8393.8
W5: Residual As (mg kg−1)106302.9
Table 2. Analysis of variance results. Effects of P treatment and P rate on As desorption in two soils (N = 3). SS: Sum of Squares, DF: Degrees of Freedom, MS: Mean Square.
SOIL 1
FactorSSDFMSp
P treatment86.17243.09<0.001
P rate15116.662519.36<0.001
P treatment X P rate271.811222.65<0.001
SOIL 2
FactorSSDFMSp
P treatment58.99229.50<0.05
P rate1381.346230.22<0.001
P treatment X P rate225.911218.83<0.01
Table 3. Parameters of the Langmuir and Freundlich models for P sorption in the two soils. Contact time 24 h, agitation rate 125 rpm, sorbent/solution ratio 1 g/0.02 L, P concentrations at start time from 2.36 to 88.88 mg/L, temperature 22 °C. T1: triple superphosphate in water, T2: triple superphosphate in 0.01 M NaNO3, T3: NH4H2PO4 in 0.01 M NaNO3.
Langmuir Constants Freundlich Constants
qm (mg/g)bL (L/mg)R2p-ValueKF (mg/g) (L/mg)1/n1/nR2p-Value
Soil 1T10.680.0900.968<0.00112.810.5250.960<0.001
T20.480.1670.996<0.00112.070.4680.957<0.001
T30.730.0700.932<0.0113.060.5110.995<0.001
Soil 2T11.360.0180.776<0.0131.260.7620.998<0.001
T20.810.0340.886<0.0126.140.6750.994<0.001
T30.990.0240.648<0.0526.580.6760.946<0.01

