Article

Lablab Purpureus Influences Soil Fertility and Microbial Diversity in a Tropical Maize-Based No-Tillage System

by
Patricia Dörr de Quadros
1,2,3,*,
Adam R. Martin
2,
Kateryna Zhalnina
3,
Raquel Dias
3,
Adriana Giongo
4,
Roberta Fulthorpe
2,
Cimelio Bayer
1,
Eric W. Triplett
3 and
Flávio A. de O. Camargo
1
1
Department of Soil Science, Federal University of Rio Grande do Sul, Porto Alegre 91540-000, Brazil
2
Department of Environmental Sciences, University of Toronto, Toronto, ON M1C 1A4, Canada
3
Department of Microbiology and Cell Science, Institute of Food and Agricultural Sciences, University of Florida, Gainesville, FL 32603, USA
4
Institute of Petroleum and Natural Resources, PUCRS, Porto Alegre, RS 90619-900, Brazil
*
Author to whom correspondence should be addressed.
Soil Syst. 2019, 3(3), 50; https://doi.org/10.3390/soilsystems3030050
Submission received: 12 May 2019 / Revised: 18 July 2019 / Accepted: 3 August 2019 / Published: 6 August 2019

Abstract

:
There are multiple mechanisms by which enhanced diversity of plant communities improves soil structure and function. One critical pathway mediating this relationship is through changes to soil prokaryotic communities. Here, nine different cropping systems were studied to evaluate how legume and grass cover crops influence soil fertility and microbial communities in a maize-based no tillage system. The soil’s bacterial and archaeal communities were sequenced (Illumina GAIIx, 12 replicates for treatment) and correlated with eight different soil features. The microbial community composition differed widely between planting treatments, with three primary “community types” emerging in multivariate space: (1) A community type associated with bare soil linked with low P, low pH, and high aluminum [Al]; (2) a community type associated with Lablab beans linked with high soil N, total organic carbon and other base cation concentrations, and high pH; and (3) a community type of all other non-lablab planting arrangements linked with higher soil P (relative to bare soil), but lower soil fertility (N and base cations). Lablab-based arrangements also expressed the highest microbial richness and alpha diversity. The inclusion of Lablab in maize-based cropping systems represents a potential alternative to reduce the use of chemical fertilizers and increase the chemical and biological quality in agricultural soils under the no-tillage system.

1. Introduction

Management strategies that reduce chemical fertilizer use and increase soil quality in agricultural systems are essential for sustainable agricultural systems. This is particularly true for the world’s most commonly planted crops, including soy, wheat, maize, and rice, which as of 2014 cumulatively occupied nearly 50% of the world’s ~1.38 billion ha of agricultural lands [1]. For instance, in 2014 maize (the primary focus of the present study) is the second-most widespread crop, grown on ~185 million ha of land globally, second only to wheat at ~220 million ha [1]. As maize has a high demand for nutrients, especially nitrogen (N), supplying the N fertilizer for this crop alone has a high cost and contributes substantially to the input of the anthropogenic N to the atmosphere. No-tillage systems naturally increase the soil organic carbon and N levels, but the addition of legume cover crops can further increase natural inputs of N and other nutrients, reducing the need for expensive chemical fertilizers [2,3].
Spatial intercropping and crop rotations are well-known agricultural practices that maintain or enhance multiple aspects of chemical, physical, and biological components of soil, while mitigating negative environmental externalities associated with conventional management [4,5]. Specifically, as compared to conventional systems (often conceptualized as intensively managed monocultures), diverse intercropping arrangements and crop rotations have been widely associated with enhanced nutrient uptake by plants and water retention and availability [6,7,8,9,10], soil aggregate stability [11,12], soil organic carbon accumulation [13,14,15,16,17,18,19,20], enhanced natural pest control [21,22,23], and yield advantages [24,25,26]. Studies have traditionally pointed to niche differentiation, complementarity, and competition as the processes that give rise to these and other positive biodiversity-agroecosystem functional relationships [27,28]. However, the role of plant diversity in altering the microbial community composition is now becoming better understood as a primary mechanism enhancing agroecosystem functioning and mediating key environmental processes in agricultural systems including crop responses to biotic and abiotic stress, and enhanced crop nutrient uptake [29,30,31,32,33,34,35]. In turn, maintaining and/or enhancing the abundance and diversity of soil microbiota is now being identified as a key goal when managing and restoring previously degraded agricultural soils [36,37].
The rhizosphere is a critical interface for the exchange of resources between roots and the soil environment [38]. Plant roots exude sugars, carbohydrates, and secondary metabolites that shape microbial community structures and influence specific activities in the rhizosphere zone. The quality and quantity of these root exudates varies according to the plant species and it can select for specific groups of microbes, both bacteria and fungi, that play various roles in the soil [39,40,41]. The rhizosphere of maize has been found to have a consistent, heritable core microbial community [42,43]. Other crop species-planted in rotation or alongside maize – have been shown to impact the both the soil microbial communities, as well as the rhizosphere microbiome and therefore the health of the maize crop [44,45]. However, the effect of different plant arrangements and their influence over the soil microbiome has not been extensively studied, therefore it is also not well understood.
The hypothesis was that cover-crop arrangements have a significant impact on soil chemical variables and on microbial community structure and diversity. To test the hypothesis, an extensive sampling effort (n = 108) derived from Illumina NGS was employed, to evaluate how different cover-crops based maize cropping systems influenced microbial diversity in a subtropical Acrisol of southern Brazil.

2. Material and Methods

2.1. Site Description

This study was situated in a 29-year-old field experiment established at the Agronomical Experimental Station at the Federal University of Rio Grande do Sul, in southern Brazil (30°50′52″ S, 51°38′08″ W). The site has a subtropical climate with an annual mean temperature of 19.4 °C, and annual mean rainfall of 1440 mm. The soil in the experiment is classified as Acrisol according to the FAO classification system, as Typic Paleudult by the US taxonomy, and is composed of 54% sand, 24% silt, and 22% clay in the 0–0.2 m layer. The experiment was installed in 1983 in a previously degraded soil due to the adoption for 15 years of the conventional tillage system that promoted extensive soil disturbance and erosion.

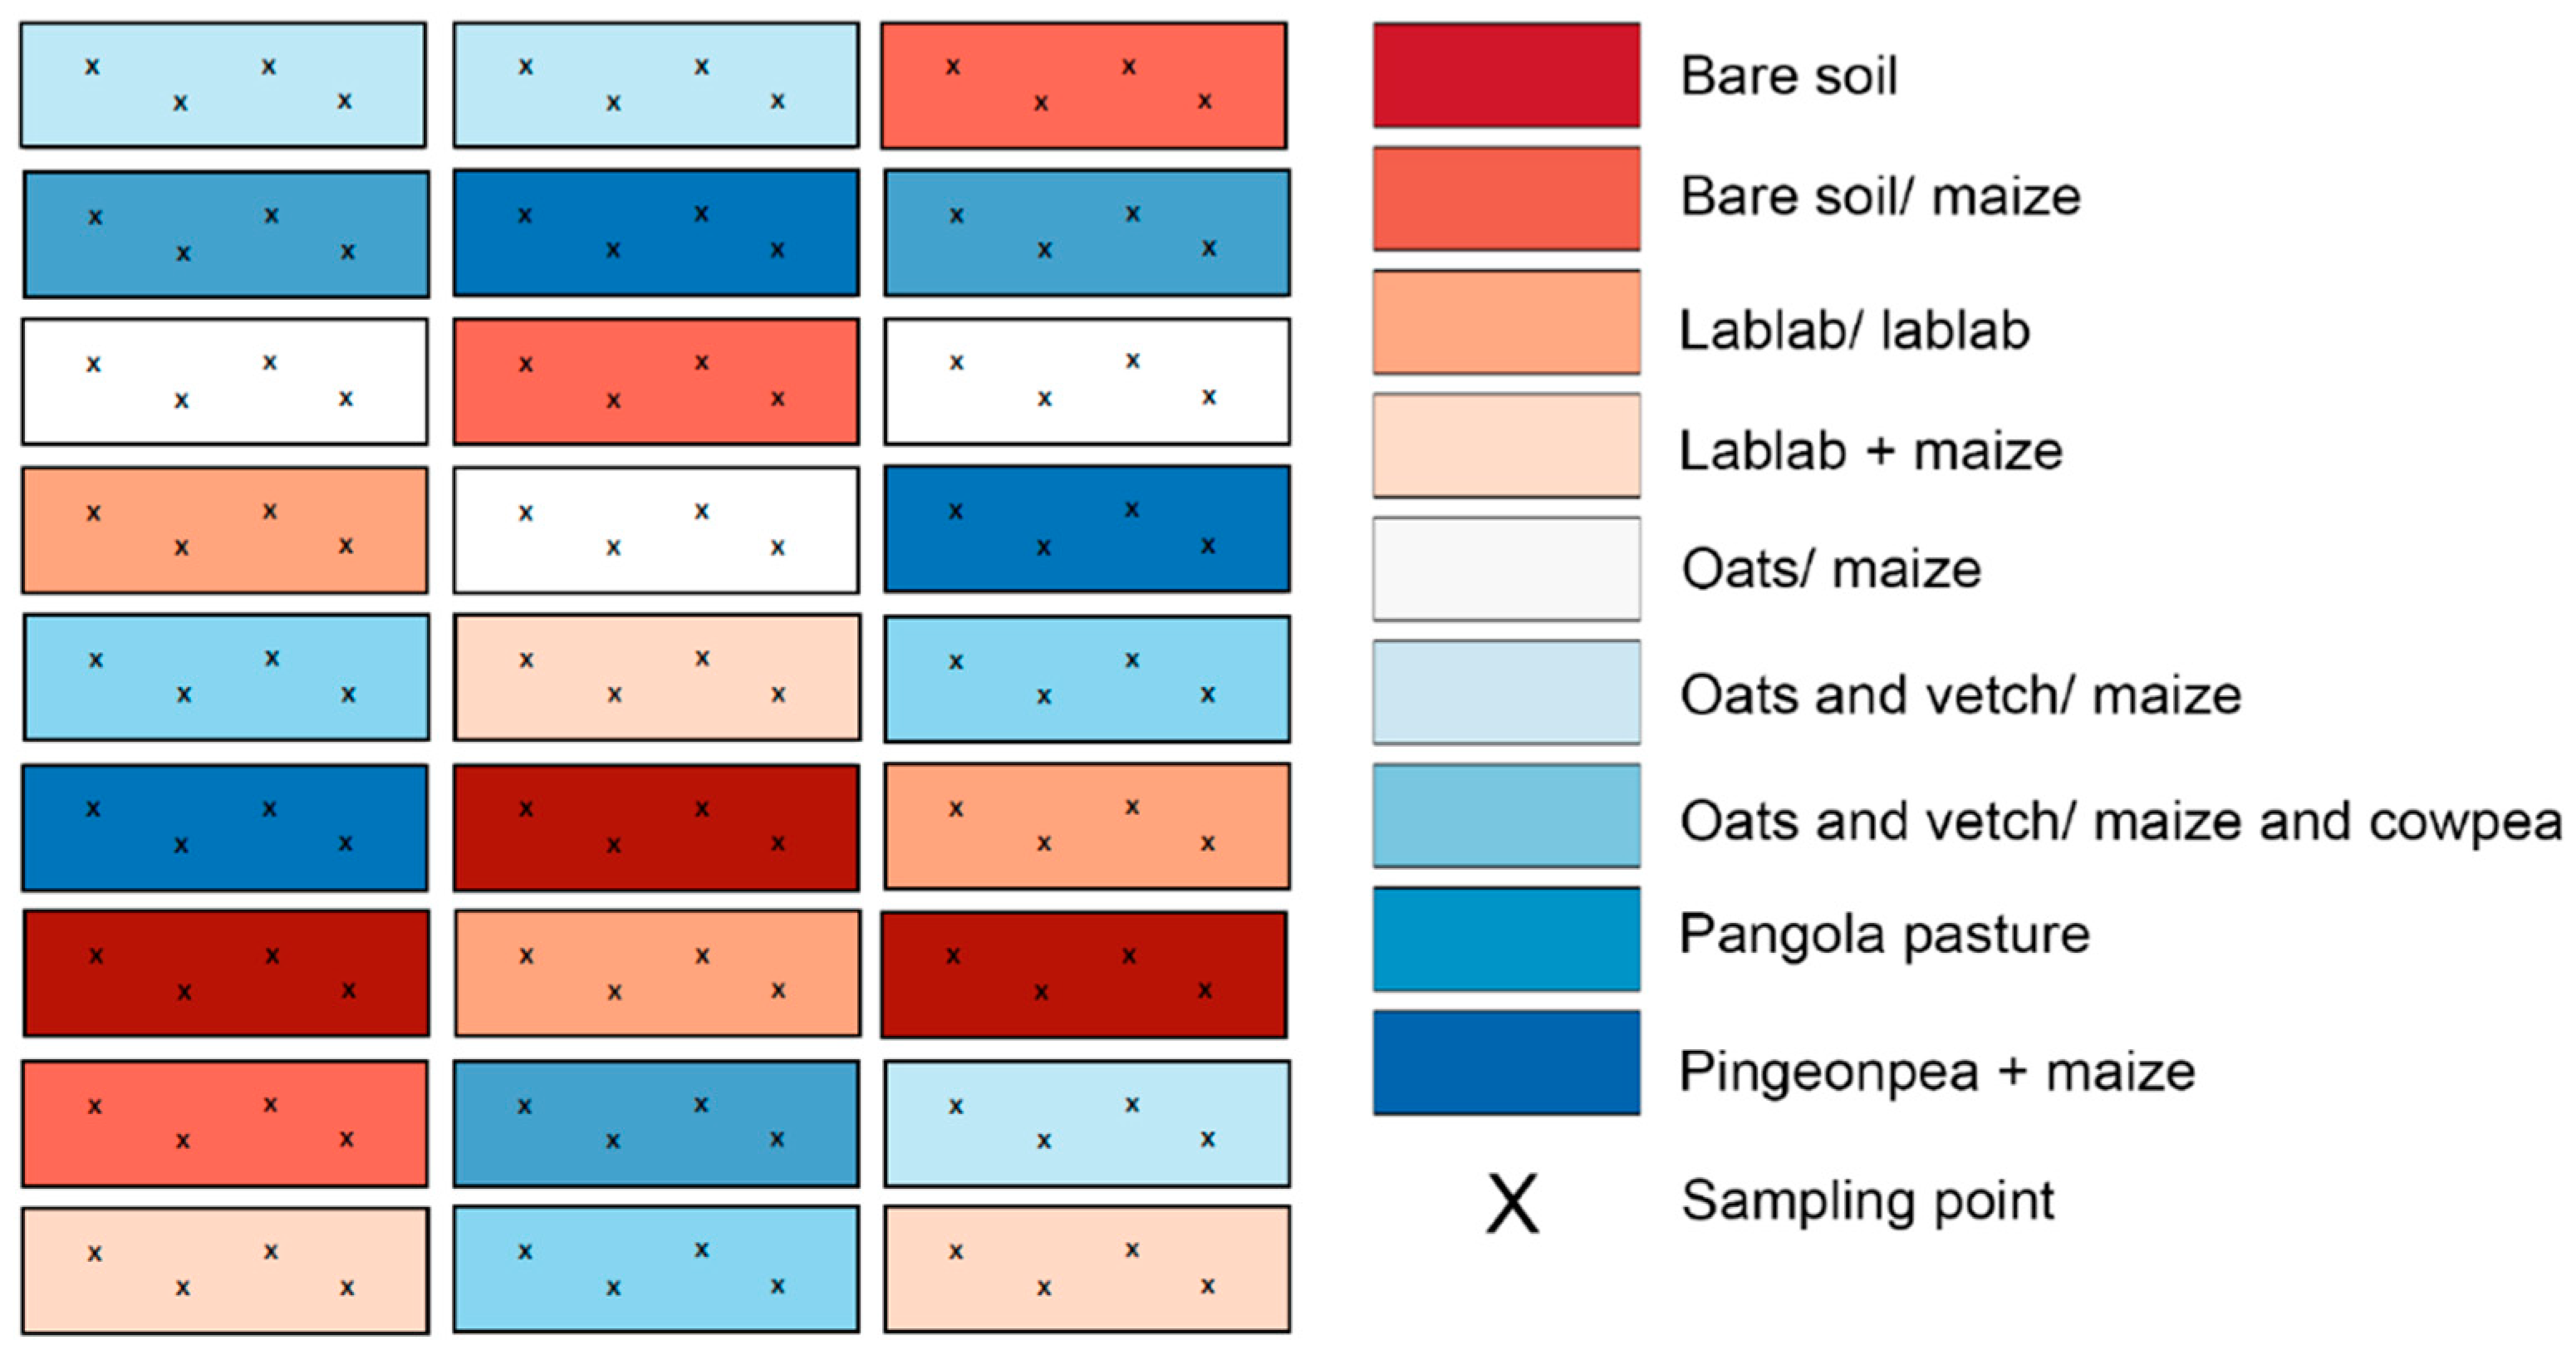
2.2. Experimental Design, Treatments, and Soil Sampling

The experimental arrangement followed a randomized block design, with three replicates. Eight different no-till cropping systems were selected for this study (a‒i), as well as a bare soil as a control treatment. Six cover crop-based cropping systems were designed to employ mainly combinations of winter and summer cover-crops, respectively, in rotation or intercropped with maize as a target crop: [(i) Fallow/ maize (Zea mays L.), (ii) oats (Avena strigosa Schreb.)/ maize, (iii) oats + vetch (Vicia sativa L.)/maize, (iv) oats + vetch/ maize + cowpea (Vigna unguiculata [L.] Walp.), (v) lablab (Lablab purpureus) + maize, and vi) pigeon pea (Cajanus cajan L. Millsp.) + maize]. In addition, a permanent pasture [pangola (Digitaria eriantha) (vii) and a continuous lablab cropping system (Lablab/lablab) (viii) were evaluated.
Soil sampling was carried out in 2012. Four soil sub-samples were collected per plot. Thus, the microbial community composition data presented here represents data from n = 4 sub-samples from n = 3 replicates per cropping system (Figure 1). All soil samples were collected at 0–10 cm depth using sterilized PVC columns. Once collected in the field, approximately 200 g of the sampled soil from the middle of each column was separated and stored in a cooler with ice packs and transported to the laboratory. Approximately 20 g and 180 g of soil was allocated for DNA sequencing and chemical analysis, respectively.

2.3. Soil Chemical Analysis

Soil samples were air dried and sieved (0.2-mm sieve). The pH, P-Mehlich, Ca, Mg and Al levels were analyzed as described by Tedesco et al. (1995) [46]. A neutral solution of KCl mol L−1 was used to extract Ca, Mg and Al. Levels of Ca and Mg were determined by atomic absorption spectrophotometry, and Al concentration by neutralization with NaOH titration [46]. Potassium was extracted by using a solution of H2SO4 0.05 mol L−1 + HCl 0.05 mol L−1 and determined by flame photometry [46]. The soil C total N concentrations were determined by dry combustion using a Fisher Scientific analyser. Mineral N was performed using Kjeldahl [46]. Total acidity (H + Al) was extracted using the calcium acetate solution (0.5 mol−1 L) buffered to pH 7 and quantified by titration with NaOH neutralization [46].

2.4. DNA Extraction and Sequencing of the 16S rRNA Gene

The genomic DNA was isolated from 0.5 g of soil using the MoBio PowerSoil ™ DNA Isolation Kit (Carlsbad, CA, USA) according to the manufacturer protocols.
Primers 304F and 806R [47] were used to target the V3-V4 region of the 16S rRNA gene, with the addition of a barcode sequence and the required Illumina adapters [48]. The PCR reactions conditions for 16S amplification were: An initial denaturation temperature of 94 °C for 3 min, followed by 20 cycles of 94 °C for 45 s, 53 °C for 30 s, 65 °C for 90 s, and a final elongation step at 65 °C for 10 min. The sequencing was performed on an Illumina GAIIx sequencer (Illumina, Inc., San Diego, CA, USA). The sequence analysis and the taxonomic identification were based on the methods of Dias et al. (2014) [49] and Richardson (2012) [50].
The removal of low-quality bases and primer region was performed using the FastX-Toolkit v0.0.13 (http://hannonlab.cshl.edu/fastx_toolkit/). Barcode separated reads were aligned to the Ribosomal Database Project database (RDP Version D633-D642) using MPI-blastn [49]. The results were mapped to their respective classification using sequence identity thresholds/ Matches were filtered at 80% length fraction and classified at the 80% identity level for domain and phylum, 90% identify for class, order and family, and 95% identity for genus level [50]. Pairs that did not match to the same sequence in the RDP database [51] were annotated according to their Last Common Ancestor (LCA), and pairs that did not have an LCA, or any match in the RDP database, were considered to be unclassified. All sequencing data reported and analyzed here are available on DDBJ/EMBL/GenBank database under the BioProject number PRJNA301687.

2.5. Statistical Analysis

Microbial diversity was estimated for each treatment using both classified and unclassified sequences. The script used for these analyses can be found in https://gist.github.com/3078251.
We first used the analysis of variance (ANOVA) to assess how the soil chemical composition, abundance (genus level), richness, and diversity differed across planting treatments, and coupled this with a Tukey’s honestly significant difference (HSD) test to assess all pairwise differences among treatments. Spearman correlations (p ≤ 0.01) were performed using XLSTAT-Pro 2016 (Addinsoft’s core software).

2.6. Multivariate Analysis of Microbial Community Composition

To assess the environmental drivers of the microbial community composition we employed a number of complementary multivariate analyses. First, we used the redundancy analysis (RDA) to evaluate how the planting arrangement and soil parameters influenced the microbial community composition. The RDA was implemented based on the Hellinger-transformed abundance data using the ‘rda’ function in the “vegan’ R package [52], and the statistical significance of all predictor variables was assessed using a permutational multivariate analysis of variance (PERMANOVA) implemented using the ‘anova.cca’ function in the ‘vegan’ package with 999 permutations used.
Based on the results of the PERMANOVA (detailed below), we then analyzed multivariate community dissimilarities across planting treatments. To do so we generated a dissimilarity matrix among all samples based on Bray-Curtis distances using the ‘vegdist’ function in the ‘vegan’ R package, and then used the ‘betadisper’ function to test if the average community composition within treatments (where n = 12 samples per treatment) differed significantly in comparison to the average community composition observed across all samples (i.e., a “global centroid”, where n = 108). Finally, we used a permutation test to evaluate if the microbial community composition differed significantly across treatments using the ‘permutest’ function with 999 permutations used. For all multivariate analyses, block identity was included as a random effect to account for potential spatial autocorrelation in the community composition.

3. Results

3.1. Impacts of Cropping Systems on Soil Chemical Variables

Soil chemical features differed significantly as a function of crop arrangements (Table 1). The mineral N concentration in the soil under the pigeon pea/ maize and maize/ lablab (16.7 mg and 15.3 mg N·kg−1) cropping systems were 8-fold higher than in the bare soil (1.8 mg N·kg−1); the same treatments presented twice the total N when compared with the bare soil. While the highest observed pH (5.5) was detected in the soil planted with the pangola pasture, the lowest pH (4.6) was detected in the soil under the pigeon pea+maize intercropping system. In the lablab/ lablab and lablab + maize, the Al3+ (toxic) concentration was respectively five and ten-fold smaller when compared with the bare soil. The soil organic carbon was 2-fold higher in the pigeon pea + maize and lablab/ lablab than in the bare soil.

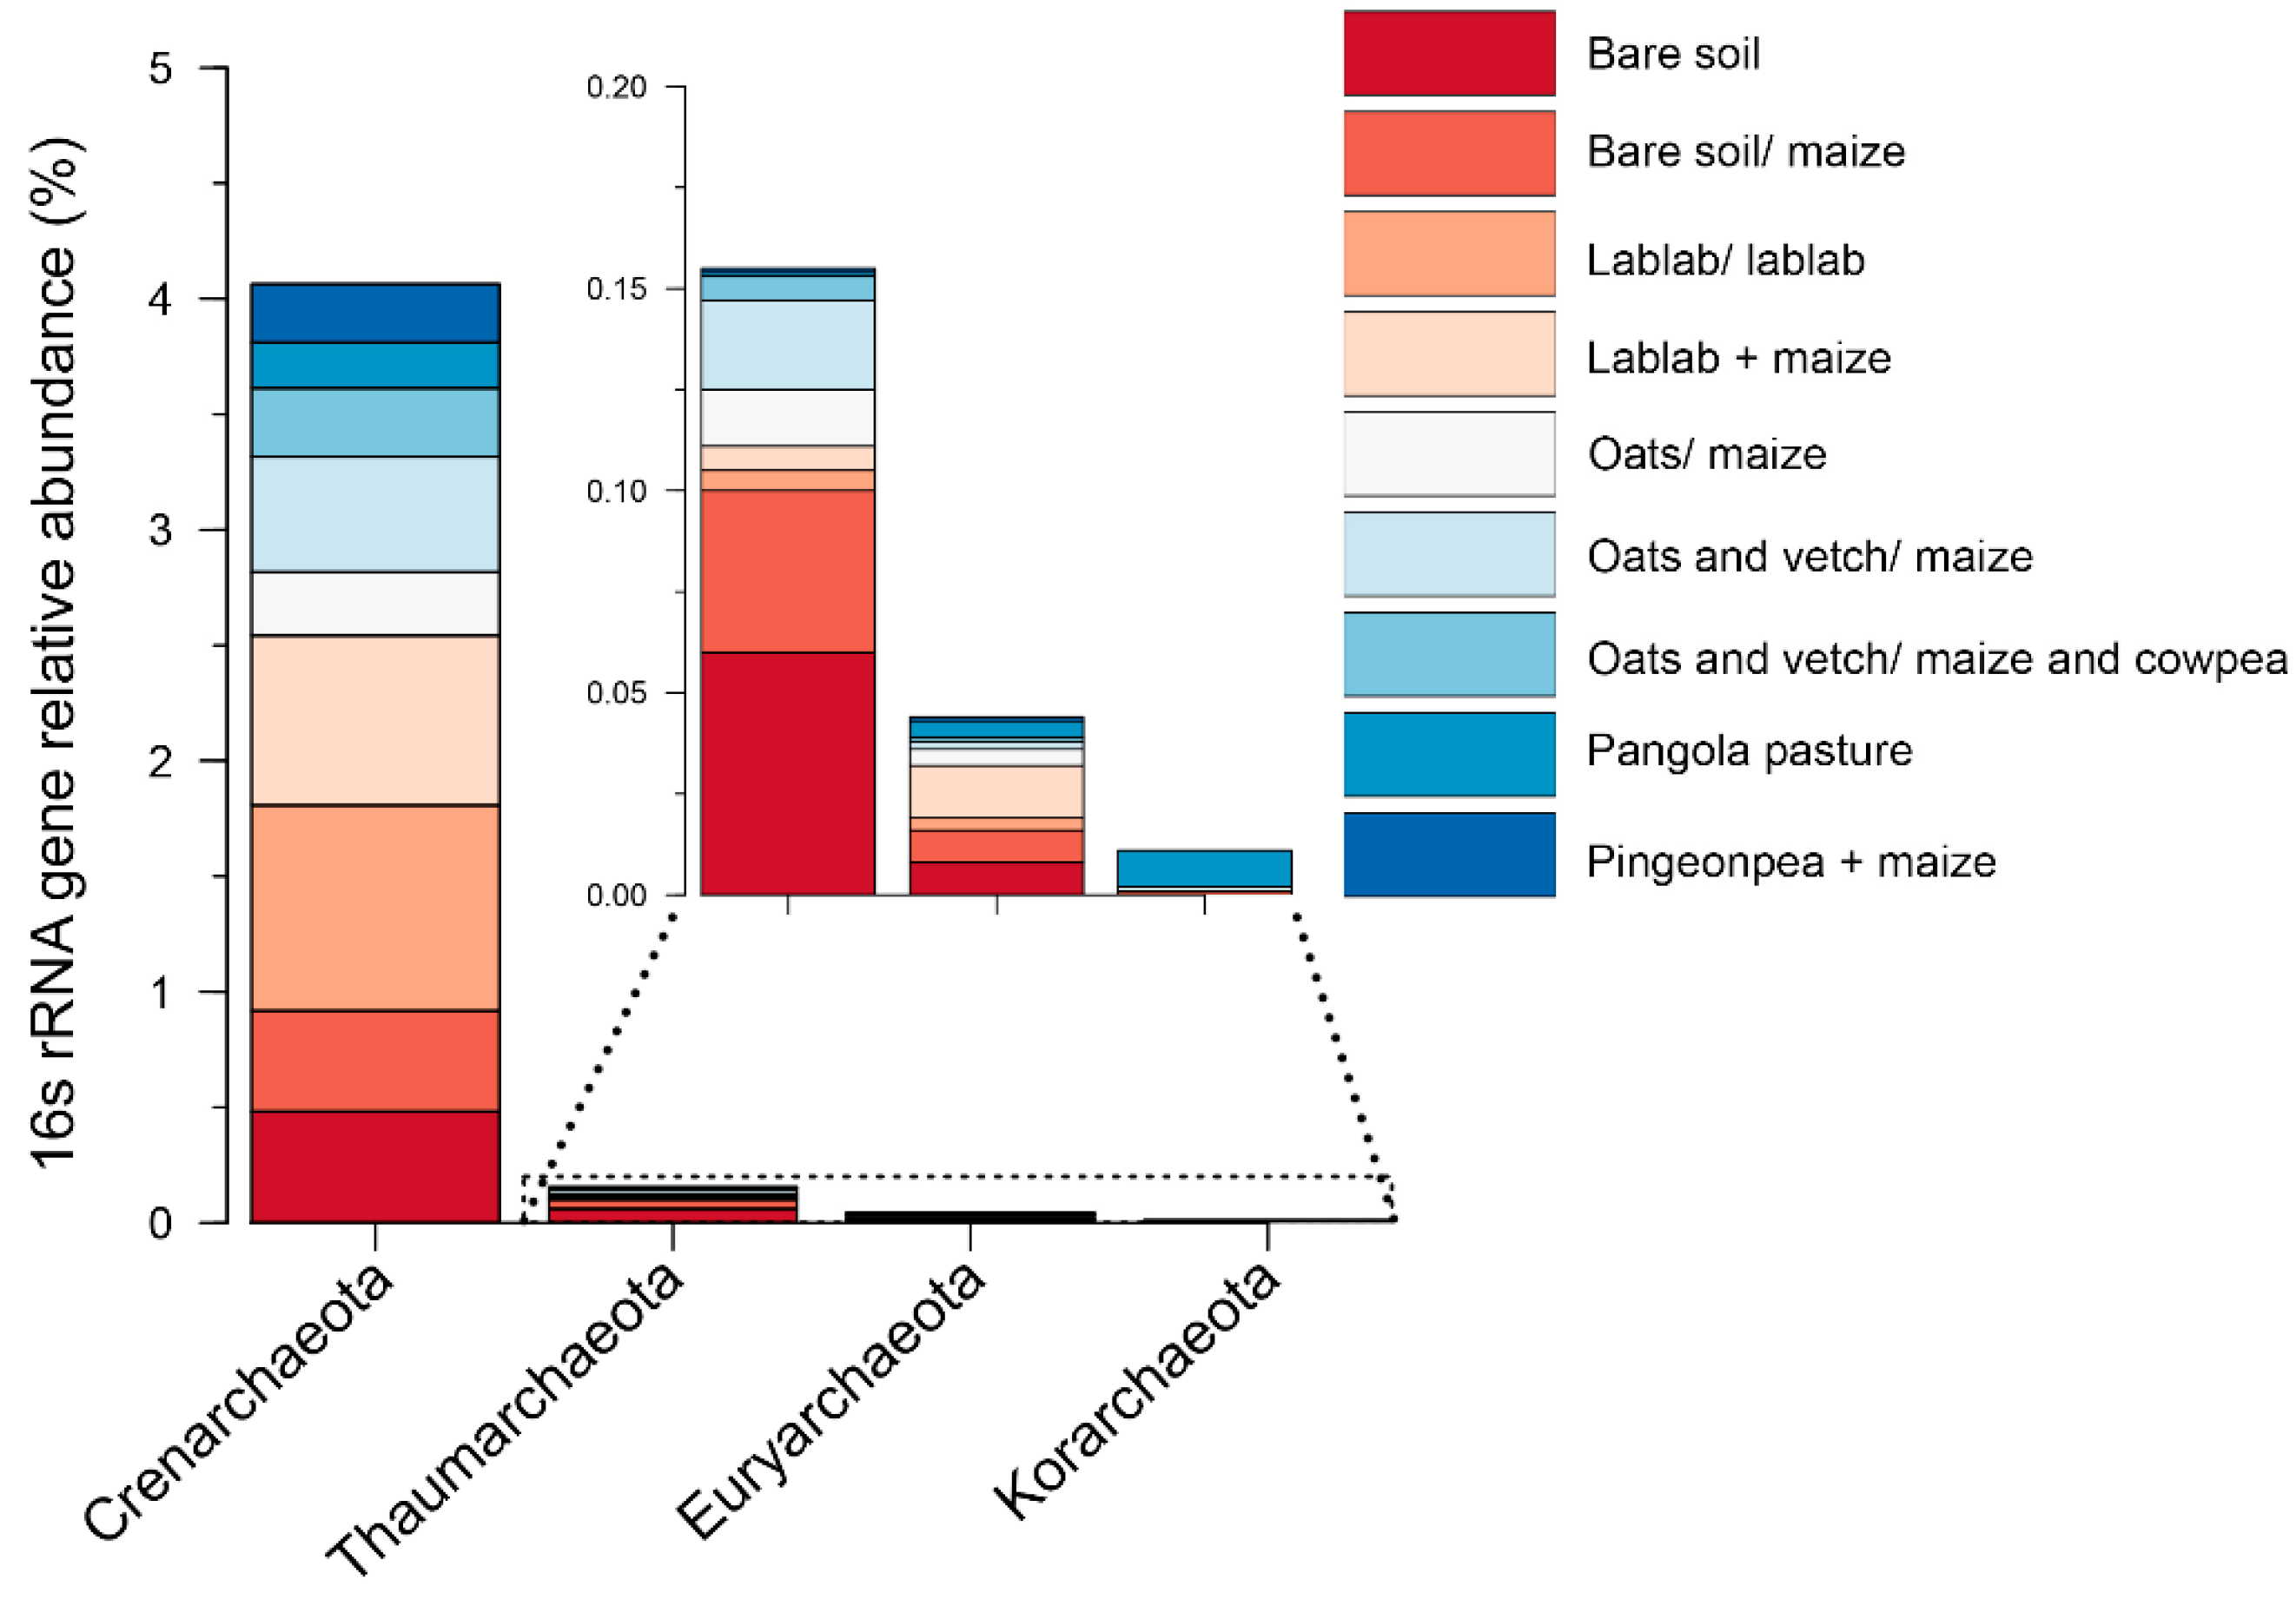
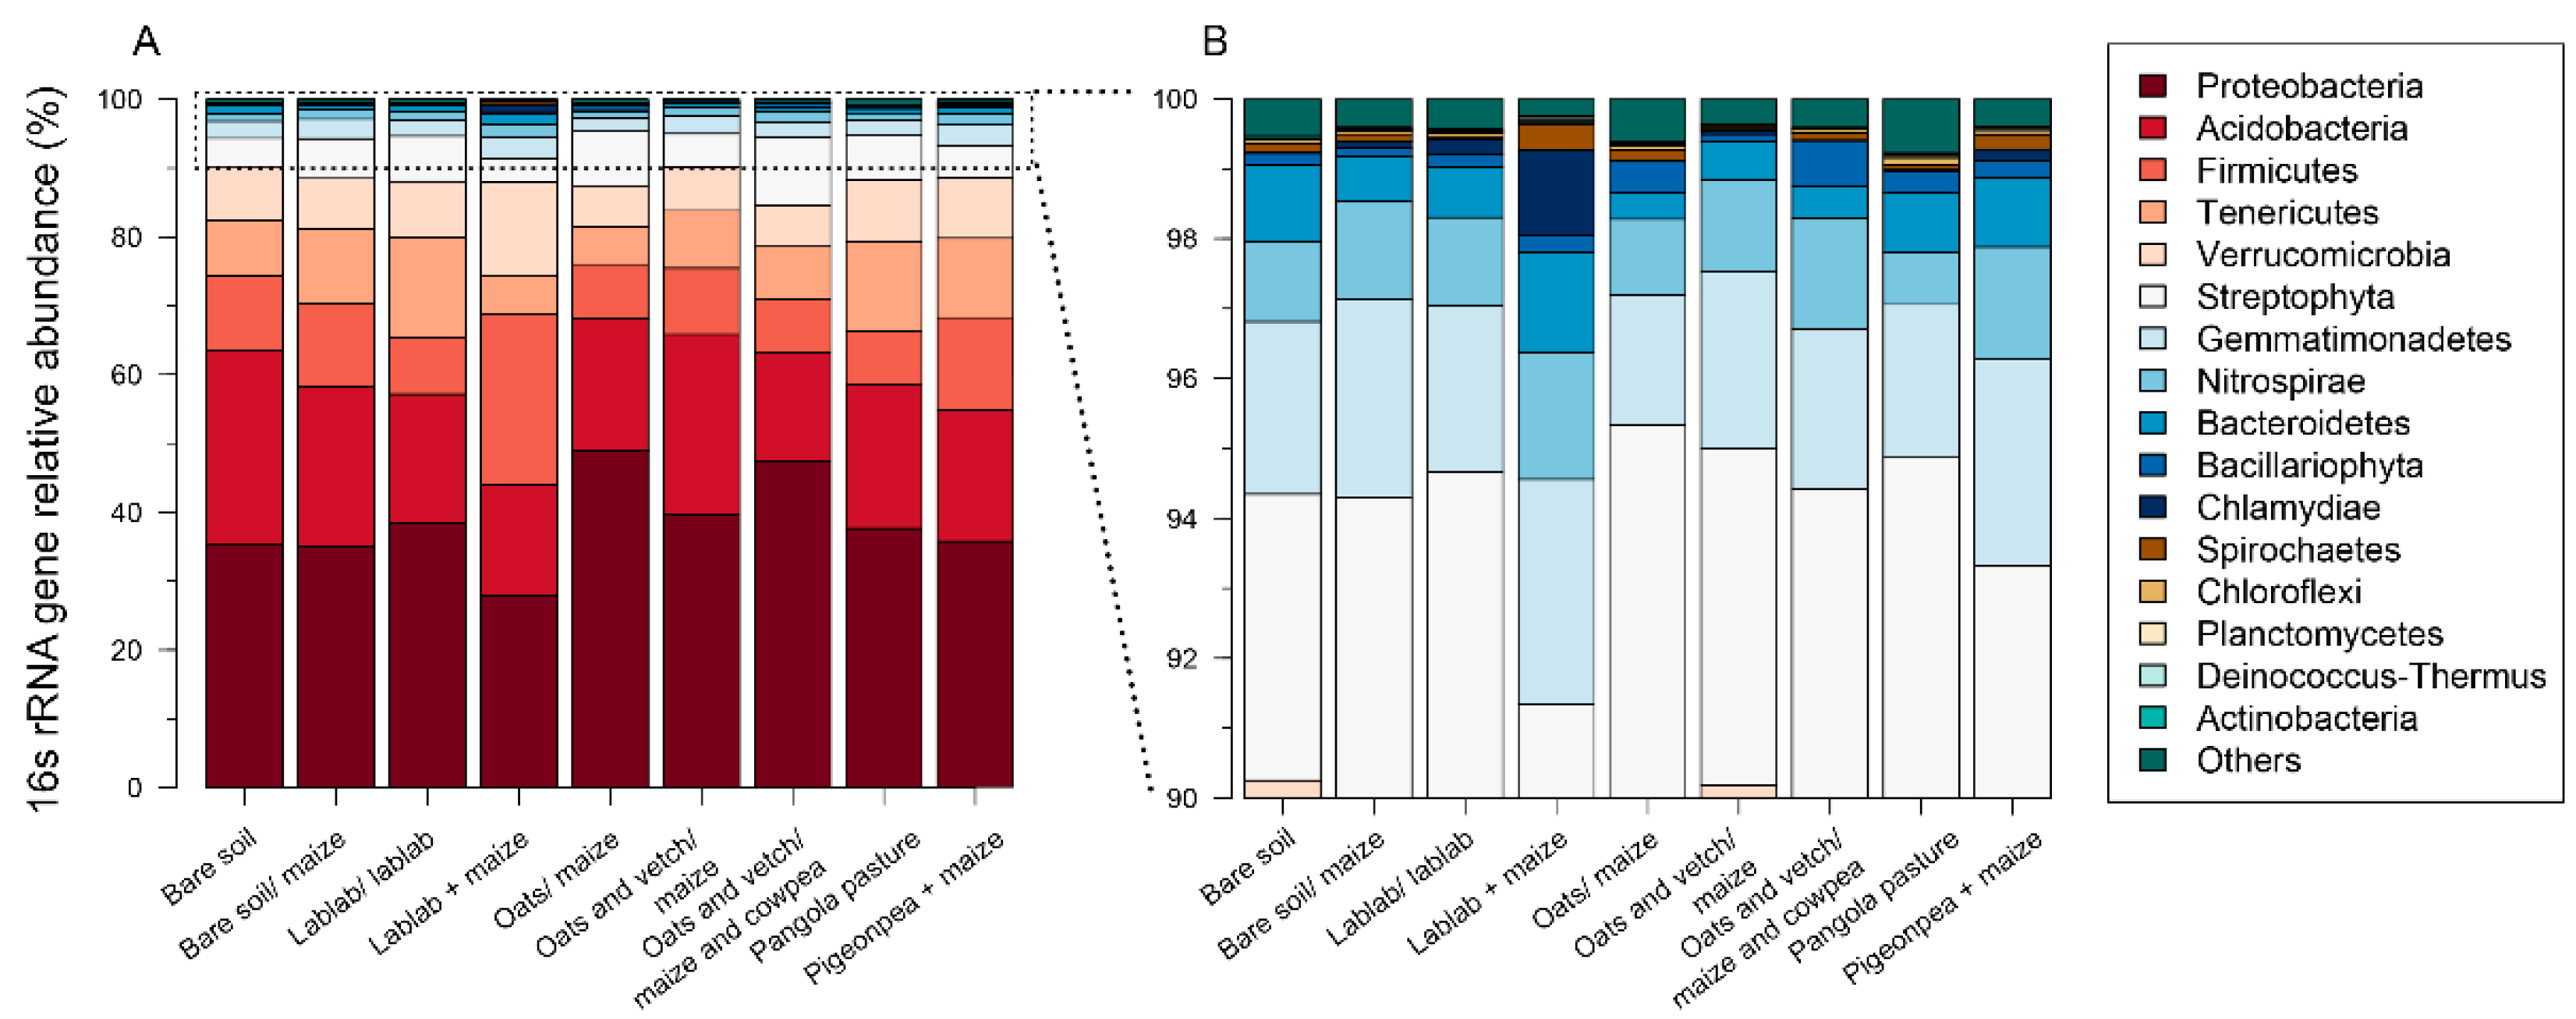
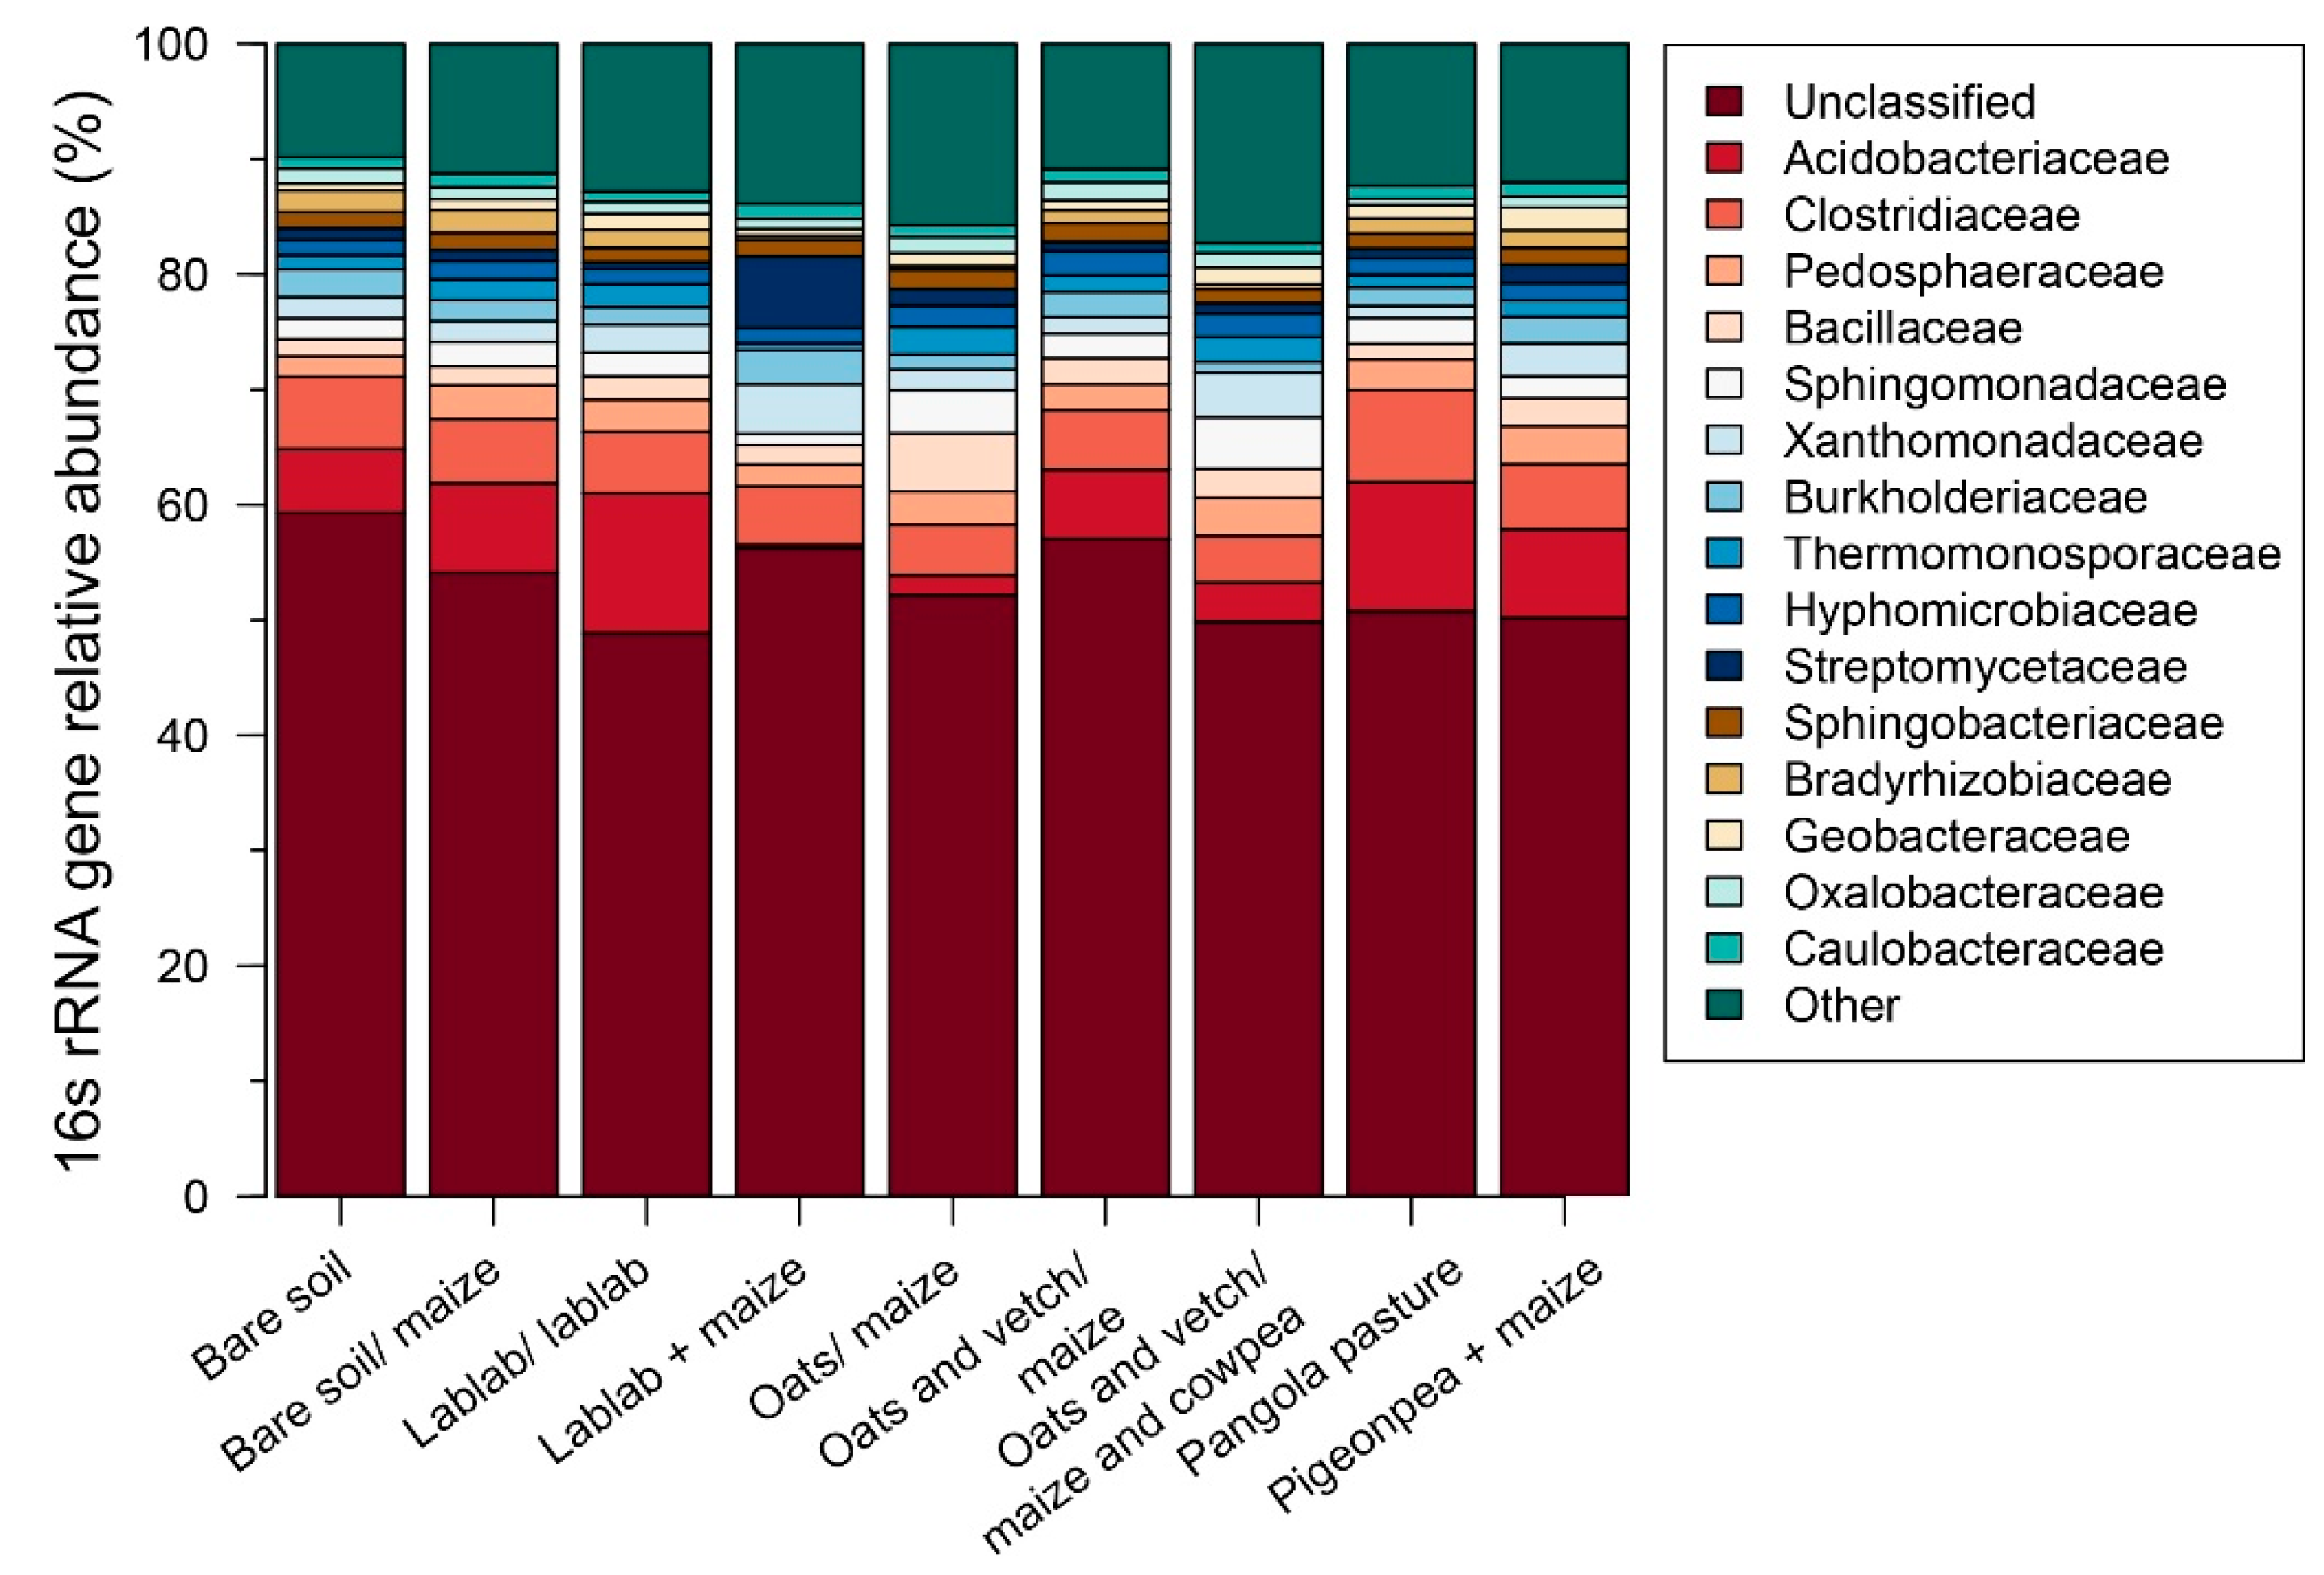
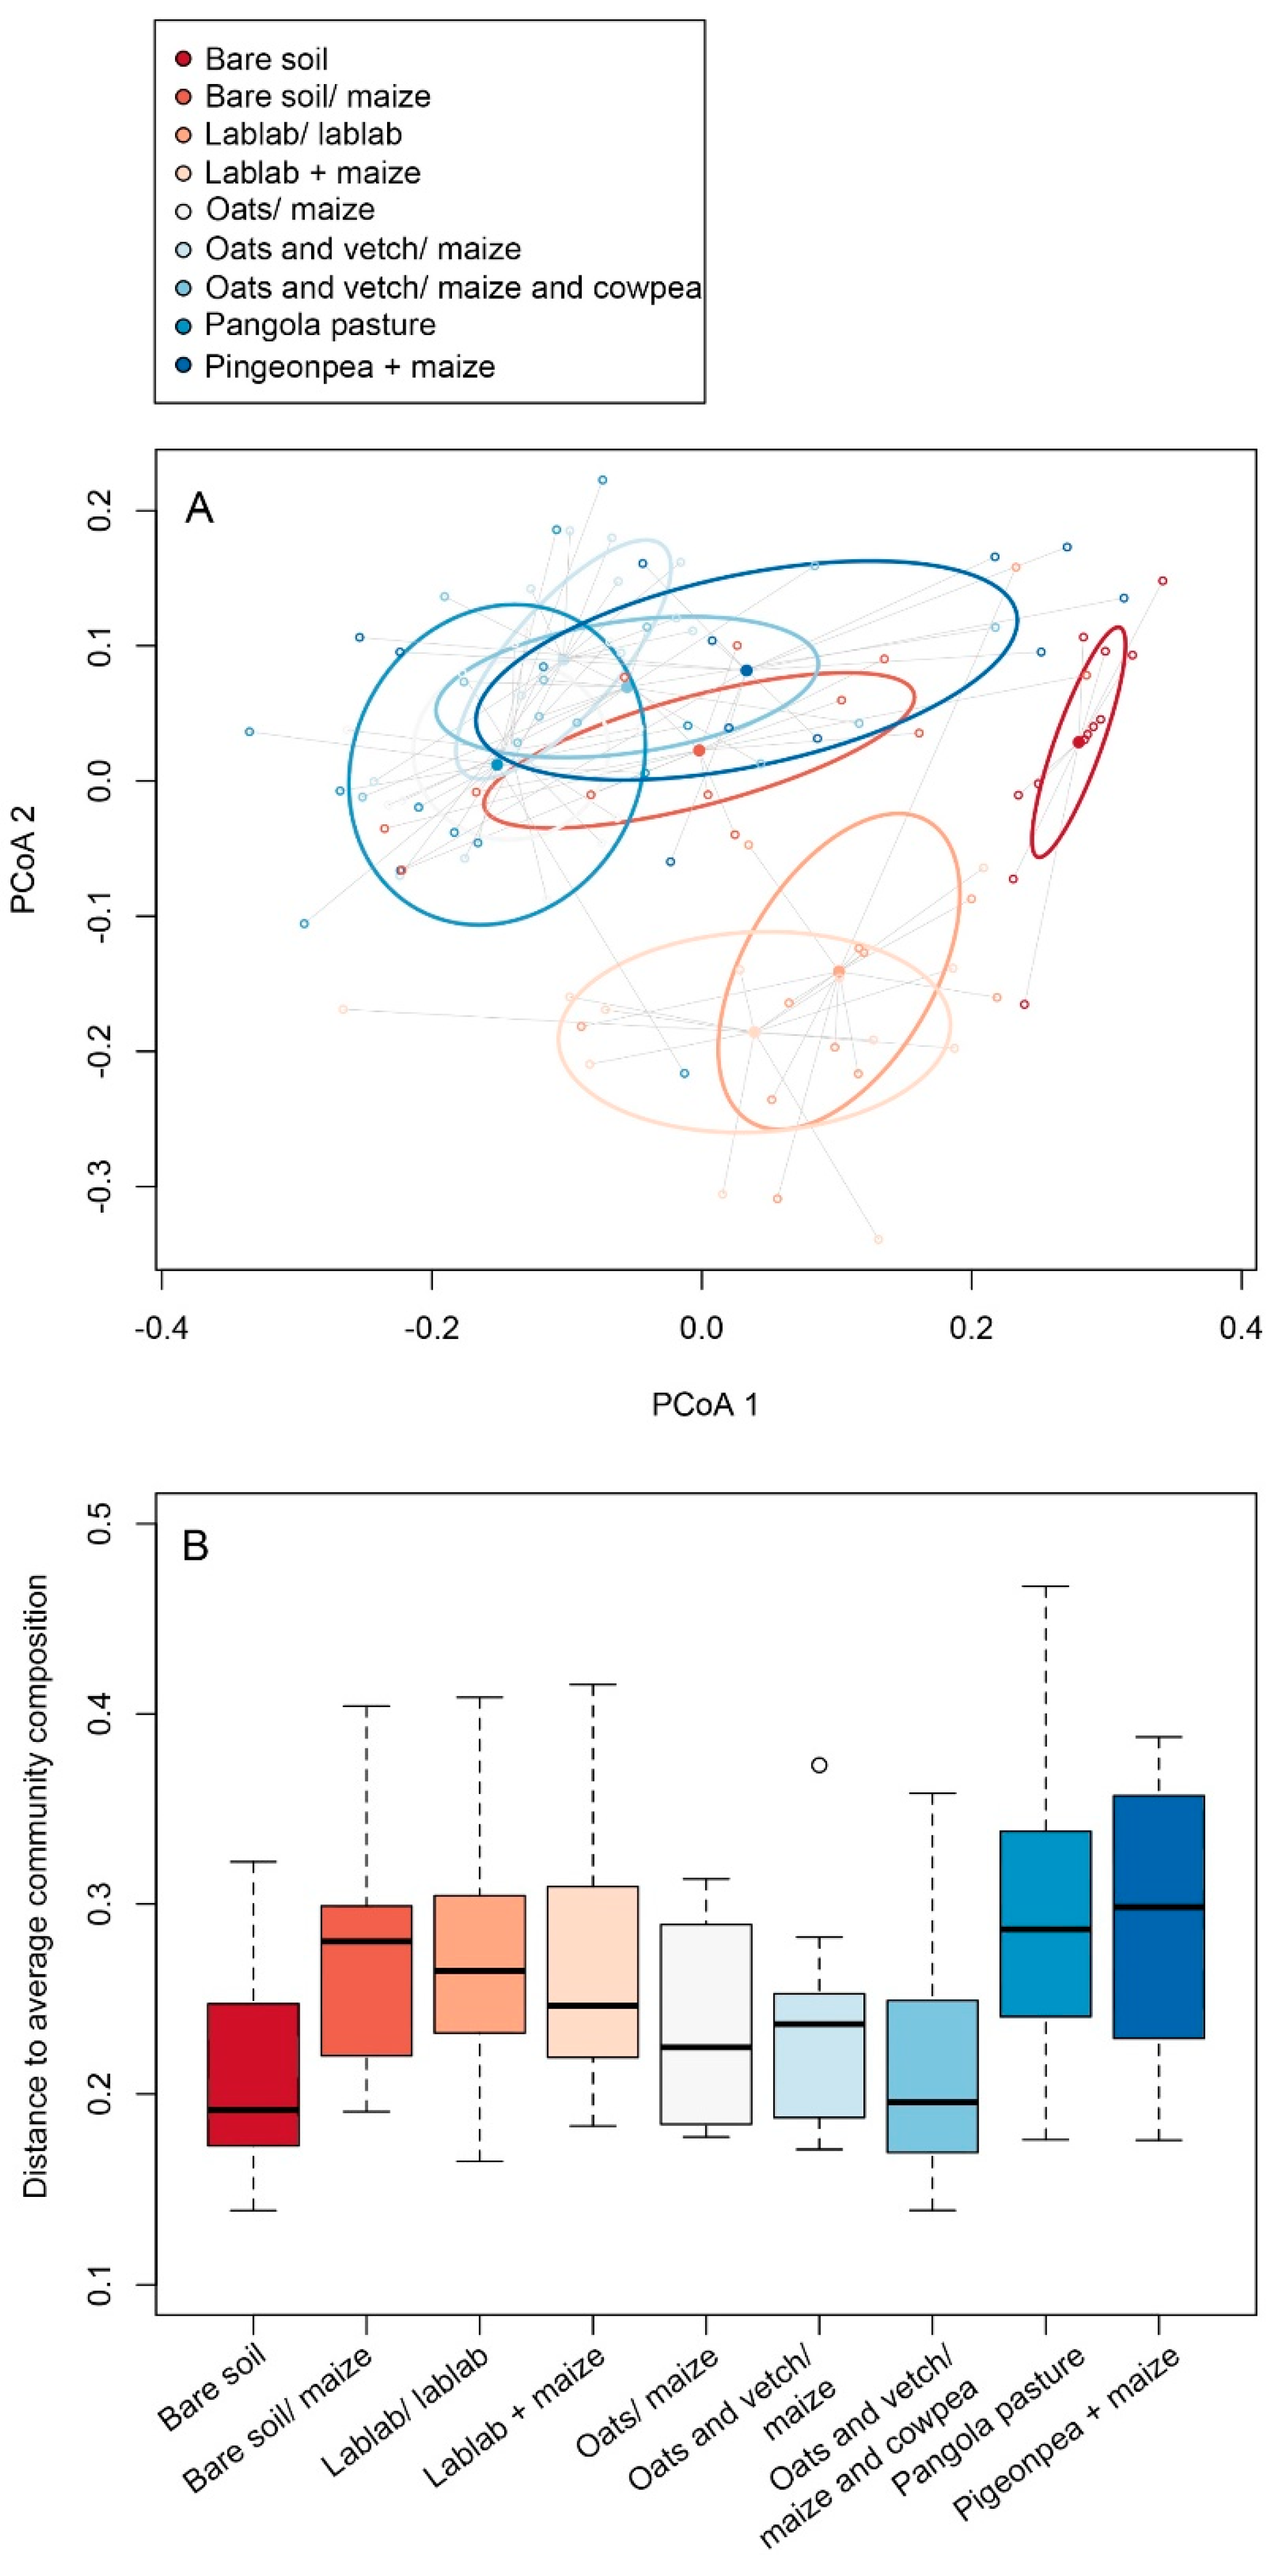
3.2. Impacts of Cropping Systems on Soil Microbial Diversity

A total of 6,354,218 reads (Table 2) were obtained from Illumina sequencing after trimming (average of 60,000 reads per sample). The domains Bacteria and Archaea detected were distributed among 30 phyla with 13 phyla with relative abundance lower than 1%, according the Ribosomal Database Project (RDP) database. When assessed at different taxonomic levels, overall diversity was highest in the lablab + maize treatment (Table 3). The lowest diversity was detected in the samples were the pigeon pea/ maize were being cultivated, as well as in the oats+vetch/ maize treatments (Table 3).
Four archaeal phyla were detected with relative abundances varying between 0.01 and 0.9% of total reads (Figure 2). Crenarchaeota was the most abundant archaeal phylum detected in all cropping systems. Thaumarchaeota was significantly higher in the bare soil and in fallow/maize plots. The phylum Crenarchaeota was detected in the experiment with relative abundance ranging between 0.1% and 1% of total reads.
Only seven bacterial phyla presented a relative abundance higher than 1% of the total reads (Figure 3), representing up to 60% of the total sequences. Proteobacteria and Acidobacteria were the most abundant phyla, with relative abundance ranging from 20%–60%. Firmicutes relative abundance ranged from 4%–15% of the classified reads. At the family level (Figure 4), Acidobacteriaceae and Clostridiaceae were the most abundant families in all soils, with abundance varying between 5%–10%. Pedosphareaceae (former Verrucomicrobia subdivision 3) presented higher abundance where only grasses were planted. Bacillaceae abundance was higher in oats/ maize soil.
553 genera were distributed among all the treatments (Table S1). The seven most abundant genera (Table 4) were compared using ANOVA (Tukey, p-value < 0.001) and Clostridium abundant in oats/ maize and in pangola pasture soils was about 60 times higher than in the bare soil. Sphingomonas abundance in the bare soil and lablab + maize was three times higher than in the pigeon pea + maize soil. Burkholderia, a well-known nitrogen fixing organism presented twice the abundance in lablab/ lablab when compared with all other treatments. Bacillus, Candidatus Koribacter, and Bradyrhizobium relative abundances varied but did not differ significantly.

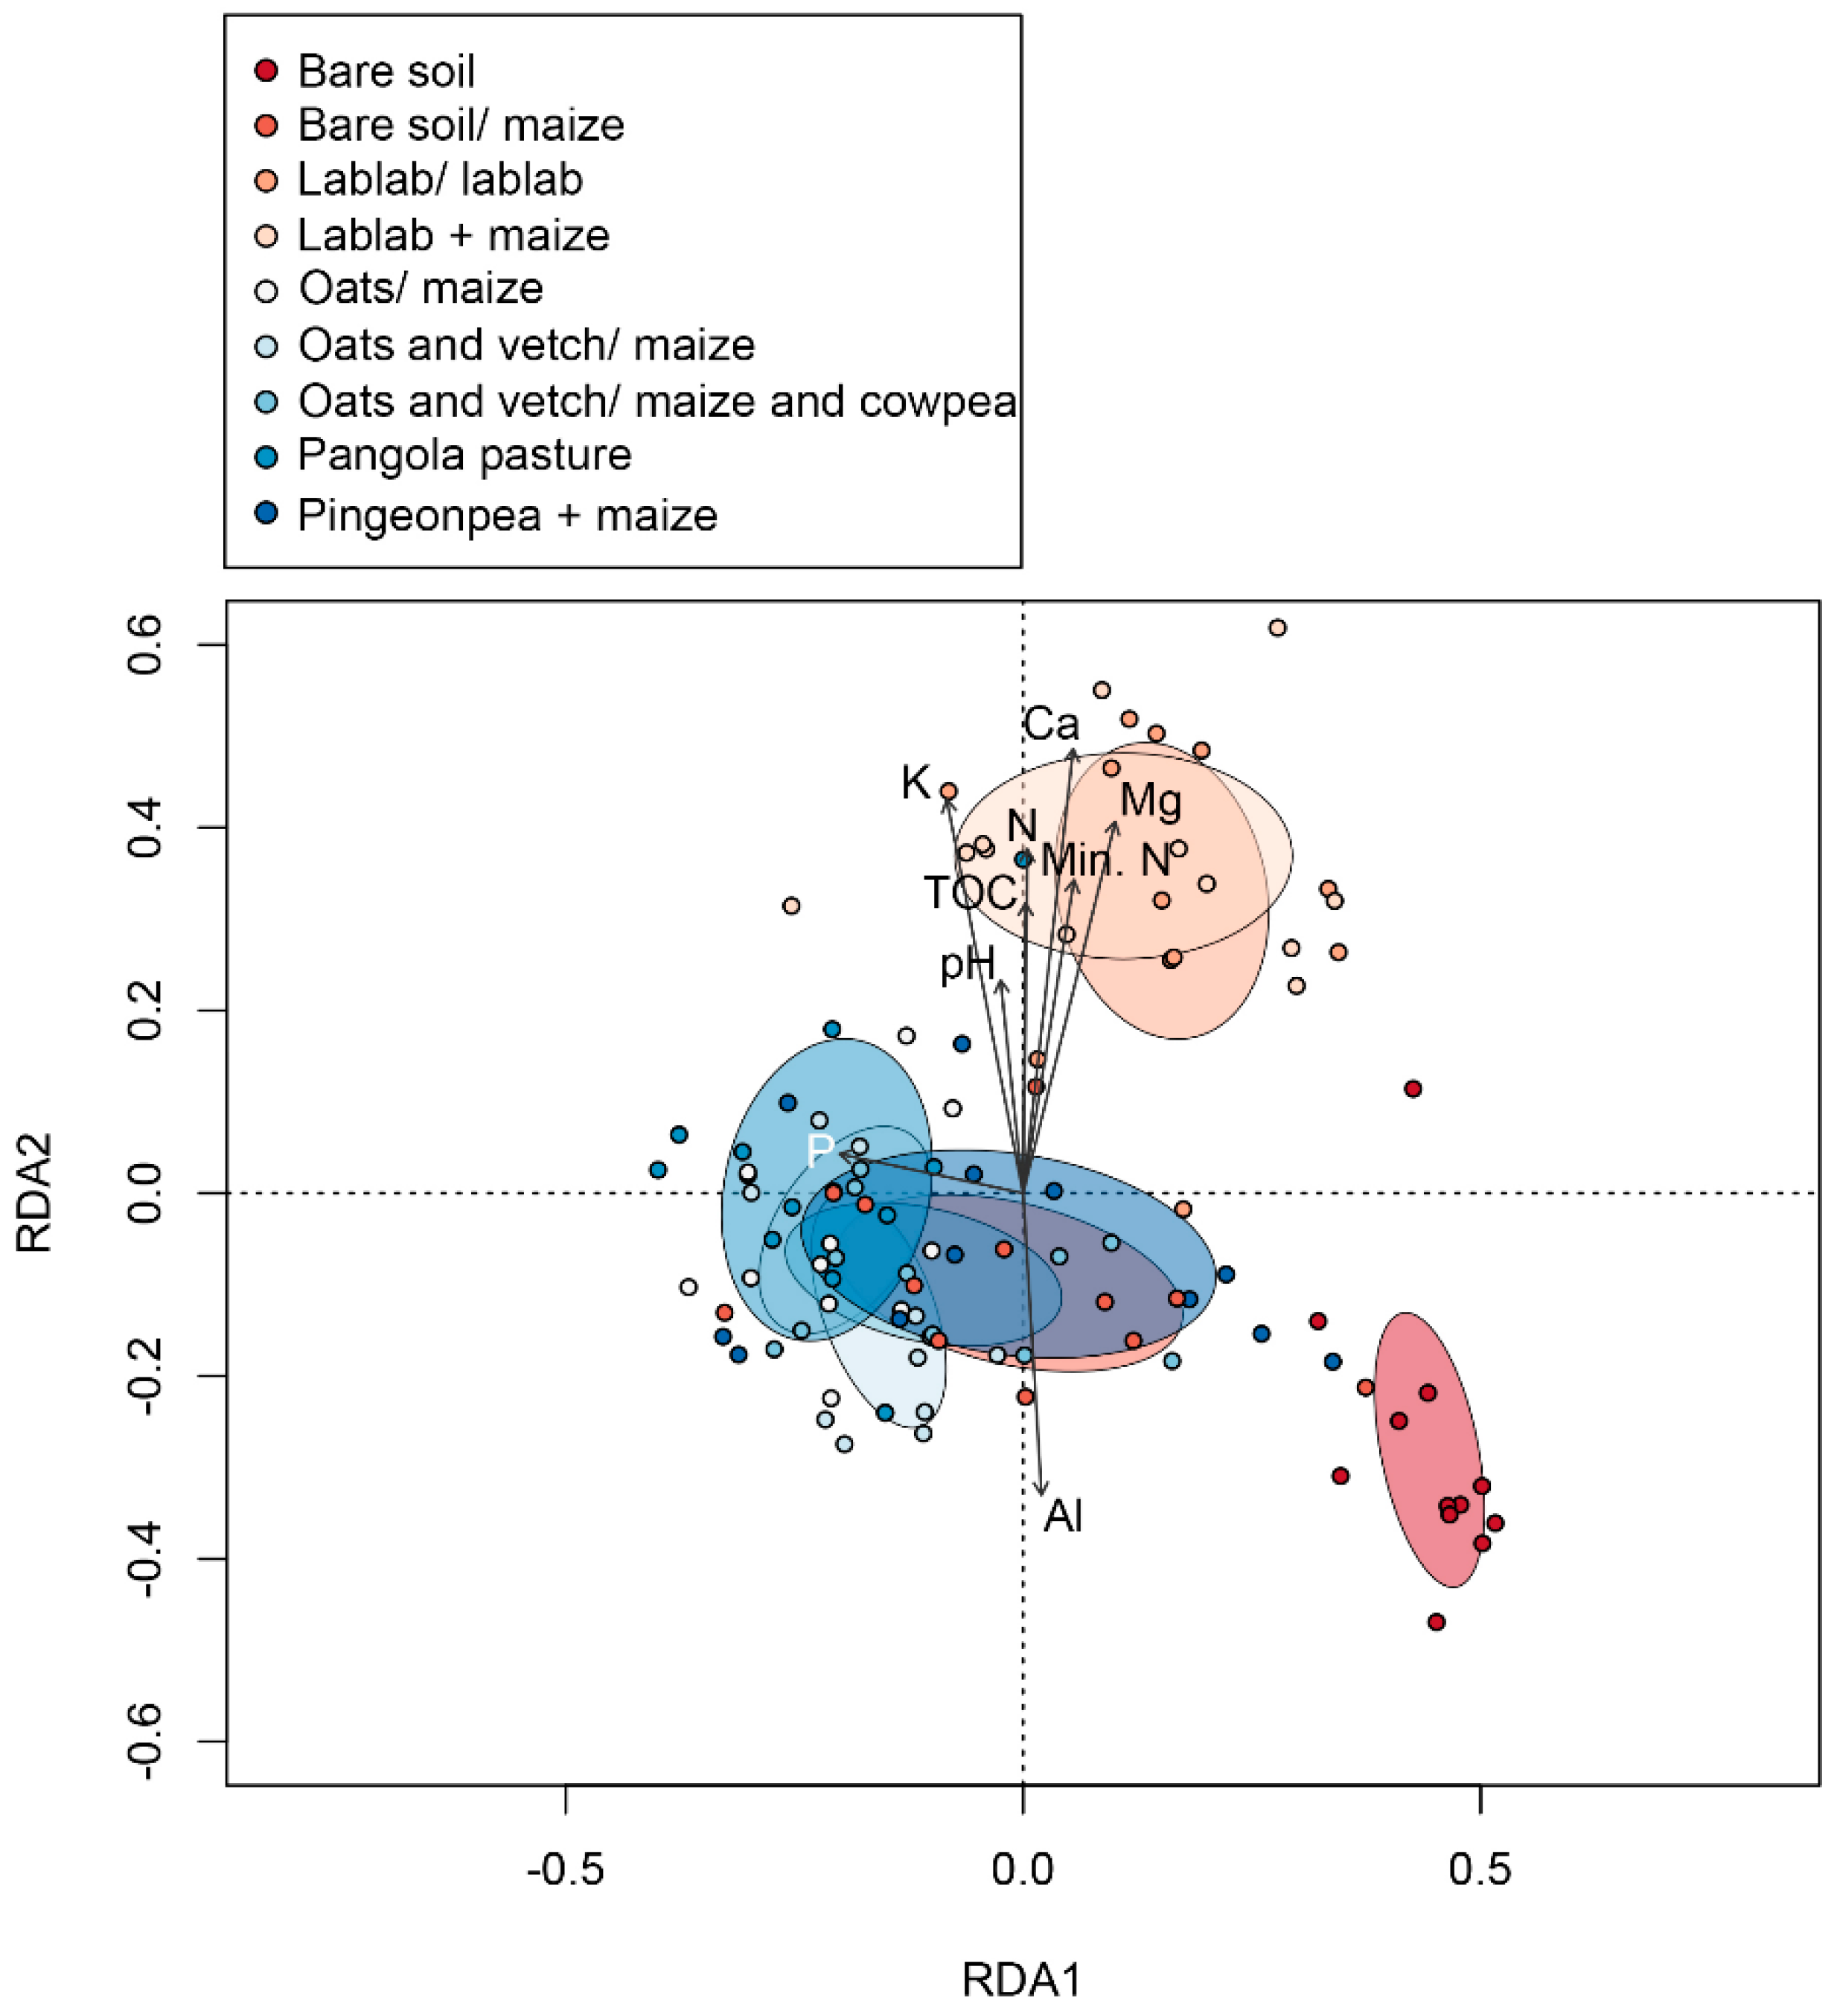
3.3. Linkages between Changes in Soil Chemical Variables and Microbial Diversity

Cropping systems significantly influenced microbial diversity at the genus level (p < 0.005) and based on the dissimilarly analysis, three treatments that differed significantly from one another could be broadly discerned (Figure 5A).
First, the community composition of all samples derived from the bare soil treatment separate from all other treatments along the first principal coordinate/ RDA axis (Figure 6).
These differences were largely correlated with the low soil P present in the bare soil as compared to all other treatments (Table 3). The second grouping within a similar community composition was comprised of lablab/ lablab and lablab + maize cropping systems, which differentiated from other cropping systems along the second RDA/ principal coordinate axis (Figure 6). This axis of community variation was largely correlated with the two lablab-based treatments expressing high soil fertility and pH, largely correlated with lower soil Al (Figure 6). Finally, the remaining six cropping systems expressed microbial community compositions that were largely undifferentiated from one another in multivariate space but differed from the previous two groupings. These differences in the community composition were largely interrelated with this group expressing high soil P (relative to lablab-based treatments) and lower soil fertility and pH linked with higher Al (relative to bare soil) (Figure 6; Table 1; Table S2). The distance to average community composition is shown in Figure 5B.
The Spearman correlation (p-value ≤ 0.001) between microbial genera and soil chemical features (Table S3) showed that Paenibacillus correlated positively with soil pH; Duganella, Nitrospira, Pseudomonas, Leptothrix, Variovorax, and Flavobacterium were positively correlated with soil pH, Ca, and Mg contents; Rodhodoplanes, Phenylobacterium, Pseudomonas, Leptothrix, and Flavobacterium correlated positively with organic C and total N; and Rodhodoplanes and Phenylobacterium correlated with mineral N as well. Opitutus correlated with P concentration. Ca. Koribacter, Bradyrhizobium, Actinoallomurus, and Actinomadura, correlated negatively with pH and positively with Al (which is soluble in acidic soils). A negative correlation between some genera and soil features were also observed, such as Streptomyces, Paenibacillus, Flavisolibacter, Actinomadura, Kitsatospora, and Chthoniobacter with organic C and total N content (both total and mineral); Paenibacillus and Flavobacterium with P concentration; and Ca. Koribacter, Actinoallomurus, Ca. Solibacter, Actinomadura, and Mycobacterium with Ca and Mg concentrations in soil.
Some genera abundance correlated positively with specific crops, such as Burkholderia, Pseudomonas and Leptothrix with lablab; Flavobacterium with pangola pasture; Clostridium with oats; Rhodoplanes and Ca. Solibacter with pigeon pea; Sphingomonas, Sphingobacterium, Nitrospira, Pseudomonas, Variovorax, and Flavobacterium with oats+vetch; and the bare soil correlated with the abundance of Sphingomonas, Actinoallomurus, Streptomyces, Paenibacillus, Flavisolibacter, Actinomadura, Mycobacterium, Kitasatospora, and Chthoniobacter.

4. Discussion

In this study it was explored how crop succession and intercropping changed the soil chemical features and affected the soil microbial communities. By employing a long-term agricultural experiment that included a wide range of agroecological crop arrangements, it was found that soils planted to Lablab purpureus alone or intercropped with maize were significantly different from soils of the other treatments. Lablab plantings correlated with high N (total and mineral), organic C, and exchangeable cations (Ca, Mg, K). This study showed that cropping systems affect soil chemical features and the microbial community structure, influencing the overall soil quality and fertility. The results found elucidated a more detailed mechanistic understanding of how certain species, in rotation or intercropped, can reduce the use of chemical fertilizers in maize-based agroecosystems.

4.1. Impacts of Legume Cover Crop-Based Cropping Systems on Soil Chemical Variables

The results indicate that the lablab and pigeon pea led to increases in the soil organic C and total N contents. When cover crops are cultivated in succession or intercropped with maize as the main crop in agroecosystems, the C and N input and recycled nutrients have a sensible impact on soil organic matter contents in soil, as well on nutrient supply of cash crops cultivated in succession (maize, in this case) and to soil microorganisms [5]. This process improves the biological, chemical, and physical quality of the soil. Lablab, for example, produces about 50 Mg ha−1 of fresh matter and releases annually to the soil about 246 kg N, 133 kg P, 484 kg K, and 51 kg Mg per hectare [53].
It was detected that an increase in the soil pH in the plots containing Maize + Lablab or Pangola pasture. In highly weathered and acid soils from the tropics [54], lime additions are widely employed as a means raise pH (generally to pH levels ≥ 6.0) and therefore enhance cation availability. However, certain crops can naturally increase the soil pH in tropical systems and therefore is a viable means to reduce agrochemical inputs (specifically, Ca- or Mg-based amendments).

4.2. Impacts of Legume Cover Crop-Based Cropping Systems on Soil Microbial Diversity

Cropping systems can increase soil microbial diversity [55] and enhance agroecosystem functions [56]. In this study it was detected that lablab previously or intercropped with maize significantly increased microbial alpha diversity; a trend possibly due to lablab roots exudate quality and concentration, which may stimulate certain group of microorganisms. This explanation is consistent with the growing literature that demonstrates soil microbial diversity and composition are linked with plant species composition vis-à-vis root exudates [57,58,59,60]. Zhalnina et al. (2018) [61] used comparative genomics and exo-metabolomics to study how plant exudates can attract microorganisms in Avena barbata and detected that bacteria were specially attracted by aromatic organic acids exudate by the plant roots. Rhizodeposition products (exudates, lysates, mucilage, secretions) can account for up to 40% of the dry matter produced by plants [62], and these compounds can regulate the communication processes between plant and rhizospheric bacteria (quorum-sensing) [63,64].
Soil archaeal members have been neglected in many studies that just focused on bacterial and fungal microbial communities, but the knowledge about their functional importance is increasing and we believe that significant microbial community assessments should always include Archaea. In our analysis here, Crenarchaeota presented the highest archaeal abundance in all the samples where Lablab was planted, indicating a possible beneficial interaction between this legume with Crenarchaeota members; this correlation indicates a role of the Crenarchaeota in increasing soil N, Ca, K, Mg, and organic C. Although Crenarchaeota has long been considered rare in the environment, more recent studies, including our own, suggest it is very common in agricultural soils [65,66,67,68]. We also detected that Thaumarchaeota, an archaeal phylum related to ammonia oxidation in soils and marine environments [69,70,71,72,73], was more abundant in the bare soil. Furthermore, we detected that Thaumarchaeota did not correlate with the soil pH, but rather correlated positively with Al concentration, and negatively with Ca, Mg, organic C, and N, contrary to the findings of Zhalnina et al. (2014) [74] when studying the Florida Everglades agricultural soils.
We observed a large range of bacteria and archaea with relative abundance smaller than 0.01% (long richness tail). These microorganisms are considered part of the rare bacterial biosphere [75], organisms that stay in a quiescence state but are genetically viable and can persist in the soil waiting for an episodic situation of nutrient availability to grow up their population [76]. The rare microbiota would probably contribute with the soil resilience through storing microbial genetic potential, which could help plants in a case of drought, disease or nutrient stress.
Some members of the Burkholderia are well-known plant endophytes, and have been proven to stimulate the plant growth and increase the natural plant resistance to environmental stresses [77,78], and it is frequently found as a diazotrophic nodulater of legumes in tropical soils [79,80]. Burkholderia were found in significantly higher abundances in lablab plots as compared to all other treatments.
The Bacillus genus was most abundant in the bare soil treatment. This Gram-positive genus is a well-known endospore producer, such that they can stay dormant for long periods in poor quality soils, while “waiting” for more favourable environmental conditions to proliferate. This may explain their high abundance in soils with no input of nutrients such as a bare soil, which confers them a function related to resilience [81,82].
Clostridium was the most abundant genera in all agricultural treatments except bare soil treatments. This is likely linked with the no-tillage bare soil systems tendency to conserve soil humidity, therefore creating anaerobic microsites which may stimulate Clostridium abundance. Some soil strains of Clostridium are diazotrophic and may be playing an important role in N cycling in the evaluated cropping systems [83].

4.3. Linkages between Changes in Soil Chemical Features and Microbial Diversity

Multivariate analyses of soil chemical features, in addition to the soil microbial structure, clearly showed that the introduction of lablab to the maize in a no-till system improved soil chemical and biological features. More specifically, in the lablab-based intercropping arrangement, we detected a group of bacteria that are likely related to soil fertility as they were positively correlated with the TOC and N content; this includes Rhodoplanes, Phenylobacterium, Pseudomonas, Leptothrix, and Flavobacterium. Yet on the other hand, in this same arrangement a group related with poor soil conditions and low pH was also detected including Actinomadura, Kitasatospora, and Chthoniobacter. Finding different microbial abundances in different planting compositions indicates how sensitive the soil microbial community is regarding changes in the soil nutrient level and pH. Soil chemical features are totally dependent on the kind and composition of crop (s) used and the kind of nutrients those plants can release into the soil, which appears to result in the selection of specific groups of microorganisms.
Lablab (Lablab purpureum) cultivated as a summer cover crop previously or intercropped with maize increased soil fertility and prokaryotic richness and diversity. These findings are potentially related to root exudation and highlight the potential of summer legume cover crops to increase soil quality, in addition to the N supply and maize grain yields.

Supplementary Materials

The following are available online at https://www.mdpi.com/2571-8789/3/3/50/s1, Table S1: Abundance matrix (generated from Illumina sequencing data) including the relative abundance, at genus level, for each treatment, in 12 replicates (n = 108). Table S2: Results from a constrained ordination (RDA) evaluating the effects of planting arrangement and nine soil variables on microbial community composition. Statistically significant parameters (where p ≤ 0.05) are highlighted in bold. Table S3: Spearman rank correlation coefficients (Spearman’s ρ) between the 30 most abundant genera and soil features. Red cells correspond to correlations where Spearman’s ρ is statistically significantly negative (where p ≤ 0.01), while blue cells correspond to correlations where Spearman’s ρ is statistically significantly positive.

Author Contributions

Conceptualization, P.D.d.Q., K.Z., R.F., C.B. and F.A.d.O.C.; Data curation, A.R.M. and R.D.; Formal analysis, P.D.d.Q.; Funding acquisition, C.B., E.W.T. and F.A.d.O.C.; Investigation, P.D.d.Q., K.Z., A.G., R.F. and E.W.T.; Methodology, P.D.d.Q., A.G. and C.B.; Resources, C.B., E.W.T. and F.A.d.O.C.; Supervision, E.W.T. and F.A.d.O.C.; Validation, A.R.M.; Writing—original draft, P.D.d.Q., A.R.M., C.B. and E.W.T.; Writing—review & editing, K.Z., R.D., A.G., R.F. and F.A.d.O.C.

Funding

This research was performed with the financial support of the National Counsel of Technological and Scientific Development (CNPq); the National Science Foundation (grant number MCB-0454030); and the United States Department of Agriculture (grant numbers 2005-35319-16300, 00067345).

Conflicts of Interest

The authors declare no conflict of interest.

References

  1. Martin, A.R.; Cadotte, M.W.; Isaac, M.E.; Milla, R.; Vile, D.; Violle, C. Regional and global shifts in crop diversity through the Anthropocene. PLoS ONE 2019, 14, e0209788. [Google Scholar] [CrossRef] [Green Version]
  2. Bayer, C.; Mielniczuk, J.; Martin-Neto, L.; Ernani, P.R. Stocks and humification degree of organic matter fractions as affected by no-tillage on subtropical soil. Plant Soil 2002, 238, 133–140. [Google Scholar] [CrossRef]
  3. Loss, A.; Pereira, M.G.; Perin, A.; Beutler, S.J.; Cunha dos Anjos, L.H.C. Carbon, nitrogen and natural abundance of δ13C e δ15N of light-fraction organic matter under no-tillage and crop-livestock integration systems. Acta Sci. Agron. 2012, 34, 465–472. [Google Scholar] [CrossRef]
  4. Tilman, D.; Cassman, K.; Matson, P.; Naylor, R. Agricultural sustainability and intensive production practices. Nature 2002, 418, 671–677. [Google Scholar] [CrossRef]
  5. McDaniel, M.D.; Grandy, A.S.; Tiemann, L.K.; Weintraub, M.N. Crop rotation complexity regulates the decomposition of high and low quality residues. Soil Biol. Biochem. 2014, 78, 243–254. [Google Scholar] [CrossRef] [Green Version]
  6. Drinkwater, L.E.; Wagoner, P.; Sarrantonio, M. Legume-based cropping systems have reduced carbon and nitrogen losses. Nature 1998, 396, 262–265. [Google Scholar] [CrossRef]
  7. Drinkwater, L.E.; Snapp, S.S. Nutrients in agroecosystems: Rethinking the management paradigm. Adv. Agron. 2007, 92, 163–186. [Google Scholar]
  8. Ren, Y.Y.; Liu, J.J.; Wang, Z.L.; Zhang, S.Q. Planting density and sowing proportions of maize/soybean intercrops affected competitive interactions and water-use efficiencies on the Loess Plateau. Eur. J. Agron. 2016, 72, 70–79. [Google Scholar] [CrossRef]
  9. Aller, D.; Mazur, R.; Moore, K.; Hintz, R.; Laird, D.; Horton, R. Biochar age and crop rotation impacts on soil quality. Soil Sci. Soc. Am. J. 2017, 81, 1157–1167. [Google Scholar] [CrossRef]
  10. Sharma, N.K.; Singh, R.J.; Mandal, D.; Kumar, A.; Alam, N.M.; Keesstra, S. Increasing farmer’s income and reducing soil erosion using intercropping in rainfed maize-wheat rotation of Himalaya, India. Agric. Ecosyst. Environ. 2017, 247, 43–53. [Google Scholar] [CrossRef]
  11. Zuber, S.M.; Behnke, G.D.; Nafziger, E.D.; Villamil, M.B. Crop rotation and tillage effects on soil physical and chemical properties in Illinois. Agron. J. 2015, 107, 971–978. [Google Scholar] [CrossRef]
  12. Nouwakpo, K.S.; Song, J.; Gonzalez, J.M. Soil structural stability assessment with the fluidized bed, aggregate stability, and rainfall simulation on long-term tillage and crop rotation systems. Soil Tillage Res. 2018, 178, 65–71. [Google Scholar] [CrossRef]
  13. Bayer, C.; Mielniczuck, J.; Amado, T.J.C.; Martin-Neto, L.; Fernandes, S.V. Organic matter storage in a sandy clay loam Acrisol affected by tillage and cropping systems in southern Brazil. Soil Tillage Res. 2000, 54, 101–109. [Google Scholar] [CrossRef]
  14. Diekow, J.; Mielniczuk, J.; Knicker, H.; Bayer, C.; Dick, D.P.; Kögel-Knabner, I. Soil C and N stocks as affected by cropping systems and nitrogen fertilisation in a southern Brazil Acrisol managed under no-tillage for 17 years. Soil Tillage Res. 2004, 81, 87–95. [Google Scholar] [CrossRef]
  15. Bayer, C.; Dieckow, J.; Amado, T.J.C.; Eltz, F.L.F.; Vieira, F.C.B. Cover Crop Effects Increasing Carbon Storage in a Subtropical No-Till Sandy Acrisol. Commun. Soil Sci. Plant Anal. 2009, 40, 9–10. [Google Scholar] [CrossRef]
  16. Schipanski, M.E.; Barbercheck, M.; Douglas, M.R.; Finney, D.M.; Haider, K.; Kaye, J.P.; Kemanian, A.R.; Mortensen, D.A.; Ryan, M.R.; Tooker, J. A framework for evaluating ecosystem services provided by cover crops in agroecosystems. Agric. Syst. 2014, 125, 12–22. [Google Scholar] [CrossRef]
  17. Lehman, R.M.; Osborne, S.L.; Duke, S.E. Diversified no-till crop rotation reduces nitrous oxide emissions, increases soybean yields, and promotes soil carbon. Accrual. Soil Sci. Soc. Am. J. 2017, 81, 76–83. [Google Scholar] [CrossRef]
  18. Brennan, E.B.; Acosta-Martinez, V. Cover cropping frequency is the main driver of soil microbial changes during six years of organic vegetable production. Soil Biol. Biochem. 2017, 109, 188–204. [Google Scholar] [CrossRef]
  19. Comin, J.J.; Ferreira, L.B.; dos Santos, L.H.; Koucher, L.P.; Machado, L.N.; dos Santos, E.; Mafra, A.L.; Kurtz, C.; Souza, M.; Brunetto, G. Carbon and nitrogen contents and aggregation index of soil cultivated with onion for seven years using crop successions and rotations. Soil Tillage Res. 2018, 184, 195–202. [Google Scholar] [CrossRef]
  20. Manns, H.R.; Martin, R.C. Cropping system yield stability inresponse to plant diversity and soil organic carbon in temperate ecosystems. Agroecol. Sustain. Food Syst. 2018, 42, 724–750. [Google Scholar] [CrossRef]
  21. Hawkins, B.A.; Mills, N.J.; Jervis, M.A.; Price, P.W. Is the biological control of insects a natural phenomenon? Oikos 1999, 86, 493–506. [Google Scholar] [CrossRef]
  22. Power, A.G. Ecosystem services and agriculture: Tradeoffs and synergies. Philos. Trans. R. Soc. B 2010, 365, 2959–2971. [Google Scholar] [CrossRef]
  23. Mendes, R.; Garbeva, P.; Raaijmakers, J.M. The rhizosphere microbiome: Significance of plant beneficial, plant pathogenic, and human pathogenic microorganisms. FEMS Microbiol. Rev. 2013, 37, 634–663. [Google Scholar] [CrossRef]
  24. Al-Dalain, S.A. Efect of intercropping of zea maize with potato (Solanum tuberosum, L) on potato growth and on the productivity and land equivalent ratio of potato and zea maize. Agric. J. 2009, 4, 164–170. [Google Scholar]
  25. Zhang, W.P.; Liu, G.C.; Sun, J.H.; Fornara, D.; Zhang, L.Z.; Zhang, F.F.; Li, L. Temporal dynamics of nutrient uptake by neighboring plant species: Evidence from intercropping. Funct. Ecol. 2017, 31, 469–479. [Google Scholar] [CrossRef]
  26. Dong, N.; Tang, M.M.; Zhang, W.P.; Bao, X.G.; Wang, Y.; Christie, P.; Li, L. Temporal Differentiation of Crop Growth as One of the Drivers of Intercropping Yield Advantage. Nat. Sci. Rep. 2018, 8, 3110. [Google Scholar] [CrossRef]
  27. Bevivino, A.; Dalmastri, C. Impact of Agricultural Land Management on Soil Bacterial Community: A Case Study in the Mediterranean Area. In Soil Biological Communities and Ecosystem Resilience; Chapter: Sustainability in Plant and Crop Protection Series; Lukac, M., Grenni, P., Gamboni, M., Eds.; Springer Nature: Cham, Switzerland, 2017; Volume 1, pp. 77–95. [Google Scholar]
  28. Peralta, A.L.; Sun, Y.; Marshall, D.; McDaniel, J.; Lennon, T. Crop rotational diversity increases disease suppressive capacity of soil microbiomes. Ecosphere 2018, 9, e02235. [Google Scholar] [CrossRef]
  29. McDaniel, M.D.; Grandy, A.S. Soil microbial biomass and function are altered by 12 years of crop rotation. Soil 2016, 2, 583–599. [Google Scholar] [CrossRef] [Green Version]
  30. Hooper, D.U.; Bignell, D.E.; Brown, V.K.; Brussaard, L.; Mark, J.D.; Wall, D.H.; Wardle, D.A.; Coleman, D.C.; Giller, K.E.; Lavelle, P. Interactions between aboveground and belowground biodiversity in terrestrial ecosystems: Patterns, mechanisms, and feedbacks. Bioscience 2000, 50, 1049–1061. [Google Scholar] [CrossRef]
  31. Kent, D.; Triplett, E.W. Microbial communities and their interactions in soil and rhizosphere ecosystems. Annu. Rev. Microbiol. 2002, 5, 211–236. [Google Scholar] [CrossRef]
  32. Zak, D.R.; Holmes, H.E.; White, D.C.; Peacock, A.D.; Tilman, D. Plant diversity, soil microbial communities, and ecosystem function: Are there any links? Ecology 2002, 84, 2042–2050. [Google Scholar] [CrossRef]
  33. Hooper, D.U.; Chapin, F.; Ewel, J.; Hector, A.; Inchausti, P.; Lavorel, S.; Lawton, J.; Lodge, D.; Loreau, M.; Naeem, S. Effects of biodiversity on ecosystem functioning: A consensus of current knowledge. Ecol. Monogr. 2005, 75, 3–35. [Google Scholar] [CrossRef]
  34. Berg, G.; Smalla, K. Plant species and soil type cooperatively shape the structure and function of microbial communities in the rhizosphere. FEMS Microbiol. Ecol. 2009, 68, 1–13. [Google Scholar] [CrossRef] [PubMed] [Green Version]
  35. Finney, D.M.; Murrell, E.G.; White, C.M.; Baraibar, B.; Barbercheck, M.E.; Bradley, B.A.; Cornelisse, S.; Hunter, M.C.; Kaye, J.P.; Mortensen, D.A. Ecosystem Services and Disservices Are Bundled in Simple and Diverse Cover Cropping Systems. Agric. Environ. Lett. 2017, 3, 170033. [Google Scholar] [CrossRef]
  36. Wood, S.A.; Karp, D.S.; DeClerck, F.; Kremen, C.; Naeem, S.; Palm, C.A. Functional traits in agriculture: Agrobiodiversity and ecosystem services. Trends Ecol. Evol. 2015, 30, 531–539. [Google Scholar] [CrossRef] [PubMed]
  37. Wood, S.A.; Bradford, M.A. Leveraging a New Understanding of How Belowground Food Webs Stabilize Soil Organic Matter to Promote Ecological Intensification of Agriculture. In Soil Carbon Storage—Modulators, Mechanisms and Modeling, 1st ed.; Brajesh Singh, Ed.; Elsevier: London, UK, 2018; Volume 4, Chapter 4; pp. 117–136. [Google Scholar]
  38. Yu, P.; Hochholdinger, F. The Role of Host Genetic Signatures on Root–Microbe Interactions in the Rhizosphere and Endosphere. Front. Plant Sci. 2018, 9, 1896. [Google Scholar] [CrossRef]
  39. Smalla, K.; Wieland, G.; Buchner, A.; Zock, A.; Parzy, J.; Kaiser, S.; Roskot, N.; Heuer, H.; Berg, G. Bulk and rhizosphere soil bacterial communities studied by denaturing gradient gel electrophoresis: Plant-dependent enrichment and seasonal shifts revealed. Appl. Environ. Microbiol. 2001, 67, 4742–4751. [Google Scholar] [CrossRef]
  40. Li, X.Z.; Rui, J.P.; Xiong, J.B.; Li, J.B.; He, Z.L.; Zhou, J.Z.; Yannarell, A.C.; Mackie, R.I. Functional Potential of Soil Microbial Communities in the Maize Rhizosphere. PLoS ONE 2014, 9, e112609. [Google Scholar] [CrossRef]
  41. Wen, X.; Wang, M.; Ti, J.; Wu, Y.; Chen, F. Bacterial community composition in the rhizosphere of maize cultivars widely grown in different decades. Biol. Fertil. Soils 2017, 53, 221–229. [Google Scholar] [CrossRef]
  42. Pfeifer, J.A.; Ley, R.E. Exploring the maize rhizosphere microbiome in the field: A glimpse into a highly complex system. Commun. Integr. Biol. 2013, 6, e25177. [Google Scholar] [CrossRef] [Green Version]
  43. Walters, A.W.; Jin, Z.; Youngblut, N.; Wallace, J.G.; Sutter, J.; Zhang, W.; González-Peña, A.; Peiffer, J.; Koren, O.; Shi, Q. Large-scale replicated field study of maize rhizosphere identifies heritable microbes. Proc. Natl. Acad. Sci. USA 2018, 115, 7368–7373. [Google Scholar] [CrossRef] [PubMed] [Green Version]
  44. Soman, S.; Li, M.W.; Kent, M. Long-term fertilizer and crop-rotation treatments differentially affect soil bacterial community structure. Plant Soil 2017, 413, 145–159. [Google Scholar] [CrossRef]
  45. Benitez, M.S.; Osborne, S.; Lehman, R.M. Previous crop and rotation history effects on maize seedling health and associated rhizosphere microbiome. Nat. Sci. Rep. 2017, 7, 15709. [Google Scholar] [CrossRef] [PubMed]
  46. Tedesco, M.J.; Gianello, C.; Bissani, C.A.; Bohnen, H.; Volkweiss, S.J. Análises de Solo, Plantas e Outros Materiais; UFRGS: Porto Alegre, Brazil, 1995. (In Portuguese) [Google Scholar]
  47. Caporaso, J.G.; Lauber, C.L.; Walters, W.A.; Berg-Lyons, D.; Lozupone, C.A.; Turnbaugh, P.J.; Fierer, N.; Knight, R. Global patterns of 16S rRNA diversity at a depth of millions of sequences per sample. Proc. Natl. Acad. Sci. USA 2010, 108, 4516–4522. [Google Scholar] [CrossRef] [PubMed] [Green Version]
  48. Fagen, J.R.; Giongo, A.; Brown, C.T.; Davis-Richardson, A.; Gano, K.A.; Triplett, E.W. Characterization of the relative abundance of the citrus pathogen Ca. Liberibacter asiaticus in the microbiome of its insect 525vecor, Diaphorina citri, using high throughput 16S rRNA sequencing. Open Microbiol. J. 2012, 6, 29–33. [Google Scholar] [CrossRef] [PubMed]
  49. Dias, R.; Xavier, M.G.; Rossi, F.D.; Neves, M.V.; Lange, T.A.P.; Giongo, A.; De Rose, C.A.F.; Triplett, E.W. MPI-blastn and NCBI-TaxCollector: Improving metagenomic analysis with high performance classification and wide taxonomic attachment. J. Bioinform. Comput. Biol. 2014, 12, 14500131–145001317. [Google Scholar] [CrossRef] [PubMed]
  50. Davis-Richardson, A.G.; Ardissone, A.N.; Dias, R.; Simell, V.; Leonard, M.T.; Kemppainen, K.M.; Drew, J.C.; Schatz, D.; Atkinson, M.A.; Kolaczkowski, B.; et al. Bacteroides dorei dominates gut microbiome prior to autoimmunity in Finnish children at high risk for type 1 diabetes. Front. Microbiol. 2014, 5, 678. [Google Scholar] [CrossRef] [PubMed]
  51. Cole, J.R.; Wang, Q.; Fish, J.A.; Chai, B.; McGarrell, D.M.; Sun, Y.; Brown, C.T.; Porras-Alfaro, A.; Kuske, C.R.; Tiedje, J.M. Ribosomal Database Project: Data and tools for high throughput rRNA analysis. Nucl. Acids Res. 2014, 42, D63342. [Google Scholar] [CrossRef] [PubMed]
  52. Oksanen, J.; Blanchet, F.G.; Friendly, M.; Kindt, R.; Legendre, P.; McGlinn, D.; Minchin, P.R.; O’Hara, R.B.; Simpson, G.L.; Solymos, P. Vegan: Community Ecology Package. R Package Version 2.5-4. Available online: https://CRAN.R-project.org/package=vegan (accessed on 10 January 2019).
  53. Neto, R.C.A.; Miranda, N.O.; Duda, G.P.; Góes, G.B.; Lima, A.S. Crescimento e produtividade do sorgo forrageiro BR 601 sob adubação verde. Rev. Bras. Eng. Agrícola Ambient. 2010, 14, 124–130. [Google Scholar] [CrossRef]
  54. Von Uexküll, H.R.; Mutert, E. Global Extent, Development and Economic Impact of Acid Soils. Plant Soil 1995, 171, 1–15. [Google Scholar] [CrossRef]
  55. Venter, Z.S.; Jacobs, K.; Hawkins, H.J. The impact of crop rotation on soil microbial diversity: A meta-analysis. Pedobiologia 2016, 59, 215–223. [Google Scholar] [CrossRef]
  56. Smith, R.G.; Mortensen, D.A.; Ryan, M.R. A new hypothesis for the functional role of diversity in mediating resource pools and weed–crop competition in agroecosystems. Weed Res. 2009, 50, 37–48. [Google Scholar] [CrossRef]
  57. Costa, R.; Götz, M.; Mrotzek, N.; Lottmann, J.; Berg, G.; Smalla, K. Effects of site and plants species on rhizosphere community structure as revealed by molecular analysis of microbial guilds. FEMS Microbiol. Ecol. 2006, 56, 236–249. [Google Scholar] [CrossRef] [PubMed]
  58. Badri, D.V.; Vivanco, J.M. Regulation and function of root exudates. Plant Cell Environ. 2009, 32, 666–681. [Google Scholar] [CrossRef]
  59. Geisseler, D.; Scow, K.M. Does long-term use of mineral fertilizers affect the soil microbial biomass? Better Crop. Plant Food 2014, 98, 13–15. [Google Scholar]
  60. Coyne, M.S.; Mikkelsen, R. Soil microorganisms contribute to plant nutrition and root health. Better Crop. Plant Food 2015, 99, 18–20. [Google Scholar]
  61. Zhalnina, K.; Louie, K.B.; Hao, Z.; Mansoori, N.; Rocha, U.N.; Shi, S.; Cho, H.; Karaoz, U.; Loqué, D.; Bowen, B.P. Dynamic root exudate chemistry and microbial substrate preferences drive patterns in rhizosphere microbial community assembly. Nat. Microbiol. 2018, 3, 470–480. [Google Scholar] [CrossRef] [Green Version]
  62. Lynch, J.M.; Whipps, J.M. Substrate flow in the rhizosphere. Plant Soil 1990, 129, 1–10. [Google Scholar] [CrossRef]
  63. Bulgarelli, D.; Schlaeppi, K.; Spaepen, S.; van Themaat, E.V.L.; Schulze-Lefert, P. Structure and functions of the bacterial microbiota of plants. Annu. Rev. Plant Biol. 2013, 64, 807–838. [Google Scholar] [CrossRef]
  64. Corral-Lugo, A.; Daddaoua, A.; Ortega, A.; Espinosa-Urgel, M.; Krell, T. Rosmarinic acid is a homoserine lactone mimic produced by plants that activates a bacterial quorum-sensing regulator. Sci. Signal. 2016, 9. [Google Scholar] [CrossRef]
  65. Jurgens, G.; Lindström, K.; Saano, A. Novel group within the kingdom Crenarchaeota from boreal forest soil. Appl. Environ. Microbiol. 1997, 63, 803–805. [Google Scholar] [PubMed]
  66. Ochsenreiter, T.; Selezi, D.; Quaiser, A.; Bonch-Osmolovskaya, L.; Schleper, C. Diversity and abundance of Crenarchaeota in terrestrial habitats studied by 16S RNA surveys and real time PCR. Environ. Microbiol. 2003, 5, 787–797. [Google Scholar] [CrossRef] [PubMed]
  67. Lehtovirta, L.E.; Prosser, J.E.; Nicol, G.W. Soil pH regulates the abundance and diversity of Group 1.1c Crenarchaeota. FEMS Microbiol. Ecol. 2009, 70, 367–376. [Google Scholar] [CrossRef] [PubMed] [Green Version]
  68. Kemnitz, D.; Kolb, S.; Conrad, R. High abundance of Crenarchaeota in a temperate acidic forest soil. FEMS Microbiol. Ecol. 2007, 60, 442–448. [Google Scholar] [CrossRef] [PubMed] [Green Version]
  69. De La Torre, J.R.; Walker, C.B.; Imgalls, A.E.; Könneke, M.; Stahl, D.A. Cultivation of a thermophilic ammonia oxidizing archaeon synthesizing crenarchaeol. Environ. Microbiol. 2007, 10, 810–818. [Google Scholar] [CrossRef] [PubMed]
  70. Lehtovirta-Morley, L.E.; Stoecker, K.; Vilcinskas, A.; Prosser, J.I.; Nicol, G.W. Cultivation of an obligate acidophilic ammonia oxidizer from a nitrifying acid soil. Proc. Natl. Acad. Sci. USA 2011, 108, 15892–15897. [Google Scholar] [CrossRef] [PubMed] [Green Version]
  71. Tourna, M.; Srieglmeier, M.; Spang, A.; Könneke, M.; Schintlmeister, A.; Urich, T.; Engel, M.; Schloter, M.; Wagner, M.; Richter, A.; et al. Nitrososphaera viennensis, an ammonia oxidizing archaeon from soil. Proc. Natl. Acad. Sci. USA 2011, 20, 8420–8425. [Google Scholar] [CrossRef] [PubMed]
  72. Kim, B.K.; Jung, M.Y.; Yu, D.S.; Park, S.J.; Oh, T.K.; Rhee, S.K.; Kim, J.F. Genome sequence of an ammonia-oxidizing soil archaeon, “Candidatus Nitrosoarchaeum koreensis” MY1. J. Bacteriol. 2011, 193, 5539–5540. [Google Scholar] [CrossRef] [PubMed]
  73. Blainey, P.C.; Mosier, A.C.; Potanina, A.; Francis, C.A.; Quake, S.R. Genome of a low-salinity ammonia-oxidizing archaeon determined by single-cell and metagenomic analysis. PLoS ONE 2011, 6, 1–12. [Google Scholar] [CrossRef]
  74. Zhalnina, K.; Dias, R.; Leonard, M.T.; Dörr de Quadros, P.; Camargo, F.A.O.; Drew, J.C.; Farmerie, W.G.; Daroub, S.H.; Triplett, E.W. Genome sequence of Candidatus Nitrososphaera evergladensis from group I.1b isolated from Everglades soil reveals novel genomic features of the ammonia-oxidizing archaea. PLoS ONE 2014, 9, e101648. [Google Scholar] [CrossRef] [PubMed]
  75. Pedrós-Alió, C. The rare bacterial biosphere. Ann. Rev. Mar. Sci. 2012, 4, 449–466. [Google Scholar] [CrossRef] [PubMed]
  76. Teira, E.; Lekunberri, I.; Gasol, J.M.; Nieto-Cid, M.; Alvarez-Salgado, X.A.; Figueiras, P.G. Dynamics of the hydrocarbon-degrading Cycloclasticus bacteria during mesocosm-simulated oil spills. Environ. Microbiol. 2007, 9, 2551–2562. [Google Scholar] [CrossRef] [PubMed]
  77. Santoyo, G.; Moreno-Hagelsieb, G.; Orozco-Mosqueda, M.D.C.; Glick, B.R. Plant growth-promoting bacterial endophytes. Microbiol. Res. 2016, 183, 92–99. [Google Scholar] [CrossRef] [PubMed]
  78. Da, K.; Nowak, J.; Flinn, B. Potato cytosine methylation and gene expression changes induced by a beneficial bacterial endophyte, Burkholderia phytofirmans PsJN. Plant Physiol. Biochem. 2012, 50, 24–34. [Google Scholar] [CrossRef] [PubMed]
  79. Talbi, C.; Delgado, M.J.; Girard, L.; Ramírez-Trujillo, A.; Caballero-Mellado, J.; Bedmar, E.J. Burkholderia phymatum strains capable of nodulating Phaseolus vulgaris are present in Moroccan soils. Appl. Environ. Microbiol. 2010, 76, 4587–4591. [Google Scholar] [CrossRef] [PubMed]
  80. Bournaud, C.; de Faria, S.M.; dos Santos, J.M.F.; Tisseyre, P.; Silva, M.; Chaintreuil, C.; Farmerie, W.G.; Daroub, S.H.; Triplett, E.W. Burkholderia species are the most common and preferred nodulating symbionts of the Piptadenia group (Tribe mimoseae). PLoS ONE 2013, 8, e6347. [Google Scholar] [CrossRef] [PubMed]
  81. Garbeva, P.; van Veen, J.A.; van Elsas, J.D. Predominant Bacillus spp. In agricultural soil under different management regimes detected via PCR-DGGE. Microb. Ecol. 2003, 45, 302–316. [Google Scholar] [CrossRef] [PubMed]
  82. Köberl, M.; Müller, H.; Ramadan, E.M.; Berg, G. Desert farming benefits from microbial potential in arid soils and promotes diversity and plant health. PLoS ONE 2011, 6, e24452. [Google Scholar] [CrossRef]
  83. De Quadros, P.D.; Zhalnina, K.; Davis-Richardson, A.; Fagen, J.R.; Drew, J.; Bayer, C.; Camargo, F.A.; Triplett, E.W. The effect of tillage system and crop rotation on soil microbial diversity and composition in a subtropical Acrisol. Diversity 2012, 4, 375–395. [Google Scholar] [CrossRef]
Figure 1. Experimental design and sampling points. Four core soil samples were taken from each one of the three replicates of the nine treatments (n = 108). Each plot has 10 m × 2 m.
Soilsystems 03 00050 g001
Figure 2. Relative abundance of archaeal 16S rRNA partial gene from agricultural no-tilled soil under eight different cropping systems, showing that Crenarchaeota was higher were lablab was planted, and that Thaumarcheota was higher in the bare soil.
Soilsystems 03 00050 g002
Figure 3. Phylum-level analysis of 16s RNA-based relative abundances.
Soilsystems 03 00050 g003
Figure 4. Family-level analysis of 16 s RNA-based relative abundances.
Soilsystems 03 00050 g004
Figure 5. (A) and (B) Dissimilarity indices among the soil microbial community composition across eight different management regimes. Panel A represents a Principal Coordinates Analysis (based on a Bray-Curtis dissimilarity matrix) across eight different planting treatments, with ellipses corresponding to 95% confidence intervals surrounding treatment-specific centroids. In this Principal Coordinates Analysis, average distances to the global centroid were largest for the Pangola pasture treatments (average Euclidean distances to centroid = 0.293) and lowest for fallow treatments (average Euclidean distances to centroid = 0.208). Boxplots in Panel B represent summaries of treatment-specific distances to an overall mean centroid calculated for all data points.
Soilsystems 03 00050 g005
Figure 6. Redundancy analysis (RDA) evaluating the microbial community composition in eight different management treatments in relation to 10 soil parameters. The first RDA axis explained 44.9% of the variation in the community composition and was strongly associated with the bare soil and Pangola pasture treatments as well as soil P; the second RDA axis explained an additional 20.9% of the variation in the community composition, and was strongly associated with two Lablab treatments, as well as all other soil parameters. Ellipses correspond to 95% confidence limits surrounding the centroids for each planting treatment.
Soilsystems 03 00050 g006
Table 1. Soil chemical features under different no-till cropping systems. Values presented are a mean from n = 4 values. Lower-case letters denote significant differences in a given soil variable according to the Tukey’s test (p ≤ 0.01).
CategoryOats + Vetch/MaizeOats +Vetch/Maize + CowpeaOat/MaizeFallow/FallowLablab/LablabMaize/Pigeon pea BeanMaize/Lablab BeanPangola/PangolaFallow/Maize
pH4.7 ± 0.4 c4.7 ± 0.2 de4.9 ± 0.3 cd5.0 ± 0.2bc5.1 ± 0.2 bc4.6 ± 0.2 e5.3 ± 0.1 ab5.5 ± 0.2 a5.0 ± 0.4 bc
P (mg dm−3)22.9 ± 2.6 b21.4 ± 2.7 b34.7 ± 8.2 a8.4 ± 1.0 cd14.2 ± 1.6 c32.7 ± 3.4 a29.1 ± 5.2 a7.3 ± 1.1 d31.9 ± 7.8 a
K (mg dm−3)232 ± 19 bc224 ± 24.4 bc220 ± 24.3 bc130 ± 5.6 e253 ± 41.6 b219 ± 16.9 c317 ± 37.6 a174 ± 14.1 c 221 ± 31.1 bc
Al (cmolc dm−3)0.75 ± 0.7 a0.97 ± 0.4 a0.77 ± 0.5 a0.70 ± 0.3 a0.15 ± 0.1 b0.75 ± 0.3 a0.07 ± 0.05 b0.10 ± 0.01b0.60 ± 0.5 ab
Ca (cmolc dm−3)2.37 ± 1.1 bc2.05 ± 0.4 c2.02 ± 0.5 c1.93 ± 0.4 c4.37 ± 0.3 a3.09 ± 0.3 b3.95 ± 0.3 a2.95 ± 0.3 b1.95 ± 0.49 c
Mg (cmolc dm−3)1.35 ± 0.7 cd1.02 ± 0.3 d1.02 ± 0.3 d1.35 ± 0.3 cd2.00 ± 0.2 ab1.55 ± 0.3 c2.08 ± 0.2 a1.65 ± 0.2 bc1.27 ± 0.32 cd
TOC (%)1.56 ± 0.06 c1.77 ± 0.09 d1.42 ± 0.06 f1.20 ± 0.08 g2.24 ± 0.12 b2.59 ± 0.2 a2.03 ± 0.2 c1.86 ± 0.1 de1.34 ± 0.1 fg
Total N (%)0.13 ± 0.01 e0.15 ± 0.01 d0.12 ± 0.01 f0.09 ± 0.01 g0.18 ± 0.01 b0.20 ± 0.01 a0.17 ± 0.01 c0.15 ± 0.01 e0.11 ± 0.01 f
Mineral N (mg kg−1)8.16 ± 2.1 c6.31 ± 0.8 cd4.27 ± 1.2d1.83 ± 0.9 e12.12 ± 1.5 b16.73 ± 3.4 a15.26 ± 4.2 a4.01 ± 1.4 de4.29 ± 0.7 de
Table 2. Summary of total classified and unclassified DNA reads, and reads at each taxonomic level, detected across nine cropping systems.
Cropping SystemsAveraged Reads per TreatmentNº of Replicates per TreatmentSum of Reads / All Replicates
Bare Soil53,53112642,375
Fallow/ Maize56,99212683,900
Oats/ Maize47,80012525,804
Oats + Vetch / Maize54,35112652,212
Oats + Vetch / Maize + Cowpea65,13512781,620
Pigeon pea + Maize49,13712589,645
Lablab + Maize 65,17612782,115
Pangola pasture79,63512875,985
Lablab/ Lablab68,38012820,562
TOTAL (SUM)540,138 N = 108 5,378,124
Table 3. Fisher alpha diversity and richness for nine planting treatments. All unclassified sequences were clustered and considered in the diversity analysis. Means that differ significantly indicated by different lower-case letters (Tukey’s test, 95% confidence, p ≤ 0.01).
Cropping SystemsFisher Alpha DiversityRichness
PhylumFamilyGenusSpeciesPhylumFamilyGenusSpecies
Bare Soil2.5 ± 0.78 a 15.4 ± 0.14 a43.0 ± 0.15 b152.7 ± 0.15 b24 ± 1.8103 ± 12 b305 ± 52 b898 ± 166 b
Fallow/Maize2.4 ± 0.80 ab 14.5 ± 0.14 ab42.5 ± 0.22 c144.3 ± 0.22 c23 ± 1.9105 ± 18 b312 ± 53 b878 ± 170 b
Oats/Maize2.3 ± 0.91 b 13.2 ± 0.22 c39.7 ± 0.30 c125.0 ± 0.30 d22± 1.5106 ± 15 b280 ± 48 c736 ± 175 bc
Oats + Vetch/ Maize2.3 ± 0.82 bc 13.5 ± 0.19 c37.4 ± 0.22 d118.3 ± 0.22 e22 ± 298 ± 11 bc270 ± 37 c716 ± 107 bc
Oats + Vetch/ Maize + Cowpea2.2 ± 0.91 c 13.3 ± 0.20 c41.0 ± 0.17 c136.4 ± 0.17 c21 ± 2.497 ± 20 bc301 ± 73 b833 ± 238 b
Pigeon pea + Maize1.9 ± 0.86 d 11.4 ± 0.58 d32.2 ± 0.24 d99.6 ± 0.29 e19 ± 2.282 ± 10 c234 ± 49 d611 ± 141 c
Lablab + Maize2.3 ± 0.97 bc 14.9 ± 0.12 a51.4 ± 0.33 a182.0 ± 0.24 a22 ± 2.2129 ± 11 a342 ± 46 a967 ± 256 a
Pangola pasture2.2 ± 0.78 c 14.4 ± 0.25 b43.4 ± 0.33 b137.0 ± 0.33 bc22 ± 1.7119 ± 16 ab303 ± 60 b838 ± 227 b
Lablab/Lablab 2.2 ± 0.88 c 14.4 ± 0.10 b46.0 ± 0.19 b159.3 ± 0.19 b22 ± 1.7122 ± 10 a366 ± 37 a1066 ± 185 a
Table 4. Differences in the relative abundances of the eight most abundant genera (where mean relative abundance for a given genus in a given treatment was >0.5%). Lower-case letters denote statistically significant differences (where ANOVA p ≤ 0.001).
Cropping SystemsClostridiumBacillusSphingomonasCandidatus KoribacterBurkholderiaRhodoplanesBradyrhizobiumGeobacter
Bare Soil0.103 d0.769 a1.898 a0.795 a0.625 b0.476 cd0.542 a0.113 b
Fallow/Maize3.823 bc1.479 a1.322 b1.086 a0.820 b0.559 bcd0.584 a0.636 a
Oats/Maize6.200 a1.229 a1.093 bcd0.921 a0.644 b0.494 cd0.459 a0.739 a
Oats + Vetch/Maize3.862 b1.074 a1.023 cd1.219 a0.544 b0.578 bcd0.551 a0.929 a
Oats + Vetch/Maize + Cowpea3.820 bc1.349 a0.846 cd1.238 a0.506 b0.645 abc0.625 a0.892 a
Pigeon pea + Maize2.996 bcd0.068 a0.613 d1.069 a0.886 b0.816 a0.652 a0.489 ab
Lablab + Maize1.700 cd1.597 a1.713 ab0.698 a0.878 b0.701 ab0.464 a0.152 b
Pangola pasture5.642 a1.256 a0.506 d0.631 a0.423 b0.454 d0.515 a0.513 ab
Lablab/Lablab 0.860 cd1.374 a0.754 cd0.911 a1.920 a0.657 abc0.668 a0.128 b
ANOVA p-value<0.0010.333<0.0010.061<0.001<0.0010.182<0.001

