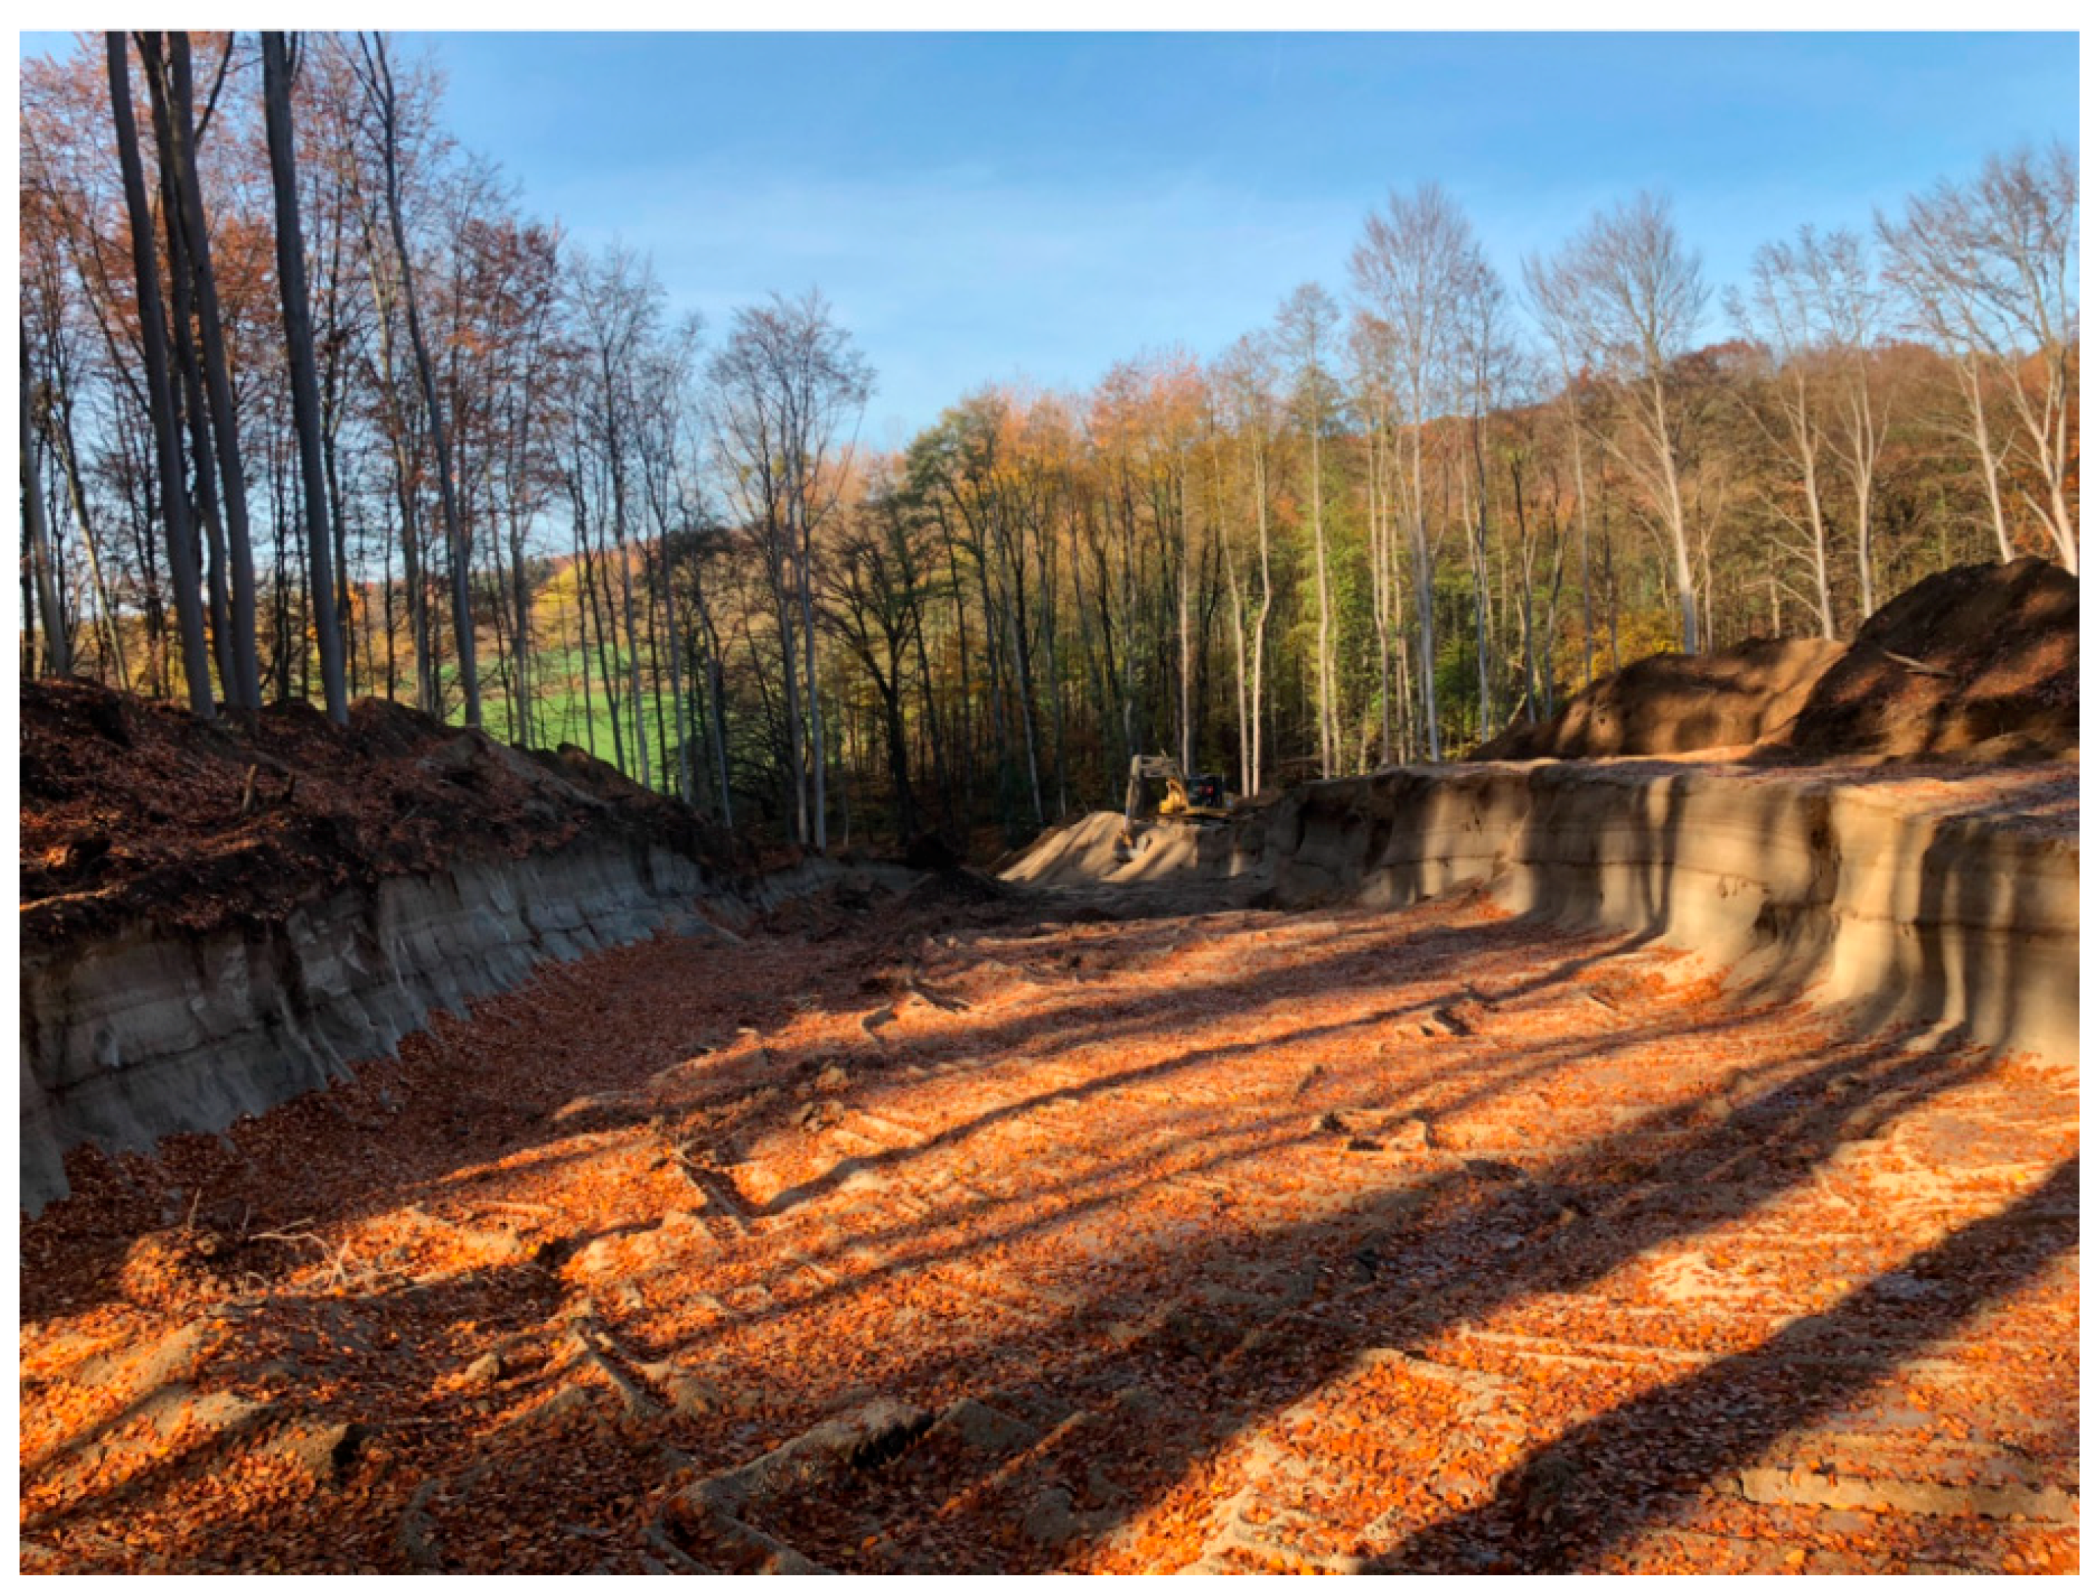
Figure 1.
Pumice excavation in forest district Bendorf, 2018 (Photo: Alexander Klein). Material for later backfilling is visible on both sides.
Figure 1.
Pumice excavation in forest district Bendorf, 2018 (Photo: Alexander Klein). Material for later backfilling is visible on both sides.
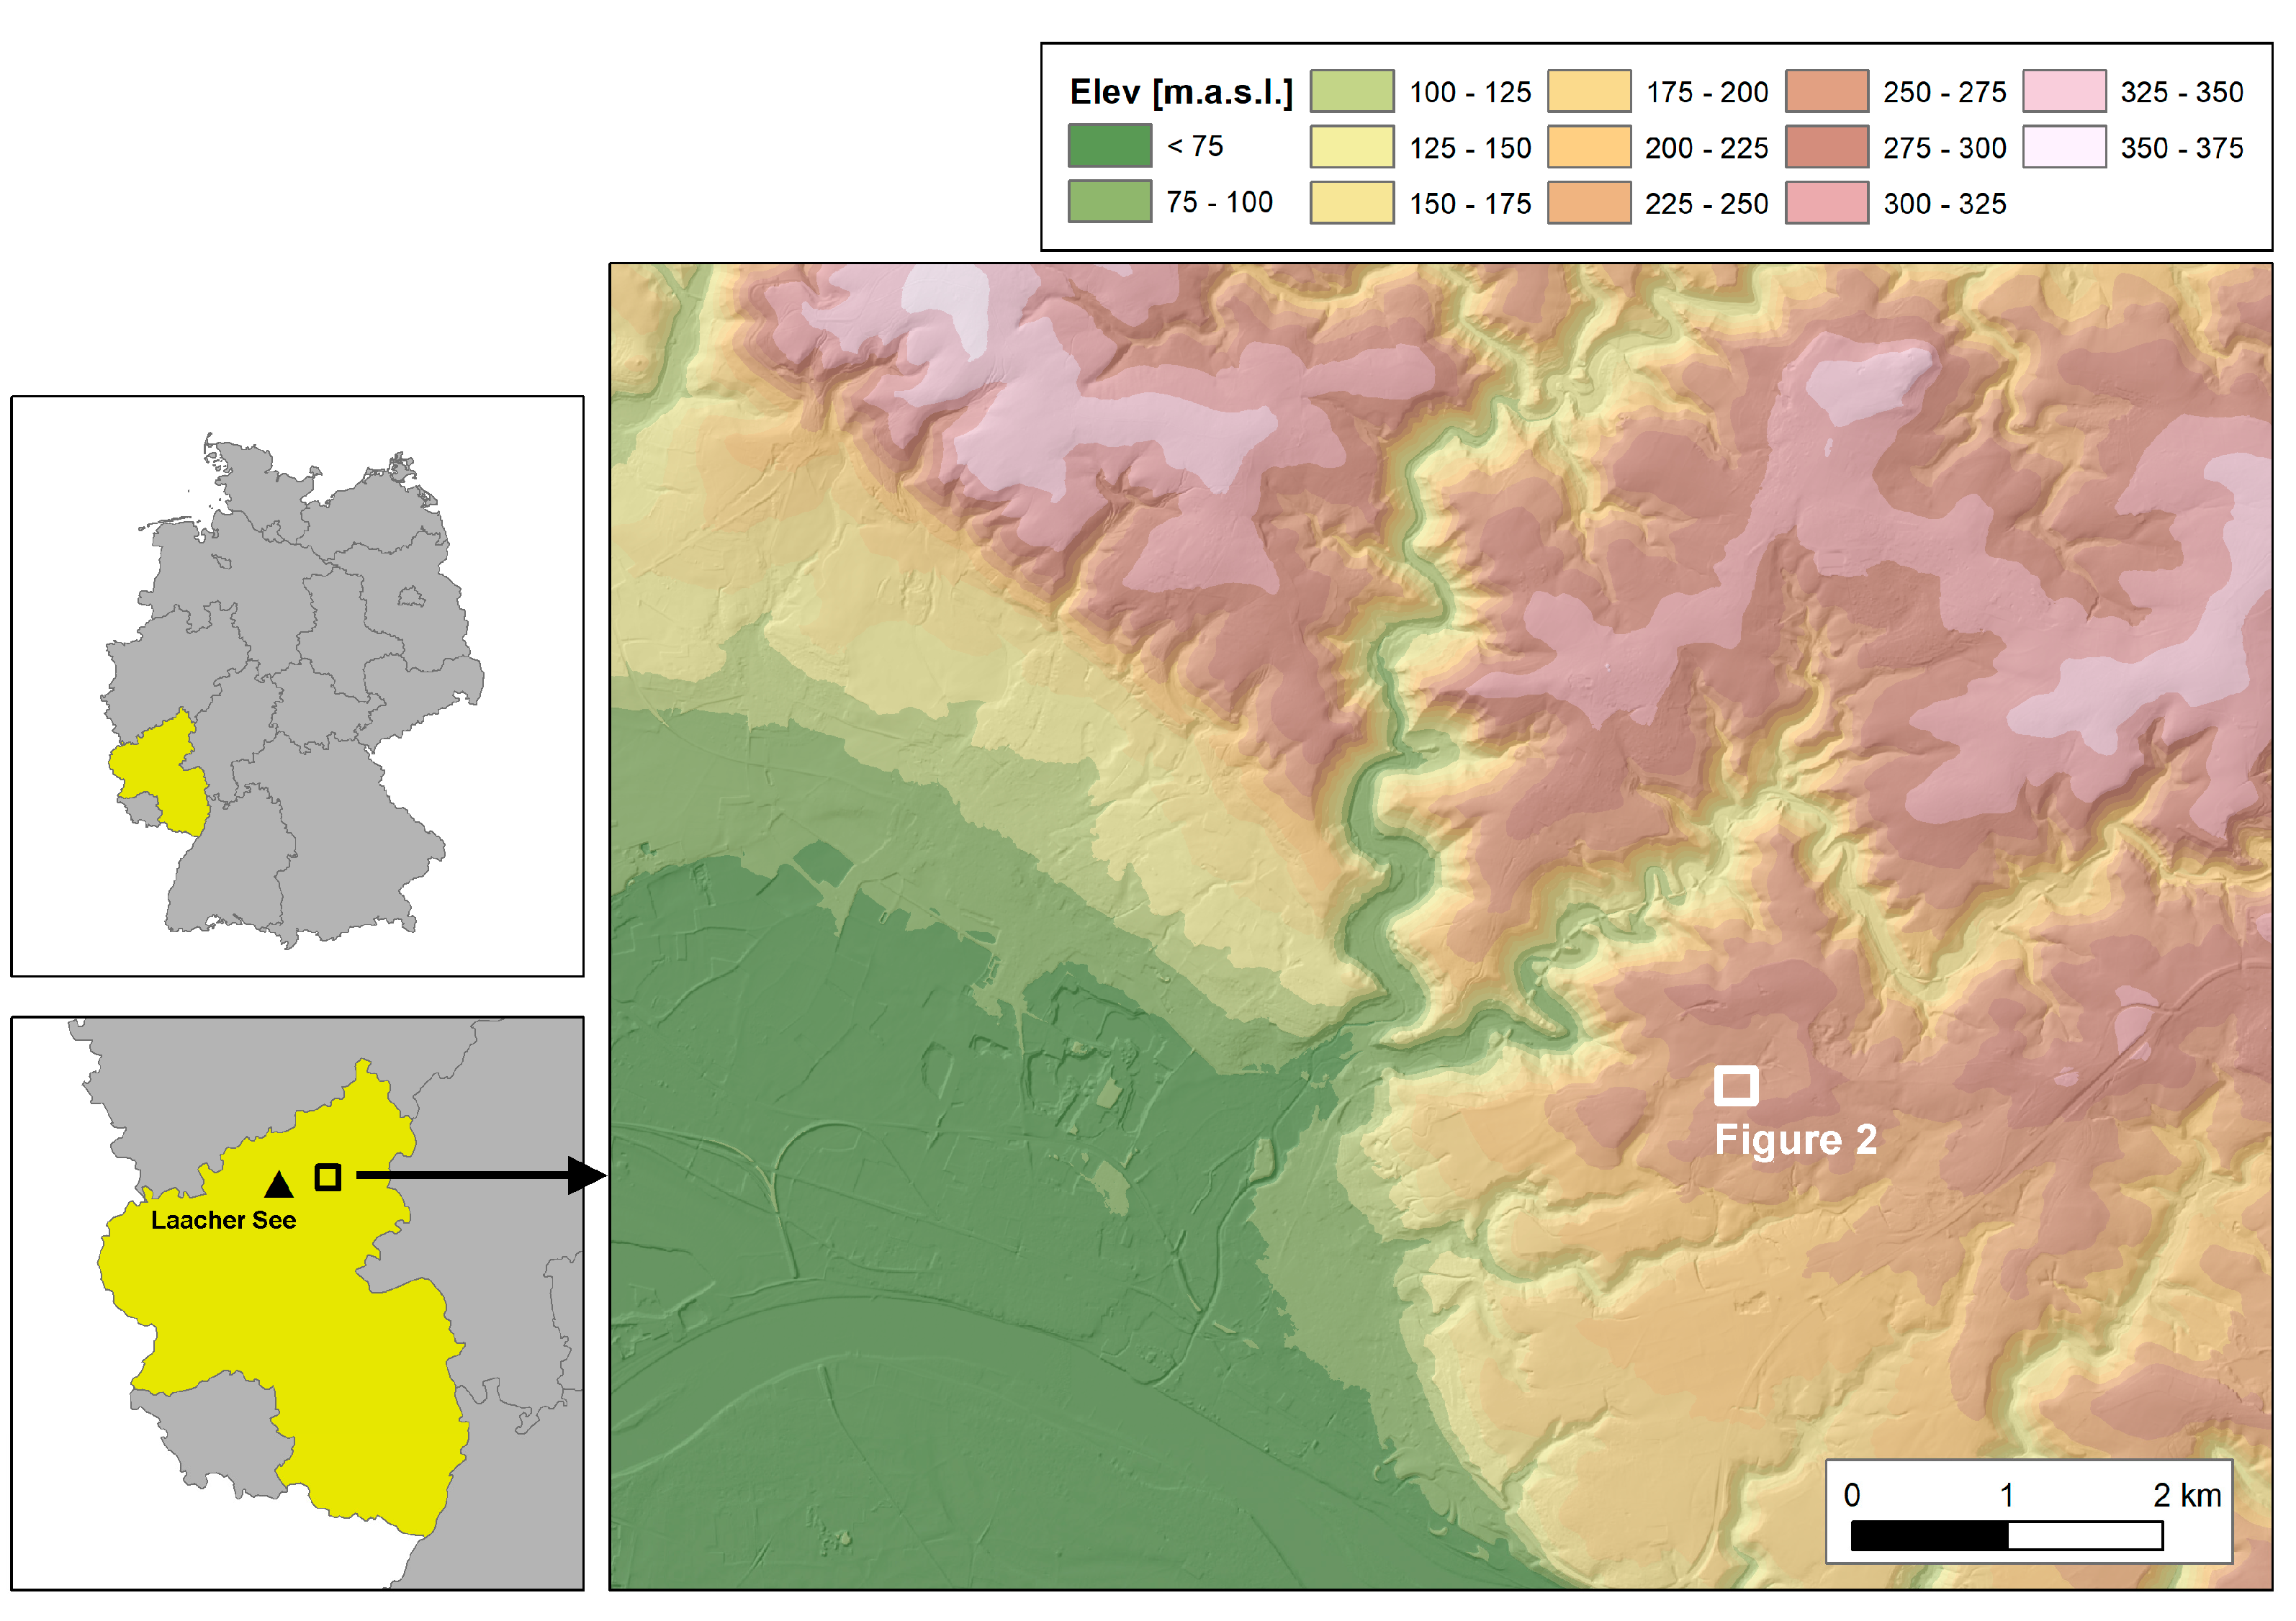
Figure 2.
Location of the study area, after [
21].
Figure 2.
Location of the study area, after [
21].
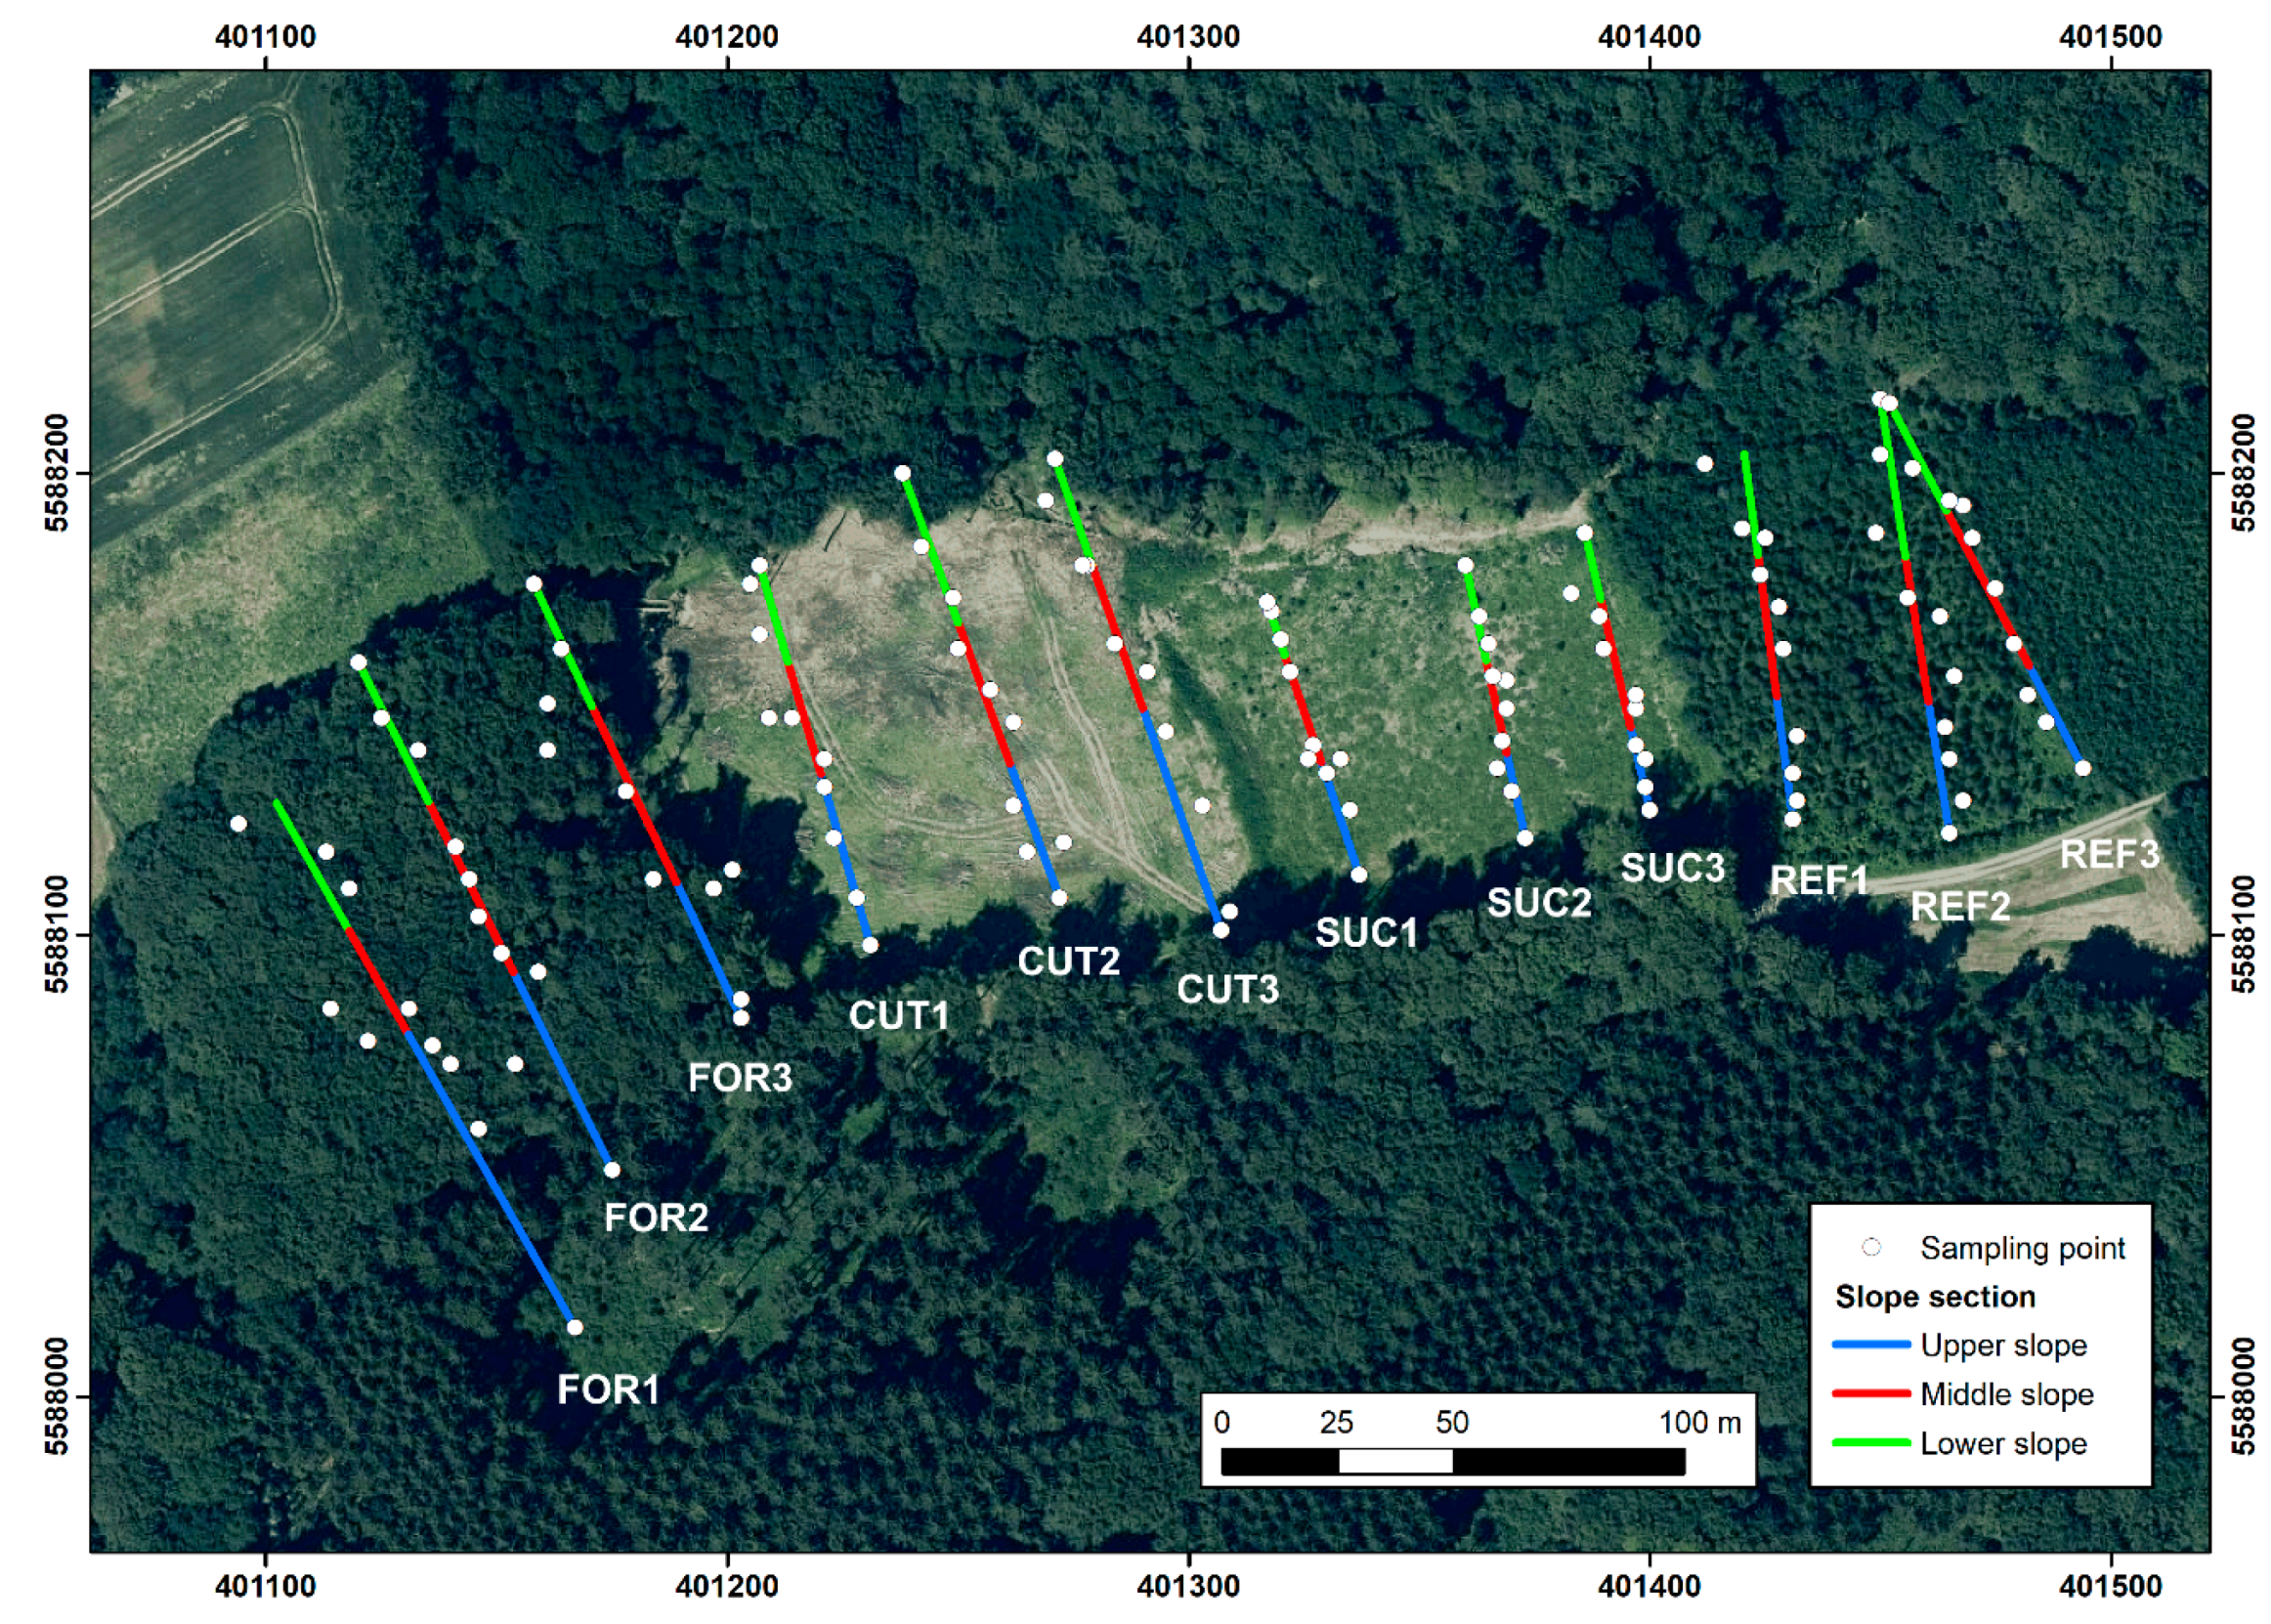
Figure 3.
Study area, sampling point and catenae indicated. Catena labels refer to sub-areas: (FOR)ested, (CUT)-down, (SUC)cession, (REF)orested. Aerial photography by the Land Surveying State Office of Rhineland-Palatinate.
Figure 3.
Study area, sampling point and catenae indicated. Catena labels refer to sub-areas: (FOR)ested, (CUT)-down, (SUC)cession, (REF)orested. Aerial photography by the Land Surveying State Office of Rhineland-Palatinate.
Figure 4.
Climograph for weather station Grenzau, raw data collected by the Dienstleistungszentrum Ländlicher Raum Rhineland-Palatinate.
Figure 4.
Climograph for weather station Grenzau, raw data collected by the Dienstleistungszentrum Ländlicher Raum Rhineland-Palatinate.
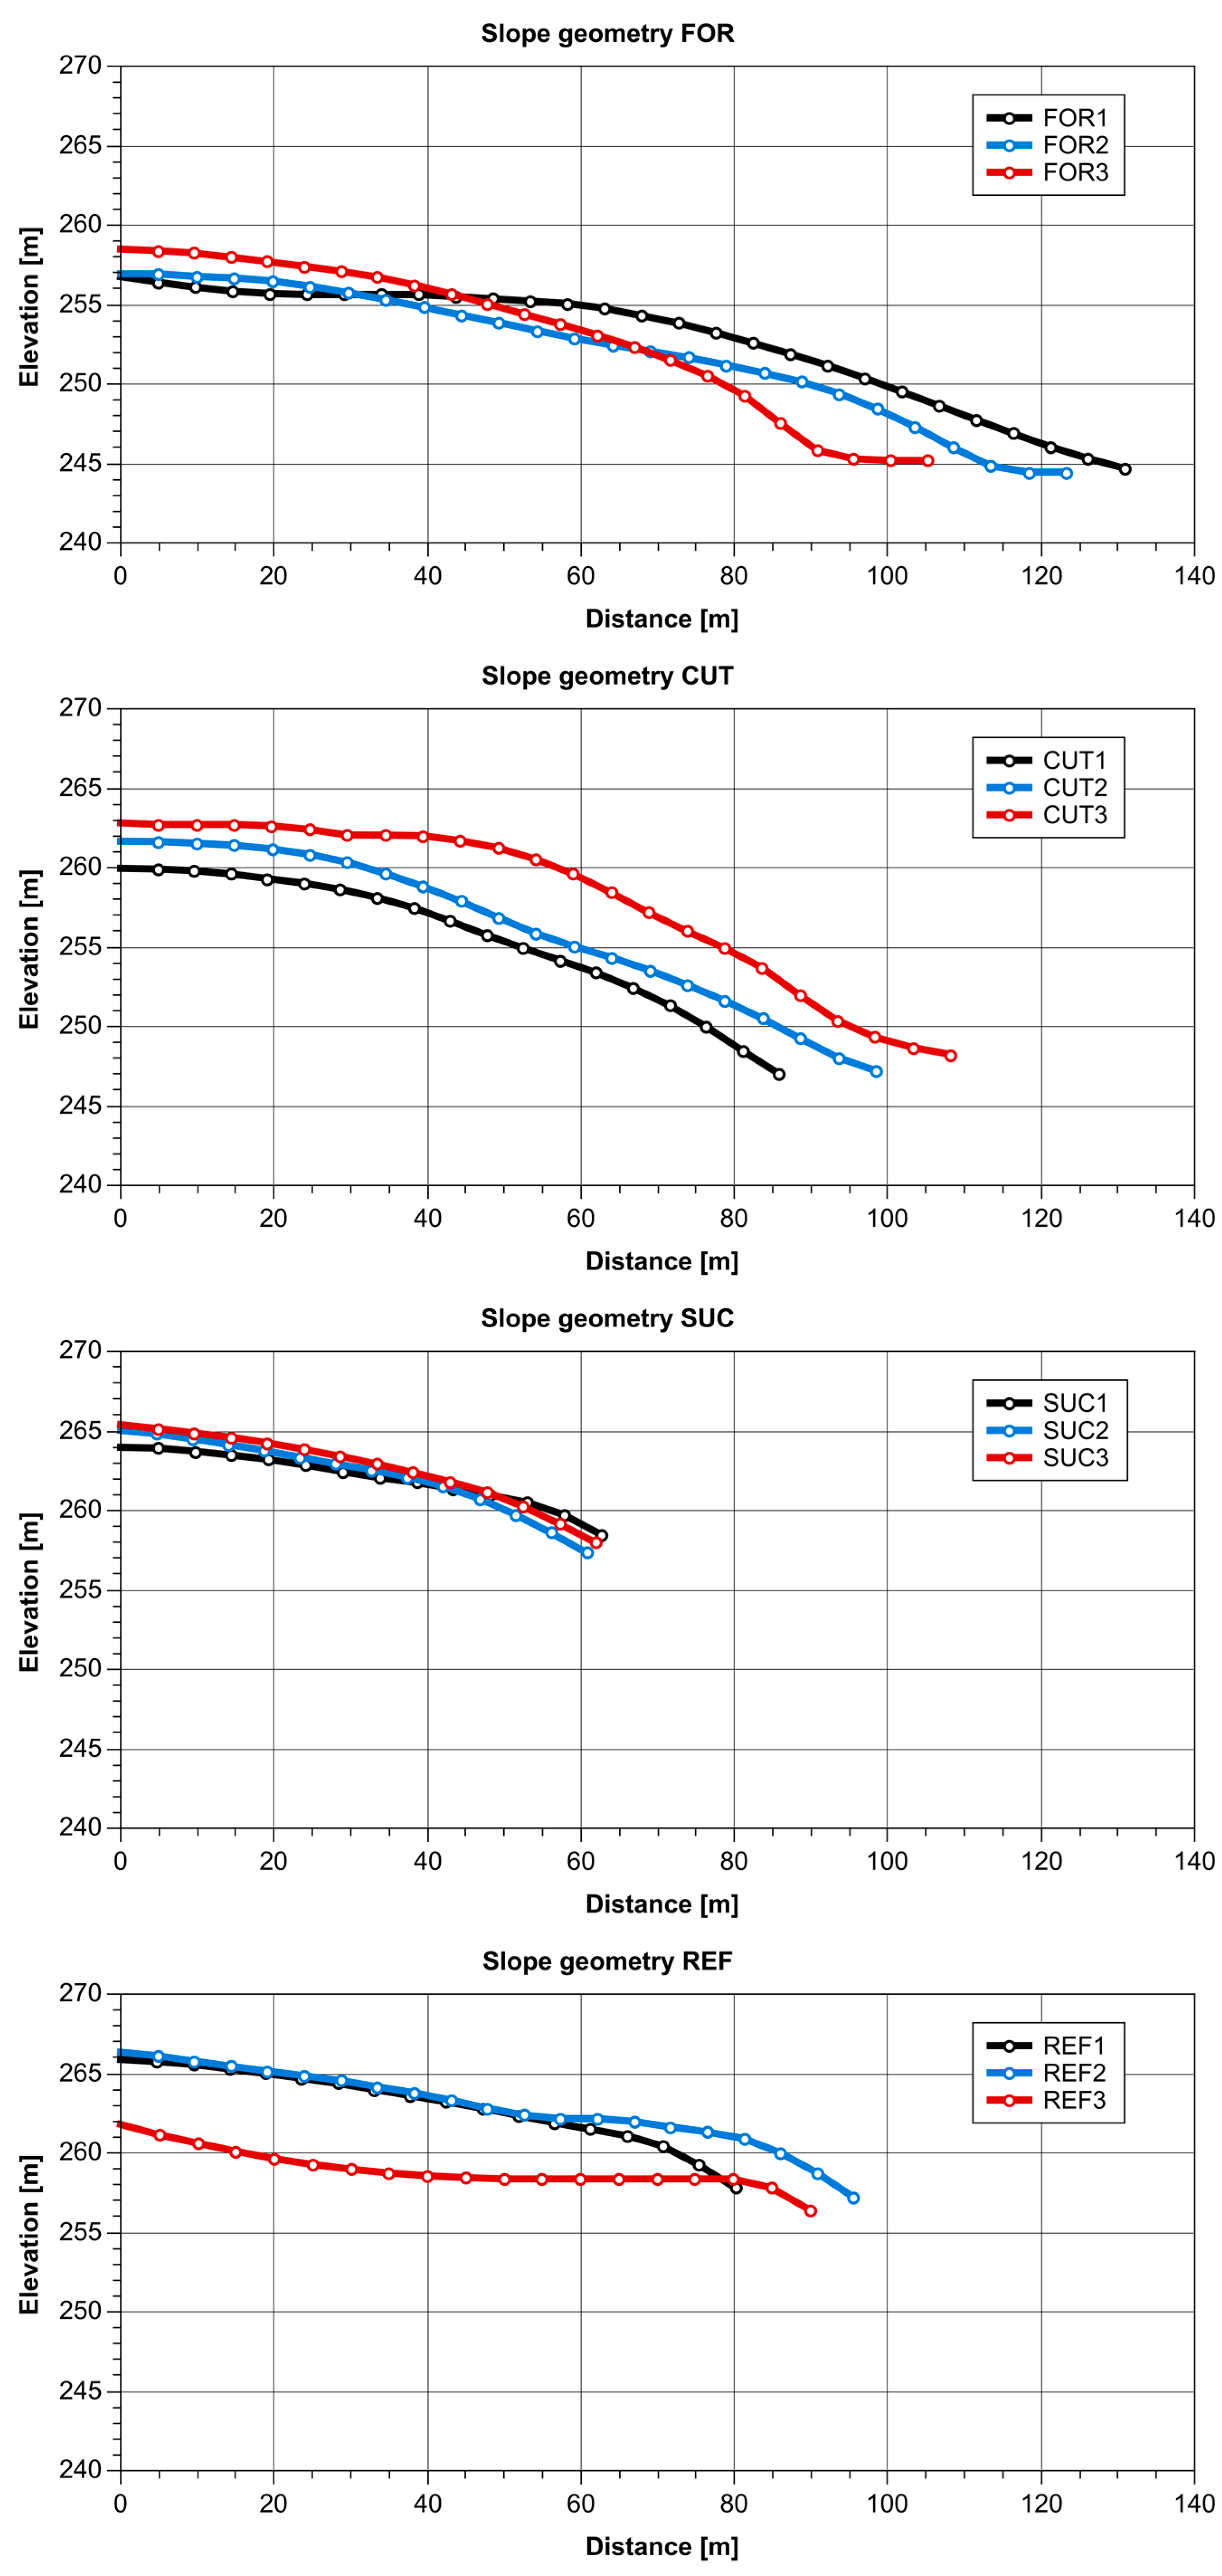
Figure 5.
Slope geometry for every catena; (FOR)est, (CUT)-down, (SUC)cession, (REF)forested.
Figure 5.
Slope geometry for every catena; (FOR)est, (CUT)-down, (SUC)cession, (REF)forested.
Figure 6.
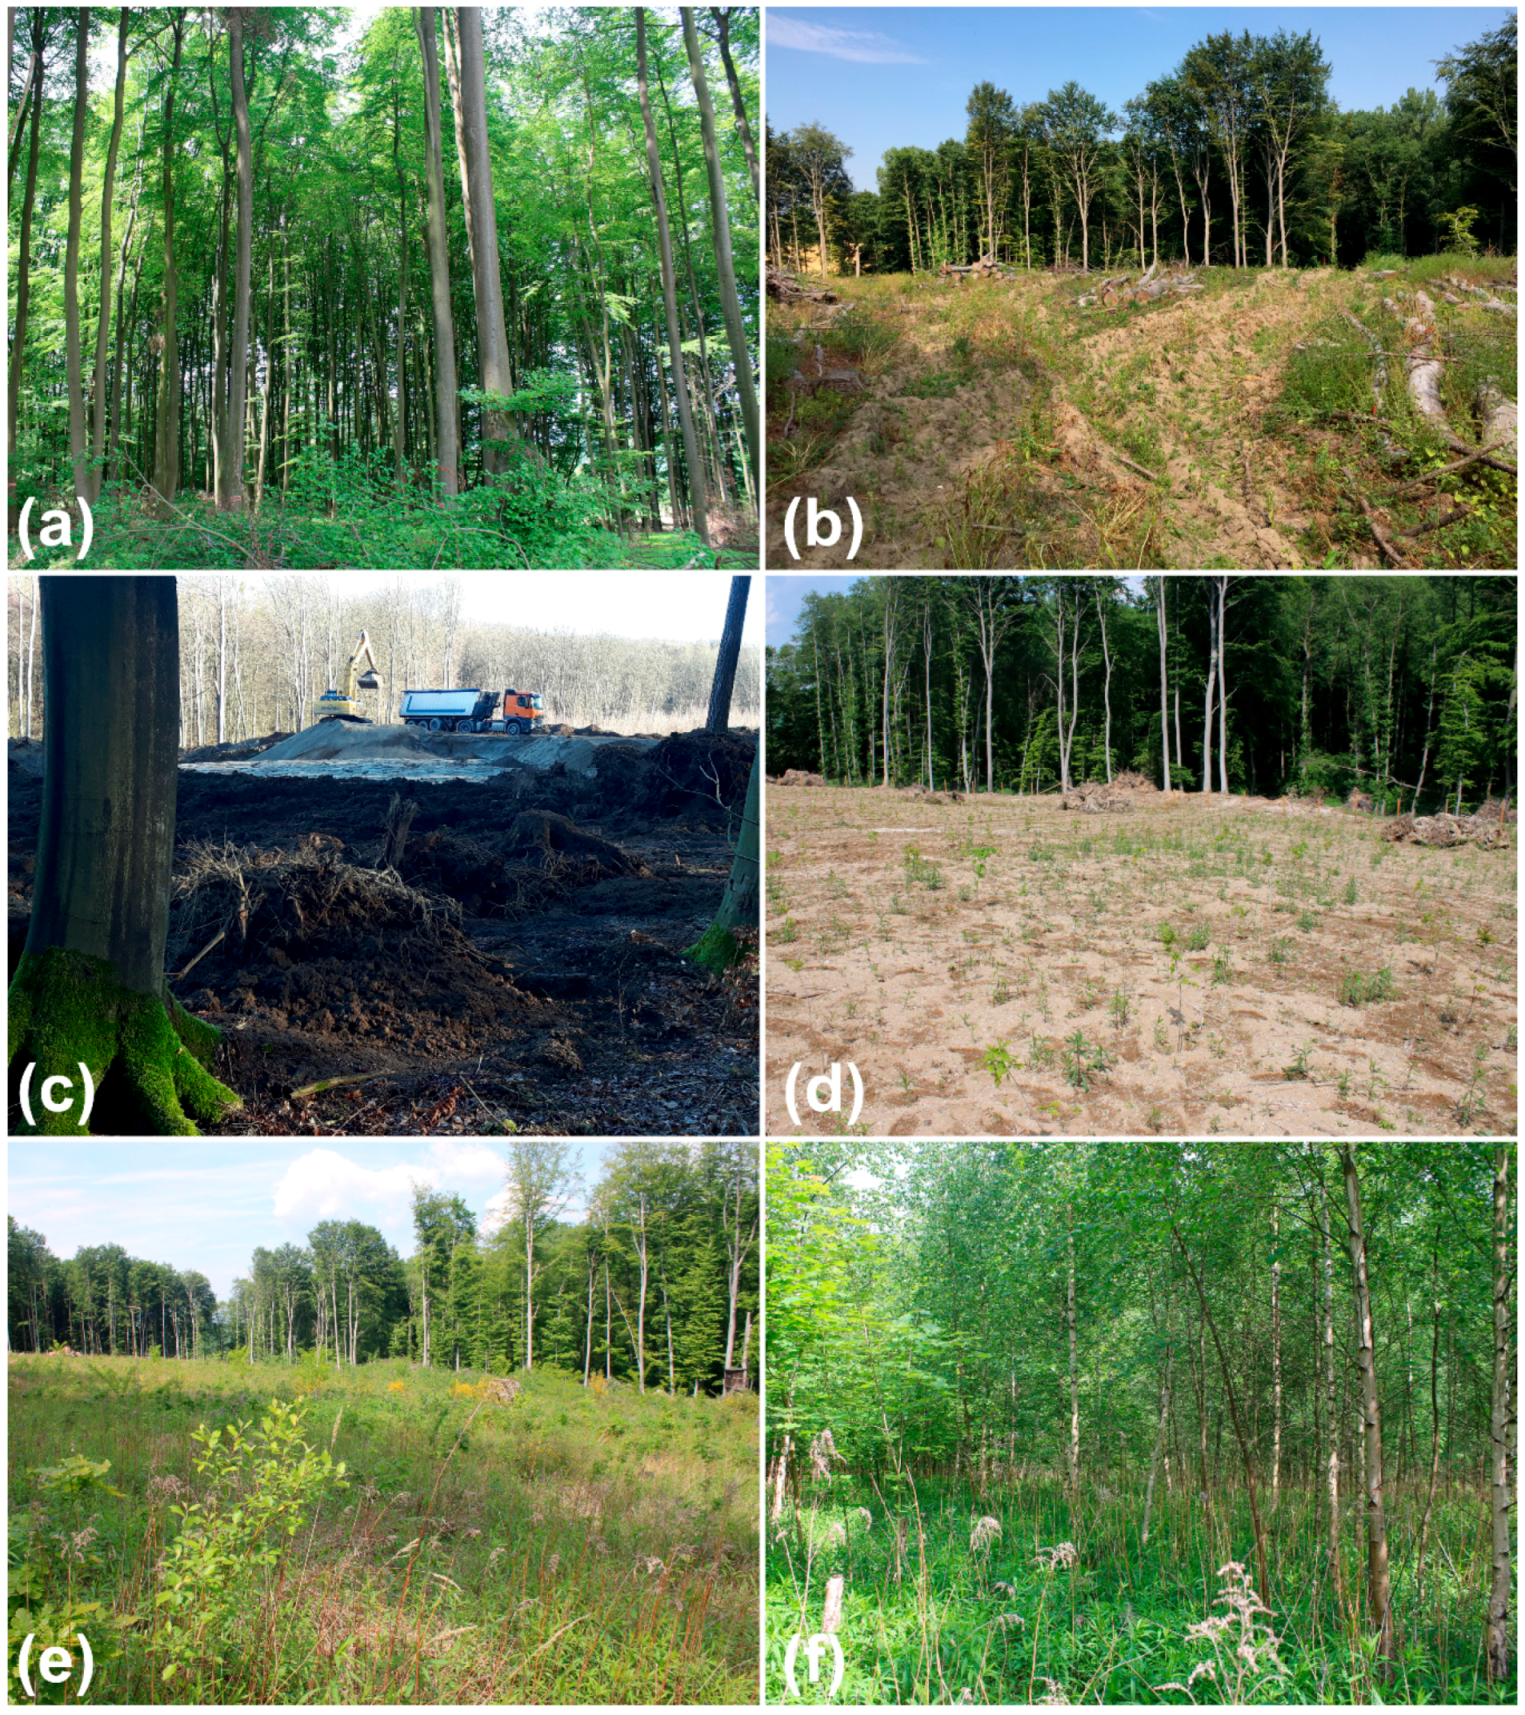
Land management stages: (a) undisturbed forest, (b) clear-cut, (c) excavation works, (d) bare surface, (e) succession, (f) reestablished forest. (Photo 4 (b): Alexander Klein). (b–d) show excavation works on the same sub-area.
Figure 6.
Land management stages: (a) undisturbed forest, (b) clear-cut, (c) excavation works, (d) bare surface, (e) succession, (f) reestablished forest. (Photo 4 (b): Alexander Klein). (b–d) show excavation works on the same sub-area.
Figure 7.
Depth-related sand content for every catena: (FOR)est, (CUT)-down, (SUC)cession, (REF)forested; solid line: upper slope, dashed line: middle slope, dotted line: lower slope.
Figure 7.
Depth-related sand content for every catena: (FOR)est, (CUT)-down, (SUC)cession, (REF)forested; solid line: upper slope, dashed line: middle slope, dotted line: lower slope.
Figure 8.
Depth-related clay content for every catena: (FOR)est, (CUT)-down, (SUC)cession, (REF)forested; solid line: upper slope, dashed line: middle slope, dotted line: lower slope.
Figure 8.
Depth-related clay content for every catena: (FOR)est, (CUT)-down, (SUC)cession, (REF)forested; solid line: upper slope, dashed line: middle slope, dotted line: lower slope.
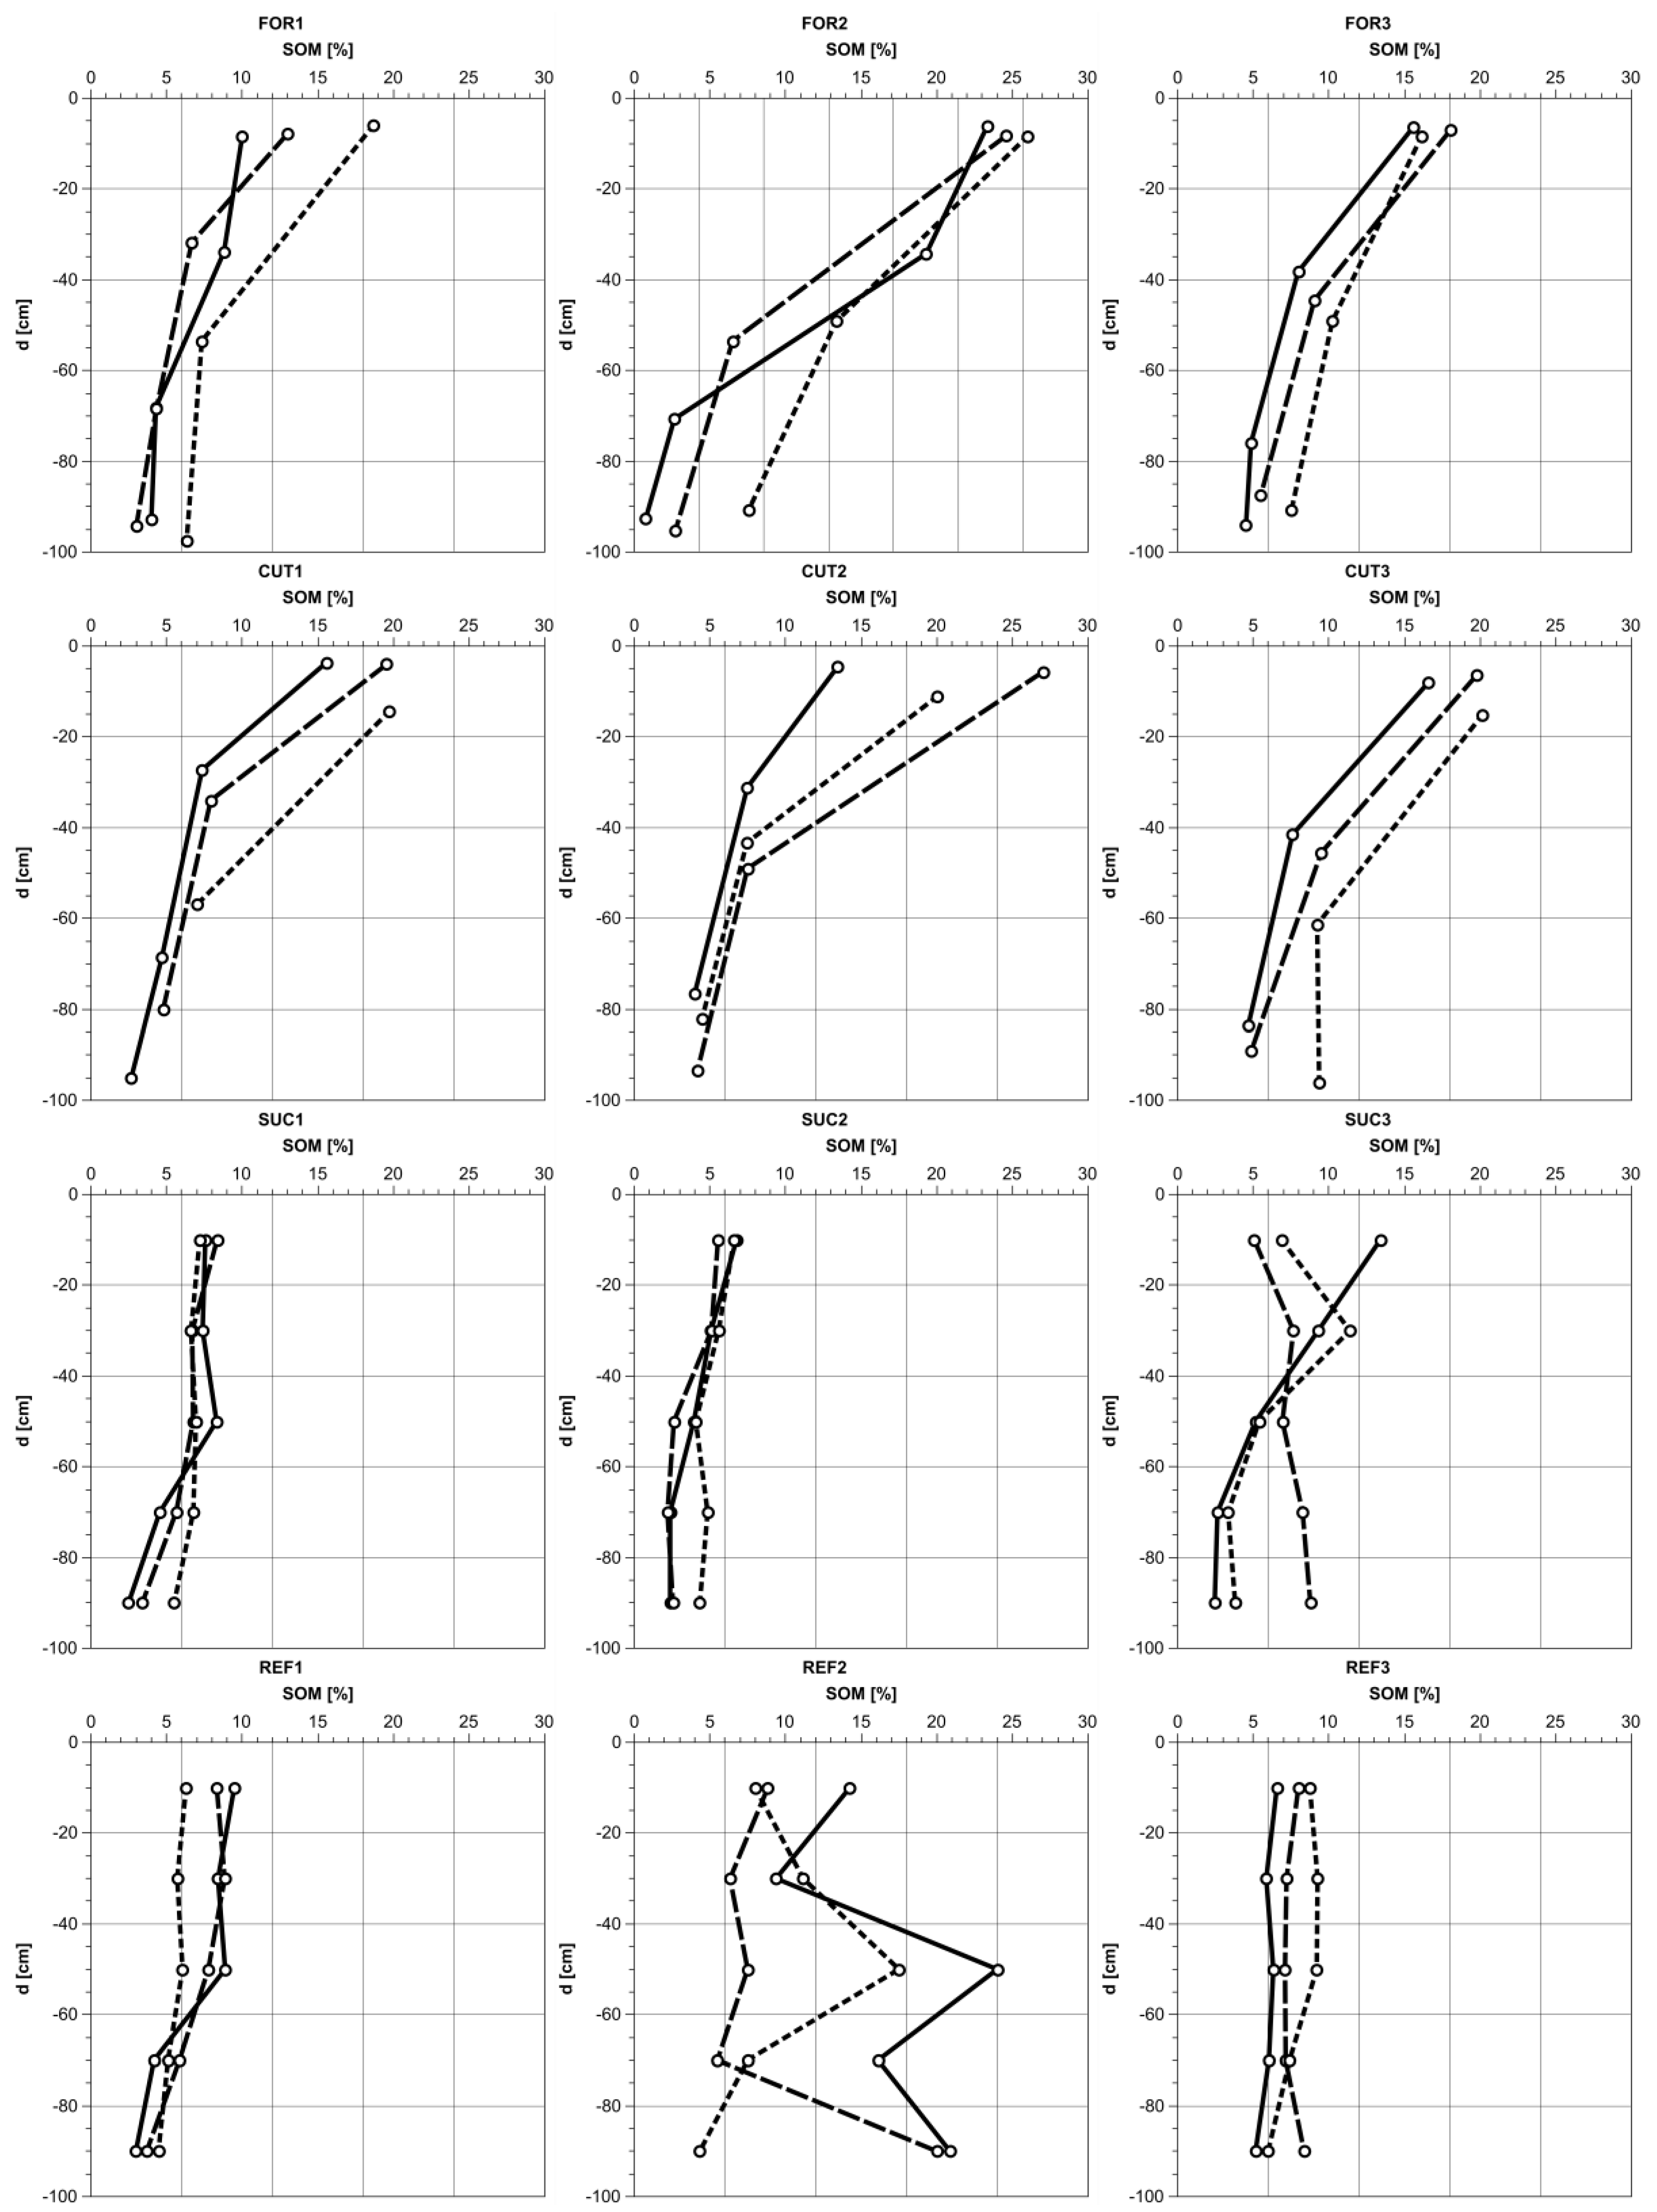
Figure 9.
Depth-related SOM content for every catena: (FOR)est, (CUT)-down, (SUC)cession, (REF)forested; solid line: upper slope, dashed line: middle slope, dotted line: lower slope.
Figure 9.
Depth-related SOM content for every catena: (FOR)est, (CUT)-down, (SUC)cession, (REF)forested; solid line: upper slope, dashed line: middle slope, dotted line: lower slope.
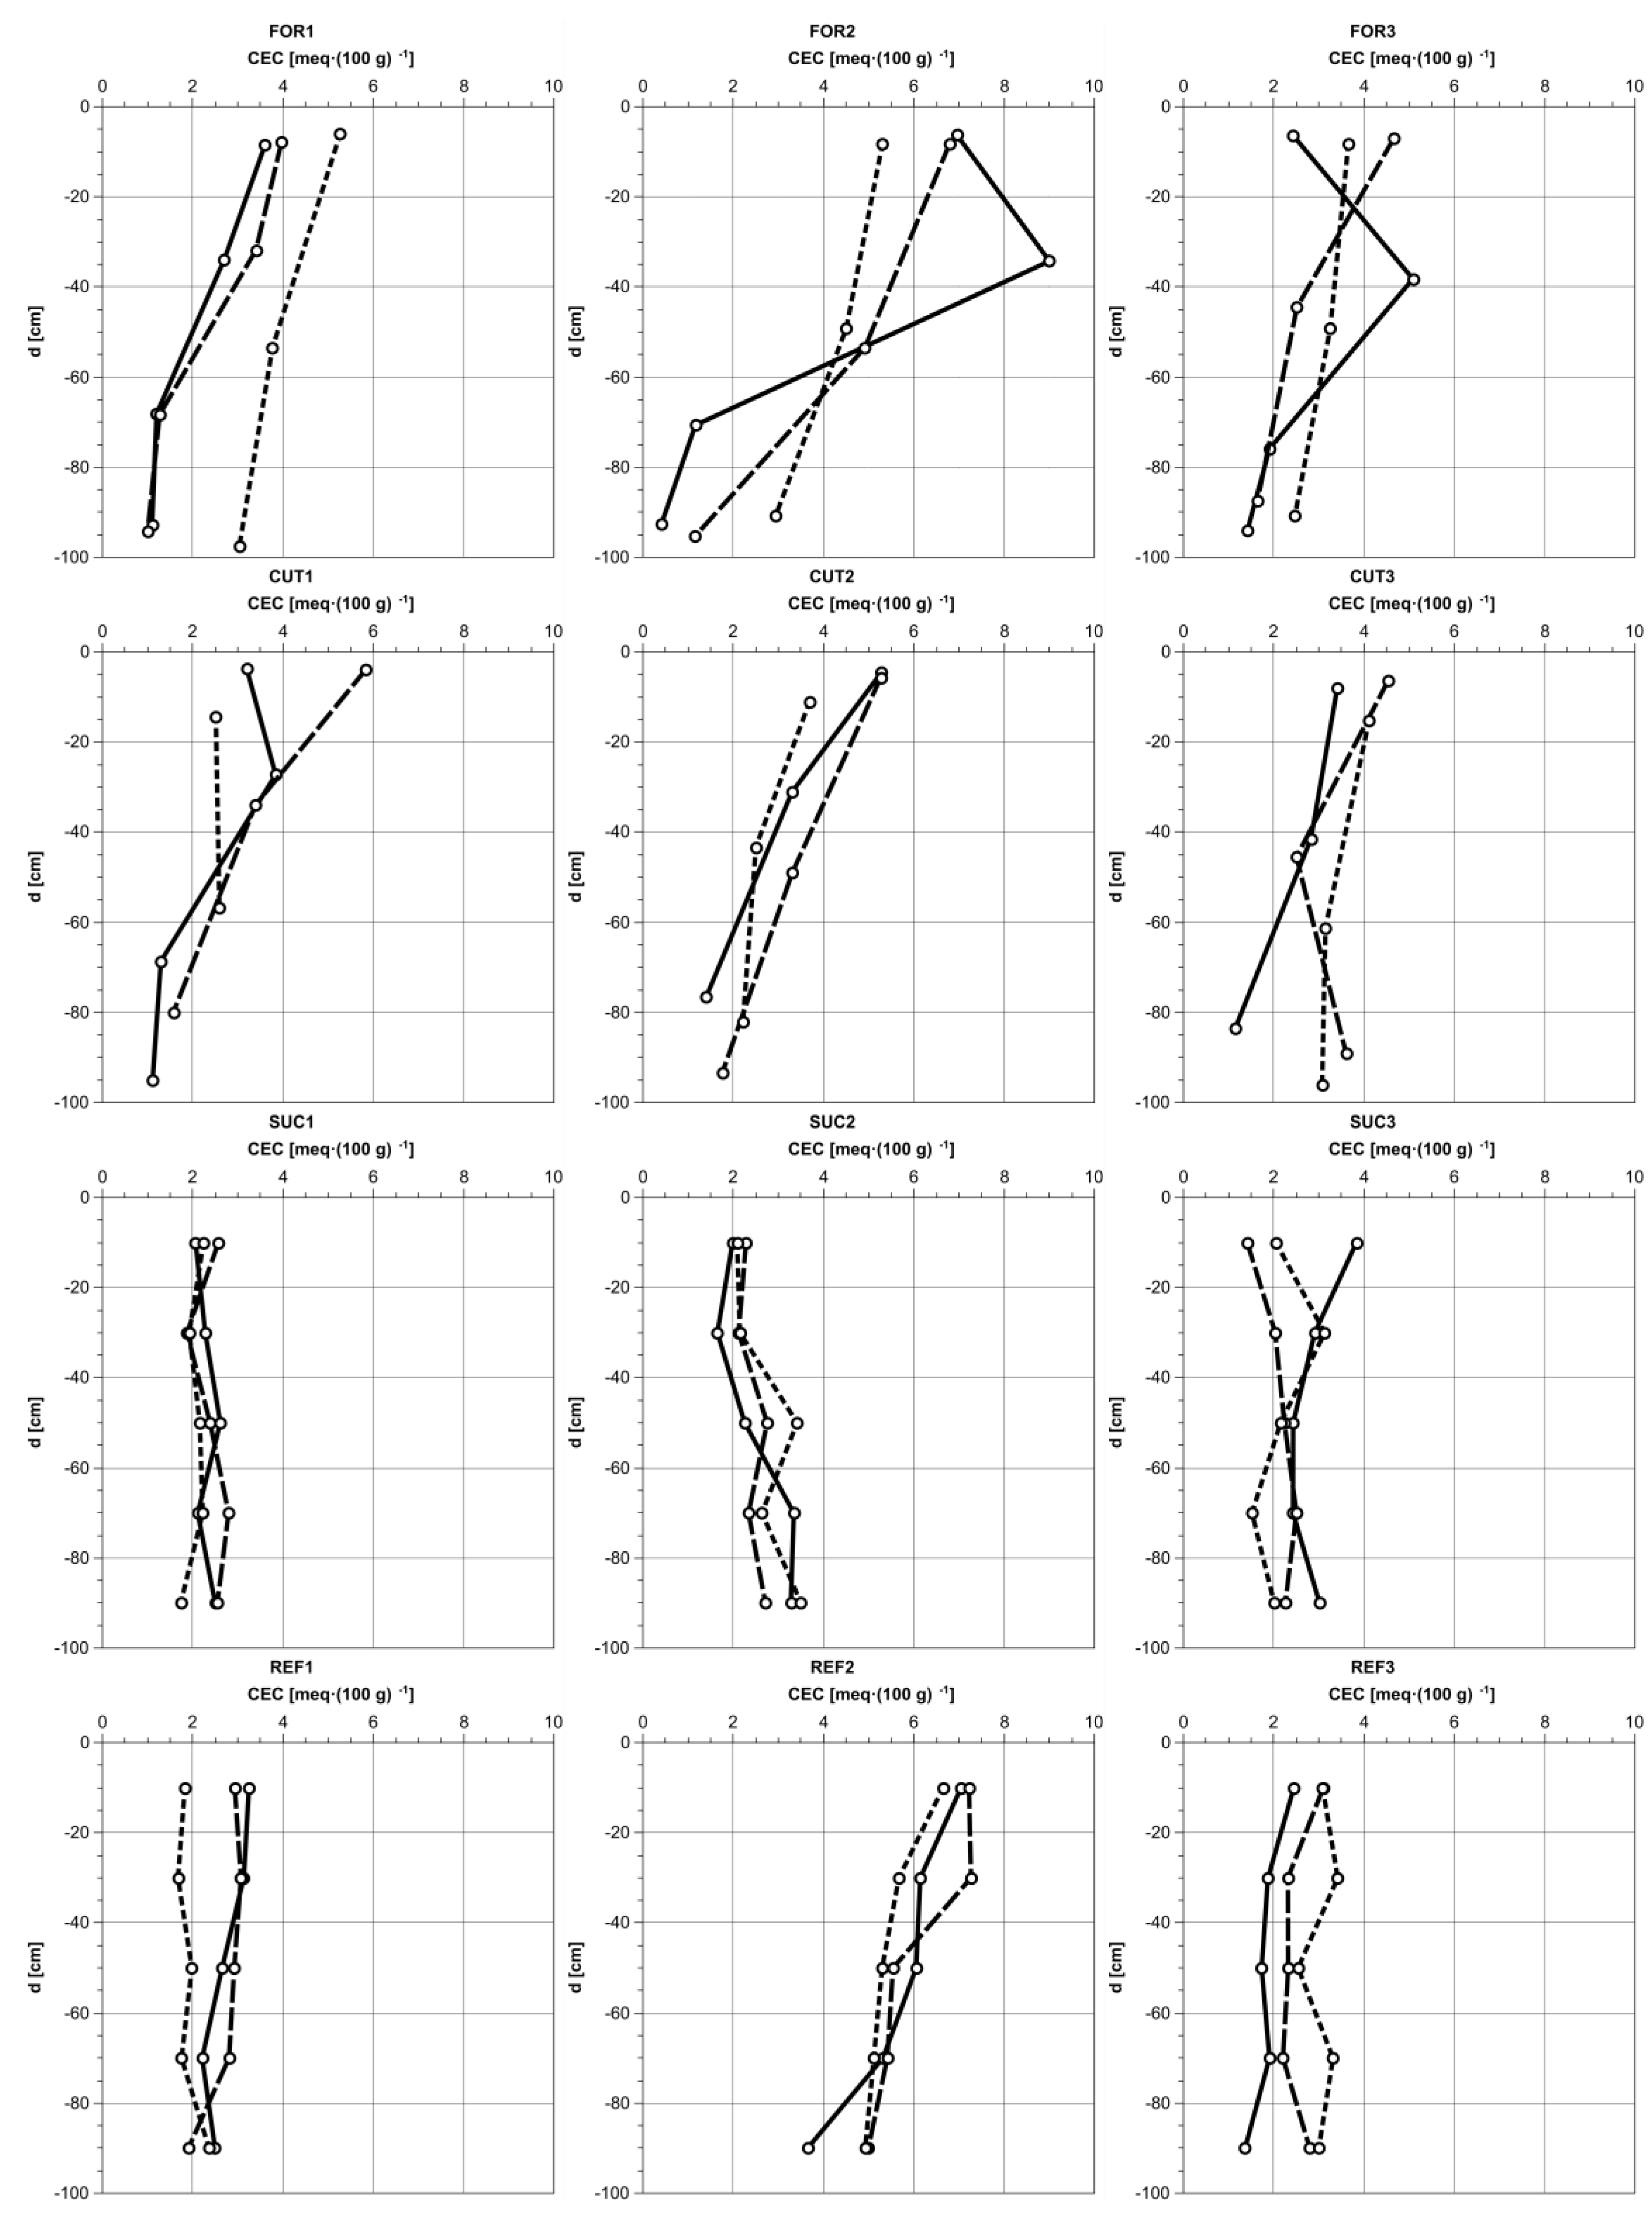
Figure 10.
Depth-related CEC content for every catena: (FOR)est, (CUT)-down, (SUC)cession, (REF)forested; solid line: upper slope, dashed line: middle slope, dotted line: lower slope.
Figure 10.
Depth-related CEC content for every catena: (FOR)est, (CUT)-down, (SUC)cession, (REF)forested; solid line: upper slope, dashed line: middle slope, dotted line: lower slope.
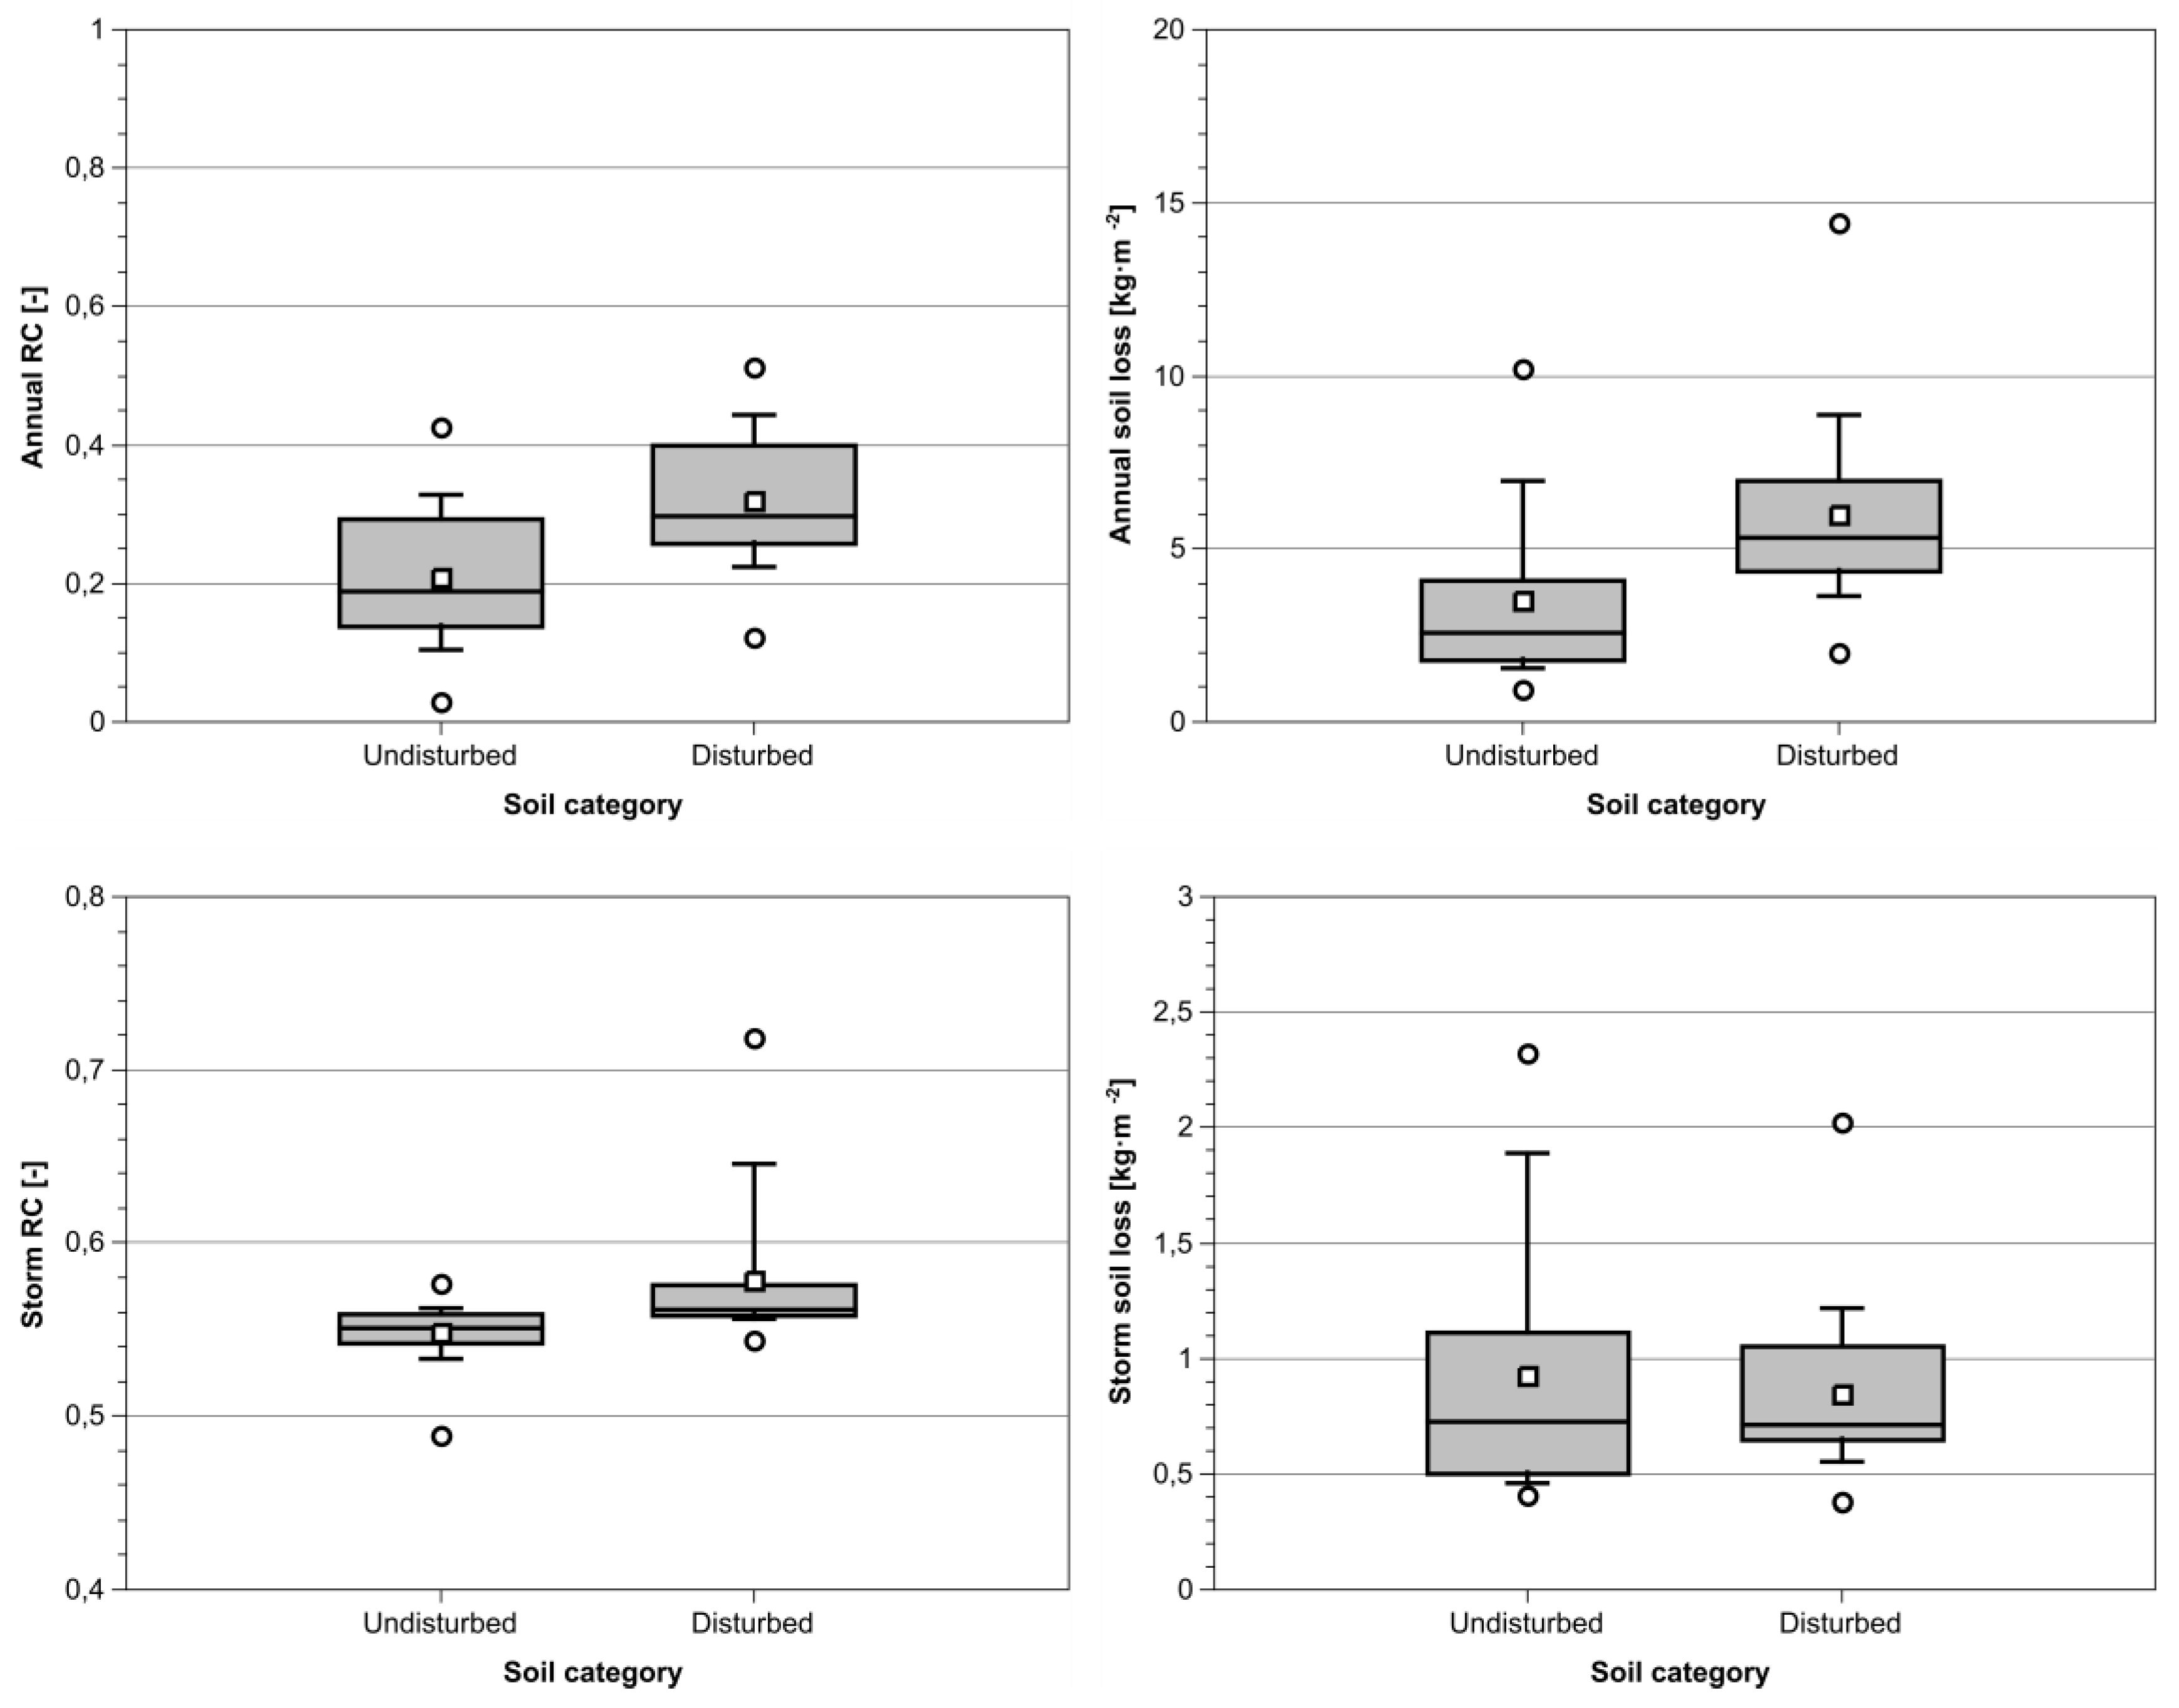
Figure 11.
Dataset distribution of standardized modeling for disturbed and undisturbed soils, viewing at singular soil samples.
Figure 11.
Dataset distribution of standardized modeling for disturbed and undisturbed soils, viewing at singular soil samples.
Figure 12.
Dataset distribution of standardized modeling for every sub-area, viewing at singular soil samples; (FOR)est, (CUT)-down, (SUC)cession, (REF)forested.
Figure 12.
Dataset distribution of standardized modeling for every sub-area, viewing at singular soil samples; (FOR)est, (CUT)-down, (SUC)cession, (REF)forested.
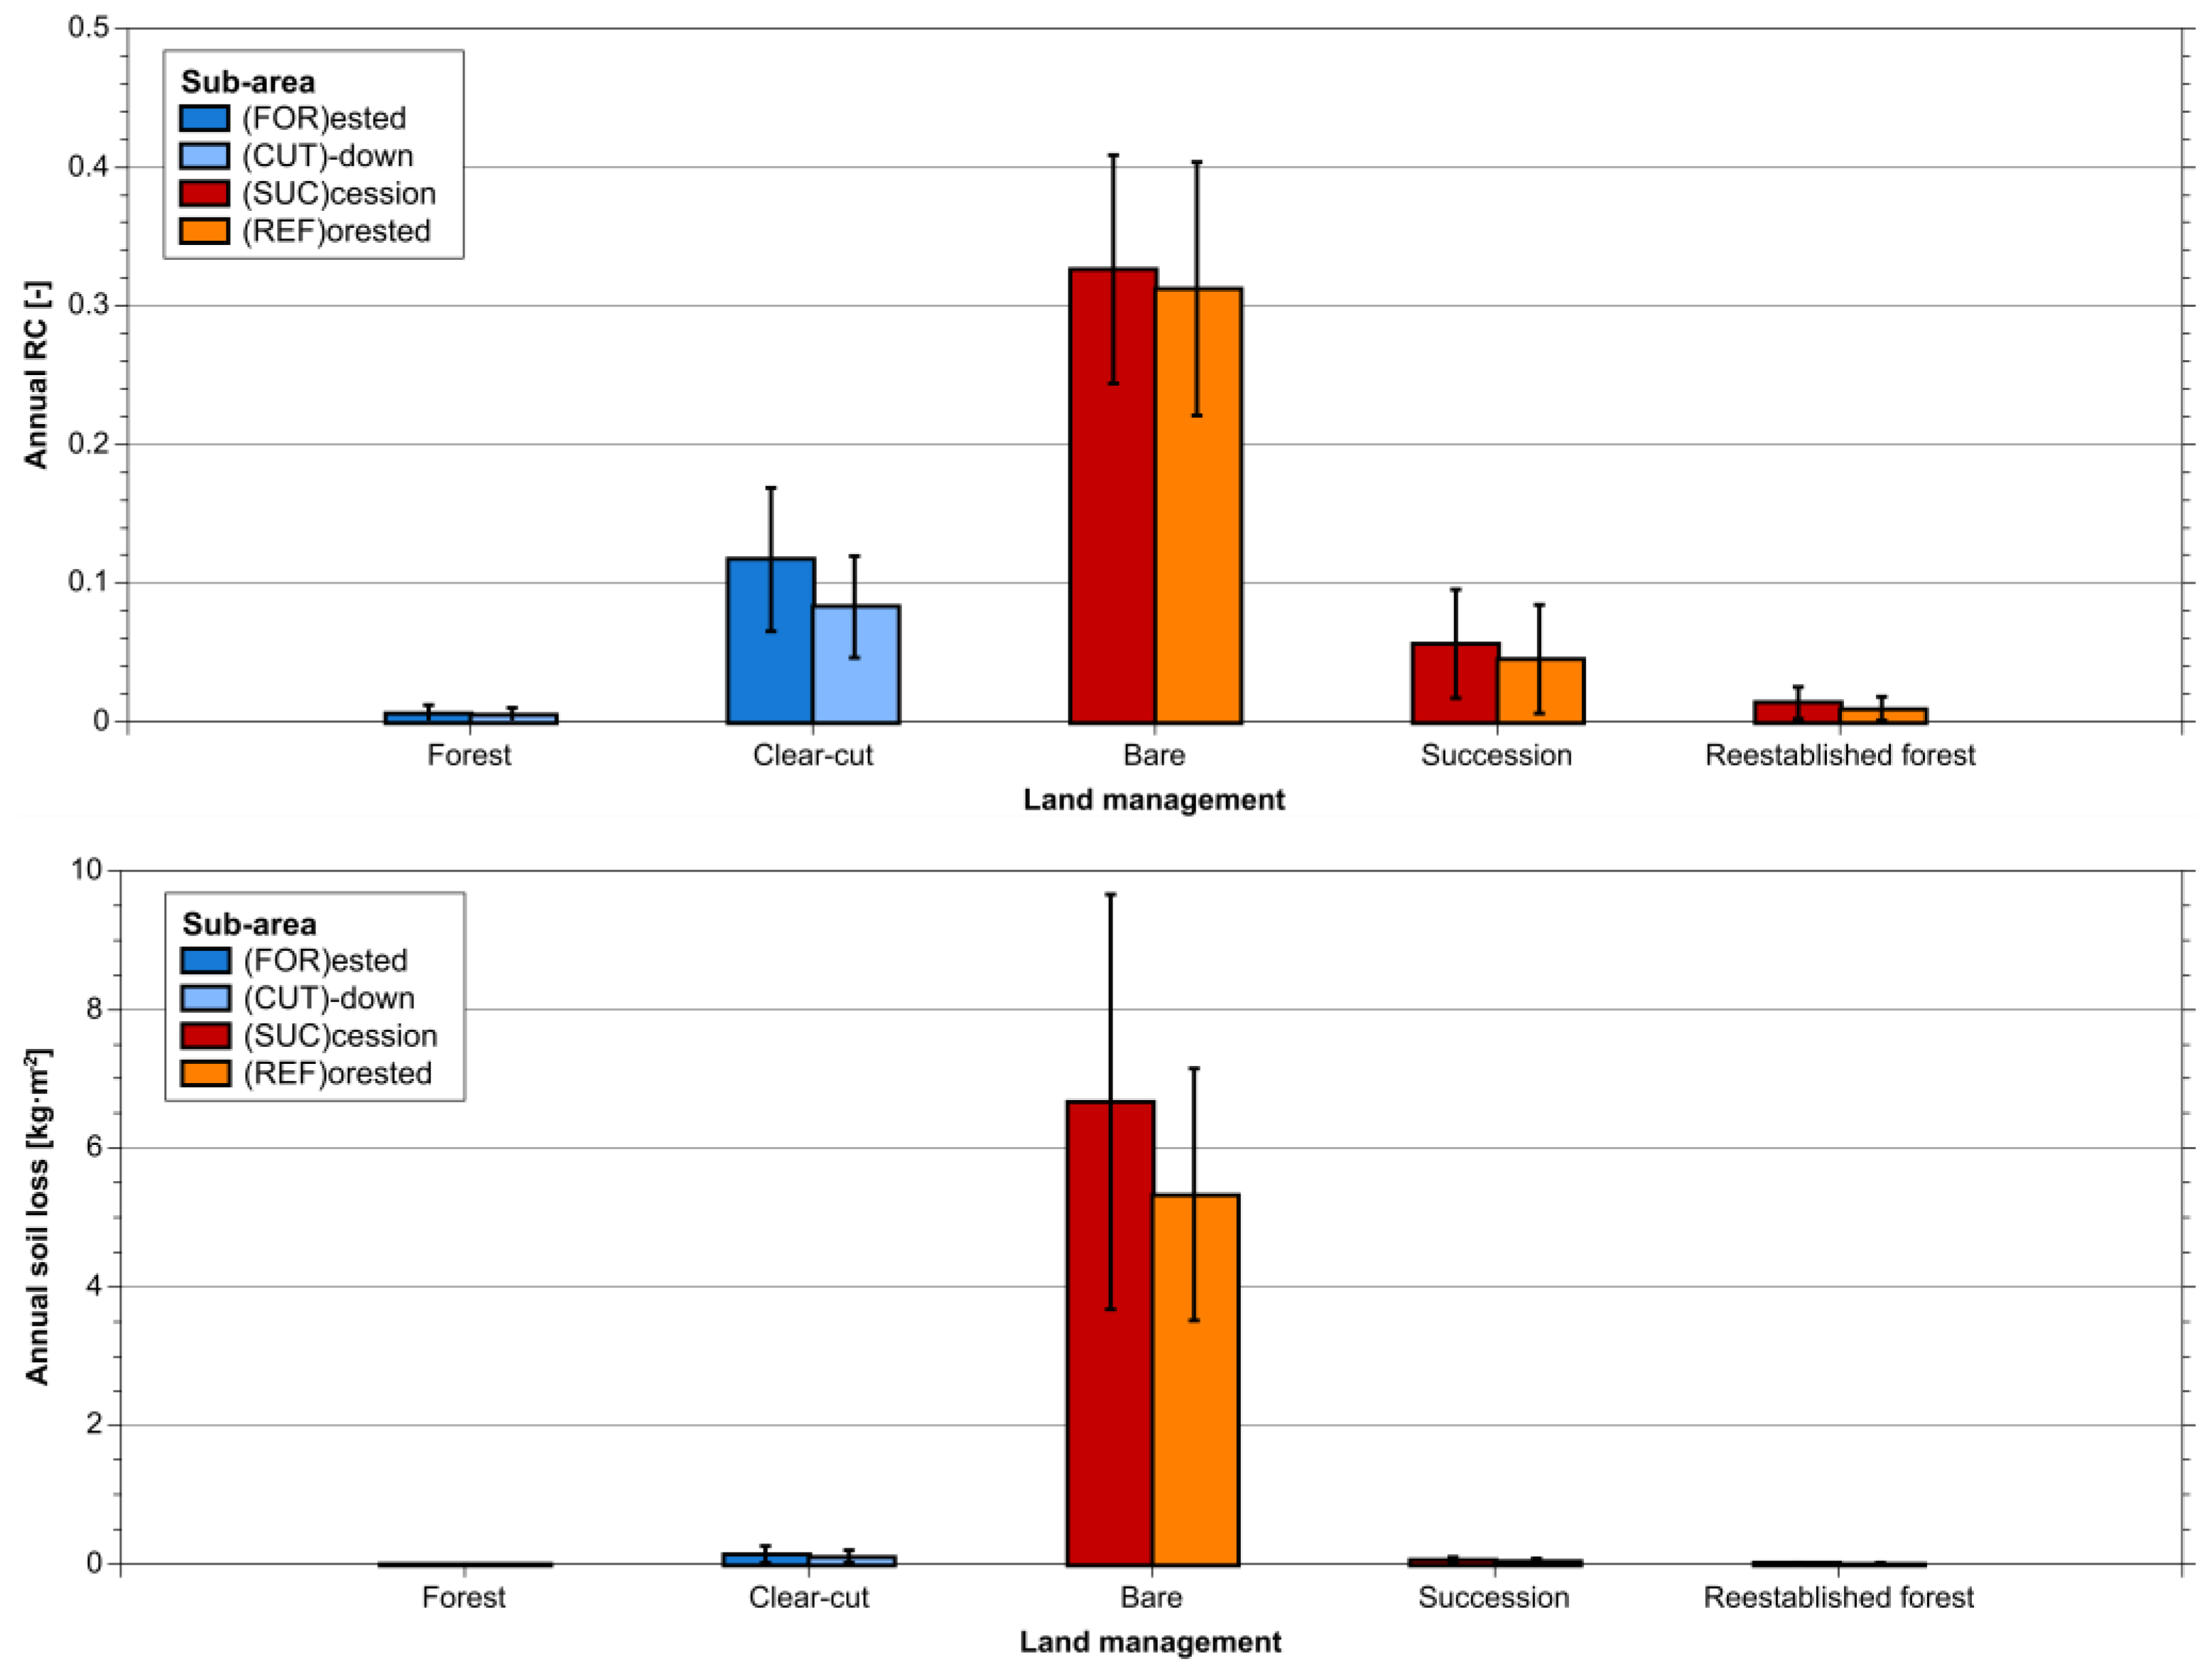
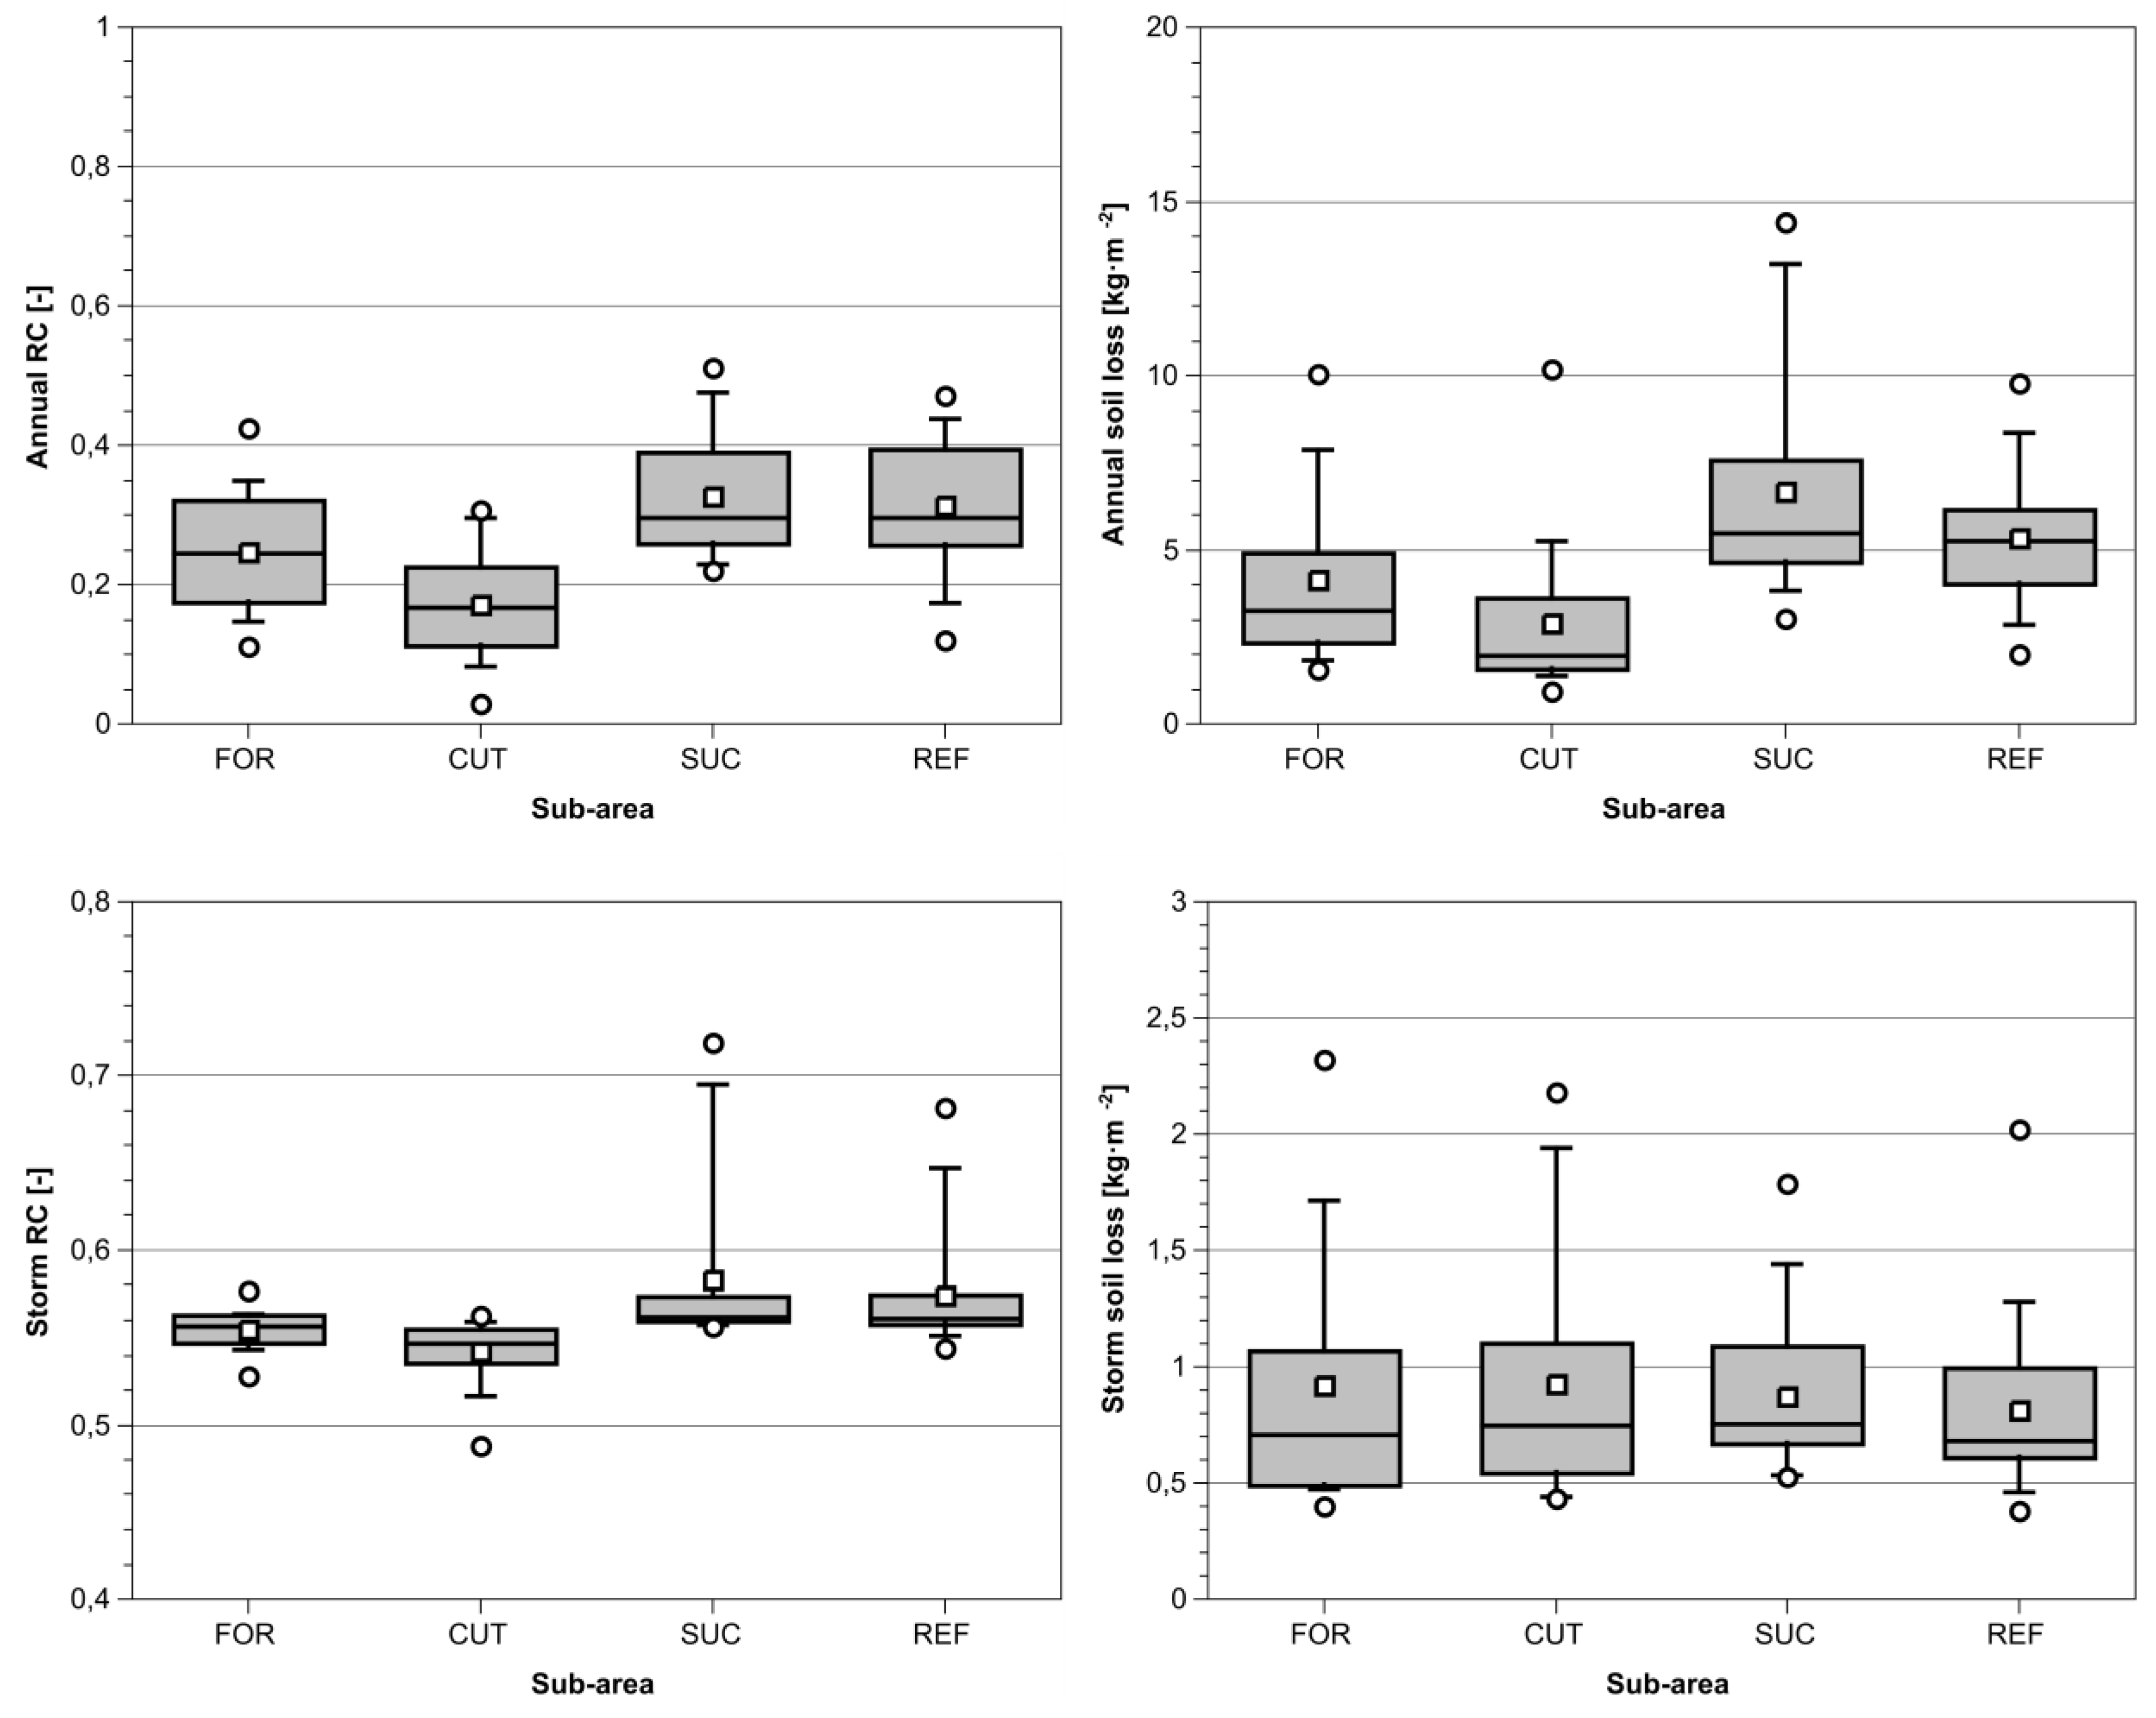
Figure 13.
Modeling results for land management shifts on standardized slope, annual runoff coefficient (RC) and soil loss. Y-error indicates standard deviation, blue columns indicate undisturbed soils, red columns indicate disturbed soils.
Figure 13.
Modeling results for land management shifts on standardized slope, annual runoff coefficient (RC) and soil loss. Y-error indicates standard deviation, blue columns indicate undisturbed soils, red columns indicate disturbed soils.
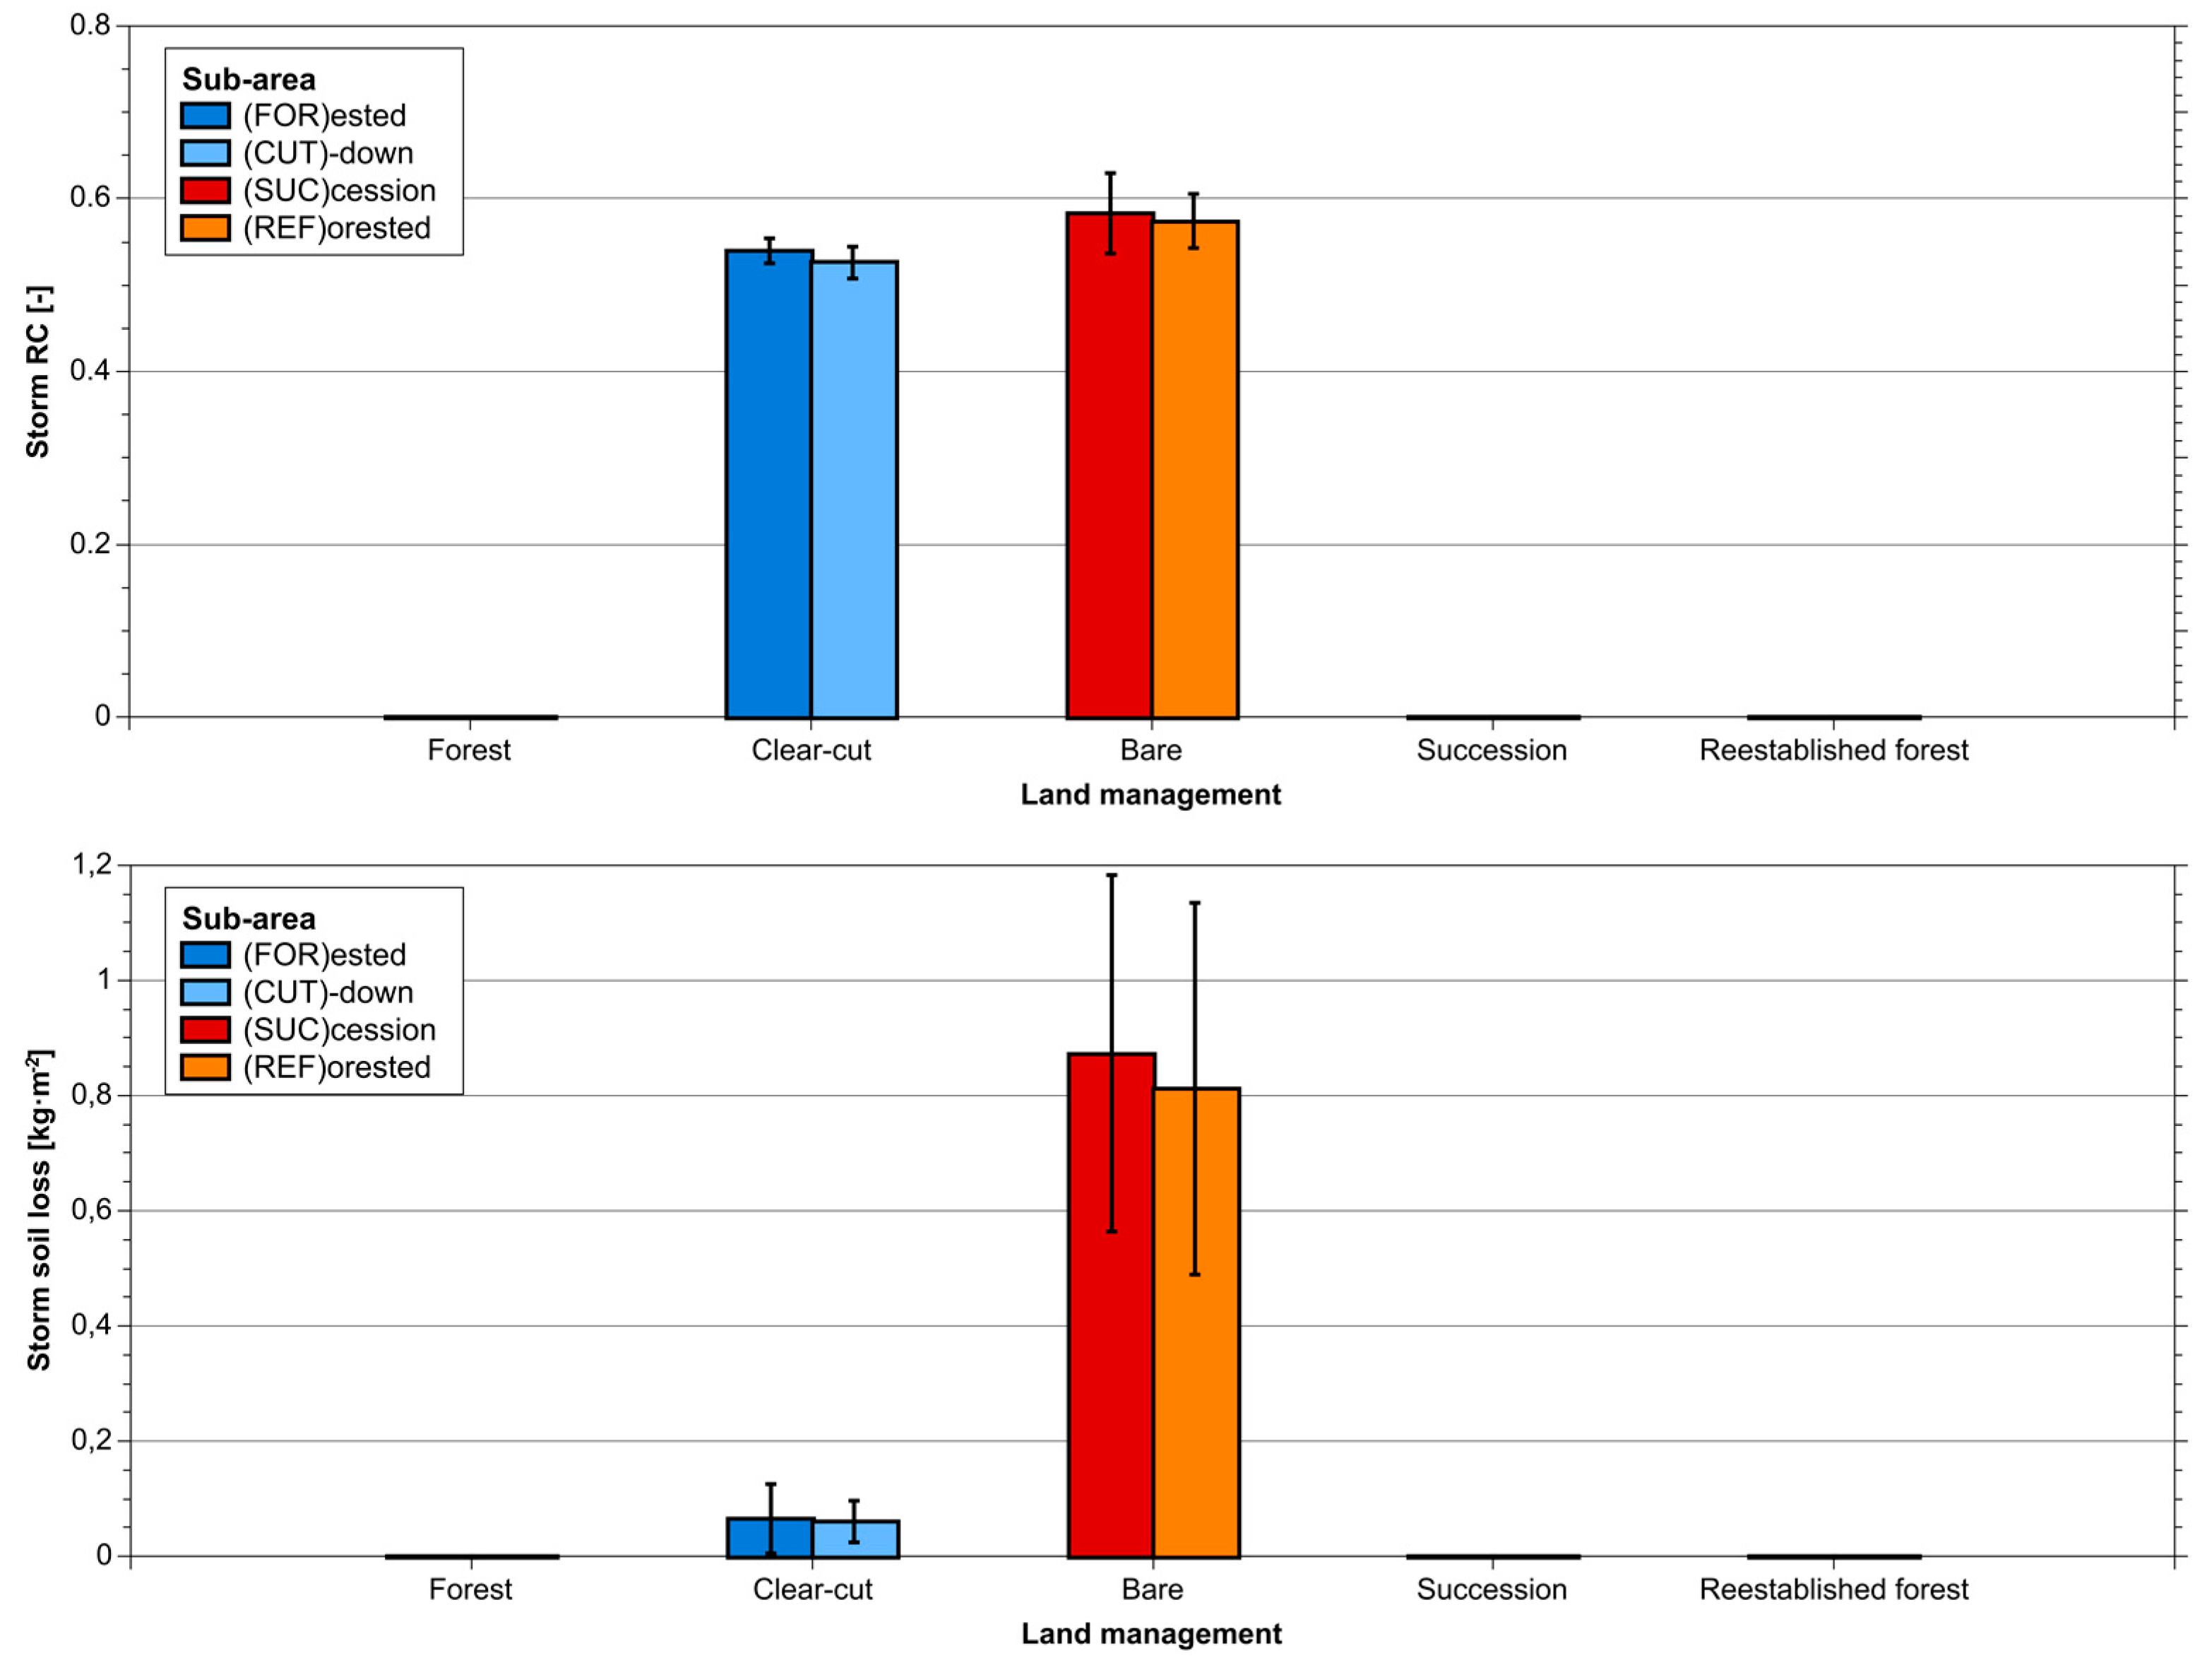
Figure 14.
Modeling results for land management shifts on standardized slope, storm runoff coefficient (RC) and soil loss. Y-error indicates standard deviation, blue columns indicate undisturbed soils, red columns indicate disturbed soils.
Figure 14.
Modeling results for land management shifts on standardized slope, storm runoff coefficient (RC) and soil loss. Y-error indicates standard deviation, blue columns indicate undisturbed soils, red columns indicate disturbed soils.
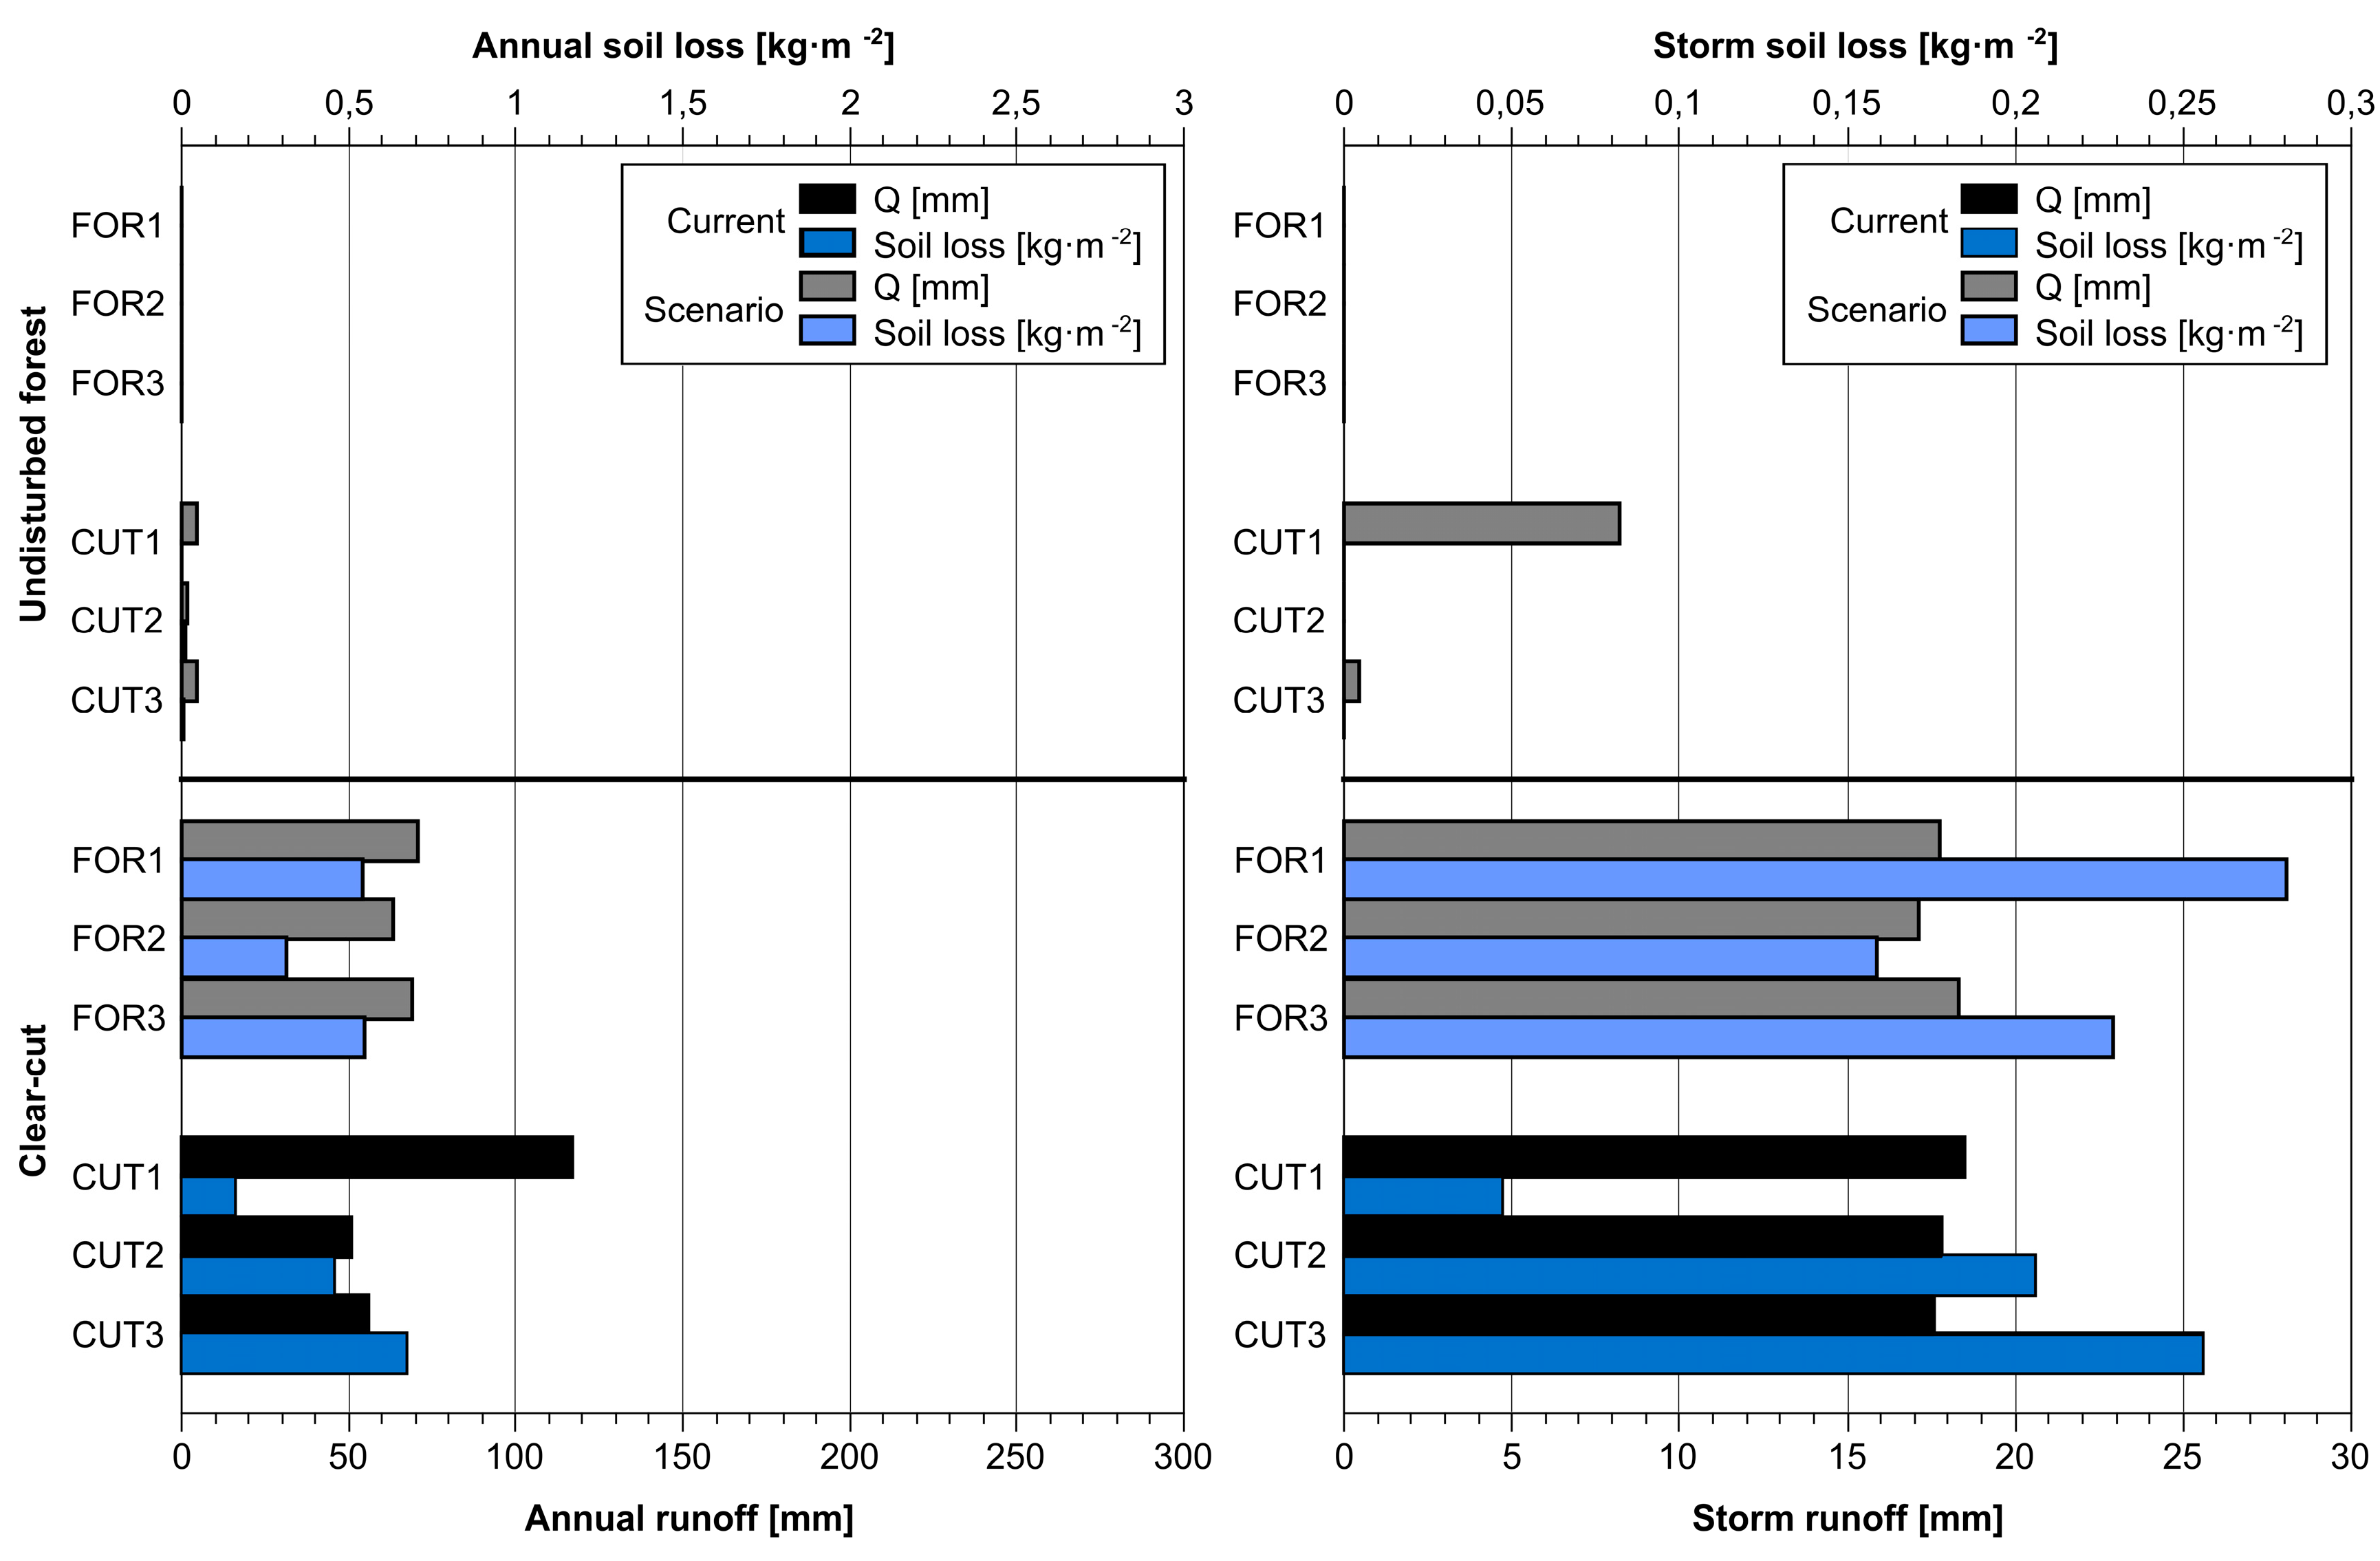
Figure 15.
Modeling results (annual and storm) for (FOR)ested and (CUT)-down sites, using realistic slope geometry and different land managements.
Figure 15.
Modeling results (annual and storm) for (FOR)ested and (CUT)-down sites, using realistic slope geometry and different land managements.
Figure 16.
Modeling results (annual and storm) for (SUC)cession and (REF)orested sites, using realistic slope geometry and different land managements.
Figure 16.
Modeling results (annual and storm) for (SUC)cession and (REF)orested sites, using realistic slope geometry and different land managements.
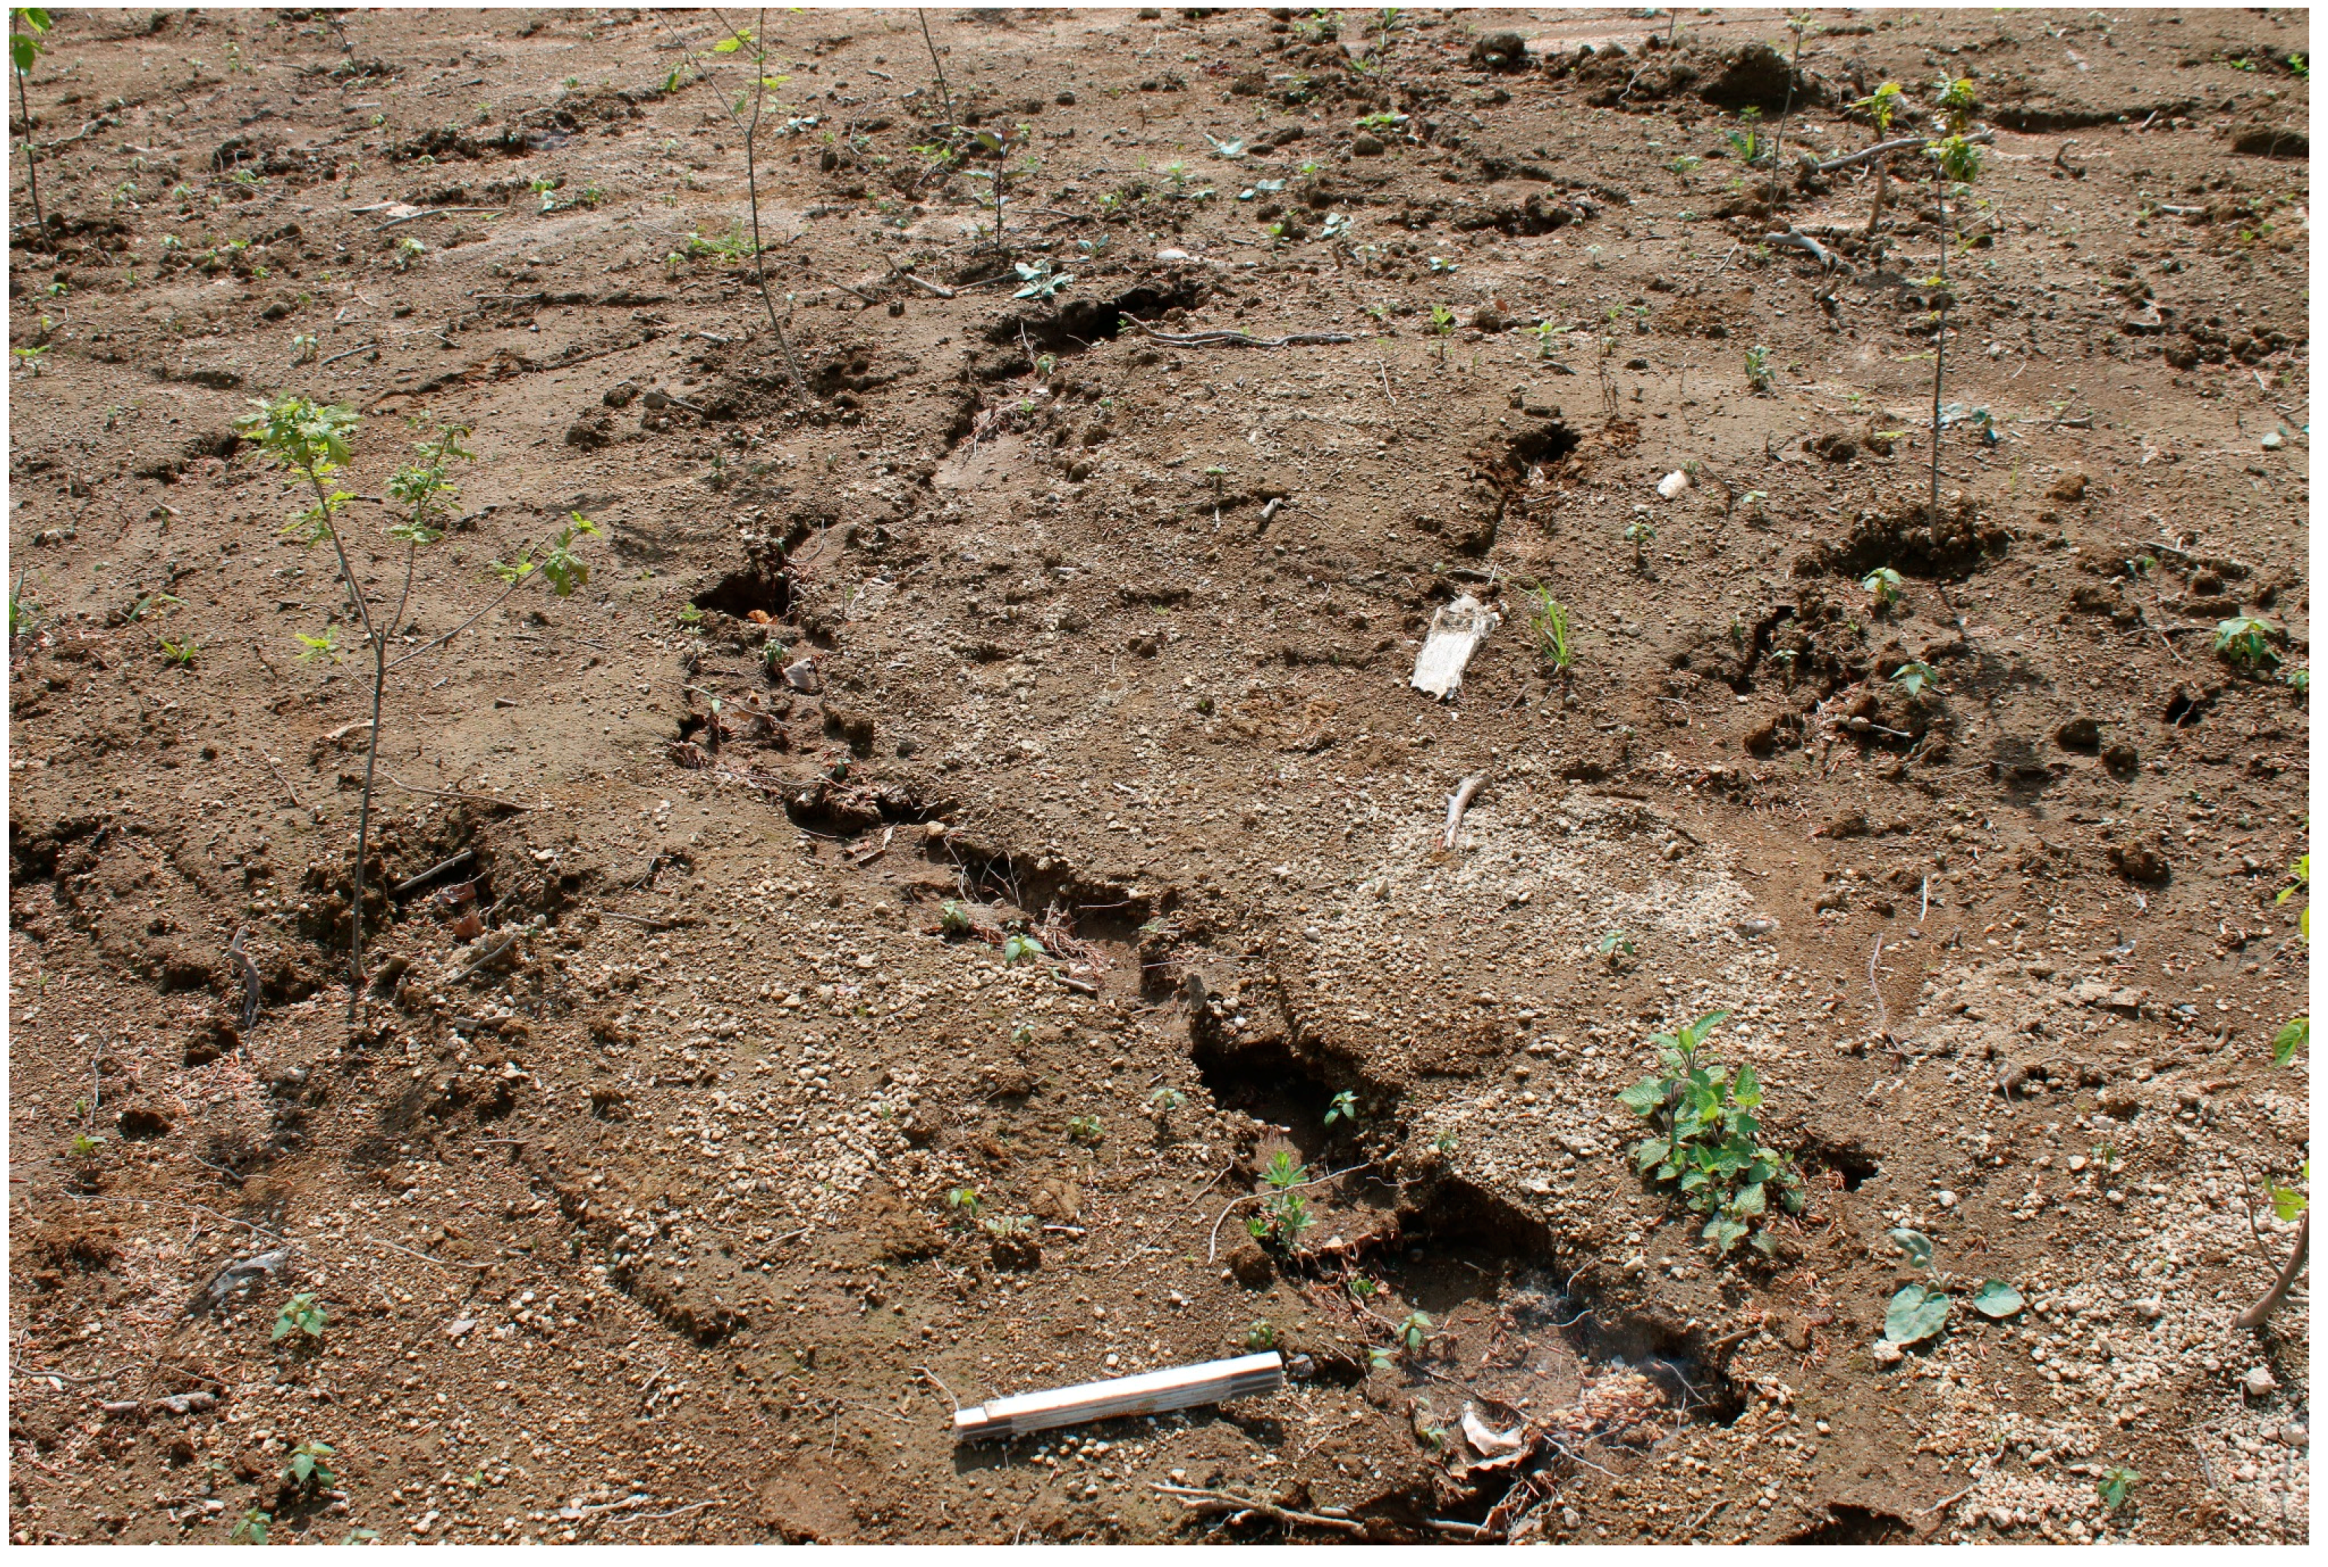
Figure 17.
Example for an erosion rill on backfilled sub-area CUT, folding ruler for scale.
Figure 17.
Example for an erosion rill on backfilled sub-area CUT, folding ruler for scale.
Table 1.
Climate data used for Water Erosion Prediction Project (WEPP) modeling, excerpt from CLIGEN parameter file.
Table 1.
Climate data used for Water Erosion Prediction Project (WEPP) modeling, excerpt from CLIGEN parameter file.
| Parameter | Jan. | Feb. | Mar. | Apr. | May | Jun. | Jul. | Aug. | Sep. | Oct. | Nov. | Dec. |
|---|
| Avg. P [mm] | 38.7 | 29.6 | 47.2 | 45.3 | 56.4 | 61.2 | 56.3 | 50.6 | 40.2 | 40.0 | 47.2 | 48.6 |
| No. of wet days | 16.9 | 11.7 | 15.5 | 12.7 | 13.1 | 13.4 | 12.3 | 10.5 | 11.3 | 12.1 | 14.3 | 16.0 |
| Max 30 min P [mm] | 7.1 | 8.1 | 4.3 | 5.6 | 10.2 | 11.0 | 9.4 | 10.7 | 6.9 | 6.4 | 6.4 | 6.6 |
| Avg.Tmax [°C] | 4.0 | 5.3 | 10.4 | 13.9 | 18.8 | 21.2 | 23.7 | 23.8 | 20.2 | 15.0 | 8.4 | 5.7 |
| Avg. Tmin [°C] | 0.5 | 0.0 | 3.8 | 5.4 | 9.3 | 12.6 | 14.3 | 14.2 | 11.8 | 8.6 | 4.2 | 2.3 |
Table 2.
Slope parameters for every catena; (FOR)est, (CUT)-down, (SUC)cession, (REF)forested.
Table 2.
Slope parameters for every catena; (FOR)est, (CUT)-down, (SUC)cession, (REF)forested.
| Catena | Length [m] | Mean Slope [%] |
|---|
| FOR1 | 130.5 | 9.01 |
| FOR2 | 123.1 | 9.98 |
| FOR3 | 105.35 | 12.58 |
| CUT1 | 86.81 | 15.05 |
| CUT2 | 99.19 | 14.62 |
| CUT3 | 107.07 | 13.65 |
| SUC1 | 63.36 | 8.74 |
| SUC2 | 62.60 | 12.88 |
| SUC3 | 62.26 | 11.82 |
| REF1 | 80.44 | 9.92 |
| REF2 | 95.67 | 9.33 |
| REF3 | 89.45 | 4.25 |
| Ø | 92.15 | 10.99 |
Table 3.
Land-management stages defined for modeling.
Table 3.
Land-management stages defined for modeling.
| Land-Management | FOR | CUT | SUC | REF |
|---|
| Undisturbed forest | Current | Scenario | - | - |
| Clear-cut with understory vegetation | Scenario | Current | - | - |
| Clear-cut without understory vegetation | Scenario | Current | - | - |
| Bare surface | - | - | Scenario | Scenario |
| Succession | - | - | Current | Scenario |
| Reestablished forest | - | - | Scenario | Current |
Table 4.
Land-management stages and WEPP presets used.
Table 4.
Land-management stages and WEPP presets used.
| Land-Management | Preset |
|---|
| Undisturbed forest | Forest perennial |
| Clear-cut | Altered preset, starting with disturbed forest and 90% ground cover. Disturbance on Sep 1st, removing ground cover |
| Bare surface | Fallow |
| Succession | Tall grass prairie |
| Reestablished forest | Tree 20yr forest |
Table 5.
Significance (p) and effect size (η2), testing depth- and soil-related influence on soil parameters (Two-way ANOVA for soil categories undisturbed and disturbed). Significant values appear bold.
Table 5.
Significance (p) and effect size (η2), testing depth- and soil-related influence on soil parameters (Two-way ANOVA for soil categories undisturbed and disturbed). Significant values appear bold.
| | Sand [%] | Clay [%] | SOM [%] | CEC [meq·(100 g)−1] |
|---|
| | p | η2 | p | η2 | p | η2 | p | η2 |
|---|
| Soil category | 0.67 | 0.00 | 0.19 | 0.01 | <0.05 | 0.14 | <0.05 | 0.12 |
| Depth | <0.05 | 0.05 | <0.05 | 0.04 | <0.05 | 0.47 | <0.05 | 0.45 |
| Soil category * depth | <0.05 | 0.18 | <0.05 | 0.14 | <0.05 | 0.28 | <0.05 | 0.26 |
Table 6.
Significance (p) and effect size (η2), testing depth- and soil-related influence on soil parameters (Two-way ANOVA for soil categories FOR, CUT, SUC and REF). Significant values appear bold.
Table 6.
Significance (p) and effect size (η2), testing depth- and soil-related influence on soil parameters (Two-way ANOVA for soil categories FOR, CUT, SUC and REF). Significant values appear bold.
| | Sand [%] | Clay [%] | SOM [%] | CEC [meq·(100 g)−1] |
|---|
| | p | η2 | p | η2 | p | η2 | p | η2 |
|---|
| Soil category | 0.52 | 0.01 | <0.05 | 0.03 | <0.05 | 0.15 | <0.05 | 0.13 |
| Depth | <0.05 | 0.05 | <0.05 | 0.04 | <0.05 | 0.49 | <0.05 | 0.46 |
| Soil category * depth | <0.05 | 0.20 | <0.05 | 0.17 | <0.05 | 0.30 | <0.05 | 0.28 |
Table 7.
Rock content of every catena; (FOR)ested, (CUT)-down, (SUC)cession, (REF)orested.
Table 7.
Rock content of every catena; (FOR)ested, (CUT)-down, (SUC)cession, (REF)orested.
| | n | Mean Rock [%] |
|---|
| FOR1 | 10 | 10.9 |
| FOR2 | 10 | 10.2 |
| FOR3 | 9 | 13.7 |
| CUT1 | 8 | 8.7 |
| CUT2 | 10 | 11.7 |
| CUT3 | 10 | 10.6 |
| SUC1 | 10 | 8.6 |
| SUC2 | 10 | 9.4 |
| SUC3 | 10 | 11.9 |
| REF1 | 10 | 8.1 |
| REF2 | 10 | 8.9 |
| REF3 | 10 | 8.4 |
Table 8.
Mean topsoil texture, erodibilities, critical shear stress and effective hydraulic conductivity (Keff) and mean site-specific effective hydraulic conductivity of every sub-area; (FOR)ested, (CUT)-down, (SUC)cession, (REF)orested.
Table 8.
Mean topsoil texture, erodibilities, critical shear stress and effective hydraulic conductivity (Keff) and mean site-specific effective hydraulic conductivity of every sub-area; (FOR)ested, (CUT)-down, (SUC)cession, (REF)orested.
| | FOR | CUT | SUC | REF |
|---|
| Mean topsoil clay [%] | 21.8 | 13.9 | 14.2 | 18.5 |
| Mean topsoil silt [%] | 42.4 | 50.4 | 22.8 | 24.9 |
| Mean topsoil sand [%] | 36.0 | 36.1 | 63.0 | 56.6 |
| Mean topsoil texture (FAO) | Loam | Silt loam | Sandy loam | Sandy loam |
| Mean topsoil interrill erodibility [kg·s·(m−4)−1] | 8,298,158 | 8,152,953 | 10,193,226 | 9,831,884 |
| Mean topsoil rill erodibility [s·m−1] | 0.0157 | 0.0164 | 0.0143 | 0.0144 |
| Mean topsoil critical shear stress [N·m−2] | 2.22 | 2.08 | 1.26 | 0.68 |
| Mean topsoil Keff [mm·h−1] | 10.04 | 10.90 | 21.26 | 18.90 |
| Mean site-specific Keff [mm·h−1] | 1.17 | 2.11 | 0.68 | 0.75 |
Table 9.
Descriptive statistics for standardized modeling results undisturbed and disturbed samples.
Table 9.
Descriptive statistics for standardized modeling results undisturbed and disturbed samples.
| | Undisturbed | Disturbed |
|---|
| n | 57 | 60 |
| Mean annual runoff [mm] | 142.54 | 217.41 |
| Mean annual RC [-] | 0.21 | 0.32 |
| Mean annual soil loss [kg·m−2] | 3.52 | 5.99 |
| Mean storm runoff [mm] | 18.37 | 19.38 |
| Mean storm RC [-] | 0.55 | 0.58 |
| Mean storm soil loss [kg·m−2] | 0.92 | 0.84 |
Table 10.
Results of Mann-Whitney U-test, testing differences between undisturbed and disturbed samples.
Table 10.
Results of Mann-Whitney U-test, testing differences between undisturbed and disturbed samples.
| | Annual Runoff | Annual Soil Loss | Storm Runoff | Storm Soil Loss |
|---|
| p | 2.4 × 10⁻⁸ * | 6.5 × 10⁻⁹ * | 5.1 × 10⁻¹⁰ * | 0.754 |
Table 11.
Descriptive statistics of standardized modeling results for individual land-management categories: (FOR)ested, (CUT)-down, (SUC)cession and (REF)orested.
Table 11.
Descriptive statistics of standardized modeling results for individual land-management categories: (FOR)ested, (CUT)-down, (SUC)cession and (REF)orested.
| | FOR | CUT | SUC | REF |
|---|
| n | 29 | 28 | 30 | 30 |
| Mean annual runoff [mm] | 167.95 | 116.22 | 222.13 | 212.68 |
| Mean annual RC [-] | 0.25 | 0.17 | 0.33 | 0.31 |
| Mean annual soil loss [kg·m−2] | 4.14 | 2.89 | 6.66 | 5.33 |
| Mean storm runoff [mm] | 18.58 | 18.17 | 19.54 | 19.23 |
| Mean storm RC [-] | 0.56 | 0.54 | 0.58 | 0.57 |
| Mean storm soil loss [kg·m−2] | 0.92 | 0.93 | 0.87 | 0.81 |
Table 12.
U-test p-values for standardized annual modeling results, (FOR)ested, (CUT)-down, (SUC)CESSION and (REF)orested samples.
Table 12.
U-test p-values for standardized annual modeling results, (FOR)ested, (CUT)-down, (SUC)CESSION and (REF)orested samples.
| | Annual Runoff | Annual Soil Loss |
|---|
| | FOR | CUT | SUC | FOR | CUT | SUC |
|---|
| CUT | 0.001 * | - | - | 0.007 * | - | - |
| SUC | 0.003 * | 9.4·× 10−8 * | - | 9.2·× 10−5 * | 2.8·× 10−7 * | - |
| REF | 0.008 * | 2·× 10−6 * | 0.668 | 0.005 * | 6·× 10−6 * | 0.128 |
Table 13.
U-test p-values for standardized storm modeling results, (FOR)ested, (CUT)-down, (SUC)CESSION and (REF)orested samples.
Table 13.
U-test p-values for standardized storm modeling results, (FOR)ested, (CUT)-down, (SUC)CESSION and (REF)orested samples.
| | Storm Runoff | Storm Soil Loss |
|---|
| | FOR | CUT | SUC | FOR | CUT | SUC |
|---|
| CUT | 0.002 * | - | - | 0.848 | - | - |
| SUC | 1.7·× 10−4 * | 1.1·× 10−8 * | - | 0.471 | 0.646 | - |
| REF | 0.003 * | 3.2·× 10−7 * | 0.271 | 0.928 | 0.834 | 0.318 |
Table 14.
Mean modeled annual runoff and soil loss on standardized slope. Bold values represent current land use.
Table 14.
Mean modeled annual runoff and soil loss on standardized slope. Bold values represent current land use.
| Land-Use | Mean Annual RC [-] | Mean Annual Soil Loss [kg·m−2] |
|---|
| FOR | CUT | SUC | REF | FOR | CUT | SUC | REF |
|---|
| Undisturbed forest | 0.01 | 0.01 | - | - | 0.003 | 0.003 | - | - |
| Clear-cut | 0.12 | 0.08 | - | - | 0.139 | 0.106 | - | - |
| Bare surface | - | - | 0.33 | 0.31 | - | - | 6.660 | 5.327 |
| Succession | - | - | 0.06 | 0.05 | - | - | 0.059 | 0.046 |
| Reestablished forest | - | - | 0.01 | 0.01 | - | - | 0.013 | 0.010 |
Table 15.
Mean modeled storm runoff and soil loss on standardized slope. Bold values represent current land use.
Table 15.
Mean modeled storm runoff and soil loss on standardized slope. Bold values represent current land use.
| Land-Use | Mean Storm Runoff [mm] | Mean Storm Soil Loss [kg·m−2] |
|---|
| FOR | CUT | SUC | REF | FOR | CUT | SUC | REF |
|---|
| Undisturbed forest | 0.00 | 0.00 | - | - | 0.000 | 0.000 | - | - |
| Clear-cut | 0.54 | 0.53 | - | - | 0.065 | 0.060 | - | - |
| Bare surface | - | - | 0.58 | 0.57 | - | - | 0.873 | 0.812 |
| Succession | - | - | 0.00 | 0.00 | - | - | 0.000 | 0.000 |
| Reestablished forest | - | - | 0.00 | 0.00 | - | - | 0.000 | 0.000 |
Table 16.
Significance (p) and effect size (η2), testing depth- and soil-related influence on RC and sediment loss (Two-way ANOVA for soil categories FOR, CUT, SUC and REF). Significant values appear bold.
Table 16.
Significance (p) and effect size (η2), testing depth- and soil-related influence on RC and sediment loss (Two-way ANOVA for soil categories FOR, CUT, SUC and REF). Significant values appear bold.
| | Annual RC [-] | Annual Sediment Loss [kg·m−2] | Storm RC [-] | Storm Sediment Loss [kg·m−2] |
|---|
| | P | H2 | p | η2 | p | η2 | p | η2 |
|---|
| Soil category | 0.06 | 0.02 | <0.05 | 0.02 | 0.09 | 0.02 | 0.65 | 0.01 |
| Land management | <0.05 | 0.84 | <0.05 | 0.79 | <0.05 | 0.99 | <0.05 | 0.82 |
| Soil category * land management | 0.30 | 0.01 | <0.05 | 0.05 | 0.12 | 0.02 | 0.63 | 0.01 |
Table 17.
Mean modeled annual runoff and soil loss. Bold values represent current land use.
Table 17.
Mean modeled annual runoff and soil loss. Bold values represent current land use.
| Land-Use | Mean Annual Runoff [mm] | Mean Annual Soil Loss [kg·m−2] |
|---|
| FOR | CUT | SUC | REF | FOR | CUT | SUC | REF |
|---|
| Undisturbed forest | 0.00 | 3.57 | - | - | 0.00 | 0.00 | - | - |
| Clear-cut | 67.69 | 74.56 | - | - | 0.47 | 0.43 | - | - |
| Bare surface | - | - | 223.43 | 190,97 | - | - | 7.55 | 6.54 |
| Succession | - | - | 89.33 | 21.74 | - | - | 0.43 | 0.09 |
| Reestablished forest | - | - | 16.31 | 4.86 | - | - | 0.03 | 0.02 |
Table 18.
Mean modeled storm runoff and soil loss. Bold values represent current land use.
Table 18.
Mean modeled storm runoff and soil loss. Bold values represent current land use.
| Land-Use | Mean Storm Runoff [mm] | Mean Storm Soil Loss [kg·m−2] |
|---|
| FOR | CUT | SUC | REF | FOR | CUT | SUC | REF |
|---|
| Undisturbed forest | 0.00 | 2.90 | - | - | 0.00 | 0.00 | - | - |
| Clear-cut | 17.75 | 17.97 | - | - | 0.22 | 0.17 | - | - |
| Bare surface | - | - | 18.72 | 18.37 | - | - | 0.85 | 0.85 |
| Succession | - | - | 1.74 | 0.00 | - | - | 0.00 | 0.00 |
| Reestablished forest | - | - | 1.65 | 0.00 | - | - | 0.00 | 0.00 |


