Article

Plant Organic Matter Really Matters: Pedological Effects of Kūpaoa (Dubautia menziesii) Shrubs in a Volcanic Alpine Area, Maui, Hawai’i

by
Francisco L. Pérez
Department of Geography and the Environment, University of Texas, Austin, TX 78712-1098, USA
Soil Syst. 2019, 3(2), 31; https://doi.org/10.3390/soilsystems3020031
Submission received: 25 March 2019 / Revised: 16 April 2019 / Accepted: 16 April 2019 / Published: 19 April 2019

Abstract

:
This study examines litter accumulation and associated soil fertility islands under kūpaoa (Dubautia menziesii) shrubs, common at high elevations in Haleakalā National Park (Maui, Hawai’i). The main purposes were to: (i) Analyze chemical and physical properties of kūpaoa leaf-litter, (ii) determine soil changes caused by organic-matter accumulation under plants, and (iii) compare these with the known pedological effects of silversword (Argyroxiphium sandwicense) rosettes in the same area. Surface soil samples were gathered below shrubs, and compared with paired adjacent, bare sandy soils; two soil profiles were also contrasted. Litter patches under kūpaoa covered 0.57–3.61 m2 area and were 22–73 mm thick. A cohesive, 5–30-mm-thick soil crust with moderate aggregate stability developed underneath litter horizons; grain aggregation was presumably related to high organic-matter accumulation. Shear strength and compressibility measurements showed crusts opposed significantly greater resistance to physical removal and erosion than adjacent bare soils. As compared to contiguous bare ground areas, soils below shrubs had higher organic matter percentages, darker colors, faster infiltration rates, and greater water-retention capacity. Chemical soil properties were greatly altered by organic matter: Cations (Ca2+, Mg2+, K+), N, P, and cation-exchange capacity, were higher below plants. Further processes affecting soils under kūpaoa included microclimatic amelioration, and additional water input by fog-drip beneath its dense canopy. Substrate modifications were more pronounced below D. menziesii than A. sandwicense. Organic matter and available nutrient contents were higher under shrubs, where soils also showed greater infiltration and water-retention capacity. These trends resulted from contrasting litter properties between plant species, as kūpaoa leaves have higher nutrient content than silversword foliage. Different litter dynamics and reproduction strategies may also explain contrasting soil properties between the monocarpic rosettes and polycarpic kūpaoa. By inducing substantial substrate changes, Dubautia shrubs alter—or even create—different microhabitats and exert critical control on alpine soil development at Haleakalā.

The pedogenic impact of organisms is inferred from comparisons of bare and vegetated soil… or of soils covered by combinations of species.”
Hans Jenny, 1980 [1], p. 359.

1. Introduction

1.1. Influence of Plants on Soil Development

The effects of plants on soil development have been investigated under various plant types; the literature on this subject is scattered through several disciplines, including pedology, ecology, botany, and geomorphology. This section will focus on pedogenic microsite amelioration by shrubs, especially in mountain and volcanic areas.
Most plants affect pedogenesis by steady addition of organic litter to a mineral substrate [1,2]; as litter decomposes, soil organic matter (SOM) gradually builds up and may modify several physical and chemical soil properties. SOM accumulation under individual shrubs has been particularly studied in arid lowlands of North America [3,4,5,6,7,8,9,10], South America [11,12], China [13,14], and Africa [15,16]. In comparison, few studies have focused on mountains. SOM addition by shrubs has been investigated in semi-arid highlands of Durango, Mexico [17] and Utah, USA [18], as well as in montane grasslands of China [19,20], and in the central sierras of Spain [21]. Some publications have dealt with soil formation in volcanic highlands, including pedogenesis induced by shrubs on pyroclastic deposits at Mt. Etna, Italy [22,23], on basalts in La Palma (Canary Islands), Spain [24], and by litter addition under pukiawe (Leptecophylla tameiameiae) and Sophora spp. shrubs on Mauna Kea, Hawai’i [25].
The role of various alpine plants on soil formation has been evaluated for herbs on Mt. St. Helens, USA [26] and in the Caucasus Mtns, Russia [27], for cushion plants in the Chilean Andes [28], and for woody shrubs in New Zealand [29]. Litter accumulation and soil changes have been examined under krummholz tree islands in the Colorado Rockies [30,31] and on volcanic substrates in California [32]. Pedogenic effects of giant rosette species were also assessed in the high Andes [33,34] and in Haleakalā volcano, Maui, Hawai’i [35].
Soil modifications are more evident under large, isolated individuals, as litter-induced patterns from contiguous plants in dense vegetation areas tend to merge, obscuring the organic matter gradients produced by single plants [36,37]. Thus, researchers have often been focused in widely spaced plants, and contrasted soil characteristics beneath a plant canopy with paired control samples, obtained in bare canopy interspaces [3,4,6,16,33,34,38]; this approach will also be followed in this study. Other studies have sampled soils along radial transects extending away from a plant [32,36,37,39,40] or on a grid pattern centered about it [18,20].
When plant material is added to soil from above—as in the case of leaf-litter—the effects of plant-derived SOM are greatest in surface soil horizons. As litter debris collects mainly under the plant canopy, its influence on soil is most prominent there [3,5,36], although factors such as wind, runoff, or slope movement on steep gradients may locally redistribute litter, causing an asymmetrical pattern of SOM accumulation [36,37,41]. Plants gather elements through their root systems and soon develop discrete litter islands under their canopy [32,42,43]; as litter decomposes, nutrients gradually become concentrated in the soil below; these nutrient-enriched patches are referred to as fertility islands [10,16,17,18,21,44,45,46] or fertile islands [13,14,47]; other names include resource islands [26,48] and modified topsoil islands [49].
Soils under plants serve as nutrient sinks, and the contiguous spaces between plants act as source areas; plants progressively transfer nutrient resources from sources to sinks [13]. Specific mechanisms implicated in nutrient trapping and patch concentration depend on the plant species involved; site factors such as wind, transport by gravity, runoff, animals, and rain or fog interception can also influence soil enrichment under plants. Fertility islands usually attain greatest development under older individuals, in surficial soil horizons, and in stable rather than geomorphically disturbed substrates such as mobile sand dunes or active talus slopes [14,35]. Fertility islands may develop quickly. Zinke [36] found distinct soil patterns around a 45-year-old pine in California; significant soil development under conifers in the U.K. occurred in just 50 years [50], and litter and soils under shrubs in Alaska reached steady state after only 110 years [51].

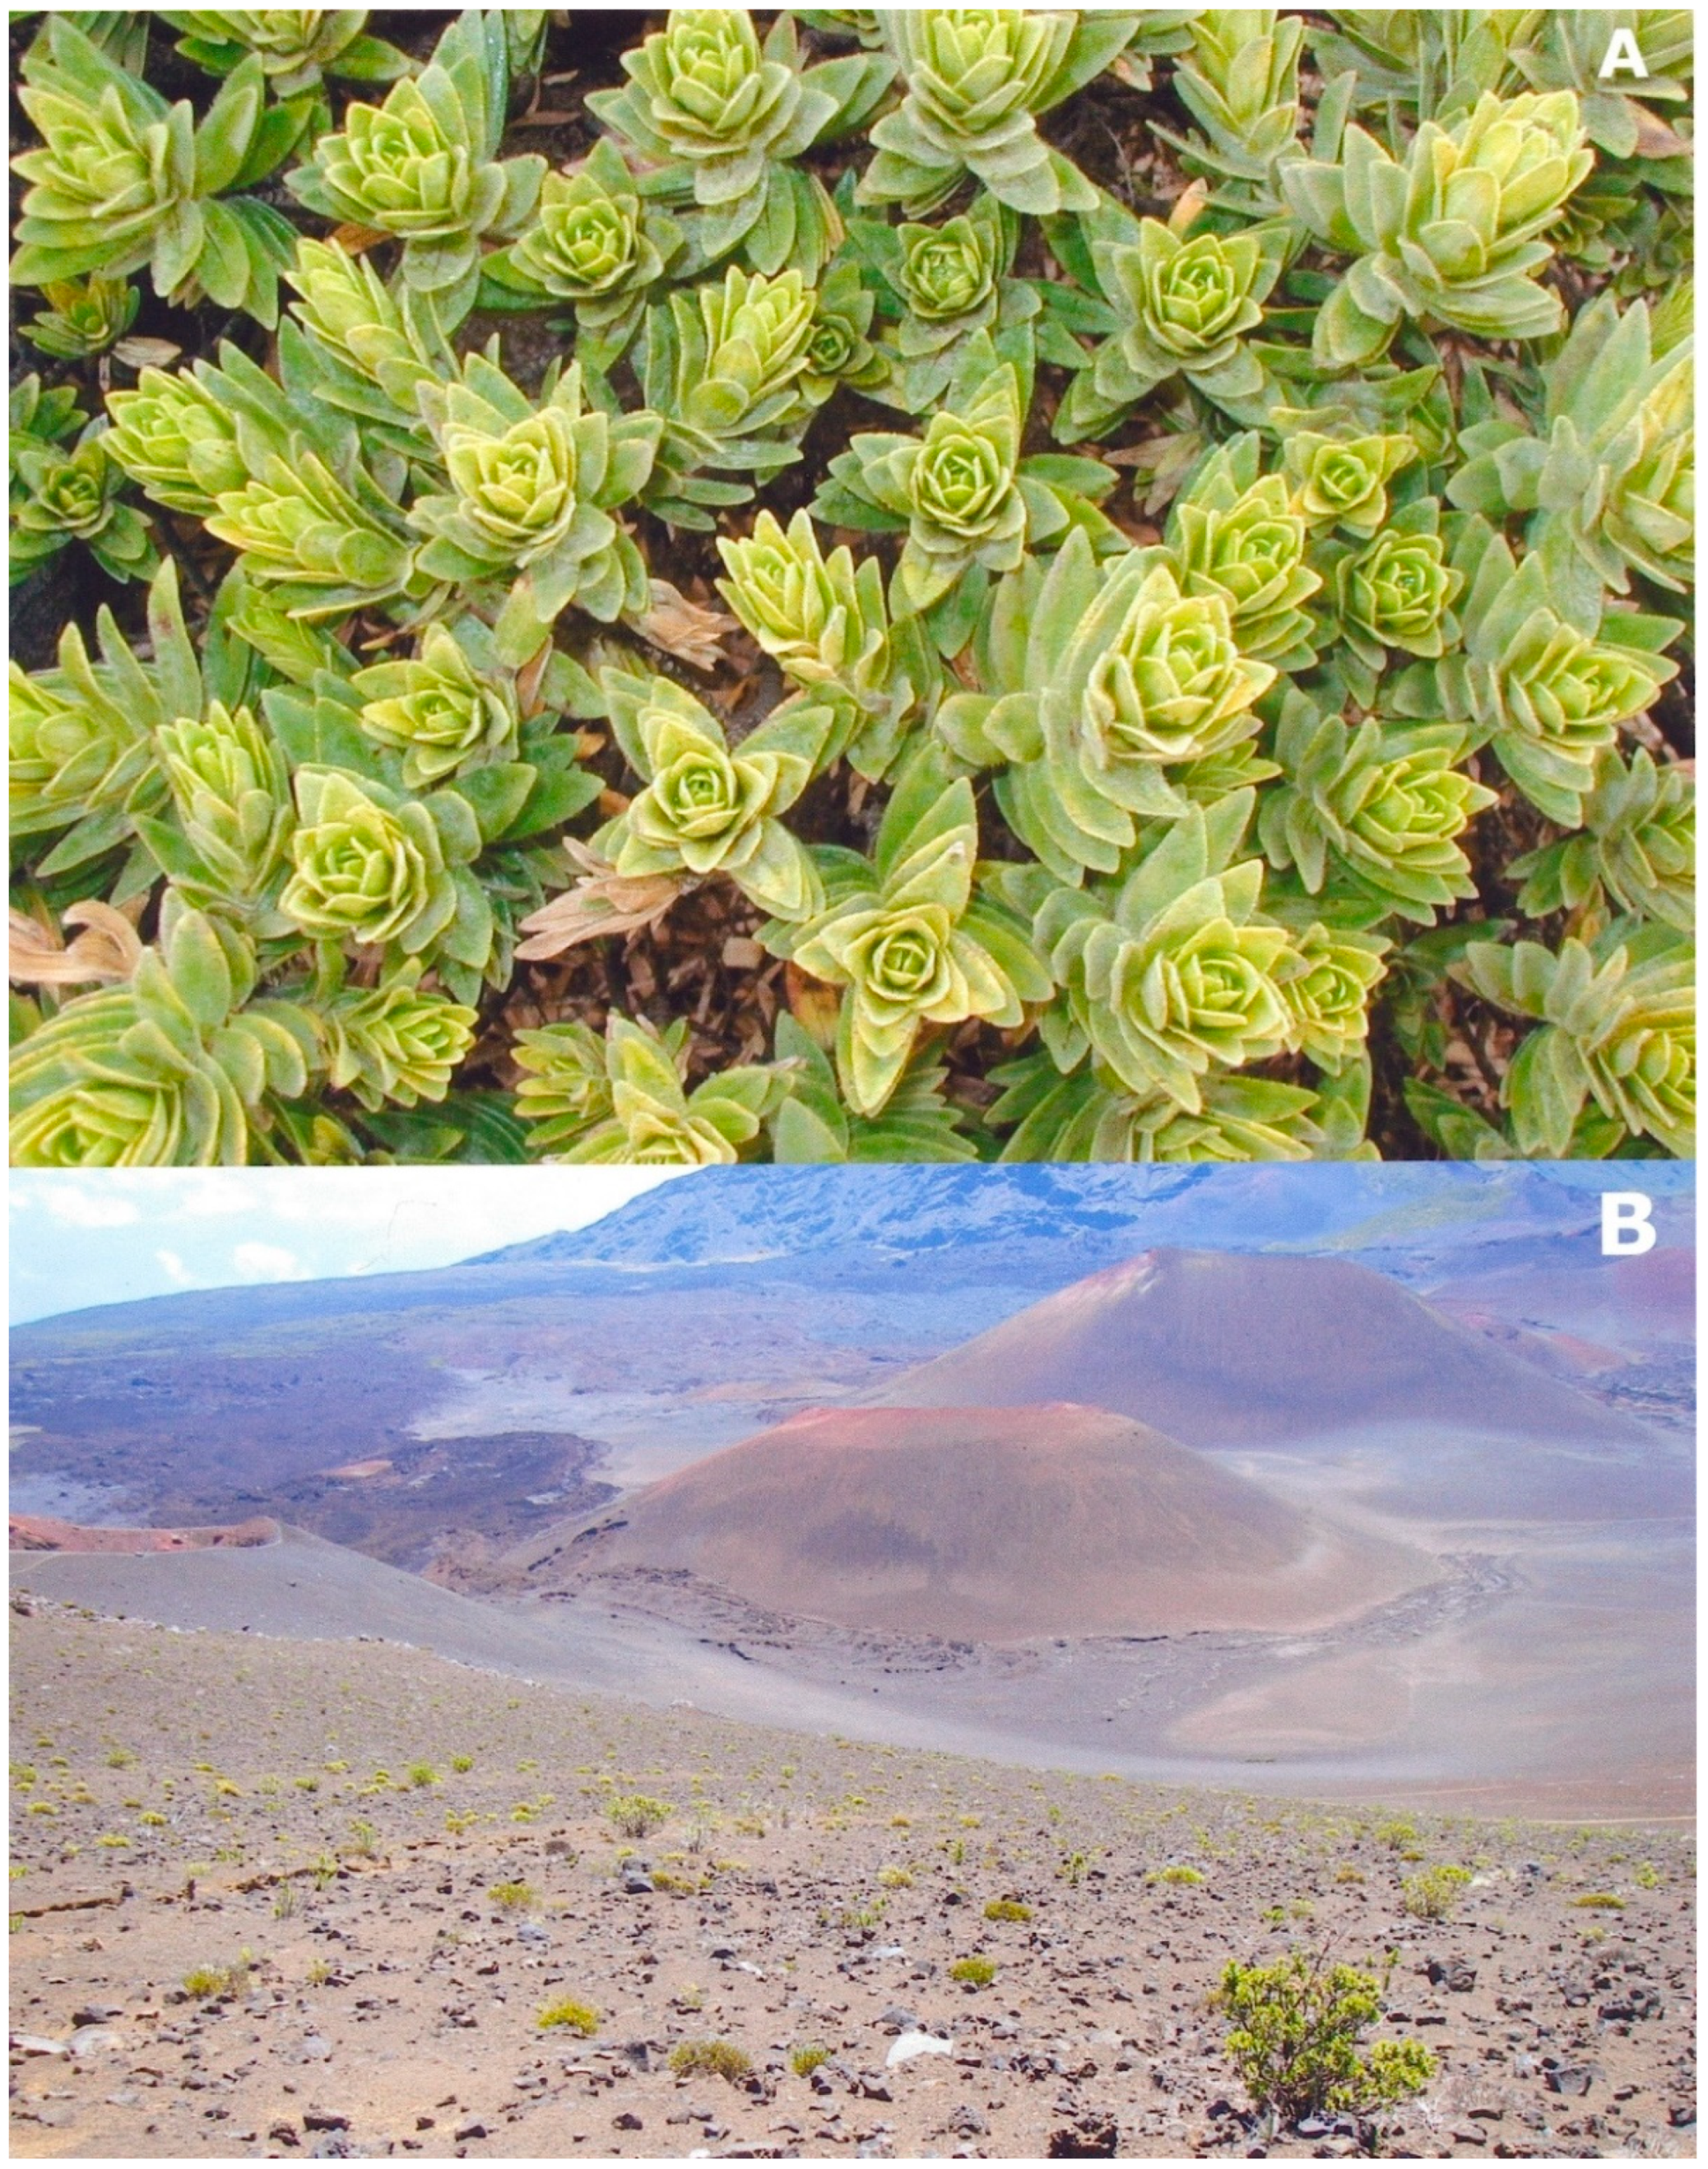
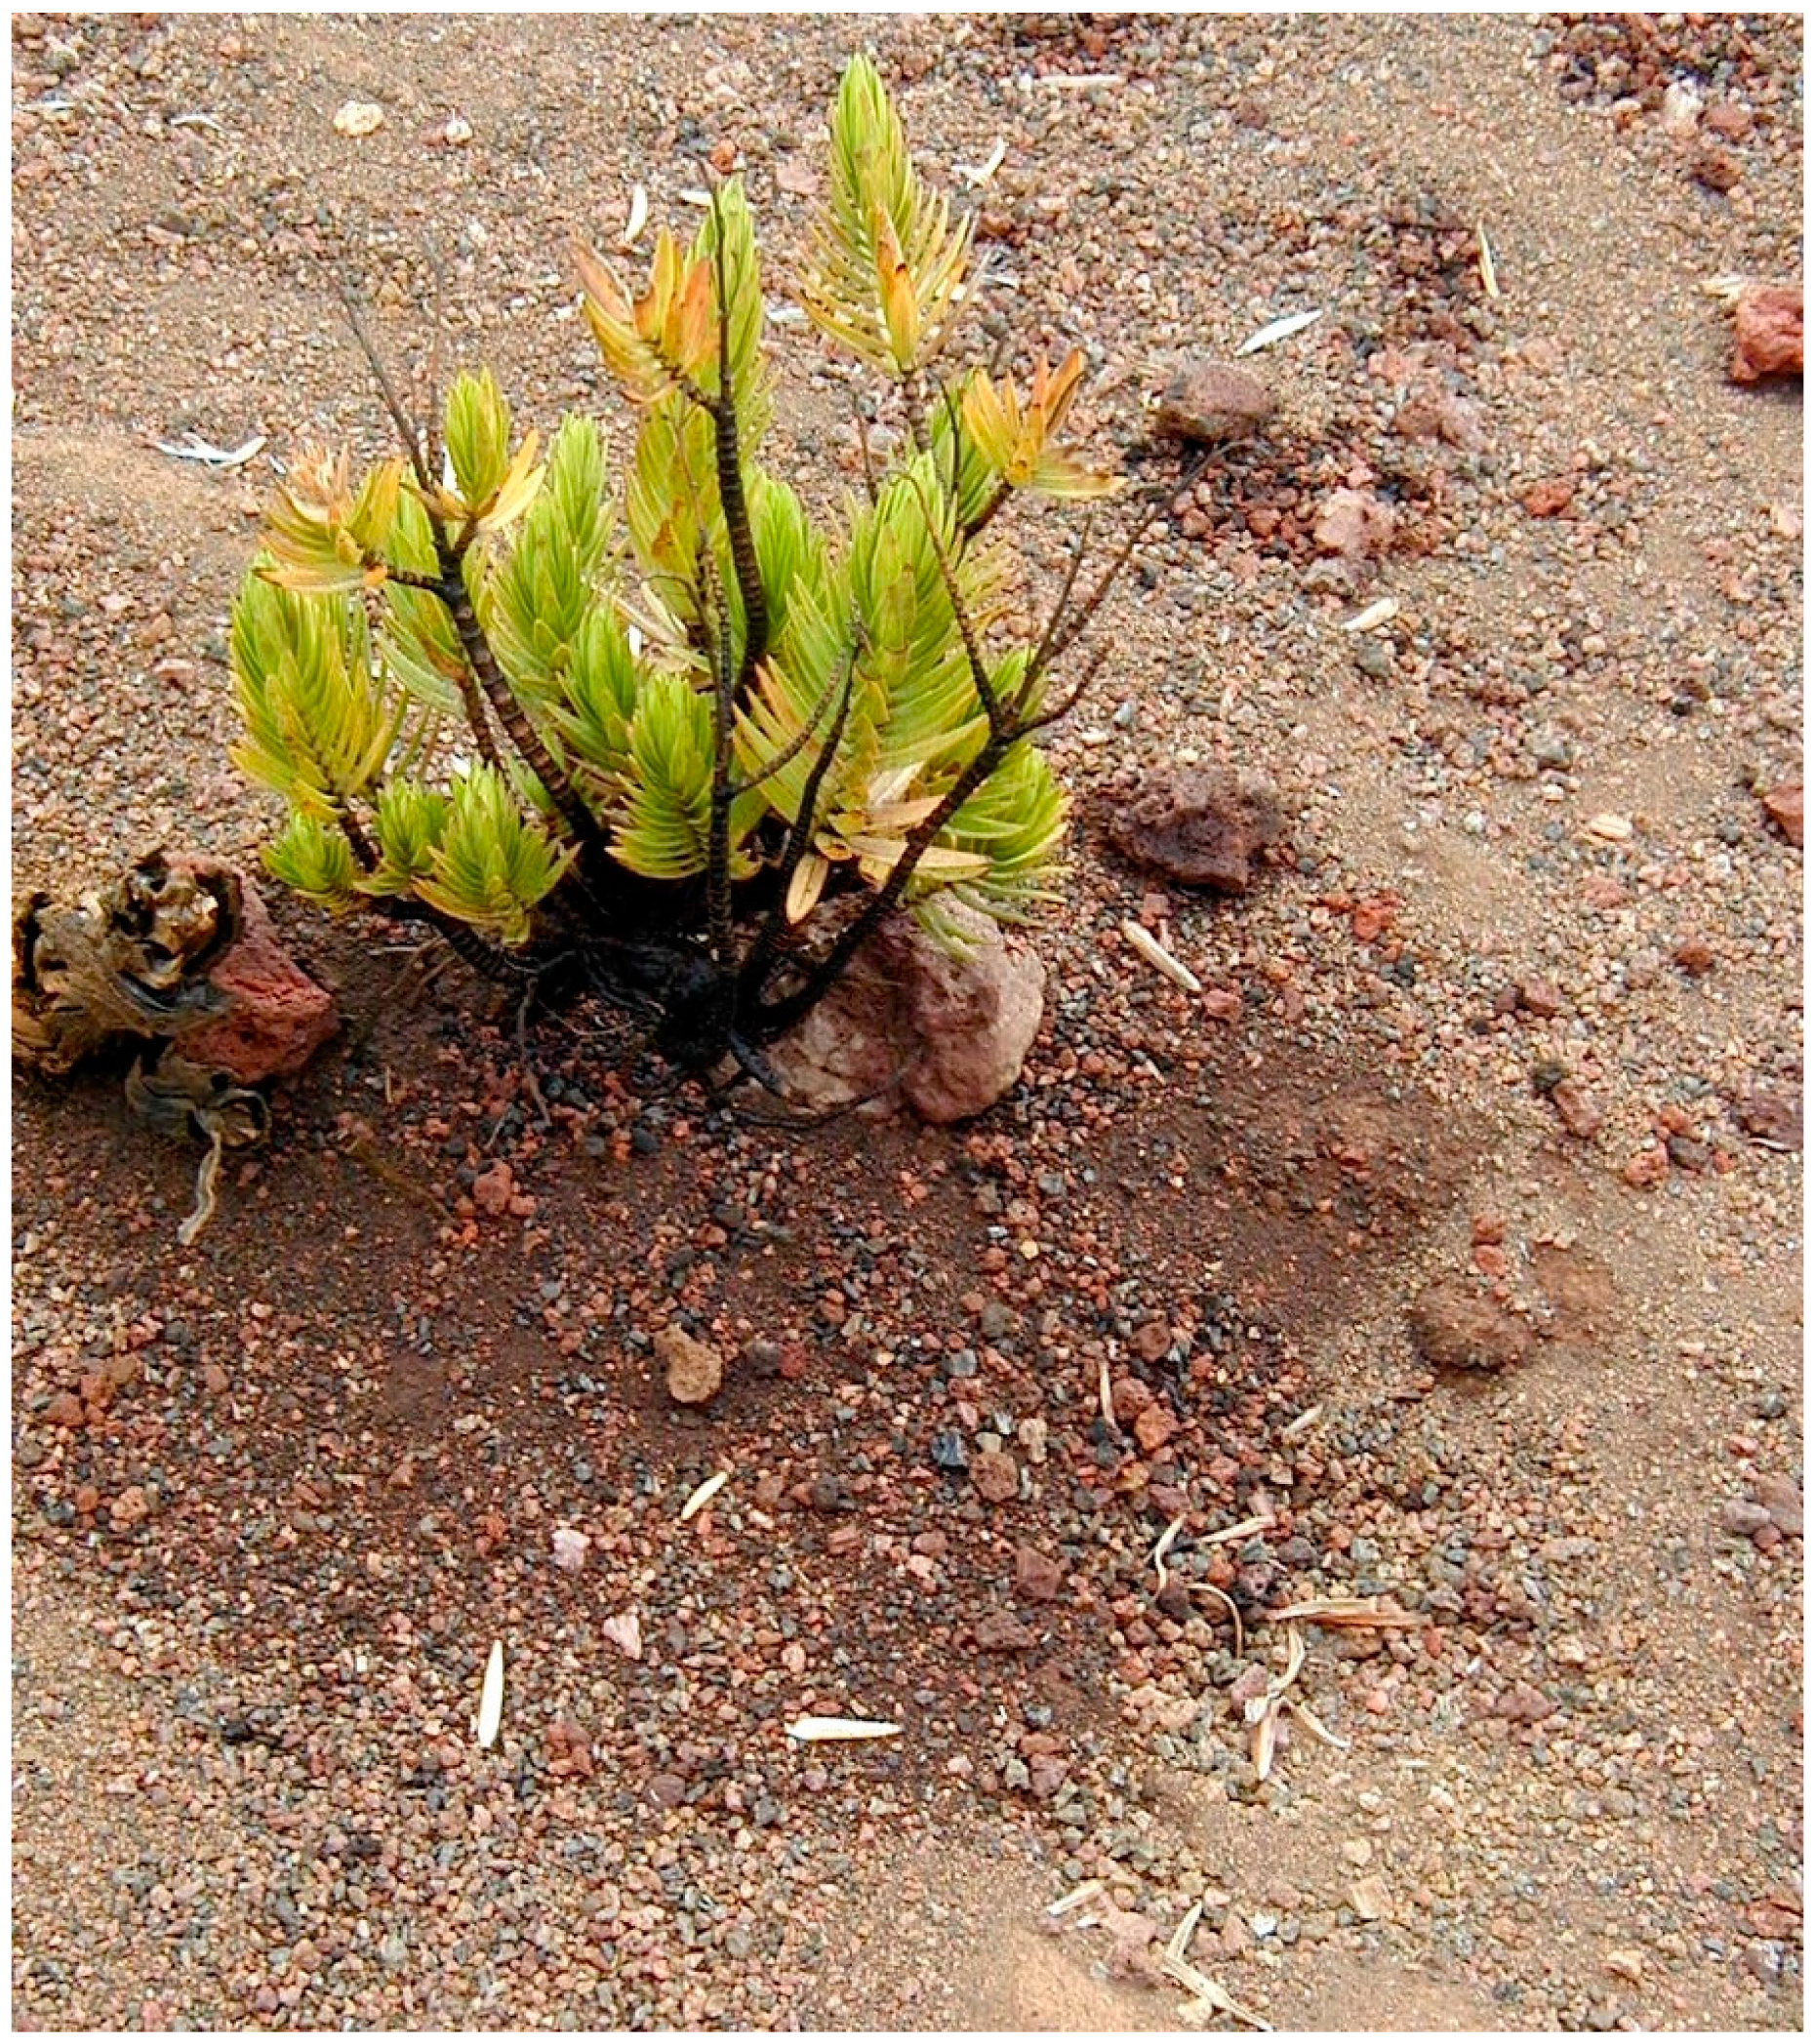
1.2. Study Species: Kūpaoa

Kūpaoa (Dubautia menziesii (A. Gray) D. Keck, Asteraceae) is a woody shrub endemic to East Maui, including Haleakalā National Park (HNP), where it grows profusely between ~1950 m and the summit (3055 m) on dry, exposed slopes littered with different pyroclastic materials. Kūpaoa is worthy of attention for several reasons, including its sheer abundance. This shrub is, by far, the most widespread species in the sparse Haleakalā scrubland, where it is practically ubiquitous [52]; shrub populations are extensive and number in the thousands [53], with a mean density of ~500–575 plants/Ha [54]. Based on its distribution, the highest-elevation section of Maui is classified as the ‘Dubautia menziesii vegetation unit’ [55].
As shrubs grow, they attain a substantial size and produce abundant biomass; adult plants reach ~2.5-m height and develop an exceptionally dense foliage (Figure 1B); the 2–5-cm-long, lanceolate leaves are opposite or alternate, and imbricate. Elastic tissue properties allow kūpaoa to maintain cell turgor as tissue water content decreases [56], hence it tolerates conditions of extremely low soil water availability. Such morphological and physiological traits allow D. menziesii to successfully colonize harsh, dry volcanic substrates in highland Maui [57]. Kūpaoa populations consist of isolated individuals randomly dispersed across slopes, separated by long intervening barren spaces with no evident spatial aggregation (Figure 1B). D. menziesii grows on areas with an assortment of tephra, cinder, and boulders; these last influence slope processes, and kūpaoa takes advantage of the stable shelters that rocks provide [58].
Another ecologically important and common plant at Haleakalā is the silversword (Argyroxiphium sandwicense), a spectacular ‘giant’ rosette that has a single, ~8-cm-thick, 60–75-cm-high stem, which ends in a dense crown of narrow, pubescent, shiny leaves. The pedological effects of silverswords have been previously described [59] and will be compared with those of kūpaoa shrubs.

1.3. Study Objectives
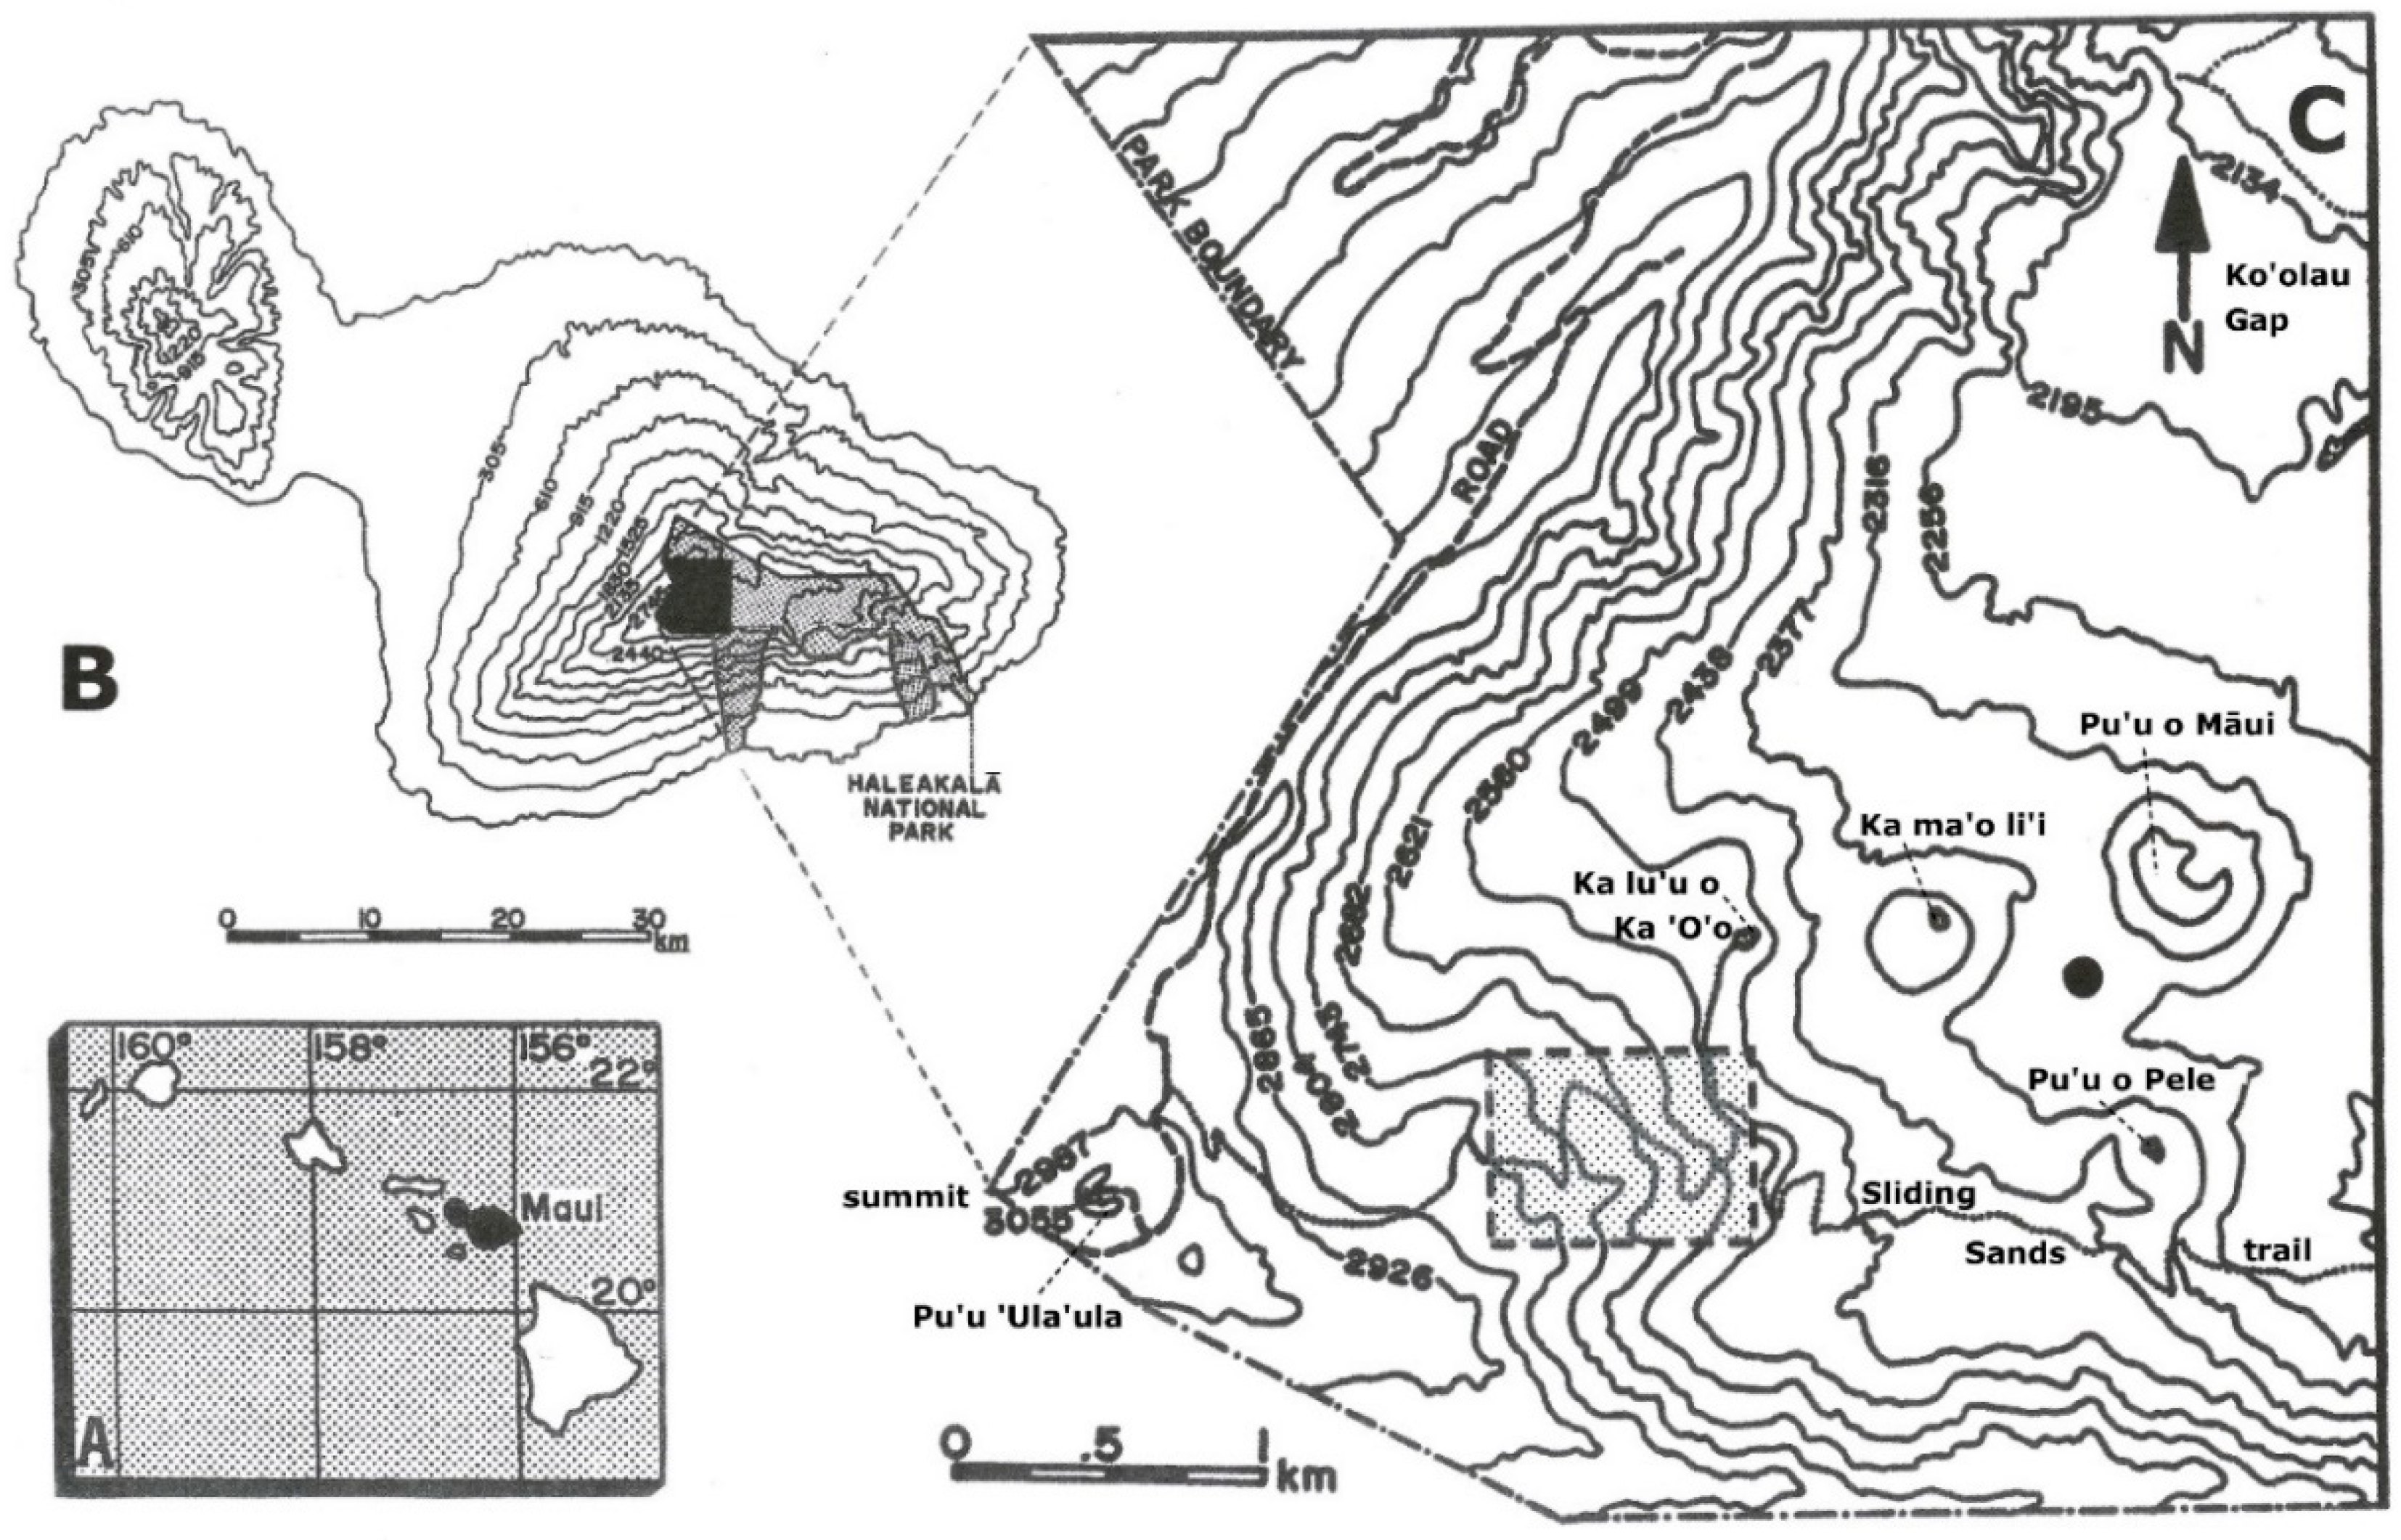
This study focuses on various pedological effects associated with kūpaoa shrubs in HNP at 2610–2710 m asl. The main goals were to: (i) Determine the physical characteristics of shrubs and litter islands (LIs) that develop below them; (ii) analyze chemical and physical properties of leaf-litter collected from these patches; (iii) measure the physical strength and other attributes of an aggregated soil crust horizon that forms beneath litter; (iv) compare physical and chemical properties of surface soils under D. menziesii with those from adjacent, bare soils devoid of plant cover; (v) examine representative soil profiles on two paired locations, and to assess the extent of soil modification with depth; (vi) contrast litter and soil characteristics found underneath kūpaoa with those associated with silverswords in HNP; and (vii) evaluate other environmental modifications by kūpaoa that may affect soil development.

2. Study Area

2.1. Physical Setting and Climate

Maui is at 20°50′ N, 156°20′ W; Haleakalā is an active 3055-m-tall shield volcano that forms the eastern island section (Figure 2); the ‘crater’, a large depression ~12 × 4 km and ≥900 m deep, occupies the summit. This erosion caldera formed when two streams enlarged their upper basins on opposite mountain flanks; as the valleys expanded through the Ko’olau Gap (N) (Figure 1B) and the Kau-pō Gap (S), they merged and created a vast summit depression [60], starting ~0.23–0.15 Ma. Dating of lava flows overlying mudflow deposits indicates this depression was well developed by ~0.12 Ma [61].
The climate of Maui is strongly affected by the NE trade winds, which interact with aspect and orographic effects to produce spatially variable precipitation; windward Haleakalā slopes get >9500 mm, whereas leeward flanks receive <500 mm. Rainfall decreases toward western crater areas where values may surpass 1000 mm/year [62]. Upper elevations experience strong seasonal drought, as they remain isolated from marine air masses due to a subsidence inversion level that develops ~70% of the time at 1200–2400 m [63]. High peaks pierce this inversion layer and suppress upward circulation, forcing trade winds to separate into lateral currents flowing around mountains; an arid zone with clear, cloud-free skies extends above this inversion layer [64], where air can be extremely dry. Relative humidity, normally <40%, may then reach 5–10% [65,66]. Moist oceanic air masses, propelled upslope by trade winds, may periodically invade the crater through the Ko’olau Gap, bringing much rain and fog (Figure 1B). Average air temperature is 9.6–13.4 °C, but this narrow yearly range is coupled with wide diurnal fluctuations (~24 °C) [65]. Freezing may occur any time of the year in the crater, where 121–187 freeze–thaw nightly cycles/year occur at the soil surface [67]. Air maxima peak at ~33 °C, but bare soils frequently exceed 50 °C [68]; I have measured midday highs of 51–56 °C at 2510 m [54], and temperatures ≥60 °C are often reached on dark-colored cinder [69].

2.2. Soils at Haleakalā Crater and the Study Site

Soils at the study site have recently developed from pyroclastic materials, mainly coarse cinder and tephra. They have a substantial gravel content (≤92%); the soil fraction has ~90–98% sand, ~2–10% silt, a negligible clay content, and low (1–2%) organic matter [35]. This structure provides low coherence, and loose soils remain unstable, prone to sliding even on gentle gradients; the name of the hiking path crossing the study site—Sliding Sands trail (SSt)—highlights the proclivity of soils for geomorphic instability. Several profiles in the crater at 2175–2725 m [59,70] evince Inceptisols (Typic, Lithic, Andic Lithic, and Aridic Lithic Haplustepts) and Andisols (Typic Haplustands) with andic properties, developed on heterogeneous pyroclastic deposits [71]. Multiple thin, finely grained subsurface horizons indicate volcanic sediments were reworked by post-depositional geomorphic events like pellicular mudflows, and rainwater or snowmelt runoff [59]. Cinder cones nearby were recently active, triggering a sequence of volcanic eruptions and subsequent vegetation colonization. Pu’u o Māui (Figure 2C) last erupted ~2700 BP, when ashfall deposits and lava flows covered much of the crater; later explosions at Ka lu’u o Ka ‘O’o and Halāli’i cones contributed additional ashfall deposits from 970 to 940 BP [72,73]. Several profiles at ~2175 m exhibit deep, buried horizons with high SOM and fine-grain percentages, suggesting successive waves of plant invasion took place after pyroclastic events [70]. As these cinder cones lie upwind ≤0.5–1 km from the research site (Figure 2C), this probably was extensively affected by deposition of pyroclastic debris, transported by NE trade winds, during the last millennium.

3. Materials and Methods

3.1. Field Sampling and Observations

Fieldwork was conducted during eight summer seasons between 1998 and 2014; all soil and litter sampling took place in 2005. The largest shrubs sampled in kūpaoa populations [58] near the SSt at ~2610–2710 m were selected for this study. Plant data obtained include height (h) from the stem base to the shrub highest point, and plant diameter—the longest measure covered by foliage—along two orthogonal directions: Width (w) across the slope, and length (l) downslope [53,74]. Elevation was determined for each plant with ThommenTm altimeter (probable error ±10 m), slope with clinometer; wind speed was measured with a hand-held anemometer.
Twenty litter islands [43] developed under shrubs were inspected with great circumspection; island width and length were measured (Figure 3). Thickness of litter horizon above mineral soil was determined to the closest mm with vernier caliper ~10–15 cm downslope from the stem; litter was gathered with a trowel [75]. A thin, moderately stable soil horizon—henceforth designated as crust—was found beneath the organic litter; thickness, spatial continuity, and shear strength of this aggregated crust were gingerly evaluated. After gently brushing litter aside, shear strength was measured ~10–15 cm downslope from the stem of 50 shrubs by a SincoTm pocket torvane with 3 vane sizes covering a 0–1000 g/cm2 stress sensitivity range [76]. Vane blades were inserted ∼5 mm vertically into the ground, and a gradual torque applied by constant vertical pressure until shear failure occurred, commonly in ≤10 sec. Unconfined soil compressive strength was also measured perpendicularly to the soil surface with a SoiltestTm hand-held pocket penetrometer equipped with foot adaptor responsive to low compressibility [77]. Whenever instruments encountered pebbles or roots, readings were discarded and repeated [78]. Paired shear strength and compressibility data were gathered on 50 adjacent bare soils ~150–200 cm away from shrubs and ≥30 cm from the edge of any surface rocks, as soils downslope of boulders, sheltered from slope geomorphic processes, are significantly more stable [58].
Soil samples—including the surface crust, if present—were collected from the upper ~10 cm; presence of coarse cinder and abundant tephra fragments precluded core sampling; this prevented determination of field bulk density. Samples of ~200 cm3 excluding pebbles were gathered with a trowel ~10–15 cm downslope from shrub stems; a paired set of samples (control) was collected ~150–200 cm from shrubs—well outside the canopy—on bare soil, devoid of litter or any plant cover. Two paired soil profiles were excavated at ~2705 m; one profile was below a 110-cm-high, 160-cm-wide solitary kūpaoa, the adjacent one was on exposed soil ~200 cm away from the canopy edge. Horizon sampling followed similar procedures as for surface samples; profile descriptions follow USA Comprehensive System [71].
Soil infiltration rates were measured under 20 kūpaoa, and on paired control soils ~150–200 cm away, with a portable field infiltrometer [79]; any surface litter was removed, and a slender-walled, 30.5-mm-wide, 15-cm-long stainless-steel cylinder was carefully pressed and rotated into the soil crust—if present—or the topsoil on a clast-free spot to a depth of ~5 cm; 50 cc of water were poured into the cylinder, and infiltration time was determined by stopwatch [80]. Microclimatic influences of kūpaoa on soil temperatures were investigated with three sealed WeathertronicsTm recording thermographs that monitored temperatures continuously between 5 and 11 August 2002. Devices were cross-calibrated prior to fieldwork and rechecked just before installation; empirical tests show measurement error is ±0.5 °C [58]. A thermograph was buried, below the shrub canopy, at −5 cm and ~25 cm away from the stem base of a 125-cm-high, 223-cm-wide, 209-cm-long isolated kūpaoa; a second device was buried at −5 cm in adjacent bare soil ~150 cm away. A third instrument registered air temperature (+10 cm) under a white shelter on bare soil ~200 cm from the plant; air circulated freely around thermal sensors.

3.2. Laboratory and Analytical Techniques

Soil samples were air-dried for 2 months, oven-dried for 48 h at 105 °C, and weighed, then were triturated by hand, and sieved through an 8-mesh sequence (16–2 mm) to sort out all gravel (>2 mm) fractions. Soil particle-size distribution was assessed by sifting the remaining material through an 11-mesh series (1.4–0.038 mm); fine-grain content was analyzed using ASTM-152H hydrometers with distilled water and sodium hexametaphosphate as dispersion agent. Gravel, sand, and fines (≤0.0625 mm, include silt and clay) contents are given as percentages by weight. Median grain size—D50, the 50th percentile diameter—was also calculated [81]. Soil structure and dry consistence follow the USA System [82]; dry colors were assessed with Munsell Color Charts [83]. Water repellency was evaluated with the ‘water drop penetration time’ test, using a >5-sec threshold to separate readily wettable from water-repellent soils or litter [84]. Water retention at field capacity (WRC, −33 kPa) was appraised in 20 untreated subsamples after saturating 30 g of soil—10 g for plant litter—with distilled water in covered, ribbed-glass funnels. Samples were left to equilibrate at 22 ± 1 °C, 60 ± 5% RH (relative humidity) until gravity had removed any ‘excess’ pore water [85]; this point was empirically attained after ~18 h, when samples reached field capacity [35,86]. Water content was gravimetrically determined by oven-drying samples ≥24 h at 105 °C and calculated as a percentage of dry soil (or litter) weight with the formula in Brady and Weil [87].
SOM percentage was analyzed by loss of weight on ignition on dry soil heated at 360 °C overnight, as this temperature does not affect fine-grain content [88]. Active soil and litter pH were measured in a 0.01 M CaCl2 solution. Cation (Ca2+, Mg2+, K+) content was determined after replacement by ammonium acetate (NH4OAc) saturation at pH 7.0 with flame-emission spectrophotometer. Cation-exchange capacity (CEC) was calculated as the sum of cations, based on chemical equivalent weights—plus neutralizable acidity as evaluated by the Woodruff buffer method—and converting ppm to cmol+ kg−1 [89]. Available P was measured by Bray 1 method with ammonium fluoride, HCl, and deionized water. Nitrate (NO3)-N content was assessed with cadmium reduction and ammonium (NH4)-N with phenolate; both were extracted with a 2 M KCl solution and measured with a Lachat Flow Injection AutoanalyzerTM (FIA) [89].
Plant litter was air-dried in paper bags for ~6 months at ~22 °C, ~60% RH, thoroughly cleaned of any pebbles or mineral particles, and oven-dried at 85 °C for 48 h [75]. Subsamples (~18 g) were taken and weighed; ~6 g were carefully ground on a mortar and reserved for chemical analyses; remaining untreated leaf-litter was used for water-retention tests (WRC, −33 kPa). Available Ca2+, Mg2+, and K+ content was analyzed by dry-ashing litter in a muffler at 500 °C for 5 h, dissolving ash in concentrated HCl, and determining nutrient concentration with a Varian Vista MPX ICP-OES; CEC was calculated in the same manner as for soil samples. Total Kjeldahl Nitrogen (TKN) and P (TKP) were appraised after H2SO4 digestion with a Lachat FIA [90].

3.3. Statistical Procedures

All data populations were analyzed with an omnibus test for departure from normality [91] and evaluated using kurtosis and skewness tables [92] to determine if they were normally distributed. Some datasets were accepted as normal, but most were slightly skewed or modestly to extremely platykurtic or leptokurtic [93]; thus, were compared with nonparametric tests, as normality is not a critical condition for such statistics [94]. Two-sample Kolmogorov–Smirnov (K–S) and Mann–Whitney (U) tests were used to contrast datasets and to confirm the hypothesis that cumulative-frequency distributions represented significantly different populations. Statistical associations between site, shrub, litter, and soil parameters were assessed with the non-parametric Spearman’s rank-difference or Kendall’s Tau (τ) correlation coefficients [93]. Presumably due to a broad value spread, combined datasets of paired samples—soils under shrubs plus bare soils—tested as normal (p < 0.05) [92] for Ca2+, Mg2+, K+ contents, CEC, and WRC%. Untransformed SOM distribution showed positive skewness and modest leptokurtosis; as a log10-transformation rendered it normal, the relationship between soil properties above and log10-SOM was analyzed with linear and polynomial regressions. Soil P and N contents were not normally distributed and were assessed with Spearman rank-difference and Kendall’s τ tests. All statistical results were evaluated with critical values in standard tables [95,96].

4. Results

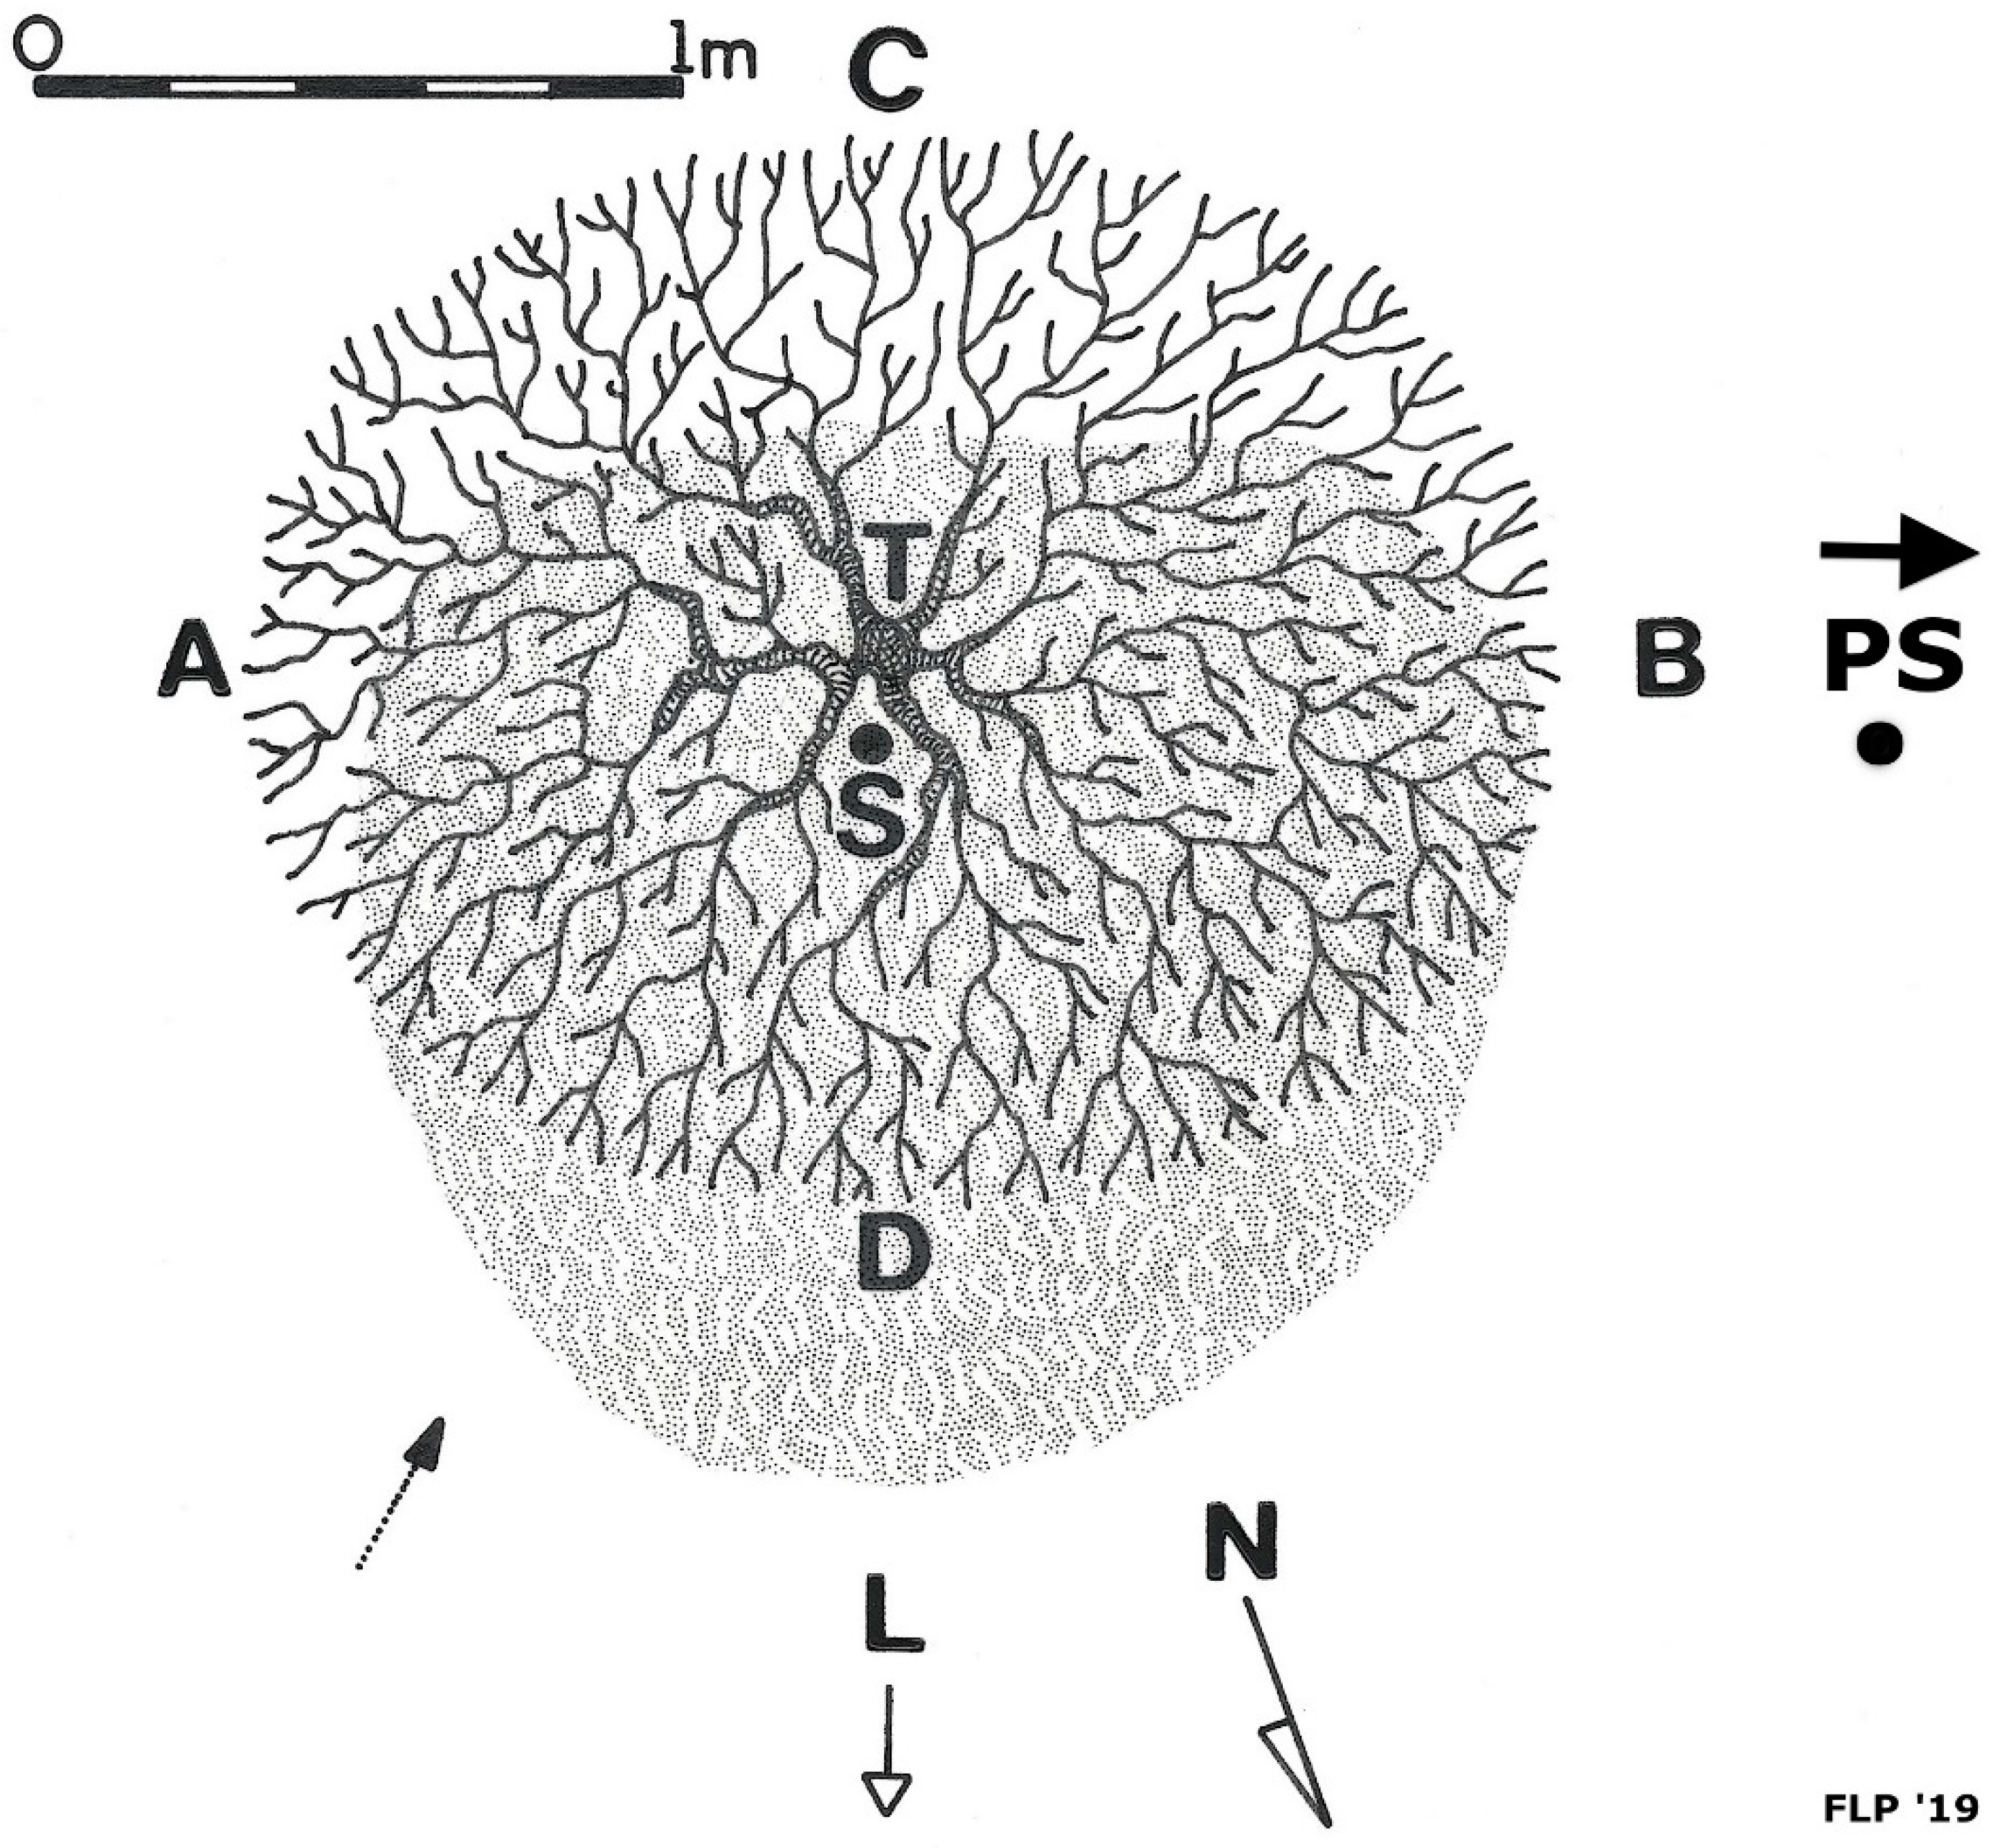
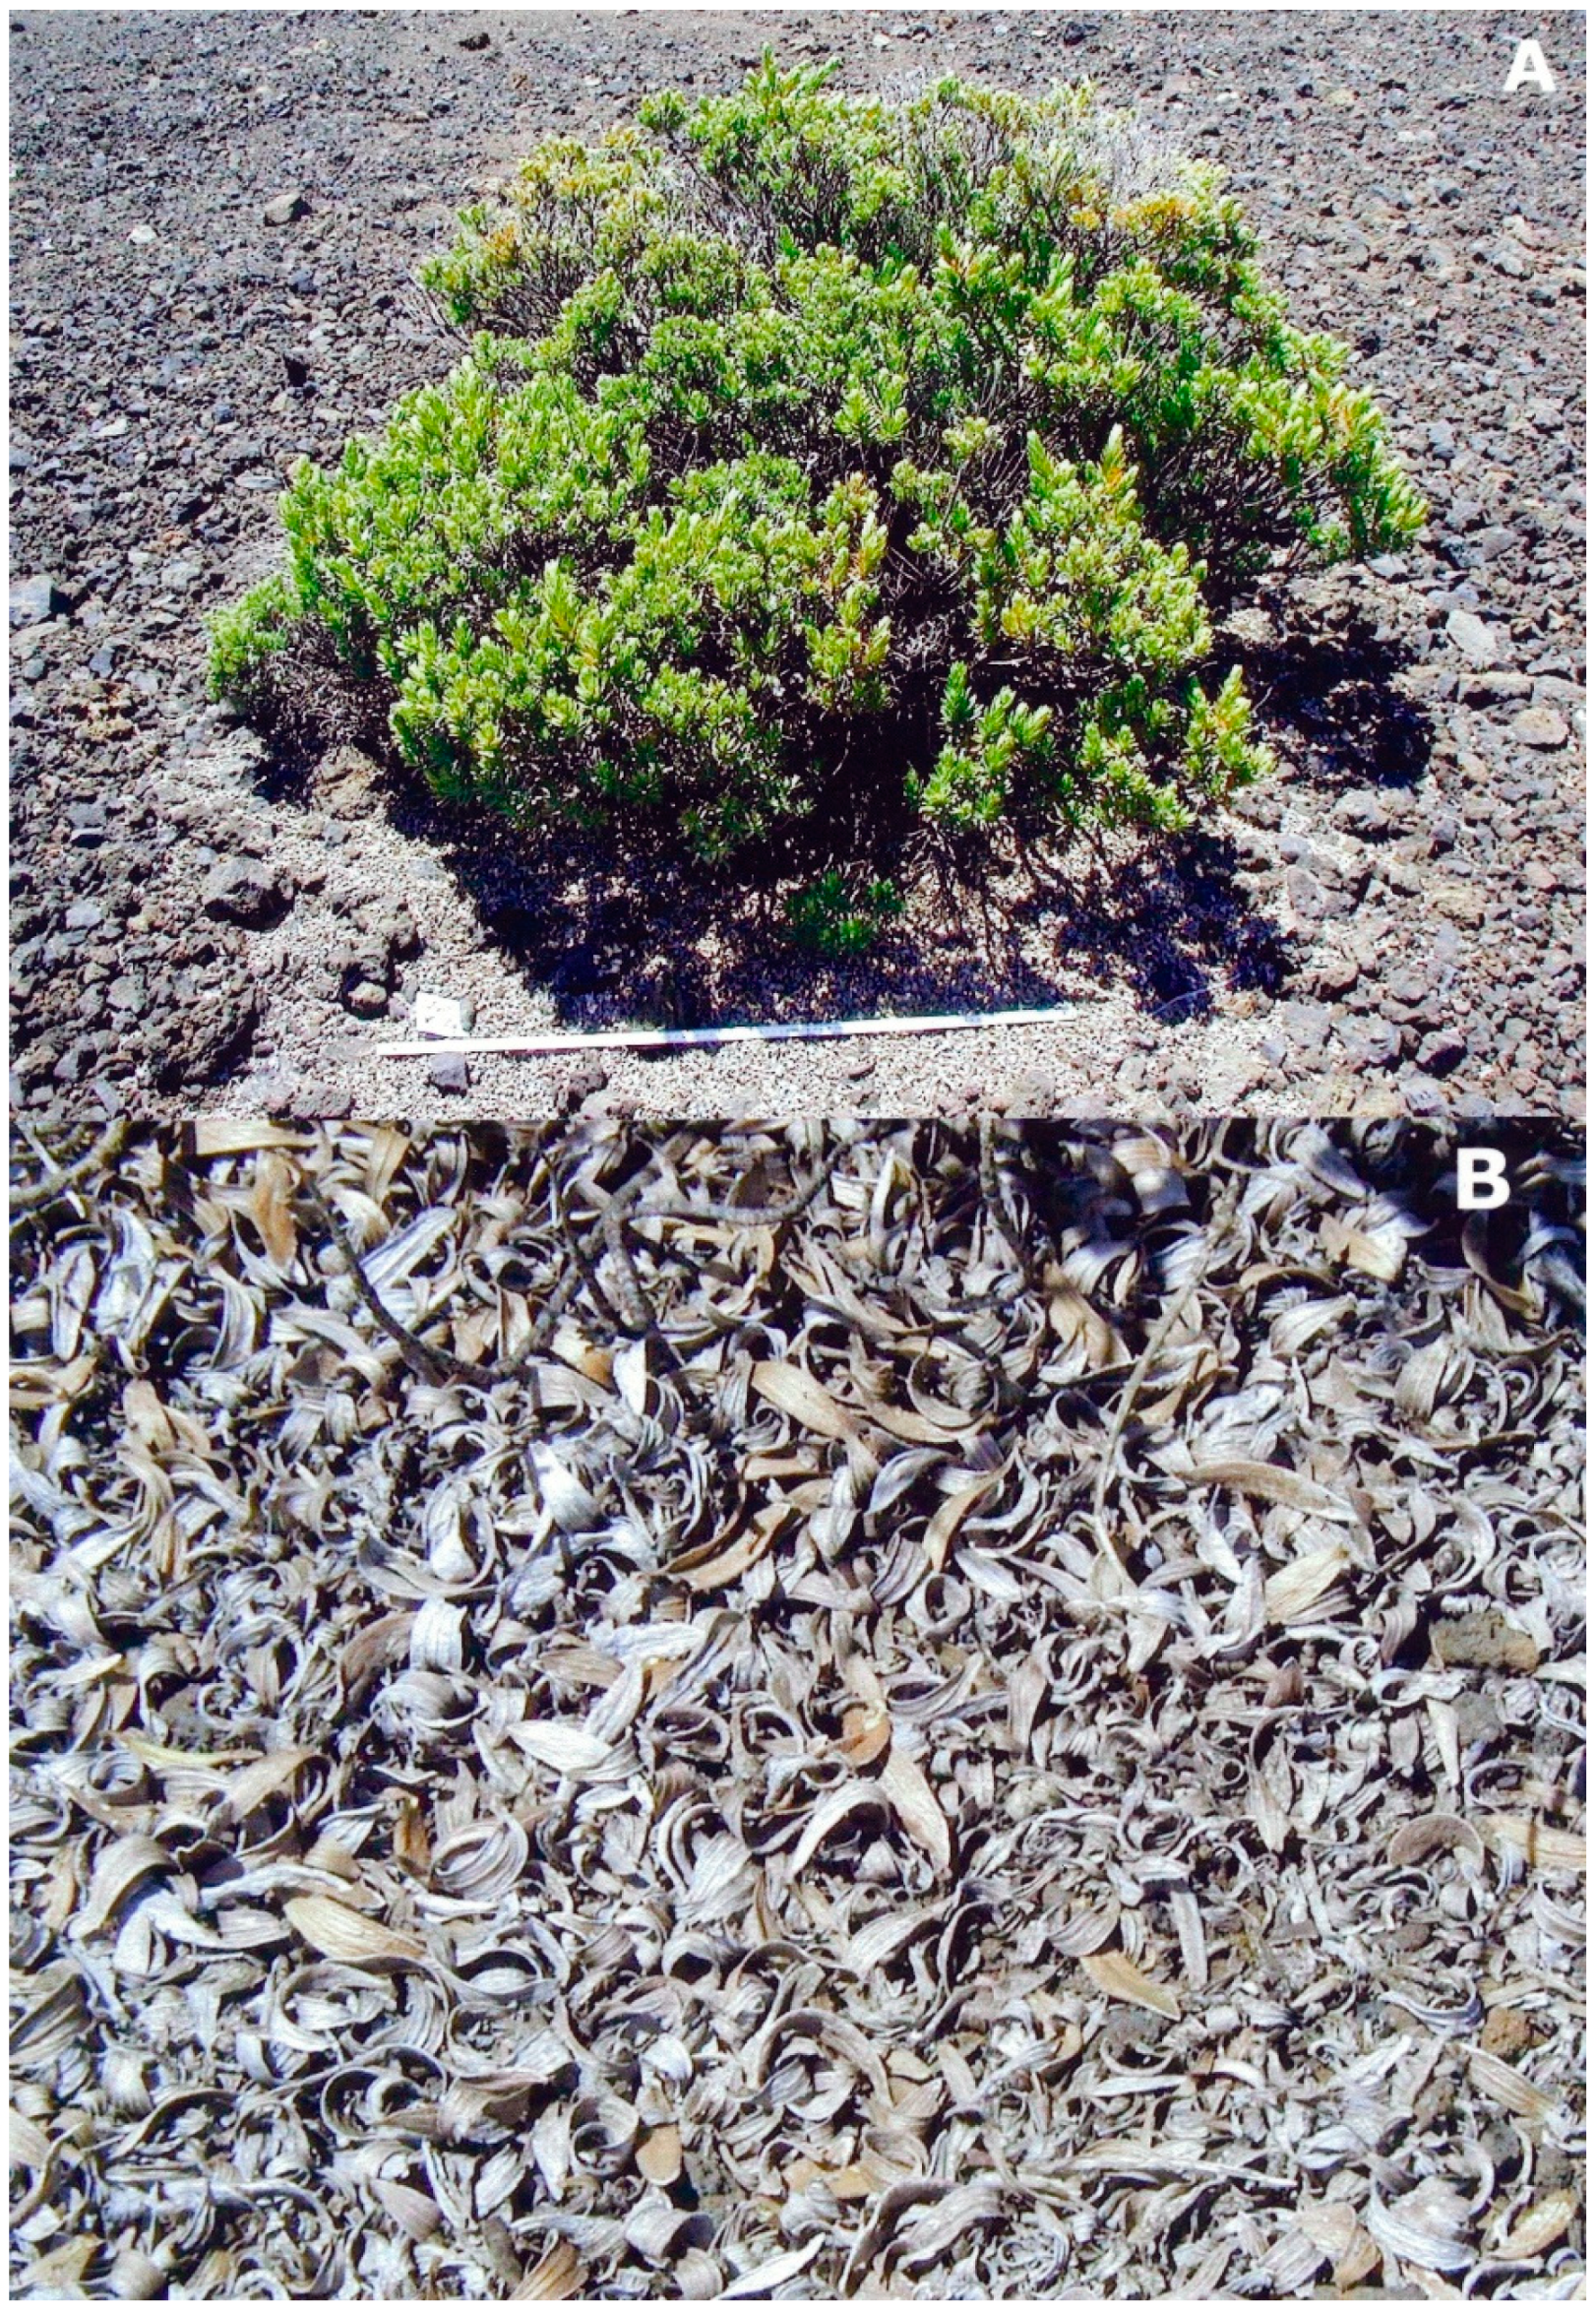
4.1. Litterfall Accumulation under Kūpaoa and Development of Litter Islands

Substantial amounts of light-gray litter—largely leaf material—had accumulated on the ground under the canopy and immediately downhill of individual shrubs; this litter sharply contrasted with the dark-brown to black cinder and tephra prevalent at the site (Figure 4A). Litter island width usually coincided with, or was slightly larger than, plant width; this was particularly noticeable under shrubs with dense foliage and/or extending close to the ground, as the plant canopy helped protect litter from wind removal. In a few exposed locations, litter was actually observed blowing away from island edges; e.g., on 24 July 2005, when trade winds reached gusts of ≥20 mph (~32 km h). Due to this aeolian effect, LIs often extended a bit more on their leeward side.
LIs were asymmetric with respect to shrubs; litter was visibly offset downhill, both upslope and downslope, from kūpaoa. Litter displacement was most obvious downslope of plants, as areas of litter accumulation extended ~15–60 cm beyond the lower canopy edge (Figure 3). LI area was estimated for all locations; the area covered by a kūpaoa shrub has been previously computed multiplying plant width by length [53], but this procedure slightly overestimates cover. As LI shape approximates that of a downslope-elongated ellipse, I calculated litter area as: A = π (w/2) × (l/2). LIs varied from 0.566 to 3.608 m2; average area was 1.917 m2 (Table 1). Downslope displacement was not associated with shrub size (h, l, or w), but was dependent on slope angle. Spearman’s tests showed LI area (ρ (rho): 0.745, Z: 2.236, p < 0.025) and LI length (ρ: 0.624, Z: 1.873, p < 0.05) were both significantly correlated with slope gradient.
Litter thickness near the plant trunk was 22–73 mm, with an average of 41.9 mm (Table 1).
Conservation concerns precluded excessive LI disruption and substrate disturbance, thus spatial variation of LI thickness was not examined in detail; however, careful observations and shallow exploratory digging suggest litter thickness gradually decreases from the shrub trunk to the LI periphery, as previous research on litter islands has shown [32,40,97].

4.2. Physical and Chemical Properties of Kūpaoa Litter

I will examine below the litter/soil horizons from top to bottom. LIs were densely covered by a mostly continuous carpet of macroorganic matter lying on the soil surface [98] The upper, thicker Oi1 section of this organic horizon consisted of a faintly matted, slightly decomposed layer of dry, whole, and mostly unbroken leaves with scarce thin twig fragments [71]; the lower, thinner Oe1 horizon contained a greater percentage of partially fragmented leaves showing slightly higher degree of humification. Litter resembled the mor type, with little mixing between the O horizon and the mineral soil below, separated by a smooth, abrupt boundary [99]. Oi1 litter color varied from 10YR 4/1 (dark gray) to 6/1 or 7/1 (gray to light gray), with some leaves 10YR 5/3 to 6/4 (brown to light yellowish brown) [83] (Figure 4B); the Oe1 horizon, with more decomposed leaves, was darker (10YR 3/1-3/2, very dark gray). Most dry pulverized litter samples were mildly water-repellent, absorbing water in ≤10 s, but some showed high water repellency and needed ≤1 min for complete water absorption [84]. Yet, once repellency was broken, litter stored water efficiently, ~264–399%, with an average water retention of ~310% dry litter weight (Table 2).
Chemical composition of kūpaoa litter shows high N contents, and an abundant supply of bases; the cation complex was dominated by Ca2+ (~82%), followed by Mg2+ (~12%) and K+ (~6%). Cation abundance was associated with high CEC (182.6 cmol+ kg−1); P content was also relatively high (~0.05%) (Table 2).

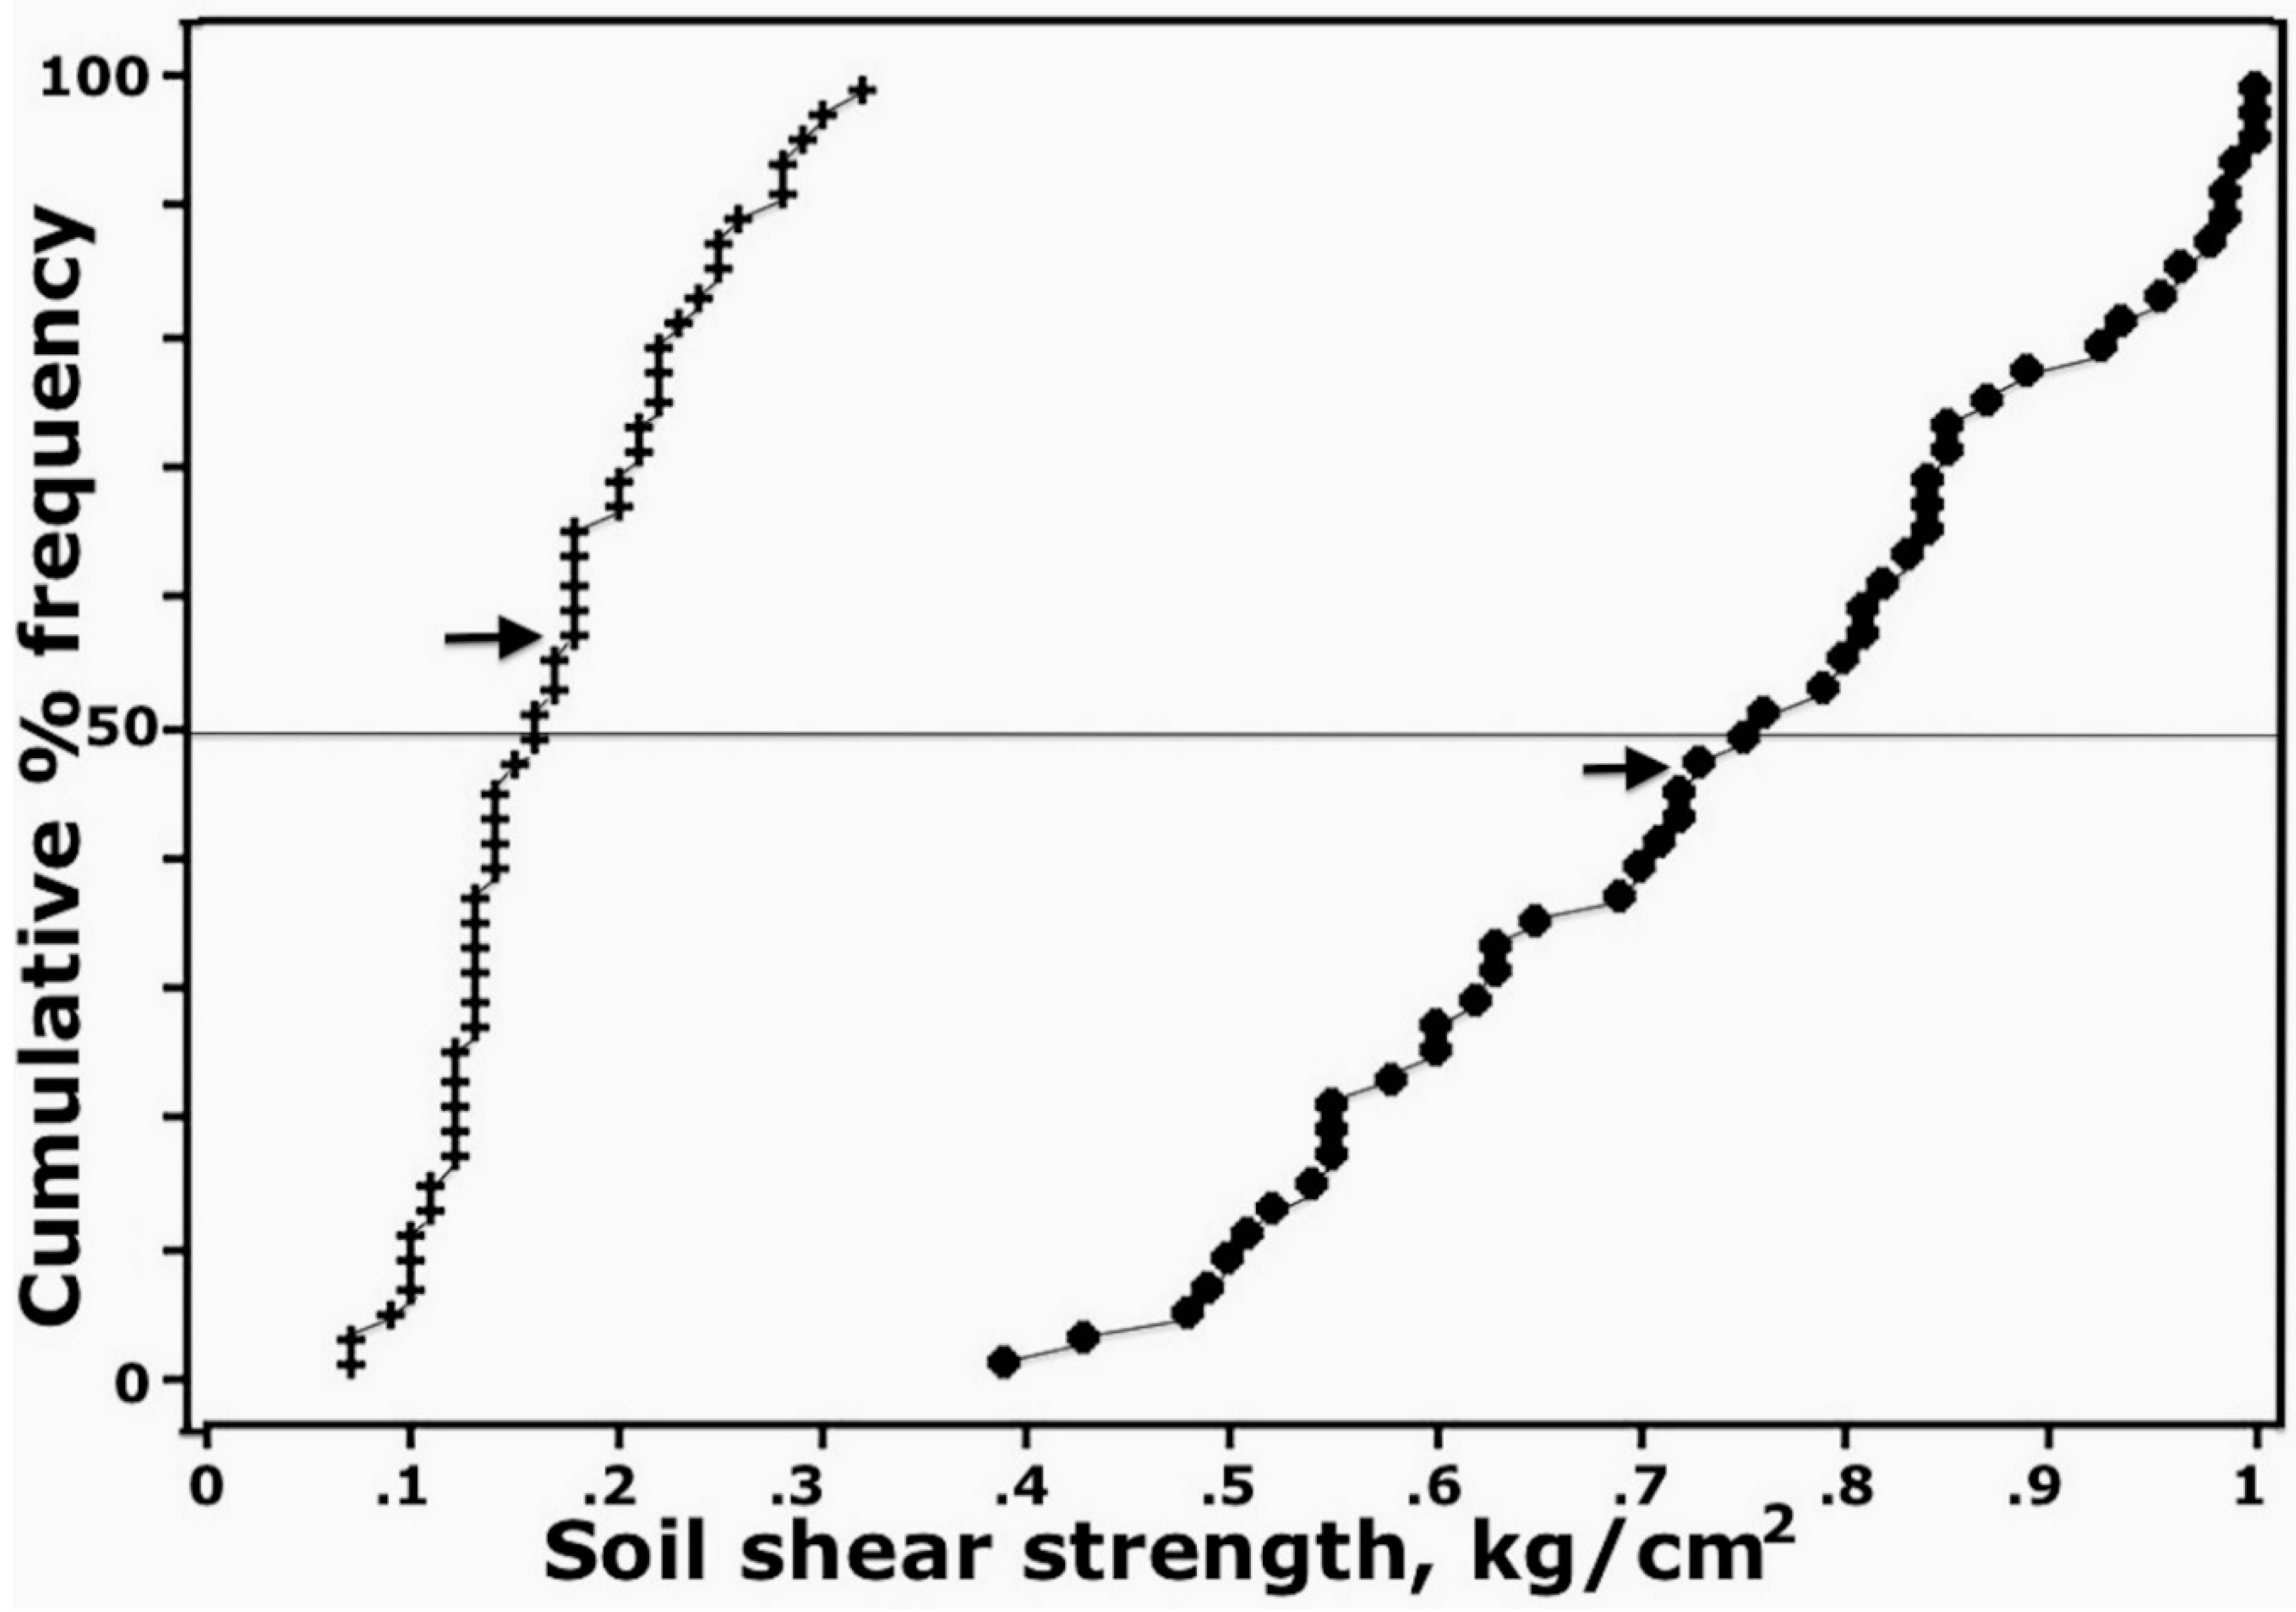
4.3. Physical Strength of Aggregated Surface Crusts

Soils beneath litter showed a cohesive surficial, dark (10YR 2/1, black), brittle crust with moderate aggregate stability and a well-developed platy structure; a few kūpaoa leaves clung to or were embedded in this horizon, but otherwise it was sharply separated and easily detached from the litter above and the soil below. However, this frangible crust readily broke down into fragments ~35–115 mm long and ~5–30 mm thick (Table 2; Figure 5), and crumbled easily, thus undisturbed samples could not be collected. The field strength and spatial continuity of this crust varied widely among the 20 kūpaoa shrubs examined.
Methodical probing showed this horizon was strong to firm below 55% of the plants, where large, cohesive pieces ≤115 mm length could be easily lifted from the ground; 35% of the sites exhibited a weaker, less resistant crust that promptly split into small, ≤40 mm, fragments, but the crust was largely absent below 10% of the shrubs. This horizon seemed more continuous and extensive under larger, and/or with denser foliage, shrubs. K–S tests indicate both the average width (197.3 cm) and height (114.0 cm) of 11 kūpaoa associated with the strongest crusts were significantly greater (χ2: 10.473, p < 0.01 for w; χ2: 7.517, p < 0.05 for h) than in 9 shrubs (w: 132.3 cm, h: 89.2 cm) with either weak or absent crust.
Mean shear strength of 50 control soils was just 0.172 ± 0.063 kg/cm2, whereas crusts under 50 LIs were ~4.3 times more resistant against shear disruption, with an average of 0.747 ± 0.180 kg/cm2; a two-sample K–S goodness of fit test (χ2: 100.0, p < 0.001) showed differences as highly significant. Cumulative-frequency curves for the two datasets (Figure 6) indicate no overlap between readings whatsoever, thus underlining their considerable disparity in erosional detachability. Differences in compressive strength were also pronounced; bare soils showed low penetrometer resistance (0.072 ± 0.031 kg/cm2) compared to soils beneath litter (1.929 ± 0.99 kg/cm2); a K–S test revealed the same statistical significance (χ2: 100.0, p < 0.001). Additional exploratory measurements of shear strength and compressibility (20 each) under two shrubs showed broad spatial variation across LIs. Readings were higher near the stem and LI center, dropping randomly toward the plant periphery; this trend seemed associated with the reduction in crust thickness near the canopy edge.

4.4. Modification of Surface-Soil Characteristics

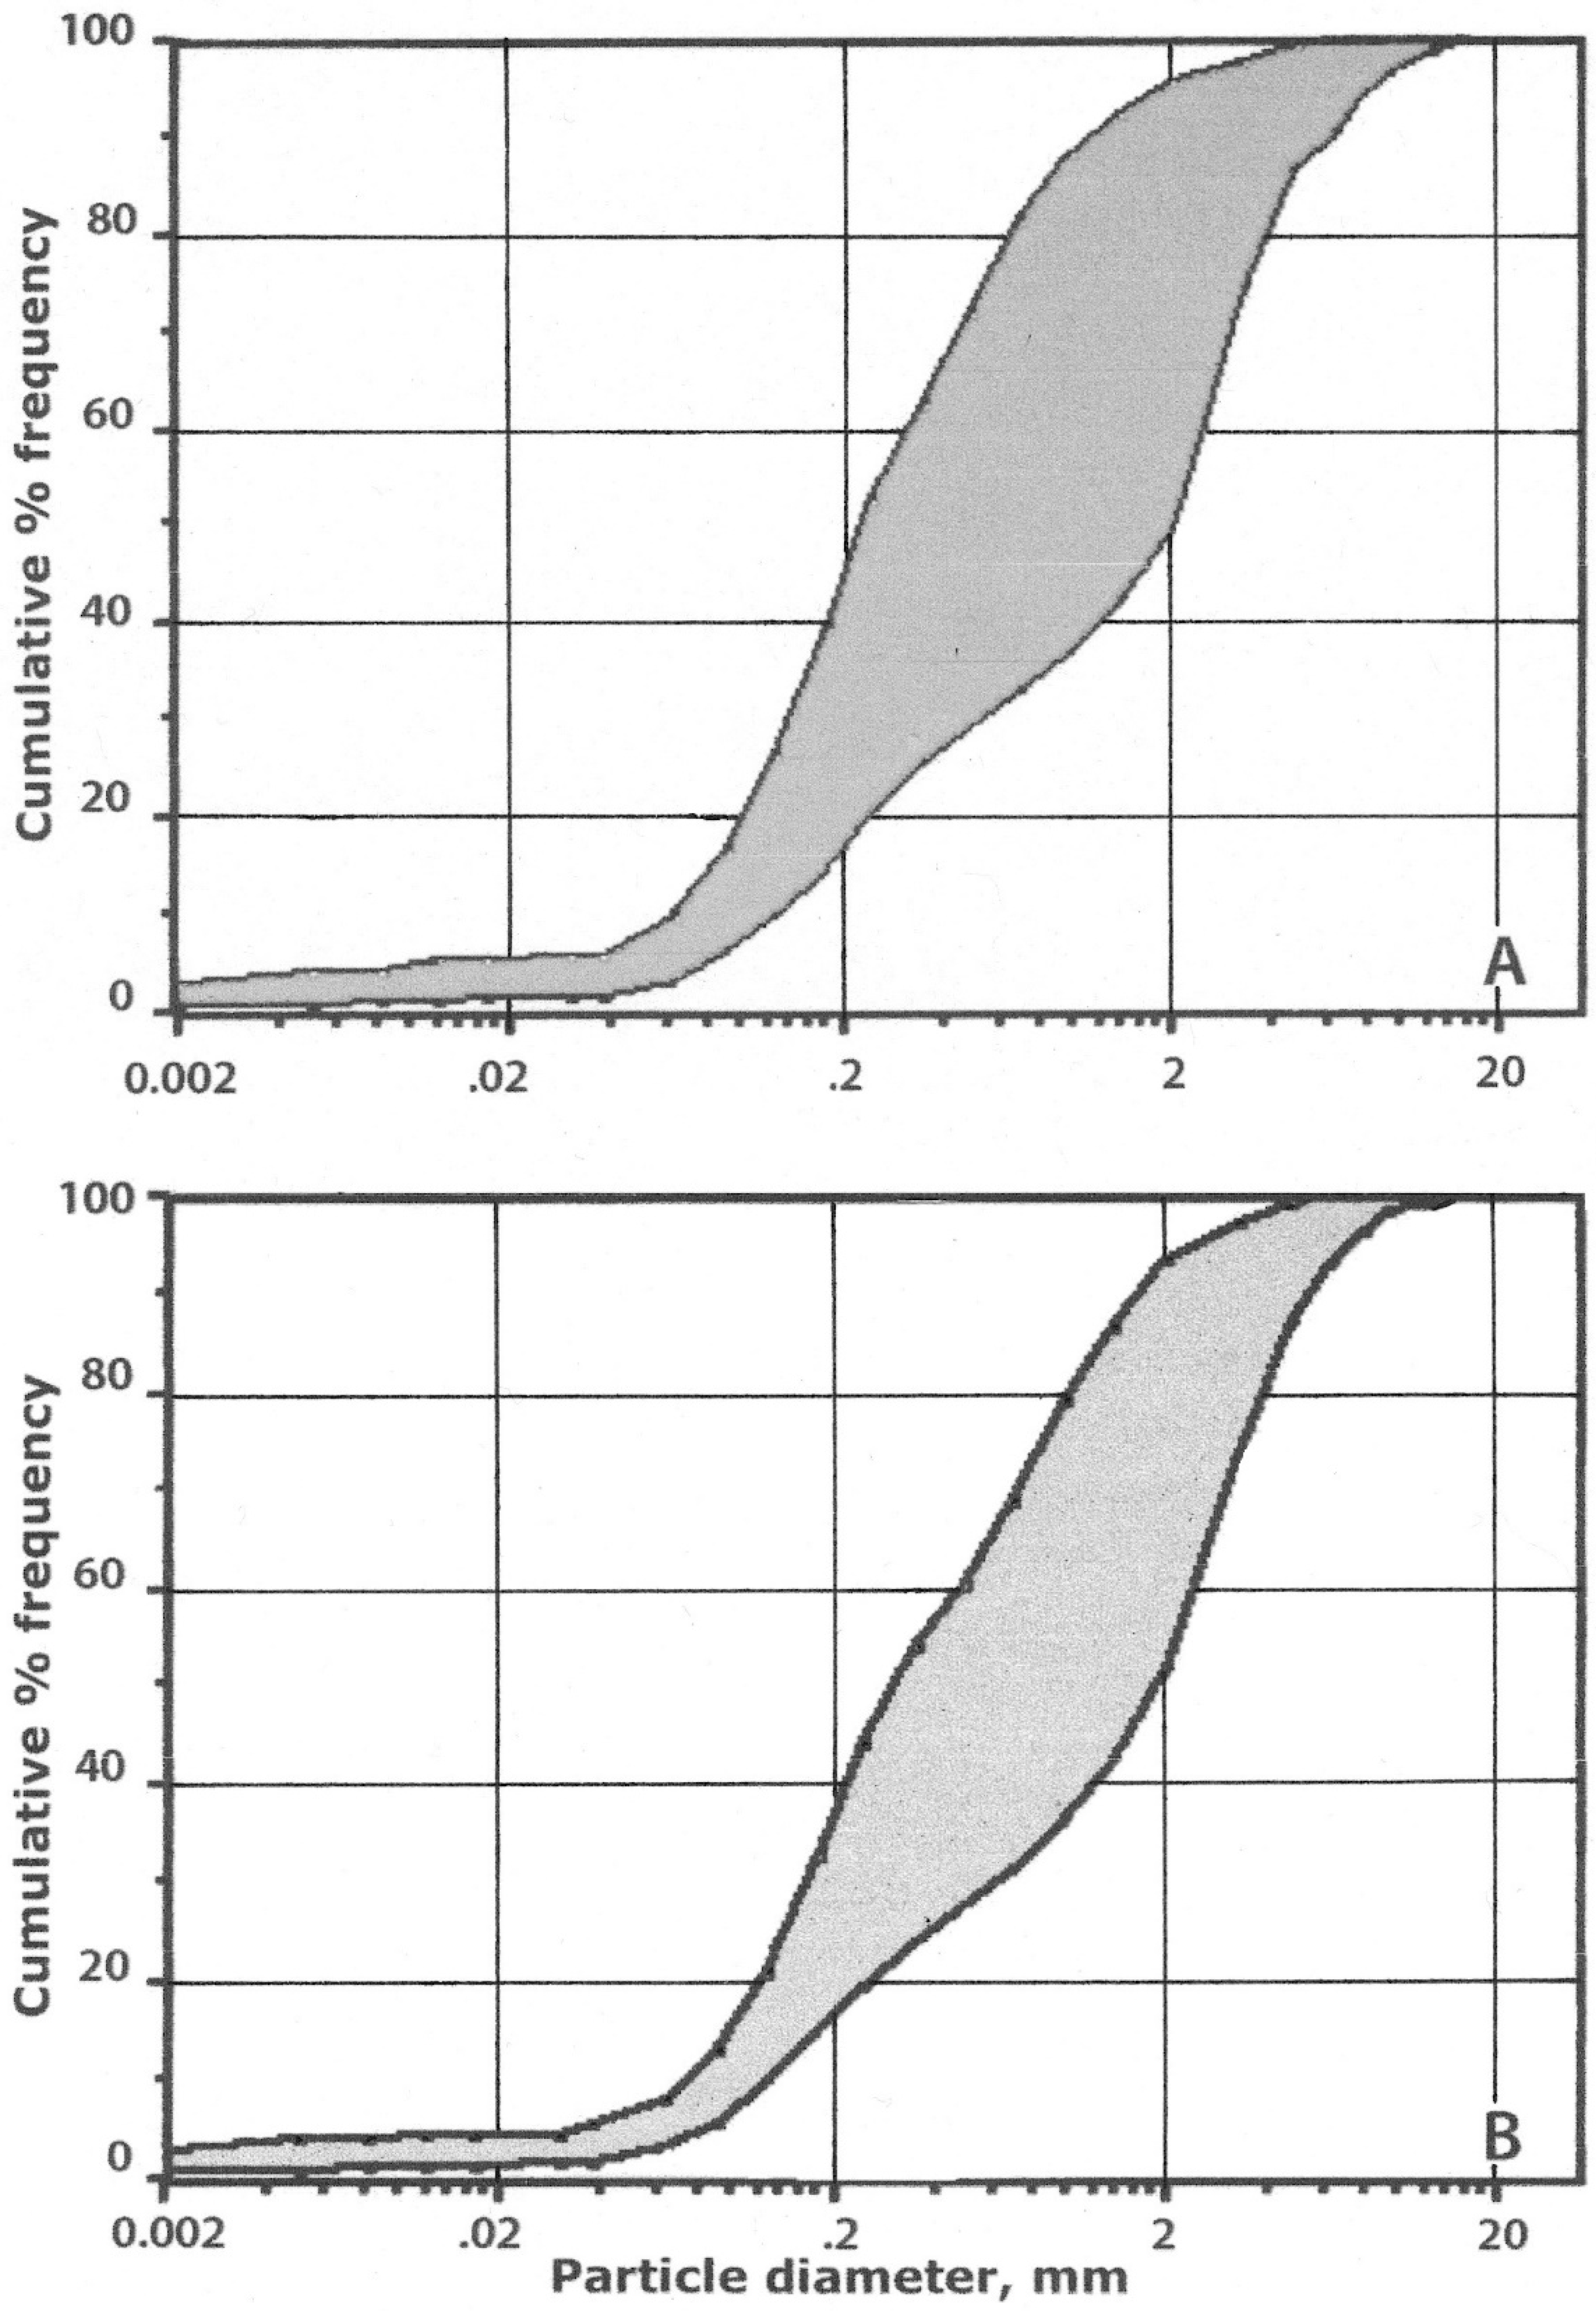
4.4.1. Mineral Particle-Size Distribution

Soil textures on bare areas and under shrubs were anticipated to be similar but were examined to ascertain any property differences between paired datasets—e.g., CEC or WRC—were not caused by textural variation [33,35]. Average gravel content was moderate in both sampling locations, but slightly higher under shrubs than in bare areas (Table 3); although K–S or U tests did not show this to be statistically significant, such difference may reflect a preference of kūpaoa for coarser substrates [54,58].
Both soils were comparably coarse and virtually had the same sand content; fines made up <8% of the soil fraction, thus all samples were classified as gravelly coarse sand [82]. The bulk of fine material was silt; contents of clay-sized particles were exceedingly low (<1%) and barely detectable by hydrometer; this is common for the young volcanic soils across Haleakalā crater [65,70]. Median grain size (D50) was practically the same for both soil positions. Textural-envelope diagrams show soils under shrubs had a slightly greater variance than those in bare areas [35], but were similar (Figure 7); thus, it can be safely assumed soil texture had no substantial influence on any differences observed in soil properties between sample sets.

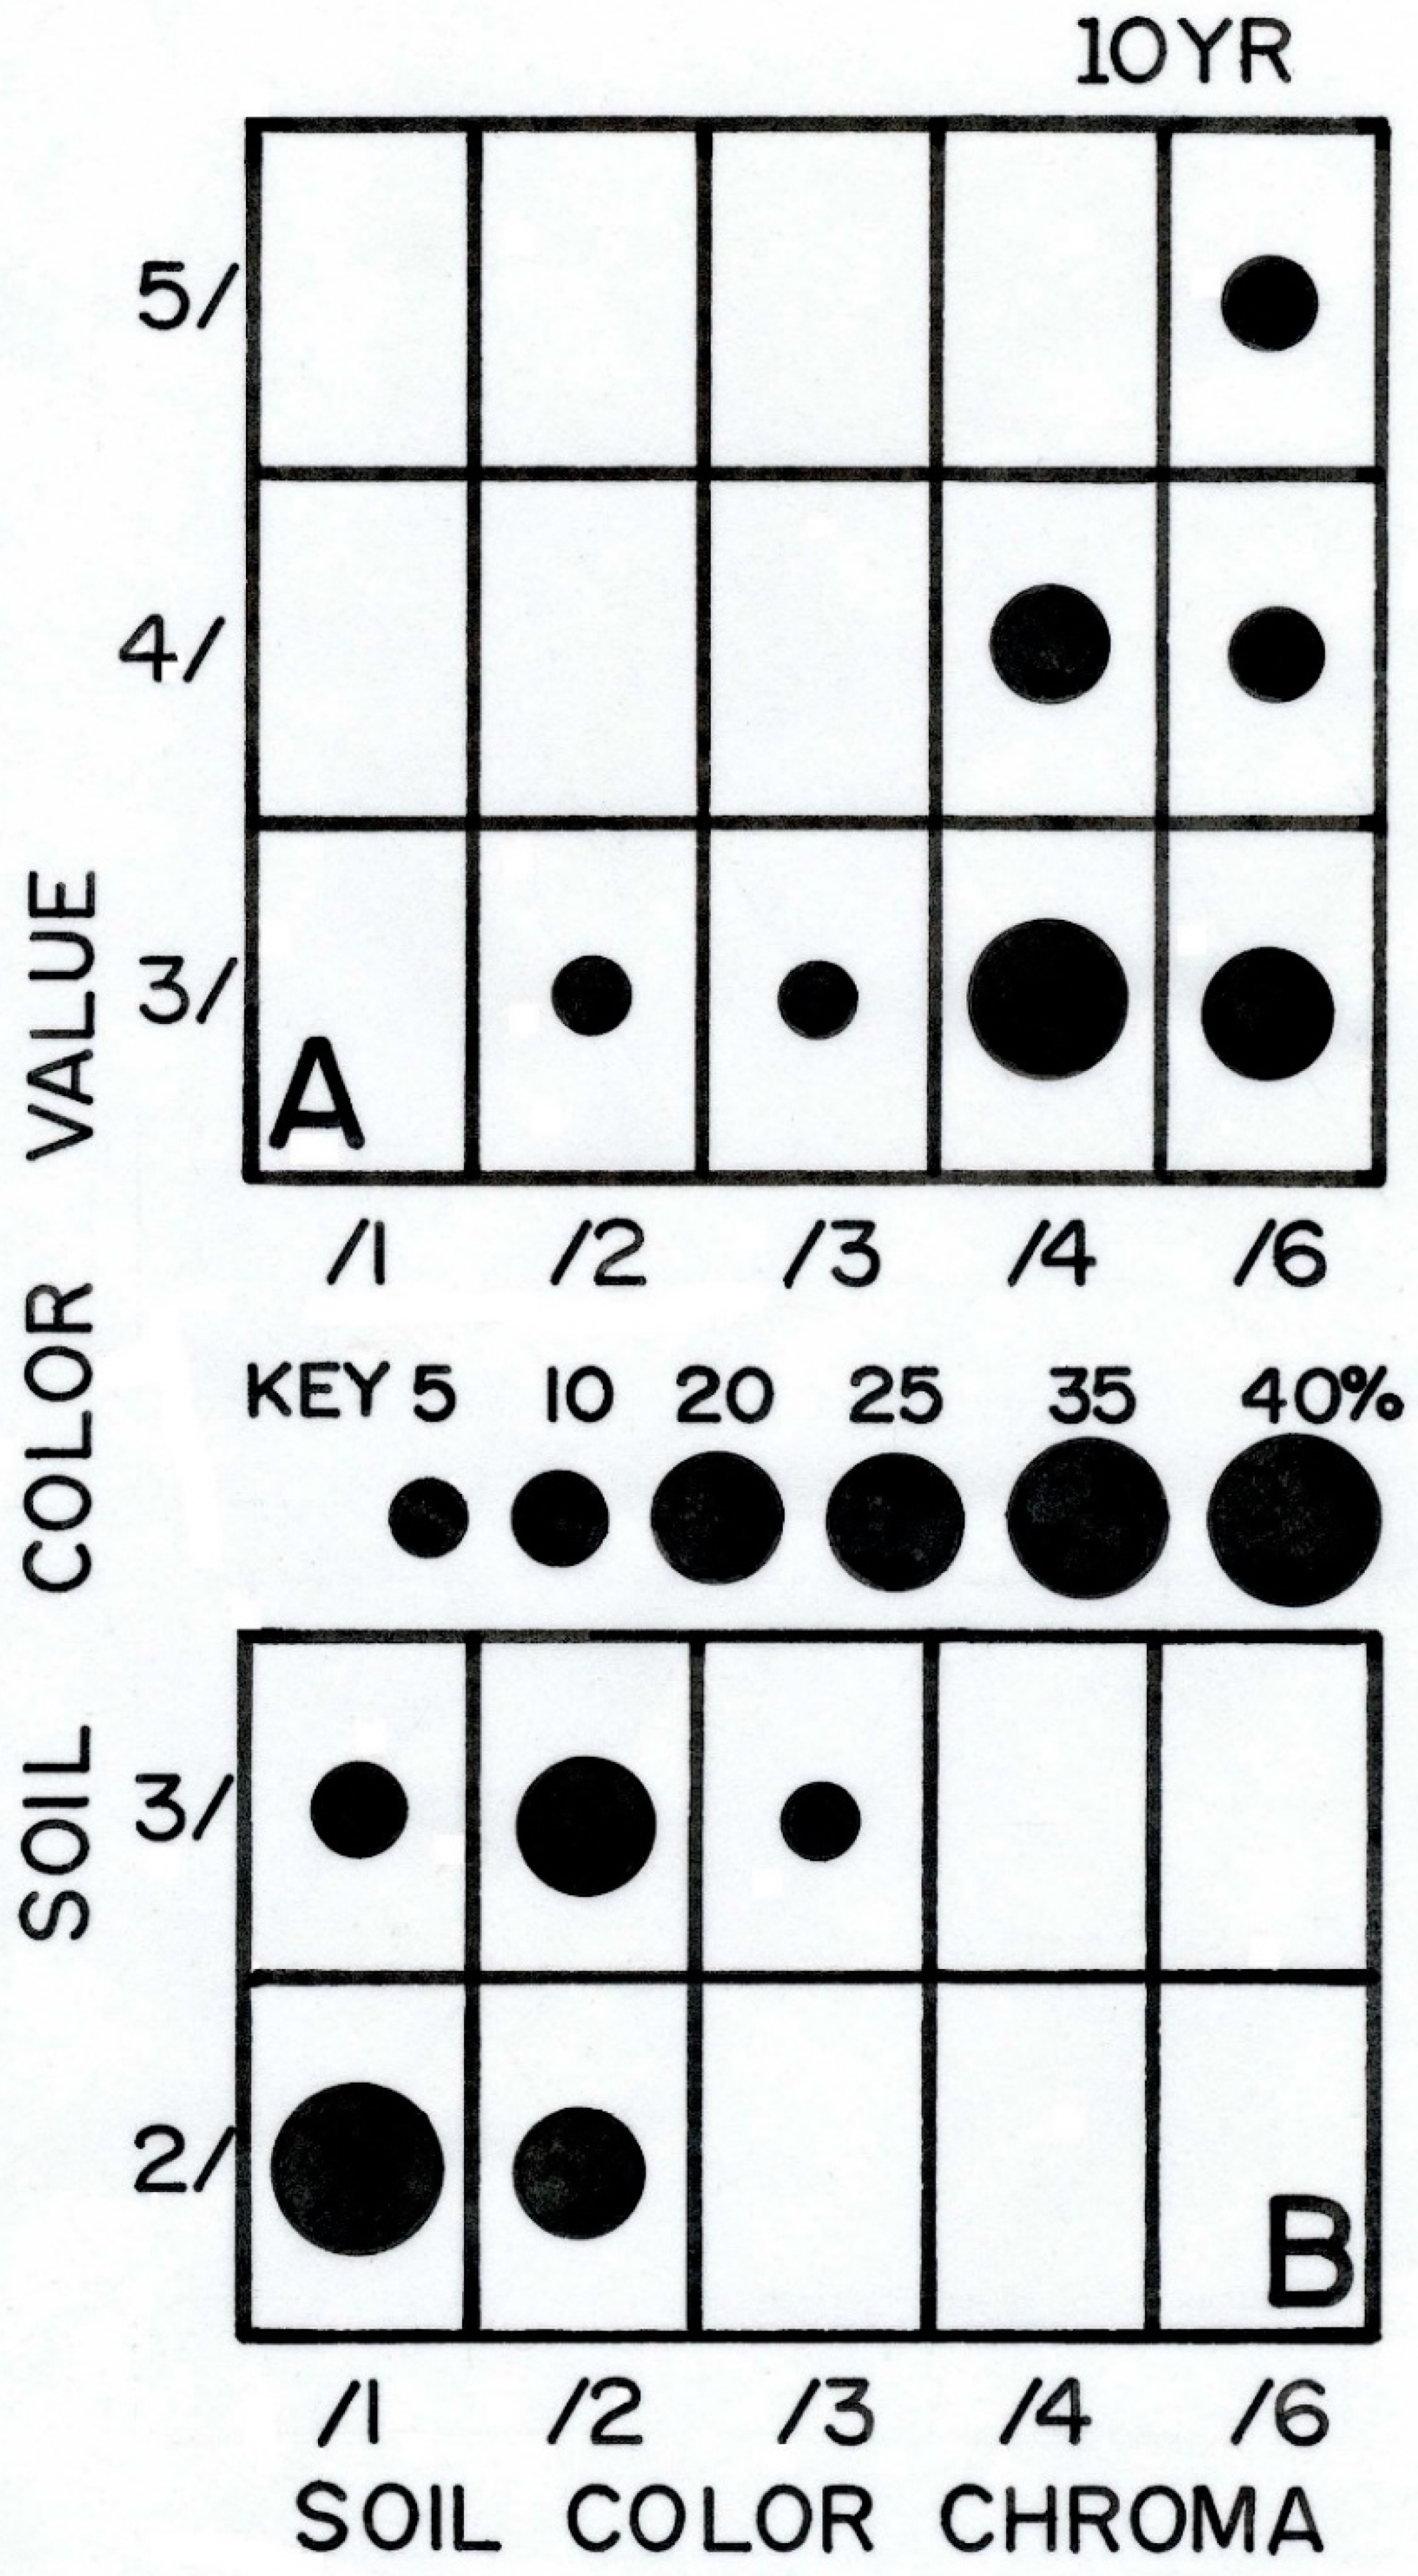
4.4.2. Soil Organic-Matter Content, and Soil Color

SOM content was low in all bare areas (0.8–1.9%, average: 1.25%). In contrast, SOM under LIs ranged from 1.7% to 7.2%, and was ~2.7 times greater (average: 3.38%) (Table 3); K-S and U statistics show this difference is highly significant (p < 0.001). SOM% was not dependent on any LI dimensions or area, or even on shrub size; yet—surprisingly—a Spearman rank test (ρ: 0.465, Z = 2.025, p < 0.05) showed bare-soil SOM% was correlated with SOM% under the neighboring shrub; this suggests the possibility that some litter is sporadically transferred from LIs to the surrounding soil areas, perhaps blown by wind.
Soil color, per se, normally has little pedological relevance, but it may indicate accumulation of humified organic matter [86,98]. Many organic compounds can also coat mineral grains, influencing their color [100]. As color is not easily amenable to standard statistical tests [101], an alternative analysis method was devised [34,35]. Color showed modest variation within both sample groups, but the Munsell 10YR hue chart [83] encompassed colors for all specimens. In each population, colors varied about the statistical mode—i.e., most common—and were compared with K–S tests. Control soils (Figure 8A) were lighter, mostly dark yellowish brown (10YR 3/4-3/6), whereas LI soils ranged from black (10YR 2/1) to very dark brown (10YR 3/3) (Figure 8B). Soil groups showed minimal overlap, just at 10YR 3/2 and 3/3; the bulk of LI samples were two chroma units and one color value lower than bare soils. A two-sample K–S statistic indicates LI soils were much darker (p < 0.001) than control soils; color trends were closely associated with SOM% in paired samples, as greater concentration of organic matter causes a drop in both soil chroma and values [101].

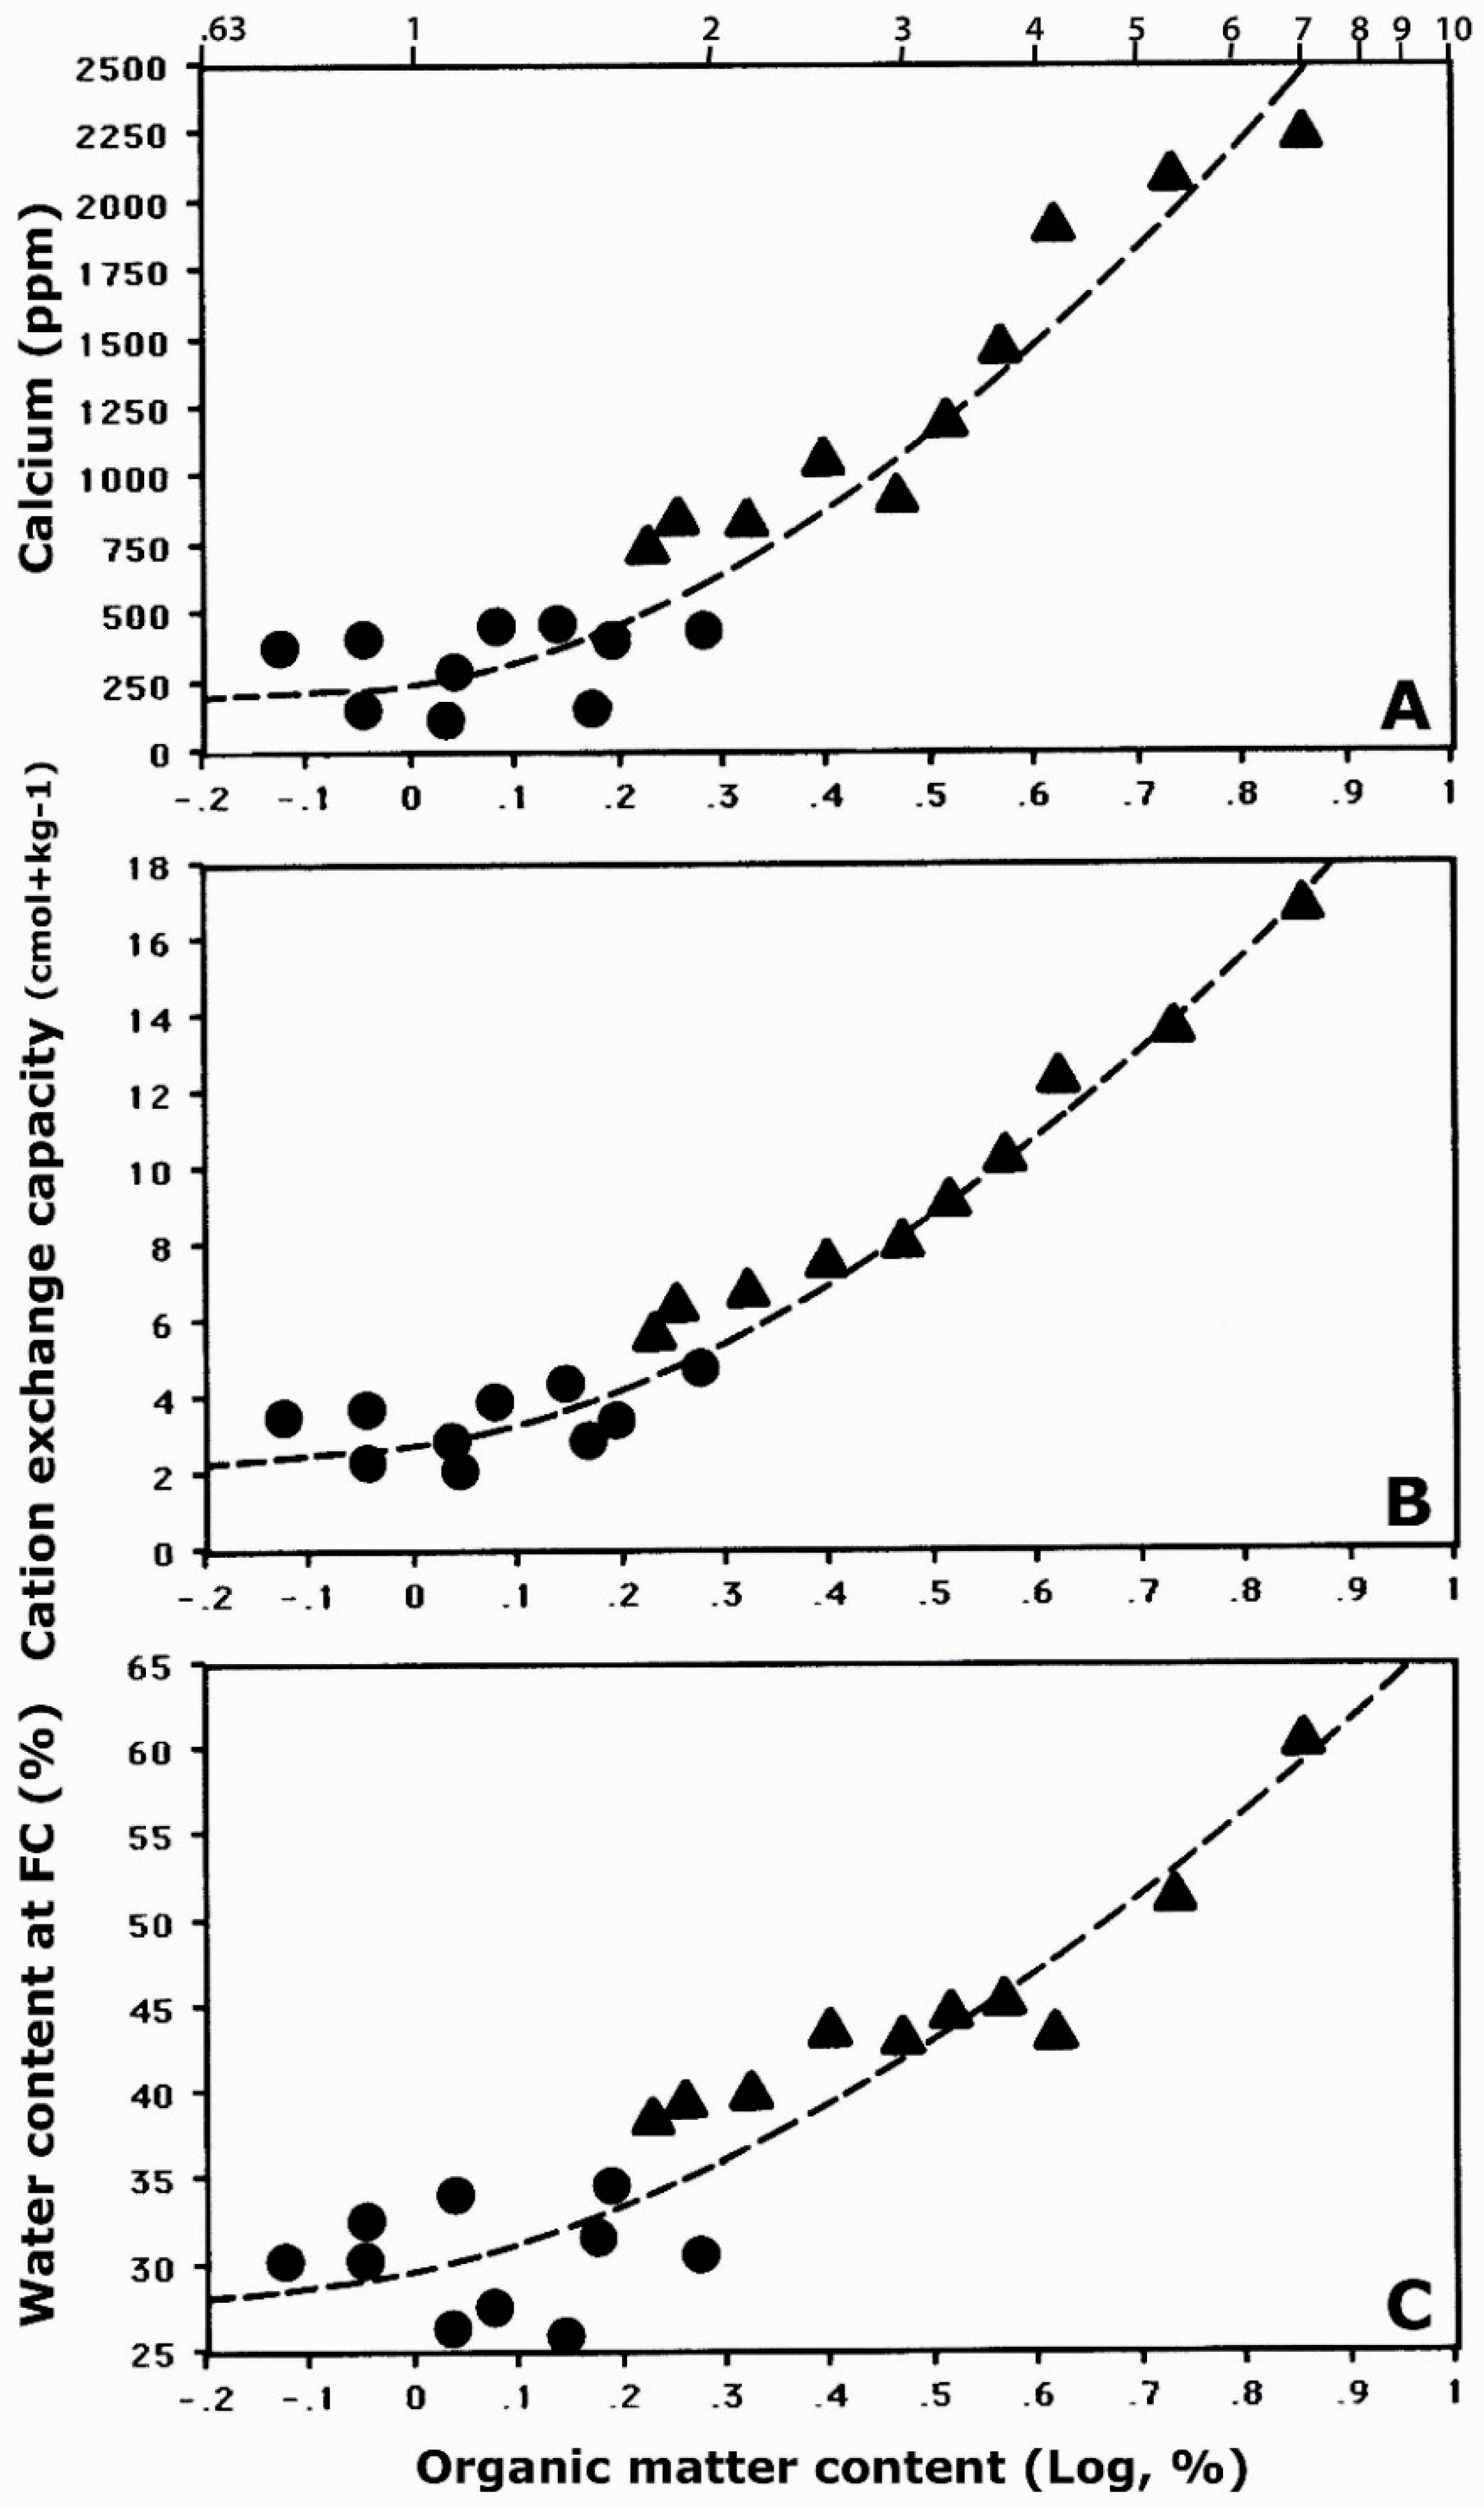
4.4.3. Influence of Organic Matter on Chemical Soil Properties

Exchangeable bases (Ca2+, Mg2+, K+) followed similar trends to those of kūpaoa litter. Ca2+, both on bare and LI soils, made up the greatest fraction (~73–79%) of the exchange complex, and was four times more abundant under shrubs than in bare areas (Table 3); differences between sampling positions were statistically significant (p < 0.001) for all cations and CEC. A polynomial regression of log10-transformed SOM on Ca2+ content (R = 0.959, R2 = 0.920, Y = 286.791 + 784.089X + 2057.979X2, p < 0.001) shows close dependency of this cation on SOM, and ‘explained’ ~92% of Ca present (Figure 9A). Mg2+ content was ~3.2 times greater on LIs (~120 ppm) than in exposed soils (~38 ppm); like calcium, magnesium was tightly associated with SOM, which accounted for 88.3% (p < 0.001) of this element in all samples. The cation fractions represented by Ca2+ and Mg2+ in both soil sets were similar to—and a bit lower than—those in kūpaoa litter, but K+ was more abundant (20%) on LI soils than in leaf litter, where magnesium made up just ~6% of cations (Table 2 and Table 3). In addition, LI soils contained nearly eight times more K+ than control soils. Similar to other cations, SOM was responsible for ~71% of exchangeable K+ in all soils.
The association of cation-exchange capacity with SOM was more pronounced than with any other property (R = 0.983, R2 = 0.966, Y = 3.097 + 4.798X + 13.537X2, p < 0.001), as nearly 97% of CEC could be ascribed to organic matter (Figure 9B); this is widely recognized as one of the most significant effects of SOM in coarse soils lacking clays [29,33,102]. CEC was almost three times higher on LI soils (9.61 cmol+ kg−1) than on adjacent substrates (3.44 cmol+ kg−1) (Table 3). Volcanic soils at Haleakalā and elsewhere commonly have low supply of phosphorus, thus P may be the limiting nutrient for plant growth [35,103,104]. Although scarce compared to other elements, available P was 6.2 times higher under kūpaoa than in unvegetated soils (p < 0.005) (Table 3); like other nutrients, P concentration was exceedingly dependent on SOM (Spearman ρ: 0.834, p < 0.001).
Total nitrogen content was not analyzed for soil samples. Nitrate (NO3)-N content was inordinately greater (~42 ppm) under kūpaoa shrubs than on bare soils (~1.2 ppm) (K–S: p < 0.005). Soil ammonium (NH4)-N was also higher under plants (16.0 ppm) than on bare soils (~9.2 ppm); this difference was less striking, albeit equally significant (p < 0.005). Nitrate and ammonium made up different N fractions in the two sampling sets: Exposed soils, dominated by NH4, had an average (NO3/NH4) ratio [105] of ~0.22, whereas soils on LIs showed an average ratio of ~4.64. Unsurprisingly, the combined nitrate + ammonium N content was about six times greater (~58 ppm) below shrubs than on bare substrates (10.3 ppm) (p < 0.001) (Table 3). SOM concentration was strongly associated with NO3-N (τ: 0.484, Z: 2.985, p < 0.0025) and with the combined N values (τ: 0.537, Z: 1.395, p < 0.001). Soil pH fluctuated only slightly among samples. Bare soils were a bit more acidic (pH: 6.42) than LI soils (pH: 6.65), but data standard deviation overlapped between sets, and differences were not statistically significant.

4.5. Soil Changes with Depth: Characteristics of Soil Profiles

Both profiles examined were Vitrandic Haplustepts developed on heterogeneous cinder and tephra deposits with high gravel fragments and >66% cinder or pumice with vitric material [71] (Table 4). The ground surface about both sections had a discontinuous and sparse cover of subangular to angular medium gravel-sized (10–25 mm) lapilli fragments and many black scoriaceous tephra cobble- (~5–10 cm) and pebble-sized (≤5 cm) clasts with rounded vesicles ≤2–5 mm diameter [106,107]. The bare-soil surface showed faint signs of frost-induced non-sorted striated patterns and pebble-sorted miniature stripes [58,67].
These soils evolved under an isomesic temperature regime and an aridic to ustic moisture regime. The profile under kūpaoa was shallower (~45 cm) than on bare ground (~95 cm). The 58-mm-thick surficial litter horizon (Oi1/Oe1) and underlying 26-mm-thick crust (A) on the LI profile have already been described (Section 4.2 and Section 4.3). Horizons in both soils had sandy texture; content of fines was comparable and relatively high down the two profiles, 8.3–10.4% in the LI profile, 6.4–11.3% in bare soil. Both soils showed gradual downward textural coarsening: gravel dropped from ~30–50% in upper horizons to 60–75% near profile bottoms. SOM stayed relatively constant down the LI profile (2.8–2.5%), whereas on bare ground it decreased sharply, from ~1.7% to 0.6% at the bottom. The A1 horizon below kūpaoa had mild water repellency, presumably related to SOM; no water repellency was found in other horizons or through the bare-soil section. Unlike other profiles in Haleakalā [59,70], no subsurface horizons showed evidence of post-depositional geomorphic events or buried horizons of high SOM.

4.6. Influence of Shrubs on Water Relationships

SOM greatly affected field infiltration rates. LI soils readily absorbed large amounts of water (42.2–195.6 mm/min, mean: 103.2 mm/min), >5 times faster than bare soils (6.7–42.3 mm/min, mean: 20.1 mm/min) (Table 3). Such highly significant differences (K–S: p < 0.001) would confer a considerably lower runoff potential, and greater resistance against erosion, to soils under kūpaoa [108,109]; similar infiltration enhancement also takes place in soils below silverswords.
Faster infiltration rates on LI soils were accompanied by more capacious water storage; owing to higher SOM, LI soils retained ~50% more water (38.6–60.4%, ~45% average) than bare soils (25.9–34.2%, ~30% average) at field capacity (K–S: p < 0.001). Data populations for water content at field capacity and log10-transformed SOM were normally distributed [91,92]. A polynomial regression (R = 0.916, R2 = 0.839, Y = 30.352 + 12.472X + 24.462 X2, p < 0.001) confirmed the crucial role of organic matter on water retention, as SOM alone accounted for ~84% of water storage (Figure 9C). A multiple regression adding fines content as a second independent variable did not yield a greater coefficient of determination; as soil textures were coarse and virtually the same in LI and bare soils (Table 3), this is hardly surprising, and further underscores the significance of SOM in soils with scant fine-grain content.
Additionally, kūpaoa may also cause much fog interception and resulting fog-drip, an important process influencing plant-water relations in LIs [65]. As trade winds sporadically invade the crater through the Ko’olau Gap, they bring much fog to north-facing slopes. The effects of fog-drip can frequently be observed in the crater, where soils on N/NE-facing sides of kūpaoa—and also of silverswords, outcrops, and boulders—become moist along that side of the plant and down to a 2–5 cm depth, as a dense shrub canopy gradually intercepts water later transferred to soil under and downslope of plants (Figure 1A and Figure 10). The foliage area vertically exposed to incoming winds by the largest shrubs may easily reach ≥3.5 m2 (Table 1); this generates high surface roughness and may winnow a substantial amount of fog moisture. Even small plants are able to intercept much fog, and soils beneath them are, from a very early growth stage, associated with an increased water supply. Field observations indicate fog interception may be most pronounced on exposed upper crater slopes above ~2500 m—precisely those studied here—where a convergence of steep gradient, high elevation, and NE orientation facing trade-wind circulation, appears ideal for optimum fog interception (Figure 1b and Figure 2c).

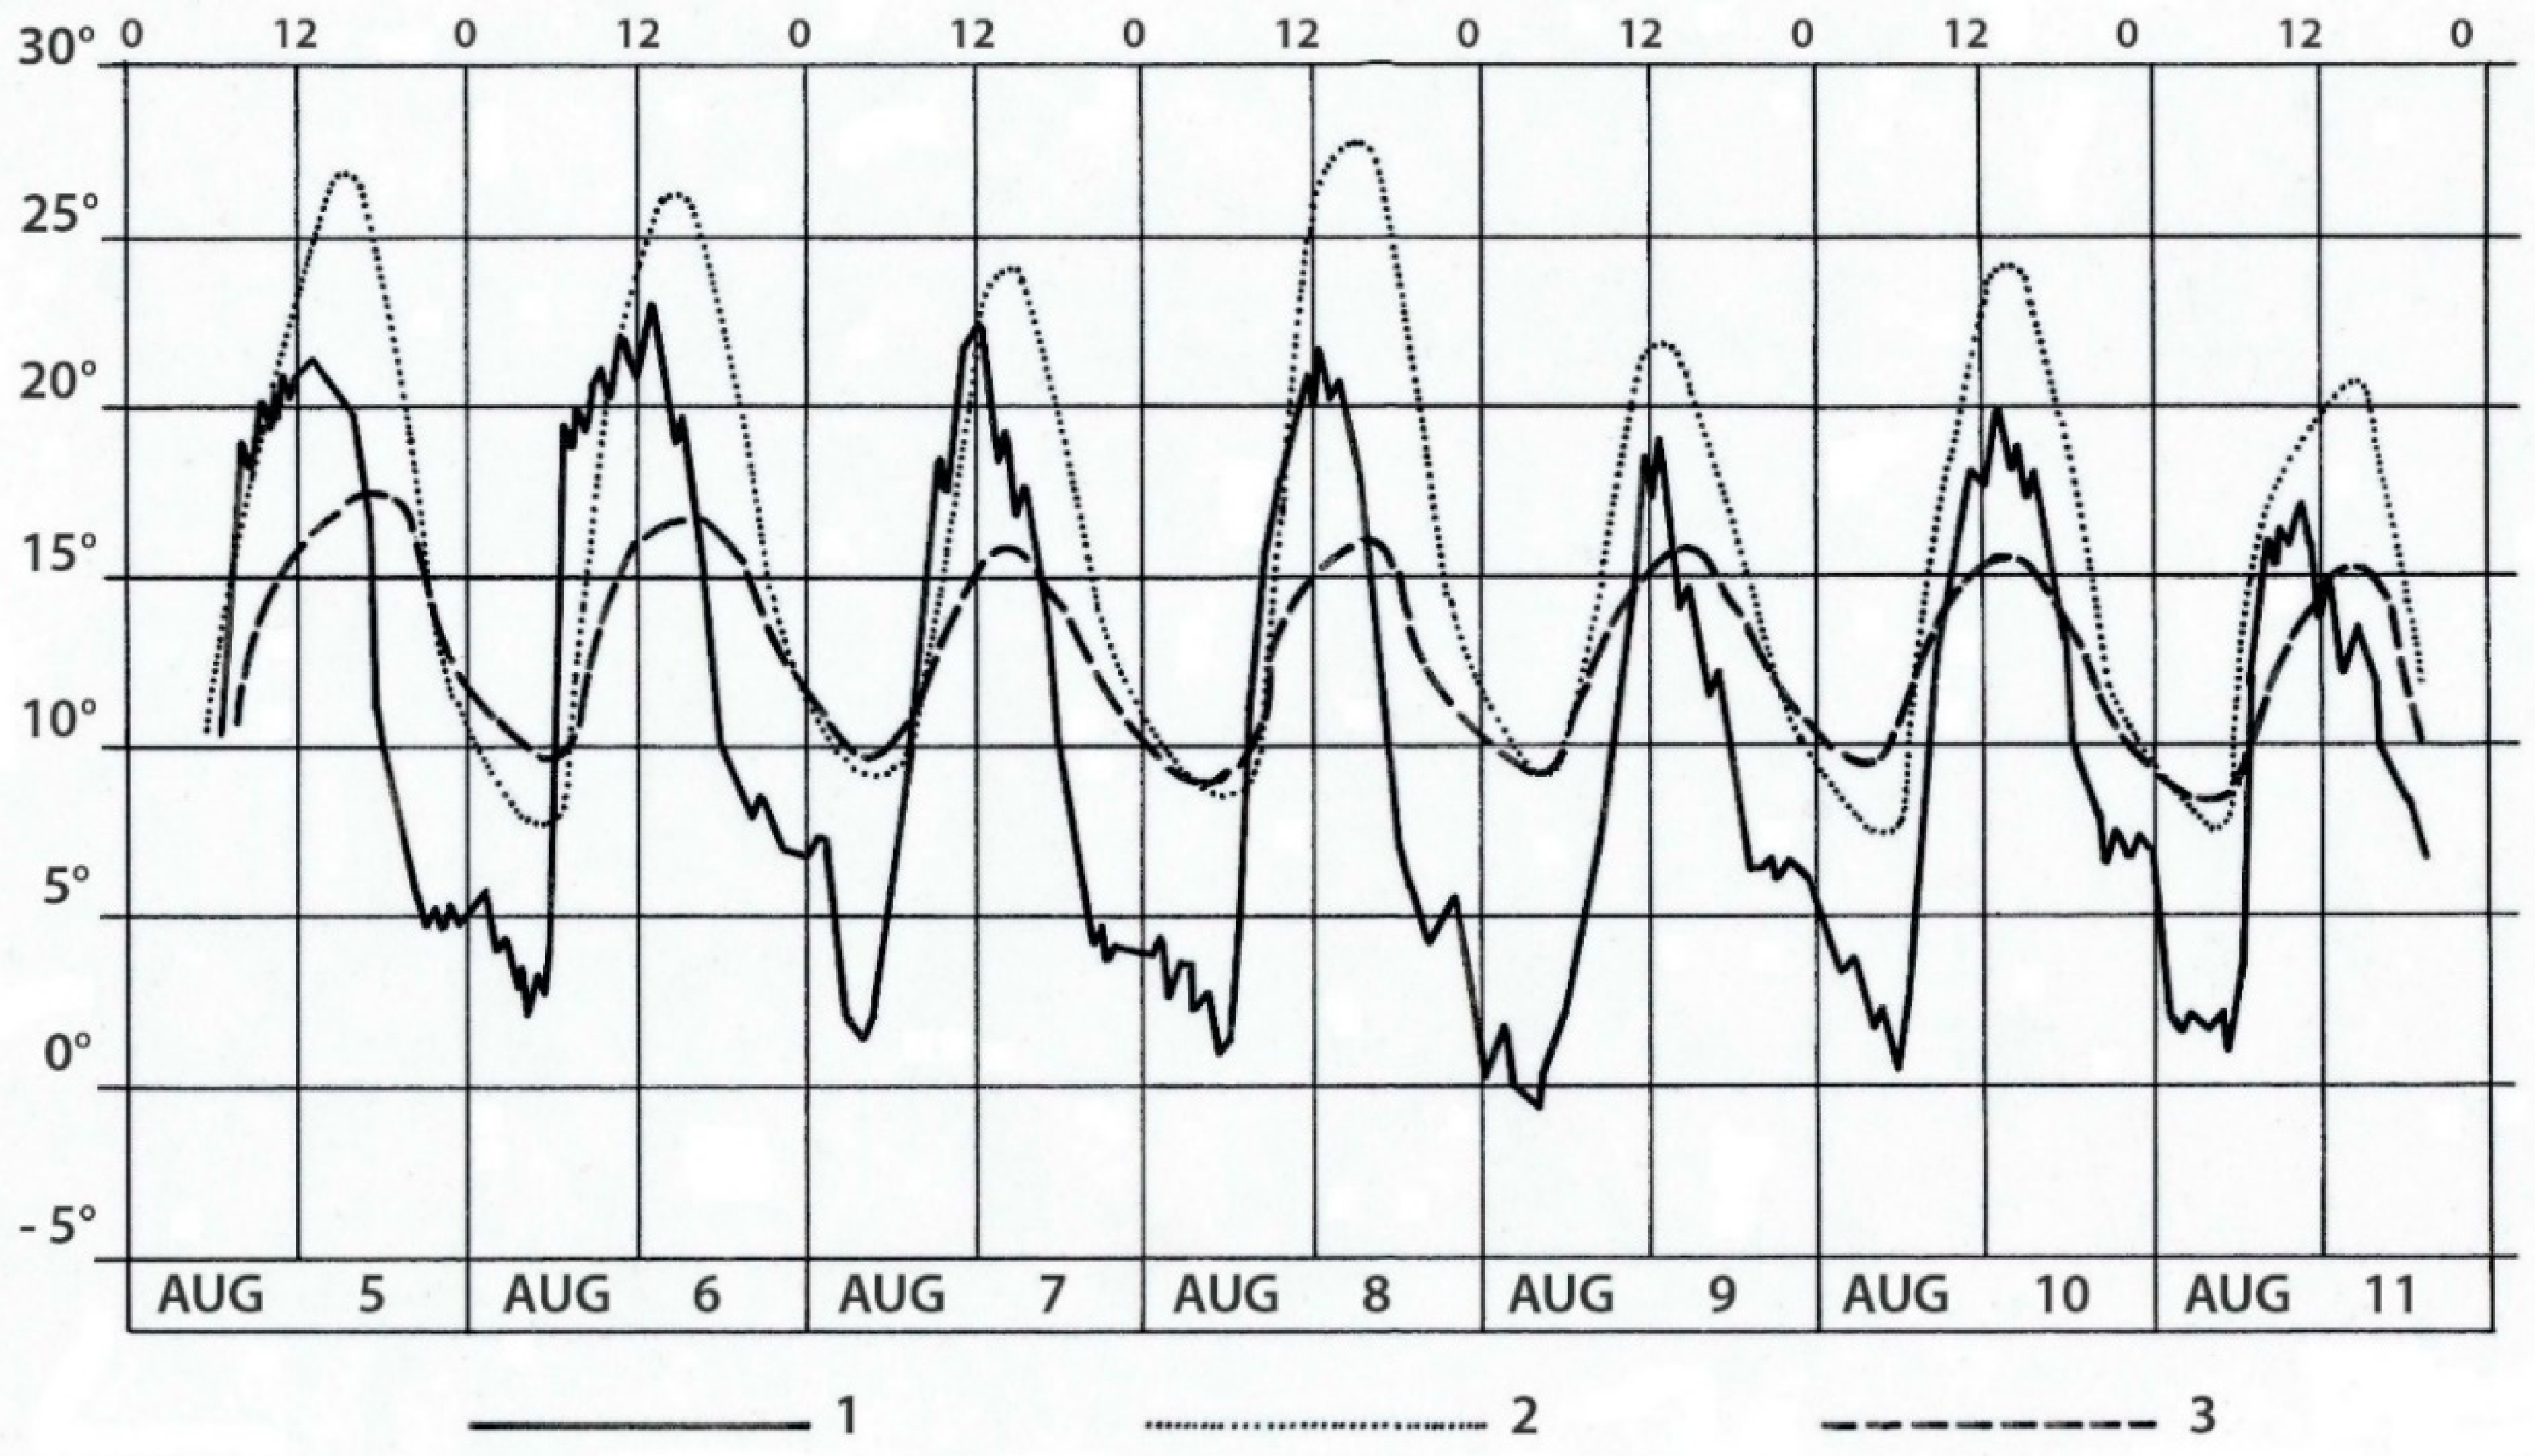
4.7. Microclimatic modification under Shrubs

Microclimatic effects of a kūpaoa canopy were studied near an isolated shrub at 2335 m on a flat (~1° slope) area ~1.4 km ENE of the main study site; this location was chosen as the southern crater rim walls, >2.2 km away (Figure 2C), did not cast shadows on it during late afternoon, so it was fully exposed to sunlight from sunrise to sunset. Maximum air temperatures during sunny days (5–8 August) peaked at 21.5–23.1 °C, but on 9–11 August—a period of high cloud cover, fog, and rain—air reached only 17.1–19.8 °C. Bare black to very dark brown (10YR 2/1-2/2) soils (−5 cm depth) outside the shrub attained 24.0–27.8 °C in the initial sunny stretch, but only 20.8–24.1 °C during the cloudy period. Soil temperatures (−5 cm) under the dense plant canopy were much lower, attaining 15.9–17.4 °C during the first four days, and then remained fairly constant, 15.3–15.8 °C, during the remainder monitoring period (Figure 11). Shaded soil was 8.1–11.7 °C (mean: 9.7 °C) cooler than exposed soil during sunny days, and 5.4–8.4 °C (mean: 6.5 °C) during cloudy ones. Minimum air temperatures showed no significant variation during the measurement period, when they reached −0.8 to 2.0 °C (mean: 0.8 °C); freezing occurred only one night (9 August), outside the shrub canopy. Soil minima were much less affected by shrub cover; exposed ground dipped to 7.3–9.1 °C (mean: 8.2 °C), whereas canopy-shaded soil only dropped down to 8.4–9.6 °C (mean: 9.2 °C) (Figure 11).

5. Discussion

5.1. Litter Accumulation, and Formation of Fertility Islands

5.1.1. Development of Litter Islands

The most significant pedological effects of kūpaoa were concentration of organic matter into discrete fertility patches, and the ensuing modification of soil properties by SOM and nutrient accumulation. The general lack of soil macrofauna and the significantly greater NO3 N/NH4+ N soil ratios found under plants suggest that vigorous bacterial activity under LIs converts most SOM ammonium to nitrate [105,110]. Additionally, plant material may also have been decomposed by actinomycetes and/or fungi [99]. Litter normally exerts a major influence on various geomorphic processes [111], yet litter islands under D. menziesii extended downhill well beyond its canopy. Association between distance of litter displacement and slope gradient suggests organic material is transported downhill by geomorphic processes, probably a combination of runoff, frost creep, and soil-grain flows [58].

5.1.2. Soil Enrichment under Fertility Islands

Soil changes under kūpaoa appear to have occurred mainly due to organic matter addition. Observed nutrient concentrations in surface soils are related to cycling of individual elements. Calcium, the most abundant cation, is not easily transported out of senescent leaves, but remains largely immobilized in the phloem, thus carried in leaf litter [112,113]. Ca2+ also bonds readily with SOM, becoming stabilized in Ca–humus complexes [99]. Magnesium cycling is similar to that of Ca2+, but this element is less strongly absorbed to cation-exchange sites than Ca2+ and is not usually fixed in unavailable forms [87,113]. The fate of potassium is more complex; K+ would normally be lost by leaching, but it is readily fixed by 2:1 silicates, which may become abundant as glassy tephra particles in Vitrandic Haplustepts gradually weather [87,114]; this process could account for the relatively high K+ amount in the soil samples (Table 3). Phosphorus quickly reacts with other ions in the soil solution, becoming absorbed to mineral colloids, thus unavailable to plants [113]. At any rate, apatite is scarce in most cinder and tephra, and this restricts available P in volcanic-ash soils [114,115].

5.2. Possible Sources of Soil Aggregation in Surface Crusts

Presence of a thin, cohesive, stable, nearly continuous crust below LIs is noteworthy, but the factors involved in its development are not apparent. Similar, weakly-aggregated, surface horizons are found under the small—≤50 cm diameter—circular canopy of some silverswords [70], but the crusts beneath kūpaoa were substantially larger and firmer. The greater shear strength and resistance to compressibility of this crust should prevent soil particles from being easily disrupted, detached, and transported downhill by the geomorphic agents mentioned above (Figure 6); higher soil aggregation would also increase infiltration, and reduce erosion and runoff [108,109]. Formation of this brittle horizon seemed apparently related to SOM accumulation and humification; as larger shrubs were associated with stronger crusts, these probably develop gradually, following SOM buildup [116,117].

5.3. Differences between Pedological Effects of Kūpaoa and Silversword

5.3.1. Comparison with Silversword Litter

Analysis of kūpaoa and silversword litter revealed significant differences: All nutrients in shrub leaf litter showed higher concentration levels than in rosettes (Table 2). Total nitrogen content was ~80% greater in kūpaoa, and cations were ~3.6 times (Ca2+) to >10 times (Mg2+ and K+) higher, and CEC was ~4.2 times greater; P in shrub litter reached a concentration ~12 times greater than in silverswords. In contrast, water storage by rosette organic material was ~45% greater; this was associated with the densely pubescent silversword leaves, which store abundant water within the myriad small pore spaces in between leaf trichomes [35].

5.3.2. Comparison with Soils under Silversword

Substrate modification under D. menziesii was more pronounced than below A. sandwicense, as the first contained greater supply of all available nutrients except P (Table 3). Mean SOM content below kūpaoa was ~80% greater than under silverswords; accordingly, soils under shrubs were darker (10YR 2/1) than beneath rosettes (10YR 3/2). Nitrogen was not compared between plants because different lab methods were used in the two studies. Content for all cations was much greater under kūpaoa: Ca2+ was ~4.9 times, Mg2+ ~5.3 times, and K+ ~2.7 times, higher than below rosettes; CEC was ~5.1 times greater under shrubs. Available P was scarce beneath either shrubs or rosettes but was ~40% greater under A. sandwicense; as mentioned, apatite and other phosphorus-bearing minerals are scarce in most tephras [103,115]. Although rosette litter stored much more water than that of kūpaoa (Table 2), the trend was reversed in soils; as the pubescent silversword leaves become gradually comminuted during SOM decomposition, water-storing voids disappear, and soils below shrubs—owing to greater SOM content—are able to hold ~47% more WRC than under rosettes (Table 3).
Divergent litter production dynamics may help understand observed differences in soil properties below plant species. Shrubs apparently deposit leaf litter on a continuous or seasonal basis, as kūpaoa periodically discards older foliage; D. menziesii may also lose all its leaves as it dies back following winter ice storms [118]. In contrast, rosettes conserve the bulk of their organic matter as a marcescent, standing-litter layer attached to the stem, with only small amounts of litter added to soil before the monocarpic plants flower, die, and topple at a median age of 49–63 years; some silverswords may survive for ~90 years [119]. SOM under live rosettes is just ~10% higher than in adjacent bare soils, but plant death results in a massive event of litter input to soil, when SOM nearly doubles during just an estimated 8-year period; following this, soil nutrient levels become comparable to those observed under live kūpaoa [35].

5.4. Additional Influences of Kūpaoa on Soil

5.4.1. Alteration of Soil-Water Relationships

Through various effects on water relationships, kūpaoa influences soil development and ecological processes. Observations indicate the tightly packed, imbricate foliage of kūpaoa is an efficient fog interceptor, as the many minute inter-leaf compartments serve as receptacles for capture and storage of countless water droplets (Figure 1A). Fog interception and fog-drip must greatly increase water supply to soil under shrubs; higher SOM, in turn, boosts infiltration rates fivefold, allowing water to quickly penetrate into the soil, where it can be more effectively stored by enhanced soil water-retention capacity, caused primarily by high SOM [99,108]. All these combined effects result in a more reliable water supply for plant growth and microorganism activity.
Fog interception is an important process that greatly augments plant water availability in Hawaiian mountains. For instance, soils on the island of Lanai below Araucaria excelsa at 838 m elevation showed a ~3.8-mm/day fog-drip gain; overall, this supplied ~750 mm/year extra water to soil [120]. On the flanks of Mauna Kea, Hawai’i, moisture-laden trade winds enhance the growth of small pukiawe shrubs on wind-facing slopes at 1950 m [121], and Sophora trees alter soils through fog interception and accumulation under the canopy [25]. On Mauna Loa, the moss Rhacomitrium lanuginosum grows at 3350 m only on N-facing cracks and sheltered holes of lava flows, where cloud-interception allows it to absorb up to ~2.5 mm/day extra water [122].
Detailed records of fog-interception need long-term monitoring. Possibly the most thorough fog-drip study in Hawai’i [123] measured cumulative fog input in Haleakalā for 15 months on 7 stations, including two SSt sites at 2500 and 2860 m near my study area. During a 9-month period, these sites received 290–300 mm rainfall, but fog-drip contributed 250–260 mm additional water, thus increasing soil-water supply by 83–90%. Other sites registered additional 100–150% water from mist sources. Fog input studies from other oceanic volcanic islands, including Tenerife [124], Madeira [125], and the Galápagos [126,127] also underline the significance of fog-drip as an ecological and pedological factor.

5.4.2. Modifications of Soil Microclimate

Ground insulation by a kūpaoa canopy caused noticeable microclimatic changes. Owing to a significant light reduction under the dense shrub foliage, soil diurnal high temperatures were substantially depressed [30,31]; reduced maximum soil temperatures should help lower evaporation from soil, thus conserving moisture [128]. Soil shielding and heat reradiation under the canopy produced a modest increase in nightly minimum temperatures; this trend would reduce the chance and frequency of frost activity under plants [129]. The opposing daily temperature trends resulted in a narrower daily amplitude (Figure 11). Microclimate changes and greater water supply under shrubs, coupled with increased nutrient availability, should also influence microorganisms—which are favored by milder temperatures and ample soil moisture—and enhance SOM decomposition [11,38].

5.4.3. Other Possible Plant Influences

Some plants may intercept and capture aeolian dust with their foliage [13,44]; for example, pukiawe and other shrubs trap much fine wind-borne material on neighboring Mauna Loa [122]. Fine grains might also be added by funneling stemflow to the stem base [39,47]; however, neither of these processes seems likely in Haleakalā, as soils below kūpaoa and on adjacent areas had similar textures (Figure 7).

6. Conclusions: Kūpaoa as a Control Factor of Alpine Pedogenesis

All data show kūpaoa exerts a significant control on soil development in Haleakalā; the multiple effects of shrubs on substrate are intricately intertwined, and many changes reinforce each other in a positive feedback. Figure 12 illustrates the most prominent interactions discussed in this study; effects are divided into biological or geomorphic (shown with letters) and microclimatic (identified by numbers). Undoubtedly, the foremost influences of kūpaoa are litterfall, leading to the formation of litter islands, and the gradual breakdown of litter, which causes substantial soil enrichment in these fertility islands.
While discussing various effects of organisms on soil evolution, van Breemen [130] differentiated between variable and invariable soil properties. Variable attributes are those that fluctuate markedly in response to seasonal or periodic processes; invariable properties show little or no change from one year to the next, but gradually change in the course of soil development, on time scales of decades to centuries to perhaps millennia. Examination of interactions between kūpaoa and its substrate (Figure 12) indicates shrubs influence several important invariable soil characteristics: Litter accumulation (Figure 12A); SOM buildup and downward translocation through the soil profile (Figure 12B), which alters the distribution and content of available nutrients; enhanced water-retention capacity and increased hydrological conductivity, which raises infiltration rates (Figure 12C); and soil aggregation changes, leading to the formation of a surface crust (Figure 12E). Shrubs also affect variable soil properties, such as sporadic water input by fog-drip following fog interception (1.1, 1.2); daily soil temperatures, relative humidity, and evaporation rates under the canopy, and any effect these temporal microclimatic alterations might have on microbial decomposition activity (2); plus, occasional litter depletion and dispersal by strong wind activity (3). Some additional interactions—not examined here—may occur as well [130]. By intermittently affecting variable soil relationships and—more importantly—progressively modifying invariable soil properties, kūpaoa alters, and even creates, different microhabitats in the alpine environment, and exerts a critical control of soil development on the young pyroclastic substrates at Haleakalā.
60 years ago, Jenny [2], p. 6 remarked on the fundamental ecological unity of plants and soils: “The boundary between vegetation and soil is wholly arbitrary… as it is impossible to separate quantitatively the mineral soil fraction from rootlets, roothairs, insects, microbes, not to mention the separation of living and dead materials.

Funding

This research received no external funding.

Acknowledgments

This work was supported in part by the Office of the Vice President for Research, Univ. of Texas at Austin (Special Research Grant 20-7604-6851). I thank E. Gordon, R.J. Nagata, D.W. Reeser and P. Welton for providing research and collection permits for HNP. I am particularly grateful to the late Lloyd L. Loope (1943–2017), USGS, Haleakalā Field Station, Maui, for kindly reviewing my initial research plans and for his always valuable help; he is missed and remembered. I am indebted to Alejandro G. Pérez-Bergquist and Martha M. Kowalak-Pérez for pleasant company and expert help during fieldwork. M.V. Nathan and J. Stecker, Division of Plant Sciences, Univ. of Missouri at Columbia, analyzed some soil and plant-litter samples. I became aware of the pedogenic significance of plants many years ago, during an inspiring lecture series by Hans Jenny (1899–1992) at UC-Berkeley. I gratefully acknowledge the pivotal influence of the late Paul J. Zinke (1920–2006) for encouraging me to study plant influences in alpine areas. Detailed comments by three anonymous reviewers greatly helped to improve and focus the manuscript.

Conflicts of Interest

The author declares no conflict of interest.

References

  1. Jenny, H. The Soil Resource. Origin and Behavior; Springer: New York, NY, USA, 1980. [Google Scholar]
  2. Jenny, H. Role of the plant factor in the pedogenic functions. Ecology 1958, 39, 5–16. [Google Scholar] [CrossRef]
  3. Fireman, M.; Hayward, H.E. Indicator significance of some shrubs in the Escalante desert, Utah. Bot. Gaz. 1952, 114, 143–155. [Google Scholar] [CrossRef]
  4. Rickard, W.H.; Keough, R.F. Soil-plant relationships of two steppe desert shrubs. Plant Soil 1968, 29, 205–212. [Google Scholar] [CrossRef]
  5. García-Moya, E.; McKell, C.M. Contribution of shrubs to the nitrogen economy of a desert-wash plant community. Ecology 1970, 51, 81–88. [Google Scholar] [CrossRef]
  6. Charley, J.L.; West, N.E. Plant-induced soil chemical patterns in some shrub-dominated semi-desert ecosystems of Utah. J. Ecol. 1975, 63, 945–963. [Google Scholar] [CrossRef]
  7. Schlesinger, W.H.; Raikes, J.A.; Hartley, A.E.; Cross, A.F. On the spatial pattern of soil nutrients in desert ecosystems. Ecology 1996, 77, 364–374. [Google Scholar] [CrossRef]
  8. Schlesinger, W.H.; Pilmanis, A.M. Plant-soil interactions in deserts. Biogeochemistry 1998, 42, 169–187. [Google Scholar] [CrossRef]
  9. Wilson, T.B.; Thompson, T.L. Soil nutrient distributions of mesquite-dominated desert grasslands: Changes in time and space. Geoderma 2005, 126, 301–315. [Google Scholar] [CrossRef]
  10. Ruiz, T.G.; Zaragoza, S.R.; Cerrato, R.F. Fertility islands around Prosopis laevigata and Pachycereus hollianus in the drylands of Zapotitlán Salinas, Mexico. J. Arid Environ. 2008, 72, 1202–1212. [Google Scholar] [CrossRef]
  11. Gutiérrez, J.R.; Meserve, P.L.; Contreras, L.C.; Vásquez, H.; Jaksic, F.M. Spatial distribution of soil nutrients and ephemeral plants underneath and outside the canopy of Porlieria chilensis shrubs (Zygophyllaceae) in arid coastal Chile. Oecologia 1993, 95, 347–352. [Google Scholar] [CrossRef] [PubMed]
  12. Aguilera, L.F.; Gutiérrez, J.R.; Meserve, P.L. Variation in soil micro-organisms and nutrients underneath and outside the canopy of Adesmia bedwellii (Papilionaceae) shrubs in arid coastal Chile following drought and above average rainfall. J. Arid Environ. 1999, 42, 61–70. [Google Scholar] [CrossRef]
  13. Li, J.; Zhao, C.; Zhu, H.; Li, Y.; Wang, F. Effect of plant species on shrub fertile island at an oasis-desert ecotone in the South Junggar Basin, China. J. Arid Environ. 2007, 71, 350–361. [Google Scholar] [CrossRef]
  14. Li, P.-X.; Wang, N.; He, W.-M.; Krüsi, B.O.; Gao, S.-Q.; Zhang, S.-M.; Yu, F.-H.; Dong, M. Fertile islands under Artemisia ordosica in inland dunes of northern China: Effects of habitats and plant developmental stages. J. Arid Environ. 2008, 72, 953–963. [Google Scholar] [CrossRef]
  15. Jeddi, K.; Cortina, J.; Chaieb, M. Acacia salicina, Pinus halepensis and Eucalyptus occidentalis improve soil surface conditions in southern Tunisia. J. Arid Environ. 2009, 73, 1005–1013. [Google Scholar] [CrossRef]
  16. Ward, D.; Trinogga, J.; Wiegand, K.; du Toit, J.; Okubamichael, D.; Reinsch, S.; Schleicher, J. Large shrubs increase soil nutrients in a semi-arid savanna. Geoderma 2018, 310, 153–162. [Google Scholar] [CrossRef]
  17. Herrera-Arreola, G.; Herrera, Y.; Reyes-Reyes, B.G.; Dendooven, L. Mesquite (Prosopis juliflora (Sw.) DC.), huisache (Acacia farnesiana (L.) Willd.) and catclaw (Mimosa biuncifera Benth.) and their effect on dynamics of carbon and nitrogen in soils of the semi-arid highlands of Durango, Mexico. J. Arid Environ. 2007, 69, 583–598. [Google Scholar] [CrossRef]
  18. Jackson, R.B.; Caldwell, M.M. Geostatistical patterns of soil heterogeneity around individual perennial plants. J. Ecol. 1993, 81, 683–692. [Google Scholar] [CrossRef]
  19. Hirobe, M.; Ohte, N.; Karasawa, N.; Zhang, G.; Wang, L.; Yoshikawa, K. Plant species effect on the spatial patterns of soil properties in the Mu-us desert ecosystem, Inner Mongolia, China. Plant Soil 2001, 234, 195–205. [Google Scholar] [CrossRef]
  20. Zheng, J.; He, M.; Li, X.; Chen, Y.; Li, X.; Liu, L. Effects of Salsola passerina shrub patches on the microscale heterogeneity of soil in a montane grassland, China. J. Arid Environ. 2008, 72, 150–161. [Google Scholar] [CrossRef]
  21. Escudero, A.; Giménez-Benavides, L.; Iriondo, J.M.; Rubio, A. Patch dynamics and islands of fertility in a high mountain Mediterranean community. Arct. Antarct. Alp. Res. 2004, 36, 518–527. [Google Scholar] [CrossRef]
  22. Certini, G.; Fernández-Sanjurjo, M.J.; Corti, G.; Ugolini, F.C. The contrasting effect of broom and pine on pedogenic processes in volcanic soils (Mt. Etna, Italy). Geoderma 2001, 102, 239–254. [Google Scholar] [CrossRef]
  23. Fernández-Sanjurjo, M.J.; Corti, G.; Certini, G.; Ugolini, F.C. Pedogenesis induced by Genista aetnensis (Biv.) DC. on basaltic pyroclastic deposits at different altitudes, Mt. Etna, Italy. Geoderma 2003, 115, 223–243. [Google Scholar] [CrossRef]
  24. Rodríguez, A.; Durán, J.; Fernández-Palacios, J.M.; Gallardo, A. Spatial pattern and scale of soil N and P fractions under the influence of a leguminous shrub in a Pinus canariensis forest. Geoderma 2009, 151, 303–310. [Google Scholar] [CrossRef]
  25. Walker, L.R.; Powell, E.A. Regeneration of the Mauna Kea silversword Argyroxiphium sandwicense (Asteraceae) in Hawaii. Biol. Conserv. 1999, 89, 61–70. [Google Scholar] [CrossRef]
  26. Halvorson, J.J.; Smith, J.L.; Franz, E.H. Lupine influence on soil carbon, nitrogen and microbial activity in developing ecosystems at Mount St. Helens. Oecologia 1991, 87, 162–170. [Google Scholar] [CrossRef] [PubMed]
  27. Onipchenko, V.G.; Makarov, M.I.; van der Maarel, E. Influence of alpine plants on soil nutrient concentrations in a monoculture experiment. Folia Geobot. 2001, 36, 225–241. [Google Scholar] [CrossRef]
  28. Nuñez, C.; Aizen, M.A.; Ezcurra, C. Species associations and nurse plant effects in patches of high-Andean vegetation. J. Veg. Sci. 1999, 10, 357–364. [Google Scholar] [CrossRef]
  29. Lee, W.G.; Hewitt, A.E. Soil changes associated with development of vegetation on an ultramafic scree, northwest Otago, New Zealand. J. R. Soc. N. Z. 1982, 12, 229–241. [Google Scholar] [CrossRef] [Green Version]
  30. Holtmeier, F.K.; Broll, G. The influence of tree islands and microtopography on pedoecological conditions in the forest-alpine tundra ecotone on Niwot Ridge, Colorado Front Range, U.S.A. Arct. Alp. Res. 1992, 24, 216–228. [Google Scholar] [CrossRef]
  31. Seastedt, T.R.; Adams, G.A. Effects of mobile tree islands on alpine tundra soils. Ecology 2001, 82, 8–17. [Google Scholar] [CrossRef]
  32. Pérez, F.L. Conifer litter and organic matter accumulation at timberline, Lassen Peak. In Examples of Resource Inventory and Monitoring in National Parks of California; van Riper, C., Stohlgren, T.J., Veirs, S.D., Castillo, S., Eds.; U.S. Department of the Interior National Park Service. Transactions and Proceedings Series: Washington, DC, USA, 1990; Volume 8, pp. 207–224. [Google Scholar]
  33. Pérez, F.L. The influence of organic matter addition by caulescent Andean rosettes on surficial soil properties. Geoderma 1992, 54, 151–171. [Google Scholar] [CrossRef]
  34. Pérez, F.L. The effects of giant Andean rosettes on surface soils along a high paramo toposequence. Geojournal 1996, 40, 283–298. [Google Scholar]
  35. Pérez, F.L. Geoecological alteration of surface soils by the Hawaiian silversword (Argyroxiphium sandwicense DC.) in Haleakala’s crater, Maui. Plant Ecol. 2001, 157, 215–233. [Google Scholar] [CrossRef]
  36. Zinke, P.J. The pattern of influence of individual forest trees on soil properties. Ecology 1962, 43, 130–133. [Google Scholar] [CrossRef]
  37. Pérez, F.L. Plant-induced spatial patterns of surface soil properties near caulescent Andean rosettes. Geoderma 1995, 68, 101–121. [Google Scholar] [CrossRef]
  38. Tiedemann, A.R.; Klemmedson, O. Nutrient availability in desert grassland soils under mesquite (Prosopis juliflora) trees and adjacent open areas. Proc. Soil Sci. Soc. Am. 1973, 37, 107–111. [Google Scholar] [CrossRef]
  39. Gersper, P.L.; Holowaychuk, N. Effects of stemflow water on a Miami soil under a beech tree: I. Morphological and physical properties. Proc. Soil Sci. Soc. Am. 1970, 34, 779–786. [Google Scholar] [CrossRef]
  40. Zinke, P.J.; Crocker, R.L. The influence of giant sequoia on soil properties. For. Sci. 1962, 8, 2–11. [Google Scholar]
  41. Thomas, D.S.G.; Tsoar, H. The geomorphological role of vegetation in desert dune systems. In Vegetation and Erosion Processes and Environments; Thornes, J.B., Ed.; Wiley: London, UK, 1990; pp. 471–489. [Google Scholar]
  42. Scarff, F.R.; Westoby, M. Leaf litter flammability in some semi-arid Australian woodlands. Funct. Ecol. 2006, 20, 745–752. [Google Scholar] [CrossRef] [Green Version]
  43. Zaitsev, A.S.; Gongalsky, K.B.; Persson, T.; Bengtsson, J. Connectivity of litter islands remaining after a fire an unburnt forest determines the recovery of soil fauna. Appl. Soil Ecol. 2014, 83, 101–108. [Google Scholar] [CrossRef]
  44. van Breemen, N.; Finzi, A.C. Plant-soil interactions: Ecological aspects and evolutionary implications. Biogeochemistry 1998, 42, 1–19. [Google Scholar] [CrossRef]
  45. Ludwig, J.A.; Tongway, D.J.; Marsden, S.G. Stripes, strands or stipples: Modelling the influence of three landscape banding patterns on resource capture and productivity in semi-arid woodlands, Australia. Catena 1999, 37, 257–273. [Google Scholar] [CrossRef]
  46. Geesing, D.; Felker, P.; Bingham, R.L. Influence of mesquite (Prosopis glandulosa) on soil nitrogen and carbon development: Implications for global carbon sequestration. J. Arid Environ. 2000, 46, 157–180. [Google Scholar] [CrossRef]
  47. Whitford, W.G.; Anderson, J.; Rice, P.M. Stemflow contribution to the ‘fertile island’ effect in creosote bush, Larrea tridentata. J. Arid Environ. 1997, 35, 451–457. [Google Scholar] [CrossRef]
  48. Roberts, C.; Jones, J.A. Soil patchiness in juniper-sagebrush-grass communities of central Oregon. Plant Soil 2000, 223, 45–61. [Google Scholar] [CrossRef]
  49. Bochet, E.; Rubio, J.L.; Poesen, J. Modified topsoil islands within patchy Mediterranean vegetation in SE evolutionarySpain. Catena 1999, 38, 23–44. [Google Scholar] [CrossRef]
  50. Grieve, I.C. Some relationships between vegetation patterns and soil variability in the Forest of Dean, U.K. J. Biogeogr. 1977, 4, 191–199. [Google Scholar] [CrossRef]
  51. Crocker, R.L.; Dickson, B.A. Soil development on recessional moraines of the Herbert and Mendenhall glaciers, southeastern Alaska. J. Ecol. 1957, 45, 169–185. [Google Scholar] [CrossRef]
  52. Wagner, W.L.; Herbst, D.R.; Sohmer, S.H. Manual of the Flowering Plants of Hawai’i, Two Volumes; Bishop Museum Special Publication 83; University Hawai’i Press: Honolulu, HI, USA, 1990; 1854p. [Google Scholar]
  53. Friar, E.A.; Prince, L.M.; Roalson, E.H.; McGlaughlin, M.E.; Cruse-Sanders, J.M.; De Groot, S.J.; Porter, J.M. Ecological speciation in the east Maui-endemic Dubautia (Asteraceae) species. Evolution 2006, 60, 1777–1792. [Google Scholar] [PubMed]
  54. Pérez, F.L. Hot soils and cooler stones: Geoecological influence of volcanic tephra and boulders on soil temperature, and significance for plant distribution in Haleakalā Crater (Maui, Hawai’i). Catena 2017, 158, 9–19. [Google Scholar] [CrossRef]
  55. Kitayama, J.; Mueller-Dombois, D. Vegetation on the wet windward slope of Haleakala, Maui, Hawaii. Pac. Sci. 1992, 46, 197–220. [Google Scholar]
  56. Robichaux, R.H.; Canfield, J.E. Tissue elastic properties of eight Hawaiian Dubautia species that differ in habitat and diploid chromosome number. Oecologia 1985, 66, 77–80. [Google Scholar] [CrossRef]
  57. Robichaux, R.H.; Carr, G.D.; Liebmann, M.; Pearcy, R.W. Adaptive radiation of the Hawaiian silversword alliance (Compositae-Madiinae): Ecological, morphological, and physiological diversity. Ann. Mo. Bot. Gard. 1990, 77, 64–72. [Google Scholar] [CrossRef]
  58. Pérez, F.L. Steady as a rock: Biogeomorphic influence of nurse rocks and slope processes on kūpaoa (Dubautia menziesii) shrubs in Haleakalā Crater (Maui, Hawai’i). Geomorphology 2017, 295, 631–644. [Google Scholar] [CrossRef]
  59. Pérez, F.L. Influence of substrate on the distribution of the Hawaiian silversword (Argyroxiphium sandwicense DC.) in Haleakala (Maui, HI). Geomorphology 2003, 55, 173–202. [Google Scholar] [CrossRef]
  60. Macdonald, G.A.; Abbott, A.T.; Peterson, A.T. Volcanoes in the Sea. The Geology of Hawaii; University Hawai’i Press: Honolulu, HI, USA, 1983. [Google Scholar]
  61. Sherrod, D.R.; Nishimitsu, Y.; Tagami, T. New K-Ar ages and the geologic evidence against rejuvenated-stage volcanism at Haleakalā, East Maui, a postshield volcano of the Hawaiian island chain. GSA Bull. 2003, 115, 683–694. [Google Scholar] [CrossRef]
  62. Giambelluca, T.W.; Chen, Q.; Frazier, A.G.; Price, J.P.; Chen, Y.-L.; Chu, P.-S.; Eischeid, J.K.; Delparte, D.M. Online Rainfall Atlas of Hawaii. Bull. Am. Meteorol. Soc. 2013, 313–316. [Google Scholar] [CrossRef]
  63. Blumenstock, D.I.; Price, S. Climates of the States: Hawaii. Climatography of the United States 60-51; US Department Commerce Publ.: Washington, DC, USA, 1967; pp. 1–27.
  64. Giambelluca, T.W.; Nullet, D. Influence of the trade-wind inversion on the climate of a leeward mountain slope in Hawaii. Clim. Res. 1991, 1, 207–216. [Google Scholar] [CrossRef]
  65. Pérez, F.L. The role of tephra covers on soil moisture conservation at Haleakala’s crater (Maui, Hawai’i). Catena 2009, 76, 191–205. [Google Scholar] [CrossRef]
  66. Whiteaker, L.D. The vegetation and environment in the Crater District of Haleakala National Park. Pac. Sci. 1983, 37, 1–24. [Google Scholar]
  67. Noguchi, Y.; Tabuchi, H.; Hasegawa, H. Physical factors controlling the formation of patterned ground on Haleakala, Maui. Geogr. Annl. 1987, 69A, 329–342. [Google Scholar] [CrossRef]
  68. Siegel, S.M.; Carroll, P.; Corn, C.; Speitel, T. Experimental studies on Hawaiian silverswords (Argyroxiphium spp.): Some preliminary notes on germination. Bot. Gaz. 1970, 131, 277–280. [Google Scholar] [CrossRef]
  69. Goldstein, G.; Drake, D.R.; Melcher, P.; Giambelluca, T.W.; Heraux, J. Photosynthetic gas exchange and temperature-induced damage in seedlings of the tropical alpine species Argyroxiphium sandwicense. Oecologia 1996, 106, 298–307. [Google Scholar] [CrossRef] [PubMed]
  70. Pérez, F.L. Biogeomorphic influence of soil depth to bedrock, volcanic ash soils, and surface tephra on silversword distribution, Haleakalā Crater (Maui, Hawai’i). Geomorphology 2015, 243, 75–86. [Google Scholar] [CrossRef]
  71. Soil Survey Staff. Keys to Soil Taxonomy, 12th ed.; USDA, Natural Resources Conservation Service: Washington, DC, USA, 2014.
  72. Sherrod, D.R.; Hagstrum, J.T.; McGeehin, J.P.; Champion, D.E.; Trusdell, F.A. Distribution, 14C chronology, and paleomagnetism of latest Pleistocene and Holocene lava flows at Haleakalā volcano, Island of Maui, Hawai’i: A revision of lava flow hazard zones. J. Geophys. Res. B 2006, 111, B05205. [Google Scholar] [CrossRef]
  73. USGS (US Geological Survey). The Age of Young Lava Flows on Haleakala’s Crater Floor, East Maui Volcano; U.S. Geological Survey, Hawaiian Volcano Observatory: Reston, VA, USA, 2003. Available online: www.accuracyingenesis.com/haleak.html (accessed on 8 March 2019).
  74. Kleier, C.; Rundel, P. Microsite requirements, population structure and growth of the cushion plant Azorella compacta in the tropical Chilean Andes. Aust. Ecol. 2004, 29, 461–470. [Google Scholar] [CrossRef]
  75. Kittredge, J. Some characteristics of forest floors from a variety of forest types in California. J. For. 1955, 53, 646–647. [Google Scholar]
  76. Brunori, F.; Penzo, M.C.; Torri, D. Soil shear strength: Its measurement and soil detachability. Catena 1989, 16, 59–71. [Google Scholar] [CrossRef]
  77. Davidson, D.T. Penetrometer measurements. In Methods of Soil Analysis, Part 1. Physical and Mineralogical Properties; Black, C.A., Ed.; American Society of Agronomy: Madison, WI, USA, 1965; Volume 9, pp. 472–484. [Google Scholar]
  78. Zimbone, S.M.; Vickers, A.; Morgan, R.P.C.; Vella, P. Field investigations of different techniques for measuring surface soil shear strength. Soil Technol. 1996, 9, 101–111. [Google Scholar] [CrossRef]
  79. Bouwer, H. Intake rate: Cylinder infiltrometer. In Methods of Soil Analysis, Part 1. Physical and Mineralogical Properties, 2nd ed.; Page, A.L., Miller, R.H., Keeney, D.R., Eds.; American Society of Agronomy: Madison, WI, USA, 1986; Volume 9, pp. 825–844. [Google Scholar]
  80. Brotherson, J.D.; Rushforth, S.R. Influence of cryptogamic crusts on moisture relationships of soils in Navajo National Monument, Arizona. Great Basin Nat. 1983, 43, 73–78. [Google Scholar]
  81. Folk, R.L. Petrology of Sedimentary Rocks, 3rd ed.; Hemphill: Austin, TX, USA, 1980. [Google Scholar]
  82. Soil Survey Staff. Soil Taxonomy; Agriculture Handbook 436; Natural Resources Conservation Service: Washington, DC, USA, 1975.
  83. Munsell Soil Color Charts; Macbeth, Kollmorgen Instruments Corp.: Newburgh, NY, USA, 1992.
  84. Bisdom, E.B.A.; Dekker, L.W.; Schoute, J.F.T. Water repellency of sieve fractions from sandy soils and relationships with organic material and soil structure. Geoderma 1993, 56, 105–118. [Google Scholar] [CrossRef]
  85. Smith, R.T.; Atkinson, K. Techniques in Pedology. A Handbook for Environmental and Resource Studies; Elek Science: London, UK, 1975. [Google Scholar]
  86. Pitty, A.F. Geography and Soil Properties; Methuen: London, UK, 1979. [Google Scholar]
  87. Brady, N.C.; Weil, R.R. The Nature and Properties of Soils, 14th ed.; Prentice-Hall: Upper Saddle River, NJ, USA, 2008. [Google Scholar]
  88. Ball, D.F. Loss-on-ignition as an estimate of organic matter and organic carbon in non-calcareous soils. J. Soil Sci. 1964, 15, 84–92. [Google Scholar] [CrossRef]
  89. Nathan, M.V.; Stecker, J.A.; Sun, Y. Soil Testing in Missouri. A Guide for Conducting Soil Tests in Missouri; Division of Plant Sciences, College of Agriculture, Food and Natural Resources, University of Missouri: Columbia, MO, USA, 2012. [Google Scholar]
  90. Nathan, M.V.; Sun, Y. Methods for Plant Analysis. A Guide for Conducting Plant Analysis in Missouri; Division of Plant Sciences, University of Missouri Soil and Plant Testing Laboratory: Columbia, MO, USA, 2006. [Google Scholar]
  91. d’Agostino, R.; Pearson, E.S. Tests for departure from normality. Empirical results for the distributions of b2 and √b1. Biometrika 1973, 60, 613–622. [Google Scholar] [CrossRef]
  92. Jones, T.A. Skewness and kurtosis as criteria of normality in observed frequency distributions. J. Sediment. Petrol. 1969, 39, 1622–1627. [Google Scholar] [CrossRef]
  93. Sokal, R.R.; Rohlf, F.J. Biometry: The Principles and Practice of Statistics in Biological Research, 3rd ed.; Freeman: San Francisco, CA, USA, 1995. [Google Scholar]
  94. Miller, R.L.; Kahn, J.S. Statistical Analysis in the Geological Sciences; Wiley: New York, NY, USA, 1962. [Google Scholar]
  95. Rohlf, F.J.; Sokal, R.R. Statistical Tables, 3rd ed.; Freeman: San Francisco, CA, USA, 1994. [Google Scholar]
  96. Bailey, N.T.J. Statistical Methods in Biology, 3rd ed.; Cambridge University Press: Cambridge, UK, 1995. [Google Scholar]
  97. Tiedemann, A.R.; Klemmedson, O. Effect of mesquite trees on vegetation and soils in the desert grassland. J. Range Manag. 1977, 30, 361–367. [Google Scholar] [CrossRef]
  98. Stevenson, F.J. Humus Chemistry. Genesis, Composition, Reactions; Wiley: New York, NY, USA, 1994. [Google Scholar]
  99. Schaetzl, R.J.; Anderson, S. Soils. Genesis and Geomorphology; Cambridge University Press: Cambridge, UK, 2005. [Google Scholar]
  100. Mahaney, W.C.; Voros, J.; Krishnamani, R.; Hancock, R.G.V.; Aufreiter, S.; Milner, M.W.; Allen, C.C.R. Physico-geochemical and mineral composition of neem tree soils and relation to organic properties. Geogr. Annl. 2016, 98A, 143–154. [Google Scholar] [CrossRef]
  101. Kosmas, C.S.; Moustakas, N.; Danalatos, N.G.; Yassoglou, N. The Spata field site: I. The impacts of land use and management on soil properties and erosion. II. The effect of reduced moisture on soil properties and wheat production. In Mediterranean Desertification and Land Use; Brandt, C.J., Thornes, J.B., Eds.; Wiley: New York, NY, USA, 1996; pp. 207–228. [Google Scholar]
  102. Krull, E.S.; Skjemstad, J.O.; Baldock, J.A. Functions of Soil Organic Matter and the Effect on Soil Properties; CSIRO Land & Water, PMB 2: Glen Osmond, Australia, 2004; pp. 1–129. [Google Scholar]
  103. Nanzyo, M.; Shoji, S.; Dahlgren, R. Physical characteristics of volcanic ash soils. In Volcanic Ash Soils: Genesis, Properties and Utilization; Shoji, S., Nanzyo, M., Dahlgren, R., Eds.; Elsevier: Amsterdam, The Netherlands, 1993; pp. 189–207. [Google Scholar]
  104. Gemma, J.N.; Koske, R.E.; Habte, M. Mycorrhizal dependency of some endemic and endangered Hawaiian plant species. Am. J. Bot. 2002, 89, 337–345. [Google Scholar] [CrossRef] [Green Version]
  105. Serna, M.D.; Borras, R.; Legaz, F.; Primo-Millo, E. The influence of nitrogen concentration and ammonium/nitrate ratio on N-uptake, mineral composition and yield of citrus. Plant Soil 1992, 147, 13–23. [Google Scholar] [CrossRef]
  106. Schmid, R. Descriptive nomenclature and classification of pyroclastic deposits and fragments: Recommendations of the IUGS Subcommission on the Systematics of Igneous Rocks. Geology 1981, 9, 41–43. [Google Scholar] [CrossRef]
  107. De Paepe, P.; Stoops, G. A classification of tephra in volcanic soils. A tool for soil scientists. In Soils of Volcanic Regions in Europe; Arnalds, O., Bartoli, F., Buurman, P., Oskarsson, H., Stoops, G., García-Rodeja, E., Eds.; Springer: Berlin, Germany, 2007; pp. 119–125. [Google Scholar]
  108. Soane, B.D. The role of organic matter in soil compactibility: A review of some practical aspects. Soil Tillage Res. 1990, 16, 179–201. [Google Scholar] [CrossRef]
  109. Franzluebbers, A.J. Water infiltration and soil structure related to organic matter and its stratification with depth. Soil Tillage Res. 2002, 66, 197–205. [Google Scholar] [CrossRef]
  110. Xu, G.; Fan, X.; Miller, A.J. Plant nitrogen assimilation and use efficiency. Ann. Rev. Plant Biol. 2012, 63, 153–182. [Google Scholar] [CrossRef] [PubMed]
  111. Walsh, R.P.D.; Voigt, P.J. Vegetation litter: An underestimated variable in hydrology and geomorphology. J. Biogeogr. 1977, 4, 253–274. [Google Scholar] [CrossRef]
  112. Chapin, F.S. The mineral nutrition of wild plants. Ann. Rev. Ecol. Syst. 1980, 11, 233–260. [Google Scholar] [CrossRef]
  113. Foth, H.D. Fundamentals of Soil Science; Wiley: New York, NY, USA, 1990. [Google Scholar]
  114. Shoji, S.; Nanzyo, M.; Dahlgren, R. Productivity and utilization of volcanic ash soils. In Volcanic Ash Soils: Genesis, Properties and Utilization; Shoji, S., Nanzyo, M., Dahlgren, R., Eds.; Elsevier: Amsterdam, The Netherlands, 1993; pp. 209–251. [Google Scholar]
  115. Nanzyo, M.; Yamasaki, S.-I. Phosphorus-bearing mineral in fresh andesite and rhyolite tephras in northern part of Japan. Phosphorus Res. Bull. 1998, 8, 95–100. [Google Scholar] [CrossRef]
  116. Tisdall, J.M.; Oades, J.M. Organic matter and water-stable aggregates in soils. J. Soil Sci. 1982, 33, 141–163. [Google Scholar] [CrossRef]
  117. Haydu-Houdeshell, C.-A.; Graham, R.G.; Hendrix, P.F.; Peterson, A.C. Soil aggregate stability under chaparral species in southern California. Geoderma 2018, 310, 201–208. [Google Scholar] [CrossRef]
  118. National Park Service. Subalpine Shrubland. Plants of Haleakala National Park. U.S. National Park Service. n.d. Available online: https://www.nps.gov/hale/learn/nature/upload/Subalpine-Shrubland.pdf (accessed on 25 September 2017).
  119. Krushelnycky, P.D.; Starr, F.; Starr, K.; Longman, R.J.; Frazier, A.G.; Loope, L.L.; Giambelluca, T.W. Change in trade wind inversion frequency implicated in the decline of an alpine plant. Clim. Chang. Response 2016, 3, 1. [Google Scholar] [CrossRef]
  120. Ekern, P.C. Direct interception of cloud water on Lanaihale, Hawaii. Proc. Soil Sci. Soc. Am. 1964, 28, 419–421. [Google Scholar] [CrossRef]
  121. Hartt, C.E.; Neal, M.C. The plant ecology of Mauna Kea, Hawaii. Ecology 1940, 21, 237–266. [Google Scholar] [CrossRef]
  122. Mueller-Dombois, D. Ecological relations in the alpine and subalpine vegetation on Mauna Loa, Hawaii. J. Indian Bot. Soc. 1967, 96, 403–411. [Google Scholar]
  123. Kobayashi, H.K. Ecology of the Silversword, Argyroxiphium sandwicense DC. (Compositae), Haleakala Crater, Hawaii. Ph.D. Dissertation, University of Hawai’i, Honolulu, HI, USA, 1973. [Google Scholar]
  124. Ritter, A.; Regalado, C.M.; Guerra, J.C. Quantification of fog water collection in three locations of Tenerife (Canary Islands). Water 2015, 7, 3306–3319. [Google Scholar] [CrossRef]
  125. Prada, S.; Menezes de Sequeira, M.; Figueira, C.; Vasconcelos, R. Cloudwater interception in the high altitude tree heath forest (Erica arborea L.) of Paul da Serra massif (Madeira, Portugal). Hydrol. Process. 2012, 26, 202–212. [Google Scholar] [CrossRef]
  126. Hendrix, L.B. Post-eruption succession on Isla Fernandina, Galápagos. Madroño 1981, 28, 242–254. [Google Scholar]
  127. Jäger, H.; Tye, A.; Kowarik, I. Destruction without extinction: Long-term impacts of an invasive tree species on Galápagos highland vegetation. J. Ecol. 2009, 97, 1252–1263. [Google Scholar] [CrossRef]
  128. Facelli, J.M.; Pickett, S.T.A. Plant litter: Its dynamics and effects on plant community structure. Bot. Rev. 1991, 57, 1–32. [Google Scholar] [CrossRef]
  129. Pérez, F.L. Some effects of giant Andean stem-rosettes on ground microclimate, and their ecological significance. Int. J. Biometeorol. 1989, 33, 131–135. [Google Scholar] [CrossRef]
  130. van Breemen, N. Soils as biotic constructs favouring net primary productivity. Geoderma 1993, 57, 183–212. [Google Scholar] [CrossRef]
Figure 1. (A) Close-up of densely packed kūpaoa foliage; note the tightly overlapping, small imbricate leaves; area shown is ~35 cm wide. Photo: Hk-591-02, 7 August 2002. (B) View of the study site, ~2675 m, ~11° gradient, looking north toward the Ko’olau Gap—seen on the upper left. Several large cinder cones rise from the crater floor, (~2300 m), including Ka ma’o li’i (center), and Pu’u o Māui (summit: 2479 m, upper right). Note the many pyroclastic blocks littering the ground, and the hundreds of shrubs across the extensive slope on the crater walls. Photo: Hk-24-11, 26 June 2011.
Soilsystems 03 00031 g001
Figure 2. Location of the study area. (A) Hawaiian archipelago; island of Maui is shaded black. Latitude (N) and longitude (W) are indicated. (B) Maui. Scale in km, elevations in m; contour interval is ~305 m (=1000 feet). Stippled area in east Maui shows current extent of Haleakalā National Park. (C) Western portion of Haleakalā crater; stippled rectangle indicates main study site on the inner crater wall, dark dot shows location of thermograph monitoring. Cinder cones and the Sliding Sands hiking trail are indicated. Scale in km, elevations in m; contour interval is 61 m (=200 feet). Base map: USGS, State of Hawai’i, Principal Islands, 1971, scale 1:500,000.
Soilsystems 03 00031 g002
Figure 3. Spatial distribution of surface litter beneath a kūpaoa shrub; diagram shows average dimensions of shrubs and litter islands (Lis) sampled (Table 1). LI is shown by stippled texture. Upslope is to the top; small blank arrow at bottom indicates slope direction. Scale is 1 m long. Key. T: shrub trunk; S: location of litter and soil samples; AB: Shrub and/or litter island width across the slope; CD: Downslope shrub length; TL: Downslope litter island length; PS: Location of paired soil sample, ~150–200 cm from canopy edge. Direction of prevailing NE trade winds is shown by a dark dash-line arrow on the lower left; north direction is shown by a large blank arrow.
Soilsystems 03 00031 g003
Figure 4. (A) Large kūpaoa shrub, ~152 cm tall, ~230 cm wide, at ~2635 m on a 23° slope; upslope is toward the top. Note the prominent cover of light-gray foliage litter forming the litter island (LI)—which essentially coincides with the plant’s width—under the shrub canopy and downslope from it; maximum litter depth near the shrub stem was 73 mm. This slope is mantled with block- and cobble-sized tephra and cinder; white scale is 100 cm long. Photo: Hk-375-05, 24 July 2005. (B) Surface view of kūpaoa leaf litter on a LI under a ~114-cm tall shrub, ~2690 m, on a 24° slope. Area shown is ~40 × 30 cm; litter depth was ~35 mm. Photo: Hk-94-05, 20 July 2005.
Soilsystems 03 00031 g004
Figure 5. Aggregated crust horizon under Oi1 litter horizon, gathered below a 265-cm-wide kūpaoa shrub at ~2660 m. (A) Top view, upper crust surface; several kūpaoa leaves remain attached or embedded within the dark horizon. This fragment is ~98 × 72 mm; scale is in cm. (B) Side view of the same fragment; maximum thickness at center is ~26 mm. Photos: Hk-256-14 and Hk-258-14, 10 September 2014.
Soilsystems 03 00031 g005
Figure 6. Cumulative-frequency distributions for surficial Torvane soil shear strength (kg/cm2), on 50 pairs of samples. Key. Dark arrows indicate mean values. Line of dark dots on the right indicates measurements under LIs, below kūpaoa canopy; median: 0.750 kg/cm2, mean: 0.747 kg/cm2. Line of crossmarks on the left show readings on paired bare soils; median: 0.160 kg/cm2, mean: 0.172 kg/cm2.
Soilsystems 03 00031 g006
Figure 7. Particle-size distributions, grain diameter (mm) for surface (0–10 cm depth) soils. Each graphic envelope indicates textural variation for 20 whole samples—soil and gravel fractions combined. (A) Soils under LIs, below kūpaoa canopy. (B) Adjacent bare soils (control).
Soilsystems 03 00031 g007
Figure 8. Color variation for dry soil samples. (A) Bare soils (control). (B) soils under LIs, below kūpaoa canopy; each diagram includes 20 data points. All sample colors covered by the Munsell 10YR hue sheet [83]. Graphic key: Circles show percentages of samples associated with a color; the largest circle on each graph indicates modal—most common—color: a: 10YR 3/4 (dark yellowish brown), b: 10YR 2/1 (black).
Soilsystems 03 00031 g008
Figure 9. Relationship between soil organic matter (SOM) (log10-transformed percentage) and various soil properties for 20 paired samples. Key. Triangles: Samples under kūpaoa; circles: Adjacent bare (control) soils. Dashed lines represent slopes of individual polynomial regressions; upper graph legend shows untransformed SOM percentages. (A) Available Ca2+ (ppm), Y = 286.791 + 784.089X + 2057.979X2, R = 0.959, R2 = 0.920, p < 0.001. (B) Cation-exchange capacity (CEC) (cmol+ kg−1), Y = 3.097 + 4.798X + 13.537X2, R = 0.983, R2 = 0.966, p < 0.001. (C) Soil water content % at field capacity (WRC, −33 kPa), Y = 30.352 + 12.472X + 24.462 X2, R = 0.916, R2 = 0.839, p < 0.001.
Soilsystems 03 00031 g009
Figure 10. Small kūpaoa at ~2720 m on 12° slope, N 22° E aspect; the ~29-cm-high, ~30-cm-wide shrub intercepted moisture from incoming winds during 4–5 afternoon hours. The darker soil area downhill of plant faces prevailing trade winds and has accumulated fog-drip water along a ~20-cm-wide, 4–5-cm-deep band near shrub. Area shown is ~50 cm-wide; upslope is to the top. Photo: Hk-143-01, 29 July 2001.
Soilsystems 03 00031 g010
Figure 11. Daily temperature (°C) fluctuations measured with mechanical thermographs at ~2335 m, 5–11 August 2002. Key. 1. Air temperature (+10 cm); 2. Bare-soil temperature (5 cm depth); 3. Soil (5 cm depth) under canopy of an isolated, ~125-cm-high, 223-cm-wide kūpaoa; thermal sensor was buried ~23 cm away from the shrub stem.
Soilsystems 03 00031 g011
Figure 12. Conceptual model depicting main influences of kūpaoa on pedogenesis under, and downslope of, shrubs. Plant outline drawn from photographs, shown on an ~11° slope, oriented along a south (left) to north (right) axis. Letters refer to biological or geomorphic interactions, numerals to microclimatic effects. Key. A: Most prominent factors are litterfall (solid black arrow), leading to the buildup of litter islands, and B: Downward transfer of soil organic matter through soil profile (dashed black arrow); C: Increased water input and infiltration through soil under canopy, due to higher SOM content; D (round inset): Black arrow shows downhill displacement of litter horizon due to slope creep movement; E (round inset): Thin stable soil crust, immediately below litter horizon, with high shear strength and resistance to erosion. 1.1: Fog interception of air masses brought by NE trade winds, which causes 1.2: Fog-drip addition of water to soil beneath plant crown; 2: Diurnal canopy shading and nightly heat reradiation of ground below shrub; 3: Dense canopy growth near the ground surface offers protection against litter erosion by wind. Consult text for additional explanations.
Soilsystems 03 00031 g012
Table 1. Average values (± S.D.) and value ranges for litter islands under the canopy of kūpaoa shrubs at ~2610–2710 m, and for the shrubs associated with these litter islands, Haleakalā crater. Litter thickness reported was measured next to the shrub stem. See text for additional details.
PropertyAverage ± S.D.Lowest ValueHighest Value
Litter thickness, mm41.9 ± 17.62273
Litter island width, cm177.0 ± 56.589253
Litter island length, cm130.4 ± 41.573206
Litter island area, m21.917 ± 1.00.5663.608
Slope angle, °16.2 ± 6.8424
Shrub height, cm110.6 ± 25.768152
Shrub width, cm202.5 ± 37.0131253
Shrub length, cm175.7 ± 47.8111268
Table 2. Average values (± S.D.) for selected physical and chemical properties of kūpaoa leaf litter collected on litter islands at ~2610–2710 m; sample N: eight. For comparison, the column on the right shows data for litter properties of silverswords at Haleakalā, at ~2510 m [35]. Dry-soil color indicates the mode for the sampling set (Munsell Soil Colors [83]). Water content shown is water-retention capacity (WRC, −33 kPa). Total nitrogen was determined by micro-Kjeldahl method. See text for details.
Litter PropertiesKūpaoa LitterSilversword Litter
Color, mode10YR 5/1 to 6/1, gray10YR 4/1, dark gray
Water content, %309.7 ± 50.4450.9 ± 121.3
Total Nitrogen, %0.504 ± 0.080.281 ± 0.22
Calcium, %2.81 ± 0.230.78 ± 0.43
Magnesium, %0.42 ± 0.090.04 ± 0.03
Potassium, %0.21 ± 0.040.02 ± 0.01
Phosphorus, %0.048 ± 0.010.004 ± 0.001
CEC, cmol+ kg−1182.6 ± 10.143.4 ± 24.0
pH5.92 ± 0.176.31 ± 0.2
Table 3. Average values (± S.D.) for physical and chemical soil properties below kūpaoa and on paired control areas; sample N: 20 for physical properties, 10 for chemical properties. For comparison, column on the right shows data for soils below silverswords in Haleakalā, ~2510 m [35]; values for control soils near silverswords (not shown) were similar to those near kūpaoa. Fines include silt and clay (<0.063 mm). D50 is the median grain size. Dry-soil Munsell colors [83] indicate the mode for each dataset. Water content is water-retention capacity (WRC, −33 kPa). Nitrogen ppm is the sum of extracted nitrate (NO3) and ammonium (NH4+). CEC: cation-exchange capacity. Significance levels refer to K–S test comparisons for soils under kūpaoa with control soils. Key: a: p < 0.001, b: p < 0.005, c: No significant difference.
Soil PropertiesBare Soils (Control) near KūpaoaSoils under KūpaoaSoils under Silverswords
Gravel, % c15.7 ± 12.119.0 ± 13.614.6 ± 10.5
Sand, % c92.8 ± 2.392.2 ± 2.294.9 ± 2.0
Fines, % c7.2 ± 2.37.8 ± 2.25.1 ± 2.0
D50, mm c0.56 ± 0.500.57 ± 0.53-
Color, mode a10YR 3/4, dark yellowish brown10YR 2/1, black10YR 3/2, very dark grayish brown
Organic matter, % a1.25 ± 0.363.38 ± 1.731.90 ± 0.3
Infiltration, mm/min a20.10 ± 9.38103.24 ± 51.6-
Water content, % a30.4 ± 3.0 44.9 ± 6.530.6 ± 3.7
Calcium, ppm a326.1 ± 1391321.1 ± 562271.3 ± 90
Magnesium, ppm a37.7 ± 16119.6 ± 6622.5 ± 8
Potassium, ppm a47.7 ± 20362.5 ± 78134.6 ± 41
CEC (cmol+ kg−1) a3.44 ± 0.89.61 ± 3.61.89 ± 0.5
Phosphorus, ppm b 1.1 ± 0.366.8 ± 4.59.6 ± 2.7
NO3 N, ppm b1.18 ± 0.0841.93 ± 43.3-
NH4+ N, ppm b9.17 ± 8.816.0 ± 11.49-
(NO3/NH4) ratio b0.22 ± 0.144.64 ± 5.04-
Nitrogen, ppm a10.35 ± 8.957.92 ± 46.4-
pH c6.42 ± 0.156.65 ± 0.266.88 ± 0.18
Table 4. Description of two representative soil profiles from the research site, at ~2705 m, Haleakalā crater. Colors are for dry soils (Munsell Soil Colors [83]); consult Soil Survey Staff [71] for horizon symbols and further details.
Profile 1.Vitrandic Haplustept, on a 7° slope, aspect: N41°E. All samples taken ~15 cm downslope from plant stem, and under the canopy of a kūpaoa shrub, 110 cm-h, 160 cm-w, 111 cm-l. Abundant volcanic tephra cobbles (~5–10 cm) with small rounded vesicles ≤2–5 mm diameter present on ground surface ≤15 cm upslope of the stem base.
Horizon, Depth, cmDescription
Oi1 +5.8–0 to Oe1Litter horizon 58 mm thick near stem base. Foliage, with a few short twig (≤43 mm long, ≤2.5 mm thick) fragments; lanceolate leaves mostly whole (30-–5 mm long) on top to partially fragmented at the horizon bottom. Fibric organic material, only slightly decomposed. Dry modal color: 10YR 5/1 (gray); pH: 6.04; total N: 0.507%, water-retention capacity (WRC, −33 kPa): 319.1%; no discernible water repellency. Mor litter type with abrupt, smooth boundary to
A 0–2.6Horizon 8–26 mm thick is a firm, cohesive to slightly fragile, frangible, aggregated crust horizon; well-developed platy structure, can be detached but easily splits into fragments ≤44 × 40 mm. Dry color: 10YR 2/1(black). Shear strength (mean 10 readings): 0.459 kg/cm2. Shear strength and horizon thickness were highest near shrub stem; both gradually drop toward the periphery of litter island. Compressibility (mean 10 readings): 1.320 kg/cm2. Abrupt, smooth boundary to
A1 2.6–5Sand, with 29.1% gravel; D50: 0.82 mm; soil fraction: 91.7% sand, 8.3% fines. Friable, single-grain structureless dry consistence; slightly sticky, non-plastic wet consistence. Mild water repellency. Dry color: 10YR 3/2, very dark grayish brown, organic matter: 2.8%, pH: 6.70. CEC: 6.5 cmol+ kg−1; WRC: 39.3%. Clear, smootYes, it is correct. ‘kPa’ is the symbol for kilopascals, and is used in several other places in the text.
h boundary to
A2 5–29Sand, with 45.6% gravel, mostly coarse volcanic cinder with small vesicles; D50: 1.83 mm; soil fraction: 91.3% sand, 8.7% fines. Friable, single-grain structureless dry consistence; slightly sticky, non-plastic wet consistence. No water repellency. Dry color: 10YR 4/4 (dark yellowish brown), organic matter: 2.4%, pH: 6.72. CEC: 6.0 cmol+ kg−1; WRC: 36.5%. Clear, smooth boundary to
A3 29–36Sand, with 45.2% gravel; D50: 1.70 mm; soil fraction: 89.6% sand, 10.4% fines. Friable, single-grain structureless; very slightly sticky, non-plastic wet consistence. No water repellency. Color: 10YR 3/3, (dark brown), organic matter: 2.5%, pH: 6.68; CEC: 6.3 cmol+ kg−1; WRC: 37.1%. Gradual, smooth boundary to
C 36–45+Coarse sand, with abundant (≥60%) gravel composed of pebble- and cobble-sized volcanic cinder and tephra prevented further auger penetration, D50: ~32.0 mm.
Profile 2Vitrandic Haplustept, ~200 cm away and on one side, of the canopy edge of shrub where profile 1 was examined, on bare soil, with same slope angle and orientation. Numerous volcanic-tephra cobbles (~5–10 cm) and pebbles (2.5–5 cm) present on the site.
Horizon, Depth, cmDescription
A 0–2Sand, with 48.4% gravel, mainly coarse volcanic cinder with small vesicles; D50: 1.98 mm; soil fraction: 90.9% sand, 9.1% fines. Friable, single-grain structureless. Dry color: 10YR 4/6 (dark yellowish brown), organic matter: 1.7%, pH 6.63; WRC: 29.8%; no water repellency through whole profile. Clear, smooth boundary to
A1 2–11Dry, dusty sand horizon, with 30.4% gravel; D50: 0.81 mm; soil fraction: 88.7% sand, 11.3% fines. Friable, single-grain structureless. Dry color: 10YR 5/6 (yellowish brown), organic matter: 1.8%, pH: 6.6. CEC: 3.9 cmol+ kg−1; WRC: 27.4% water. Shear strength (mean 10 readings): 0.171 kg/cm2. Compressibility (mean 10 readings): 0.084 kg/cm2. Clear, smooth boundary to
A2 11–43Sand, with 40.9% gravel, volcanic cinder; D50: 1.54 mm; soil fraction: 93.6% sand, 6.4% fines. Friable, single-grain structureless. Dry color: 10YR 4/4 (dark yellowish brown), organic matter: 1.7%, pH: 6.7. Gradual smooth boundary to
C1 43–85Sand, with 45.3% gravel, volcanic cinder; D50: 1.77 mm; soil fraction: 92.2% sand, 7.8% fines. Friable, single-grain structureless. Dry color: 10YR 3/2 (very dark grayish brown), organic matter: 0.6%, pH: 6.73. Gradual, smooth boundary to
C2 85–95+Coarse sand, with abundant (≥75%) gravel composed of cobble- and pebble-sized volcanic tephra and cinder prevented further auger penetration, D50: ~45.0 mm.

