Abstract
Terrestrial consumption of the potent greenhouse gas methane (CH4) is a critical aspect of the future climate, as CH4 concentrations in the atmosphere are projected to play an increasingly important role in global climate forcing. Anaerobic oxidation of methane (AOM) has only recently been considered a relevant control on methane fluxes from terrestrial systems. We performed in vitro anoxic incubations of intact peat from Utqiaġvik (Barrow), Alaska using stable isotope tracers. Our results showed an average potential AOM rate of 15.0 nmol cm3 h−1, surpassing the average rate of gross CH4 production (6.0 nmol cm3 h−1). AOM and CH4 production rates were positively correlated. While CH4 production was insensitive to additions of Fe(III), there was a depth:Fe(III) interaction in the kinetic reaction rate constant for AOM, suggestive of stimulation by Fe(III), particularly in shallow soils (<10 cm). We estimate AOM would consume 25–34% of CH4 produced under ambient conditions. Soil genetic surveys showed phylogenetic links between soil microbes and known anaerobic methanotrophs in ANME groups 2 and 3. These results suggest a prevalent role of AOM to net CH4 fluxes from Arctic peatland ecosystems, and a probable link with Fe(III)-reduction.
1. Introduction
Anaerobic oxidation of methane (AOM) affects global climate, as it constrains the atmospheric release of the powerful greenhouse gas methane (CH4). In marine systems, AOM linked to sulfate-reduction consumes approximately 90% of methane before it can be released into the atmosphere [1,2]. In terrestrial systems, there is increasing evidence that AOM plays a similar role in controlling net CH4 fluxes from soils and freshwater systems [3,4,5]. The Arctic contains vast quantities of soil organic carbon, much of which is increasingly vulnerable to mobilization as soils warm and permafrost thaws [6]. Global climate change is disproportionately warming Arctic systems, enhancing the likelihood of changes in net greenhouse gas fluxes to the atmosphere from warming soils [7]. Northern peatlands traditionally act as sinks of carbon dioxide (CO2) and sources of CH4 to the atmosphere [8,9,10]. Estimates of the AOM pathway and its impact on net ecosystem CH4 balance within intact northern soils are limited [3,11,12,13,14,15], highlighting the need for additional studies to determine the role of AOM in CH4 cycling in northern peatlands.
A number of mechanisms have been identified for the AOM process. Marine AOM is most commonly linked with sulfate-reduction, conducted by either a single sulfate-reducing bacterium or via the consortium of a sulfate-reducing bacterium and a methanotrophic archaeal partner [1]. For terrestrial systems, AOM is often not related to sulfate reduction, as electron acceptors other than sulfate are more abundant and energetically favorable [16]. Recent work in terrestrial systems has found evidence for AOM associated with non-sulfate terminal electron acceptors [3,11,17,18,19,20,21], including a number of studies identifying a potential linkage to iron-reduction [17,20,22,23,24,25], which may be highly relevant to the Fe-rich oligotrophic soils found on the Arctic Coastal Plain. While the drivers of terrestrial AOM and their interactions with electron acceptors are still somewhat confounded, alternative electron acceptors are known to inhibit methanogenesis [26,27,28] directly via microbial competition [29], and/or indirectly through toxic intermediate products like NO2− [30]. Regardless, alternative electron acceptors could suppress net CH4 flux through AOM, even if they do not directly inhibit methanogenesis.
Advances in the genetic characterization of the AOM pathway have given us a means for identifying the presence and activity of AOM-associated organisms, including 16S rRNA and functional genes such as pmoA, pMMO, and mmoX, which code for methanotrophic-specific enzymes [3,31,32]. In marine systems, archeal methanotrophs, also known as “ANME” for ANaerobic MEthanotroph, have been differentiated into the phylogenetically-distinct groups ANME-1 (with subgroups a and b), ANME-2 (with subgroups a, b, and c), and ANME-3 [1,33]. The ANME groups do not cover all known members of the AOM community, particularly in terrestrial and some extreme environments [34,35], but they have been shown to display some interesting functional characteristics. For example, Mohanty et al. [36] found type I methanotrophs were stimulated by nitrogenous fertilizers, while type II were inhibited. Further, Knoblauch et al. [37] saw a shift from type I to type II aerobic methanotrophs in Siberian peat under warming conditions.
Despite recent advances in our understanding of the mechanisms and organisms associated with terrestrial AOM, relatively few studies have measured AOM rates in Arctic systems. The drained thaw lake basin landscapes on the North Slope of Alaska offer a unique location for the measurement of terrestrial AOM. The landscape is populated with vegetated drained thermokarst lake basins (hereafter referred to as “basins”), underlain by deep continuous permafrost that create a natural chronosequence of soil development [38,39]. As basins age, the depth of the surface organic layer grows, reducing contact with the iron (Fe)-rich mineral layer. The active layer constitutes the seasonally unfrozen surface soils that contain material available to biological processes and contribute to ecosystem respiration and CH4 flux. Measurements of ecosystem respiration within the basins show high Fe-reduction rates, high native loads of iron, and low or non-measurable amounts of nitrate and sulfate electron acceptors when active layer soils are thawed [40]. The basins are currently net sources of CH4 to the atmosphere. This system is, however, projected to become wetter and warmer with climate change [41,42], a condition likely to enhance CH4 production as new basins develop [39,43]. As AOM is a substrate limited process, increased CH4 production may in turn enhance conditions for AOM [13,31,44], yet no studies exist that investigate the role of AOM in high-Arctic CH4 production.
Current methods for in situ rate estimates of CH4 production and oxidation involve the combination of stable isotopes and methanogenic inhibition chemicals [45,46]. Given evidence that methanogenic inhibition chemicals do, in fact, impact AOM in both culture and environmental samples [47,48,49], the best available method for determining AOM rates and relative importance to net CH4 flux is in vitro incubation [12]. Laboratory incubations of intact soils ride the line between realistic [50] and controllable.
To our understanding, there are no previously-published AOM rates within high Arctic peatland systems [15]. Our research was motivated by field-based evidence of net CH4 flux suppression by Fe and humic substances, with an unknown mechanism: inhibition of methanogenesis or stimulation of AOM [51]. To determine the importance of AOM to net CH4 fluxes in high Arctic wetland systems and the influence of inorganic electron acceptors on AOM rates, we performed in vitro incubations of active layer peat soils. We amended soils with treatments of sulfate (SO42−) and ferric iron (Fe(III)-nitrilotriacetic acid). Given the importance of Fe reduction to the anaerobic carbon cycle in these soils, we hypothesize that increased Fe(III) will stimulate AOM in this system, impacting overall CH4 flux from the soils. We also present genetic data from basin soils to confirm the presence of microorganisms related to known anaerobic methanotrophs.
2. Materials and Methods
2.1. Study System
Soils were collected from sites located within the Barrow Environmental Observatory research reserve near Utqiaġvik, AK (71.2963 N, 156.5891 W) [39,52]. The Alaskan North Slope landscape is dominated by drained thaw lake basins, which are the footprints of shallow thermokarst lakes that have vegetated since draining [39]. The basins represent a successional chronosequence, commonly categorized into four age classes based on time since draining: young (0–50 years), medium (50–300 years), old (300–2500 years), and ancient (2500–5000 years) [38,39]. Basin succession has been linked to soil productivity, with a strong relationship with organic matter content, bulk density, Fe content, and soil respiration [38,40,52,53,54]. As basin age increases, organic matter accretion grows the depth of the organic soil layer over time, increasing the distance between the surface and the mineral soil layers. In young and medium age classes the shallow, less-developed soils have relatively high rates of CH4 production and net flux to the atmosphere, with thinner organic layers, lower organic matter content, and higher bulk density in the active layer [53,55,56]. There is also low availability of sulfate and nitrate electron acceptors in the acidic and anoxic peat soils in the Arctic, where nutrients are scarce and biological uptake is fast and competitive. Basic soil and porewater data from the cores used in this study are presented in Table 1, as measured by methods outlined in Lipson et al. [40]. For more depth-specific information on Utqiaġvik soils, see Lipson et al. 2010 and 2013 [40,52].

Table 1.
Average basin soil characteristics used in incubation.
2.2. Soil Sampling and Incubation Setup
We performed two discrete incubation experiments. For the first incubation experiment, we used soils from three depths (5, 15, and 25 cm) along a single representative core from all of the four basin age classes for a total of 12 samples with no replication to quickly determine which basin age class(es) and depths (if any) had measurable or dynamic AOM activity rates. For the second incubation experiment, we used the results from the first experiment to target basin age classes and depths with promising AOM activity, and explored the interactions between gross AOM rates, gross rates of CH4 production, and terminal electron acceptor treatments using three replicate cores from each of two basin age classes and 12 depths per core for a total of 72 samples in triplicate. All soils used in both experiments were from soil cores extracted in June 2011 with a 12 cm diameter SIPRE corer attached to a handheld gas-powered drill. All soils were collected from waterlogged sites, as previous work showed soil CH4 3- to 5-fold higher in these locations (as opposed to hydrologically mesic soils in micro-topographically raised areas) [53,56,57]. Extracted frozen cores were kept on wet ice in the field, and stored at −80 °C within 2 h of collection. In the lab, 1 cm thick discs were cut out of each core at specific depths with a band saw, weighed and transferred to 1-L glass Mason jars with metal ring lids modified to contain gas impermeable butyl rubber septa (Geo-Microbial Technologies, Inc., Ochelata, OK, USA) and an anaerobic indicator strip (Anaerotest 115112, Merck Millipore, Burlington, MA, USA). Jars containing the intact “pucks” of frozen soils were sealed, the headspace immediately vacuumed for 2 min, and purged with UHP helium gas for 5 min. Jars were wrapped in foil and stored in dark incubators at 10 °C for one week to allow for full soil thaw. Jar headspaces were purge-flushed with ultra-high purity helium (99.999%) for 2 min every other day, to remove any O2 released or produced upon thaw.
To begin each incubation, an aqueous treatment solution was added to the jar via the septum, the headspace volume was vacuum flushed with UHP helium for 5 min, and then allowed to equilibrate to atmospheric pressure through tubing submerged in O2-free deionized water. After the jar reached atmospheric pressure, a CH4 mixture was injected to create an initial jar headspace of 5% CH4 with a 5.03 atom percent (AP%) 13/12C isotopic composition. Jars were incubated at 10 °C (range: 8–11 °C) in the dark. All anaerobic indicator test strips signaled anoxia within the incubation chambers throughout the incubation. Time series samples at 24, 336, 480, 720, and 960 h (i.e., 1, 14, 20, 30, and 40 days) were collected into 10-mL glass serum vials fitted with gas-tight 10-mm butyl rubber stoppers and stored in dark refrigeration until analysis.
2.3. Basin AOM Activity
To determine ballpark AOM rates, we conducted a small pilot study using the mass and isotopic signature of CO2 in the headspace to indicate AOM activity. The pilot study used a set of three soil depths (5, 15, and 25 cm) extracted from a single soil core from each of the four basin age classes, for a total of 12 incubations with no replication. No soil amendments were used in the pilot study. Headspace gases were sampled at 24, 48, 120, 216, and 384 h. Headspace samples were analyzed for CO2 concentration (ppmv) and δ13CO2 at the University of California-Davis Stable Isotope Facility (Davis, CA, USA).
Before the pool dilution experiment, which was designed to quantify rates of AOM activity and CH4 production, we used the pilot study to determine if AOM was occurring in the soil cores. In the case of the pilot study, we only followed the production of 13CO2 over time, which must originate from AOM consuming the 13CH4 spike. In other words, AOM must be active if a 13CO2 spike is measurable in the headspace. Jar headspaces were established with 5% of 5.03 AP% CH4. For calculations, isotopic fractionation associated with the anaerobic fermentation processes was assumed negligible, so the δ13C signature of soil respired CO2 was essentially the isotopic signature of the substrate (which was given a value of −24‰ based on recent work in Utqiaġvik, AK, USA) [58]. Non-methanotrophic anaerobic soil respiration is expected to gradually decrease headspace 13CO2 while increasing overall CO2 concentration. AOM, if present, consumes spiked 13CH4, increasing headspace 13CO2 and CO2 mass. Hydrogenotrophic methanogenesis could utilize some of the 13CO2 produced by AOM, however, we ignored this possible feedback as our experiments were not long in duration, and by assuming null methane production we underestimated the rate of 13CO2 reduction. Using mass balance equations for total CO2 and assuming 13CO2 fractionation factors for AOM and anaerobic soil respiration, we calculated the amount of CO2 produced by AOM using an isotope mixing model. AOM rates were calculated as the change in mass of AOM-produced CO2 versus incubation time.
2.4. CH4 and AOM Rate Estimates
We estimated gross CH4 production and consumption (AOM) rates using an isotope pool dilution method slightly modified from von Fischer and Hedin [45] and Smemo and Yavitt [13]. Using mass balance equations and an isotope mixing model, this technique allows us to simultaneously calculate gross methanogenesis and AOM rates.
The isotope pool dilution begins with an initial spike of 13C-enriched CH4 in the headspace of an incubation jar. Subsequently, the amount of 13CH4 in the headspace decreases by two processes: (1) diffusive flow of the labeled substrate into the soil [45], and (2) 13CH4 consumption by AOM. The latter in turn releases 13CO2, representing the only significant source of 13C-enriched CO2 into the headspace. Methanogenesis, on the other hand, produces and releases mostly 12CH4 and 12CO2 into the headspace, while anaerobic soil respiration contributes predominantly 12CO2 into the headspace. Over time, the isotope ratios of headspace CH4 should decrease as AOM continues to draw down 13CH4 from the initial spike. Total mass of CH4 also changes over time depending on the balance between CH4 production and consumption (i.e., headspace CH4 mass increases over time if P > C). Labeled 13C was expressed as atom percent (AP%) in all calculations.
CH4 mass and isotope data were used to calculate an incubation-specific, first-order reaction rate constant (k) for gross CH4 consumption. In these calculations, we assumed an isotopic signature of newly produced CH4 of −60‰, or 1.05 AP% [13,45,59]. The isotope fractionation of AOM has estimates ranging from −2 to −14‰ in terrestrial systems [13,60,61,62]. We used a conservative estimate for this effect using a value of 0‰ in our calculations. Given our 0‰ assumption, we cannot overestimate the effect of AOM. All mass values were standardized to a dry soil weight basis. Net CH4 fluxes were calculated as the rate of CH4 mass change over time. Calculations of gross CH4 consumption and net CH4 flux rates were taken over the entire incubation period. Gross CH4 production rates were calculated by Net Flux = Production − Consumption, as the sum of gross consumption and net CH4 flux rates.
A small number of incubation jars showed positive net increase in CH4 AP%. The magnitude was small and often within the range of instrument precision (~0.0357%). Those results were considered unreliable and were excluded from rate analyses. This is because CH4 AP% can either decrease or see little change during incubation, but not increase. A continuous decline in headspace 13CH4 is expected in the presence of AOM. Without AOM, headspace 13CH4 is likely to decrease initially as a small fraction of 13CH4 diffuses into soil pore space. When jars with increasing CH4 AP% were used in the calculation, we arrived at zero CH4 production. These results were inconsistent with total mass observation in which significant increases in CH4 production were measured at the end of the incubation.
2.5. Treatments
To characterize potential AOM rates more broadly, we incubated a total of 72 soil samples taken from a total of six cores of waterlogged depressions within young and medium age class basins, three from each basin age class. The effect of depth on AOM rates in the pilot study was unclear, thus for this experiment, twelve depths were sampled from each core ranging from 1 to 30 cm below the surface, resulting in the following replication: two basin age classes x three basins per age class x 12 depths per core. To determine the effect of electron acceptors on both methanogenic and AOM rates, treatments of DI water, iron (Fe(III)-nitrilotriacetic acid, or Fe(III)-NTA) and sulfate (K2SO4) were used to alter the amount of available electron acceptors present in incubated soils. Fe-NTA has been used as an electron acceptor in multiple studies of Fe reducers as it is used by common ones such as Geobacter, Shewanella, and Rhodoferax [63,64]. We created common volume treatment solutions using the average frozen weight of incubated soils and basin-specific soil water content. Treatments were designed to deliver equal amounts of electron accepting capacity, resulting in final soil concentrations of 8 mM Fe(III)-NTA and 1 mM K2SO4. Autoclaved treatment solutions were bubbled with UHP helium for 10 min, capped and stored in serum vials with UHP helium headspaces at 10 °C for less than 12 h before administration. We excluded a nitrate treatment, despite evidence of a nitrate-dependent AOM pathway in other systems [18,65]. This was done in deference to the low availability of nitrate found in past research in Utqiaġvik soils, and the possible inhibitory effect nitrogen can have on methanogenesis rates [13,30].
The three treatments were administered in a stratified block design, blocked by core, and stratified into 4 depth classes: top (0–1, 2–3, 5–6 cm), top-middle (8–9, 9–10, 11–12 cm), bottom-middle (14–15, 17–18, 20–21 cm), and bottom (23–24, 26–27, 29–30 cm). Electron acceptor treatments were randomly assigned within each depth class. Samples of headspace gas from each jar were drawn after 24, 336, 480, 720, and 960 h of incubation. Mass and δ13C of CH4 gas in the headspace were measured at the Stable Isotope Facility of the University of California-Davis using a ThermoScientific PreCon-GasBench system interfaced to a ThermoScientific Delta V Plus isotope ratio mass spectrometer (ThermoScientific, Bremen, DE, 0.0357% or 0.2‰ instrument precision). Headspace CO2 mass and isotopic signatures are not needed for rate estimations using the pool dilution method, and were not measured in the full experiment.
2.6. Molecular Analysis
We used two datasets (16S rRNA gene sequences and random shotgun metagenomes) to identify gene sequences from Utqiaġvik soils that are closely related to microbes capable of AOM. 16S rRNA sequences were obtained from the Earth Microbiome Project (EMP) [66]. This study used soil samples of varying depths from the rims and centers of low-centered polygons of old and ancient basins, sampling a total of 12 locations (six basins x high vs. low) times three depths, minus one sample that was lost, for a total of 35 libraries [67]. Sample processing, sequencing, and core amplicon data analyses were performed by the EMP (www.earthmicrobiome.org) and all amplicon and metadata have been made public through the data portal (www.microbio.me/emp). Sequences closely related to ANME groups 1, 2, and 3 [68] were identified by local BLAST of the data set, aligned with known representatives from these groups using the SINA alignment tool (www.arb-silva.de/aligner/) [69], and a maximum likelihood phylogenetic tree was generated using the Fast DNAml application within BioEdit [70].
The metagenomic analysis used the libraries described by Lipson et al. [71]. These represent soils of varying depths from a single medium-aged basin. MG-RAST was used to search for mcrA genes, and the relationships of these sequences to mcrA genes from known ANME clades [72,73,74] was explored using a protein maximum likelihood tree (PROml) with amino acid sequences aligned using CLUSTALW in Bioedit [70].
2.7. Statistical Analyses
Most data were unbalanced due to unequal sample sizes after data screening and were therefore evaluated using the Type III sum of squares from multi-way ANOVA and ANCOVAs, with post-hoc determinations by one-way ANOVA and Tukey honest significant difference tests (both of which are less sensitive to unequal sample size). Soil depths were analyzed as a continuous variable, while depth class was treated as a categorical variable. We used correlation analysis to compare quantities and rates of methane produced and consumed. When necessary, data were transformed to conform to test assumptions of normality and homogeneity of variance. All statistics were performed with R version 3.1.1 [75].
3. Results
3.1. AOM-Associated Microbes and Genes
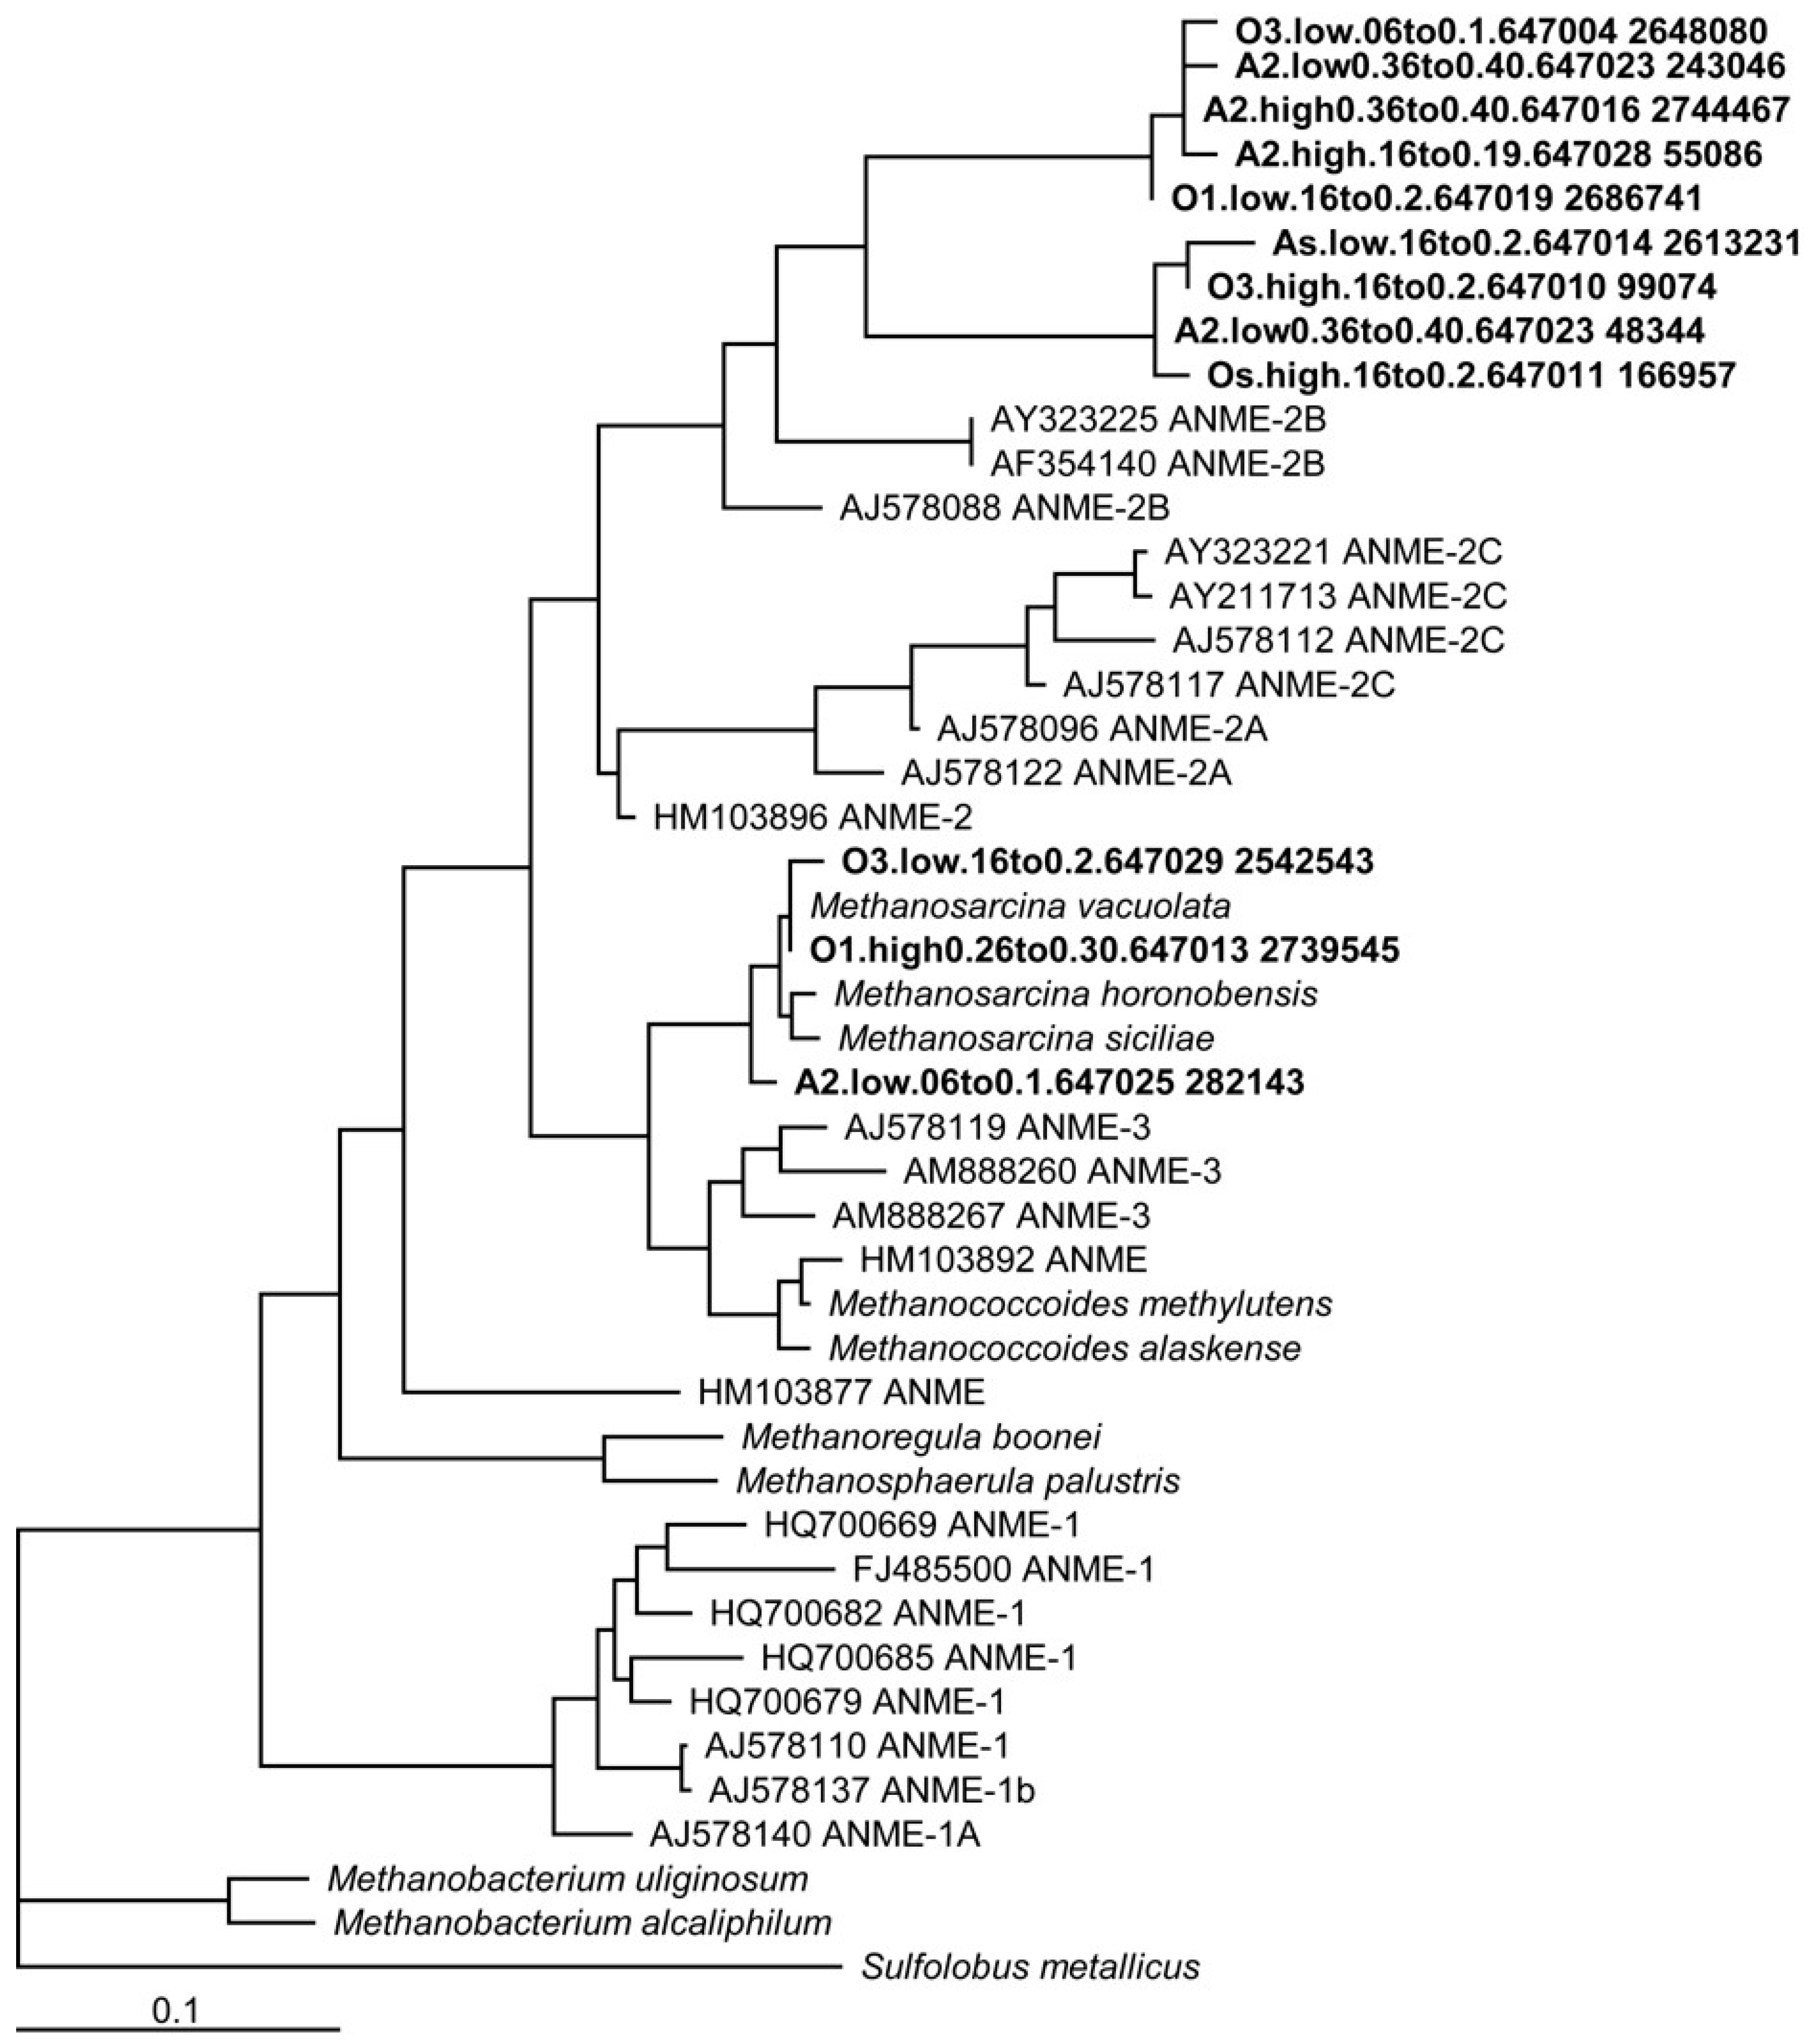
Phylogenetic analysis of 16s rRNA showed the clustering of Utqiaġvik basin soil sequences with known methane-cycling archaea, including ANME groups 2 and 3 (Figure 1). A total of 3306 (out of 2027920) sequences were similar to nitrate-dependent methanotrophs belonging to the phyla NC10. Soils sequenced in this series were exclusively from old and ancient age class basins, and so they are not directly related to the soils incubated for AOM and methanogenesis rates. However, recent studies using 16s rRNA gene sequences in this landscape have shown the ubiquity of methanogen communities and a convergence in microbial composition within the active layer, regardless of basin age class [76]. Therefore, differences in microbial communities between age classes in this ecosystem appear to be more subtle than changes associated with soil depth and microtopography [40,71,77].
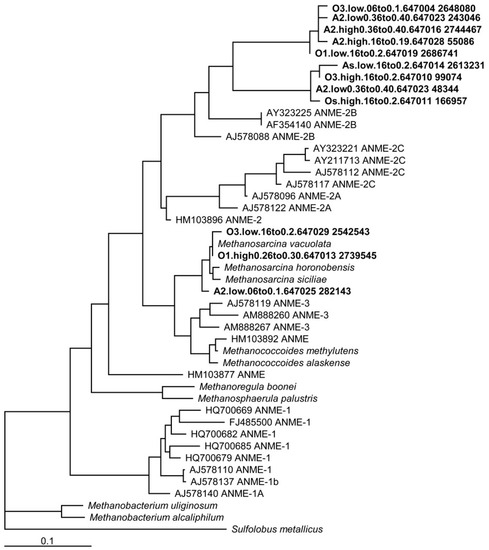
Figure 1.
Phylogenetic tree of 16S rRNA sequences from the Earth Microbiome Project of old and ancient basins, illustrating the relatedness of organisms found in Utqiaġvik soils with other known methane-cycling isolates in ANME groups 2 and 3.
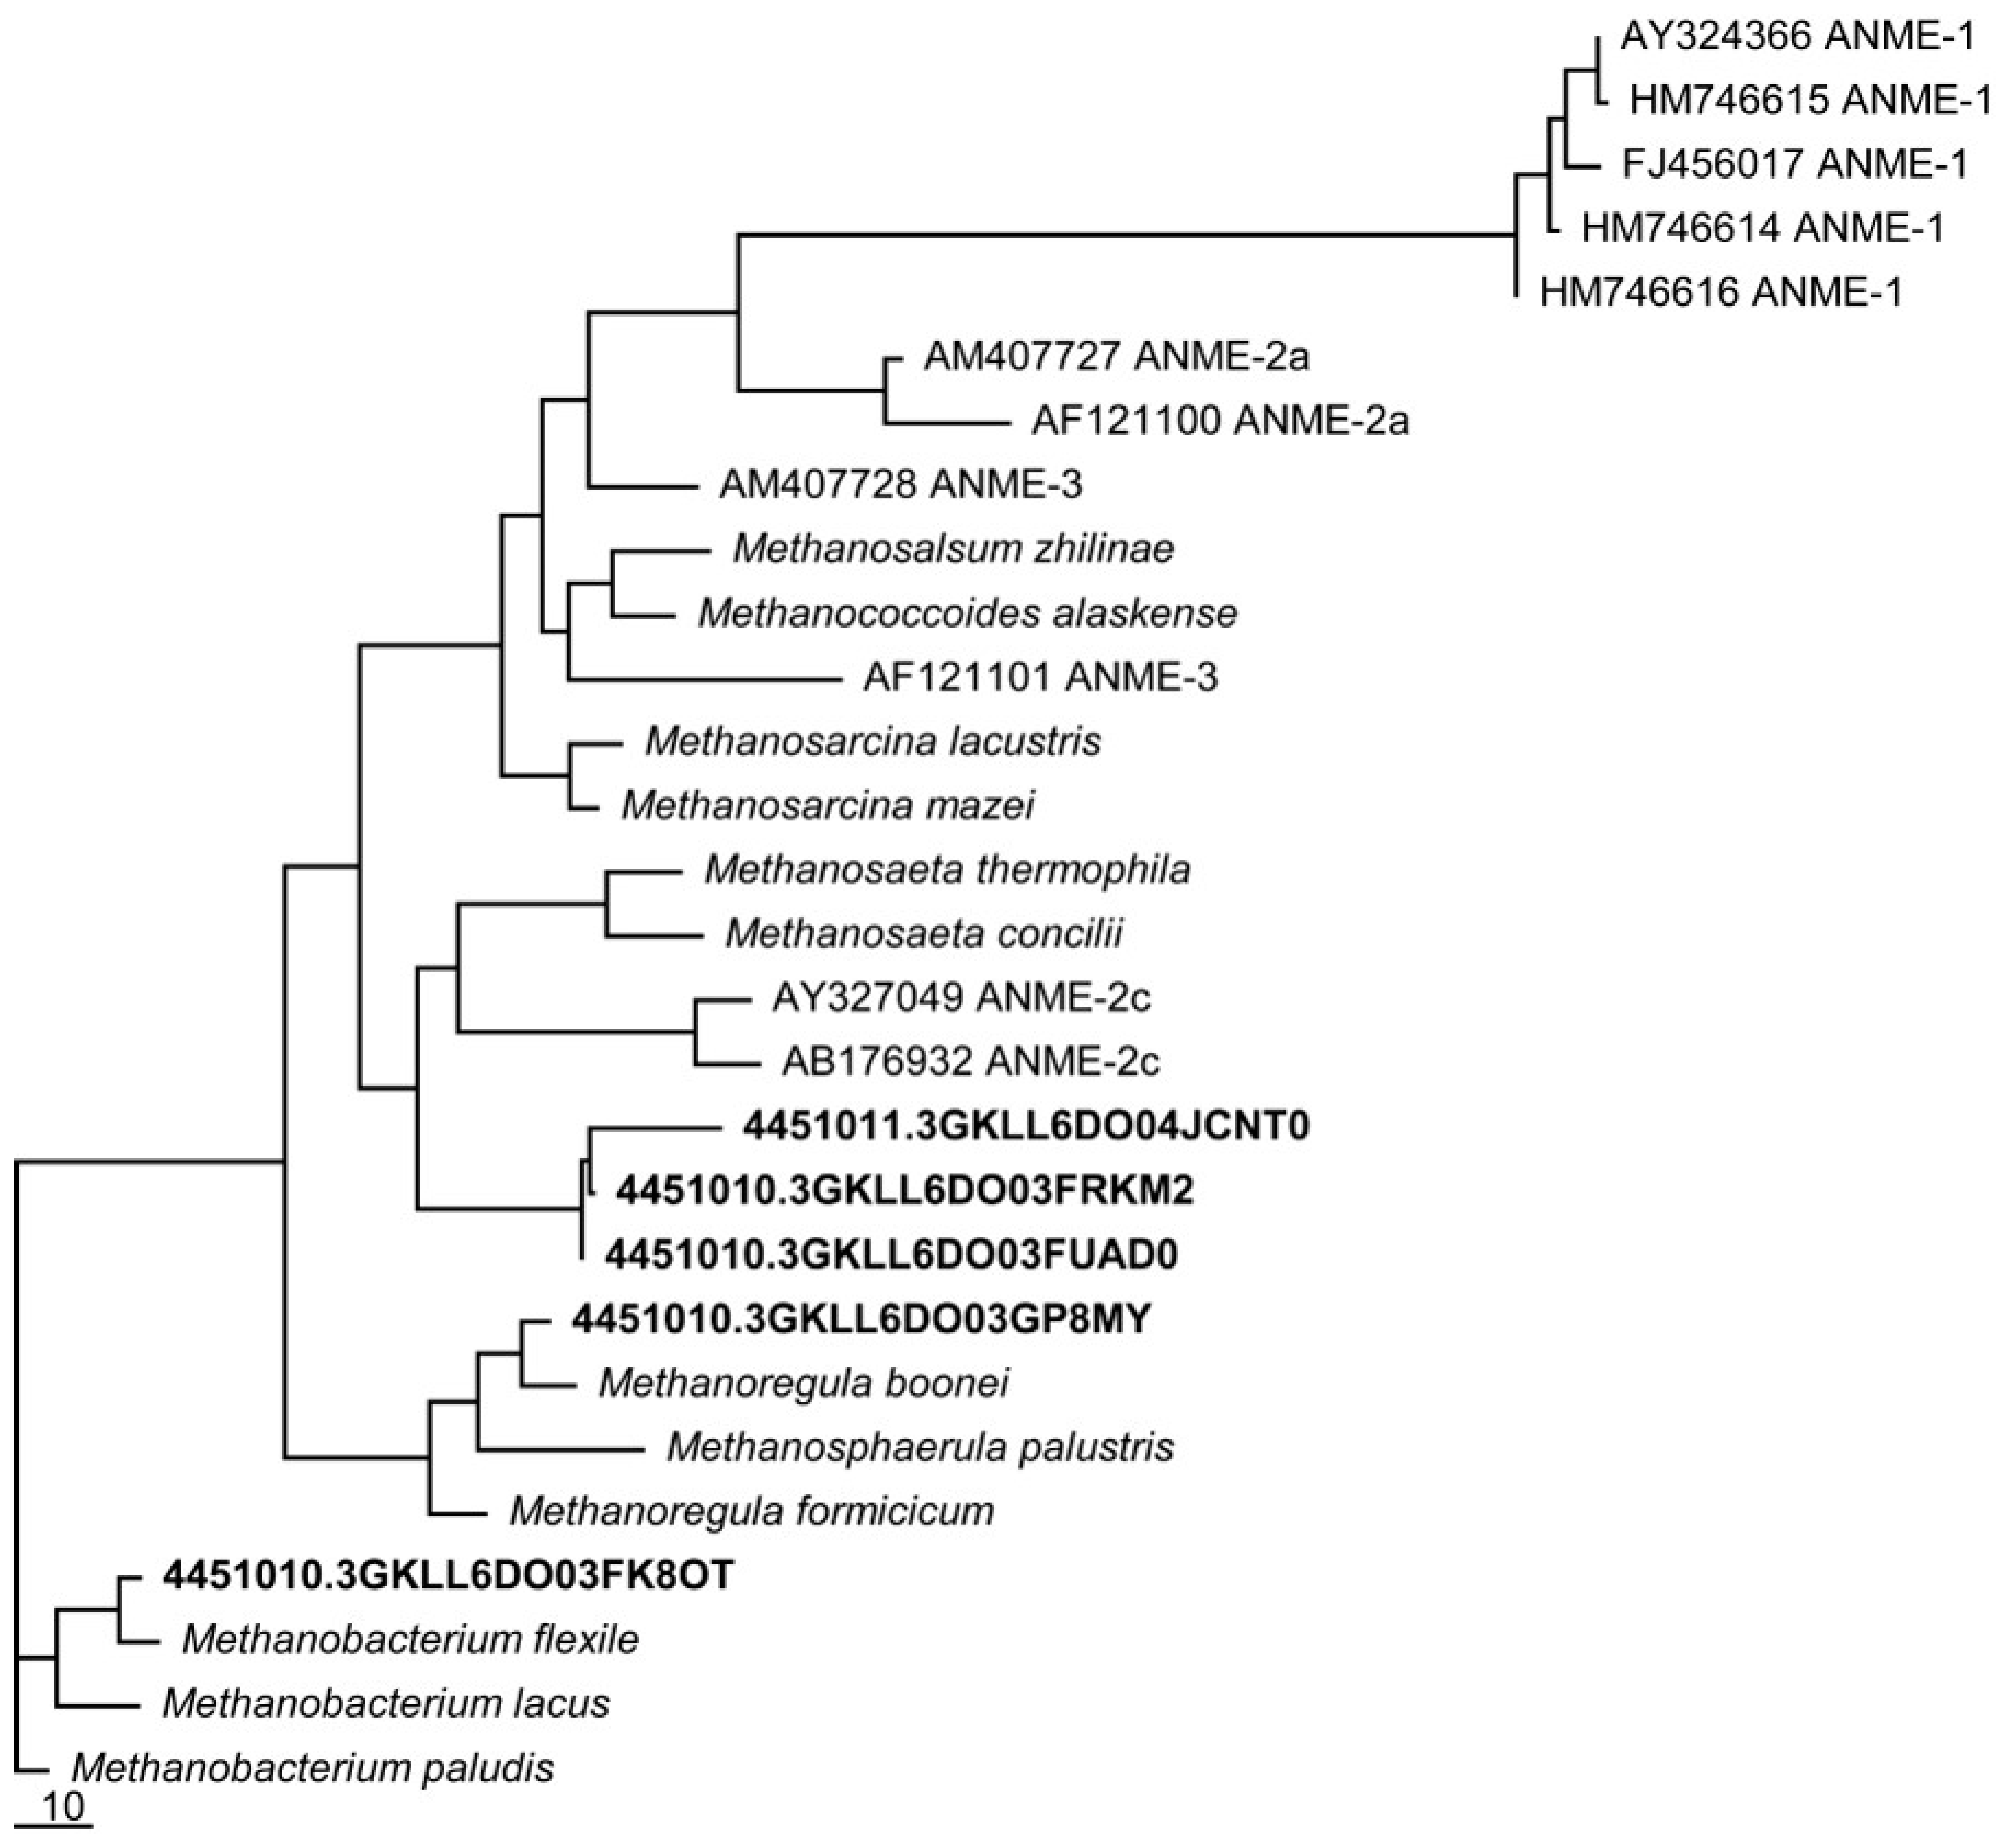
Utqiaġvik soil isolates related to methanogens capable of Fe(III)-reduction were detected [63], namely the Methanosarcina, Methanobacterium palustre, and Methanococcus clades (Figure 2), grouping closely amongst ANME groups 2 and 3, with greater separation from the ANME group 1.
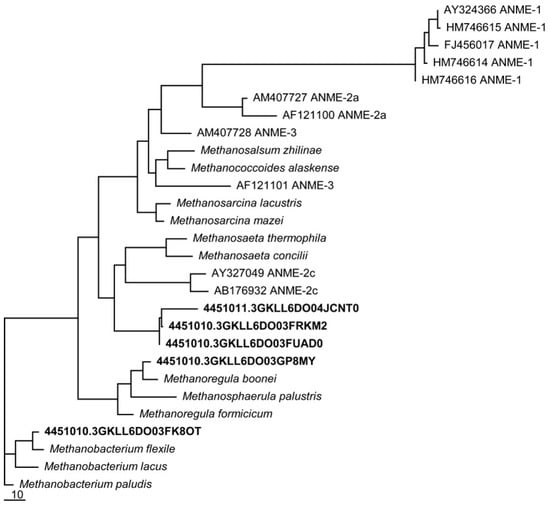
Figure 2.
Phylogenetic tree of mcrA genes from the metagenomes of a single medium-aged basin. Utqiaġvik sequences cluster near mcrA genes known to be associated with the “reverse methanogenesis” pathway of CH4 consumption.
3.2. Pilot Study
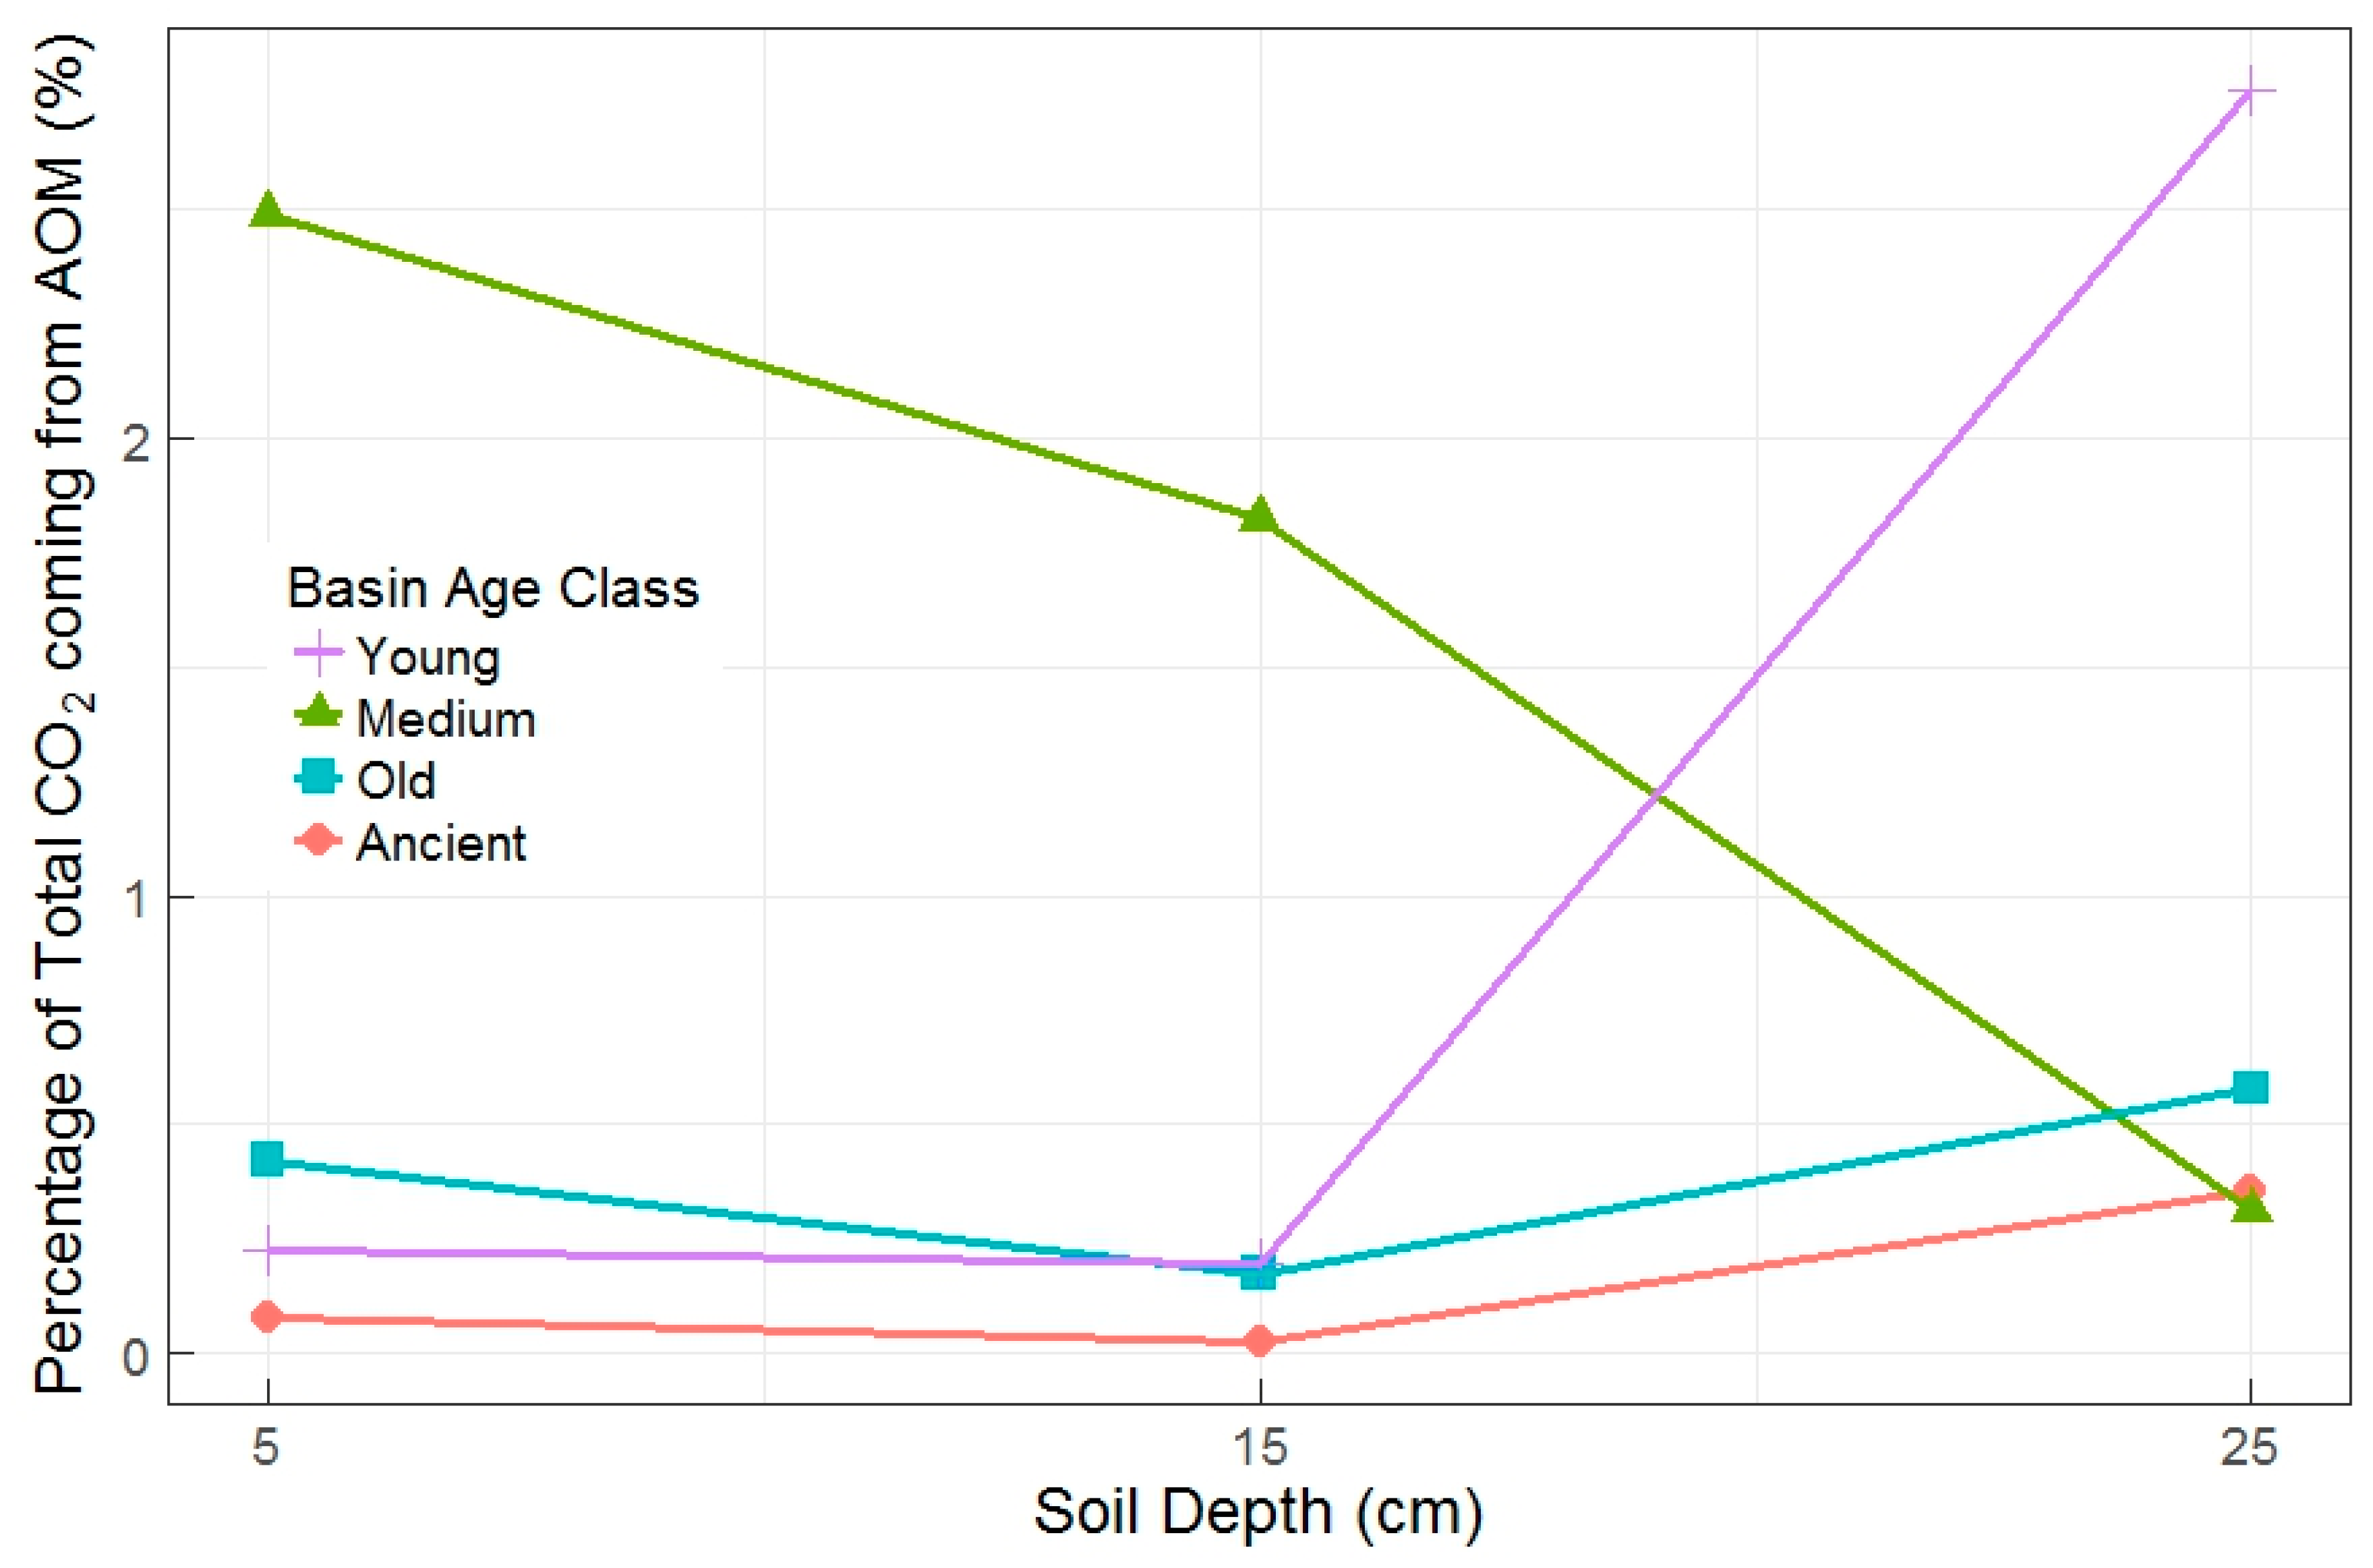
All data in the pilot study showed linear trends of increasing CO2 mass and δ13CO2 over time, indicating AOM activities within incubated soil cores from all age classes. The relative importance of AOM measured during the pilot study was greatest in young and medium age basin soils, but the two age classes had an inconsistent relationship with soil depth (Figure 3). Basin age class and soil depth were most strongly related to total CO2 flux rates (p = 0.018 and 0.006, respectively). There was also an interaction of soil depth x basin age class with AOM rates (interaction p = 0.078), with lower AOM rates found in the deeper layers of old and ancient basins (Figure 3).
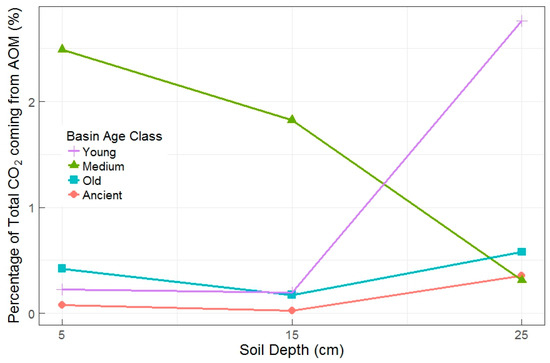
Figure 3.
Percentage of total CO2 attributed to AOM by basin age class and soil depth in the pilot experiment. Proportions represent total amount of CO2 from AOM relative to total amount of CO2 evolved over the course of the incubation (all 384 h). There is one incubation represented per age class and depth interaction (n = 12).
Four of the twelve pilot jars were significantly different than the others in terms of either AOM rates and/or the ratio of AOM CO2 to total CO2 production. The highest AOM rates were measured in soils from the old basin at 5 cm, the medium basin at 5 cm, and the young basin at 25 cm. The three highest values for the percentage of total CO2 coming from AOM were from the medium basin at 15 cm, the medium basin at 5 cm, and the young basin at 25 cm. Total CO2 flux rates were also lower in the young and medium basins (independent of depth). The most dynamic (and often the highest) AOM rates were in soils from young and medium basins, thus, we sampled from only young and medium basins for the full experiment.
3.3. Methane Production and Consumption Rates
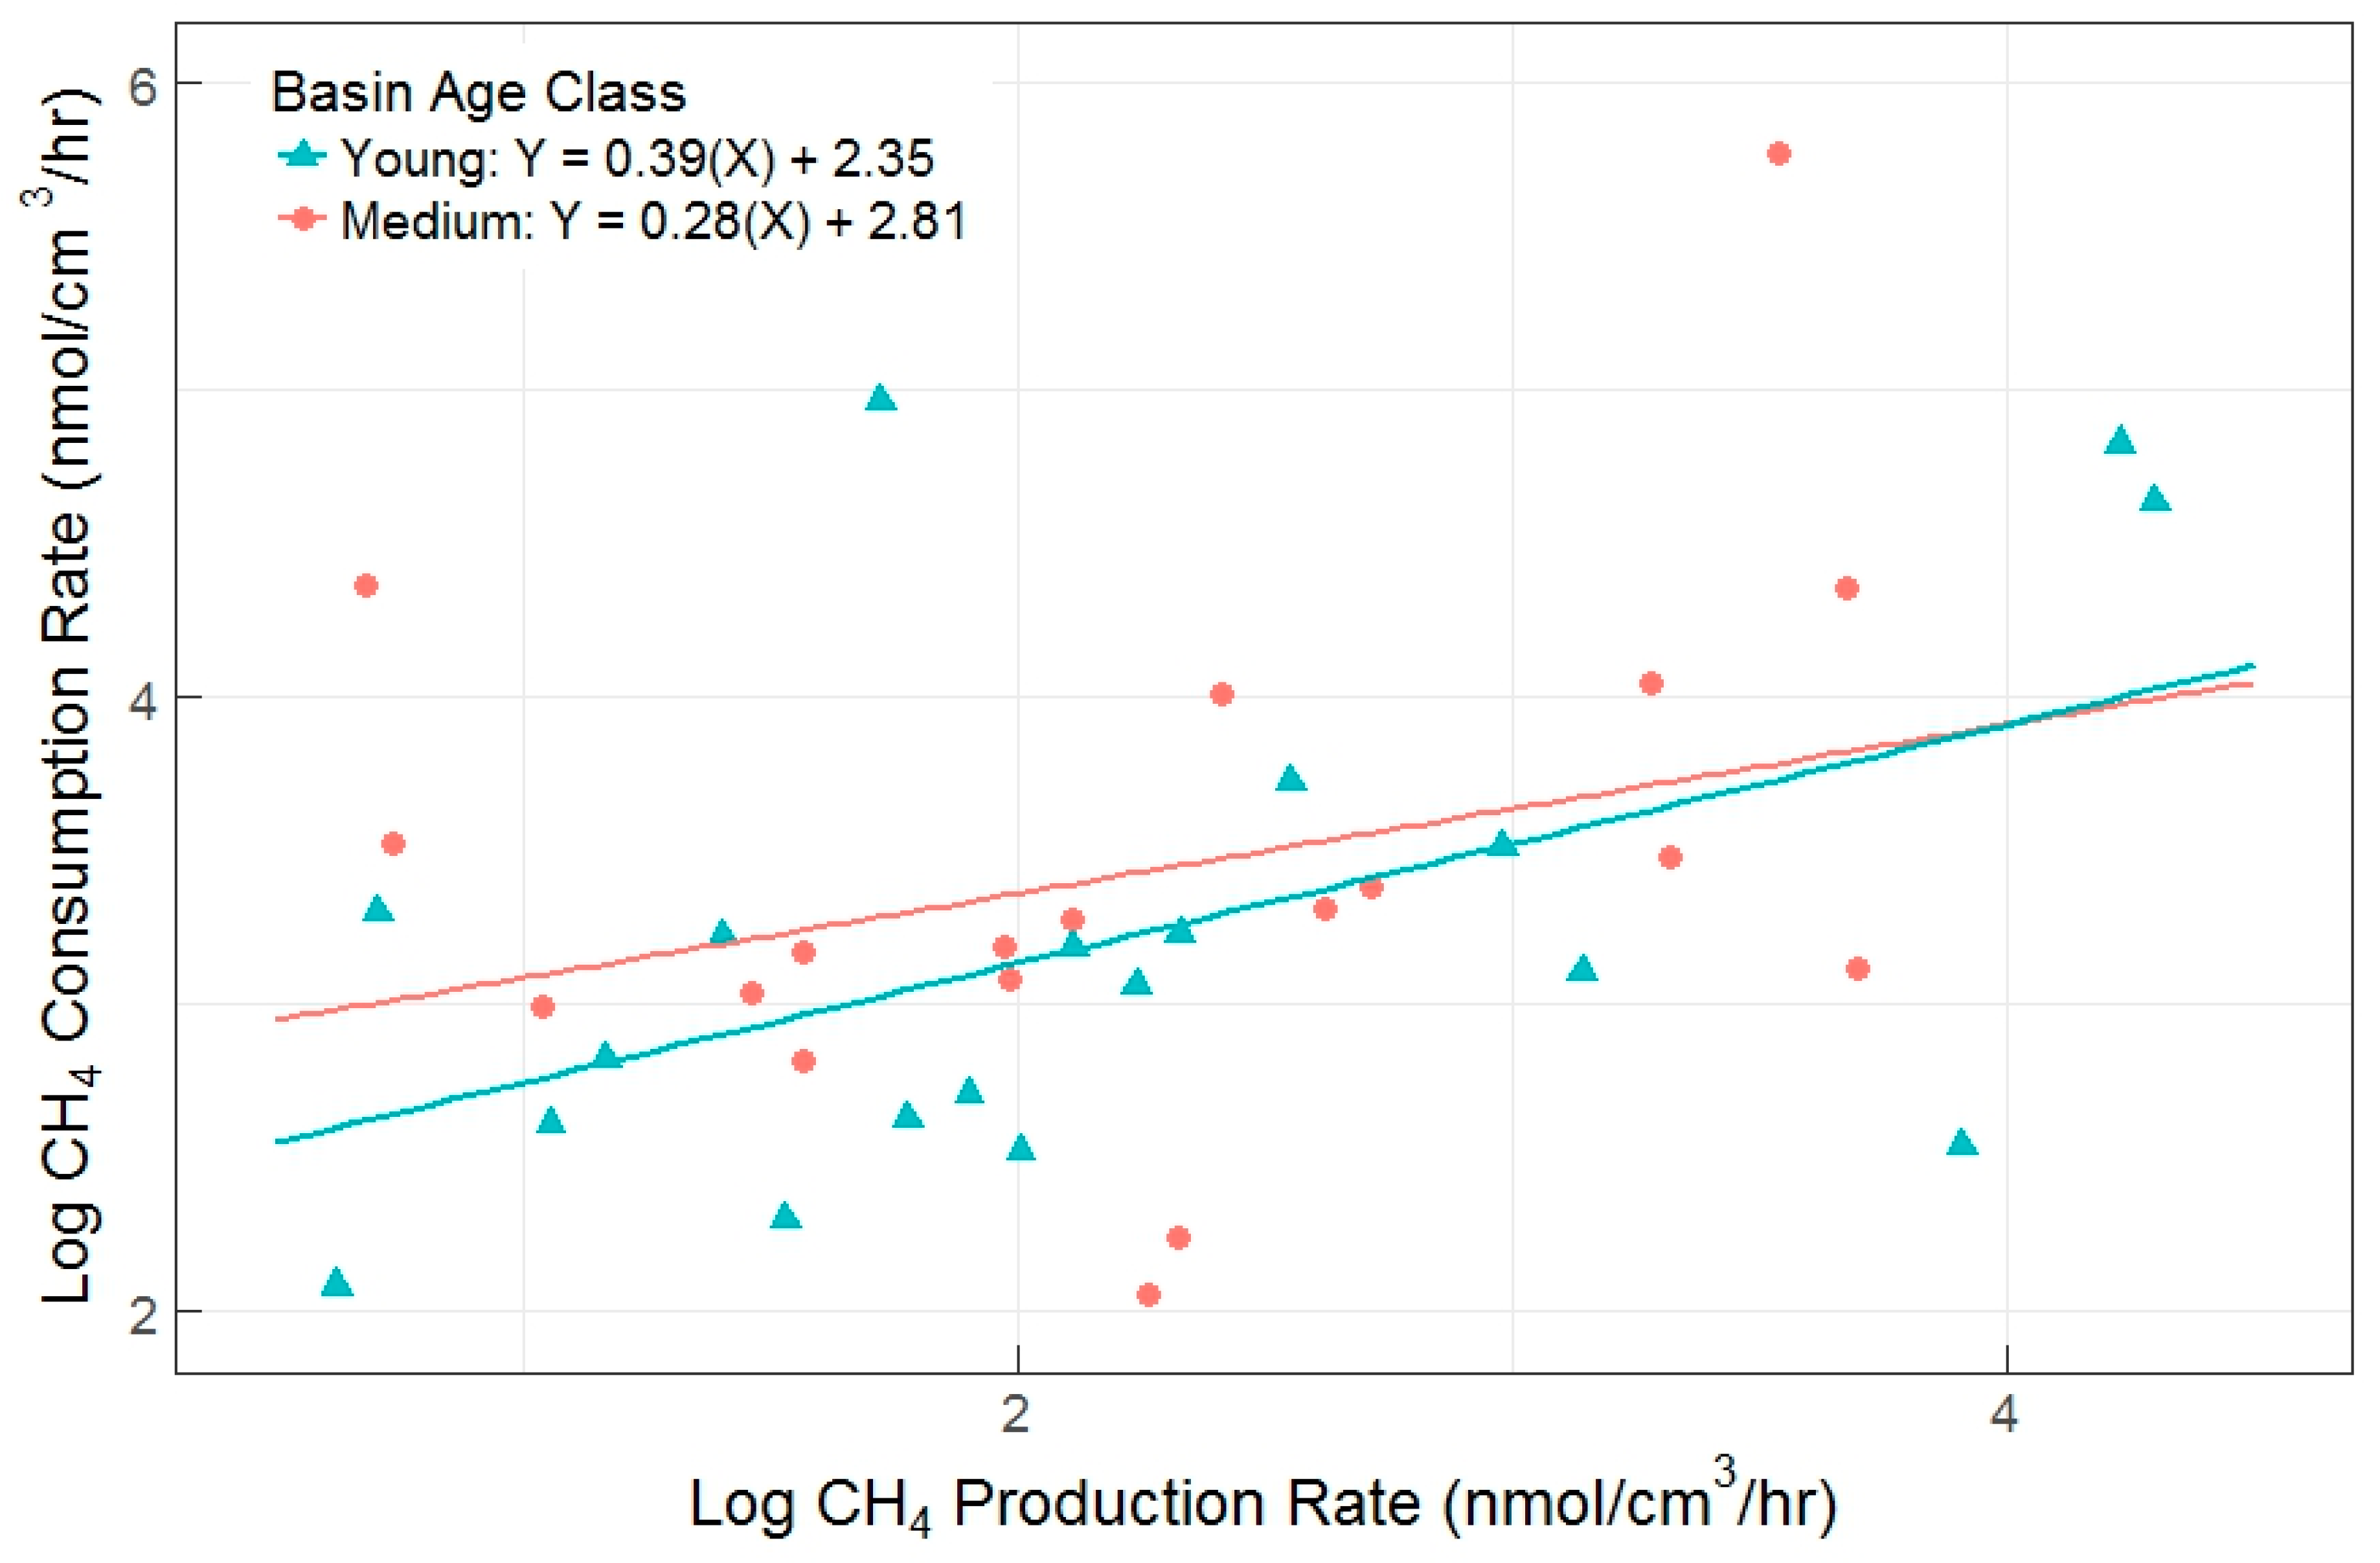
The primary objectives in the full experiment were to determine if the AOM pathway was an important aspect of soil carbon cycling in this system, and to determine possible drivers of differences in gross CH4 production and consumption rates (Figure 4). We found a moderate correlation between the two gross rates, with an overall R2 = 0.51 (p < 0.001) upon removal of a single outlier (consumption rate <1 nmol CH4-C cm−3 h−1). Consumption rates were higher than production rates (overall linear regression slope = 0.34, and y-intercept = 2.55), demonstrating that AOM can eclipse methanogenesis in closed laboratory incubations. This effect was similar between young and medium age classes, which had indistinguishable linear relationships between production and consumption rates (ANOVA p = 0.4911).
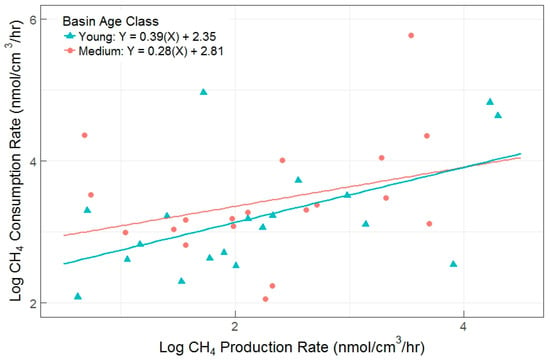
Figure 4.
Gross CH4 production versus gross consumption rates (R2 = 0.51, p < 0.001) for young and medium basin age classes. Each data point represents results from a single incubation, with all incubations represented.
3.4. Basin, Depth and Treatment Effects
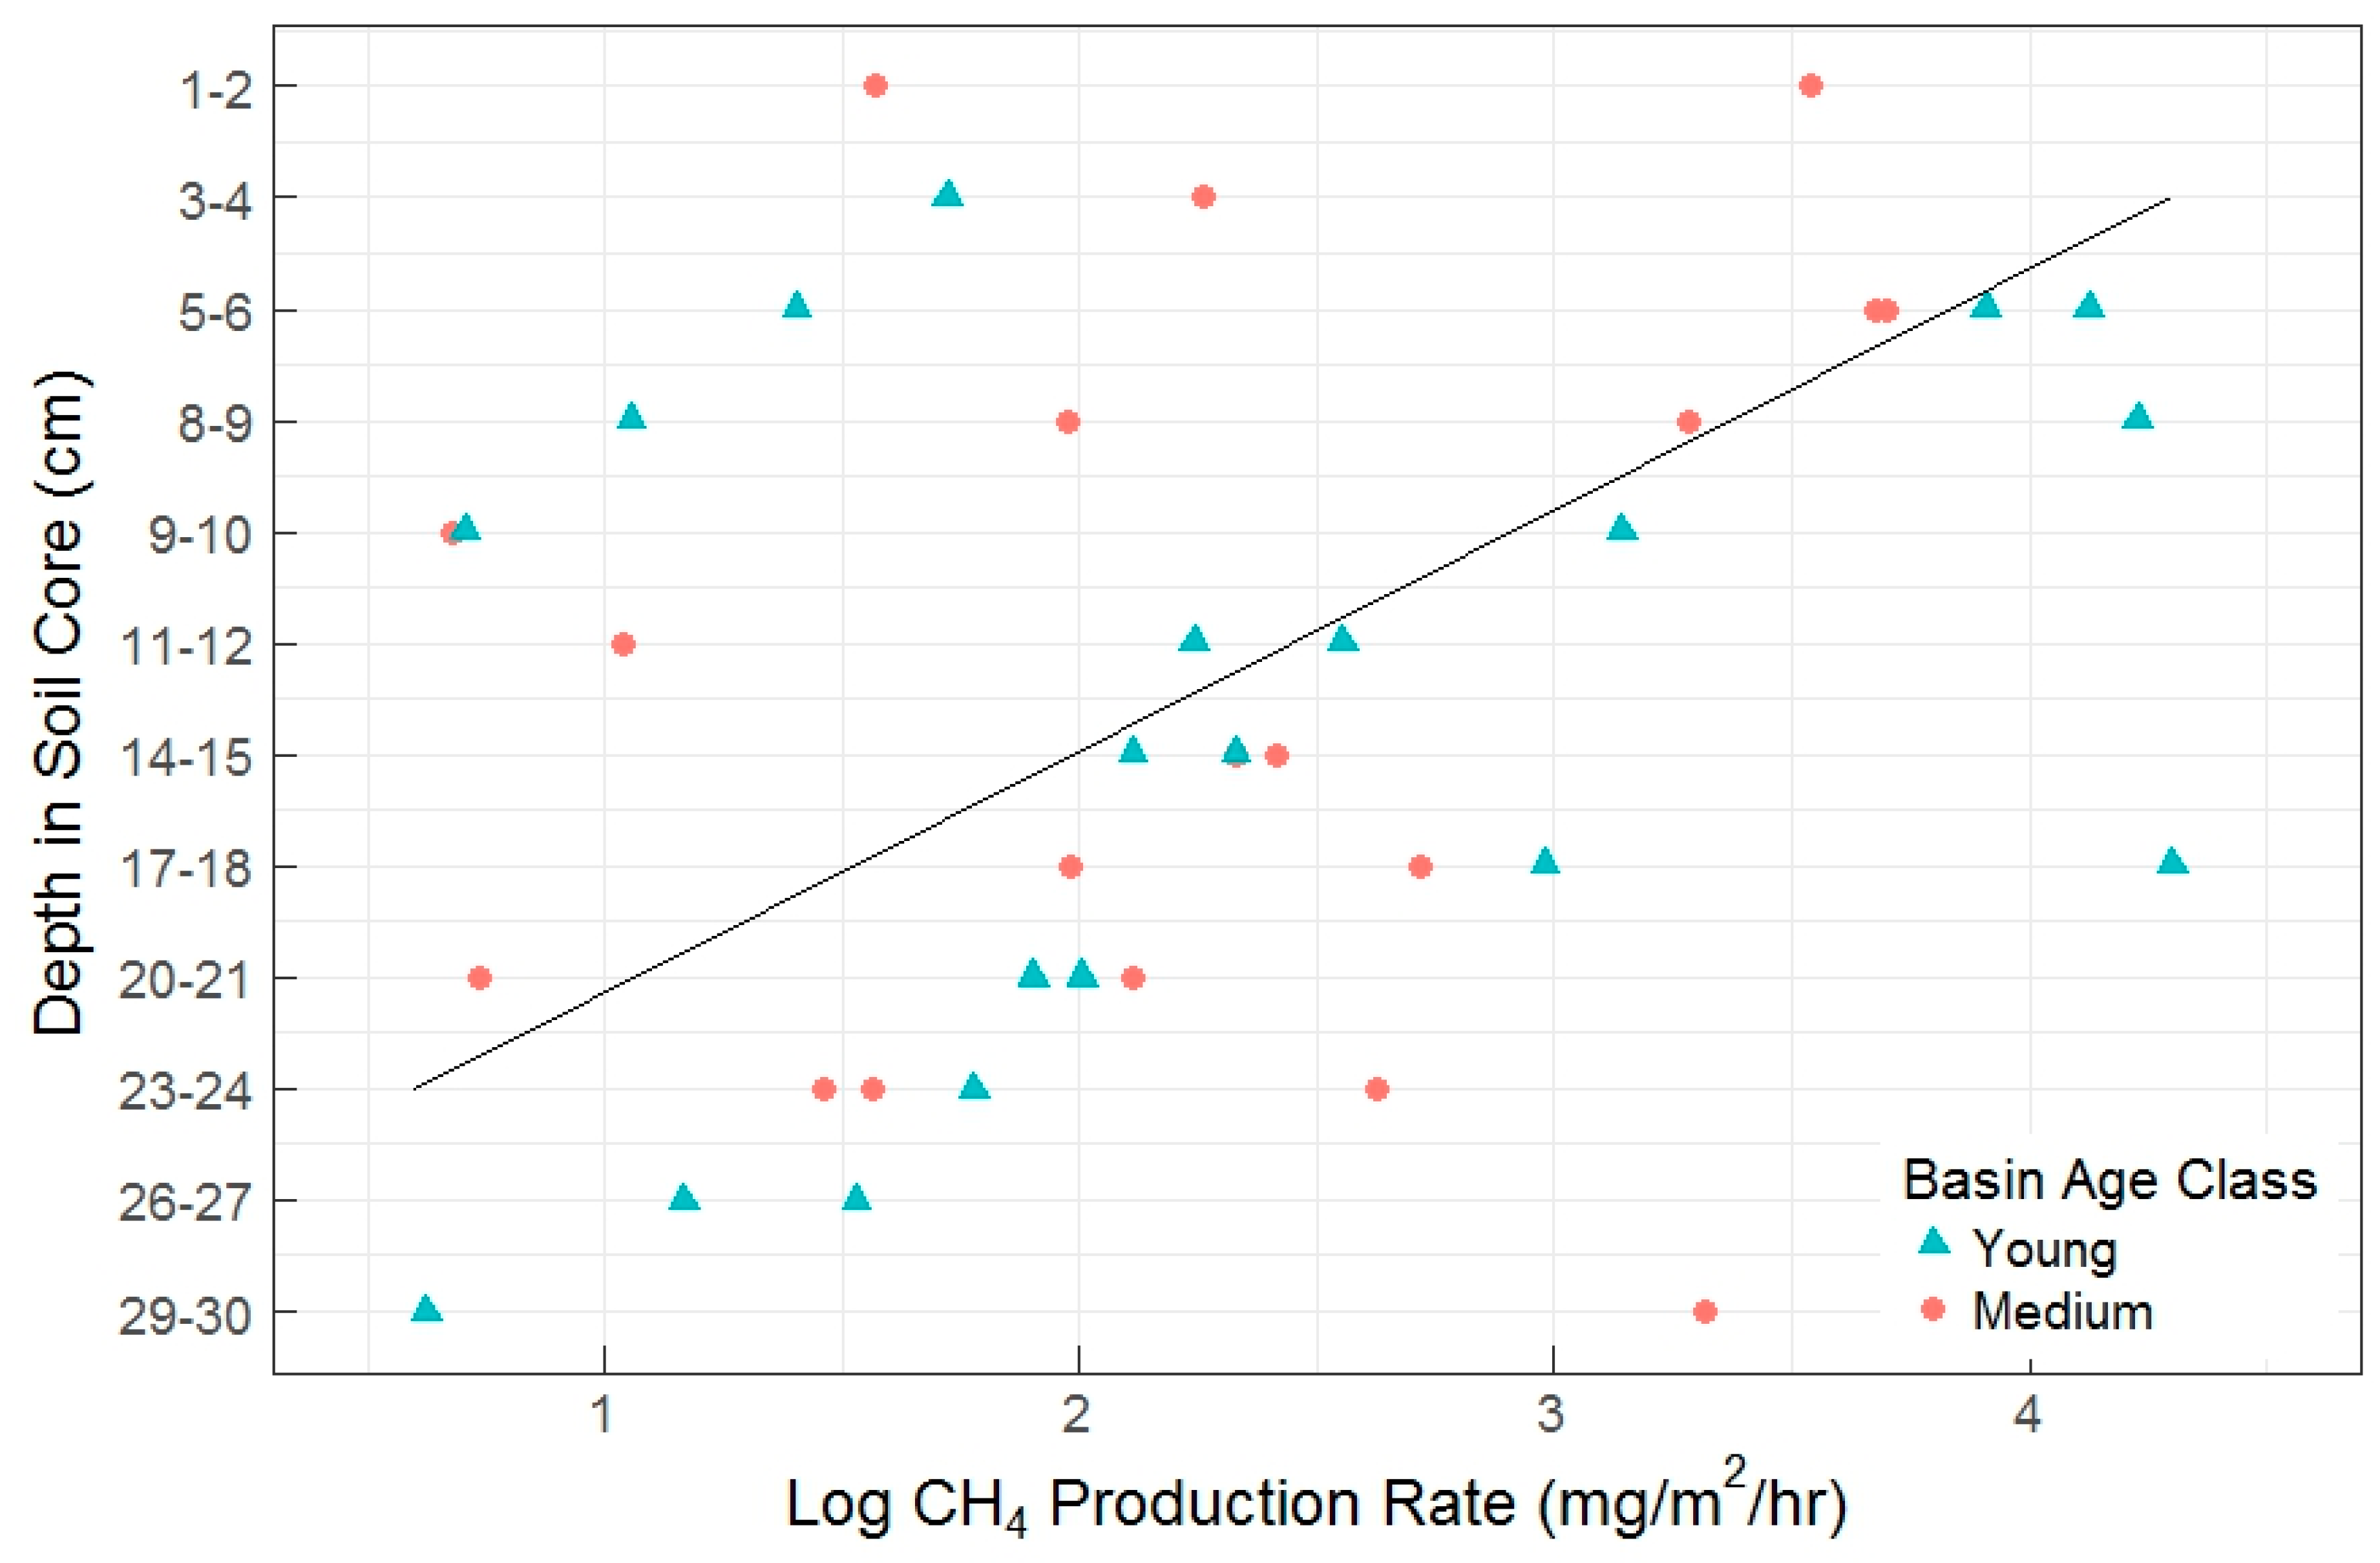
There were no statistically significant differences among basins and basin age classes in any of the CH4 flux metrics (net flux, gross consumption, and gross production). In the pilot study, we did not find a clear relationship between depth and AOM rates. Similarly in the full experiment, AOM rates did not show a relationship with soil depth, but gross CH4 production rates significantly decreased by a factor of 3 with increasing depth (Figure 5).
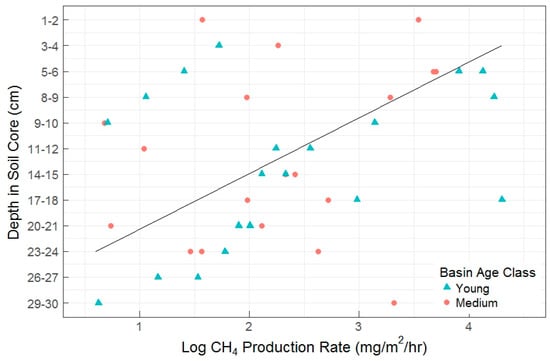
Figure 5.
Gross CH4 production rate by soil depth measured in the full experiment. Each data point represents a single incubation. Depth in soil core is oriented along the y-axis with soil surface at top. Also shown is a linear fit line (R2 = 0.22, p = 0.06).
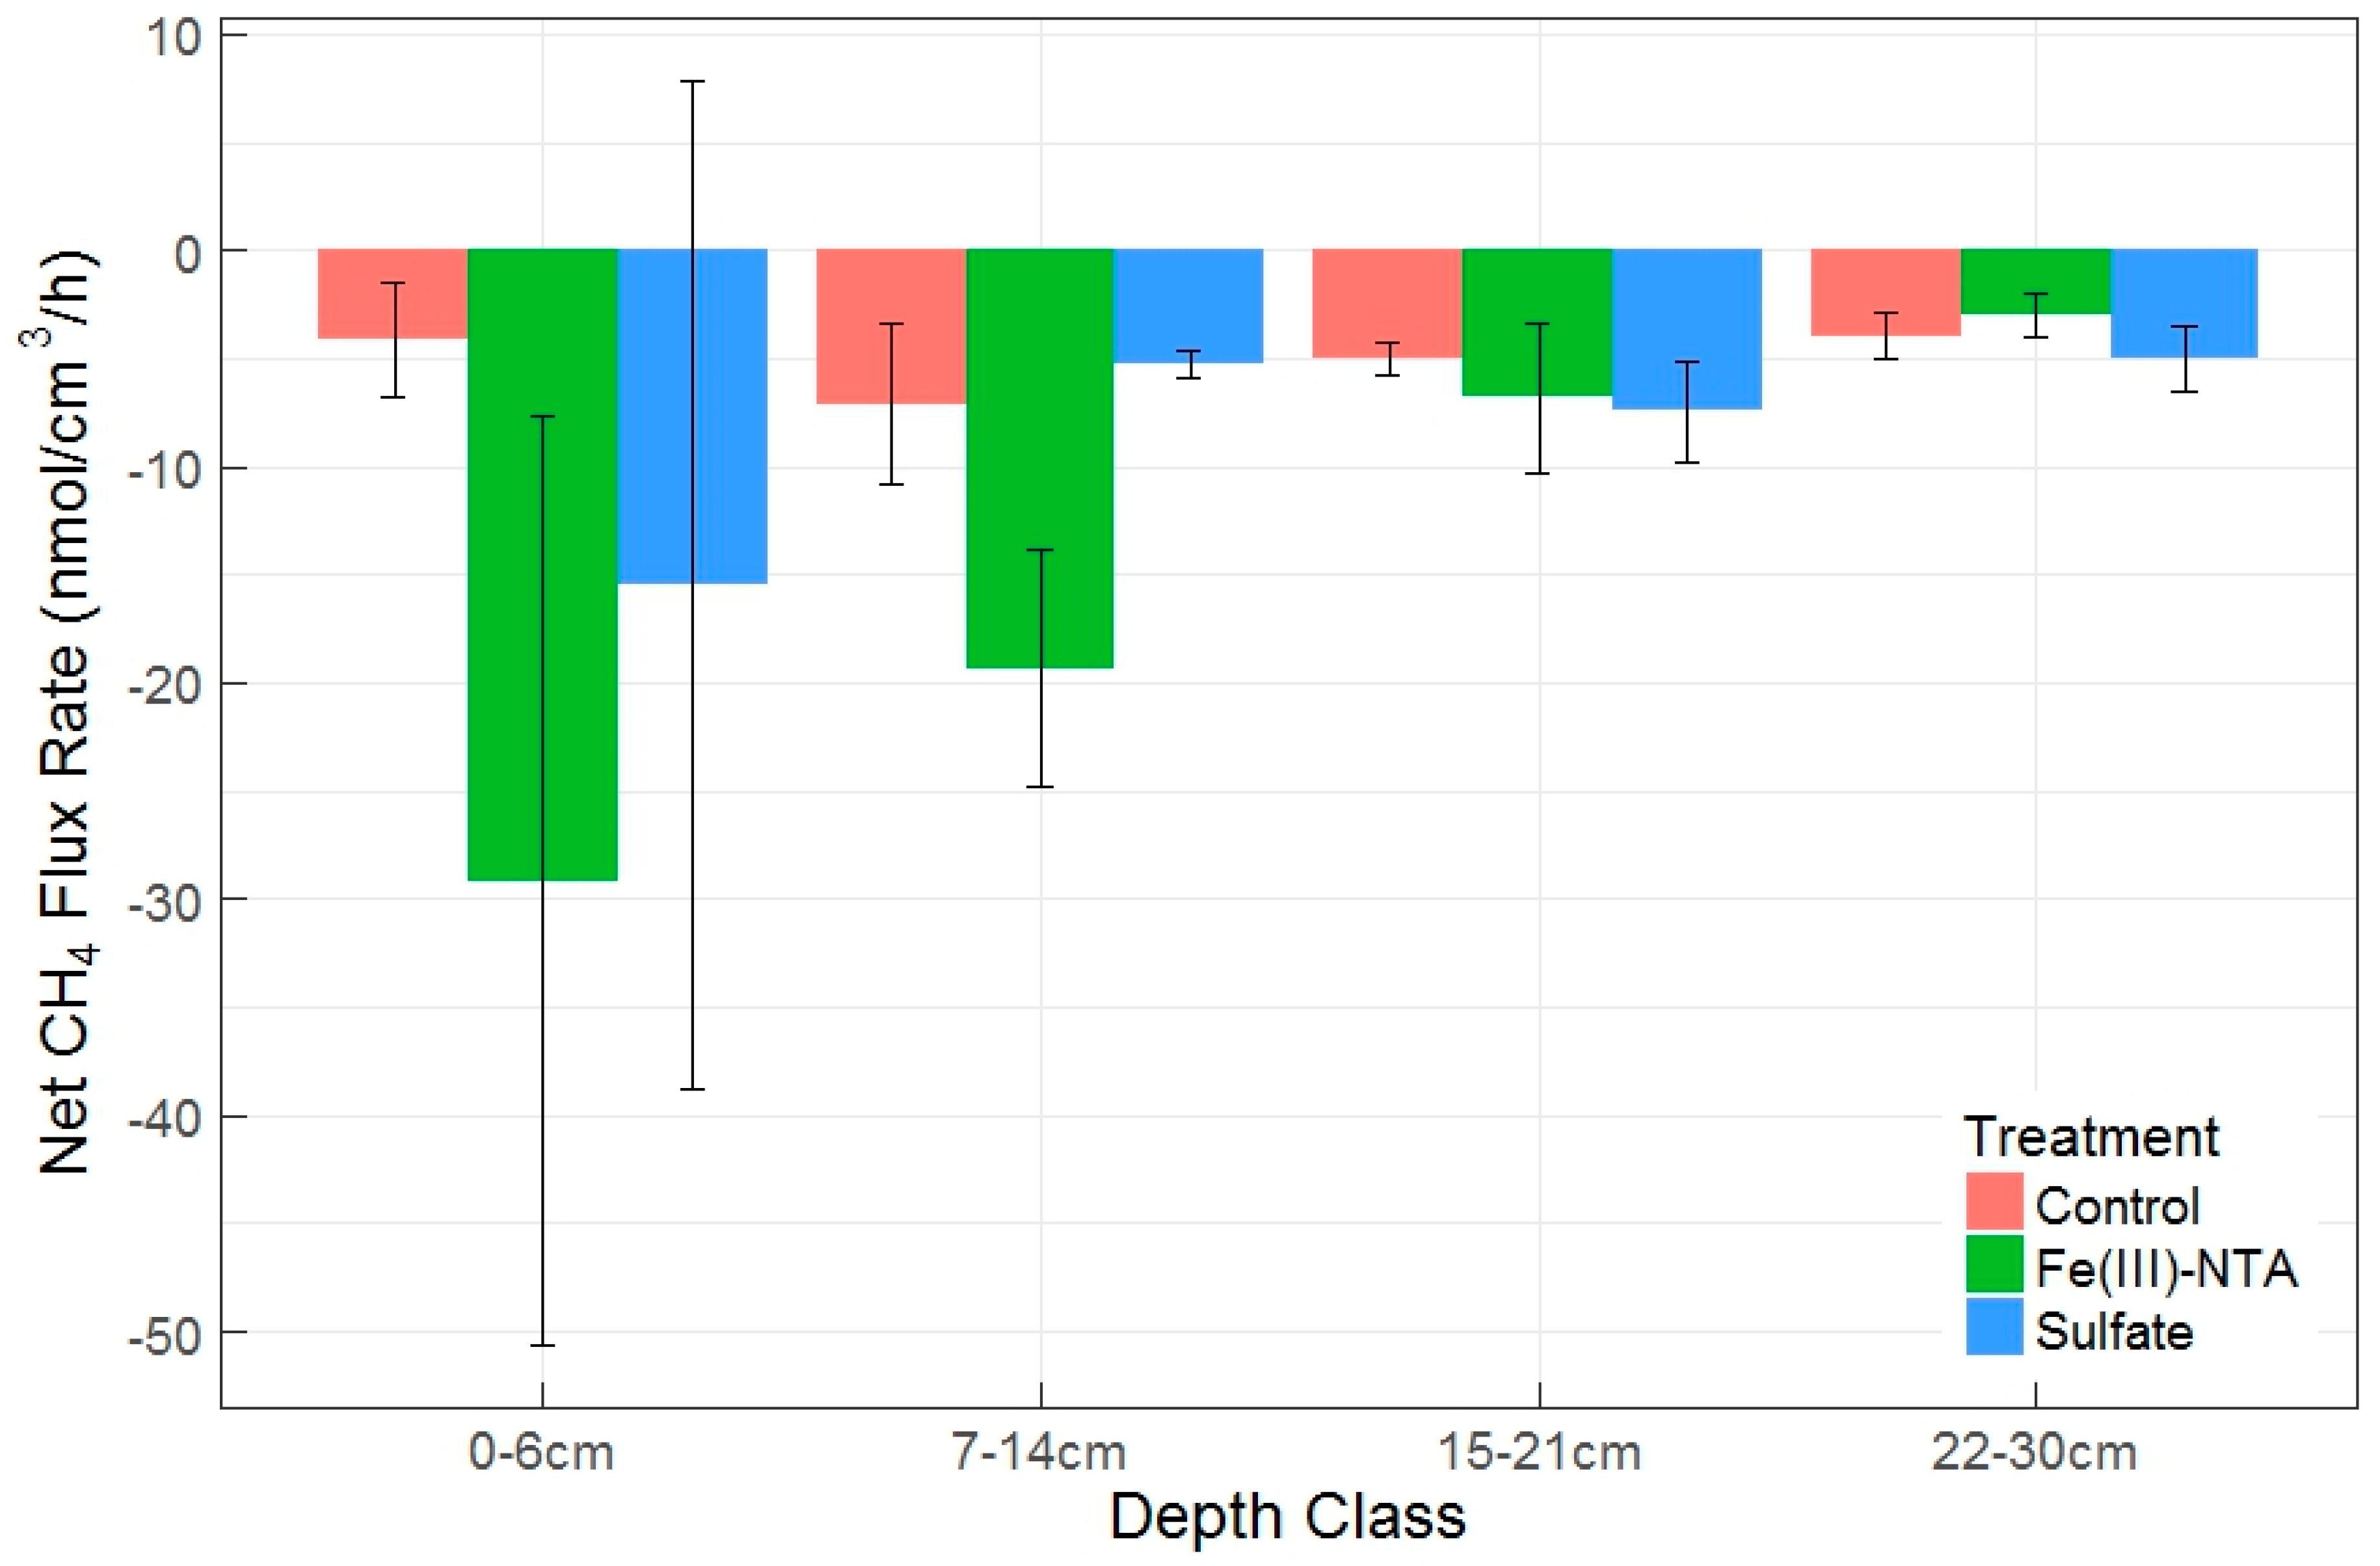
When soil depth was binned into four sequential depth classes as a blocking factor during random treatment assignment, deeper soil layers were related to lower gross production rates (p = 0.015), but were not significantly linked with gross consumption rates. There was also not a significant change in net CH4 fluxes by depth class, regardless of a visual pattern (Figure 6). Despite a lack of overall significance in depth class on net CH4 fluxes, there was a significant difference between the Fe(III)-NTA and sulfate treatments within the 7–14 cm depth class, with higher AOM rates and CH4 production rates found in the Fe-treated soils. The production to consumption ratio (P:C, Table 2) indicated there is a proportional increase in production and consumption as a result of Fe-treatment in this depth class. Figure 6 exhibits the prevalence of net CH4 oxidation in these soils (or the potential thereof), which were further enhanced by the treatment effect. We discovered no difference in net fluxes by depth or treatment between the sulfate and control treatments, but significant effects of depth, treatment, and the depth x treatment interaction between the control and Fe(III)-treated net fluxes (p = 0.03, 0.02, and 0.02, respectively). These patterns held true when using depth class (Figure 6).
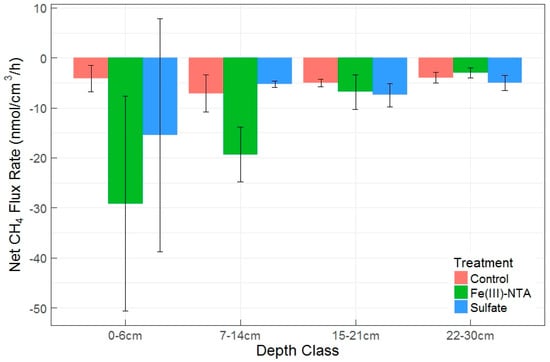
Figure 6.
Mean ± SEM net CH4 flux rates by depth class and electron acceptor treatment. Negative values denote oxidation/consumption. Different letters above each treatment within each depth class denote significant differences by Tukey test (p < 0.05).

Table 2.
Methane cycling rates by depth class and acceptor addition treatment.
With the exception of gross production, CH4 flux rates were not significantly explained by depth, depth class, or electron acceptor treatment (Table 2, ANOVA). Blocking by depth class, we found CH4 flux rates and k were not significantly altered by electron acceptor treatments, with the lack of treatment effect due to the relative insensitivity found in the bottom half of depth treatments. The ratio of gross production to gross consumption (P:C) did not significantly vary by depth or treatment.
Average gross production rates within sulfate-treated soils were distinguishable by depth classes (p = 0.003), with an overall decrease in rates with increasing depth. Within the sulfate-treated soils, the effect of depth class on gross production was significant (ANOVA p = 0.01). The sulfate:depth effect is absent in the P:C ratio, with an exception in the 0–6 cm depth, which had a marginally higher P:C than all other sulfate depth classes (ANOVA p = 0.09).
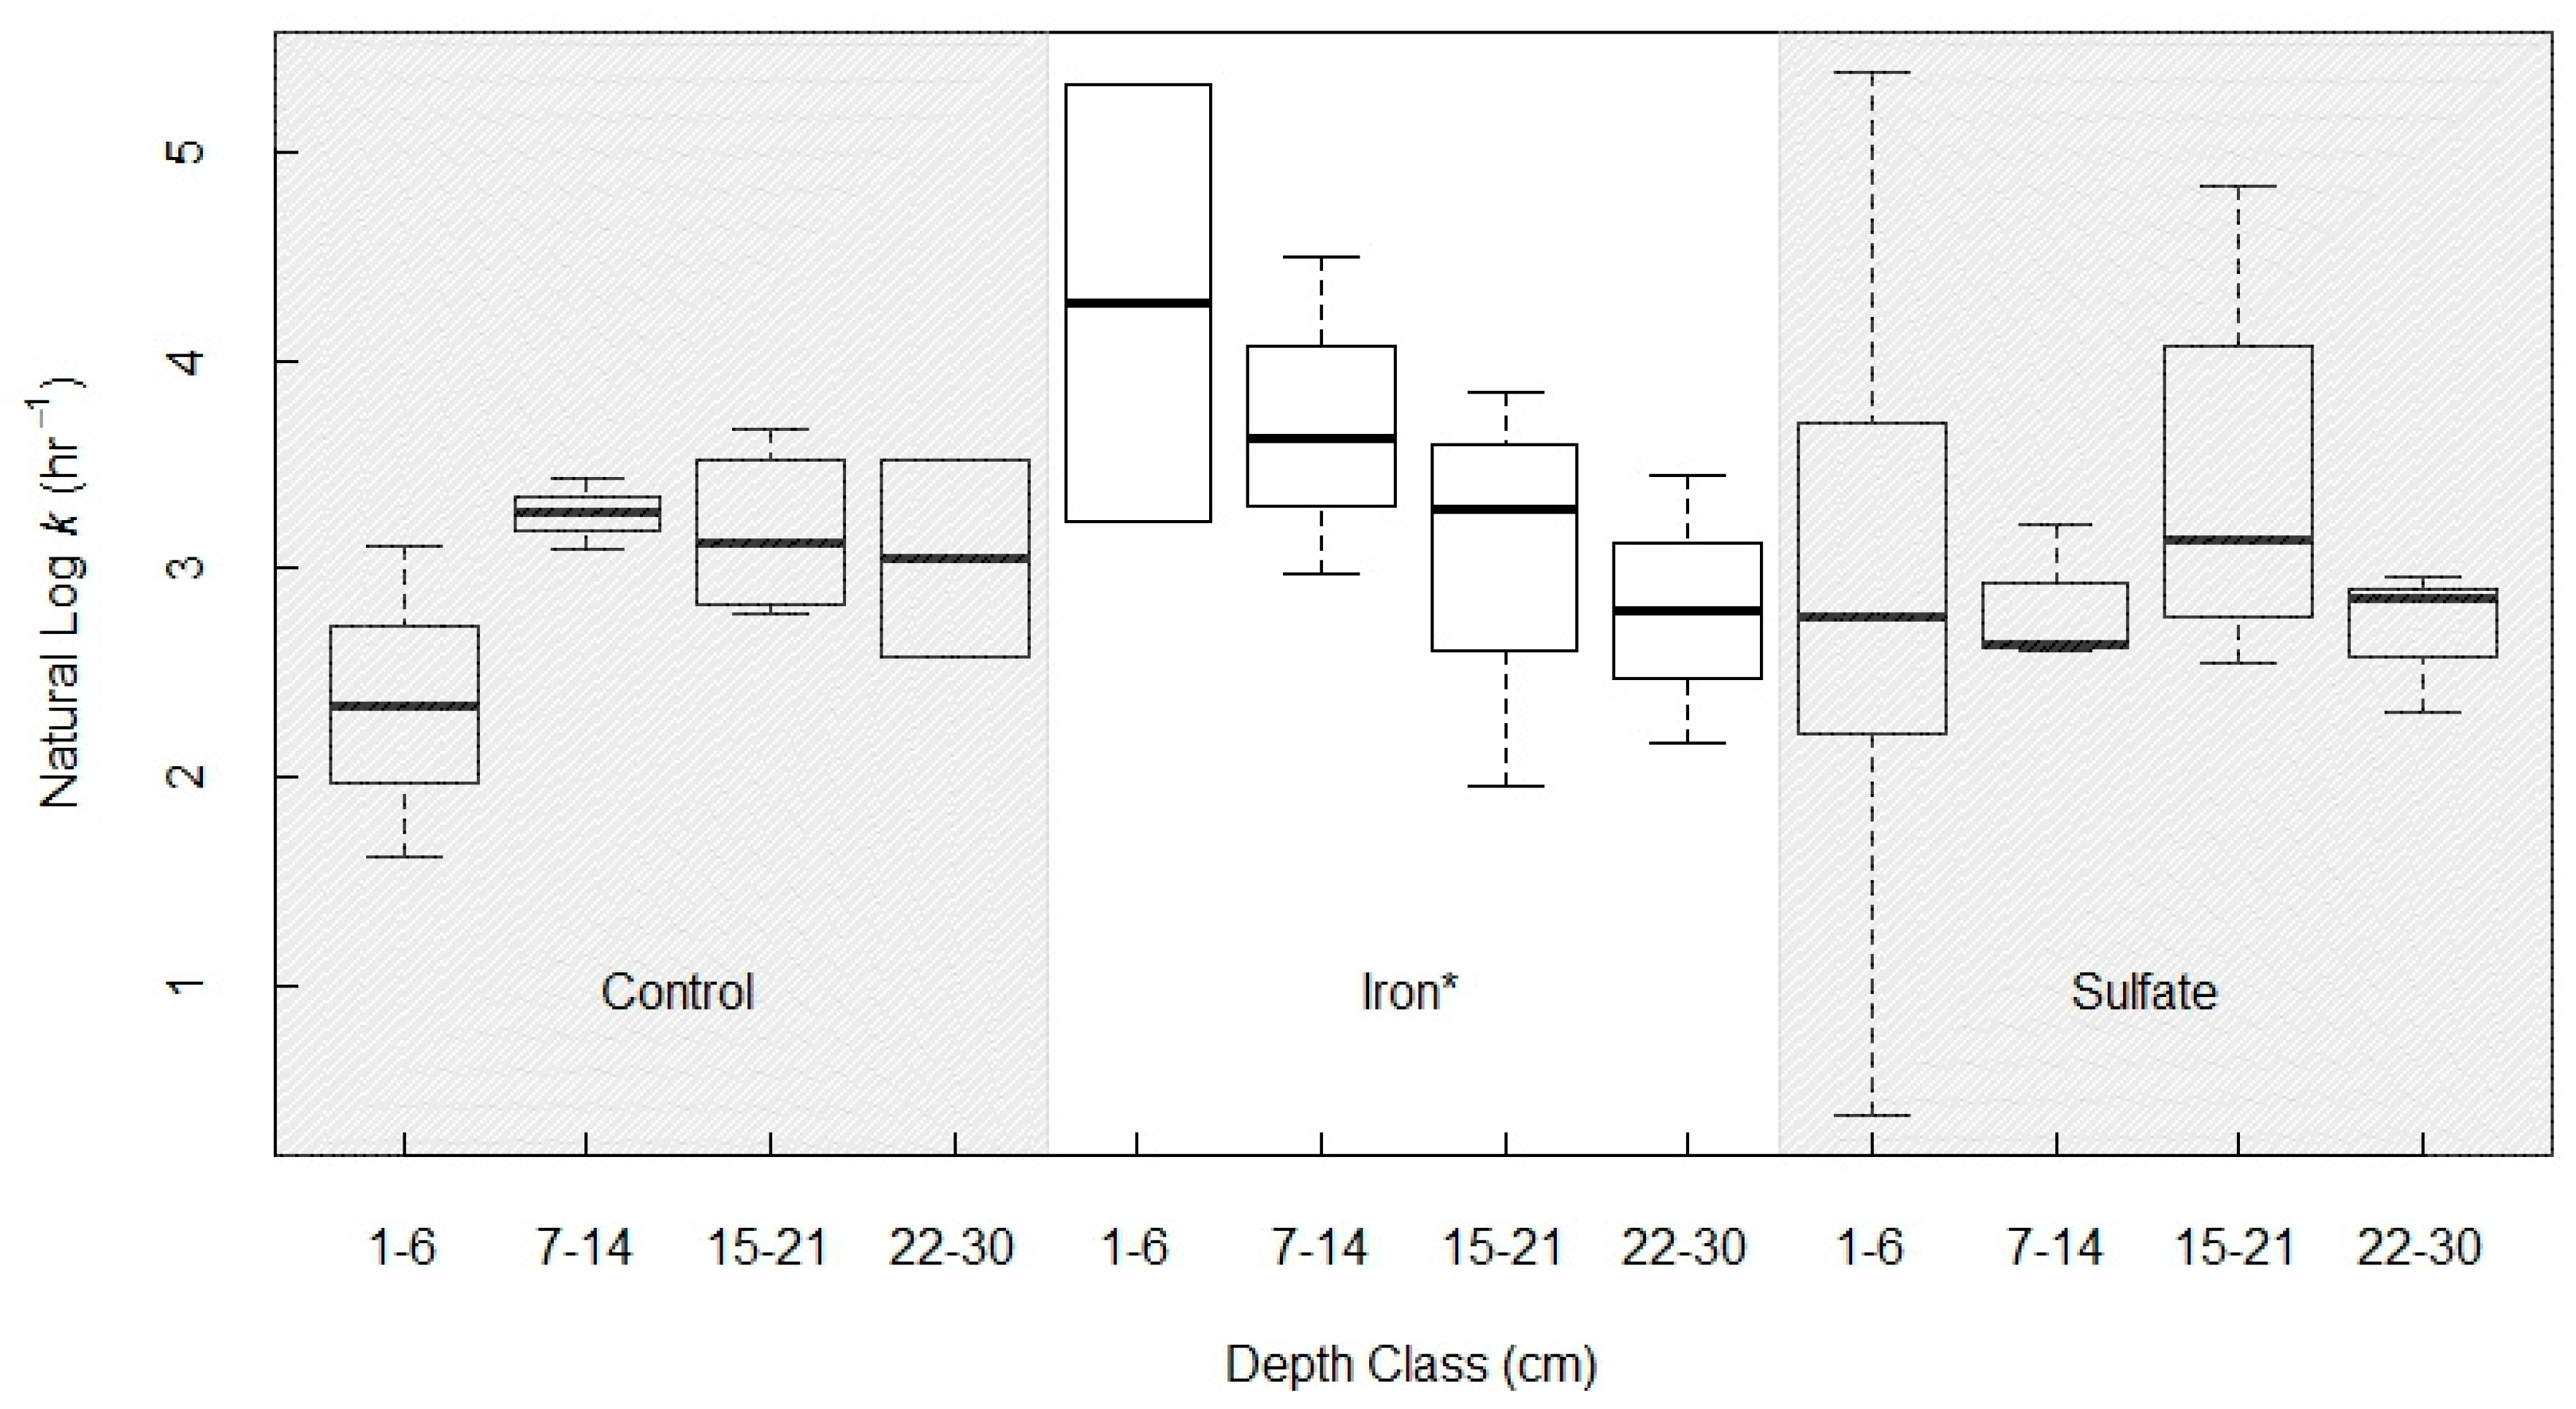
In the full ANOVA, the effects of depth and electron acceptor treatment on the first-order rate constant for AOM (k), were not significant. However, there was a depth effect nested within the iron treatment group, where increasing depth was significantly correlated with decreasing k, and thus, lower potential AOM rates (Figure 7). To parse out the effects of the Fe-treatment and soil depth on k, we directly compared the Fe and control treatments (leaving the sulfate-treated soils out of the analysis, as they were not distinguishable from the control group k estimates at any depth, but did contribute a high variance obfuscating the model). Including all depth classes, we found a marginal effect of the Fe treatment (p = 0.078), and a significant interaction effect between treatment x depth (p = 0.024). The treatment x depth interaction was driven by the higher rate constant in Fe-treated shallow soils. Within Fe-treated soils, there was a significant depth effect (p = 0.048).
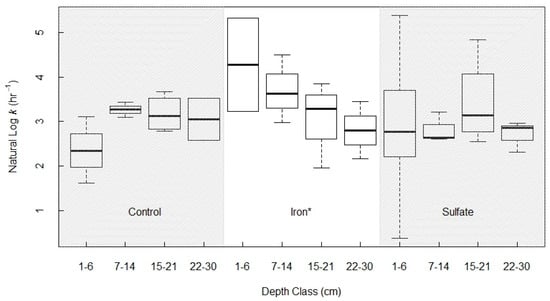
Figure 7.
Natural log of gross AOM rate constant k separated by depth class and electron acceptor treatment. There was a significant difference between depth classes within the iron treatment group (p = 0.048, ANOVA), and for the depth-by-treatment interaction between the control and iron treatments (p = 0.024).
4. Discussion
The AOM pathway is gaining momentum in its recognition as a process of potential importance within terrestrial systems. Peatlands in the high Arctic are of particular interest to understanding net terrestrial CH4 fluxes because they act as massive soil carbon storage sites within both the active and permafrost soil layers [6]. This study demonstrated both the presence of AOM-associated microbes and that anaerobic CH4 consumption has the potential to influence CH4 cycling in the basin wetland landscapes of the Alaskan North Slope. Using in vitro soil incubations of intact soils, we quantified AOM rates by two methods: measuring the appearance of 13CO2 after incubating soils with a 13CH4 headspace spike; and a stable isotope pool dilution technique to simultaneously estimate the rates of methanogenesis and AOM.
4.1. Presence of Relevant Microbial Communities
Phylogenetic analysis of Utqiaġvik soils showed the presence of known methanotrophs using 16S rRNA and mcrA genes associated with the “reverse methanogenesis” pathway, which most closely aligned with anaerobic methanotrophs known as ANME groups 2 and 3. The presence of these organisms in our system serves to confirm that consumption rates measured in the soil incubations were biologically-mediated, and provide some information about the likely functionality of the ANME in these soils.
In addition to the evidence that our soils contain ANME organisms, we also have evidence for the presence and functioning of organisms known to facilitate extracellular electron transfers. Extracellular electron transfer is a capability associated with both ANME-2 [78] and Geobacter [79] microorganisms that can reduce solid electron acceptors like metal oxides. From previous work we know Geobacter is a major contributor to ecosystem respiration from these soils [71,77]. Extracellular electron transfer is a recognized mechanism for metal- and organics-dependent AOM [80], tied functionally to ANME group 2 organisms [17,20,79]. This work found organisms closely related to other known methane-cycling isolates in ANME groups 2 and 3 (Figure 1 and Figure 2). The presence of both Geobacter and ANME-2 organisms, in conjunction with evidence of significant levels of methanotrophy during anoxic incubations, supports metal-dependent AOM driven by extracellular electron transfer [20,78,81].
4.2. AOM Activity Rates and Importance to Net CH4 Flux
Given the potential rates we measured, AOM is a significant sink of methane in the Utqiaġvik soils we tested—in most of our closed system incubations, AOM consumed the equivalent mass of biogenic methane during the experiment, leading to our estimates that AOM consumes between 25% and 34% of CH4 produced, commensurate with other estimates of AOM effect on net flux rates from freshwater wetlands [82,83,84].
We observed peak rates of AOM at the outset of the incubation periods, likely an artifact from the 5% CH4 spike. We designed the incubations with a large, initial dose of CH4 (5%) in the headspace in order to address concerns over substrate limitation of the AOM pathway. This decision appears to have indeed promoted AOM activities and initially depressed CH4 production [13], as suggested by an overall intercept of 2.55 nmol CH4 cm−1 h−1 in the comparison between consumption and production rates (Figure 4). We posit that the positive intercept represents the artifact effect of the 5% CH4 spike, but as incubations continued methanogenesis quickly caught up, producing more CO2 substrates. When we combine all young and medium basin data, the regression line represents the ratio of consumption to production as the incubation approaches a quasi-steady state. Using the slope for all incubations (regardless of basin, depth, and treatment), we estimate potential AOM consumption to be approximately 34% of CH4 production in a highly CH4 concentrated environment.
The potential influence of high CH4 concentrations in the headspace becomes less important with increasing soil depth, where high levels of CH4 are likely commonplace. Within deep anoxic soils, biogenic gas can reach very high concentrations, with published values reaching up to 10% CH4 [85]. Potential AOM rates were measured under 5% CH4, but ambient CH4 concentrations in the soil profile may only reach around 5 ppt (0,5%) (Lipson, unpublished data). Assuming the AOM rate constant and CH4 production rates found in this study hold for natural conditions, we would expect an AOM rate about 10% lower than measured in the experiment. Therefore, 1.5 nmol cm3 h−1 CH4 consumed by AOM vs 6.0 nmole cm3 h−1 produced, or 25% of the total.
The results we present here are based entirely on biological processes, as abiotic uptake of CH4 is not accounted for in our isotope-based rate calculations. Taking abiotic CH4 sorption into account could influence the quantification of the rates presented here [86], and should be a consideration in the planning of future studies of soil CH4 cycling dynamics.
4.3. Drivers and Stressors
Since these landscapes act as net sources of CH4 to the atmosphere, we know that production outpaces consumption rates in intact soil systems under current conditions, but how might climate change impact these pathways, and thereby influence overall carbon gas fluxes? The North Slope landscape is likely to become warmer and wetter with climate change [41,42], coincident with thicker active layers as permafrost thaw extends deeper into the transition zone and beyond. With the increased thaw depths leading to thicker active layers, there will be more carbon available for biological processing and losses as net carbon flux to the atmosphere as the greenhouse gases CO2 and CH4 [7]. The role of northern peatland soils to ecosystem CH4 flux is dependent on the complex interaction between microbial populations producing and consuming CH4. We found evidence that Fe enrichment in shallow soils positively influences the rates of AOM, thereby acting as a check on net CH4 flux to the atmosphere.
With warming and increased permafrost thaw depths, the interaction between the organic and mineral soil layers will increase, particularly in the young basin age classes that have the thinnest organic layers and relatively high system productivity. Our results also showed that CH4 flux rates, driven by changes in production rates, varied with depth. The relationship with depth was weak, and could be driven by Fe availability rather than other factors associated with depth, as a discernible pattern was only seen in soils treated with Fe(III). Vaughn et al. [87] found a disconnect between CH4 concentrations in the soil porewater and net flux from the soil surface, explained as a difference in production rates by depth, a difference in transportation rates, and/or different oxidation rates in shallow soils. We have evidence supporting a difference in production rates by depth (Table 2), with shallow soils exhibiting the lowest gross production rates. The data we presented here have relatively weak depth effects for most variables, which could be an artifact of the type of soil incubations we performed creating conditions that represent an estimation of reality more likely for some soil layers than for others [50]. Weak depth effects shown in variables like gross production rate (Figure 5, Table 2) are indicative of the complex suite of abiotic and biotic conditions and processes occurring in the soil system.
Our work supports a depth x Fe interaction effect on AOM rates, which could be explained as: (1) CH4 production suppression in shallow soils by the presence of oxygen, and in deeper soils by substrate limitation; (2) decreased production due to high concentrations of Fe in the deeper soil layers; and/or (3) increased Fe-AOM in the deeper layers where concentrations of both CH4 and Fe are highest. The presence of Fe and other mineral species in the deeper soil layers could contribute to substrate-related depressions in production, as mineral-organic associations protect soil organic carbon from decomposition [88]. There is also evidence that organic- and mineral-CH4 associations in deeper soil layers have a complex relationship with temperature, where warmer anoxic soils could result in higher rates of non-methanogenesis redox [83], particularly salient to net fluxes from warming permafrost peat soils. Contrastingly, Zhuang et al. [81] document an intriguing relationship between CH4 production and longer term Fe cycling, finding that additions of ferric iron initially depressed methanogenesis rates (as expected), but the production of secondary mineral compounds like magnetite later facilitated increased CH4 production via interspecies electron transfer between Geobacter and Methanosarcina. Thus, Fe cycling in deeper soils of the landscape could be both suppressing and promoting CH4 production depending on the mineral state and localized temperatures experienced at any given time within the soil system. Future work to determine drivers of net fluxes from both soil layer types and the landscape should focus on the interactions between mineral-organic dynamics and CH4 production and AOM.
The anoxic basins representative of the North Slope landscape near Utqiaġvik are characterized by Fe-driven soil respiration [40,52,77]. We hypothesize that high native Fe concentrations and the importance of Fe-reduction respiration in these wetland soils favor AOM energetically linked with Fe-reduction, as has been seen in some high-Fe freshwater systems [22,24,82]. The relative insensitivity of overall AOM rates to additions of Fe(III) may be most simply explained by the abundance of pre-existing electron acceptors in these soils. However, Fe concentrations increase with depth in these soils [40,52], and so the stimulation of AOM by Fe addition in the shallow layer may be evidence that Fe(III) is indeed an important electron acceptor for AOM, as recently found in other environments [17,20,25]. In light of these data, the inhibitory effects of Fe(III) on landscape CH4 fluxes found by Miller et al. [51] might have been driven by Fe-dependent AOM.
Net CH4 release is a balance of the opposing forces of production and consumption, and so the environmental controls and drivers are likely to be complex. For example, Tan et al. [83] found a temperature-dependent inhibitory effect of humic substances on methane production in peat soils, while Valenzuela et al. [80] proved that humic substances can act as an electron acceptor for AOM in wetland soils. We know that warming will promote permafrost thaw, thus increasing the availability of complex soil carbon species (e.g., humic substances) and minerals for metabolic use [88,89,90]. It is unknown how the full suite of changing dynamics of the active layer will interact with CH4 cycling, as it seems likely that increased humic substance concentrations could inhibit methanogenesis, while also promoting AOM activities. Perhaps more importantly to overall net flux dynamics, the duration of any effects we expect is unknown—if a suppression of methane production eventually restricted AOM via substrate limitation, what could we expect the net balance of production and consumption pathways to be?
This landscape has an abundance of alternative electron acceptors, particularly Fe and humic substances [40,51,77]. Increased thaw could therefore release more Fe (and humic substances) currently trapped in the frozen mineral layer, and warming-induced cryoturbation could redistribute minerals into the upper active layer [91]. Based on what is already known about this system and the data presented here, Fe is likely the dominant electron acceptor for AOM. As soils thaw and deep mineral layers contribute to biogeochemical cycling in the active layer, increased Fe availability could theoretically dampen the release of CH4 through competitive inhibition of production and/or stimulation of Fe-dependent AOM. Alternatively, changes to the physical and metabolic dynamics of the active layer could potentially disturb any microbial consortia responsible for AOM, decoupling CH4 oxidation from these anaerobic processes [78], impacting net CH4 fluxes.
4.4. Implications for CH4 Emissions in the Arctic Coastal Plain
The recent shifts in some northern systems from their traditional role as CO2 sinks to CO2 sources [7,10] are attributed to alterations in climate and changes in species distribution. If those same changes in local climate are conducive to CH4 production (e.g., wetter, warmer soils), it stands to reason that AOM rates will “follow the CH4” and likewise accelerate activity. If so, and the methanogenesis to AOM (P:C) ratio we observed remains steady, we would expect a larger quantity of AOM-derived CO2 released to the atmosphere, positively contributing to the enhanced CO2 source effect, but diminishing the net release of the more potent greenhouse gas CH4.
As Arctic warming spurs thermokarst changes and new basin development, young basins may become more prevalent across the future North Slope [39], previously shown to have the highest levels of ecosystem respiration [56]. Young basins have thinner organic layers, with more overlap between the active layer sediments and the electron acceptor-rich mineral layer, and have been shown to have strong linkages between net CH4 fluxes and Fe dynamics [51]. In our pilot study, we observed the highest AOM rates from young and medium basin soils, and low AOM rates in deep layers of old and ancient basin soils, but replicated studies of these patterns are needed. Deep layers of older basin features in particular contain both high Fe concentrations and high soil organic carbon [90], likely somewhat protected from biomobilization by mineral-organic associations [88]. The emergence of young basins with high Fe contents in the upper soils would increase the precise landscape features and drivers we found associated with high levels of AOM, suggesting a potential control on net CH4 fluxes from the landscape as a whole.
5. Conclusions
The major contributions of the work we presented here are: (1) finding evidence of AOM-capable microbes in the soils of the Arctic Coastal Plain drained thaw lake basin ecosystem; (2) measuring the first estimates of AOM rates from Alaskan North Slope soils, confirming the relative importance of this pathway to overall CH4 fluxes; and (3) making the connection between Fe and AOM in this system.
We used stable isotope tracers to quantify AOM rates, verifying the potential of Arctic peat soils to perform AOM (a previously unknown result), and corroborated this with genomic data, revealing the phylogenetic relatedness of Utqiaġvik soil organisms and known anaerobic methanotrophs of ANME groups 2 and 3. We found that 25–34% of methane produced was converted to CO2 by AOM, affecting net flux dynamics in this landscape, and that AOM activity was related to Fe. This work provides evidence that AOM has the potential to be a control on net CH4 fluxes from northern peatland soils, particularly as the Arctic warms and landscape features change to include more Fe-rich shallow soils.
Author Contributions
Conceptualization, K.E.M., C.-T.L., and D.A.L.; methodology, K.E.M., C.-T.L., and D.A.L.; formal analysis, K.E.M.; investigation, K.E.M.; resources, R.A.D., D.A.L., and K.E.M.; data curation, K.E.M.; writing—original draft preparation, K.E.M.; writing—review and editing, K.E.M., C.-T.L., R.A.D., and D.A.L.; visualization, K.E.M.; funding acquisition, D.A.L. and K.E.M.
Funding
This work was supported by NSF 0808604 to David Lipson, Largus Angenent and Ted K. Raab, and a Jastro-Shields Research Fellowship to K. Miller from UC-Davis.
Acknowledgments
We thank Faustine Bernadac, CPS, UMIAQ, and BASC for logistical support, and Marguerite Mauritz for comments on an earlier draft of this paper.
Conflicts of Interest
The authors declare no conflict of interest.
References
- Knittel, K.; Boetius, A. Anaerobic oxidation of methane: Progress with an unknown process. Annu. Rev. Microbiol. 2009, 63, 311–334. [Google Scholar] [CrossRef] [PubMed]
- Valentine, D.L. Biogeochemistry and microbial ecology of methane oxidation in anoxic environments: A review. Antonie Van Leeuwenhoek 2002, 81, 271–282. [Google Scholar] [CrossRef]
- Gupta, V.; Smemo, K.A.; Yavitt, J.B.; Fowle, D.; Branfireun, B.; Basiliko, N. Stable isotopes reveal widespread Anaerobic Methane Oxidation across latitude and peatland type. Environ. Sci. Technol. 2013, 47, 8273–8279. [Google Scholar] [CrossRef] [PubMed]
- Gauthier, M.; Bradley, R.L.; Šimek, M. More evidence that anaerobic oxidation of methane is prevalent in soils: Is it time to upgrade our biogeochemical models? Soil Biol. Biochem. 2015, 80, 167–174. [Google Scholar] [CrossRef]
- Serrano-Silva, N.; Sarria-Guzmán, Y.; Dendooven, L.; Luna-Guido, M. Methanogenesis and Methanotrophy in Soil: A Review. Pedosphere 2014, 24, 291–307. [Google Scholar] [CrossRef]
- Hugelius, G.; Strauss, J.; Zubrzycki, S.; Harden, J.W.; Schuur, E.A.G.; Ping, C.-L.; Schirrmeister, L.; Grosse, G.; Michaelson, G.J.; Koven, C.D.; et al. Estimated stocks of circumpolar permafrost carbon with quantified uncertainty ranges and identified data gaps. Biogeosciences 2014, 11. [Google Scholar] [CrossRef]
- Schuur, E.A.G.; McGuire, A.D.; Schädel, C.; Grosse, G.; Harden, J.W.; Hayes, D.J.; Hugelius, G.; Koven, C.D.; Kuhry, P.; Lawrence, D.M.; et al. Climate change and the permafrost carbon feedback. Nature 2015, 520, 171–179. [Google Scholar] [CrossRef]
- Gorham, E. Northern peatlands: Role in the carbon cycle and probable responses to climatic warming. Ecol. Appl. 1991, 1, 182–195. [Google Scholar] [CrossRef]
- Limpens, J.; Berendse, F.; Blodau, C.; Canadell, J.G.; Freeman, C.; Holden, J.; Roulet, N.; Rydin, H.; Schaepman-Strub, G. Peatlands and the carbon cycle: From local processes to global implications—A synthesis. Biogeosciences 2008, 5, 1475–1491. [Google Scholar] [CrossRef]
- Oechel, W.C.; Laskowski, C.A.; Burba, G.; Gioli, B.; Kalhori, A.A.M. Annual patterns and budget of CO2 flux in an Arctic tussock tundra ecosystem. J. Geophys. Res. Biogeosci. 2014, 119, 323–339. [Google Scholar] [CrossRef]
- Smemo, K.A.; Yavitt, J.B. Anaerobic oxidation of methane: An underappreciated aspect of methane cycling in peatland ecosystems? Biogeosciences 2011, 8, 779–793. [Google Scholar] [CrossRef]
- Blazewicz, S.J.; Petersen, D.G.; Waldrop, M.P.; Firestone, M.K. Anaerobic oxidation of methane in tropical and boreal soils: Ecological significance in terrestrial methane cycling. J. Geophys. Res. Biogeosci. 2012, 117. [Google Scholar] [CrossRef]
- Smemo, K.A.; Yavitt, J.B. Evidence for Anaerobic CH4 Oxidation in Freshwater Peatlands. Geomicrobiol. J. 2007, 24, 583–597. [Google Scholar] [CrossRef]
- Zhu, B.; van Dijk, G.; Fritz, C.; Smolders, A.J.P.; Pol, A.; Jetten, M.S.M.; Ettwig, K.F. Anaerobic oxidization of methane in a minerotrophic peatland: Enrichment of nitrite-dependent methane-oxidizing bacteria. Appl. Environ. Microbiol. 2012. [Google Scholar] [CrossRef] [PubMed]
- Xu, X.; Elias, D.A.; Graham, D.E.; Phelps, T.J.; Carroll, S.L.; Wullschleger, S.D.; Thornton, P.E. A microbial functional group-based module for simulating methane production and consumption: Application to an incubated permafrost soil. J. Geophys. Res. Biogeosci. 2015, 120, 1315–1333. [Google Scholar] [CrossRef]
- Caldwell, S.L.; Laidler, J.R.; Brewer, E.A.; Eberly, J.O.; Sandborgh, S.C.; Colwell, F.S. Anaerobic Oxidation of Methane: Mechanisms, bioenergetics, and the ecology of associated microorganisms. Environ. Sci. Technol. 2008, 42, 6791–6799. [Google Scholar] [CrossRef]
- Ettwig, K.F.; Zhu, B.; Speth, D.; Keltjens, J.T.; Jetten, M.S.M.; Kartal, B. Archaea catalyze iron-dependent anaerobic oxidation of methane. Proc. Natl. Acad. Sci. USA 2016, 113, 12792–12796. [Google Scholar] [CrossRef]
- Ettwig, K.F.; Butler, M.K.; Paslier, D.L.; Pelletier, E.; Mangenot, S.; Kuypers, M.M.M.; Schreiber, F.; Dutilh, B.E.; Zedelius, J.; de Beer, D.; et al. Nitrite-driven anaerobic methane oxidation by oxygenic bacteria. Nature 2010, 464, 543–548. [Google Scholar] [CrossRef] [PubMed]
- Thauer, R.K.; Shima, S. Methane as fuel for anaerobic microorganisms. Ann. N. Y. Acad. Sci. 2008, 1125, 158–170. [Google Scholar] [CrossRef]
- He, Z.; Zhang, Q.; Feng, Y.; Luo, H.; Pan, X.; Gadd, G.M. Microbiological and environmental significance of metal-dependent anaerobic oxidation of methane. Sci. Total. Environ. 2018, 610–611, 759–768. [Google Scholar] [CrossRef]
- Vaksmaa, A.; Lüke, C.; van Alen, T.; Valè, G.; Lupotto, E.; Jetten, M.S.M.; Ettwig, K.F. Distribution and activity of the anaerobic methanotrophic community in a nitrogen-fertilized Italian paddy soil. FEMS Microbiol. Ecol. 2016, 92. [Google Scholar] [CrossRef] [PubMed]
- Amos, R.T.; Bekins, B.A.; Cozzarelli, I.M.; Voytek, M.A.; Kirshtein, J.D.; Jones, E.J.P.; Blowes, D.W. Evidence for iron-mediated anaerobic methane oxidation in a crude oil-contaminated aquifer. Geobiology 2012, 10, 506–517. [Google Scholar] [CrossRef] [PubMed]
- Crowe, S.A.; Katsev, S.; Leslie, K.; Sturm, A.; Magen, C.; Nomosatryo, S.; Pack, M.A.; Kessler, J.D.; Reeburgh, W.S.; Roberts, J.A.; et al. The methane cycle in ferruginous Lake Matano. Geobiology 2011, 9, 61–78. [Google Scholar] [CrossRef] [PubMed]
- Sivan, O.; Adler, M.; Pearson, A.; Gelman, F.; Bar-Or, I.; John, S.G.; Eckert, W. Geochemical evidence for iron-mediated anaerobic oxidation of methane. Limnol. Oceanogr. 2011, 56, 1536–1544. [Google Scholar] [CrossRef]
- Bar-Or, I.; Elvert, M.; Eckert, W.; Kushmaro, A.; Vigderovich, H.; Zhu, Q.; Ben-Dov, E.; Sivan, O. Iron-coupled Anaerobic Oxidation of Methane performed by a mixed bacterial-archaeal community based on poorly reactive minerals. Environ. Sci. Technol. 2017, 51, 12293–12301. [Google Scholar] [CrossRef] [PubMed]
- Reiche, M.; Torburg, G.; Küsel, K. Competition of Fe(III) reduction and methanogenesis in an acidic fen. FEMS Microbiol. Ecol. 2008, 65, 88–101. [Google Scholar] [CrossRef]
- Schlesinger, W.H.; Bernhardt, E.S. Biogeochemistry: An Analysis of Global Change; Academic Press: Cambridge, MA, USA, 2013; ISBN 978-0-12-385874-0. [Google Scholar]
- Yao, H.; Conrad, R. Thermodynamics of methane production in different rice paddy soils from China, the Philippines and Italy. Soil Boil. Biochem. 1999, 31, 463–473. [Google Scholar] [CrossRef]
- Van Bodegom, P.M.; Scholten, J.C.; Stams, A.J. Direct inhibition of methanogenesis by ferric iron. FEMS Microbiol. Ecol. 2004, 49, 261–268. [Google Scholar] [CrossRef]
- Klüber, H.D.; Conrad, R. Effects of nitrate, nitrite, NO and N2O on methanogenesis and other redox processes in anoxic rice field soil. FEMS Microbiol. Ecol. 1998, 25, 301–318. [Google Scholar] [CrossRef]
- Jugnia, L.-B.; Roy, R.; Pacheco-Oliver, M.; Planas, D.; Miguez, C.B.; Greer, C.W. Potential activity and diversity of methanotrophic bacteria in forest soil, peat, and sediments from a hyrdoelectric reservoir (Robert-Bourassa) and lakes in the Canadian taiga. Soil Sci. 2006, 171, 127. [Google Scholar] [CrossRef]
- Tuomivirta, T.T.; Yrjälä, K.; Fritze, H. Quantitative PCR of pmoA using a novel reverse primer correlates with potential methane oxidation in Finnish fen. Res. Microbiol. 2009, 160, 751–756. [Google Scholar] [CrossRef] [PubMed]
- Orphan, V.J.; House, C.H.; Hinrichs, K.-U.; McKeegan, K.D.; DeLong, E.F. Methane-consuming archaea revealed by directly coupled isotopic and phylogenetic analysis. Science 2001, 293, 484–487. [Google Scholar] [CrossRef] [PubMed]
- Cadillo-Quiroz, H.; Yashiro, E.; Yavitt, J.B.; Zinder, S.H. Characterization of the archaeal community in a minerotrophic fen and terminal restriction fragment length polymorphism-directed isolation of a novel hydrogenotrophic methanogen. Appl. Environ. Microbiol. 2008, 74, 2059–2068. [Google Scholar] [CrossRef] [PubMed]
- Dettling, M.D.; Yavitt, J.B.; Cadillo-Quiroz, H.; Sun, C.; Zinder, S.H. Soil–methanogen interactions in two peatlands (bog, fen) in central New York State. Geomicrobiol. J. 2007, 24, 247–259. [Google Scholar] [CrossRef]
- Mohanty, S.R.; Bodelier, P.L.E.; Floris, V.; Conrad, R. Differential effects of nitrogenous fertilizers on methane-consuming microbes in rice field and forest soils. Appl. Environ. Microbiol. 2006, 72, 1346–1354. [Google Scholar] [CrossRef] [PubMed]
- Knoblauch, C.; Zimmermann, U.; Blumenberg, M.; Michaelis, W.; Pfeiffer, E.-M. Methane turnover and temperature response of methane-oxidizing bacteria in permafrost-affected soils of northeast Siberia. Soil Boil. Biochem. 2008, 40, 3004–3013. [Google Scholar] [CrossRef]
- Bockheim, J.G.; Hinkel, K.M.; Eisner, W.R.; Dai, X.Y. Carbon pools and accumulation rates in an age-series of soils in drained thaw-lake basins, Arctic Alaska. Soil Sci. Soc. Am. J. 2004, 68, 697–704. [Google Scholar] [CrossRef]
- Hinkel, K.M.; Eisner, W.R.; Bockheim, J.G.; Nelson, F.E.; Peterson, K.M.; Dai, X. Spatial extent, age, and carbon stocks in drained thaw lake basins on the Barrow Peninsula, Alaska. Arctic, Antarct. Alp. Res. 2003, 35, 291–300. [Google Scholar] [CrossRef]
- Lipson, D.A.; Jha, M.; Raab, T.K.; Oechel, W.C. Reduction of iron (III) and humic substances plays a major role in anaerobic respiration in an Arctic peat soil. J. Geophys. Res. Biogeosci. 2010, 115. [Google Scholar] [CrossRef]
- Thomas, E.K.; Castañeda, I.S.; McKay, N.P.; Briner, J.P.; Salacup, J.M.; Nguyen, K.Q.; Schweinsberg, A.D. A wetter Arctic coincident with hemispheric warming 8000 years ago. Geophys. Res. Lett. 2018, 45, 10637–10647. [Google Scholar] [CrossRef]
- Vaughan, D.G.; Comiso, J.C.; Allison, I.; Carrasco, J.; Kaser, G.; Mote, P.; Murray, T.; Paul, F.; Ren, J.; Rignot, E.; et al. Observations: Cryosphere. In Climate Change 2013: The Physical Science Basis. Contribution of Working Group I to the Fifth Assessment Report of the Intergovernmental Panel on Climate Change; Cambridge University Press: New York, NY, USA, 2013; pp. 317–382. [Google Scholar]
- Bockheim, J.G.; Hinkel, K.M.; Nelson, F.E. Predicting carbon storage in tundra soils of Arctic Alaska. Soil Sci. Soc. Am. J. 2003, 67, 948–950. [Google Scholar] [CrossRef]
- Prater, J.L.; Chanton, J.P.; Whiting, G.J. Variation in methane production pathways associated with permafrost decomposition in collapse scar bogs of Alberta, Canada. Glob. Biogeochem. Cycles 2007, 21. [Google Scholar] [CrossRef]
- Von Fischer, J.C.; Hedin, L.O. Separating methane production and consumption with a field-based isotope pool dilution technique. Glob. Biogeochem. Cycles 2002, 16. [Google Scholar] [CrossRef]
- Bodelier, P.L.E.; Frenzel, P. Contribution of methanotrophic and nitrifying bacteria to CH4 and NH4 + oxidation in the rhizosphere of rice plants as determined by new methods of discrimination. Appl. Environ. Microbiol. 1999, 65, 1826–1833. [Google Scholar] [PubMed]
- Krüger, M.; Meyerdierks, A.; Glöckner, F.O.; Amann, R.; Widdel, F.; Kube, M.; Reinhardt, R.; Kahnt, J.; Böcher, R.; Thauer, R.K.; et al. A conspicuous nickel protein in microbial mats that oxidize methane anaerobically. Nature 2003, 426, 878–881. [Google Scholar] [CrossRef]
- Zehnder, A.J.; Brock, T.D. Methane formation and methane oxidation by methanogenic bacteria. J. Bacteriol. 1979, 137, 420–432. [Google Scholar]
- Nauhaus, K.; Treude, T.; Boetius, A.; Krüger, M. Environmental regulation of the anaerobic oxidation of methane: A comparison of ANME-I and ANME-II communities. Environ. Microbiol. 2005, 7, 98–106. [Google Scholar] [CrossRef]
- Kelly, C.A.; Chynoweth, D.P. Comparison of in situ and in vitro rates of methane release in freshwater sediments. Appl. Environ. Microbiol. 1980, 40, 287–293. [Google Scholar]
- Miller, K.E.; Lai, C.-T.; Friedman, E.S.; Angenent, L.T.; Lipson, D.A. Methane suppression by iron and humic acids in soils of the Arctic Coastal Plain. Soil Boil. Biochem. 2015, 83, 176–183. [Google Scholar] [CrossRef]
- Lipson, D.A.; Raab, T.K.; Goria, D.; Zlamal, J. The contribution of Fe(III) and humic acid reduction to ecosystem respiration in drained thaw lake basins of the Arctic Coastal Plain. Glob. Biogeochem. Cycles 2013, 27, 399–409. [Google Scholar] [CrossRef]
- Lipson, D.A.; Zona, D.; Raab, T.K.; Bozzolo, F.; Mauritz, M.; Oechel, W.C. Water-table height and microtopography control biogeochemical cycling in an Arctic coastal tundra ecosystem. Biogeosciences 2012, 9, 577–591. [Google Scholar] [CrossRef]
- Sturtevant, C.S.; Oechel, W.C. Spatial variation in landscape-level CO2 and CH4 fluxes from arctic coastal tundra: Influence from vegetation, wetness, and the thaw lake cycle. Glob. Chang. Boil. 2013, 19, 2853–2866. [Google Scholar] [CrossRef]
- Sturtevant, C.S.; Oechel, W.C.; Zona, D.; Kim, Y.; Emerson, C.E. Soil moisture control over autumn season methane flux, Arctic Coastal Plain of Alaska. Biogeosciences 2012, 9, 1423–1440. [Google Scholar] [CrossRef]
- Zona, D.; Lipson, D.A.; Zulueta, R.C.; Oberbauer, S.F.; Oechel, W.C. Microtopographic controls on ecosystem functioning in the Arctic Coastal Plain. J. Geophys. Res. Biogeosci. 2011, 116. [Google Scholar] [CrossRef]
- Von Fischer, J.C.; Rhew, R.C.; Ames, G.M.; Fosdick, B.K.; von Fischer, P.E. Vegetation height and other controls of spatial variability in methane emissions from the Arctic coastal tundra at Barrow, Alaska. J. Geophys. Res. Biogeosci. 2010, 115. [Google Scholar] [CrossRef]
- Vaughn, L.J.S.; Torn, M.S. Radiocarbon measurements of ecosystem respiration and soil pore-space CO2 in Utqiaġvik (Barrow), Alaska. Earth Syst. Sci. Data Discuss. 2018, 1–20. [Google Scholar] [CrossRef]
- Quay, P.D.; King, S.L.; Lansdown, J.M.; Wilbur, D.O. Isotopic composition of methane released from wetlands: Implications for the increase in atmospheric methane. Glob. Biogeochem. Cycles 1988, 2, 385–397. [Google Scholar] [CrossRef]
- Alperin, M.J.; Reeburgh, W.S. Carbon isotope fractionation by anaerobic methane oxidation. In Proceedings of the Abstracts of Papers of the American Chemical Society; Americal Chemical Society: Washington, DC, USA, 1987; Volume 193. [Google Scholar]
- Grossman, E.L.; Cifuentes, L.A.; Cozzarelli, I.M. Anaerobic methane oxidation in a landfill-leachate plume. Environ. Sci. Technol. 2002, 36, 2436–2442. [Google Scholar] [CrossRef]
- Martens, C.S.; Albert, D.B.; Alperin, M.J. Stable isotope tracing of anaerobic methane oxidation in the gassy sediments of Eckernforde Bay, German Baltic. Am. J. Sci. 1999, 299, 589–610. [Google Scholar] [CrossRef]
- Bond, D.R.; Lovley, D.R. Reduction of Fe(III) oxide by methanogens in the presence and absence of extracellular quinones. Environ. Microbiol. 2002, 4, 115–124. [Google Scholar] [CrossRef] [PubMed]
- Finneran, K.T.; Johnsen, C.V.; Lovley, D.R. Rhodoferax ferrireducens sp. nov., a psychrotolerant, facultatively anaerobic bacterium that oxidizes acetate with the reduction of Fe(III). Int. J. Syst. Evol. Microbiol. 2003, 53, 669–673. [Google Scholar] [CrossRef] [PubMed]
- Raghoebarsing, A.A.; Pol, A.; van de Pas-Schoonen, K.T.; Smolders, A.J.P.; Ettwig, K.F.; Rijpstra, W.I.C.; Schouten, S.; Damsté, J.S.S.; den Camp, H.J.M.O.; Jetten, M.S.M.; et al. A microbial consortium couples anaerobic methane oxidation to denitrification. Nature 2006, 440, 918–921. [Google Scholar] [CrossRef] [PubMed]
- Gilbert, J.A.; Meyer, F.; Antonopoulos, D.; Balaji, P.; Brown, C.T.; Brown, C.T.; Desai, N.; Eisen, J.A.; Evers, D.; Field, D.; et al. Meeting Report: The Terabase Metagenomics Workshop and the Vision of an Earth Microbiome Project; BioMed Central: London, UK, 2010; p. 243. [Google Scholar]
- Lipson, D.A.; Raab, T.K.; Parker, M.; Kelley, S.T.; Brislawn, C.J.; Jansson, J. Changes in microbial communities along redox gradients in polygonized Arctic wet tundra soils. Environ. Microbiol. Rep. 2015, 7, 649–657. [Google Scholar] [CrossRef]
- Knittel, K.; Lösekann, T.; Boetius, A.; Kort, R.; Amann, R. Diversity and distribution of methanotrophic archaea at cold seeps. Appl. Environ. Microbiol. 2005, 71, 467–479. [Google Scholar] [CrossRef] [PubMed]
- Pruesse, E.; Peplies, J.; Glöckner, F.O. SINA: Accurate high-throughput multiple sequence alignment of ribosomal RNA genes. Bioinformatics 2012, 28, 1823–1829. [Google Scholar] [CrossRef]
- Hall, T.A. BioEdit: A User-Friendly Biological Sequence Alignment Editor and Analysis Program for Windows 95/98/NT; Nucleic Acids Symposium Series; Oxford University Press: Oxford, UK, 1999; pp. 95–98. [Google Scholar]
- Lipson, D.A.; Haggerty, J.M.; Srinivas, A.; Raab, T.K.; Sathe, S.; Dinsdale, E.A. Metagenomic insights into anaerobic metabolism along an Arctic peat soil profile. PLoS ONE 2013, 8, e64659. [Google Scholar] [CrossRef] [PubMed]
- Bidle, K.A.; Kastner, M.; Bartlett, D.H. A phylogenetic analysis of microbial communities associated with methane hydrate containing marine fluids and sediments in the Cascadia margin (ODP site 892B). FEMS Microbiol. Lett. 1999, 177, 101–108. [Google Scholar] [CrossRef] [PubMed]
- Hallam, S.J.; Girguis, P.R.; Preston, C.M.; Richardson, P.M.; DeLong, E.F. Identification of methyl coenzyme M reductase A (mcrA) genes associated with methane-oxidizing archaea. Appl. Environ. Microbiol. 2003, 69, 5483–5491. [Google Scholar] [CrossRef]
- Inagaki, F.; Tsunogai, U.; Suzuki, M.; Kosaka, A.; Machiyama, H.; Takai, K.; Nunoura, T.; Nealson, K.H.; Horikoshi, K. Characterization of C1-Metabolizing Prokaryotic Communities in Methane Seep Habitats at the Kuroshima Knoll, Southern Ryukyu Arc, by Analyzing pmoA, mmoX, mxaF, mcrA, and 16S rRNA Genes. Appl. Environ. Microbiol. 2004, 70, 7445–7455. [Google Scholar] [CrossRef] [PubMed]
- R Core Team. R: A Language and Environment for Statistical Computing; R Foundation for Statistical Computing: Vienna, Austria, 2017. [Google Scholar]
- Kao-Kniffin, J.; Woodcroft, B.J.; Carver, S.M.; Bockheim, J.G.; Handelsman, J.; Tyson, G.W.; Hinkel, K.M.; Mueller, C.W. Archaeal and bacterial communities across a chronosequence of drained lake basins in arctic alaska. Sci. Rep. 2015, 5, 18165. [Google Scholar] [CrossRef]
- Friedman, E.S.; Miller, K.E.; Lipson, D.A.; Angenent, L.T. Potentiostatically poised electrodes mimic iron oxide and interact with soil microbial communities to alter the biogeochemistry of Arctic peat soils. Minerals 2013, 3, 318–336. [Google Scholar] [CrossRef]
- Scheller, S.; Yu, H.; Chadwick, G.L.; McGlynn, S.E.; Orphan, V.J. Artificial electron acceptors decouple archaeal methane oxidation from sulfate reduction. Science 2016, 351, 703–707. [Google Scholar] [CrossRef] [PubMed]
- Gao, Y.; Lee, J.; Neufeld, J.D.; Park, J.; Rittmann, B.E.; Lee, H.-S. Anaerobic oxidation of methane coupled with extracellular electron transfer to electrodes. Sci. Rep. 2017, 7, 5099. [Google Scholar] [CrossRef]
- Valenzuela, E.I.; Prieto-Davó, A.; López-Lozano, N.E.; Hernández-Eligio, A.; Vega-Alvarado, L.; Juárez, K.; García-González, A.S.; López, M.G.; Cervantes, F.J. Anaerobic methane oxidation driven by microbial reduction of natural organic matter in a tropical wetland. Appl. Environ. Microbiol. 2017. [Google Scholar] [CrossRef] [PubMed]
- Zhuang, L.; Xu, J.; Tang, J.; Zhou, S. Effect of ferrihydrite biomineralization on methanogenesis in an anaerobic incubation from paddy soil. J. Geophys. Res. Biogeosci. 2015, 120, 876–886. [Google Scholar] [CrossRef]
- Segarra, K.E.A.; Schubotz, F.; Samarkin, V.; Yoshinaga, M.Y.; Hinrichs, K.-U.; Joye, S.B. High rates of anaerobic methane oxidation in freshwater wetlands reduce potential atmospheric methane emissions. Nat. Commun. 2015, 6, 7477. [Google Scholar] [CrossRef] [PubMed]
- Tan, W.; Jia, Y.; Huang, C.; Zhang, H.; Li, D.; Zhao, X.; Wang, G.; Jiang, J.; Xi, B. Increased suppression of methane production by humic substances in response to warming in anoxic environments. J. Environ. Manag. 2018, 206, 602–606. [Google Scholar] [CrossRef] [PubMed]
- Martinez-Cruz, K.; Leewis, M.-C.; Herriott, I.C.; Sepulveda-Jauregui, A.; Anthony, K.W.; Thalasso, F.; Leigh, M.B. Anaerobic oxidation of methane by aerobic methanotrophs in sub-Arctic lake sediments. Sci. Total. Environ. 2017, 607–608, 23–31. [Google Scholar] [CrossRef] [PubMed]
- Comas, X.; Kettridge, N.; Binley, A.; Slater, L.; Parsekian, A.; Baird, A.J.; Strack, M.; Waddington, J.M. The effect of peat structure on the spatial distribution of biogenic gases within bogs. Hydrol. Process. 2014, 28, 5483–5494. [Google Scholar] [CrossRef]
- Smagin, A.V. Abiotic uptake of gases by organic soils. Eurasian Soil Sci. 2007, 40, 1326–1331. [Google Scholar] [CrossRef]
- Vaughn, L.J.S.; Conrad, M.E.; Bill, M.; Torn, M.S. Isotopic insights into methane production, oxidation, and emissions in Arctic polygon tundra. Glob. Chang. Boil. 2016, 22, 3487–3502. [Google Scholar] [CrossRef] [PubMed]
- Gentsch, N.; Wild, B.; Mikutta, R.; Čapek, P.; Diáková, K.; Schrumpf, M.; Turner, S.; Minnich, C.; Schaarschmidt, F.; Shibistova, O.; et al. Temperature response of permafrost soil carbon is attenuated by mineral protection. Glob. Chang. Boil. 2018, 24, 3401–3415. [Google Scholar] [CrossRef] [PubMed]
- Stackhouse, B.T.; Vishnivetskaya, T.A.; Layton, A.; Chauhan, A.; Pfiffner, S.; Mykytczuk, N.C.; Sanders, R.; Whyte, L.G.; Hedin, L.; Saad, N.; et al. Effects of simulated spring thaw of permafrost from mineral cryosol on CO2 emissions and atmospheric CH4 uptake. J. Geophys. Res. Biogeosci. 2015, 120, 1764–1784. [Google Scholar] [CrossRef]
- Mueller, C.W.; Rethemeyer, J.; Kao-Kniffin, J.; Löppmann, S.; Hinkel, K.M.; Bockheim, J.G. Large amounts of labile organic carbon in permafrost soils of northern Alaska. Glob. Chang. Boil. 2015, 21, 2804–2817. [Google Scholar] [CrossRef] [PubMed]
- Bockheim, J.G. Importance of cryoturbation in redistributing organic carbon in permafrost-affected soils. Soil Sci. Soc. Am. J. 2007, 71, 1335–1342. [Google Scholar] [CrossRef]
© 2019 by the authors. Licensee MDPI, Basel, Switzerland. This article is an open access article distributed under the terms and conditions of the Creative Commons Attribution (CC BY) license (http://creativecommons.org/licenses/by/4.0/).

