Article

A Novel Approach for High-Frequency in-situ Quantification of Methane Oxidation in Peatlands

Department of Forest Ecology and Management, Swedish University of Agricultural Sciences, Skogsmarksgränd, 90183 Umeå, Sweden
*
Author to whom correspondence should be addressed.
Soil Syst. 2019, 3(1), 4; https://doi.org/10.3390/soilsystems3010004
Submission received: 5 October 2018 / Revised: 14 December 2018 / Accepted: 14 December 2018 / Published: 31 December 2018
(This article belongs to the Special Issue Formation and Fluxes of Soil Trace Gases)

Abstract

:
Methane (CH4) oxidation is an important process for regulating CH4 emissions from peatlands as it oxidizes CH4 to carbon dioxide (CO2). Our current knowledge about its temporal dynamics and contribution to ecosystem CO2 fluxes is, however, limited due to methodological constraints. Here, we present the first results from a novel method for quantifying in-situ CH4 oxidation at high temporal resolution. Using an automated chamber system, we measured the isotopic signature of heterotrophic respiration (CO2 emissions from vegetation-free plots) at a boreal mire in northern Sweden. Based on these data we calculated CH4 oxidation rates using a two-source isotope mixing model. During the measurement campaign, 74% of potential CH4 fluxes from vegetation-free plots were oxidized to CO2, and CH4 oxidation contributed 20 ± 2.5% to heterotrophic respiration corresponding to 10 ± 0.5% of ecosystem respiration. Furthermore, the contribution of CH4 oxidation to heterotrophic respiration showed a distinct diurnal cycle being negligible during nighttime while contributing up to 35 ± 3.0% during the daytime. Our results show that CH4 oxidation may represent an important component of the peatland ecosystem respiration and highlight the value of our method for measuring in-situ CH4 oxidation to better understand carbon dynamics in peatlands.

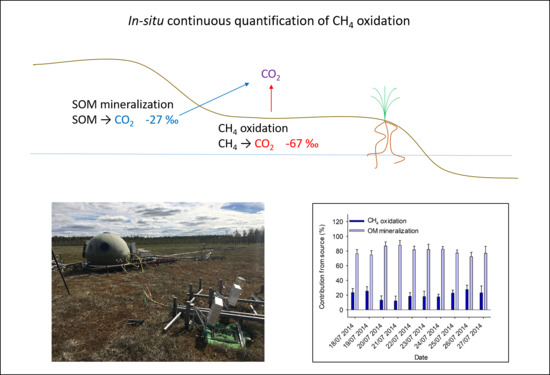
Graphical Abstract

1. Introduction

Northern peatlands are an important component of the global carbon (C) cycle, as they are sinks of carbon dioxide (CO2) and store about one third of the global soil organic C stock [1]. However, northern peatlands also emit the potent greenhouse gas methane (CH4) at a rate that depends on the balance between CH4 production and oxidation of CH4 to CO2. Detailed knowledge of in-situ CH4 production and oxidation dynamics is thus key for understanding the contribution of CH4 from northern peatlands to the atmosphere. Furthermore, as these processes are sensitive to climatic factors [2,3,4], this understanding is even more crucial in order to accurately predict the role of northern peatlands for the atmospheric radiative forcing under a changing climate.
No studies to our knowledge have measured in-situ CH4 oxidation continuously with high temporal resolution in predominantly methanogenic systems, e.g., peatlands, in the field. Furthermore, current studies do not estimate the contribution of CO2 resulting from CH4 oxidation to total ecosystem respiration (ER, abbreviations are listed in Table 1), and thus our understanding of the importance of this process in relation to the other CO2 component fluxes is limited. Most peatland CO2 models assume that all heterotrophic respiration (Rh) comes from soil organic matter (SOM) mineralization [5,6,7,8] while ignoring the contributions from CH4 oxidation. Meanwhile, those models that estimate in-situ CH4 oxidation lack data for validation [9]. This could potentially result in false parametrization and model predictions and overestimation of SOM mineralization with impacts on the modeling of the C balance. Another important limitation of previous studies is that they do not measure CH4 oxidation continuously and with high temporal resolution, and as a result we know little of the temporal variation of CH4 oxidation on both diurnal and seasonal time scales. This might further affect model prediction and estimation, particularly if input data is measured only during daytime and/or during the peak growing season. These issues therefore highlight the need for high temporal resolution CH4 oxidation data in order to support process-based model development and to further improve our understanding of the peatland C cycle.
Current methods for estimating CH4 oxidation in peatlands include laboratory incubations [10,11,12], often in combination with oxidation inhibitors [13,14,15], stable isotope techniques [10,16,17,18,19], methane profiles [20] and gas push-pull tests [21] which all have their strengths and weaknesses. For instance, the disadvantage of incubations is that they may estimate oxidation potentials instead of actual in-situ rates. Meanwhile, oxidation inhibitors are intrusive, do not allow for repeated measurements, and may partly inhibit CH4 production [22,23]. The use of natural abundance stable isotope techniques is promising, although these techniques have traditionally been based on manual sampling which limits the spatial and temporal resolution of these measurements. In addition, natural abundance approaches depend on reliable estimates of the fractionation factors for CH4 oxidation and diffusion [18,24]. Thus, there is a need for new methods that overcome these limitations and allow in-situ measurements of CH4 oxidation at high temporal scales to better parameterize C and greenhouse gas dynamics in peatlands.
This study aims at developing a method for continuous high-frequency estimates of peatland CH4 oxidation and the proportion of Rh that emanates from CH4 oxidation. In spring 2014, we established an experimental setup in the field with automated flux chambers connected to a Picarro G1101-i isotopic CO2 analyzer (Picarro Inc., Santa Clara, CA, USA) in an oligotrophic, minerogenic mire in northern Sweden. We measured massfluxes and isofluxes of ER and Rh (from plots with all photosynthetic biomass removed). By combining the isotopic signature (δ13C) of Rh, organic matter (OM) and pore water CH4 in a two-source mixing model, we were for the first time able to partition the CO2 originating from heterotrophic respiration into CO2 resulting from CH4 oxidation and mineralization of OM.

2. Materials and Methods

2.1. Site Description

The field site is an oligotrophic, minerogenic mire, Degerö Stormyr (64°11′ N, 19°33′ E), located near the town of Vindeln, Västerbotten County, Northern Sweden. The average annual temperature and average annual precipitation of the World Meteorological Organization (WMO) reference normal period 1961–1990 is 1.2 °C and 523 mm respectively (Table 2) [25]. Long-term net ecosystem exchange (NEE) is −58 g C m−2 year−1 [26], average growing season CH4 emission rates are ca. 1 to 5 mg CH4 m−2 h−1 [27], and the net ecosystem carbon balance is ca. −20 to −27 g C m−2 year−1 [28]. Approximately half of the precipitation comes as snow and snow cover lasts for about six months (November to April). The peat layer is on average 3 to 4 m deep and the growing season water table generally varies between ca. 0 and 25 cm [26,28]. The vegetation consists mainly of Sphagnum majus Russ. C. Jens., Sphagnum balticum Russ. C. Jens., and Sphagnum lindbergii Schimp. Ex Lindb, Eriophorum vaginatum L., Trichophorum cespitosum L. Hartm., Vaccinium oxycoccos L., Andromeda polifolia L., Rubus chamaemorus L. [29].

2.2. Experimental Setup

The experimental setup was established in spring 2014 and consists of four replicate blocks containing three plots (1 × 1 m) each with different treatments, resulting in a total of 12 plots. Thus, each treatment/measurement type has four replicates. Each plot is equipped with an automated chamber (45 × 45 cm, 15 cm high) for flux measurements. A detailed description of the automated chamber system is provided by Järveoja et al. 2018 [30]. Briefly, two plots in each block are undisturbed where one is used for measurements of NEE using a transparent chamber and the other for measurements of ER using a dark chamber. In the third plot within each block, the aboveground vegetation, including the green parts (i.e., ~upper 5 cm) of the Sphagnum mosses, was removed in autumn 2013, and a 30 cm deep trench was cut along the plot sides using a handheld saw to prevent root activity inside the plots. These plots were used for measurements of CO2 from heterotrophic activity (Rh) with a dark chamber. CH4 fluxes were also measured at all plots. Each automatic flux chamber has measurements of air temperature 10 cm above the peat surface, and soil temperature at 2 and 10 cm depth. A water level sensor is also placed in each block.

2.3. Measurements of Mass and Isotopes of CH4 and CO2

Fluxes of CO2 and CH4 mass as well as the δ13C signature of the CO2 concentrations were measured in the period of 18 to 27 July 2014. Massfluxes of CO2 (NEE, ER, Rh) and CH4 were measured using a greenhouse gas analyzer (model GGA-24EP, Los Gatos Research (LGR) Inc., San Jose, CA, USA) connected in a closed loop to the chambers. Isofluxes and massfluxes, used for Keeling plots, were measured using a Picarro G1101-i (Picarro Inc., CA, USA) placed downstream of the LGR. Analytical precision for in-situ carbon isotope analyses using the Picarro 1101-i instrument was 0.2‰ based on repeated analysis of known isotopic standards. An external pump was connected to the loop to provide continuous airflow. Chamber closure time lasted 18 min and was preceded and followed by one-minute flushing of the tubes with ambient air before onset of next measurement. Measurements took one hour per block and thus four hours for one round of measurements. The mean time of each four-hour measurement round is used to designate the measurement time point for a four-hour mean flux. For example, the measurement round taking place from 00.00 to 04:00 a.m. is reported for the time point 02:00 a.m.

2.4. Isotopic Signature of Soil Organic Matter and Pore Water CH4

In order to obtain the δ13C signature of soil organic matter (δ13COM), eight peat cores from 0 to 30 cm depth, which represents the area of highest potential CH4 production and oxidation activity [31], were collected from the mire in October 2015. The cores were cut into 2 cm sections and freeze-dried. The 2 cm sections were then ground in a ball mill and analyzed for δ13C signature on an elemental analyzer (Flash EA 2000, Thermo Scientific, Bremen, Germany) coupled to a continuous flow isotope ratio mass spectrometer (IRMS, Delta V Advantage, Thermo Scientific, Bremen, Germany). The standard deviation based on analysis of standards was <0.15‰ for δ13C.
On 3 and 27 August 2015, pore water was collected at 20 and 30 cm just outside the chamber frames in the non-vegetated plots and the vegetated plots used for dark measurements, as well as one location in the middle of the four blocks (n = 30). 2 mL of pore water was sampled using a syringe and transferred to N2 flushed vials. Subsequently, 2 mL of gas was removed from the vials in order to equalize the pressure. The samples were stored at 5 °C until analysis for δ13C signature of CH413CCH4,pw) on a Precon (Thermo Scientific, Bremen, Germany) and a gasbench (GasBench II, Thermo Scientific, Bremen, Germany) connected to a continuous flow IRMS (Delta V Advantage, Thermo Scientific, Bremen, Germany) on 28 and 29 September 2015. The standard deviation based on analysis of standards was <0.3‰ for δ13C.

2.5. Incubation Experiment to Determine the Fractionation Factor for CH4 Oxidation

Four cores of 10 × 10 cm and 20 cm deep were collected in the Degerö mire on 8 October 2017. The cores were divided into four depths 0–5, 5–10, 10–15 and 15–20 cm below live vegetation, put in zip lock bags, brought back to the lab and placed in a freezer (−18 °C). Samples were kept frozen for two months and then preincubated at 4 °C for a month. After preincubation, 10 g field moist peat material from each sub core was transferred to 160 mL airtight glass bottles. Three replicates were made of each sample (to be incubated at three different temperatures) giving a total of 48 bottles (i.e., one sample per layer per core for each temperature). In addition, nine blanks (bottles containing 10 mL water as an analogue for field moist peat) were prepared. All bottles had ambient air inside and were given 0.05 mL pure CH4 to feed the methanotrophs, and placed at 5 °C.
Six days after addition of CH4, two replicate batches of bottles were placed at 10 and 15 °C respectively, while one replicate batch remained at 5 °C. After an additional three days, the bottles were flushed with technical air and given 0.12 mL pure CH4, thereby raising headspace to app. 1000 ppm. Immediately after injecting CH4, 0.5 mL of the headspace was sampled and transferred to 12 mL vials containing helium. Further headspace samples were taken at six, 12, 24, and 48 h and additionally at 96 h for the 0–5 cm interval in order to trace the oxidation rate (i.e., the decrease in headspace CH4 concentration over time, and the concurrent change in δ13C signature of the CH4). For 13C isotope analysis of CH4 in the gas samples, a Finnigan MAT PreCon unit (Thermo Scientific, Bremen, Germany) was used for automated sample conversion and concentration. Briefly, sample CO2 was removed by chemical adsorption succeeded by Pt-catalyzed oxidation of the CH4-component to CO2 that was subsequently trapped by duplicated cryogenic (liquid N2) focusing. The isotopic analysis took place upon separation on a GC (HP 6890, equipped with 25 m long PoraPlot Q fused-silica column (32 mm i.d.), operated at 40 °C) coupled in continuous flow-mode to a Finnigan MAT Delta PLUS isotope ratio mass spectrometer. At the 24-h sampling, an additional 0.5 mL of the headspace was taken out and transferred to a 22 mL vial, where the concentration of CH4 was determined on a gas chromatograph in order to preliminarily assess the oxidation rate and hence the required incubation time (data not shown). By the end of the experiment, the peat samples were dried for 48 h at 60 degrees and weighed for determination of dry weight.

2.6. Flux Calculation and Estimation of Flux Isotopic Signature

Massfluxes of NEE, ER, Rh and CH4 were calculated from the linear change in gas concentration within the chamber headspace over time using the ideal gas law [30]. The linear slope was determined based on 10 concentration records over a 1 min 40 s calculation window (each record representing a 10 s mean of the 1 Hz sampling) moving stepwise (with one-point increments) over the chamber closure period. From these individual slopes, the one with the highest coefficient of determination (R2) was selected as the final slope for each flux measurement. All fluxes with an R2 ≥ 0.90 (p < 0.001) were accepted giving a total of 428 CO2 flux measurements and 437 CH4 flux measurements over the ten-day period.
The δ13C source signature of respired CO2 (corresponding to the δ13C signature of the source material) was determined using the Keeling plot approach [32]. The Picarro G1101-i logged measurements approximately every four seconds. From these data, one-minute averages were generated. Disregarding the first one minute average, we used linear regression analysis of δ13C and 1/[CO2] for the remaining 17 min, with the y-axis intercept corresponding to the 13C signature of respired soil CO2. Intercepts were excluded for regressions with slopes not significantly different from 0 (p > 0.05) and if the slopes were between −0.25 ppm min−1 and 0.25 ppm min−1 due to the uncertainty in Keeling estimates associated with very small fluxes.

2.7. Calculation of Fractionation Factor for CH4 Oxidation

To account for preferential use of 12C over 13C by methanotrophs [33,34], we used a kinetic fractionation factor for CH4 oxidation (hereafter referred to as “fractionation factor” or α). The fractionation factor describes the fractionation against the heavy isotope, where α = 1 means no fractionation and α > 1 means that fractionation is occurring with product becoming depleted in the heavy isotope and the substrate becoming enriched. α was calculated by the following equations [24] based on data from the incubation experiment:
α = 1 ( m + 1 ) ,
where m is:
m = δ 13 C CH 4 , t δ 13 C CH 4 , 0 ln [ CH 4 ] t [ CH 4 ] 0 ,
and δ13CCH4,0 and δ13CCH4,t designates the δ13C signature of the headspace CH4 at times 0 and t, and [CH4]0 and [CH4]t is the concentration of the headspace CH4 at times 0 and t. In practice, since we had more than two time points, m was calculated as the slope of a linear regression between the difference in isotopic signatures (δ13Ct–δ13C0) and natural logarithm of the fraction between remaining and initial headspace CH4 concentration (ln([CH4]t/[CH4]0) [24]. The permil fractionation factor Δ could then be calculated from the α [35]:
Δ = α 1 1000 .
CH4 oxidation rates were also calculated for the incubations, using linear regression. Only significant fractionation factors (slope different from 0, p < 0.05) with a corresponding flux <0 were included in the analysis.

2.8. Mixing Model

The fractional contribution of CH4 oxidation and OM mineralization to total Rh was calculated using a two-source mixing model [35]:
f CH 4 = δ sample δ 13 C OM δ 13 C CH 4 , pw Δ δ OM ,
where fCH4 is the fraction of the heterotrophic respiration contributed by oxidation of CH4, δsample is the δ13C signature of the heterotrophic respiration, δ13CCH4,pw is the isotopic signature of dissolved CH4 in pore water, and δ13COM is the isotopic signature of the OM. We used the mean δ13C signature of OM in 0–30 cm depth and the mean δ13C signature of CH4 in 20 and 30 cm depth for the mixing model. We used the mean fractionation factor for methane oxidation in peat at 0–20 cm depth (Δ = 54.0‰) and across three incubation temperatures (5, 10 and 15 °C) as the statistical test showed no significant effect of neither depth nor temperature. The fractionation factors are subtracted from the δ13CCH4,pw because the oxidation of CH4 discriminates against the heavy isotope (13C) and thus the resulting CO2 is depleted in 13C compared to the source CH4. In other words, the δ13C signature of the CO2 produced during CH4 oxidation is more negative than the source CH4.
The relative contribution of CH4 oxidation (%CH4oxi) is calculated as [36]:
% CH 4 oxi = Oxidized   CH 4   flux Oxidized   CH 4 flux + measured   CH 4 flux 100 ,
and the oxidized CO2 flux is calculated by multiplying fCH4 and Rh.

2.9. Data Presentation and Statistics

The differences in fractionation factor between the four depths, and three temperatures were tested with a mixed linear model in R version 3.5.1 (R Core Team, Vienna, Austria) using depth and temperature as fixed effects and core as random effect. The model was reduced stepwise using ANOVA.
All data are presented as mean and standard error. Means and errors for the time series of relative contribution of CH4 oxidation to Rh as well as time series of isotopic signatures of ER and Rh are weighted averages based on the four-hour averages, as some missing values during nighttime would skew an overall average towards daytime values. Figures were made in Sigmaplot 13.0 (Systat Software Inc., San Jose, CA, USA) and R.

3. Results and Discussion

3.1. Isotopic Signatures of CO2 Fluxes

Measurements of mass- and isofluxes of ER and Rh as well as fluxes of NEE and CH4 from the undisturbed plots in the mire were carried out from 18 to 27 July 2014 (Figure 1 and Figure S1). During this period, the water table level dropped from 0.08 to 0.16 m below mire surface, and the average daily air temperature at 10 cm above mire surface varied between 8.2 and 30.9 °C (Figure S2). The δ13C signature of source CO2 in both the ER and Rh fluxes showed strong diurnal cycles (Figure 1). The δ13C signature of ER (δ13CER) varied between −52 and −22‰ with minimum values occurring during mid-day. The average of δ13CER for the period was −32.3 ± 1.0‰ (±standard error). The four-hour means of δ13C signature of Rh13CRh) usually peaked at 2 am (Figure 1b) with a maximum δ13CRh of −22‰, whereas the minimum δ13CRh was −99‰. Average δ13CRh was −49.2 ± 2.3‰.
The observed diurnal pattern of δ13CER indicates that given the less depleted source during night, ER mainly results from OM mineralization, whereas during the day, the more depleted signatures of CO2 suggest an additional process contributing to ER. This trend is even more apparent in the vegetation-free Rh plots. We suggest that the source of these negative δ13C values is the result of methanotrophs oxidizing CH4 with an average δ13C of −67.2‰ (see below) in the peat pore water. The fact that some δ13CRh values were lower than the average δ13C signature of the CH4 may be due to the uncertainty associated with the estimation of the keeling intercepts (the standard error of the intercept is on average 8.3‰ for Rh) or a small difference in δ13CCH4,pw between the 2014 measurement period and the pore water sampling done in 2015. However, it is also likely due to a large contribution from CH4 oxidation and the fractionation occurring during the oxidation process, which lowers the δ13C signatures of the resulting CO2 relative to the substrate CH4 [33].

3.2. Mixing Model

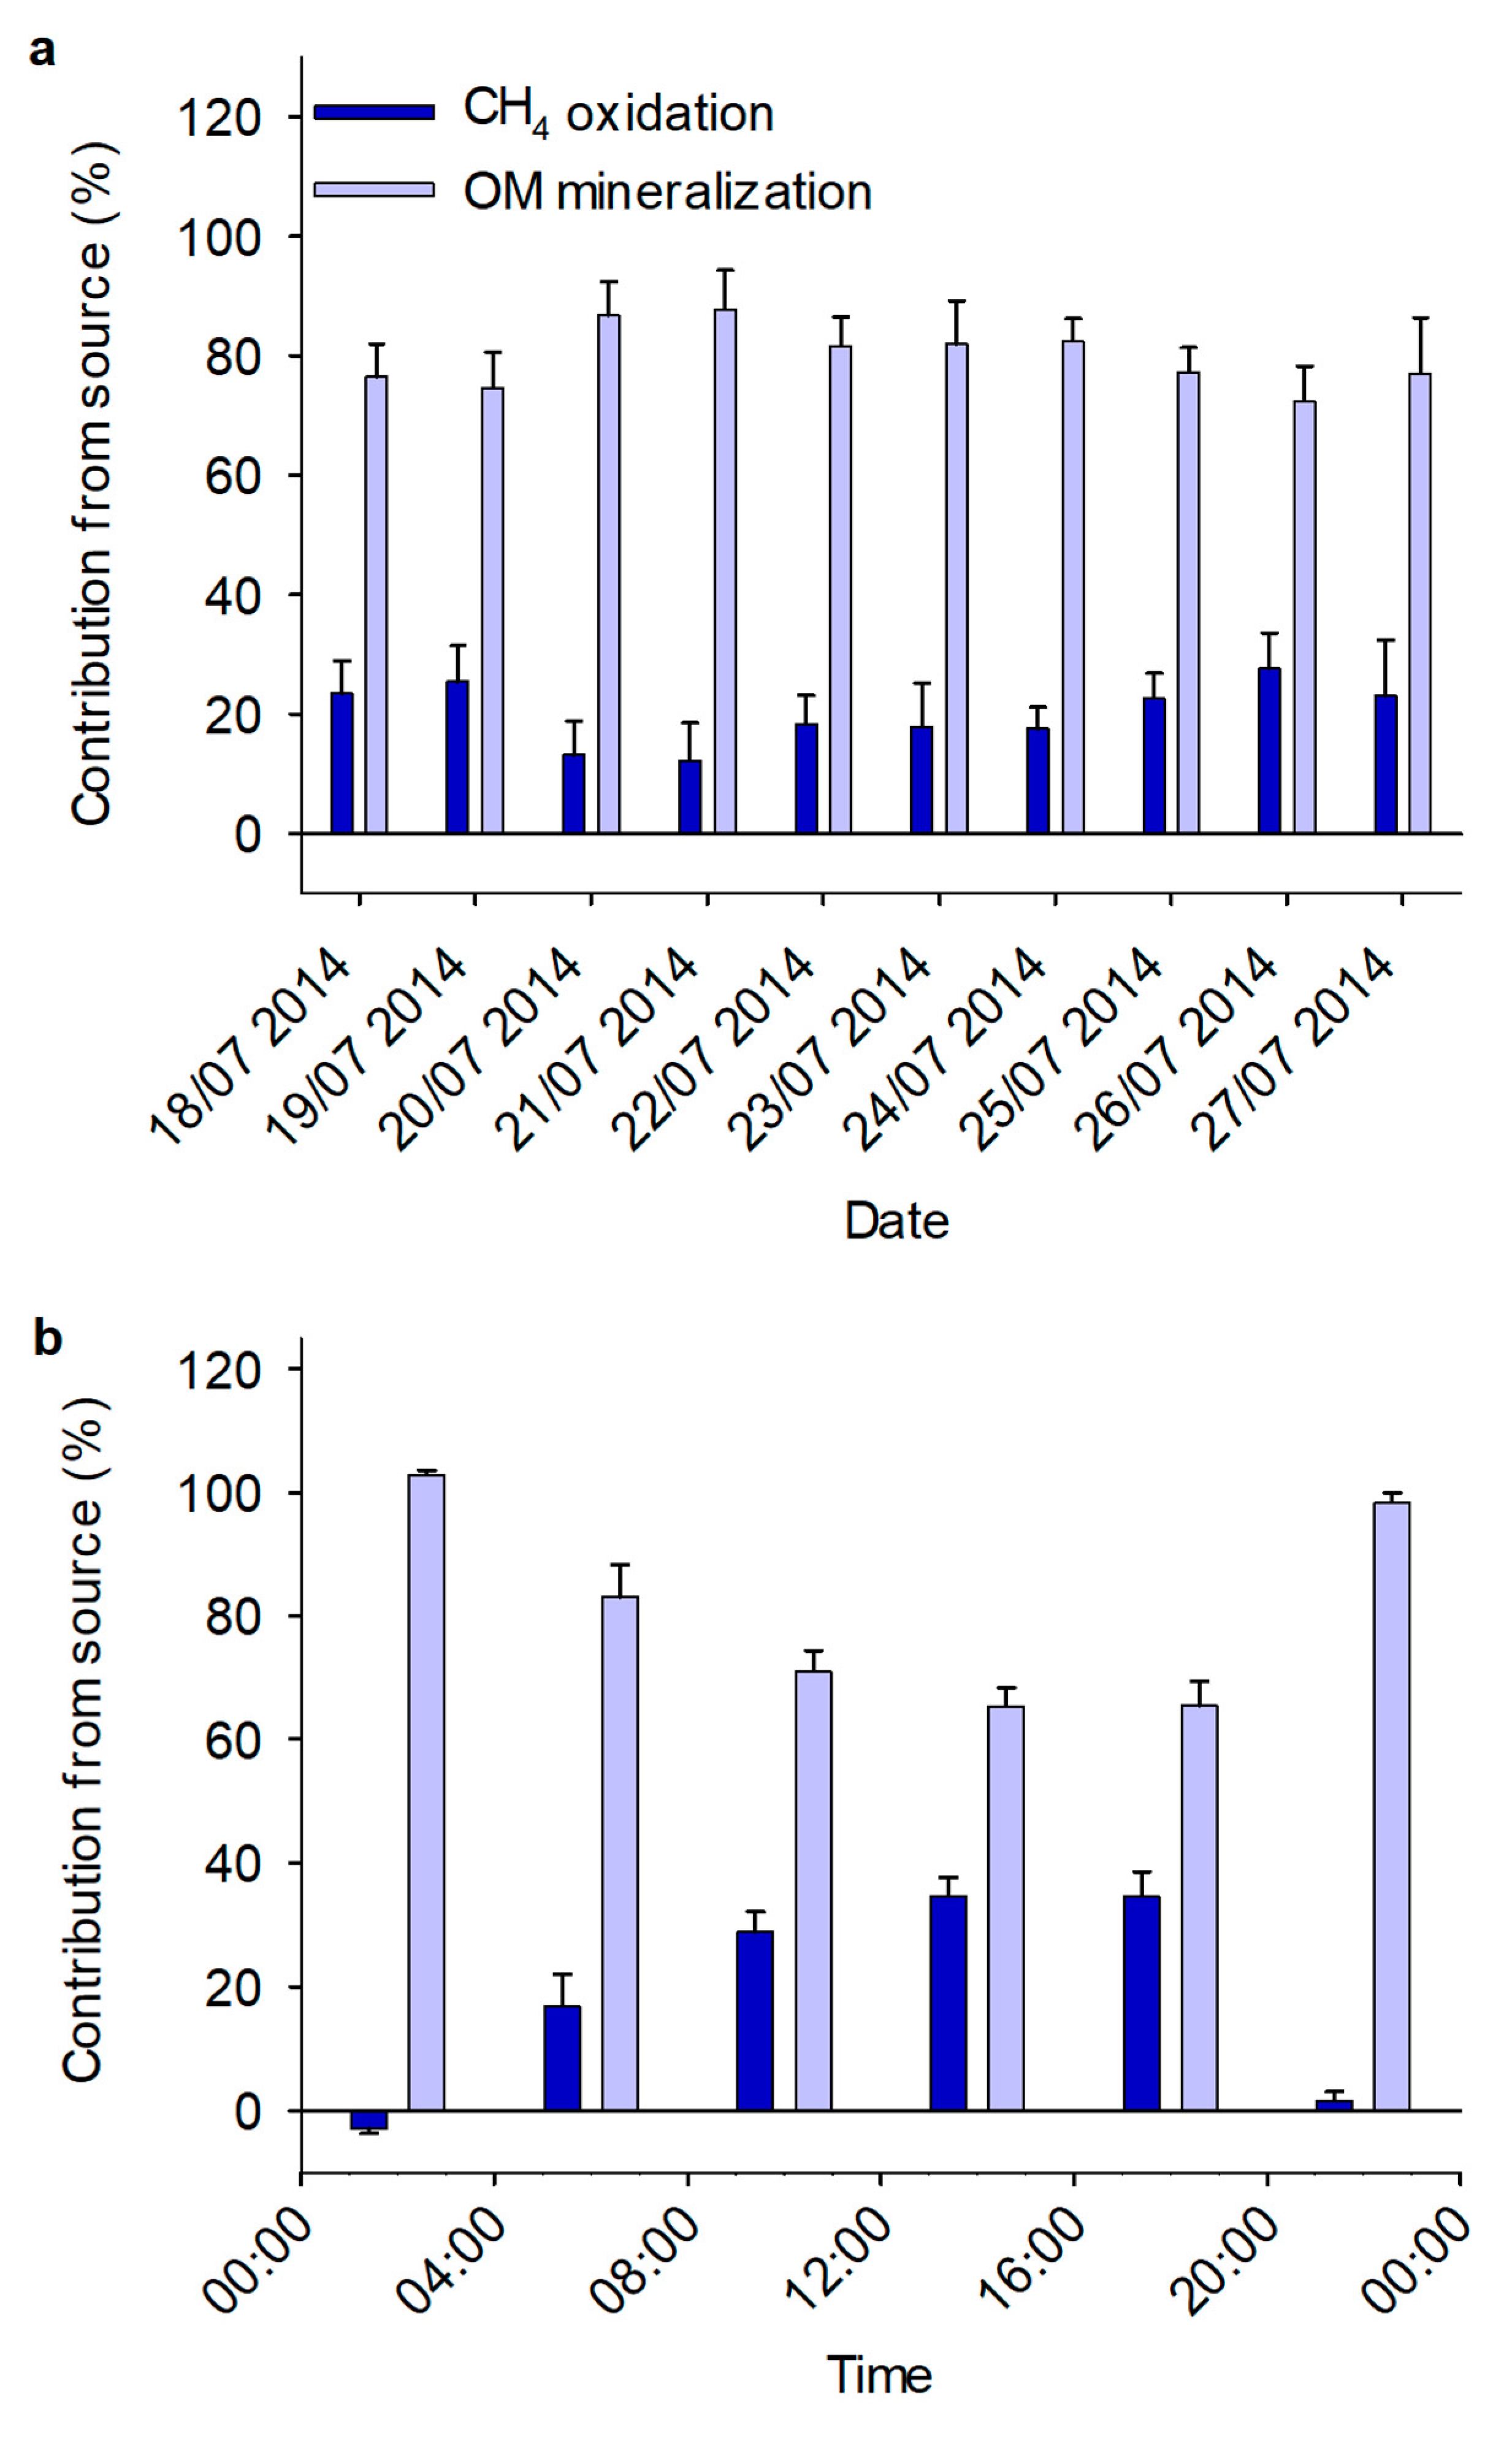
We used a two-source mixing model to quantify the relative contributions of OM mineralization and CH4 oxidation to total Rh fluxes. The δ13C signature of OM (δ13COM) integrated over 0 to 30 cm depth was −27.4‰ (Figure S3) and was used to represent the δ13C signature of OM mineralization in the mixing model. The average δ13C signature of the pore water CH413CCH4,pw) was −67.2‰ and represents the δ13C signature of CO2 originating from CH4 oxidation in the mixing model. We consider the δ13CCH4,pw in 2015 a good representation of the δ13CCH4,pw from 2014 due to little variation between years in these depths below the water table (−73.4 ± 0.5‰ on 8 August 2017 and −68.1 ± 0.6‰ on 26 July 2018). In order to account for the fractionation taking place when CH4 is oxidized to CO2, we subtracted the measured fractionation factor Δ = 54.0 ± 3.4‰ (n = 28) from the δ13CCH4,pw (Figure S4). Our fractionation factor is within the range reported in the literature [19,24,33,37,38,39] though slightly on the high end. Over the measurement period (18 to 27 July 2014) CH4 oxidation contributed 20 ± 2.5% of Rh (Figure 2a) and 10 ± 0.5% of ER (Figure S1, assuming that no additional oxidation occurs in vegetated plots due to production and transport of oxygen by plants). At the same time, if ignoring any difference in transport rate between CH4 and CO2, 74% of the produced CH4 in the Rh plots were oxidized to CO2 within the assessed time period. We made a sensitivity analysis to assess the effect of the calculated contribution of CH4 oxidation to Rh using the minimum and maximum measured δ13COM and δ13CCH4,pw as well as minimum and maximum fractionation factors from the literature (Figures S7 and S8). The analysis showed that the highest and lowest estimates across this period resulted in methane oxidation contributing between 16 and 57% of Rh. Our result (20%) is therefore in the lower range, making it more likely that we underestimate the relative contribution of methane oxidation to soil CO2 effluxes. Using this novel approach our results showed that during a relatively warm and dry period (Figure S2), CH4 oxidation likely reduced CH4 emissions and contributed considerably to Rh in this boreal peatland. Although our approach appears promising in quantifying methane oxidation in real time in the field, our results also stress that more high-frequency measurements are needed to quantify the importance of this process for various mire plant communities and during various stages of the growing season associated with differences in plant phenology, water table levels, and soil temperatures.

3.3. Diurnal Variation

We also observed a diurnal variation in the relative contribution of CH4 oxidation to total CO2 efflux from the Rh plots (Figure 2b). Previously, speculations around diurnal variation in peatland CH4 oxidation have been inferred based on diurnal variation of CH4 fluxes [40]. However, this study shows diurnal variation the isotopic signature of Rh and thus likely in CH4 oxidation. During nighttime, the contribution of CH4 oxidation to Rh seemed negligible, while during the day, CH4 oxidation appeared to contribute up to 35 ± 3.0%. In order to assess whether the diurnal variation was caused by a change in CH4 oxidation rather than increased OM mineralization during night, we calculated the CO2 fluxes associated with the two processes (Figure S5). These fluxes show that even though mineralization like total Rh appears to be higher during night, there still seems to be a distinct diurnal pattern in the CH4 oxidation. We suggest that the diurnal variation is driven by a combination of changes in soil temperature (on average 7.1 and 2.6 °C difference between min. and max. temperatures in 2 and 10 cm depth respectively, Figure S2) and a decreasing water table. The water table follows a staircase-like trend with lowering during day and plateauing at night (Figure S2) and is likely driven by enhanced evapotranspiration during the day. This would lead to daytime O2 intrusion into areas in the soil profile with high CH4 concentration (enhancing CH4 oxidation rates), as well as to the possible release of CO2 with a depleted signature (originating from CH4) due to enhanced diffusion rates [41]. It is important to point out that the diurnal variation in the isotopic signature of CO2 from vegetated plots may also partly be caused by increased input of O2 to the rhizosphere by photosynthesizing plants. Although it was beyond the scope of this study, the observed diurnal variation in methane oxidation highlights the need for depth specific O2 and CH4 measurements in order to better understand the drivers responsible for temporal variation in methane oxidation in the field. The diurnal variation in δ13C signatures of Rh also highlights that bias in the diurnal sampling protocol can influence the results as e.g., only daytime sampling would give values highly biased towards more depleted δ13C signatures. It should also be noted, that there was a buildup of CO2 and CH4 in the air above the mire surface during each night of the measurement period, which may have led to some overestimation of the flux isotopic signature [42,43] (see Figure S6).
Our results show that CH4 oxidation may contribute considerably to Rh fluxes, and thus highlights the importance of including this process in peatland CO2 models in order to better predict and understand peatland C dynamics. Our new approach for measuring CH4 oxidation creates the opportunity for future studies to provide the necessary data to validate and improve these models. Furthermore, studies estimating ecosystem respiration in boreal peatlands based on partitioning of eddy covariance data assume that OM mineralization and plant respiration are the only sources for respired CO2 and commonly relate ecosystem respiration to only one factor; namely temperature [44,45]. However, our results show that in peatland ecosystems a considerable amount of Rh fluxes could be derived from CH4 oxidation which is controlled by additional factors (e.g., water table level [46] and CH4 and O2 availability [47]), that differ from the main factors controlling OM mineralization and plant respiration.

3.4. Methodological Limitations

In our two-source mixing model, we assume that fractionation during diffusion of CH4 and CO2 would not strongly influence our results for the following reasons (1) our estimates of the source δ13C signatures integrate over the soil profile, (2) there was no difference in the δ13CCH4,pw at depths 20 and 30 cm, and (3) CH4 diffusion in water saturated soil causes negligible fractionation [24] and in addition other non-fractionating transport processes such as pressure gradients and near surface layer air flow might have contributed to the total flux [48]. We also assume that OM mineralization and aerobic CH4 oxidation are the only two processes influencing the isotopic signature of 13CO2 from the Rh plots. Although it is possible that anaerobic CH4 oxidation could potentially take place [49,50], we consider this process of minor importance in this nutrient-poor ecosystem. However, if anaerobic CH4 oxidation was occurring, it would produce CH4 less depleted in 13C due to a lower fractionation factor [50] and thereby, if anything, our estimates of contribution of CH4 oxidation to total Rh would be underestimated. We also acknowledge that CO2 is produced during methanogenesis. Theoretically, both hydrogenotrophic (based on carbohydrate fermentation and including the step of H2 production) and acetoclastic methanogenesis produces equimolar amounts of CO2 and CH4, and as the CH4 is depleted compared to the substrate, the CO2 must be equally enriched [51]. An estimation by Corbett and colleagues [51] based on a substrate signature of −26‰ and a resulting CH4 signature of −60‰, suggested a 13C signature of 8‰ for the CO2 produced during methanogenesis [51]. In the current study, we were not able to include the CO2 from methanogenesis in our mixing model, and therefore our estimation of the contribution of CH4 oxidation to total Rh is potentially underestimated. This is because the CO2 from methanogenesis raises the isotopic signature of the total pore water CO2 pool and emitted CO2 and thereby causes the contribution from CH4 oxidation to appear smaller.
We used the method of plant removal and plot trenching for estimating Rh [52]. As is the case for other methods measuring Rh, this approach has some shortcomings. For instance, the removal of the vegetation causes a reduction in supply of rhizodeposits and possibly a lower input of O2 to the soil (due to elimination of downward plant mediated transport of O2). For CH4 oxidation, the latter is mostly relevant when the water table is high and thus limits the diffusion of O2 from the atmosphere into soil, as was not the case during our measurement campaign. The decrease in concentration of both O2 and rhizodeposits may however be counteracted to some extent by lateral transfer with moving water, and we consider this issue of minor importance in our study. The plant removal in the Rh plot also eliminated CH4 transport by plants, and thus the CH4 fluxes from these plots were on average 16% lower than from the vegetated plots. In addition, the potential for CH4 oxidization in the vegetation-free plots might also be somewhat lower to due to the removal of the upper moss layer with its associated methanotrophic communities [53]. However, the oxidation in these plots was on average 74% of potential fluxes, which is marginally higher than the 70% oxidation in vegetated plots, and thus we would argue that vascular plant CH4 transport and moss-associated CH4 oxidation plays only a minor role for net CH4 oxidation in our experiment.
In this study we used an average of the measured fractionation factors across peat depth and incubation temperature as we found no statistical effect of these parameters. We did, however, find a correlation between oxidation rate and fractionation factor (Figure S9), although we were not able to include this information into the mixing model at this point, as we are using the model to estimate the oxidation rate. We acknowledge however that the fractionation factor can vary in response to different parameters such as CH4 concentration and CH4 oxidation rate [54,55]. The fractionation factor may be positively correlated with CH4 starting concentration of in incubations [54] highlighting the importance of matching the CH4 starting concentration of incubations with conditions found in the field. The fractionation factor is also influenced by the fraction of active methanotrophs [55] and thus a decreasing water table could initially influence the fractionation factor when exposing potentially dormant methanotrophs to optimal conditions. However, according to our sensitivity analysis (Figure S8) this factor alone cannot explain the observed diurnal variation in CH4 oxidation. We encourage future studies for improvements on this method by including this component.

4. Conclusions

In this study, we present a new method for continuous, high-frequency in-situ quantification of CH4 oxidation in peatlands. Previous studies from wetlands and lakes have quantified CH4 oxidation using the δ13C (and δD) of pore water or lake water CH4 [19,33,37] and CH4 flux [56]. However, our method is the first, to our knowledge, that uses high temporal resolution isotopic measurements of 13CO2 in Rh fluxes based on automated chamber measurements on vegetation-free plots to quantify the relative contribution of CH4 oxidation to the heterotrophic and ecosystem respiration fluxes in the field. Thus, our approach creates an unprecedented opportunity to study the temporal dynamics and controls of CH4 oxidation in peatland ecosystems. In addition, we observed a diurnal pattern in the δ13C signatures of heterotrophic respiration suggesting a high contribution of CH4 oxidation to CO2 fluxes during daytime and a negligible contribution during nighttime. Overall, our novel approach of directly measuring the isotopic composition of Rh at high temporal resolution provides unique insight into the effect of CH4 oxidation on CO2 and CH4 fluxes, which is crucial for further developing process-based models and improving our understanding of peatland C dynamics.

Supplementary Materials

The following are available online at https://www.mdpi.com/2571-8789/3/1/4/s1, Figure S1. CO2 and CH4 fluxes, Figure S2. PAR, temperature and water table data, Figure S3. Carbon isotopic signature of peat, Figure S4. Fractionation factors, Figure S5. CO2 fluxes from CH4 oxidation and OM mineralization, Figure S6. Ambient air CO2 concentrations and isotopic signatures, Figure S7. Sensitivity analysis of daily averages, Figure S8. Sensitivity analysis of hourly averages, Figure S9. Correlation between fractionation factor and oxidation rate, Table S1. Sensitivity analysis of contribution of CH4 oxidation to heterotrophic respiration.

Author Contributions

Conceptualization, N.J.H., M.B.N., M.Ö. and M.P.; Formal analysis, C.S.N., N.J.H. and J.J.; Funding acquisition, M.B.N.; Investigation, C.S.N., N.J.H. and M.P.; Methodology, C.S.N., N.J.H., M.B.N., M.Ö. and M.P.; Visualization, C.S.N.; Writing—original draft, C.S.N.; Writing—review & editing, C.S.N., N.J.H., M.B.N., M.Ö., J.J. and M.P.

Funding

This research was funded by the Kempe Foundation, grant number JCK-1608 and Carl Tryggers Foundation grant number CTS 15-377.

Acknowledgments

We kindly acknowledge support from the ICOS Sweden (Integrated Carbon Observation System) and SITES (Swedish Infrastructure for Ecosystem Research) research infrastructure funded by the Swedish Research Council and partner research institutes.

Conflicts of Interest

The authors declare no conflict of interest.

References

  1. Loisel, J.; Yu, Z.C.; Beilman, D.W.; Camill, P.; Alm, J.; Amesbury, M.J.; Anderson, D.; Andersson, S.; Bochicchio, C.; Barber, K.; et al. A database and synthesis of northern peatland soil properties and Holocene carbon and nitrogen accumulation. Holocene 2014, 24, 1028–1042. [Google Scholar] [CrossRef] [Green Version]
  2. Christensen, T.R.; Ekberg, A.; Ström, L.; Mastepanov, M.; Panikov, N.; Öquist, M.; Svensson, B.H.; Nykanen, H.; Martikainen, P.J.; Oskarsson, H. Factors controlling large scale variations in methane emissions from wetlands. Geophys. Res. Lett. 2003, 30. [Google Scholar] [CrossRef] [Green Version]
  3. McCalley, C.K.; Woodcroft, B.J.; Hodgkins, S.B.; Wehr, R.A.; Kim, E.H.; Mondav, R.; Crill, P.M.; Chanton, J.P.; Rich, V.I.; Tyson, G.W.; et al. Methane dynamics regulated by microbial community response to permafrost thaw. Nature 2014, 514, 478–481. [Google Scholar] [CrossRef] [PubMed] [Green Version]
  4. Granberg, G.; Mikkela, C.; Sundh, I.; Svensson, B.H.; Nilsson, M. Sources of spatial variation in methane emission from mires in northern Sweden: A mechanistic approach in statistical modeling. Glob. Biogeochem. Cycle 1997, 11, 135–150. [Google Scholar] [CrossRef] [Green Version]
  5. Wu, Y.Q.; Verseghy, D.L.; Melton, J.R. Integrating peatlands into the coupled Canadian Land Surface Scheme (CLASS) v3.6 and the Canadian Terrestrial Ecosystem Model (CTEM) v2.0. Geosci. Model Dev. 2016, 9, 2639–2663. [Google Scholar] [CrossRef] [Green Version]
  6. Wu, J.H.; Roulet, N.T.; Nilsson, M.; Lafleur, P.; Humphreys, E. Simulating the Carbon Cycling of Northern Peat lands Using a Land Surface Scheme Coupled to a Wetland Carbon Model (CLASS3W-MWM). Atmos.-Ocean 2012, 50, 487–506. [Google Scholar] [CrossRef]
  7. Abdalla, M.; Hastings, A.; Bell, M.J.; Smith, J.U.; Richards, M.; Nilsson, M.B.; Peichl, M.; Lofvenius, M.O.; Lund, M.; Helfter, C.; et al. Simulation of CO2 and Attribution Analysis at Six European Peatland Sites Using the ECOSSE Model. Water Air Soil Poll. 2014, 225, 14. [Google Scholar] [CrossRef]
  8. Qiu, C.; Zhu, D.; Ciais, P.; Guenet, B.; Krinner, G.; Peng, S.; Aurela, M.; Bernhofer, C.; Brümmer, C.; Bret-Harte, S.; et al. ORCHIDEE-PEAT (revision 4596), a model for northern peatland CO2, water and energy fluxes on daily to annual scales. Geosci. Mod. Dev. Discuss. 2017. [Google Scholar] [CrossRef]
  9. Metzger, C.; Nilsson, M.B.; Peichl, M.; Jansson, P.E. Parameter interactions and sensitivity analysis for modelling carbon heat and water fluxes in a natural peatland, using CoupModel v5. Geosci. Model Dev. 2016, 9, 4313–4338. [Google Scholar] [CrossRef]
  10. Gerard, G.; Chanton, J. Quantification of methane oxidation in the rhizosphere of emergent aquatic macrophytes: Defining upper limits. Biogeochemistry 1993, 23, 79–97. [Google Scholar] [CrossRef]
  11. Kankaala, P.; Bergström, I. Emission and oxidation of methane in Equisetum fluviatile stands growing on organic sediment and sand bottoms. Biogeochemistry 2004, 67, 21–37. [Google Scholar] [CrossRef]
  12. Sundh, I.; Mikkela, C.; Nilsson, M.; Svensson, B.H. Potential Aerobic Methane Oxidation in a Sphagnum-Dominated Peatland—Controlling Factors and Relation to Methane Emission. Soil Biol. Biochem. 1995, 27, 829–837. [Google Scholar] [CrossRef]
  13. Ding, W.X.; Cai, Z.C.; Tsuruta, H. Factors affecting seasonal variation of methane concentration in water in a freshwater marsh vegetated with Carex lasiocarpa. Biol. Fert. Soils 2005, 41, 1–8. [Google Scholar] [CrossRef]
  14. Lombardi, J.E.; Epp, M.A.; Chanton, J.P. Investigation of the methyl fluoride technique for determining rhizospheric methane oxidation. Biogeochemistry 1997, 36, 153–172. [Google Scholar] [CrossRef]
  15. van der Nat, F.; Middelburg, J.J. Seasonal variation in methane oxidation by the rhizosphere of Phragmites australis and Scirpus lacustris. Aquat. Bot. 1998, 61, 95–110. [Google Scholar] [CrossRef]
  16. Popp, T.J.; Chanton, J.P.; Whiting, G.J.; Grant, N. Methane stable isotope distribution at a Carex dominated fen in north central Alberta. Glob. Biogeochem. Cycle 1999, 13, 1063–1077. [Google Scholar] [CrossRef]
  17. Groot, T.T.; Bodegom, P.M.V.; Harren, F.J.M.; Meijer, H.A.J. Quantification of methane oxidation in the rice rhizosphere using 13C-labelled methane. Biogeochemistry 2003, 64, 355–372. [Google Scholar] [CrossRef]
  18. Riveros-Iregui, D.A.; King, J.Y. Isotopic Evidence of Methane Oxidation across the Surface Water-Ground Water Interface. Wetlands 2008, 28, 928–937. [Google Scholar] [CrossRef]
  19. Cadieux, S.B.; White, J.R.; Sauer, P.E.; Peng, Y.B.; Goldman, A.E.; Pratt, L.M. Large fractionations of C and H isotopes related to methane oxidation in Arctic lakes. Geochim. Cosmochim. Acta 2016, 187, 141–155. [Google Scholar] [CrossRef]
  20. Fechner, E.J.; Hemond, H.F. Methane transport and oxidation in the unsaturated zone of a Sphagnum peatland. Glob. Biogeochem. Cycles 1992, 6, 33–44. [Google Scholar] [CrossRef]
  21. Urmann, K.; Gonzalez-Gil, G.; Schroth, M.H.; Zeyer, J. Quantification of Microbial Methane Oxidation in an Alpine Peat Bog. Vadose Zone J. 2007, 6, 705–712. [Google Scholar] [CrossRef]
  22. King, G.M. In situ analyses of methane oxidation associated with the roots and rhizomes of a bur reed, Sparganium eurycarpum, in a Maine wetland. Appl. Environ. Microbiol. 1996, 62, 4548–4555. [Google Scholar] [PubMed]
  23. Popp, T.J.; Chanton, J.P.; Whiting, G.J.; Grant, N. Evaluation of methane oxidation in the rhizosphere of a Carex dominated fen in north central Alberta, Canada. Biogeochemistry 2000, 51, 259–281. [Google Scholar] [CrossRef]
  24. Preuss, I.; Knoblauch, C.; Gebert, J.; Pfeiffer, E.M. Improved quantification of microbial CH4 oxidation efficiency in arctic wetland soils using carbon isotope fractionation. Biogeosciences 2013, 10, 2539–2552. [Google Scholar] [CrossRef]
  25. Alexandersson, H.; Karlström, C.; Larsson-Mccann, S. Temperature and Precipitation in Sweden during 1961–1990. Reference Normals; SMHI Meteorologi: Norrköping, Sweden, 1991; Volume 81. [Google Scholar]
  26. Peichl, M.; Öquist, M.; Löfvenius, M.O.; Ilstedt, U.; Sagerfors, J.; Grelle, A.; Lindroth, A.; Nilsson, M.B. A 12-year record reveals pre-growing season temperature and water table level threshold effects on the net carbon dioxide exchange in a boreal fen. Environ. Res. Lett. 2014, 9, 11. [Google Scholar] [CrossRef]
  27. Eriksson, T.; Öquist, M.G.; Nilsson, M.B. Effects of decadal deposition of nitrogen and sulfur, and increased temperature, on methane emissions from a boreal peatland. J. Geophys. Res.-Biogeosci. 2010, 115, 13. [Google Scholar] [CrossRef]
  28. Nilsson, M.; Sagerfors, J.; Buffam, I.; Laudon, H.; Eriksson, T.; Grelle, A.; Klemedtsson, L.; Weslien, P.; Lindroth, A. Contemporary carbon accumulation in a boreal oligotrophic minerogenic mire—A significant sink after accounting for all C-fluxes. Glob. Chang. Biol. 2008, 14, 2317–2332. [Google Scholar] [CrossRef]
  29. Laine, A.M.; Bubier, J.; Riutta, T.; Nilsson, M.B.; Moore, T.R.; Vasander, H.; Tuittila, E.-S. Abundance and composition of plant biomass as potential controls for mire net ecosytem CO2 exchange. Botany 2011, 90, 63–74. [Google Scholar] [CrossRef]
  30. Järveoja, J.; Nilsson, M.B.; Gažovič, M.; Crill, P.M.; Peichl, M. Partitioning of the net CO2 exchange using an automated chamber system reveals plant phenology as key control of production and respiration fluxes in a boreal peatland. Glob. Chang. Biol. 2018, 24, 3436–3451. [Google Scholar] [CrossRef]
  31. Eriksson, T.; Öquist, M.G.; Nilsson, M.B. Production and oxidation of methane in a boreal mire after a decade of increased temperature and nitrogen and sulfur deposition. Glob. Change Biol. 2010, 16, 2130–2144. [Google Scholar] [CrossRef]
  32. Keeling, C.D. The Concentration and Isotopic Abundances of Atmospheric Carbon Dioxide in Rural Areas. Geochim. Cosmochim. Acta 1958, 13, 322–334. [Google Scholar] [CrossRef]
  33. Happell, J.D.; Chanton, J.P.; Showers, W.S. The Influence of Methane Oxidation on the Stable Isotopic Composition of Methane Emitted from Florida Swamp Forests. Geochim. Cosmochim. Acta 1994, 58, 4377–4388. [Google Scholar] [CrossRef]
  34. Coleman, D.D.; Risatti, J.B.; Schoell, M. Fractionation of Carbon and Hydrogen Isotopes by Methane-Oxidizing Bacteria. Geochim. Cosmochim. Acta 1981, 45, 1033–1037. [Google Scholar] [CrossRef]
  35. Fry, B. Stable Isotope Ecology; Springer: New York, NY, USA, 2006; p. 316. [Google Scholar]
  36. Schipper, L.A.; Reddy, K.R. Determination of methane oxidation in the rhizosphere of Sagittaria lancifolia using methyl fluoride. Soil Sci. Soc. Am. J. 1996, 60, 611–616. [Google Scholar] [CrossRef]
  37. Kankaala, P.; Taipale, S.; Nykanen, H.; Jones, R.I. Oxidation, efflux, and isotopic fractionation of methane during autumnal turnover in a polyhumic, boreal lake. J. Geophys. Res.-Biogeosci. 2007, 112. [Google Scholar] [CrossRef] [Green Version]
  38. De Visscher, A.; De Pourcq, I.; Chanton, J. Isotope fractionation effects by diffusion and methane oxidation in landfill cover soils. J. Geophys. Res.-Atmos. 2004, 109, 8. [Google Scholar] [CrossRef]
  39. Reeburgh, W.S.; Hirsch, A.I.; Sansone, F.J.; Popp, B.N.; Rust, T.M. Carbon kinetic isotope effect accompanying microbial oxidation of methane in boreal forest soils. Geochim. Cosmochim. Acta 1997, 61, 4761–4767. [Google Scholar] [CrossRef] [Green Version]
  40. Mikkelä, C.; Sundh, I.; Svensson, B.H.; Nilsson, M. Diurnal variation in methane emission in relation to the water table, soil temperature, climate and vegetation cover in a Swedish acid mire. Biogeochemistry 1995, 28, 93–114. [Google Scholar] [CrossRef]
  41. Moore, T.R.; Dalva, M. The influence of temperature and water table position on carbon dioxide and methane emissions from laboratory columns of peatland soils. J. Soil Sci. 1993, 44, 651–664. [Google Scholar] [CrossRef]
  42. van Asperen, H.; Warneke, T.; Sabbatini, S.; Höpker, M.; Nicolini, G.; Chiti, T.; Papale, D.; Böhm, M.; Notholt, J. Diel variation in isotopic composition of soil respiratory CO2 fluxes: The role of non-steady state conditions. Agric. For. Meteorol. 2017, 234–235, 95–105. [Google Scholar] [CrossRef]
  43. Braendholt, A.; Larsen, K.S.; Ibrom, A.; Pilegaard, K. Overestimation of closed-chamber soil CO2 effluxes at low atmospheric turbulence. Biogeosciences 2017, 14, 1603–1616. [Google Scholar] [CrossRef]
  44. Lasslop, G.; Reichstein, M.; Papale, D.; Richardson, A.D.; Arneth, A.; Barr, A.; Stoy, P.; Wohlfahrt, G. Separation of net ecosystem exchange into assimilation and respiration using a light response curve approach: Critical issues and global evaluation. Glob. Chang. Biol. 2010, 16, 187–208. [Google Scholar] [CrossRef]
  45. Reichstein, M.; Falge, E.; Baldocchi, D.; Papale, D.; Aubinet, M.; Berbigier, P.; Bernhofer, C.; Buchmann, N.; Gilmanov, T.; Granier, A.; et al. On the separation of net ecosystem exchange into assimilation and ecosystem respiration: Review and improved algorithm. Glob. Chang. Biol. 2005, 11, 1424–1439. [Google Scholar] [CrossRef]
  46. Roslev, P.; King, G.M. Regulation of methane oxidation in a freshwater wetland by water table changes and anoxia. FEMS Microbiol. Ecol. 1996, 19, 105–115. [Google Scholar] [CrossRef] [Green Version]
  47. Lai, D.Y.F. Methane Dynamics in Northern Peatlands: A Review. Pedosphere 2009, 19, 409–421. [Google Scholar] [CrossRef]
  48. Redeker, K.R.; Baird, A.J.; Teh, Y.A. Quantifying wind and pressure effects on trace gas fluxes across the soil–atmosphere interface. Biogeosciences 2015, 12, 7423–7434. [Google Scholar] [CrossRef] [Green Version]
  49. Smemo, K.A.; Yavitt, J.B. Anaerobic oxidation of methane: An underappreciated aspect of methane cycling in peatland ecosystems? Biogeosciences 2011, 8, 779–793. [Google Scholar] [CrossRef]
  50. Smemo, K.A.; Yavitt, J.B. Evidence for Anaerobic CH4 Oxidation in Freshwater Peatlands. Geomicrobiol. J. 2007, 24, 583–597. [Google Scholar] [CrossRef]
  51. Corbett, J.E.; Tfaily, M.M.; Burdige, D.J.; Cooper, W.T.; Glaser, P.H.; Chanton, J.P. Partitioning pathways of CO2 production in peatlands with stable carbon isotopes. Biogeochemistry 2013, 114, 327–340. [Google Scholar] [CrossRef]
  52. Bond-Lamberty, B.; Bronson, D.; Bladyka, E.; Gower, S.T. A comparison of trenched plot techniques for partitioning soil respiration. Soil Biol. Biochem. 2011, 43, 2108–2114. [Google Scholar] [CrossRef]
  53. Larmola, T.; Tuittila, E.S.; Tiirola, M.; Nykanen, H.; Martikainen, P.J.; Yrjala, K.; Tuomivirta, T.; Fritze, H. The role of Sphagnum mosses in the methane cycling of a boreal mire. Ecology 2010, 91, 2356–2365. [Google Scholar] [CrossRef] [PubMed]
  54. Teh, Y.A.; Silver, W.L.; Conrad, M.E.; Borglin, S.E.; Carlson, C.M. Carbon isotope fractionation by methane-oxidizing bacteria in tropical rain forest soils. J. Geophys. Res.-Biogeosci. 2006, 111. [Google Scholar] [CrossRef] [Green Version]
  55. Templeton, A.S.; Chu, K.-H.; Alvarez-Cohen, L.; Conrad, M.E. Variable carbon isotope fractionation expressed by aerobic CH4-oxidizing bacteria. Geochim. Cosmochim. Acta 2006, 70, 1739–1752. [Google Scholar] [CrossRef]
  56. Dorodnikov, M.; Marushchak, M.; Biasi, C.; Wilmking, M. Effect of microtopography on isotopic composition of methane in porewater and efflux at a boreal peatland. Boreal Environ. Res. 2013, 18, 269–279. [Google Scholar]
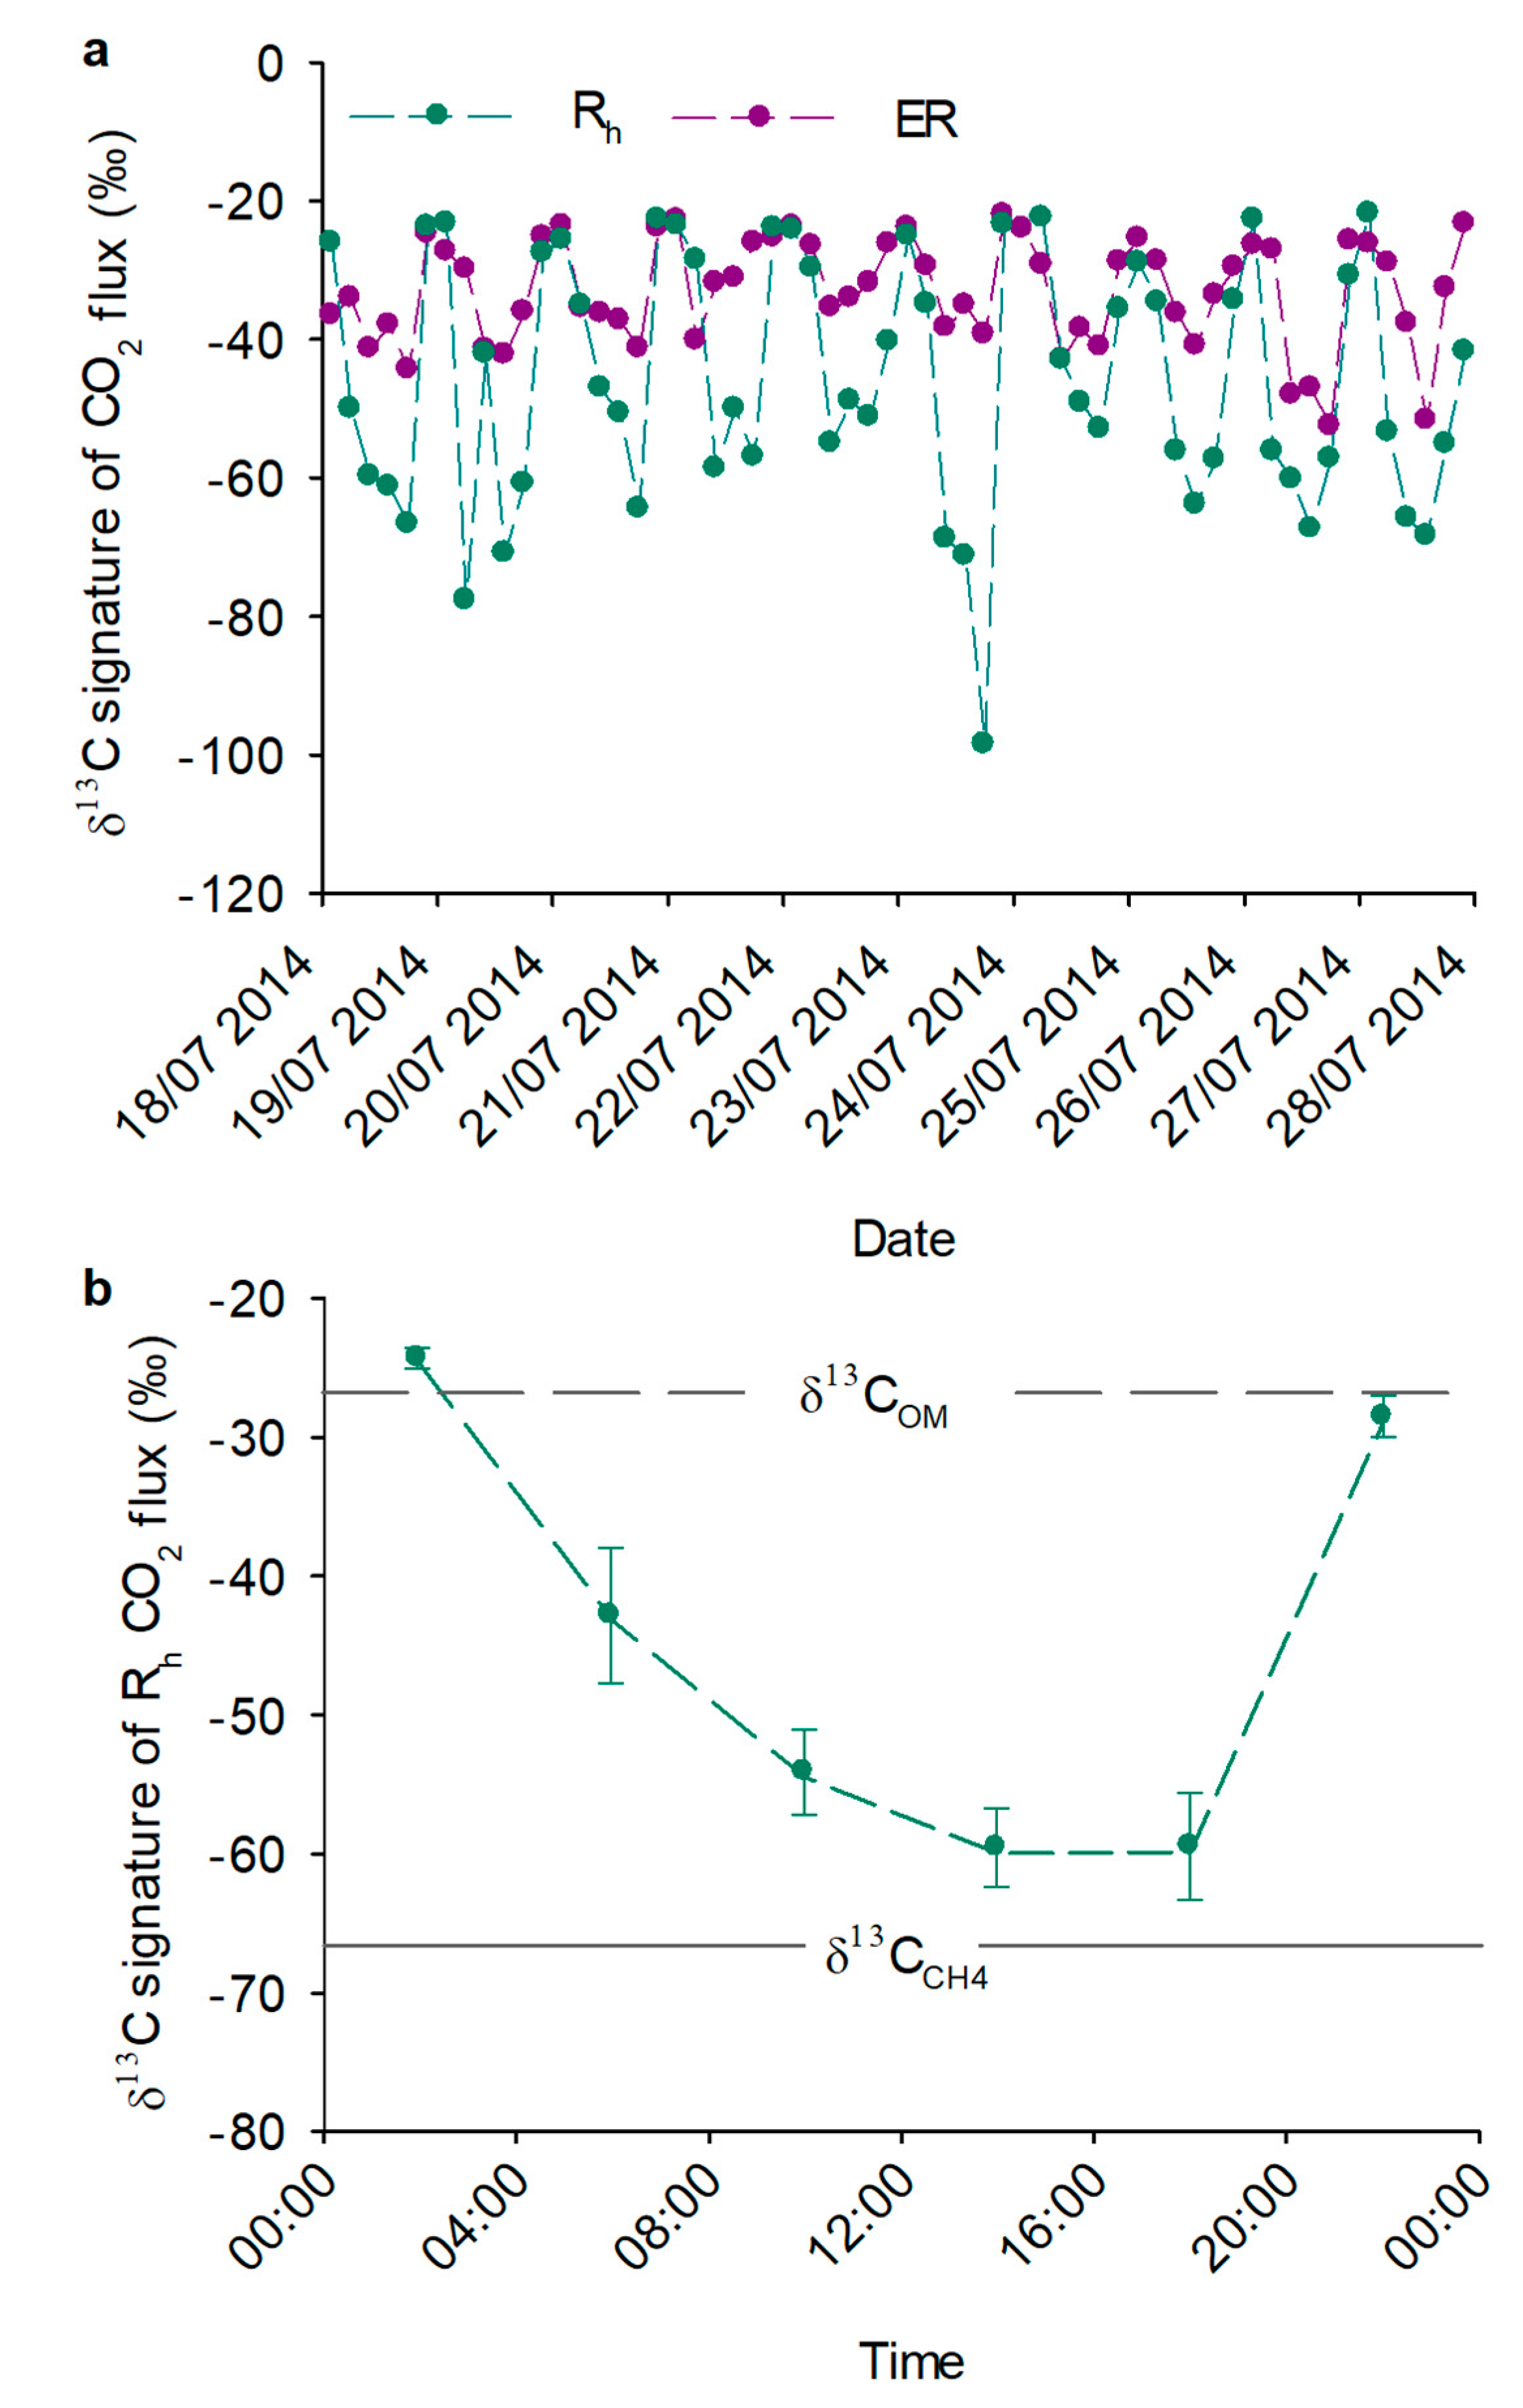
Figure 1. (a) Four-hourly averages of the carbon isotopic signatures of ecosystem respiration (ER) and heterotrophic respiration (Rh) and (b) average diurnal variation during 18 to 27 July 2014 in the isotopic signature of CO2 fluxes from the Rh plots (i.e., plots that had all photosynthetic biomass removed). Error bars in (b) show standard error. Dashed and solid lines in (b) show respectively the δ13C signatures of organic matter (δ13COM) and pore water CH413CCH4,pw) in the peatland. The lines connecting the points are visual aids.
Soilsystems 03 00004 g001
Figure 2. The relative contribution of CH4 oxidation and organic matter (OM) mineralization to heterotrophic respiration for the period 18 to 27 July 2014 shown as (a) daily averages and (b) diurnal ensembles. Error bars show standard error. The negative contribution from CH4 oxidation to Rh at 2 am is an artifact of uncertainty in the estimation.
Soilsystems 03 00004 g002
Table 1. List of abbreviations used in the article.
TermAbbreviation
Concentration of headspace CH4 at time 0 in the incubation experiment for the fractionation factor[CH4]0
Concentration of headspace CH4 at time t in the incubation experiment for the fractionation factor[CH4]t
Ecosystem respirationER
Fractional contribution of CH4 oxidation to heterotrophic respirationfCH4
Kinetic fractionation factorα
Heterotrophic respirationRh
Isotopic 13C signatureδ13C
Isotopic 13C signature of ecosystem respiration δ13CER
Isotopic 13C signature of headspace CH4 at times 0 in the incubation experiment for the fractionation factorδ13CCH4,0
Isotopic 13C signature of headspace CH4 at times t in the incubation experiment for the fractionation factorδ13CCH4,t
Isotopic 13C signature of heterotrophic respirationδ13CRh
Isotopic 13C signature of pore water CH4δ13CCH4,pw
Isotopic 13C signature of organic matterδ13COM
Net ecosystem exchangeNEE
Organic matterOM
Permil fractionation factorΔ
Relative CH4 oxidation %%CH4oxi
Soil organic matterSOM
Table 2. Climate and soil properties at Degerö Stormyr.
PropertiesValue
Mean annual temperature1.2 °C [25]
Mean annual precipitation523 mm [25]
Growing season mean water table level−4.1 cm [30]
Average depth of peat layer3–4 m [28]
Peat C:N ratio 168.9 ± 1.9
1 0–30 cm depth.