Article

Biochar Particle Size and Post-Pyrolysis Mechanical Processing Affect Soil pH, Water Retention Capacity, and Plant Performance

University of Toronto, Faculty of Forestry, 33 Willcocks St., Toronto, ON M5S 3B3, Canada
*
Author to whom correspondence should be addressed.
Soil Syst. 2019, 3(1), 14; https://doi.org/10.3390/soilsystems3010014
Submission received: 29 December 2018 / Revised: 11 February 2019 / Accepted: 12 February 2019 / Published: 14 February 2019

Abstract

:
It has become common practice in soil applications of biochar to use ground and/or sieved material to reduce particle size and so enhance mixing and surface contact between soils and char particles. Smaller particle sizes of biochars have been suggested to enhance liming effects and nutrient exchange, and potentially to increase water storage capacity; however, data remains scarce and effects on plant growth responses have not been examined. We manipulated biochar particle size by sieving or grinding to generate particles in two size ranges (0.06–0.5 mm and 2–4 mm), and examined effects on soil pH, soil water retention, and plant physiological and growth performance of two test species (ryegrass: Lolium multiflorum, and velvetleaf: Abutilon theophrasti) grown in a granitic sand culture. The small particle sieved biochar had the largest liming effect, increasing substrate pH values by an additional ~0.3 pH units compared to other biochars. Small particle size biochar showed enhanced water retention capacity, and sieved biochars showed 91%–258% larger water retention capacity than ground biochars of similar particle size, likely because sieved particles were more elongated than ground particles, and thus increased soil interpore volume. The two plant species tested showed distinct patterns of response to biochar treatments: ryegrass showed a better growth response to large biochar particles, while velvetleaf showed the highest response to the small, sieved biochar treatment. We show for the first time that post-processing of biochars by sieving and grinding has distinct effects on biochar chemical and physical properties, and that resulting differences in properties have large but strongly species-specific effects on plant performance in biochar-amended substrates.

Graphical Abstract

1. Introduction

Biochar has been defined as a carbon-rich product produced by pyrolyzing biomass under oxygen-limited conditions and intended for use as a soil amendment [1]. Biochar addition, particularly to nutrient-deficient and/or drought-prone soils, generally increases the yield of crop plants and trees [2,3], as well as enhancing soil carbon sequestration. Biochar is thought to enhance plant growth by improving both chemical (e.g., increasing pH of acid soils and enhancing cation exchange capacity) and physical (e.g., enhancing water retention capacity) properties of soil [4].
Biochars vary greatly in their properties; efforts to “design” biochars for specific applications have mainly focused on pyrolysis parameters. Biochar pH increases with pyrolysis temperature, but is also determined by variation in feedstock chemistry [5,6]. Higher pyrolysis temperatures enhance the liming effect of biochar, which generally increases plant available phosphorus (P) and potassium (K) on acid soils [2] and reduces mobility and bioavailability of common toxic metals [7,8]. Biochars, particularly those generated at relatively high pyrolysis temperatures, also improve soil water retention capacity (WRC) and plant available water content in soils by directly storing water in the pores and indirectly by rearranging soil particles [9]. Biochar amendments can also result in increased leaf and whole-plant water-use efficiency [10,11], though such an effect is not always observed (e.g., Thomas et al. 2013 [12]). As water acts as a medium to transport nutrients to plants and microbial communities in soils, higher soil WRC is expected to enhance plant nutrient status [13,14].
Particle size is an important aspect of biochar “design” that has received much less research attention. Particle size is expected to strongly influence interactions between soil and biochar, since smaller biochar particles will necessarily have greater physical contact with soil particles [15,16]. One predicted consequence is that smaller biochar particles will result in more rapid pH equilibration of soil-biochar mixtures and potentially higher pH values [8,16,17]. In addition to a mechanism based on increased particle contact, Chen et al. (2017) [16] suggest that biochar derived from smaller feedstock particles generally have higher ash content, which enhances liming effects. There is also evidence that biochar with smaller particle sizes can increase nutrient and organic compound sorption [18]. Sun et al. (2012) [19] found that the smaller the feedstock particle size, the larger the microporosity of resulting biochars. Additionally, some studies indicate that biochars produced from smaller-sized feedstock particles have larger Brunauer–Emmett–Teller (BET) surface areas and larger external surface areas [18,20]. Microporosity, surface areas, and external surface areas are critical factors that determine biochar’s ability to absorb and exchange nutrient ions; therefore, biochars with smaller particle sizes might result in higher plant nutrient availability.
Recent research indicates that, in general, biochar improves WRC of soils [10,21,22,23]. Biochar helps to form soil macro-aggregates and improve soil structure [22,24], which generally reduces bulk density of biochar-soil mixtures [25,26]. Particle geometry is also important: the creation of interpores between soil and non-spherical biochar particles can increase water content stored in the soil [14]. Prior studies of porosity [26,27] suggest that pores on external surfaces, as well as inner micro-pores and meso-pores of biochar, retain water in biochar-amended soils. Liu et al. (2016) [22] suggest that the hydrophilicity of biochar surfaces might contribute to water sorption. However, biochar with different particle sizes might influence WRC differently. Zhang et al. (2010) [28] found that biochars with larger particle sizes had higher WRC, as water can only flow through smaller pore spaces between soil particles. However, Chen et al. (2017) [16] report the opposite pattern: smaller biochar particles were more efficient at storing water, due to increased external particle surface area compared with larger biochar particles. Related research suggests that the WRC of biochar-soil mixtures depends on soil particle size [27]. It has been suggested that biochar particles that are either smaller or larger than soil particles will mechanically lead to increased packing, resulting in increased tortuosity of the soil pore space [27].
Although there are strong reasons to expect effects of biochar particle size on its effectiveness in terms of stimulation of plant growth, we are not aware of any prior study that explicitly addresses this point. There is also an important distinction to be made regarding the particle size of feedstock used to generate biochars, versus the particle size of the biochars themselves. Biochars generated by feedstocks with differing particle size are expected to differ in terms of chemical properties: smaller feedstock particles increase the rate of escape of volatile organics and syngas, and the biochars produced have been found to exhibit increased ash content [16]. We therefore predict that sorting of biochar particles by sieving or similar means is likely to produce biochars that differ in chemical properties. Conversely, the same biochar ground to produce different-sized particles is expected to show similar chemical properties, but to differ in terms of its capacity to intermingle and interact with soil particles.
In the present study, we examine biochar particle size effects on soil pH, WRC, and plant performance. We manipulated materials by physical grinding and sieving to obtain biochars of the same feedstock and pyrolysis conditions but of varying particle size. Lab and greenhouse experiments were conducted to address the following hypotheses: (1) Addition of biochar with smaller particle sizes will result in increased soil pH and increased soil water retention capacity relative to biochar with larger particle size; (2) Biochar with smaller particle sizes will have stronger positive effects on plant growth than that with larger particle sizes; (3) Particle size effects, particularly those related to chemistry, will be more pronounced when produced by sieving than by physical grinding.

2. Materials and Methods

2.1. Biochar Production, Particle Sizes, and Preparation

The biochar used was produced from sugar maple (Acer saccharum) wood, which was harvested and processed at Haliburton Forest and Wildlife Reserve, Ltd. A rotating drum batch pyrolyzer was used; woodchip and sawdust feedstock were pyrolyzed under oxygen-limited conditions for ~2 h at peak temperatures of 363–374 °C (with ~40 min at peak temperature). The pyrolysis system was passive and so temperatures varied somewhat between runs; low oxygen conditions were maintained by positive pressure within the reaction vessel (a more complete description of the system is provided by Sackett et al. 2015 [29]). We assumed that in practice sieving alone to produce small biochar particles would require small particle feedstock, while grinding could make use of larger feedstock. Both large and small sieved (hereafter L-sieved and S-sieved) biochars were produced from sawdust feedstock: L-sieved biochar passed through a 4 mm mesh and was collected by a 2 mm mesh; S-sieved biochar was passed through a 0.5 mm mesh and collected by a 0.0635 mm mesh. The ground biochars were produced from pyrolyzed wood chips. The large ground (hereafter L-ground) biochar was ground with a mortar and pestle and then sieved through a 4 mm sieve, with collection by a 2 mm sieve. The small-sized (0.0635–0.5 mm) ground biochar (hereafter S-ground) was ground with a laboratory mill (Arthur H. Thomas Company, PA, USA), and then sieved by a 0.5 mm mesh and collected by a 0.0635 mm mesh (Figure 1).
Before mixing different biochars with sand, the biochars were pre-washed with a 1:5 (v/v) mixture of biochar to de-ionized water to remove water-soluble phytotoxic organic compounds that may have negative effects on plant growth [11]. The biochar-water mixture was shaken on an oscillating table at 60 RPM for 48 h to make the biochars water-saturated, and the mixture was then oven-dried at 60 °C for 48 h.

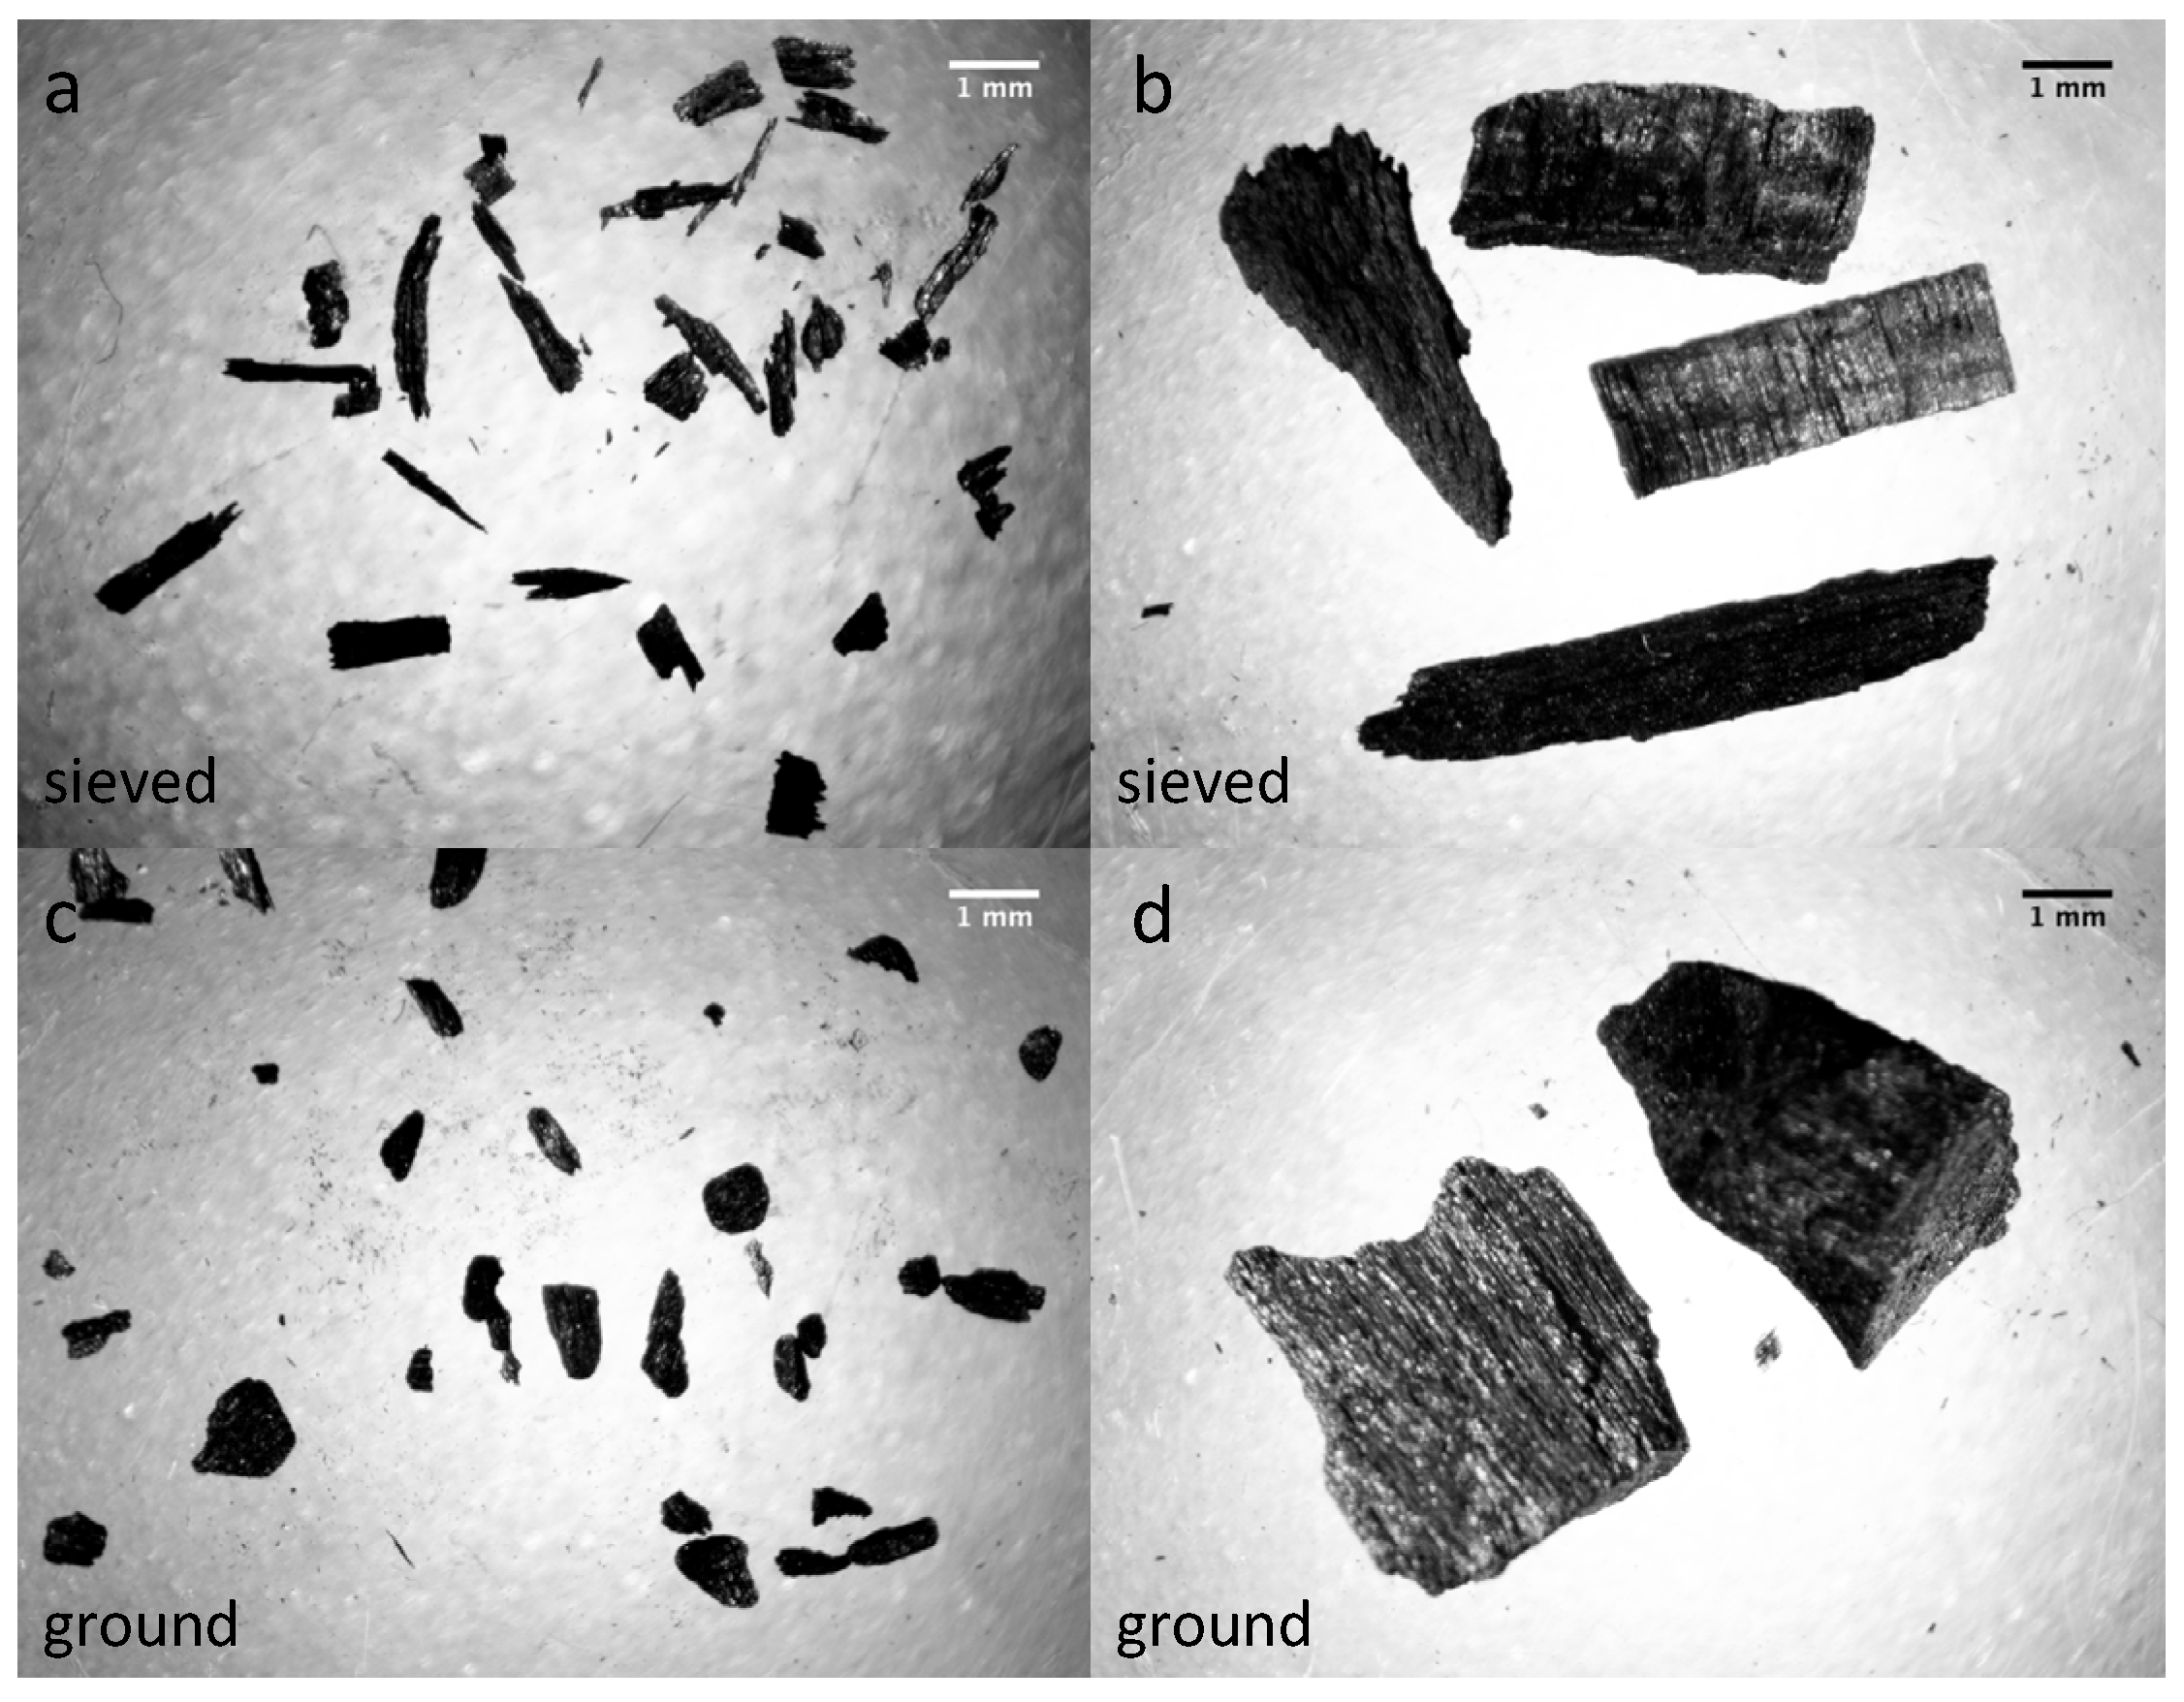
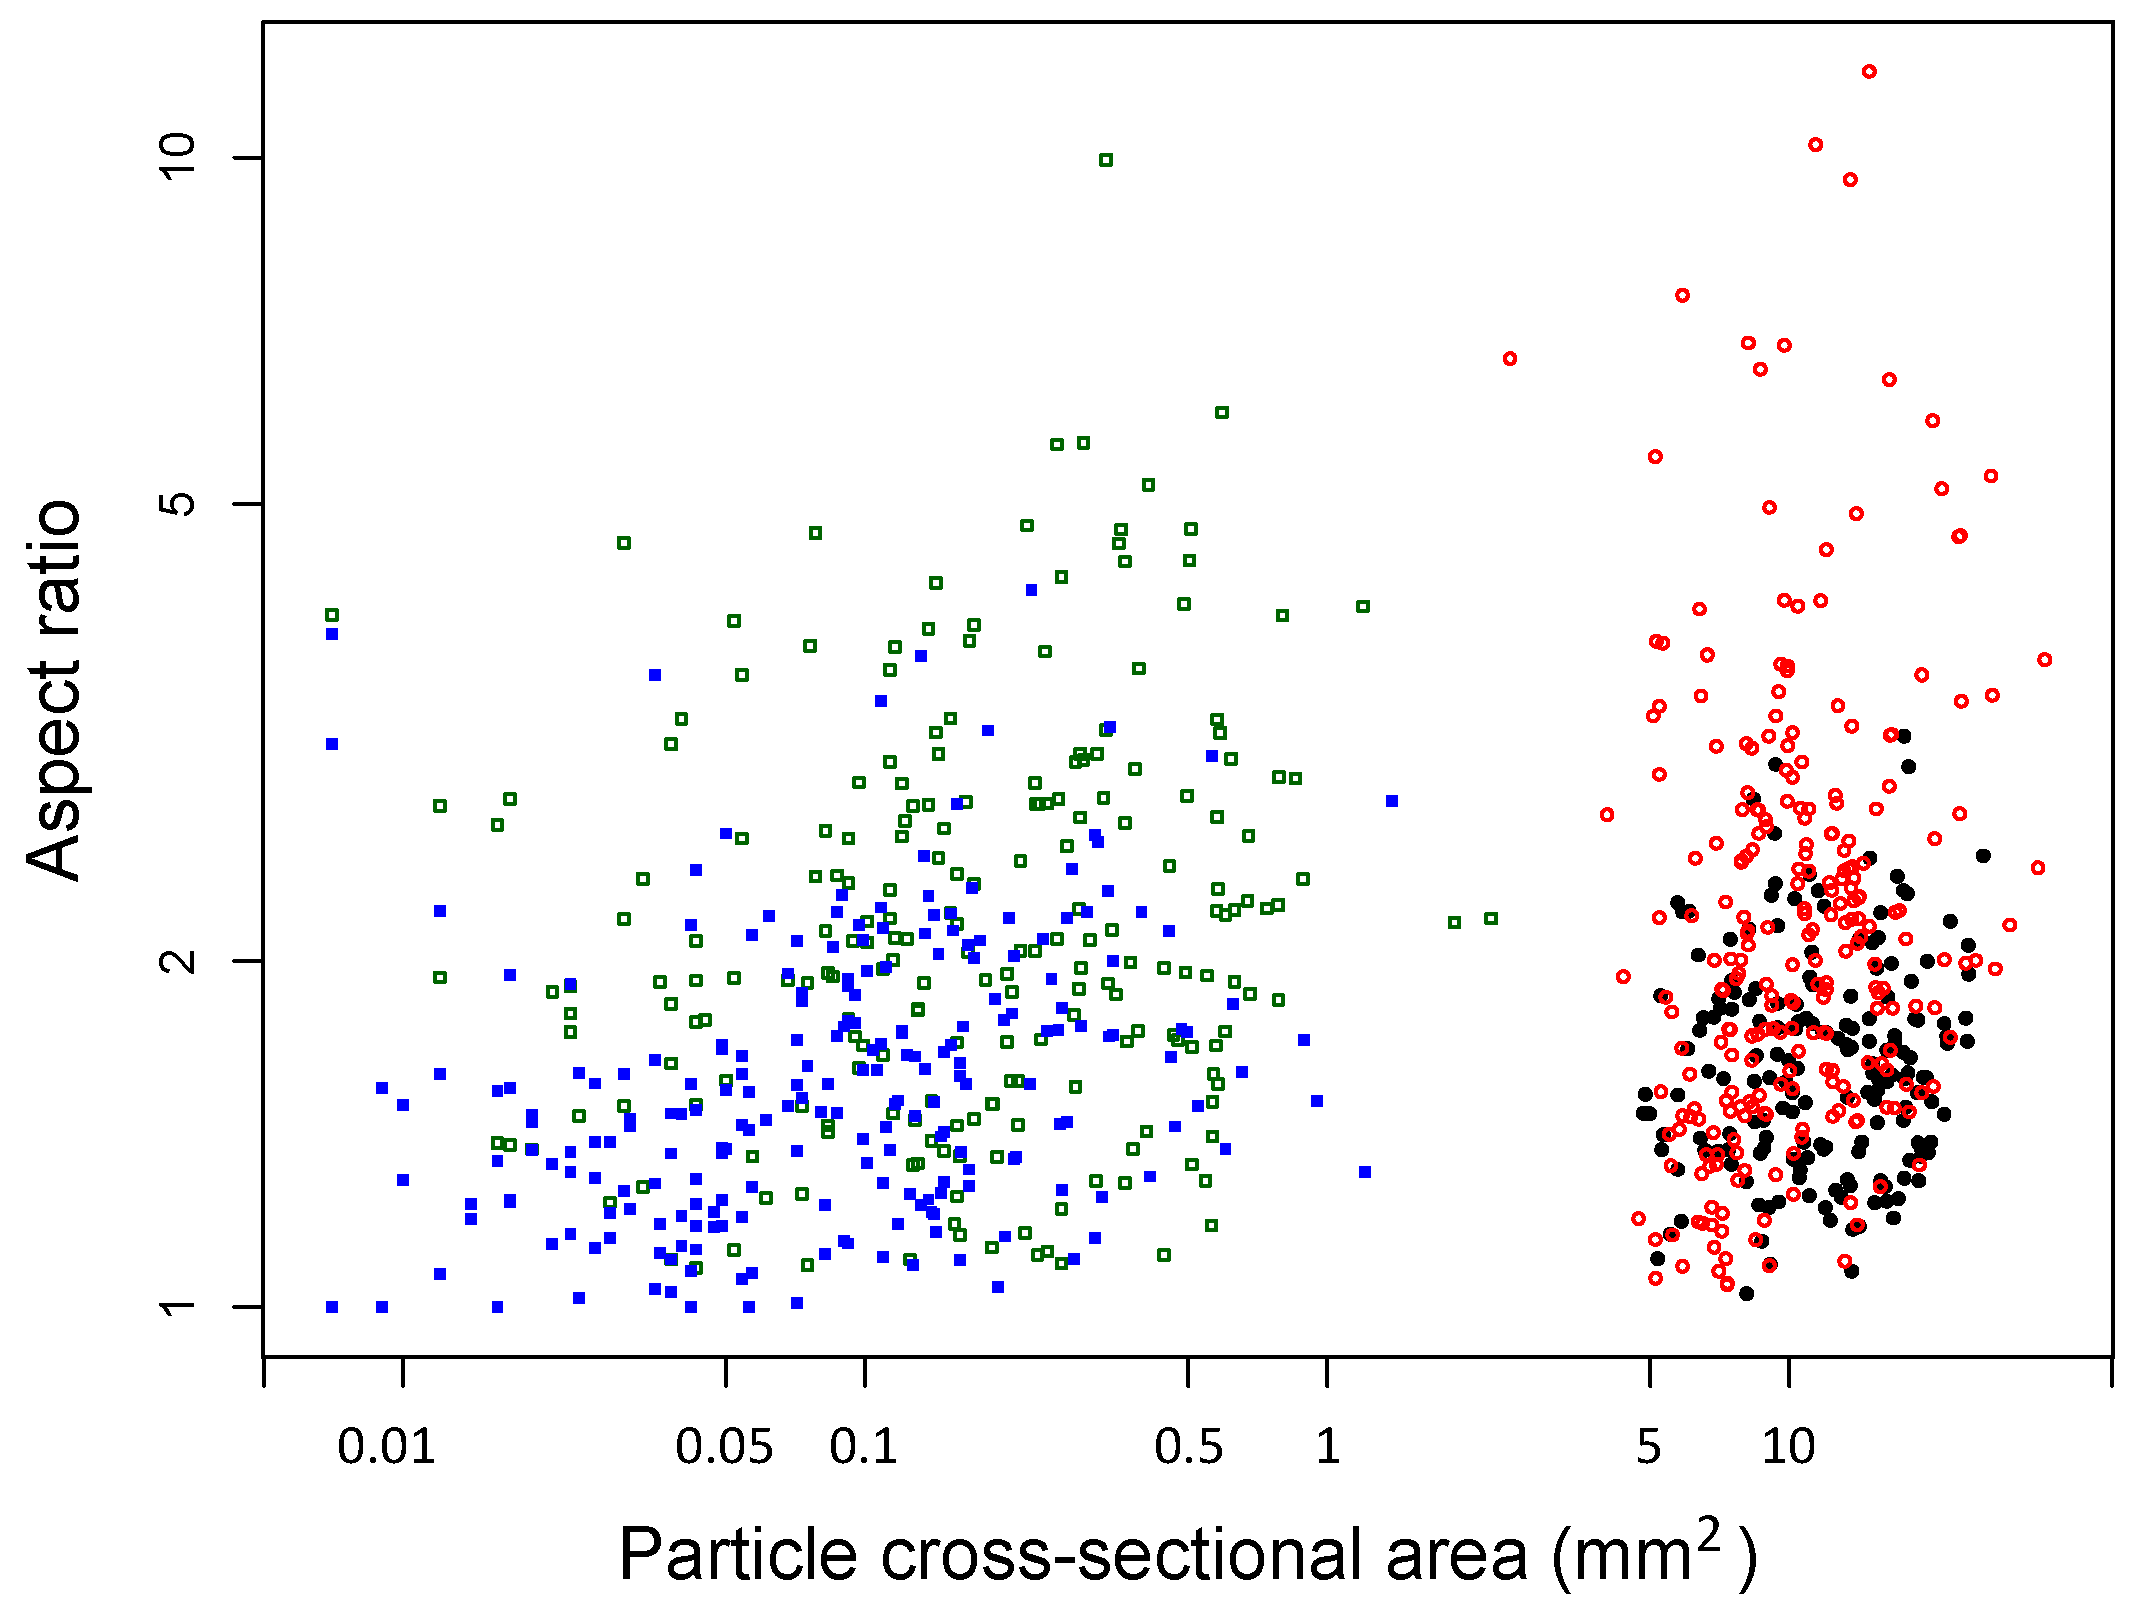
2.2. Characterization of Biochar Particle Size, Shape, Bulk Density, and Tap Density

The size distribution and shape of biochar particles was assessed by image analysis. Biochar samples were dispersed on 10 cm diameter or 5 cm diameter transparent petri dishes, and images were collected using a flatbed scanner (Epson Perfection 1250, Epson Co., Tokyo, Japan) with a resolution of 600 dpi or (for S-sieved and S-ground samples) a 10 mega-pixel digital camera affixed to a dissecting microscope (Amscope MU1000, www.amscope.com, Irvine, CA, USA). Particle size and shape were analyzed using the image analysis software ImageJ (imagej.net). The particle cross-sectional area for each dispersed particle was then examined in ImageJ. For particle shape, each particle was enclosed by a fitted ellipse in ImageJ, and an aspect ratio was estimated as the ratio of the major axis to minor axis length for each particle.
Biochar bulk density and tap density were determined using an analytical balance and a graduated cylinder. The biochar volume for bulk density was detected by measuring uncompacted volume of the particles, while the biochar volume for tap density was examined by measuring tap-induced compacted volume of the particles, with physical perturbation continuing until a constant volume was measured. Bulk density was calculated as M1/V1 and tap density as M1/V2, where M1 is the mass of the biochars, V1 is the volume of uncompacted biochars, and V2 is the volume of compacted biochars.

2.3. Biochar pH, Electrical Conductivity, Ash Content, and Water Retention Capacity

pH and electrical conductivity (EC) of pure biochars were determined in a 1:20 (w/v) mixture of biochar to de-ionized water [11], with the biochar-water mixture shaken on an oscillating table at 60 RPM for 24 h prior to measurement. In addition, the pH and EC of biochar-soil mixtures were measured in 1:1 (v:v) biochar-soil mixtures with de-ionized water, with the biochar-soil mixture shaken on an oscillating table at 60 RPM for 24 h. All pH and EC measurements were made at 20 °C using a pH/mV/Temp system (IQ Scientific Instruments, USA) and conductivity meter (Hanna Instruments, Inc., USA), respectively. Biochar ash content was measured by combusting the biochars in a muffle furnace (ThermoFisher Scientific, USA) at 800 °C for 1 h after oven-drying the biochars. Triplicate measurements were conducted in each case.
WRC of biochar samples was measured as water retained at gravity-drained equilibrium. 100 mL stainless steel cylinders (depth: 6.7 cm, radius: 2.4 cm) were packed with sample biochars and placed on a 0.0635 mm sieve (Fisher Scientific Company, Hampton, NH, USA), and covered with parafilm (Bemis Company, Inc., Oshkosh, WI, USA). Volumes of 100 mL biochar and 100 mL de-ionized water were added into each column, and allowed to drain for 24 h. The moist biochar was collected with containers following drainage, weighed, and then dried for 48 h at 60 °C. WRC was calculated as (W2 − W3)/(W3 − W1), where W1 is the mass of the container, W2 is the mass of gravity-drained biochar plus container, and W3 is the dry mass of the biochar plus container.

2.4. Growth Conditions and Experimental Design

The experiment was conducted in a greenhouse at the University of Toronto, examining responses of the annual forb velvetleaf (Abutilon theophrasti Medik.) and the annual ryegrass (Lolium multiflorum Lam.). Seeds were obtained from V&J Seed Farm, Woodstock, Illinois, USA. The soil used to grow the seeds was a naturally occurring pure granitic sand (pH = 5.82) from Haliburton Forest and Wildlife Reserve, Haliburton, Ontario, Canada. The sand was sieved by passing through a 2 mm mesh. (Although the sand used is essentially unmodified parent material, we refer to the pure sand and sand-biochar mixtures as a “soil” hereafter). There were two treatment factors in this experiment: one was the biochar particle size (2–4 mm and 0.0635–0.5 mm); the other was processing method (sieving and sieving after grinding). The experiments were conducted sequentially; average temperatures were 15.8 °C (range: 5.9–34.6 °C) during the annual ryegrass experiment and 26.6 °C (range: 14.5–38.1 °C) during the velvetleaf experiment.
The growth containers used had a surface area of 50.3 cm2, depth of 8 cm, and volume of 402 cm3. Two grade 415 filter paper sheets (VWR International, Radnor, PA, USA) and one layer of fiberglass mesh were placed at the bottom of each growth container to prevent loss of sand and biochar. Approximately 350 cm3 of biochar-sand mixture or pure sand was added to each replicate pot. For treatments, the dosage for biochar application to each pot was 20 t/ha (10.05 g/pot), calculated on a pot surface area basis. The biochar was evenly mixed with the sand in the top 5 cm of each growth container (similar to Basso et al., 2013 [25]). One seedling was transplanted into each growth container after an 8-day germination period in vermiculite. Fertilizer (nutricote 16-10-10 NPK, JCAM AGRI, Tokyo, Japan) was added to the surface of the soils for velvetleaf to compensate for the high N demands of this species [30]. The amount of fertilizer added, which was calculated based on surface areas of each pot, matched 25 kg/ha to approximate a typical nitrogen mineralization rate in one growing season [12].
Plant performance measures made included leaf area, aboveground, and belowground biomass, chlorophyll fluorescence (Fv/Fm: the ratio of variable to maximum fluorescence yield estimating the potential quantum efficiency of photosystem II), chlorophyll concentration index (CCI), and the nitrogen (N) concentration of aboveground tissues. Leaf area was tracked weekly, while CCI, Fv/Fm, nitrogen level in aboveground biomass, and biomass were measured at the end of the experiment. The measurements of CCI and Fv/Fm were only conducted on velvetleaf, because the leaves of annual ryegrass were too small to be measured. CCI was measured using CCM-200 Chlorophyll Meter (ENVCO, Auckland, New Zealand) and Fv/Fm measurements were made with a MINI-PAM fluorometer (Heinz Walz GmbH, Effeltrich, Germany), using the saturated pulse method [31]. Aboveground and belowground biomass was separated by cutting the stems at the top of the soil; roots were washed, and biomass components were dried in a convection oven for 48 h at 60°C prior to weighing on an analytical balance to the nearest mg. N levels in aboveground biomass following grinding of tissues using a 628 Series CN Analyzer (LECO, St. Joseph, MI, USA). The leaf area of annual ryegrass and velvetleaf were measured using Li-3100C leaf area scanner with a resolution of 1 mm2 (LiCor Biosciences, Lincoln, NE, USA). Plant leaf area was also tracked weekly by recording leaf length to the nearest 0.5 cm and estimating leaf areas using non-linear regression models. The non-linear models used were based on prior publications: for velvetleaf A = 0.613L 2.204 [32], and for annual ryegrass A = 0.0008491L 1.692 [33], where A is leaf area in cm2 and L is leaf length in cm.
The experimental growth period was 29 days (from 7 March 2018 to 5 April 2018) for annual ryegrass and 28 days (from 26 June 2018 to 24 July 2018) for velvetleaf. Annual ryegrass was watered with 50 mL of water once per two or three days during the experiment; velvetleaf was watered by 50 mL of water every day during the first week and thereafter every other day until the end of the experiment. A total of 70 pots of plants were used in the experiment: 1 feedstock × 2 species × 7 replicates × (4 treatments + 1 control group) = 70 pots.

2.5. Statistical Analysis
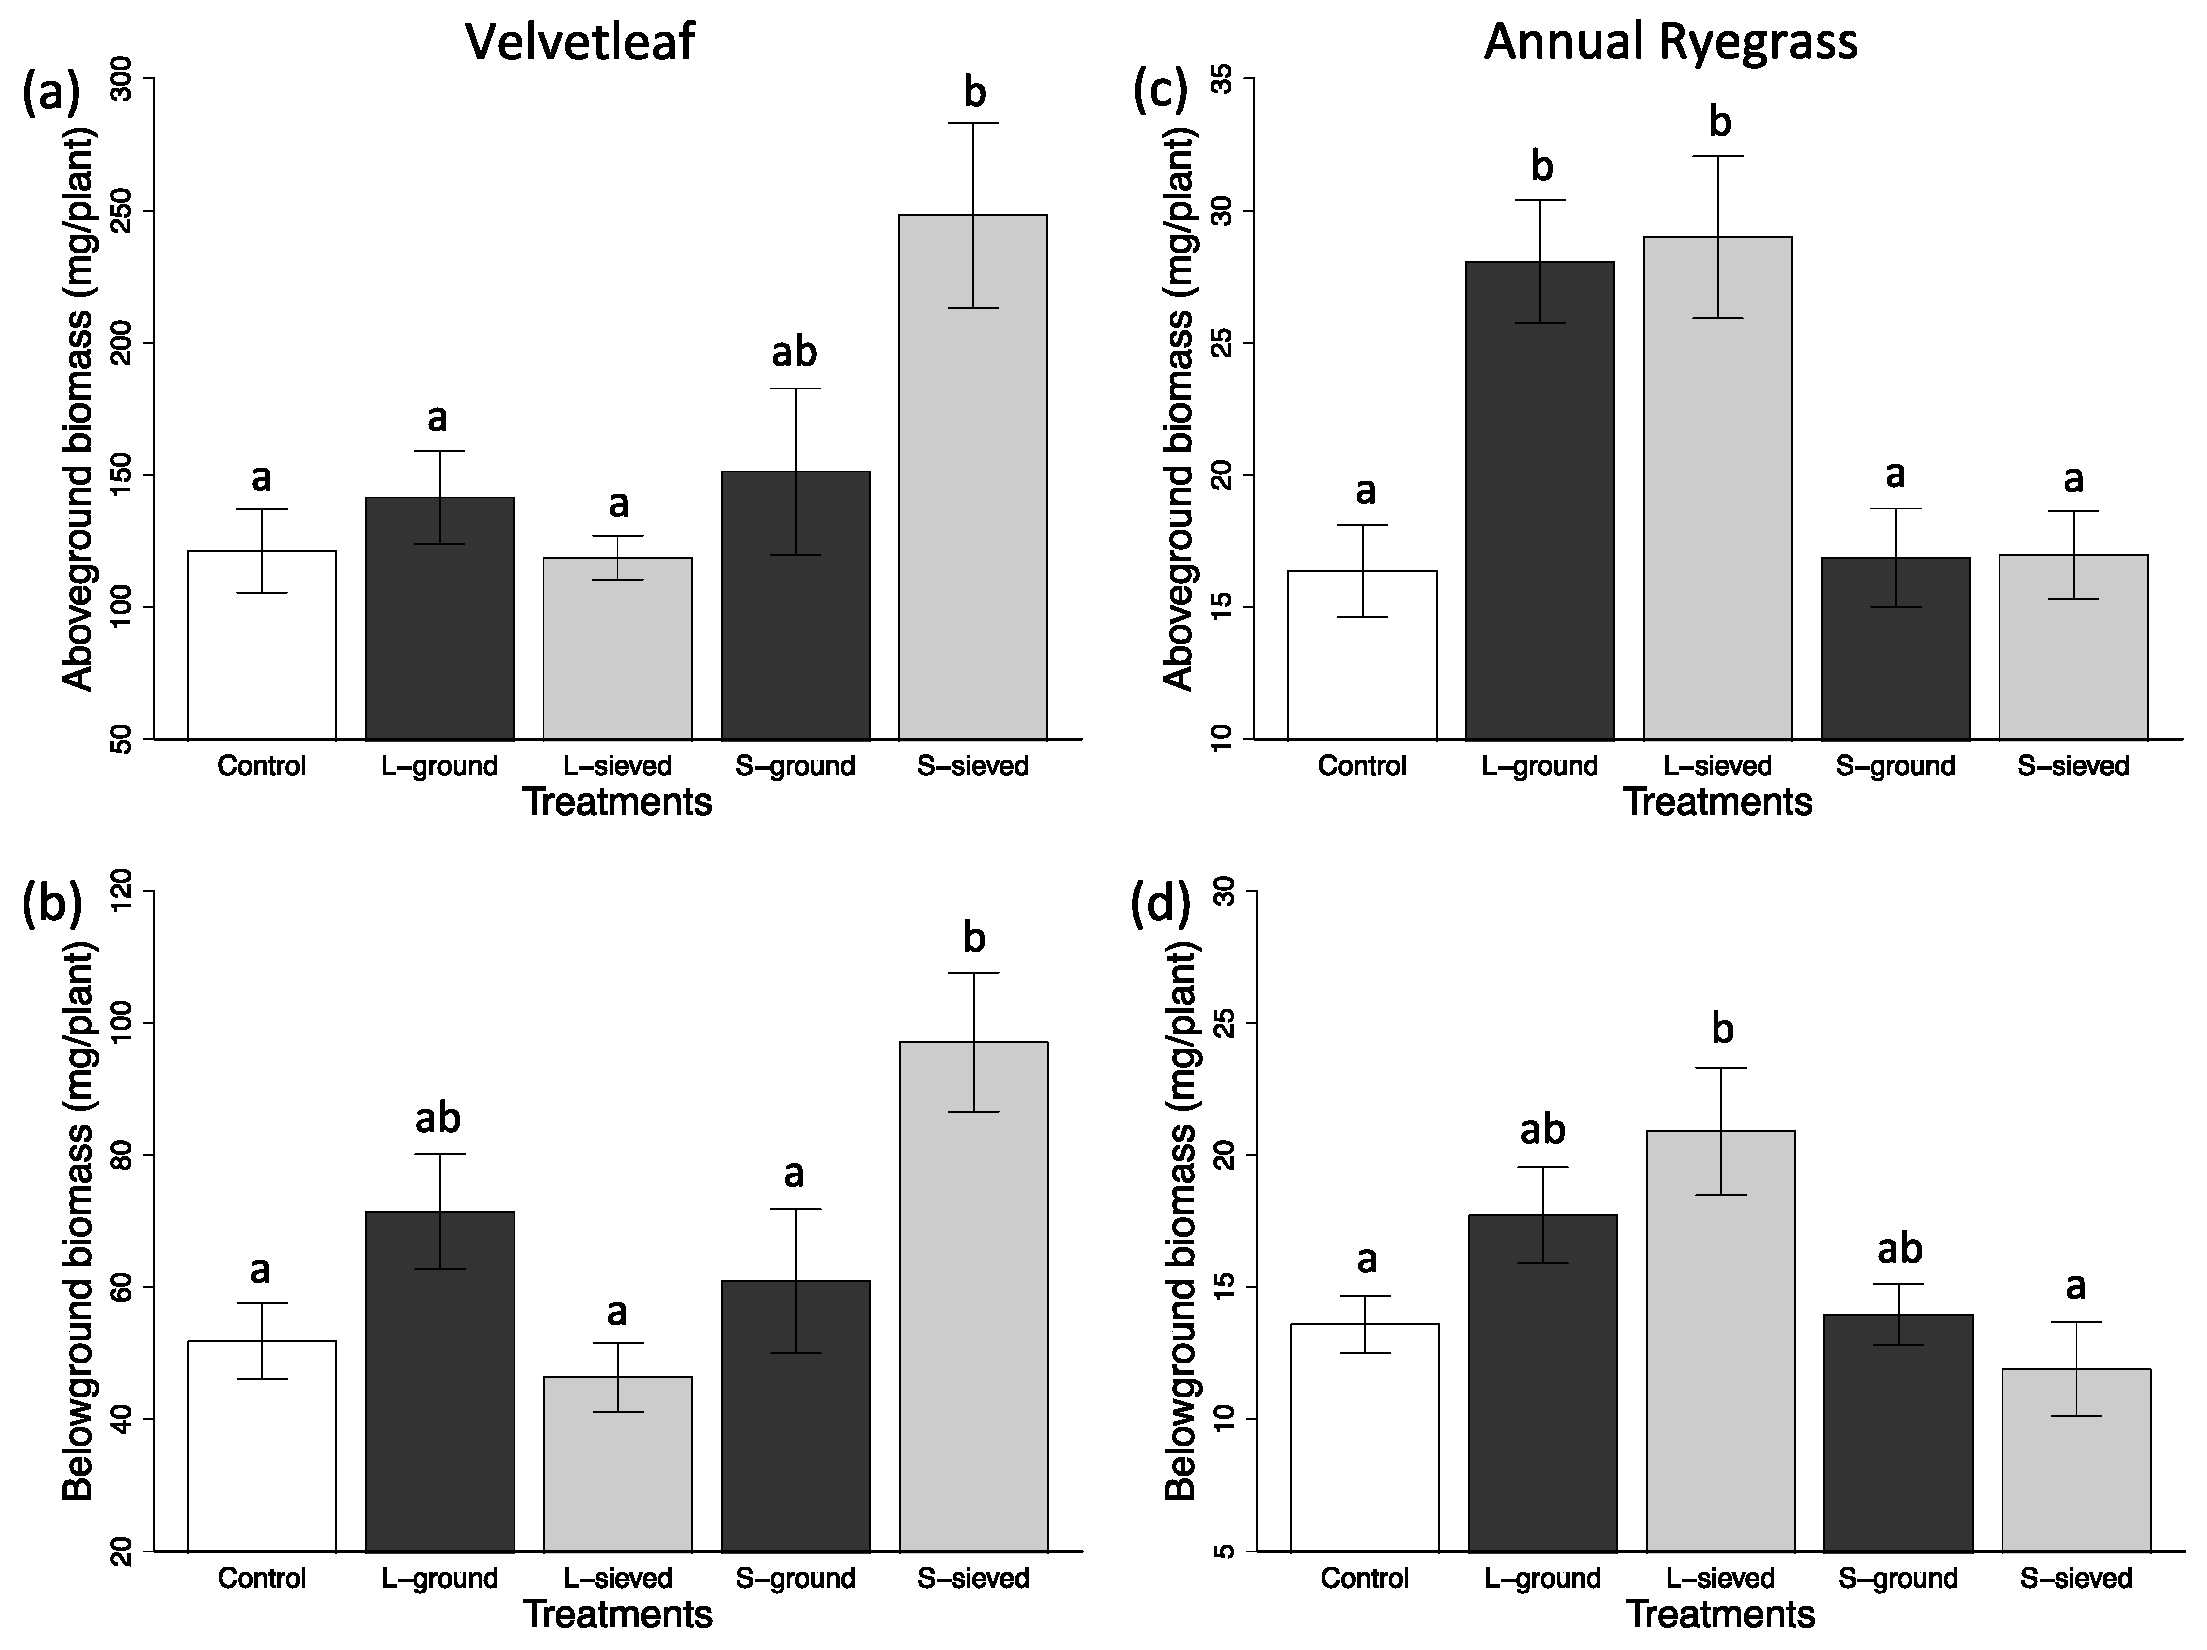
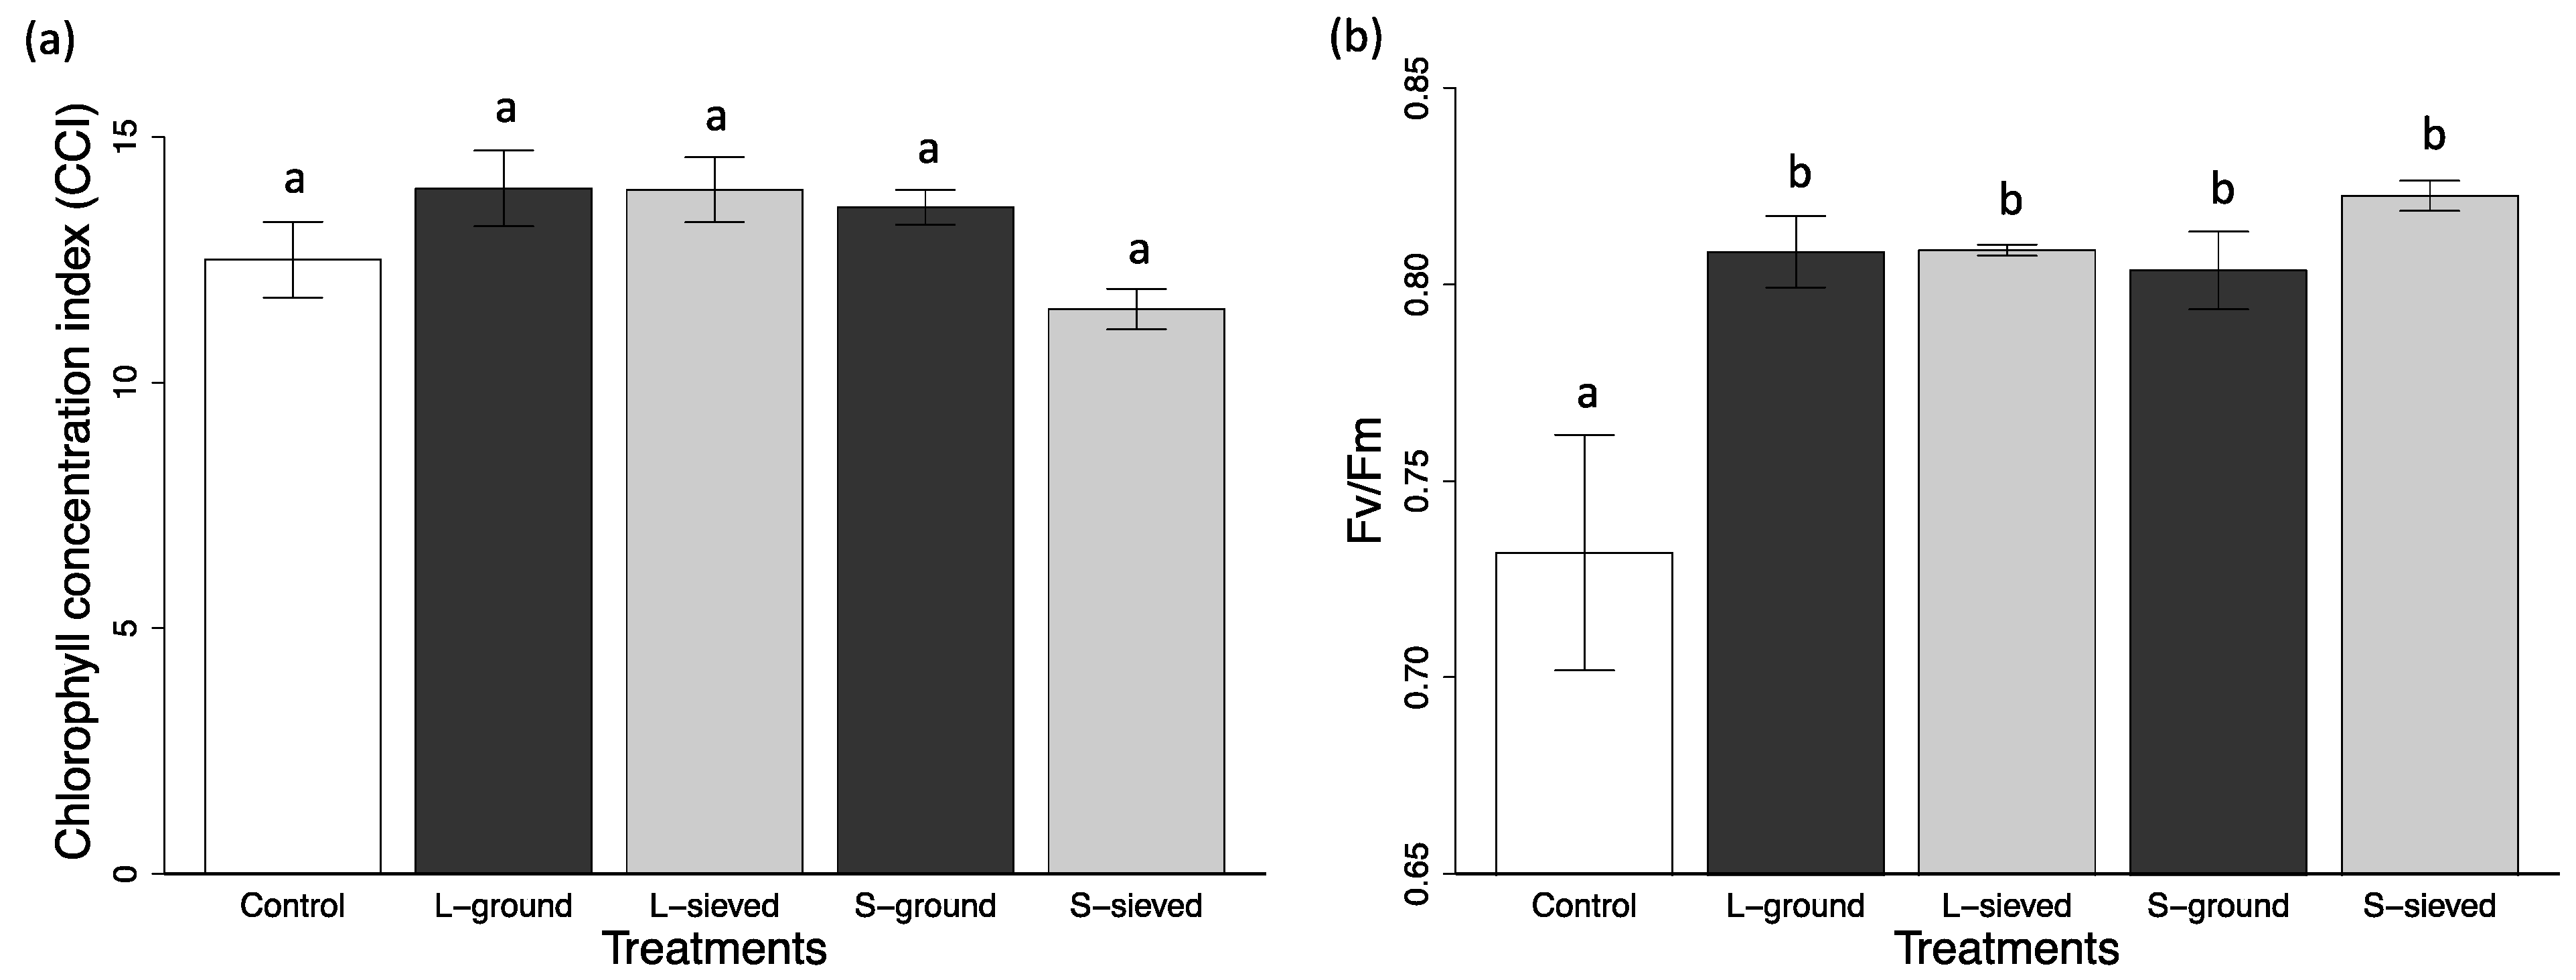
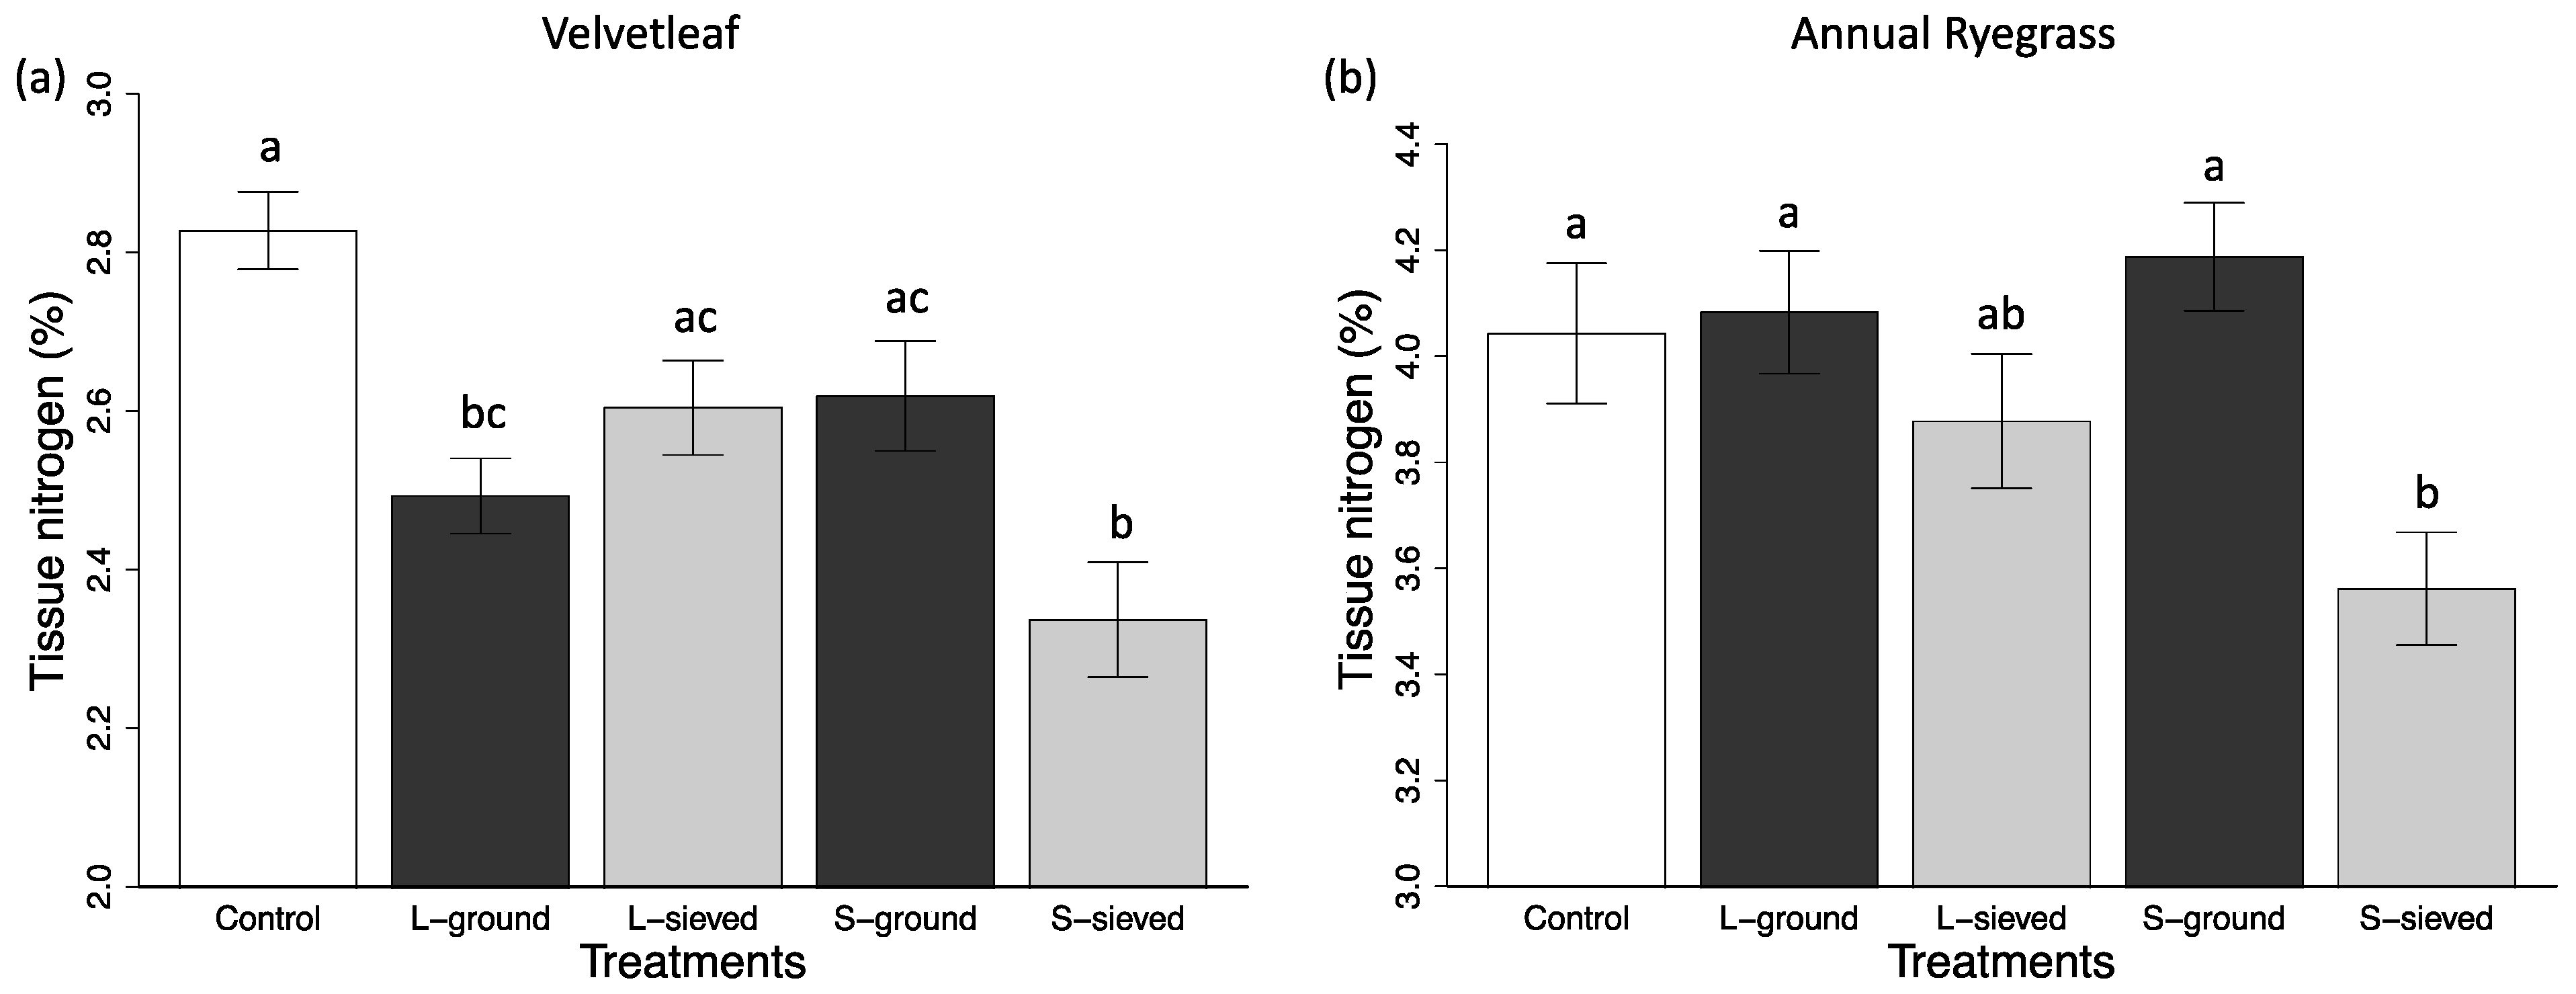
Plant performance measures and biochar/soil properties were analyzed by one-way analysis of variance (ANOVA), following graphical analyses to confirm normality and equality of variances. Tukey’s honest significant difference (HSD) test was performed to describe differences of pairwise treatments (using p < 0.05). All data analyses were conducted using the statistics software R version 3.3.3 (R Core Team 2017).

3. Results

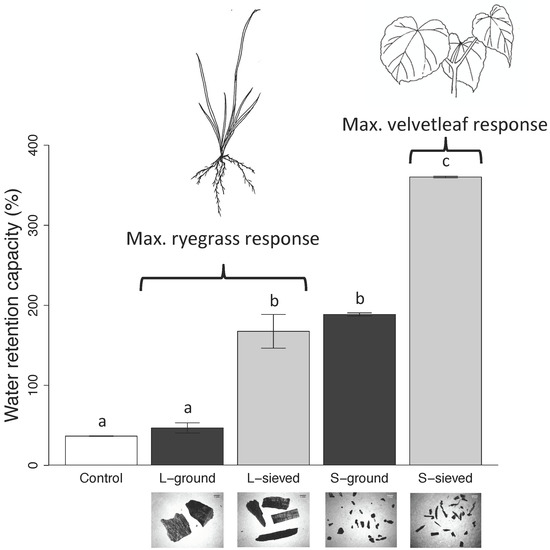
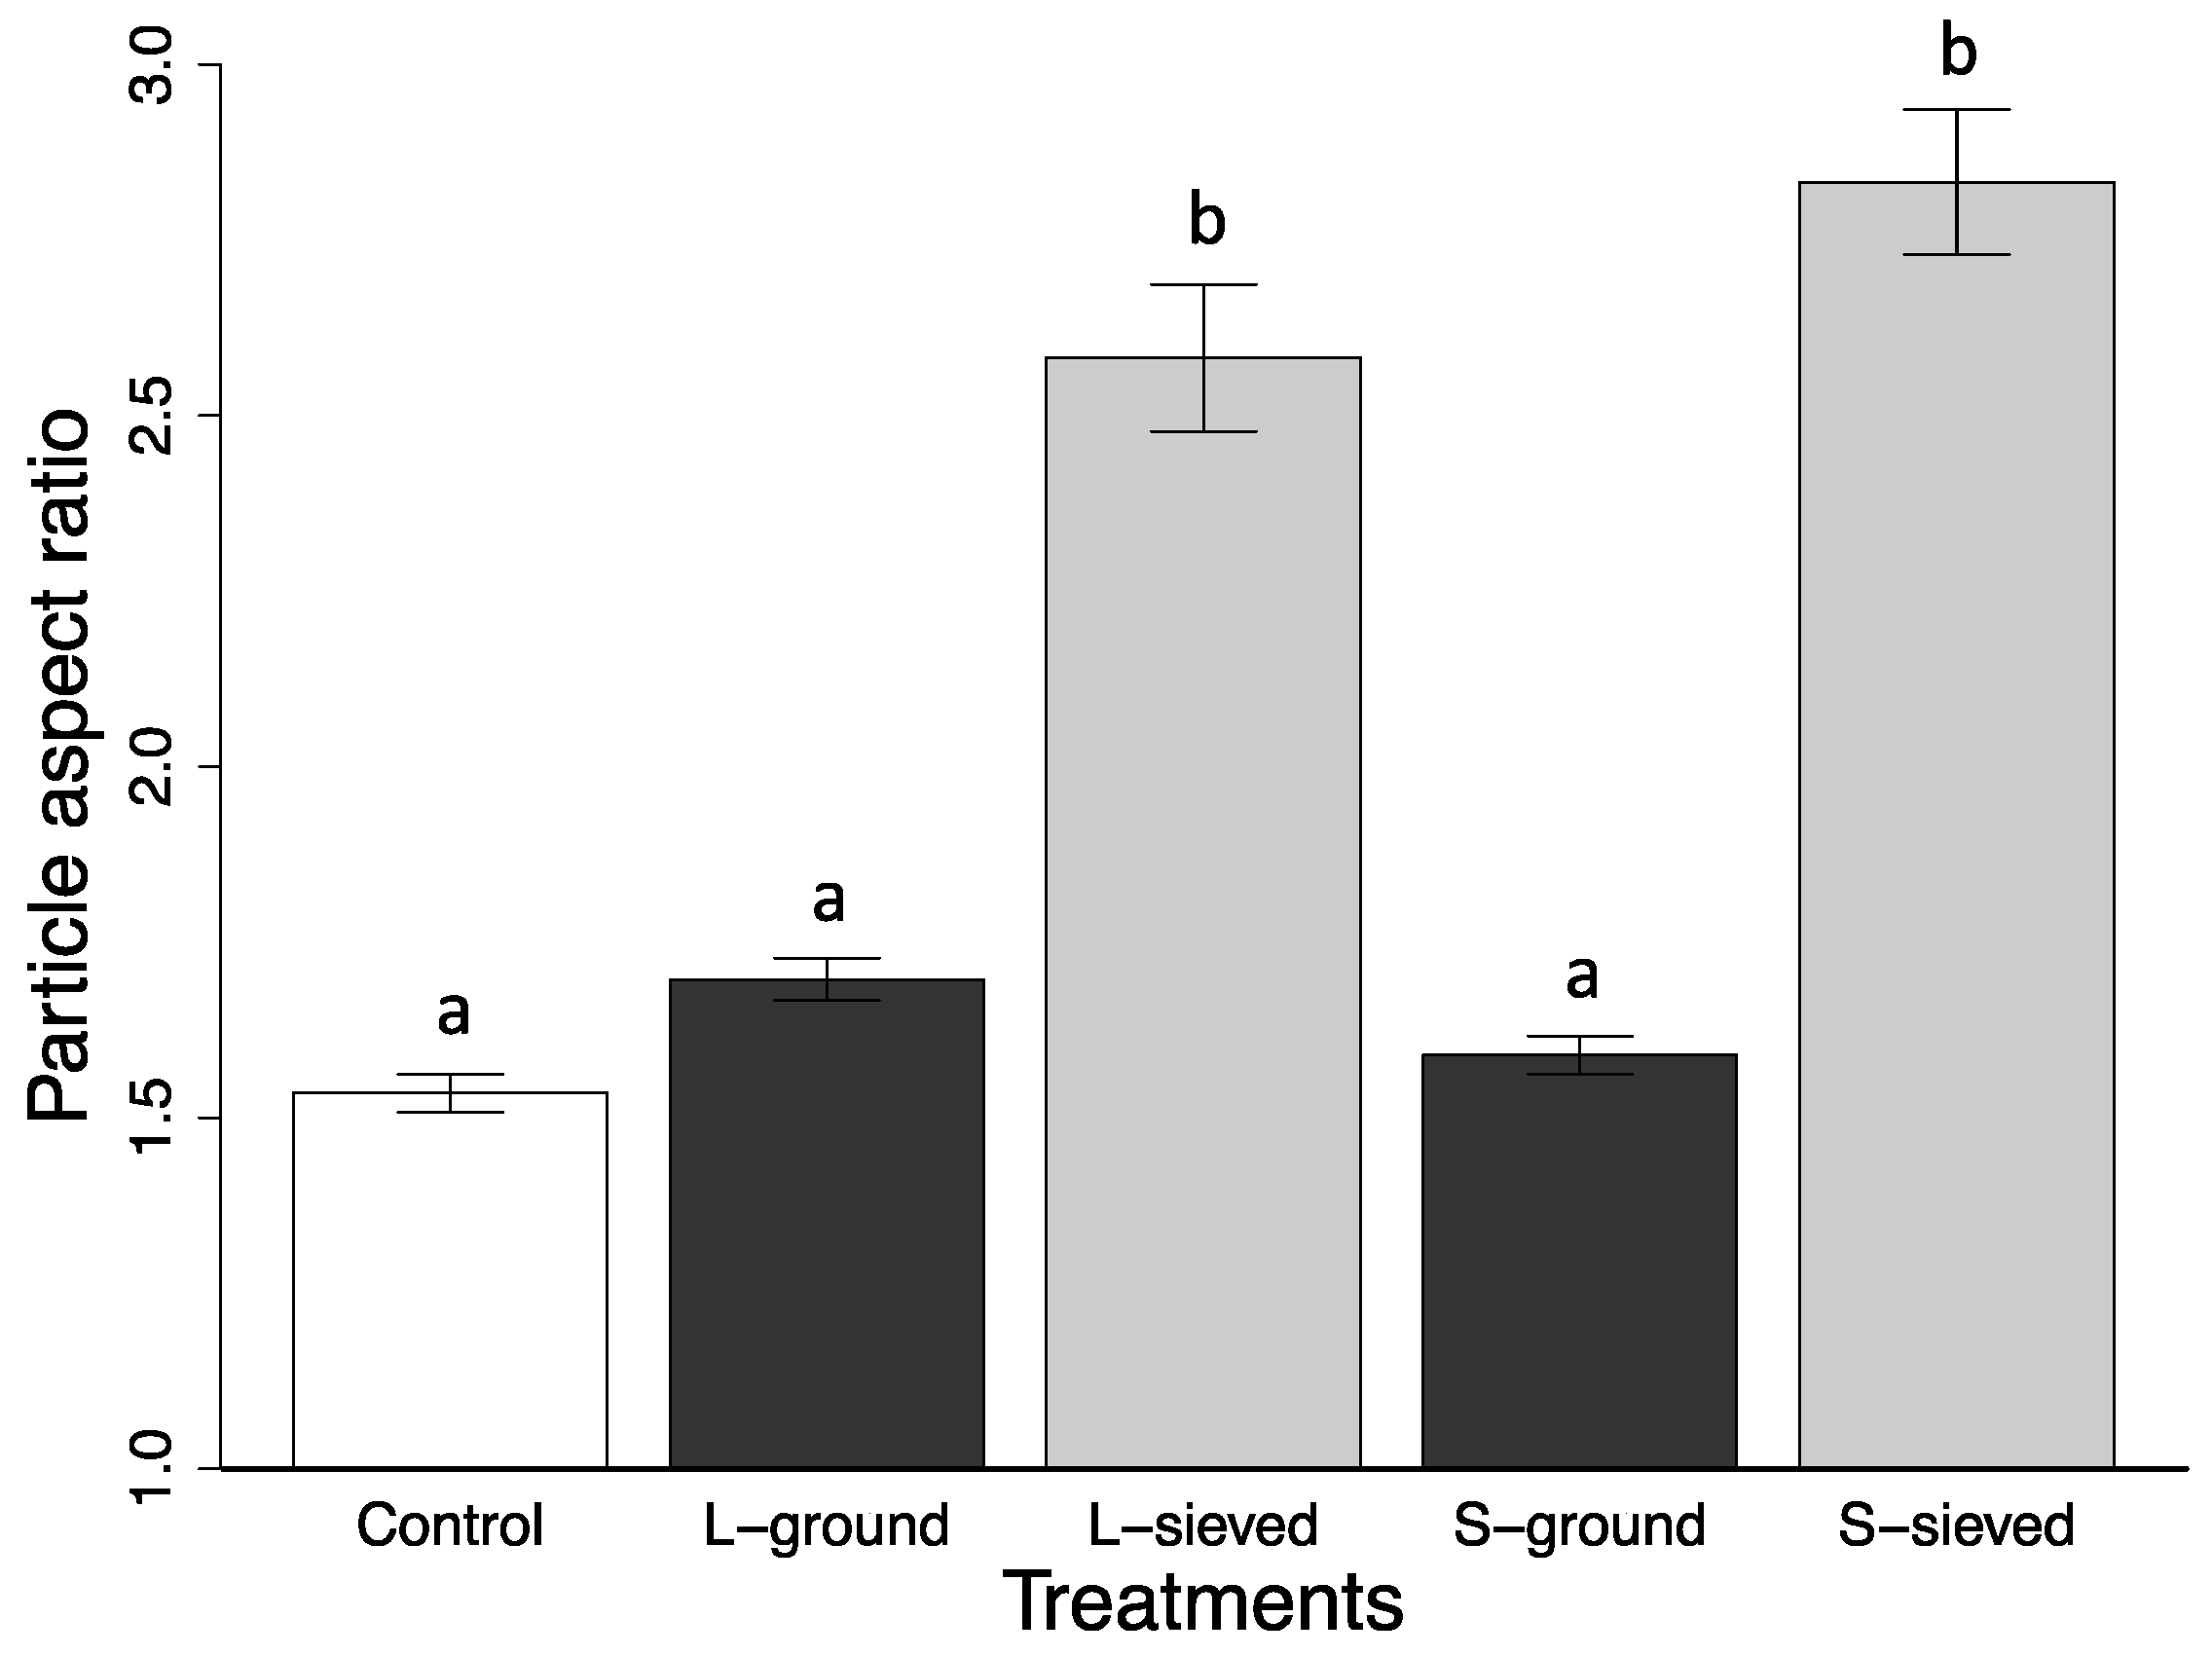
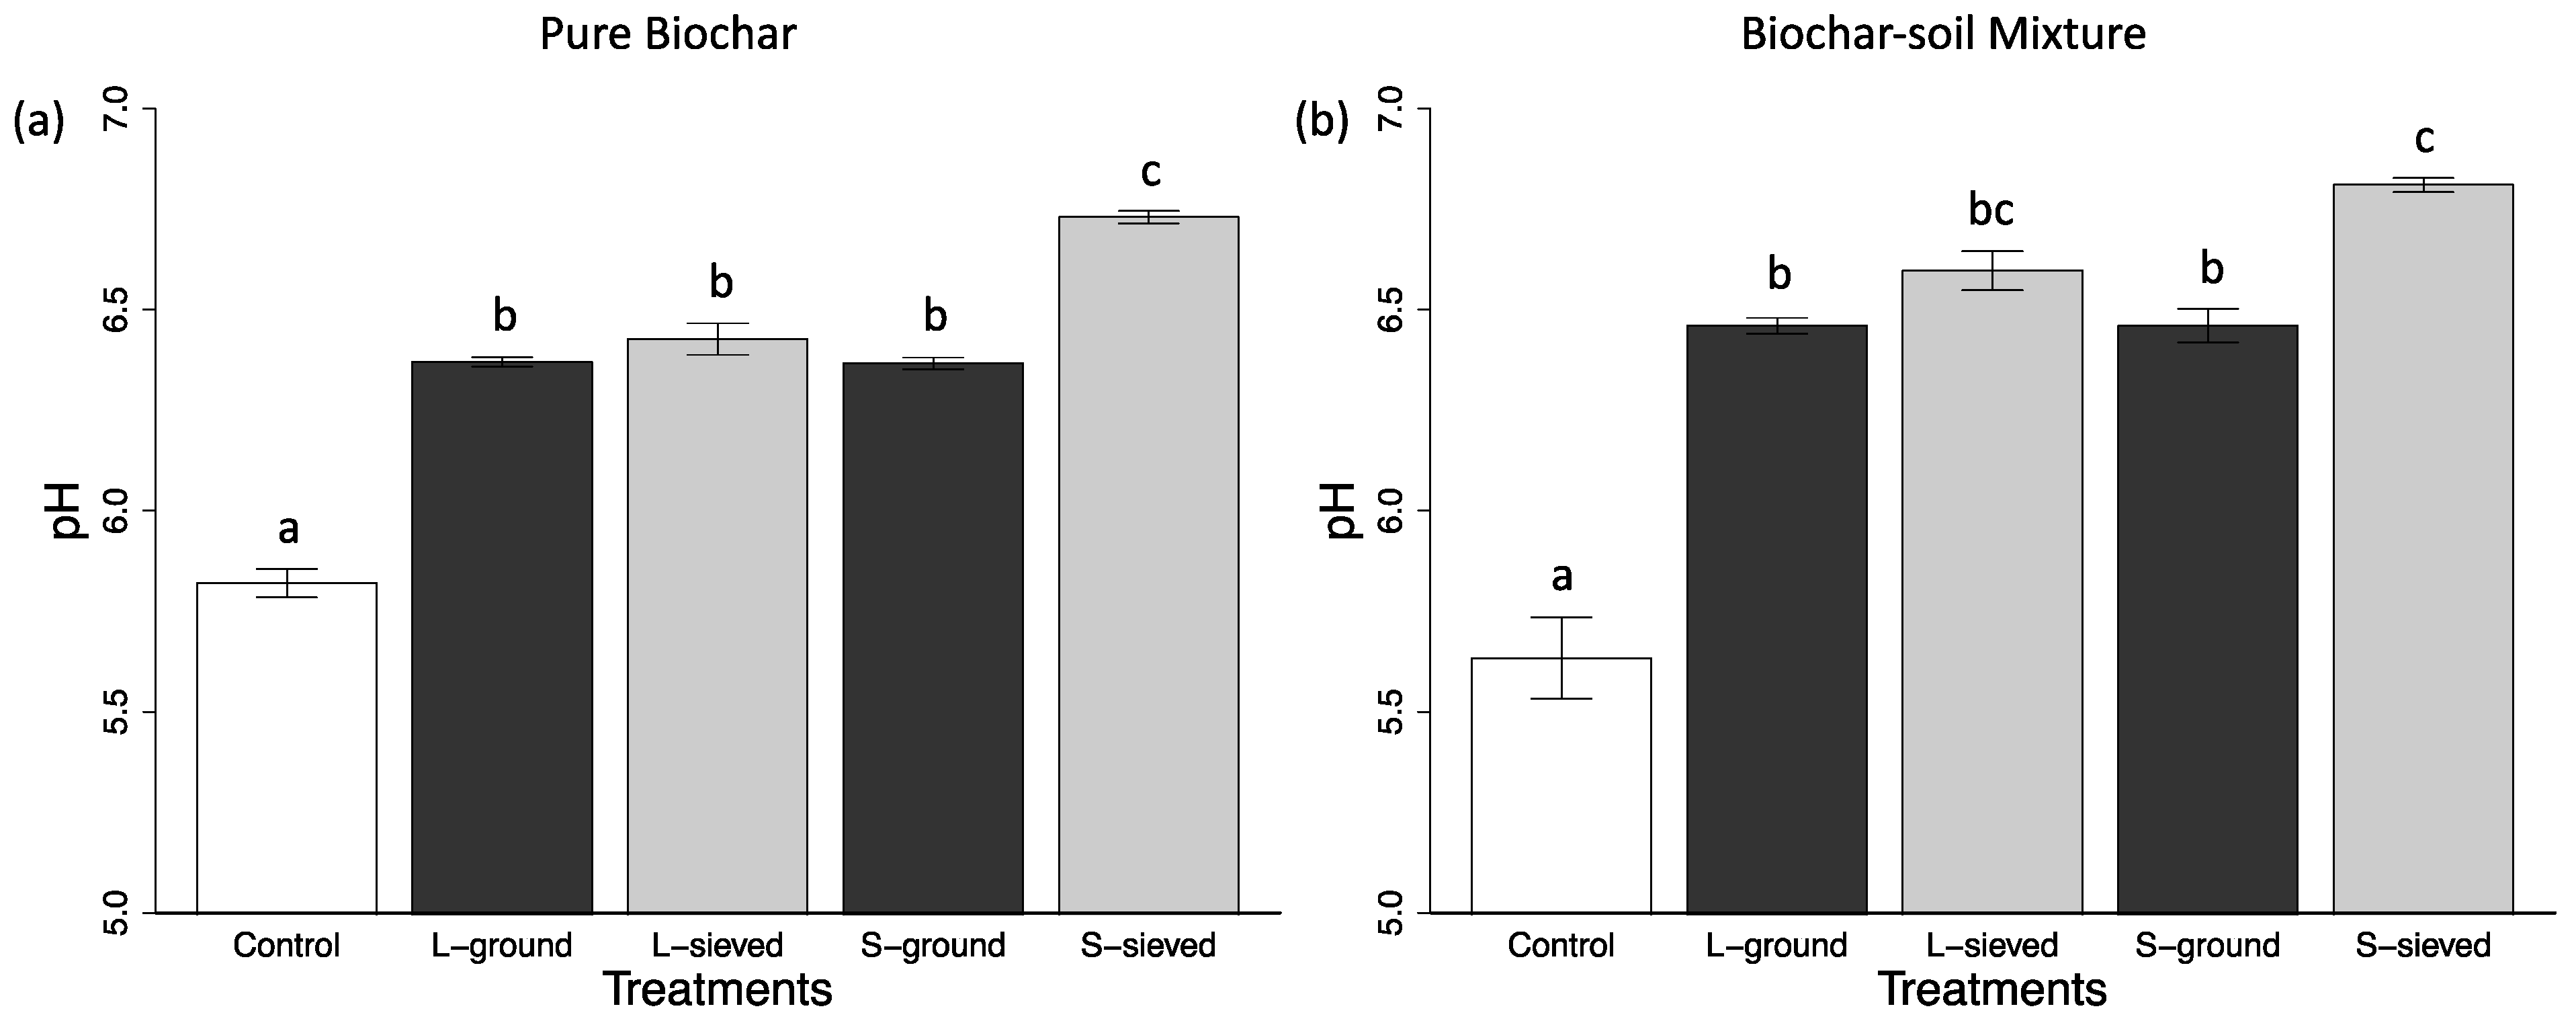
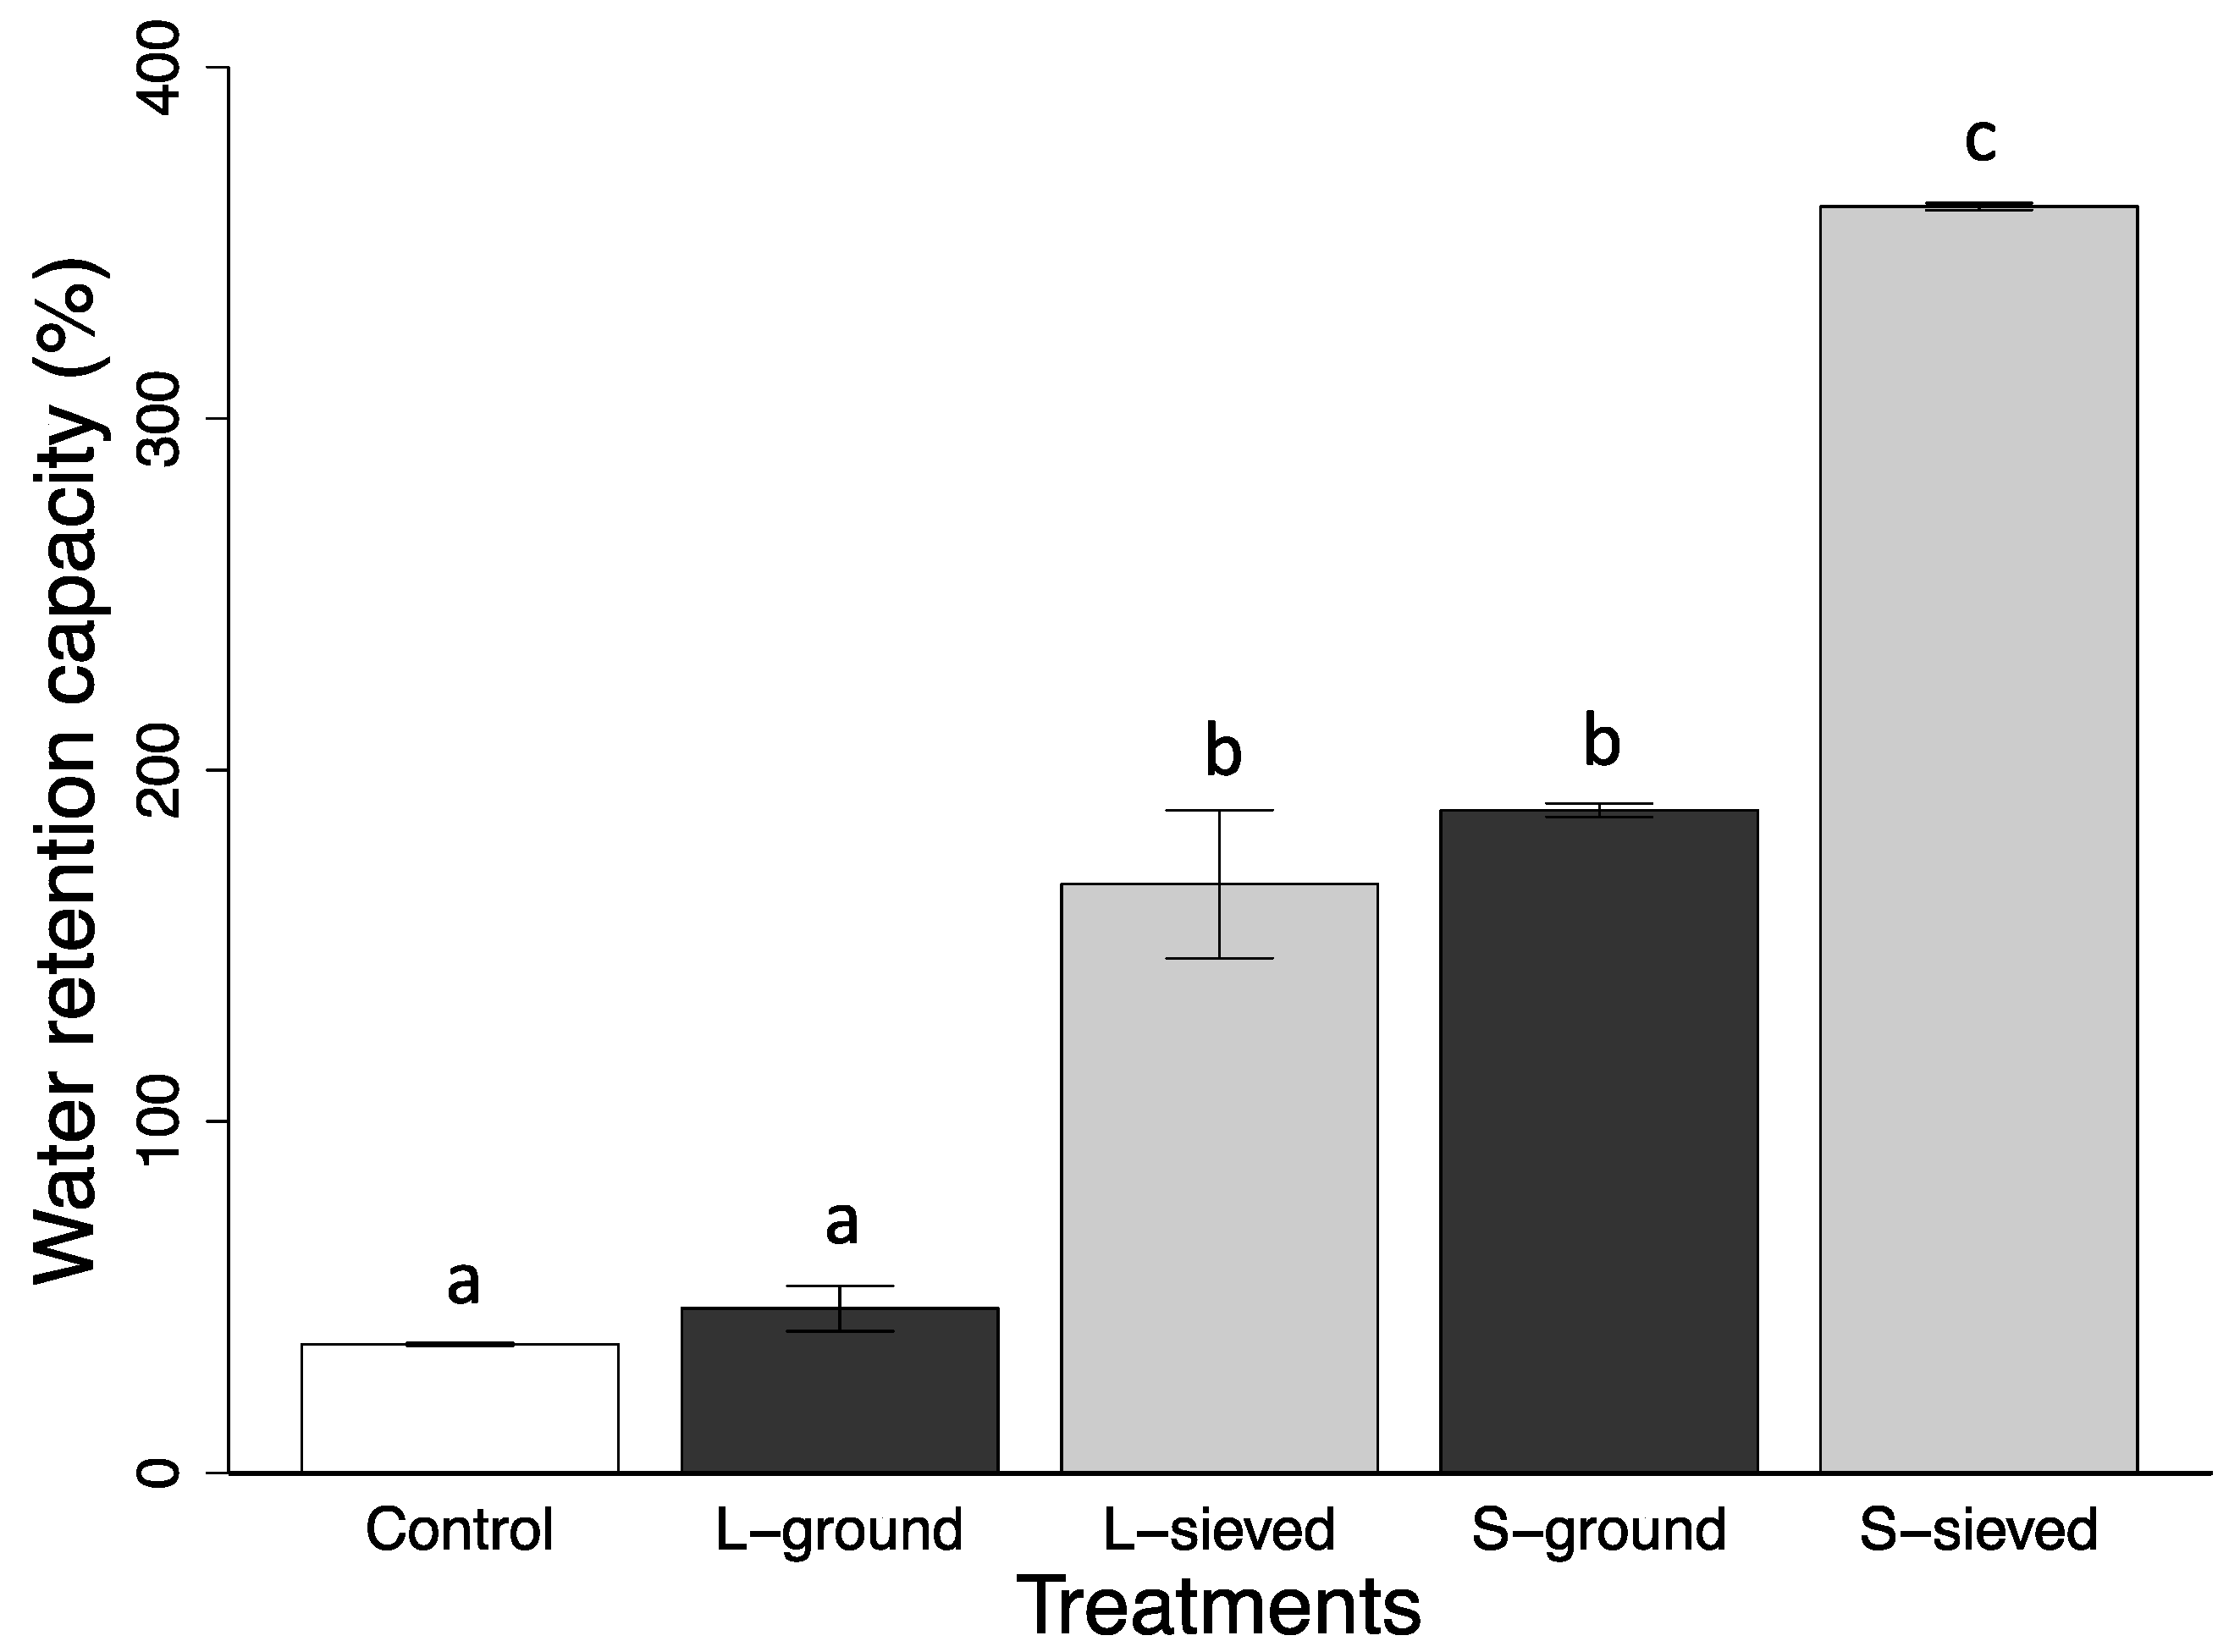
3.1. Properties, pH, and Water Retention Capacity of Biochar and Sand

Biochar particle aspect ratio was weakly positively correlated to particle size (measured as particle cross-sectional area), based on image analysis results (Figure 2). This correlation was significant for the pooled data (r = 0.151; p < 0.001), and the S-ground (r = 0.392; p < 0.001) and L-sieved (r = 0.176; p = 0.005) treatments, but only marginally so for the S-sieved (r = 0.109; p = 0.107) and L-ground (r = 0.113; p = 0.080) treatments.
Properties of the biochars differed according to post-production treatment. Biochars manipulated by direct sieving had a significantly higher aspect ratio (p < 0.05) than those obtained by sieving following grinding (Figure 3). The mean aspect ratios of L-sieved and S-sieved were higher than those of L-ground and S-ground by 52% and 78%, respectively. However, no significant differences were in aspect ratios of L-sieved vs. S-sieved biochars, or L-ground vs. S-ground biochars; both ground biochars showed similar aspect ratios to sand particles. In sum, sieved biochars were on average more elongate in shape, while ground biochars and sand were more spherical in shape (Table 1; Figure 3).
With respect to pH of pure biochars, S-sieved biochar had significantly higher (p < 0.05) pH than all the other pure biochars (Figure 4a and Table 1). However, there were no significant differences among the pH of L-ground, S-ground, and L-sieved treatments (p > 0.05), though all biochars showed higher pH values than did the control. pH of biochar-soil mixtures showed similar trends to pure biochar samples (Figure 4b). Soil mixtures with S-sieved biochar had significantly higher (p < 0.05) pH than soil mixtures with S-ground and L-ground biochars. Nevertheless, no significant differences were found among the pH values of L-ground, S-ground, or L-sieved biochar-soil mixture, while all biochar-amended substrates had higher pH values than the control.
WRC differed substantially among treatments. The WRC of smaller-sized biochar particles was significantly higher (p < 0.05) than that of larger-sized biochar particles when post-processing methods were the same (Figure 5). The WRC of S-sieved biochar was significantly higher (p < 0.05) than that of all other-sized biochars and sand (Table 1). Biochars collected by direct sieving had significantly higher (p < 0.05) WRC than those obtained by grinding and sieving at a given particle size. The WRC of S-sieved biochar was higher than that of S-ground biochar by 91%, while the WRC of L-sieved biochar were higher than that of L-ground biochar by 258%. The WRC of L-ground biochar and sand was statistically indistinguishable (p > 0.05).

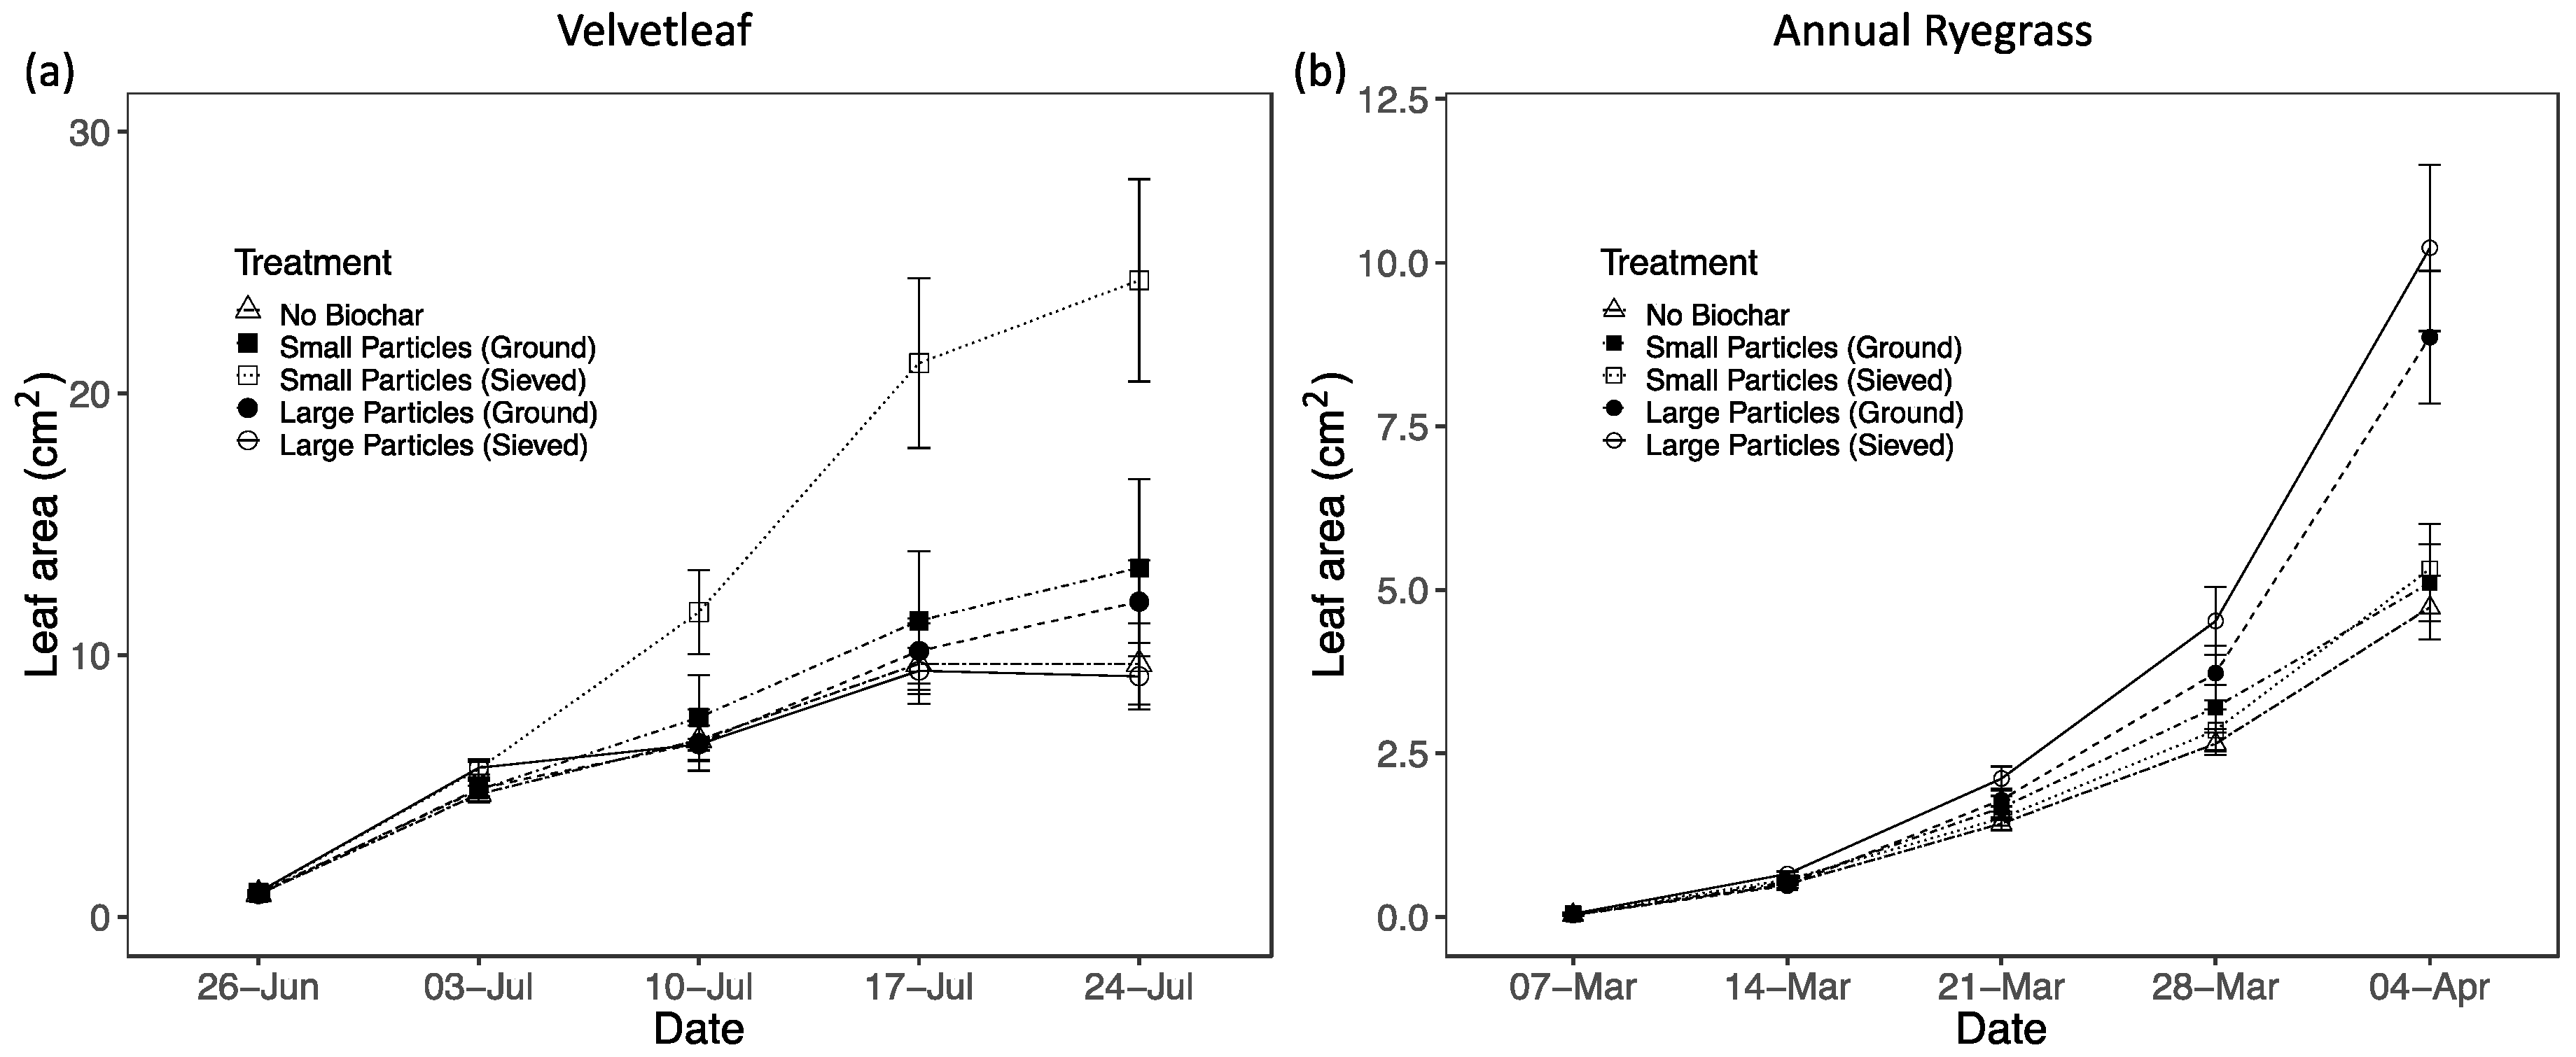
3.2. Plant Performance in Different Biochar Treatments and Sand

3.2.1. Particle Size Effects

Velvetleaf and annual ryegrass showed opposite responses to biochars of differing particle size (Table 2). For velvetleaf, smaller-sized biochars resulted in stronger positive effects on plant performance relative to larger-sized biochars or pure sand. Velvetleaf grown in soils with S-sieved biochar had significantly higher leaf areas (p < 0.05) than those in soils with other biochars or in pure sand (Figure 6a). At the end of the experiment, the average leaf area of velvetleaf with S-sieved biochar addition was 164%, 82%, and 102% higher than the leaf area of velvetleaf grown with the addition of L-sieved, S-ground, and L-ground biochar, respectively, and 152% higher than the leaf area of control group. No significant differences were observed between other biochar treatments and pure sand in terms of leaf area.
Velvetleaf grown with smaller-sized biochar addition also showed greater biomass production compared to other treatments (Figure 7a). The aboveground biomass of velvetleaf with S-sieved biochar addition was 109%, 75%, and 105% higher than with L-sieved or L-ground biochar, while no significant differences (p > 0.05) were found in aboveground biomass of velvetleaf among S-ground, L-sieved, and L-ground biochar addition, or pure sand. Similarly, the belowground biomass of velvetleaf with S-sieved biochar addition was 87%–110% higher than the L-sieved and S-ground biochar pure sand controls (Figure 7b). However, no significant differences were observed in belowground biomass of velvetleaf among S-ground, L-sieved, and L-ground biochar additions, or the pure sand control treatment.
Biochar addition significantly enhanced the Fv/Fm of velvetleaf (p < 0.05), compared to the control (Figure 8b). Fv/Fm of velvetleaf with S-sieved, S-ground, L-sieved, and L-ground biochar addition was 12%, 10%, 11%, and 11% higher than that grown in pure sand, respectively. However, no significant treatment effects were found for CCI (Figure 8a). In addition, no significant trends in N concentration of aboveground biomass were found according to biochar particle size, although quantitatively N concentrations were marginally higher in the control (Figure 9a).
Annual ryegrass had stronger positive growth responses to biochars with larger sized particles compared to smaller-sized biochars or pure sand controls. Larger biochar particle addition resulted significantly larger leaf area (p < 0.05) compared to smaller biochar particles or pure sand (Figure 6b). The leaf areas of annual ryegrass grown in the soils with L-sieved and L-ground biochars were almost twice that of plants grown in soils with S-sieved biochar, S-ground biochar, or pure sand. However, the leaf areas of annual ryegrass with smaller-sized biochar addition did not show significant differences from the pure sand controls. Similarly, larger-sized biochar particles showed stronger positive effects in terms of biomass responses in annual ryegrass (Figure 7c,d). Aboveground biomass of annual ryegrass grown in soils with L-sieved and L-ground treatments was 71%–77% higher than the control, while no detectable response was seen with the S-sieved and S-ground treatments. Similar patterns were observed for belowground biomass of annual ryegrass (Figure 7d). No significant treatment effects on tissue N concentration were observed (Figure 9b).

3.2.2. Post-Processing Effects

Velvetleaf and annual ryegrass had distinct responses to biochars manipulated by different post-processing methods (Table 2, Figure 5 and Figure 6). Velvetleaf showed higher growth in soils with direct sieved biochars when biochar particles were small, but grew better in soils with ground biochars when biochar particles were large. The leaf area of velvetleaf with S-sieved biochar was greater than that of velvetleaf with S-ground biochar by 82%, whereas the leaf area of velvetleaf with L-sieved biochar was less than that of velvetleaf with L-ground biochar by 31% (Figure 6a). The final biomass of velvetleaf with S-sieved biochar was likewise greater than with S-ground biochar; however, velvetleaf plants with L-sieved biochar were smaller than those with L-ground biochar (Figure 7a,b). Tissue N concentration was reduced in velvetleaf grown with direct sieved biochars when biochar particles were small; however, tissue N was lower for velvetleaf grown with ground biochars when biochar particles were large (Figure 9a). In annual ryegrass the different post-processing methods produced only small effects. The leaf areas of annual ryegrass grown in soils with S-sieved and L-sieved biochar were not significantly different from those grown in soils with S-ground and L-ground (Table 2, Figure 6b). Likewise, biomass components for annual ryegrass did not differ between sieved vs. ground biochars for either small or large particles (Figure 7c,d). While biochar amendments reduced tissue N concentration for velvetleaf in all treatments, in annual ryegrass, only the sieved biochar treatments reduced tissue N in comparison to the control (Figure 9).

4. Discussion

The present study demonstrates large effects of biochar particle size and post-processing method on biochar pH and water-holding capacity. However, contrary to our initial hypotheses, smaller biochar particles did not consistently result in improved plant performance: annual ryegrass showed consistently better performance in response to larger-sized biochar particles, while velvetleaf showed improved performance on small, sieved biochar particles.

4.1. Biochar pH and Water Retention Capacity

We found large effects of post-pyrolysis processing on biochar pH. Higher pH of sieved biochars was associated with higher ash content of the sieved particles, with ash content linked to liming effects. Prior research indicates that biochar pH increases with pyrolysis temperatures [5,34,35] due to the combined effects of increasing concentrations of alkaline earth metals (in particular Ca and Mg) in conjunction with reductions in acidic organic moieties [6]. Increased biochar pH and ash content has likewise been found in biochars produced from smaller feedstock particle size [16]. Our results indicate that this effect also is found in smaller individual particles where feedstock varies in size. The higher pH in the S-sieved biochar was associated with higher ash content (Figure 4, Table 2), and would be expected to show a higher concentration of basic cations [35]. Lower particle thickness and higher specific surface area allow more heat to reach the interior of small biochar particles, increasing alkaline earth metals in the ash fraction and reducing negatively charged functional groups (e.g., carboxyl groups), along with volatile substances [5].
Biochars composed of small particle size also showed higher WRC than larger particle size biochars, similar to results reported recently by Trifunovic et al. (2018) [13]. A few mechanisms likely contribute to this effect. First, smaller-sized biochars can easily fill the voids between larger biochar particles and between soil particles, thereby mechanically obstructing the existing pores in the soils. This will increase the tortuosity of water flow in the soils and reduce soil hydraulic conductivity [36,37]. In addition, as smaller-sized biochars fill the inter-pores between particles, more water can be retained on the surface of the biochars and the soil particles under capillary pressure [13,38]. The smaller-sized biochars we used were finer than sand particles; therefore, the biochars mechanically blocked water flow in the soil and held water on the biochar surface. Second, biochars with smaller particle sizes likely have more broken intrinsic macropores, which increases the amount of water that can be stored [13]. Third, smaller-sized biochar particles generally have higher BET surface areas and external surface areas [18,20,24,39], which may directly enhance WRC by increasing cohesion and adhesion between water molecules and between water and the biochars, respectively [9]. Finally, the smaller biochars can potentially increase soil aggregation by binding the individual soil particles together, which reduces hydraulic conductivity [24].
Prior studies have not investigated how alternative means of reducing biochar particle size influence soil hydrological properties. We found that WRC of biochar particles obtained by sieving alone was higher than that of biochar manipulated by physical grinding. This was a remarkably large effect: at a given particle size sieved biochars had 2–4-fold greater WRC than ground biochars (Figure 5). We suspect that different biochar shapes are responsible for this effect, since particles of sieved biochars were substantially more elongated than particles of ground biochars. Sieved biochars also had lower bulk density and tap density, consistent with an increased volume of voids between particles in the soil, providing increased water retention by the macro-pores in the soil.
Although some research on biochar WRC suggests that biochar has significantly higher WRC than sand or loamy sand substrates due to its higher porosity and higher external surface area [10,40], we found no difference in WRC between the large ground biochar and sand. This might be due to remaining aliphatic compounds that reduce biochar porosity. As the pyrolyzing temperatures for our biochar were relatively low, the heat might not be high enough to completely pyrolyze the inner parts of the large-sized feedstock. Therefore, aliphatic compounds, which include pyrogenic oils and tars, might not be able to escape from the inner parts of biochar, or the aliphatic compounds might condense during pyrolysis and obstruct pores [41].

4.2. Plant Performance

To our knowledge this is the first study to empirically test for differences in plant performance relative to biochar particle size. The two plant species examined showed highly distinct patterns of response. Velvetleaf showed enhanced growth in soils with smaller-sized biochar particles, showing by far the best performance in small sieved biochar treatment. In contrast, annual ryegrass showed the best performance in treatments with large biochar particles. The pattern observed for velvetleaf was that expected based on increased substrate WRC and pH. Water stress greatly affects growth of velvetleaf [42,43], and this species is also highly responsive to increased K and P availability [44,45], and shows a peak performance in soils with pH between 6.1 and 7.8 [46]. In contrast, annual ryegrass is tolerant of a wide range of soil types, but is known to be highly responsive to N limitation [47]. Additions of wood-based biochars commonly reduce soil N availability, consistent with the reductions in plant tissue N observed here, which was most pronounced for the small sieved biochar treatment (Figure 9). There is evidence that plant species more sensitive to N limitation tend to show neutral or negative responses to biochars [48]; thus, the reduced performance of annual ryegrass to smaller-sized biochar particles may in part be explained by N immobilization and sensitivity to N limitation. In addition, we speculate the large biochar particles may enhance soil macroporosity, enhancing oxygen diffusion into the soil and reducing soil resistance to root penetration. Smaller-sized biochar particles fill the space between the soil particles, which can increase the bulk density and packing of the biochar-soil mixture [49]; thus, the smaller-sized biochars may mechanically obstruct water flow and increase WRC [36,37]. Brockhoff et al. (2010) [50] suggest that the increase of WRC and the decrease of pore space in soils might lead to anaerobic effects, which limit root growth. In contrast, coarser biochar particles can have larger macropores and create larger spaces between biochar particles and soils [13]. Prior work on perennial ryegrass (Lolium perenne) indicates that this species has high sensitivity to soil bulk density and root penetration resistance [51].
In addition to biochar particle size effects, application of similar-sized biochars obtained by different mechanical processing methods resulted in large differences in plant performance in the case of velvetleaf. For small particle sizes, sieved biochar had a much stronger positive effect on growth (Figure 5 and Figure 6); the highest observed chlorophyll fluorescence (Fv/Fm) values were also observed for this treatment (Figure 8). Improved performance of velvetleaf in sieved relative to ground biochar is consistent with the observed differences in substrate pH and WRC, and with the relatively high sensitivity of velvetleaf to both of these factors.
The results from our research suggest that physical processing of biochars is an important potential avenue to enhance biochar performance for specific applications. Various techniques can be utilized to produce designed biochars with specific particle characteristics. Manipulation methods can generally be divided into two steps: grinding or chopping biochars to reduce particle size, and separating biochars according to particle size. Ball mills are a common means available to grind biochar into various sizes. Differently sized biochars could be obtained by varying grinding duration, mill ball size, and material/feed sizes (e.g., Yusof et al. 2014 [52]). Mill ball sizes and combinations should be determined according to size of feed materials and targeted particle sizes [53]. For example, larger particles crack faster by grinding with larger mill balls [54]. In addition to mechanical sieving, vibrational sieving and electrostatic separation techniques could be used to separate and group biochars by particle size. Sieves with multiple sieving ranges can be stacked and placed on a vibrating sieve shaker to group biochars based on particle sizes [55]. Triboelectrostatic separation methods are commonly used to separate coal particles [56,57], and could be similarly applied to biochars. As different biochars can have distinct conductivities, triboelectrification is also a possible method to separate biochar particles according to conductivity.

5. Conclusions

Our results indicate that post-pyrolysis mechanical processing of biochars can strongly affect its physical and chemical interactions with water and plant nutrients, and that this can result in large differences in plant performance. However, with respect to biochar particle size, it is not simply the case that “smaller is better”. One of the plant species tested performed significantly better in the large particle biochar treatments. Also, the method for mechanically manipulating biochar particle size is clearly important, and it appears that sieving biochars without grinding can produce biochars with higher liming effects and much higher water holding capacity. These results have important implications for biochar “design” for specific applications. Mechanical processing is one of the simplest potential methods for enhancing biochar properties, but as in nearly any application of a soil amendment, results will depend on both the substrate to be amended and the target crop species in question. An obvious next step in this research area is investigation of biochars across a particle size continuum; an initial study along these lines has recently assessed biochar chemistry and pore size distribution [58], and this work could profitably be extended to determine potential biochar particle size optima for agronomic applications.

Author Contributions

Conceptualization, W.L. and S.C.T.; Methodology, W.L.; Formal Analysis, W.L.; Writing—Original Draft Preparation, W.L.; Writing—Review and Editing, S.C.T.; Supervision, S.C.T.

Funding

This work was supported by grants from the Canadian Natural Sciences and Engineering Research Council.

Acknowledgments

We thank Haliburton Forest and Wildlife Reserve Ltd, Haliburton, ON for research support and provision of biochars and soil. Special thanks to Jennifer Drake (Dept of Civil and Mineral Engineering, Univ. of Toronto), Sylvie Spraakman, Marisa Fryer, Leeladarshini Sujeeun, Md. Abdul Halim, and Adam Gorgolewski for assistance with lab measurements.

Conflicts of Interest

The authors declare no conflict of interest.

References

  1. Lehmann, J.; Joseph, S. Biochar for Environmental Management: Science, Technology and Implementation; Routledge: London, UK, 2015. [Google Scholar]
  2. Biederman, L.A.; Harpole, W.S. Biochar and its effects on plant productivity and nutrient cycling: A meta-analysis. GCB Bioenergy 2013, 5, 202–214. [Google Scholar] [CrossRef]
  3. Thomas, S.C.; Gale, N. Biochar and forest restoration: A review and meta-analysis of tree growth responses. New For. 2015, 46, 931–946. [Google Scholar] [CrossRef]
  4. Atkinson, C.J.; Fitzgerald, J.D.; Hipps, N.A. Potential mechanisms for achieving agricultural benefits from biochar application to temperate soils: A review. Plant Soil 2010, 337, 1–18. [Google Scholar] [CrossRef]
  5. Novak, J.M.; Lima, I.; Xing, B.; Gaskin, J.W.; Steiner, C.; Das, K.C.; Ahmedna, M.; Rehrah, D.; Watts, D.W.; Busscher, W.J.; et al. Characterization of designer biochar produced at different temperatures and their effects on a loamy sand. Ann. Environ. Sci. 2009, 3, 195–206. [Google Scholar]
  6. Gezahegn, S.; Sain, M.; Thomas, S.C. Variation in feedstock wood chemistry strongly influences biochar liming potential. Soil Syst. 2019. in review. [Google Scholar]
  7. Beesley, L.; Moreno-Jiménez, E.; Gomez-Eyles, J.L.; Harris, E.; Robinson, B.; Sizmur, T. A review of biochars’ potential role in the remediation, revegetation and restoration of contaminated soils. Environ. Pollut. 2011, 159, 3269–3282. [Google Scholar] [CrossRef] [PubMed]
  8. Rees, F.; Simonnot, M.O.; Morel, J.L. Short-term effects of biochar on soil heavy metal mobility are controlled by intra-particle diffusion and soil pH increase: Heavy metal mobility in biochar-amended soils. Eur. J. Soil Sci. 2014, 65, 149–161. [Google Scholar] [CrossRef]
  9. Mollinedo, J.; Schumacher, T.E.; Chintala, R. Influence of feedstocks and pyrolysis on biochar’s capacity to modify soil water retention characteristics. J. Anal. Appl. Pyrolysis 2015, 114, 100–108. [Google Scholar] [CrossRef]
  10. Baronti, S.; Vaccari, F.P.; Miglietta, F.; Calzolari, C.; Lugato, E.; Orlandini, S.; Pini, R.; Zulian, C.; Genesio, L. Impact of biochar application on plant water relations in Vitis vinifera (L.). Eur. J. Agron. 2014, 53, 38–44. [Google Scholar] [CrossRef]
  11. Gale, N.V.; Sackett, T.E.; Thomas, S.C. Thermal treatment and leaching of biochar alleviates plant growth inhibition from mobile organic compounds. PeerJ 2016, 4, e2385. [Google Scholar] [CrossRef]
  12. Thomas, S.C.; Frye, S.; Gale, N.; Garmon, M.; Launchbury, R.; Machado, N.; Melamed, S.; Murray, J.; Petroff, A.; Winsborough, C. Biochar mitigates negative effects of salt additions on two herbaceous plant species. J. Environ. Manag. 2013, 129, 62–68. [Google Scholar] [CrossRef] [PubMed]
  13. Trifunovic, B.; Gonzales, H.B.; Ravi, S.; Sharratt, B.S.; Mohanty, S.K. Dynamic effects of biochar concentration and particle size on hydraulic properties of sand. Land Degrad. Dev. 2018, 29, 884–893. [Google Scholar] [CrossRef]
  14. Liu, Z.; Dugan, B.; Masiello, C.A.; Gonnermann, H.M. Biochar particle size, shape, and porosity act together to influence soil water properties. PLoS ONE 2017, 12, e0179079. [Google Scholar] [CrossRef] [PubMed]
  15. Sigua, G.C.; Novak, J.M.; Watts, D.W.; Cantrell, K.B.; Shumaker, P.D.; Szögi, A.A.; Johnson, M.G. Carbon mineralization in two ultisols amended with different sources and particle sizes of pyrolyzed biochar. Chemosphere 2014, 103, 313–321. [Google Scholar] [CrossRef] [PubMed]
  16. Chen, J.; Li, S.; Liang, C.; Xu, Q.; Li, Y.; Qin, H.; Fuhrmann, J.J. Response of microbial community structure and function to short-term biochar amendment in an intensively managed bamboo (Phyllostachys praecox) plantation soil: Effect of particle size and addition rate. Sci. Total Environ. 2017, 574, 24–33. [Google Scholar] [CrossRef] [PubMed]
  17. Zheng, W.; Guo, M.; Chow, T.; Bennett, D.N.; Rajagopalan, N. Sorption properties of greenwaste biochar for two triazine pesticides. J. Hazard. Mater. 2010, 181, 121–126. [Google Scholar] [CrossRef]
  18. Xie, T.; Reddy, K.R.; Wang, C.; Yargicoglu, E.; Spokas, K. Characteristics and applications of biochar for environmental remediation: A Review. Crit. Rev. Environ. Sci. Technol. 2015, 45, 939–969. [Google Scholar] [CrossRef]
  19. Sun, H.; Hockaday, W.C.; Masiello, C.A.; Zygourakis, K. Multiple controls on the chemical and physical structure of biochars. Ind. Eng. Chem. Res. 2012, 51, 3587–3597. [Google Scholar] [CrossRef]
  20. Valenzuela-Calahorro, C.; Bernalte-Garcia, A.; Gómez-Serrano, V.; Bernalte-García, M.J. Influence of particle size and pyrolysis conditions on yield, density and some textural parameters of chars prepared from holm-oak wood. J. Anal. Appl. Pyrolysis 1987, 12, 61–70. [Google Scholar] [CrossRef]
  21. Bruun, E.W.; Petersen, C.T.; Hansen, E.; Holm, J.K.; Hauggaard-Nielsen, H. Biochar amendment to coarse sandy subsoil improves root growth and increases water retention. Soil Use Manag. 2014, 30, 109–118. [Google Scholar] [CrossRef]
  22. Liu, C.; Wang, H.; Tang, X.; Guan, Z.; Reid, B.J.; Rajapaksha, A.U.; Ok, Y.S.; Sun, H. Biochar increased water holding capacity but accelerated organic carbon leaching from a sloping farmland soil in China. Environ. Sci. Pollut. Res. 2016, 23, 995–1006. [Google Scholar] [CrossRef] [PubMed]
  23. Ulyett, J.; Sakrabani, R.; Kibblewhite, M.; Hann, M. Impact of biochar addition on water retention, nitrification and carbon dioxide evolution from two sandy loam soils: Biochar impacts on nitrogen and water dynamics. Eur. J. Soil Sci. 2014, 65, 96–104. [Google Scholar] [CrossRef]
  24. Ouyang, L.; Wang, F.; Tang, J.; Yu, L.; Zhang, R. Effects of biochar amendment on soil aggregates and hydraulic properties. J. Soil Sci. Plant Nutr. 2013, 13, 991–1002. [Google Scholar] [CrossRef]
  25. Basso, A.S.; Miguez, F.E.; Laird, D.A.; Horton, R.; Westgate, M. Assessing potential of biochar for increasing water-holding capacity of sandy soils. GCB Bioenergy 2013, 5, 132–143. [Google Scholar] [CrossRef]
  26. Xiao, Q.; Zhu, L.; Shen, Y.; Li, S. Sensitivity of soil water retention and availability to biochar addition in rainfed semi-arid farmland during a three-year field experiment. Field Crops Res. 2016, 196, 284–293. [Google Scholar] [CrossRef]
  27. Liu, Z.; Dugan, B.; Masiello, C.A.; Barnes, R.T.; Gallagher, M.E.; Gonnermann, H. Impacts of biochar concentration and particle size on hydraulic conductivity and DOC leaching of biochar–sand mixtures. J. Hydrol. 2016, 533, 461–472. [Google Scholar] [CrossRef] [Green Version]
  28. Zhang, W.; Niu, J.; Morales, V.L.; Chen, X.; Hay, A.G.; Lehmann, J.; Steenhuis, T.S. Transport and retention of biochar particles in porous media: Effect of pH, ionic strength, and particle size. Ecohydrology 2010, 3, 497–508. [Google Scholar] [CrossRef]
  29. Sackett, T.E.; Basiliko, N.; Noyce, G.L.; Winsborough, C.; Schurman, J.; Ikeda, C.; Thomas, S.C. Soil and greenhouse gas responses to biochar additions in a temperate hardwood forest. GCB Bioenergy 2015, 7, 1062–1074. [Google Scholar] [CrossRef]
  30. Barker, D.C.; Knezevic, S.Z.; Martin, A.R.; Walters, D.T.; Lindquist, J.L. Effect of nitrogen addition on the comparative productivity of corn and velvetleaf (Abutilon theophrasti). Weed Sci. 2006, 54, 354–363. [Google Scholar] [CrossRef]
  31. Maxwell, K.; Johnson, G.N. Chlorophyll fluorescence—A practical guide. J. Exp. Bot. 2000, 51, 659–668. [Google Scholar] [CrossRef]
  32. Regnier, E.E.; Harrison, S.K. Compensatory responses of common cocklebur (Xanthium strumarium) and velvetleaf (Abutilon theophrasti) to partial shading. Weed Sci. 1993, 41, 541–547. [Google Scholar]
  33. Thomas, S.C.; Jasienski, M.; Bazzaz, F.A. Early vs. asymptotic growth responses of herbaceous plants to elevated CO2. Ecology 1999, 80, 1552–1567. [Google Scholar] [CrossRef]
  34. Yuan, J.-H.; Xu, R.-K.; Zhang, H. The forms of alkalis in the biochar produced from crop residues at different temperatures. Bioresour. Technol. 2011, 102, 3488–3497. [Google Scholar] [CrossRef] [PubMed]
  35. Domingues, R.R.; Trugilho, P.F.; Silva, C.A.; de Melo, I.C.N.A.; Melo, L.C.A.; Magriotis, Z.M.; Sánchez-Monedero, M.A. Properties of biochar derived from wood and high-nutrient biomasses with the aim of agronomic and environmental benefits. PLoS ONE 2017, 12, e0176884. [Google Scholar] [CrossRef] [PubMed]
  36. Lim, T.J.; Spokas, K.A.; Feyereisen, G.W.; Weis, R.; Koskinen, W.C. Influence of biochar particle size and shape on soil hydraulic properties. J. Environ. Sci. Eng. 2017, 5, 8–15. [Google Scholar]
  37. Ibrahim, A.; Usman, A.R.A.; Al-Wabel, M.I.; Nadeem, M.; Ok, Y.S.; Al-Omran, A. Effects of conocarpus biochar on hydraulic properties of calcareous sandy soil: Influence of particle size and application depth. Arch. Agron. Soil Sci. 2017, 63, 185–197. [Google Scholar] [CrossRef]
  38. Sun, F.; Lu, S. Biochars improve aggregate stability, water retention, and pore-space properties of clayey soil. J. Plant Nutr. Soil Sci. 2014, 177, 26–33. [Google Scholar] [CrossRef]
  39. Jaafar, N.M.; Clode, P.L.; Abbott, L.K. Soil microbial responses to biochars varying in particle size, surface and pore properties. Pedosphere 2015, 25, 770–780. [Google Scholar] [CrossRef]
  40. Abel, S.; Peters, A.; Trinks, S.; Schonsky, H.; Facklam, M.; Wessolek, G. Impact of biochar and hydrochar addition on water retention and water repellency of sandy soil. Geoderma 2013, 202–203, 183–191. [Google Scholar] [CrossRef]
  41. Gray, M.; Johnson, M.G.; Dragila, M.I.; Kleber, M. Water uptake in biochars: The roles of porosity and hydrophobicity. Biomass Bioenergy 2014, 61, 196–205. [Google Scholar] [CrossRef]
  42. Karkanis, A.; Bilalis, D.; Efthimiadou, A. Architectural plasticity, photosynthesis and growth responses of velvetleaf (Abutilon theophrasti Medicus) plants to water stress in a semi-arid environment. Aust. J. Crop Sci. 2011, 5, 369–374. [Google Scholar]
  43. Patterson, D.T.; Highsmith, M.T. Competition of spurred anoda (Anoda cristata) and velvetleaf (Abutilon theophrasti) with cotton (Gossypium hirsutum) during simulated drought and recovery. Weed Sci. 1989, 37, 658–664. [Google Scholar]
  44. Aghaie, P.; Kazemeini, S.A.; Majd, R.; Alebrahim, M.T. Role of phosphorus in maize (Zea mays L.) competitiveness against velvetleaf (Abutilon theophrasti). Int. J. Agron. Plant Prod. 2013, 4, 2323–2329. [Google Scholar]
  45. Nagy, V.; Szabo, R.; Budai, P.; Nadasy, E. Sprouting of velvetleaf (Abutilon theohrasti Medic.) influenced by N, P and K fertilizers. 13th Alps-Adria Sci. Workshop 2014, 63, 275–278. [Google Scholar]
  46. Warwick, S.I.; Black, L.D. The biology of Canadian weeds. 90. Abutilon theophrasti. Can. J. Plant Sci. 1988, 68, 1069–1085. [Google Scholar] [CrossRef]
  47. Evers, G.W.; Smith, G.R.; Hoveland, C.S. Ecology and production of annual ryegrass. In Ecology, Production, and Management of Lolium for Forage in the USA; Crop Science Society of America: Medison, WI, USA, 1997; pp. 29–43. [Google Scholar]
  48. Gale, N.V.; Halim, M.A.; Horsburgh, M.; Thomas, S.C. Comparative responses of early-successional plants to charcoal soil amendments. Ecosphere 2017, 8, e01933. [Google Scholar] [CrossRef] [Green Version]
  49. Esmaeelnejad, L.; Shorafa, M.; Gorji, M.; Hosseini, S.M. Impacts of woody biochar particle size on porosity and hydraulic conductivity of biochar-soil mixtures: An incubation study. Commun. Soil Sci. Plant Anal. 2017, 48, 1710–1718. [Google Scholar] [CrossRef]
  50. Brockhoff, S.R.; Christians, N.E.; Killorn, R.J.; Horton, R.; Davis, D.D. Physical and mineral-nutrition properties of sand-based turfgrass root zones amended with biochar. Agron. J. 2010, 102, 1627–1631. [Google Scholar] [CrossRef]
  51. Houlbrooke, D.J.; Thom, E.R.; Chapman, R.; McLay, C.D.A. A study of the effects of soil bulk density on root and shoot growth of different ryegrass lines. N. Z. J. Agric. Res. 1997, 40, 429–435. [Google Scholar] [CrossRef] [Green Version]
  52. Yusof, J.M.; Salleh, M.A.M.; Rashid, S.A.; Ismail, I.; Adam, S.N. Characterisation of carbon particles (CPs) derived from dry milled kenaf biochar. J. Eng. Sci. Technol. 2014, 125–131. [Google Scholar]
  53. Hlabangana, N.; Danha, G.; Muzenda, E. Effect of ball and feed particle size distribution on the milling efficiency of a ball mill: An attainable region approach. S. Afr. J. Chem. Eng. 2018, 25, 79–84. [Google Scholar] [CrossRef]
  54. Khumalo, N.; Glasser, D.; Hildebrandt, D.; Hausberger, B.; Kauchali, S. The application of the attainable region analysis to comminution. Chem. Eng. Sci. 2006, 61, 5969–5980. [Google Scholar] [CrossRef] [Green Version]
  55. Kaudal, B.B.; Chen, D.; Madhavan, D.B.; Downie, A.; Weatherley, A. An examination of physical and chemical properties of urban biochar for use as growing media substrate. Biomass Bioenergy 2016, 84, 49–58. [Google Scholar] [CrossRef]
  56. Dwari, R.K.; Hanumantha Rao, K. Fine coal preparation using novel tribo-electrostatic separator. Miner. Eng. 2009, 22, 119–127. [Google Scholar] [CrossRef]
  57. Higashiyama, Y.; Asano, K. Recent progress in electrostatic separation technology. Part. Sci. Technol. 1998, 16, 77–90. [Google Scholar] [CrossRef]
  58. He, P.; Liu, Y.; Shao, L.; Zhang, H.; Lü, F. Particle size dependence of the physicochemical properties of biochar. Chemosphere 2018, 212, 385–392. [Google Scholar] [CrossRef] [PubMed]
Figure 1. Biochar particles of varying size and shape generated by sieving and grinding “raw” biochars. (a) and (c) are biochar particles between 0.0635 mm and 0.5 mm; (b) and (d) are biochar particles between 2 mm and 4 mm. (a) and (b) (elongated) are biochars obtained by direct sieving from biochars pyrolyzed from sawdust; (c) and (d) (round) are biochars obtained by grinding and sieving from biochars pyrolyzed from woodchips.
Soilsystems 03 00014 g001
Figure 2. Particle aspect ratio (long/short axis length of fitted ellipse) vs. particle size (cross-sectional area) for biochars tested, based on image analysis. Symbols are as follows: closed squares (blue): S-ground; open squares (green): S-sieved; closed circles (black): L-ground; open circles (red): L-sieved.
Soilsystems 03 00014 g002
Figure 3. Aspect ratio of biochar particles by treatment and of sand (control) particles. Means are plotted ± 1 standard error based on 277 particles detected by flatbed scanner for each treatment. Bars with the same lower case letters do not differ significantly at p < 0.05 according to Tukey’s honest significant difference (HSD) test.
Soilsystems 03 00014 g003
Figure 4. pH of pure biochar and control (sand) (a) and pH of the biochar-soil mixture and control (b). Means are plotted ± 1 standard error (SE) based on triplicate measurements within each treatment. Within each panel, bars with the same lower case letters do not differ significantly at p < 0.05 according to Tukey’s HSD test.
Soilsystems 03 00014 g004
Figure 5. Water retention capacity of pure biochar by treatment and pure sand. Means are plotted ± 1 SE based on triplicate measurements within each treatment.
Soilsystems 03 00014 g005
Figure 6. Leaf area growth of velvetleaf (a) and annual ryegrass (b) by treatment. Means are plotted ± 1 SE based on measurements on 7 replicates for each treatment by species combination.
Soilsystems 03 00014 g006
Figure 7. Aboveground (a) and belowground (b) biomass of velvetleaf; aboveground (c) and belowground (d) biomass of annual ryegrass. The bar graph indicates the aboveground biomass of the velvetleaf and annual ryegrass on the day of harvest for each treatment and control. Means are plotted ± 1 standard error based on measurements on 7 replicates for each treatment in each plant species. Within each panel, bars with the same lowercase letters do not differ significantly at p < 0.05 according to Tukey’s HSD test.
Soilsystems 03 00014 g007
Figure 8. Chlorophyll concentration index (CCI) (a) and Fv/Fm (quantum efficiency of photosystem II) (b) of velvetleaf. Means are plotted ± 1 standard error based on measurements on 7 replicates for each treatment in velvetleaf. Within each panel, bars with the same lower case letters do not differ significantly at p < 0.05 according to Tukey’s HSD test.
Soilsystems 03 00014 g008
Figure 9. Nitrogen concentration of aboveground biomass of velvetleaf (a) and annual ryegrass (b). Means are plotted ± 1 standard error based on measurements on 7 replicates for each treatment in velvetleaf and annual ryegrass. Within each panel, bars with the same lower-case letters do not differ significantly at p < 0.05 according to Tukey’s HSD test.
Soilsystems 03 00014 g009
Table 1. Physical and chemical properties of biochars and sand. S-sieved, L-sieved, S-ground, and L-ground stand for small sieved biochar, large sieved biochar, small ground biochar, and large ground biochar, respectively. Means are listed with standard errors in parentheses. N/A indicates not applicable; ND indicates values below detection limit.
Treatment
AttributeS-sievedL-sievedS-groundL-groundSand
Pyrolysis temperature (°C)374374 363363N/A
Particle cross-sectional area (mm2)0.26 (0.02)11.31 (0.34)0.12 (0.01)12.76 (0.32)0.07 (0.00)
Particle aspect ratio2.83 (0.10)2.58 (0.10)1.59 (0.03)1.70 (0.03)1.53 (0.03)
pH of pure biochar or sand6.73 (0.02)6.43 (0.04)6.37 (0.03)6.37 (0.01)5.82 (0.04)
pH of Biochar-sand mixture or sand *6.81 (0.02)6.60 (0.05)6.46 (0.04)6.46 (0.02)5.63 (0.10)
Electrical conductivity (uS/cm)23.9 (1.0)28.5 (1.1)23.9 (0.6)25.7 (1.5)45.3 (7.8)
Water retention capacity (%)360 (1)168 (21)189 (1)47 (6)37 (0)
Carbon (%)68.368.968.268.90.240
Nitrogen (%)0.3500.3350.2530.205ND
Ash content (%)3.28 (0.35)3.74 (1.00)1.26 (0.16)1.58 (0.17)N/A
Bulk density (g/cm3)0.16 (0.00)0.14 (0.00)0.29 (0.00)0.22 (0.02)1.38 (0.01)
Tap density (g/cm3)0.23 (0.00)0.20 (0.00)0.41 (0.01)0.34 (0.04)1.69 (0.01)
* pH of sand samples were measured at 1:20 (w/v) dilution for comparison to pure biochar samples, and at 1:1 (v/v) dilution for comparison to biochar-sand mixtures.
Table 2. Plant responses for annual ryegrass and velvetleaf. S-sieved, L-sieved, S-ground, and L-ground stand for small sieved biochar, large sieved biochar, small ground biochar, and large ground biochar, respectively. Means are listed with standard errors in parentheses.
TreatmentLeaf Area (cm2)Aboveground biomass (mg)Belowground biomass (mg)Chlorophyll conc. indexFv/FmLeaf N (%)
Annual Ryegrass
S-sieved5.3 (0.7)16.96 (1.66)11.90 (1.77)N/AN/A3.56 (0.11)
L-sieved10.2 (1.3)28.99 (3.07)20.90 (2.42)N/AN/A3.88 (0.13)
S-ground5.1 (0.6)16.87 (1.86)13.96 (1.15)N/AN/A4.19 (0.10)
L-ground8.9 (1.0)28.06 (2.33)17.72 (2.33)N/AN/A4.08 (0.12)
Control4.7 (0.5)16.37 (13.59)13.59 (1.08)N/AN/A4.04 (0.13)
Velvetleaf
S-sieved24.3 (3.9)248.28 (35.05)97.11 (10.52)11.5 (0.4)0.823 (0.004)2.34 (0.07)
L-sieved9.2 (1.3)118.67 (8.31)46.35 (5.20)13.9 (0.7)0.809 (0.001)2.60 (0.06)
S-ground13.3 (3.4)151.31 (31.46)60.89 (10.88)13.6 (0.4)0.804 (0.010)2.62 (0.07)
L-ground12.0 (1.6)141.51 (17.60)71.44 (8.69)14.0 (0.8)0.808 (0.009)2.49 (0.05)
Control9.7 (1.6)121.27 (15.85)51.82 (5.79)12.5 (0.9)0.732 (0.030)2.83 (0.05)

