Article

Nitrogen Mineralization and Microbial Biomass Dynamics in Different Tropical Soils Amended with Contrasting Organic Resources

by
Richard Ansong Omari
1,
Dorothea Sonoko Bellingrath-Kimura
2,3,*,
Yoshiharu Fujii
4,
Elsie Sarkodee-Addo
1,
Kwame Appiah Sarpong
1 and
Yosei Oikawa
4
1
United Graduate School of Agricultural Science, Tokyo University of Agriculture and Technology, Saiwaicho 3-5-8, Fuchu, Tokyo183-8509, Japan
2
Leibniz Centre for Agricultural Landscape Research, Eberswalder Str. 84, 15374 Müencheberg, Germany
3
Faculty of Life Science, Institute of Agriculture and Horticulture, Humboldt-University of Berlin, Albrecht-Thaer-Weg 5, 14195 Berlin, Germany
4
Institute of Agriculture, Tokyo University of Agriculture and Technology, Saiwaicho 3-5-8, Fuchu, Tokyo183-8509, Japan
*
Author to whom correspondence should be addressed.
Soil Syst. 2018, 2(4), 63; https://doi.org/10.3390/soilsystems2040063
Submission received: 21 September 2018 / Revised: 15 November 2018 / Accepted: 20 November 2018 / Published: 23 November 2018

Abstract

:
The use of location-specific and underutilized organic residues (OR) as soil amendments in small-holder agro-ecosystems is promising. Six ORs (Leucaena leucocephala, Centrosema pubescens, Gliricidia sepium, Pueraria phaseoloides, Azadirachta indica, and Theobroma cacao) were amended to three tropical soils each at 24 mg g−1 dry soil in 120-day incubation study to estimate their nitrogen (N) mineralization and microbial biomass carbon (C) dynamics. Inorganic N contents varied among ORs, soil type and incubation days. Regardless of soil type, Gliricidia had the highest inorganic N among the studied ORs. Mineralization rate of 1.4 to 1.5 mg N kg−1 soil day−1 was observed for Lego and Tec soils, respectively, and was twice higher than Nya soil. However, Nya soil released higher inorganic N than Tec and Lego soils, implying high N mineralization efficiency in the former. Consistent soil pH increase was respectively observed for Theobroma and Pueraria treatments in all soils. Moreover, Theobroma and Pueraria amendments showed the highest soil microbial biomass C (MBC) at the end of the incubation. The assessed soil properties likely affected by the dominant edaphic factors and management influenced differences in MBC and dissolved organic carbon (DOC) while OR quality indices controlled N mineralization. Thus, we conclude that soil properties and OR type are important factors for optimal utilization of organic resources.

1. Introduction

A significant proportion of agricultural soils in Sub-Saharan Africa (SSA) including Ghana are depleted of essential nutrients for optimum crop growth [1,2]. Such soils, characterized by low amounts of soil organic matter (SOM) are the livelihood base for many rural populations in the region. Consequently, yield potentials of crops continue to fall below maximum thresholds as a result of the continuous cultivation practices. The attempt to maintain SOM, often regarded as a good proxy for soil fertility status in a high decomposition driven environment [3], is necessary for water and nutrient retention and overall soil productivity [4,5,6].
Farming practices in Ghana are based popularly on inorganic fertilizers with minimal SOM improvement strategies [6,7,8]. Apart from its constant price fluctuation in the country, there are reports of topsoil acidification following continuous use of some inorganic fertilizers on [9], priming of SOM as well as a decrease in biomass and activity of soil microbes [10]. Thus, a more sustainable farming option would be to increase crop yield while maintaining the productive potential of soils since it provides a means of living for a significant rural Ghanaian population.
In an era of limited organic resource materials, ubiquitous or location specific weeds, invasive tree species, cover crops, and under-utilized crop residues (OR) could be exploited as soil amendments. The inputs from such organic sources could be vital sources of soil carbon (C) and nitrogen (N) and enhance microbial activities [11,12]. This approach could increase C stocks and offset soil nutrient deficits as well as a reduction in the use of expensive inorganic fertilizers. In situ studies in Ghana on the evaluation of potential ORs as options for soil productivity improvement have often been conducted in one location involving single soil type [13,14,15]. While this approach could achieve the intended objectives to some extent, it fails to reveal further details on the interaction between soil types and organic resource quality characteristics. Previous studies show that soil texture together with soil microbial composition greatly influences organic matter decomposition [11,16,17]. Thus, studies that will evaluate the performance of different organic amendments in different soil types will be of immense importance in the adoption process of specific organic resources for specific agro-ecological zones. Given the bulky nature and lower availability of OR in Ghana, use of dominant plant or weeds species as soil amendments for specific soil ecosystems presents a promising option for weed or crop residue utilization.
Distinct climate and soil types characterize the main agro-ecological zones of Ghana. Such differences in characteristics—i.e. pH, texture, moisture, and soil nutrient content [18]—have been reported to influence soil microbial biomass C (MBC) dynamics [19,20,21,22]. Most soils in the coastal Savannah zone are characterized by low SOM content as the Savannah ochrosols in the Guinea Savannah zone. In contrast, significant areas of the transition zone are characterized by predominantly organic matter-rich soils [23].
Plant litter decomposition is greatly influenced by the biochemical quality of organic materials and soil factors [11]. For example, different organic resources undergo different decomposition pattern with resultant differences in soil microbial composition [24]. Moreover, the preference of soil microbial communities for specific substrates and the resulting release of nutrients in different patterns result in varying nutrient availability to crops [25,26].
Therefore, to evaluate the potential utilization of biochemically contrasting organic resources in different ecosystems, a practical approach will be to understand their mineralization dynamics in different soil types. The objectives of the present study were to i) quantify the N-release potential of different organic resource materials in different soil types, ii) understand the dynamics of dissolved organic carbon (DOC) in different soils amended with different organic materials, and iii) evaluate how soil properties and contrasting OR quality type influence N mineralization dynamics and resultant soil physicochemical properties.

2. Materials and Methods

2.1 Soil Sampling Sites

Soil samples from three distinct agro-ecological zones were used. The three agro-ecological zones are characterized by distinct climates and cover a significant proportion of Ghana’s arable land. They are also contributors to a wide range of agricultural products in the country. Nyankpala (9°24′01″N, 0°58′58″W; 165 m above sea level (a.s.l.)), hereafter referred as Nya belongs to the Guinea Savannah. Legon (5°39′31″N, 0°12′00″W; 61 m a.s.l.) and Techiman (7°32′58″N, 1°58′09″W; 387 m a.s.l.), hereafter referred as Lego and Tec belong to the coastal Savannah and the transition zones, respectively. The Nya and Lego soils are reddish grey weathered Savannah ochrosols [18]. The soil at Tec is defined as forest ochrosols [27], often characterized by thick subsoil. Composite samples from Nya, Tec, and Lego were collected in July 2013. The basic physicochemical properties of the studied soils are shown in Table 1. At the time of sampling, all the three sites were being cropped with maize. Each soil sample was collected from 6 to 12 points at depth (0–15cm) using a soil auger, mixed thoroughly and passed through a 2-mm sieve. They were then air-dried at ambient temperature, stored in plastic bags at temperatures below 4 °C and kept cool till analysis in Japan.

2.2 Plant Residues Sampling

Six ORs of different biochemical qualities were used in this study (Table 2). The residues were sampled from farmers’ fields at Agona Swedru (5°32′36″ N, 0°40′28″ W; 140 m a.s.l.) and Kade (6°8′48″ N, 0°53′58″ W; 170 m a.s.l.), Ghana. They are common underutilized tree/weed species or crop residues in some farming communities of Ghana (More details in [24]). Dried portions of aboveground biomass (stems, petioles, branches, petioles, vines, and leaves) were collected and finely ground (less than 0.1mm) using wonder blender (WB-1 Osaka Chemical Co., Ltd., Japan). For all ORs except Theobroma, the leaf component in the mixture was over 80%. Only dried husk was used in the case of Theobroma.

2.3. Laboratory Incubation Setup

To determine N mineralization and response of soil MBC to OR addition, subsamples of soils (80 g dry-equivalent) were weighed out into plastic Magenta boxes of dimension 7.6 × 7.6 × 10.2 cm (Magenta Corporation, Chicago, IL, USA). Each finely ground OR amendment was uniformly incorporated into each Magenta box with soil at 24 mg g−1 dry soil, a recommended field application rate for green waste–based composts [28] on 14th November 2014. The control treatment received no OR input. The experiment was set in a factorial combination of the treatments: seven ORs (including control) and three soil types. The amended soil samples were then shaken thoroughly in order to mix the plant residues uniformly. The treatments were laid out in a completely randomized design in triplicates and incubated in a phytotron under both light and dark (25 °C temperature, 70% relative humidity) conditions for 16 weeks. The lids of the boxes were regularly opened at 3–5 days interval to maintain aerobic condition during incubation. The moisture content of each container was adjusted to field capacity (pF = 1.7–2.3) at 5–7 days interval. The incubated soils were destructively sampled at 30, 60, 90, and 120 days of incubation for immediate extraction of ammonium (NH4+-N) and nitrate (NO3-N). After incubation (120 days), the remaining fresh soil was used to analyze pH, MBC, and DOC contents.

2.4. Plant Tissue and Soil Analyses

The OR quality indicators (Polyphenols (PP), total carbon (TC) and total nitrogen (TN)) were determined as explained in our previous research [24]. Each OR was initially ball milled to a powder and analyzed in three replicates for quality parameters. The TN and TC contents were determined by dry combustion with an automatic sensitive CN analyzer (Sumika Chemical Analysis Service Ltd., Osaka, Japan). The PP contents were assayed by a procedure derived from Swain and Hills [29].
Soil TC and TN contents were also quantified by dry combustion using an automatic sensitive CN analyzer (Sumika Chemical Analysis Service Ltd., Osaka, Japan). Soil pH was determined in the supernatant suspension of a 1:2.5 soil-water mixture using Beckman PKG-260 pH meter (Beckman Coulter Instruments Inc., Fullerton, USA). Particle size distribution was determined using laser diffraction particle size analyzer (SALD-2300, Shimadzu Corporation, Kyoto, Japan) after digesting 10 g of each soil sample with 100ml hydrogen peroxide. Soil moisture during incubation was determined with portable pF-meter (pF-meter 02; Daiki Rika Kogyo Co., Ltd., Saitama, Japan).
Inorganic N (NH4+-N and NO3-N) content in soil was estimated by first extracting 10 g fresh soil with 100 mL 2M KCl. The NH4+-N and NO3-N were then determined using UV–vis spectrophotometer (Shimadzu UV mini 1240, Shimadzu Corporation, Kyoto, Japan), following procedures as described by Parson et al. [30] and US EPA [31], respectively. Net inorganic N for each OR was calculated as the difference in inorganic N content between amended and unamended control soils [32]. Cumulative litter-derived inorganic N (CIN) for each soil was determined by subtracting the inorganic N of the unamended control and initial litter inorganic N content from amended soils at each sampling time [33]. The SOM per unit mass of soil was determined by loss on ignition, based on the change in weight after soil samples are exposed to 550 °C [34], in an Electric muffle furnace (FUL 230 FA, Advantech Toyo Co., Ltd, Tokyo Japan). The DOC was estimated by first extracting 20g dry weight equivalent of soil with 50 ml of 0.5 M K2SO4 [35]. The DOC in the filtrates was measured using TOC-L analyzer (TOC-L CPH, Shimadzu Corporation, Kyoto, Japan).
Soil MBC was estimated using the modified fumigation-extraction method proposed by Hobbie [36]. The subsoil samples marked for fumigation were fumigated with chloroform for 72 h while non-fumigated samples were kept frozen. Afterwards, the dissolved organic C (fumigated and non-fumigated) in 0.5 M K2SO4 extracts was analyzed with TOC-L (TOC-L CPH, Shimadzu Corporation, Kyoto, Japan). Soil MBC was estimated from the relationship MBC=C/KEC, where C is the difference in organic carbon content between fumigated and non-fumigated samples. The calibration value (KEC), estimated as 0.45 [37], was used to convert the extracted organic C to MBC.

2.5. Statistical Analyses

Data were analyzed using IBM statistics program SPSS, (SPSS Inc., Chicago, IL, version 21). The three study sites, each representing an agro-ecological zone was considered as a factor in statistical analyses. A two-way analysis of variance (ANOVA) was generated using a general linear model (GLM) to detect statistical differences among the sites and ORs amendments. Mean differences among the ORs and study sites were done using Tukey's honestly significant difference (HSD) test. Step-wise regression analysis was done using Sigma Plot program (Systat Software Inc., San Jose, CA, version 11.0) to show the relationship between OR quality on soil N mineralization and MBC contents. All statistical significance was assigned at the ρ < 0.05 level.

2.6. Nitrogen Mineralization Kinetics

The N mineralization rate in each soil was calculated using zero-order kinetics [38], as follows:
N min ( t )   =   K   ×   t   +   N min   ( 0 )
where Nmin (t) is the cumulative mineralized N in the soil at time t (days), K is the zero-order mineralization rate (day−1), and Nmin (0) is the intercept at t = 0.

3. Results

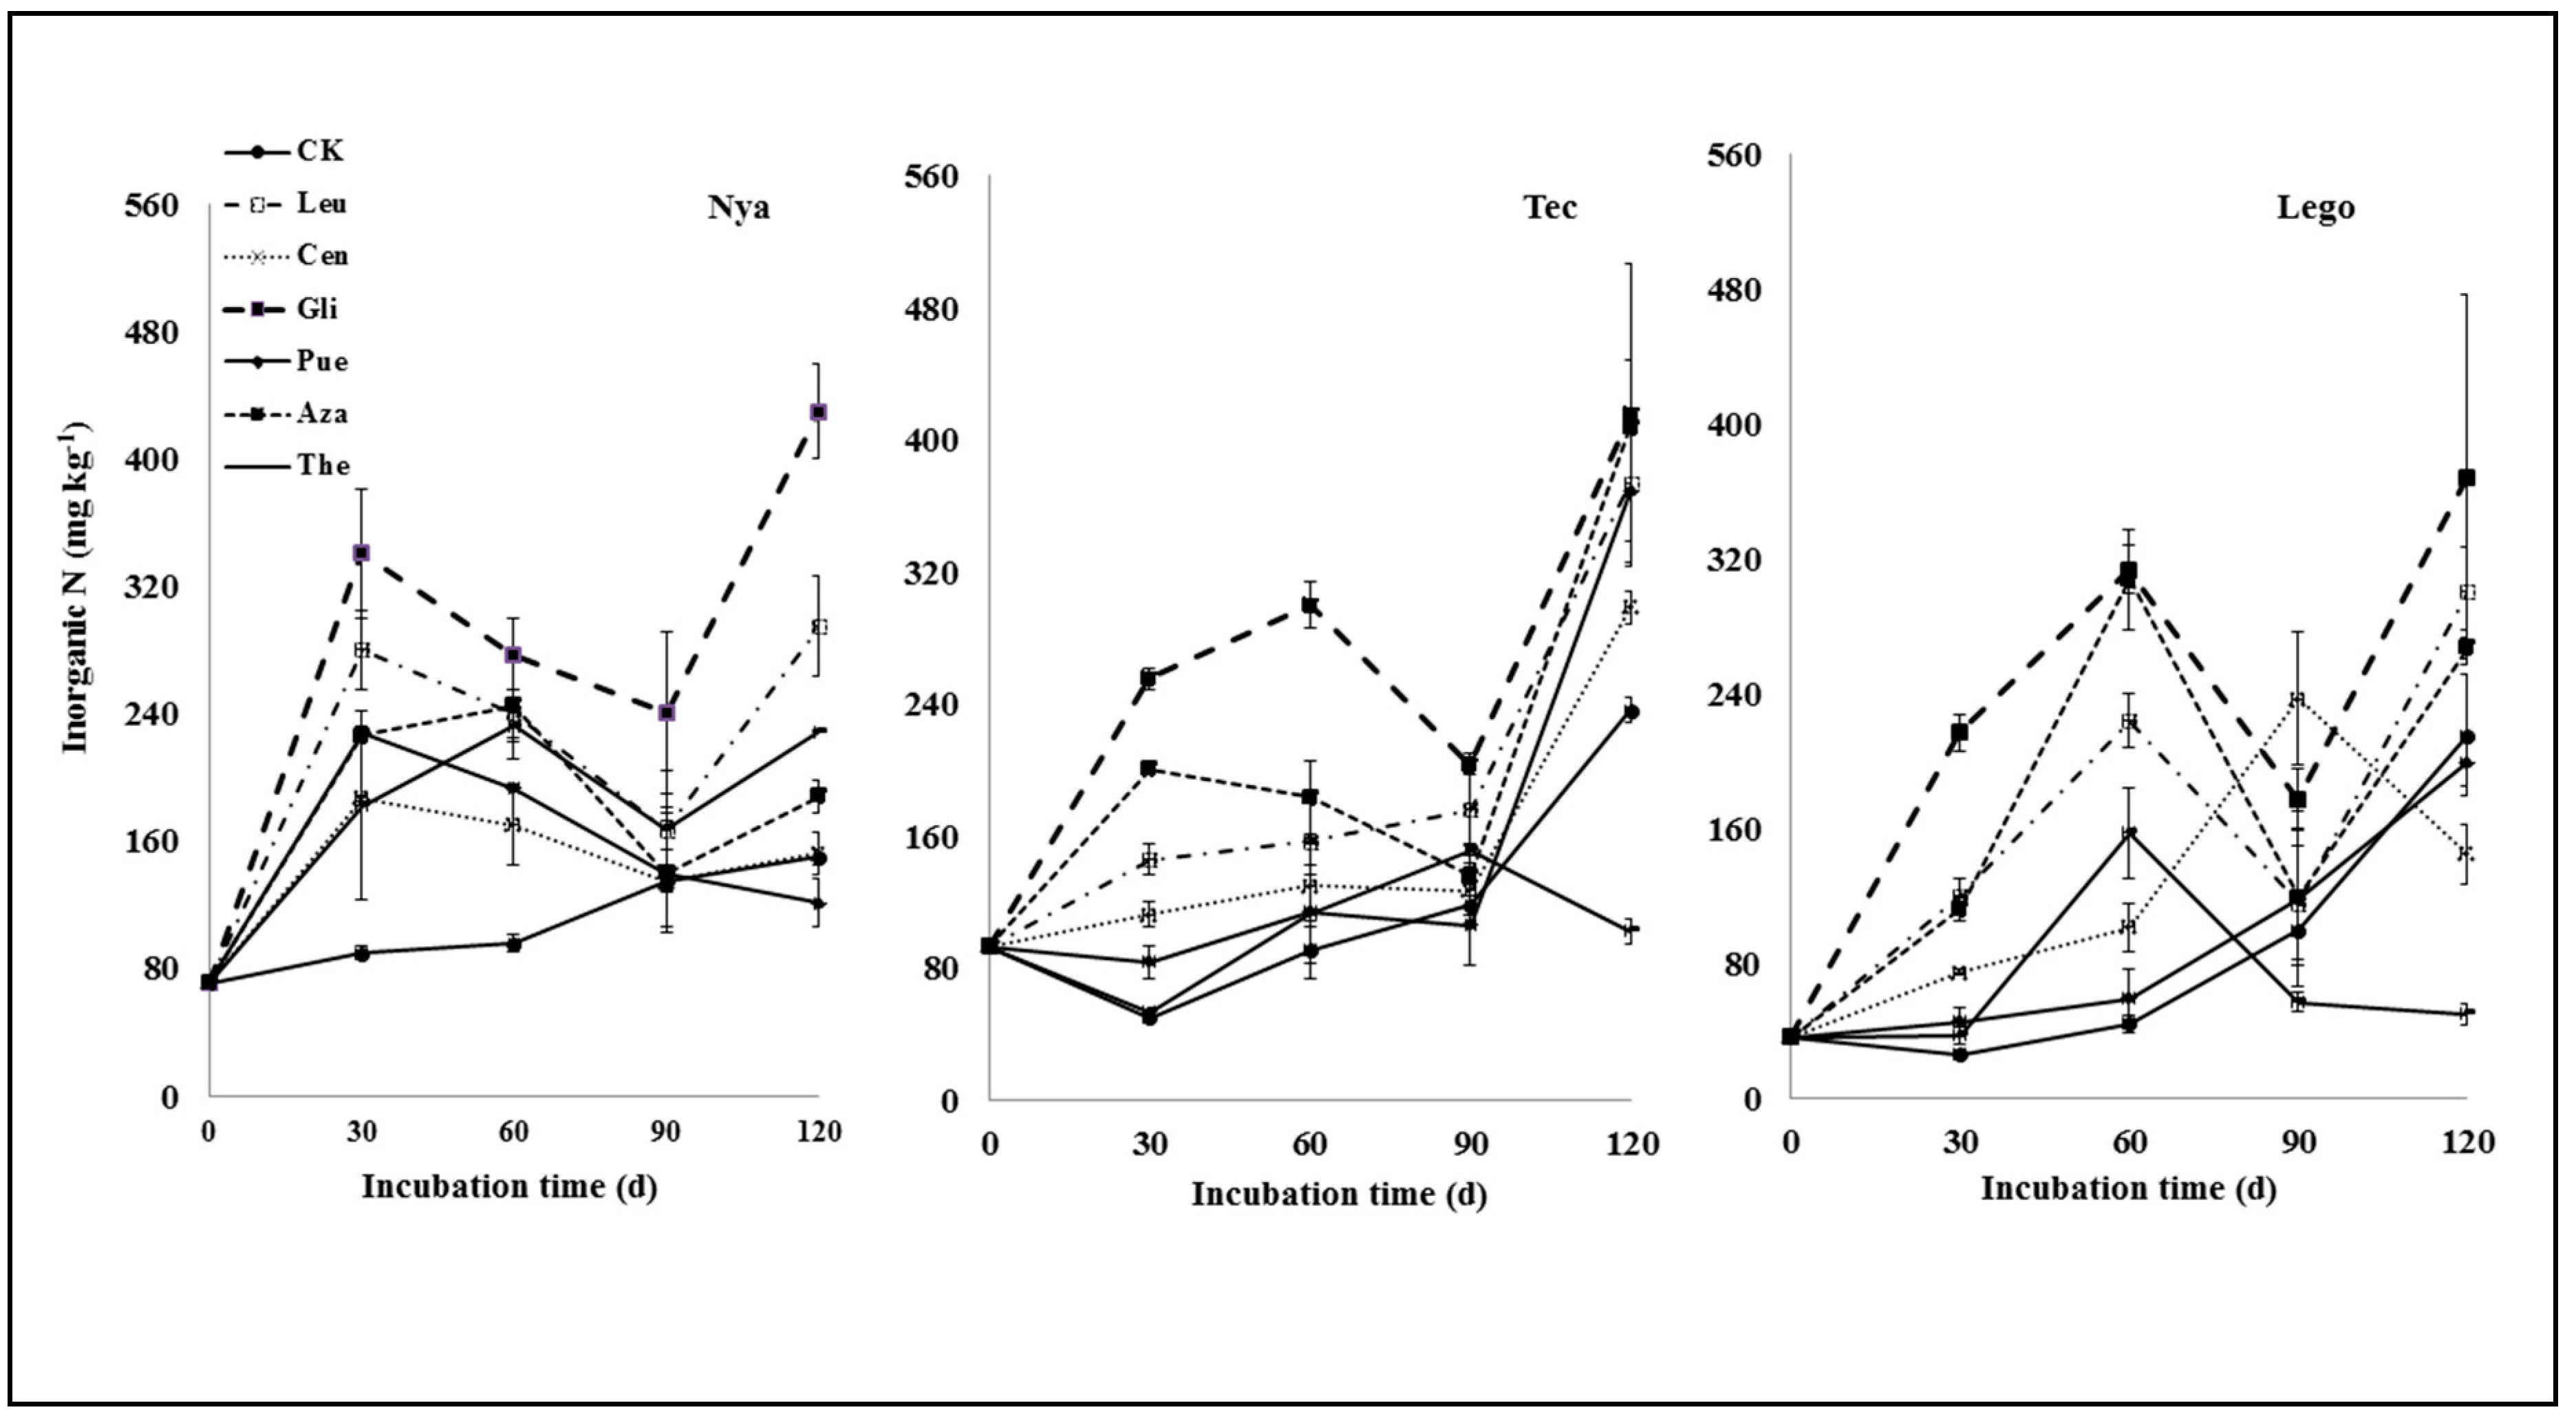
3.1. Nitrogen Mineralization

Inorganic N (NH4+-N and NO3-N) contents during the 120-day incubation varied significantly among OR type, soil and days of incubation (Figure 1, Table 3). The tested ORs exhibited both an increase and a decrease in mineral N contents during incubation. Irrespective of ORs and soil type, the highest inorganic N content was observed on day 120 while the least was on day 90 of incubation (Figure 1). However, in the unamended controls, the highest inorganic N content was observed on day 120 in all the three soils. The pattern of mineral N contents also varied among soils regardless of residue type at respective sampling dates (Figure 1). The trend was similar between Tec and Lego soils, where the highest inorganic N peaks for most treatments were at 60 and 120 days of incubation. In the case of Nya soil, a significant increase in inorganic N was observed at day 30 of incubation, followed by a reduction at day 90 in almost all treatments in all soils. For most residues, there was a significant initial increase in inorganic N content in all soils at day 30 of incubation. At the 60th day of incubation, inorganic N content in Gliricidia-amended soils in both Tec and Lego increased significantly as opposed to a decrease in Nya soil. After that, either an increase or decrease in inorganic N content took place in all soils. On day 30 after incubation, Nya soil showed the highest significant net inorganic N and was almost twice higher than Lego and Tech soils (Table 3). On day 60, the highest net inorganic N was observed in Lego soil, followed by Nya with Tec being the least. On day 90, while no significant differences in net inorganic N occurred were observed among the three soils, OR amendment at Nya and Tec yielded 15 times higher net inorganic N compared to Lego on the 120th day of incubation. While high net inorganic N content in Gliricidia amendment was consistent in all soils, the least net inorganic N varied among the soil types (Table 3). For instance, while Centrosema amendment in Nya soil showed the net lowest inorganic N contents, both Tec and Lego soils amended with Theobroma residues had the least net inorganic N. At the end of the incubation, the average inorganic N content in Gliricidia-amended soil was 272.2 mg N kg−1 in Nya soil, 253.3 mg N kg−1 in Tec soil and 222.7 mg N kg−1 in Lego soil. In contrast, the average inorganic N in control was 117.4, 108.8, and 84.4 mg N kg−1 soil in Tec, Nya and Lego soils, respectively. In Nya soil, Gliricidia amendment increased the net inorganic N to 279.5 mg N kg−1 soil compared to -29.0 mg N kg−1 soil in the Pueraria treatment at day 120 of incubation (Table 3). Moreover, the net inorganic N in Tec soil ranged from −134.3 to 179.7 mg N kg−1 soil in the Theobroma and Gliricidia treatments, respectively. Additionally, in Lego soil, Gliricidia amendment released the highest net inorganic N of 153.1 mg N kg−1 soil compared to −165.6 mg N kg−1 soil in the Theobroma treatment. There was a significant interaction between ORs and soil types on net inorganic N at all sampling times.
A zero-order mineralization kinetics equation was fitted to the total inorganic N released from each OR. The results of these calculations are summarized in Table 4. Gliricidia amendment showed the highest average N mineralization rate of 2.0 mg N kg−1 soil day−1, followed by 1.6 mg N kg−1 soil day−1 for Leucaena, and 1.3 mg N kg−1 soil day−1 for Azadirachta, with 0.5 mg N kg−1 soil day−1 being the least for Theobroma. Among the studied soils and regardless of OR type, N mineralization rate (k) was in the order; Tec > Lego > Nya. High N mineralization rate of 1.4 to 1.5 mg N kg−1 soil day−1 was observed for Lego and Tec soils, respectively and was significantly higher than that of Nya (0.8 mg N kg−1 soil day−1). However, an opposite trend in inorganic N release was observed among the soils. The highest average mineralized N at t = 0 was observed in Nya soil (127.4 mg N kg−1 soil), followed by Tec (75.0 mg N kg−1 soil) and the least was in Lego soil (48.5 mg N kg−1 soil). Moreover, significant interactions were observed between ORs and soil types on N mineralization at t = 0 and mineralization rate constant (K).

3.2. Soil pH

The results of ANOVA for soil pH, DOC and MBC are summarized in Table 5. The OR amendment during incubation resulted in an increase in soil pH compared to their respective controls in all soil types (Table 6). Among the residues and consistent in all soils, significant soil pH increase was observed in the Theobroma treatment. In contrast, the least pH values were observed in the control treatment of all soil types. Irrespective of soil type, soil pH ranged from 6.1 to 6.8 in control, and 8.1 to 9.0 in the Theobroma treatment. The mean soil pH after incubation, regardless of OR type was significantly higher in Nya soil, followed by Tec and Lego soils.

3.3 Soluble Organic Carbon and Microbial Biomass Carbon

The soil DOC and MBC contents varied significantly among the soils and OR amendments after incubation (Table 7). Soils amended with Azadirachta exhibited the highest average DOC content in almost soils with 166.4 mg kg−1 in Nya, 100.0 mg kg−1 in Tec, and 86.8 mg kg−1 in Lego, followed by Theobroma and with control being the least. The Azadirachta treatment yielded four times higher average DOC relative to the control. Among the three soils, Nya soil showed the highest significant average DOC of 113.7 mg kg−1 soil, followed by Tec with Lego being the least. The Nya soil showed twice-higher average DOC content compared to Tec and Lego soils.
About organic input quality, Pueraria-amended soil exhibited the highest MBC content among the three soil types with 862.7 mg kg−1 in Nya soil, 668.8 mg kg−1 in Tec soil and 971.6 mg kg−1 in Lego soil. Additionally, Theobroma and Centrosema treatments showed high and consistent MBC contents among the studied soil types. All other residues including the control showed high variation in soil MBC among the three soils ranging from 35.8 to 753.1 mg kg−1. Among the three soils, MBC content was significantly higher in Lego soil relative to Nya and Tec.

3.4 Relationships

Biochemical quality indicators of ORs interactively showed a significant relationship with soil pH differences among the amendments and soil types after incubation (Table 8). Similarly, TN and CN ratio of ORs positively influenced CIN content. Specifically, up to 20% and 48% variation in CIN content among the amendments and soil types were respectively explained by CN ratio and TN of ORs. Among the biochemical quality indices, CN ratio significantly influenced the differences in soil pH, CIN and N mineralization rate among the studied amendments, and soil types.
The initial soil TN, TC, CN ratio, and SOM interactively influenced differences in soil MBC and DOC contents among the amendments and soil types after incubation (Table 8). Up to 38, 54, and 61% variation in DOC contents were predicted by the initial soil TN, CN ratio, and TC contents, respectively. Additionally, sand and silt fraction accounted for up to 20–36% variation in soil DOC and MBC contents. However, none of the initial soil conditions showed any significant relationship with N mineralization. The effect of OR quality on DOC and MBC dynamics was less than the initial soil condition. In contrast, no significant interactions between OR quality and initial soil properties were detected for CIN. The mineralization rate (k) showed a significant negative correlation (r = −0.6, ρ < 0.001) with soil pH but a positive one (r = 0.6, ρ < 0.001) with CIN content after incubation (Table 9). Similarly, CIN was negatively correlated with MBC but positively related to DOC. Soil MBC demonstrated a significant negative correlation with CIN (r = −0.53, ρ < 0.05) and DOC (r = −0.48, ρ < 0.05).

4. Discussion

4.1 Nitrogen Mineralization and pH Changes in Different Soil Types

As confirmed by the net inorganic N content, different soil type and biochemically contrasting ORs showed varied effects on N mineralization (Table 3). In particular, the present study reveals differences in N mineralization potential among different soil types amended with the same ORs under same conditions. The N mineralization rate (k) was twice higher in high-SOM containing Tec soil compared to Nya (Table 4). However, the effects of OR and soil type on total inorganic N production was more pronounced in low fertile Nya soil compared to Lego and Tec withe latter having a high TN (0.26% N) and TC (0.65% C) contents. This observation may imply a short-term high inorganic N availability in low-fertile Nya soil following amendment with the present organic materials. Hence, amendment of low fertile soils with the present ORs may be more suitable for annual crops.
In accordance, Khalil et al. [39] observed enhanced C and N mineralization in soils with low C (0.75% C) and TN (0.08% N) contents. The observed high N unavailability in Tec and Lego soils, although marked by enhanced mineralization rates (Table 4), suggests the need to establish OR application thresholds based on soil inherent physicochemical composition.
In agreement with Masunga et al. [38] but inconsistent with Li et al. [40], OR amendment in the present study significantly increased CIN content in all amended soils compared to control. The present results also agree with our previous incubation study under similar conditions using depleted soils from Japan [24]. Accordingly, Gliricidia treatment with similar CN ratio as Centrosema and Pueraria showed significantly higher net inorganic N contents (Table 4), due to the large pool of labile organic N which could quickly be released into the soil solution [32]. In the same study, similar to the present report, Theobroma was classified as low-quality OR due to its significantly low inorganic N returns after 120-day incubation. The observed high mineralization rate, although applied at relatively lower rates compared to [38,41] under similar conditions is ascribed to the fine ground form of ORs in the present studies.
Biochemical quality of ORs (e.g., TN and CN ratio) exhibited consistent influence on N mineralization at all sampling times in agreement with Abbasi et al. [42], and in all cases showed a strong interaction with physicochemical soil properties. The degree to which OR quality affected N mineralization was dependent on the fertility status of soil, implying potentially distinct nutrient recoveries in inherently different soils after amendment with same materials.
Similar to previous reports [25,39], OR amendment raised the pH levels of all soils after incubation (Table 6). The OR quality characteristics were strong predictors of soil pH differences, possibly due to the alkaline nature of plant residues [43,44]. The increase in soil pH suppressed mineralization rates, availing more basic humic forms in the soil matrix. This suggests enhanced ammonification as opposed to nitrification with the subsequent release of OH- ions into soil solution [45]. High soil pH values reported for Theobroma in all soils is ascribed to its high potash content [46].
Biochemical quality of ORs exhibited a substantial effect on pH dynamics and interacted significantly with soil type. Moreover, soil fertility gradient affected pH, which was greater in the low fertile Nya soil (Table 6). In this respect, the effect of biochemical quality of ORs on pH dynamics was modulated by the current soil TC and CN ratio. Soil textural class affects SOM mineralization via decomposition [16]. However, Gregorich et al. [47] observed non-significant interactive effects of soil texture on litter decomposition in accordance with our present result. Such discrepancies may be due to the influence of ORs, which might have masked the effects of soil physicochemical properties.

4.2 Dissolved Organic Carbon and Microbial Biomass Carbon Contents in Different Soil Types

The Nya soil with low initial fertility status (Table 1), exhibited twice increase in DOC compared to Lego and Tec soils. Moreover, the soil TC and CN ratio provided the most substantial influence on the variation in DOC contents among the amendments and soil types. Thus, it can be inferred that priming of organic matter in Tec and Lego soils, influenced by their inherent soil TC and CN ratio resulted in the observed low DOC contents in both soils. This is further confirmed by the corresponding increase in mineralization rates (K) in Tec and Lego soils (Table 4). According to Zimmerman et al. [48], the magnitude and direction of priming effect following OR incorporation depend on amendment type, soil type, and the period over which measurements are made.
The SOM, though a proxy indicator of soil fertility status [3], was not a likely predictor of soil MBC in the present results. This is probably due to its composition, as the readily available C component for microbial assimilation may have been depleted in the three soils. Among the tested ORs, Azadirachta and Theobroma treatments, characterized by high CN ratio had higher DOC contents after incubation (Table 7). However, the CN ratio of ORs did not show any significant effects on the resultant differences in DOC after incubation.
The soil MBC content differed among the studied soils, with highest values in Lego soil (Table 7). The sand and silt content of soils in the present study showed a higher influence on differences in soil MBC among the amendments and soil types. The moderate sand and silt proportion in Lego soil relative to Nya and Tec were probably responsible for its observed high MBC content. However, soil DOC and MBC dynamics were not only confounded to sand and silt proportions, but significant interaction effects between OR quality factor and some soil physicochemical properties were also evident. Moreover, soil TC explained the variation in DOC content and CN ratio (61% and 54%), respectively; whereas the variation of the soil MBC was only explained by soil CN ratio (22%). This suggests variability in litter decomposition under different soils and thus implies that the effects of ORs on DOC and MBC dynamics are specific to each soil likely modulated by soil texture, TC, and CN ratio. Our current study suggests that physicochemical composition of soil regulates OR decomposition, indicating that the high DOC in low fertile Nya soil following the amendment of the present ORs was dependent upon its low chemical composition (e.g., TC, TN, CN ratio, and SOM) and texture.
The TC content of Pueraria was reasonably low, though exhibited consistent enhancement in MBC content among the three soils (Table 7). However, among the biochemical quality indicators, TC content is the only property that significantly influenced differences in soil MBC content among the amendments and soil types (Table 8). This could be ascribed to the composition of C fractions [49,50] and the coupling effects of the soil physicochemical properties, which provided energy and appropriate niche for the decomposing microflora. Increased MBC corresponded with hindered CIN and DOC amounts, although Kukal et al. [50] previously observed stimulation of soil microbial biomass and activities following organic C additions. Our present results imply temporal assimilation of inorganic N and DOC fractions by soil microbes for cellular synthesis [51]. Azadirachta, Leucaena, and Gliricidia showed a reduction in soil MBC content possibly as a result of the effects of their allelochemicals namely; azadirachtin, mimosine, and coumarin respectively, which suppressed the growth of soil microbes during incubation [52,53,54]. Their effects on soil MBC were however subdued when co-applied with chicken manure in our previous studies [24]. This suggests the possibility of exploiting the benefits of readily available allelopathic ORs when co-applied with other resources.

5. Conclusions

In 120-day controlled incubation experiment, we observed a stronger influence of soil physicochemical factors (TC, TN, CN ratio, SOM, and texture) on DOC dynamics than OR quality. Only the TC content of OR amendment as regulated by soil CN ratio and sand and silt proportion influenced differences in MBC among the soils. On the other hand, biochemical quality of ORs exhibited consistent influence on N mineralization, and pH changes and the degree of their effects was dependent upon the existing soil fertility gradient. The TN and CN ratio of ORs were strong predictors of N mineralization and soil pH dynamics.
Of the six evaluated ORs, inorganic N content was highest in Gliricidia while the lowest was in Theobroma-amended soils. Besides, the highest soil pH increase was observed in Theobroma amendment in all soil types. Soil MBC contents were low in Leucaena, Azadirachta, and Gliricidia, emphasizing the need consider the allelopathic potentials of ORs before their selection as soil amendments. The observed significant interaction between soil type and OR quality on N mineralization, DOC, and MBC dynamics presupposes varying nutrient recoveries from the ORs in each soil type. The present results revealed high N mineralization efficiency from ORs in the relatively low fertile Nya soil than in Tec and Lego soils, suggesting its suitability for annual crops. This study reiterates the need for farmers to know the initial soil properties before OR incorporation in order to meet the possibility of matching N availability with crop growth needs.

Author Contributions

R.A.O. was involved in the conceptualization, methodology, and original draft preparation; D.S.B.-K. was involved in the conceptualization, coordination, review, and editing of the manuscript; Y.F. supported with funds and resources; E.S.-A. assisted in conceptualization, review, and editing of the manuscript; K.A.S. supported during sampling, review, and editing of the manuscript; Y.O. assisted with resources and funds and was involved in coordination during the study.

Funding

This research received funding from the JSPS KAKENHI grant number 26304024.

Acknowledgments

The first author is grateful to the Ministry of Education, Culture, Sports, Science, and Technology (MEXT), Japan for the financial assistance for his doctoral program.

Conflicts of Interest

The authors declare no conflict of interest.

References

  1. Sanchez, P.A. Ecology: Soil Fertility and Hunger in Africa. Science 2002, 295, 2019–2020. [Google Scholar] [CrossRef] [PubMed]
  2. Ncube, B.; Twomlow, S.J.; Dimes, J.P.; Van Wijk, M.T.; Giller, K.E. Resource Flows, Crops and Soil Fertility Management in Smallholder Farming Systems in Semi-Arid Zimbabwe. Soil Use Manag. 2009, 25, 78–90. [Google Scholar] [CrossRef]
  3. Vanlauwe, B.; Bationo, A.; Chianu, J.; Giller, K.E.; Merckx, R.; Mokwunye, U.; Ohiokpehai, O.; Pypers, P.; Tabo, R.; Shepherd, K.D.; et al. Integrated Soil Fertility Management: Operational Definition and Consequences for Implementation and Dissemination. Outlook Agric. 2010, 39, 17–24. [Google Scholar] [CrossRef]
  4. Batjes, N.H. Soil Data Resources for Land Suitability Assessment and Environmental Protection in Central and Eastern Europe: The 1: 2,500,000 Scale SOVEUR Project. Land 2001, 5, 51–68. [Google Scholar]
  5. Moebius-Clune, B.N.; van Es, H.M.; Idowu, O.J.; Schindelbeck, R.R.; Kimetu, J.M.; Ngoze, S.; Lehmann, J.; Kinyangi, J.M. Long-Term Soil Quality Degradation along a Cultivation Chronosequence in Western Kenya. Agric. Ecosyst. Environ. 2011, 141, 86–99. [Google Scholar] [CrossRef]
  6. Heve, W.K.; Olesen, J.E.; Chirinda, N.; Adiku, S.G.K. Targeted Management of Organic Resources for Sustainably Increasing Soil Organic Carbon: Observations and Perspectives for Resource Use and Climate Adaptations in Northern Ghana. Acta Agric. Scand. Sect. B Soil Plant Sci. 2016, 66, 178–190. [Google Scholar] [CrossRef]
  7. Wood, T.N. Agricultural Development in the Northern Savannah of Ghana. Available online: https://digitalcommons.unl.edu/planthealthdoc/1/ (accessed on 10 September 2018).
  8. Omari, R.A.; Bellingrath-Kimura, S.D.; Sarkodee-Addo, E.; Oikawa, Y.; Fujii, Y. Exploring farmers’ indigenous knowledge of soil quality and fertility management practices in selected farming communities of the guinea savannah agro-ecological zone of Ghana. Sustainability 2018, 10, 1034. [Google Scholar] [CrossRef]
  9. Vanlauwe, B.; Giller, K.E. Popular Myths around Soil Fertility Management in Sub-Saharan Africa. Agric. Ecosyst. Environ. 2006, 116, 34–46. [Google Scholar] [CrossRef]
  10. Fageria, N.K.; Baligar, V.C. Ameliorating Soil Acidity of Tropical Oxisols by Liming for Sustainable Crop Production. Adv. Agron. 2008, 99, 345–399. [Google Scholar]
  11. Palm, C.A.; Gachengo, C.N.; Delve, R.J.; Cadisch, G.; Giller, K.E. Organic Inputs for Soil Fertility Management in Tropical Agro Ecosystems: Application of an Organic Resource Database. Agric. Ecosyst. Environ. 2001, 83, 27–42. [Google Scholar] [CrossRef]
  12. Kumar, K.; Goh, K.M. Nitrogen Release from Crop Residues and Organic Amendments as Affected by Biochemical Composition. Commun. Soil Sci. Plant Anal. 2003, 34, 2441–2460. [Google Scholar] [CrossRef]
  13. Bayorbor, T.B.; Addai, I.K.; Lawson, I.Y.D.; Dogbe, W.; Djabletey, D. Evaluation of some herbaceous legumes for use as green manure crops in the rain-fed rice based cropping system in northern Ghana. J. Agron. 2006, 5, 137–141. [Google Scholar]
  14. Adiku, S.G.K.; Jones, J.W.; Kumaga, F.K.; Tonyigah, A. Effects of Crop Rotation and Fallow Residue Management on Maize Growth, Yield and Soil Carbon in a Savannah-Forest Transition Zone of Ghana. J. Agric. Sci. 2009, 147, 313–322. [Google Scholar] [CrossRef]
  15. Nyalemegbe, K.K.; Asuming-Brempong, S.; Danso, S.K.A. Evaluation of Sesbania Sesban L. (Merr) and Mimosa Invisa L. (Fabaceae) as Sources of Nitrogen in Irrigated Rice on the Vertisols of the Accra Plains of Ghana. J. Ecol. Nat. Environ. 2012, 4, 88–93. [Google Scholar] [CrossRef]
  16. Amato, M.; Ladd, J.N. Decomposition of 14C-Labelled Glucose and Legume Material in Soils: Properties Influencing the Accumulation of Organic Residue C and Microbial Biomass C. Soil Biol. Biochem. 1992, 24, 455–464. [Google Scholar] [CrossRef]
  17. Mtambanengwe, F.; Mapfumo, P.; and Kirchmann, H. Decomposition of organic matter in soil as influenced by texture and pore space distribution. In Managing Nutrient Cycles to Sustain Soil Fertility in Sub-Saharan Africa; Bationo, A., Ed.; Academy Science Publishers/TSBF-CIAT: Nairobi, Kenya, 2004; pp. 261–275. [Google Scholar]
  18. Adjei-Gyapong, T.; Asiamah, R. The Interim Ghana Soil Classification System and Its Relation with the World Reference Base for Soil Resources; FAO Report on Soil Resources: Abomey, Republic of Benin, 2002; pp. 9–13. [Google Scholar]
  19. Fierer, N.; Jackson, R.B. The Diversity and Biogeography of Soil Bacterial Communities. Proc. Natl. Acad. Sci. USA 2006, 103, 626–631. [Google Scholar] [CrossRef] [PubMed]
  20. Wakelin, S.A.; Macdonald, L.M.; Rogers, S.L.; Gregg, A.L.; Bolger, T.P.; Baldock, J.A. Habitat Selective Factors Influencing the Structural Composition and Functional Capacity of Microbial Communities in Agricultural Soils. Soil Biol. Biochem. 2008, 40, 803–813. [Google Scholar] [CrossRef]
  21. Brockett, B.F.T.; Prescott, C.E.; Grayston, S.J. Soil Moisture Is the Major Factor Influencing Microbial Community Structure and Enzyme Activities across Seven Biogeoclimatic Zones in Western Canada. Soil Biol. Biochem. 2012, 44, 9–20. [Google Scholar] [CrossRef]
  22. Docherty, K.M.; Borton, H.M.; Espinosa, N.; Gebhardt, M.; Gil-Loaiza, J.; Gutknecht, J.L.M.; Maes, P.W.; Mott, B.M.; Parnell, J.J.; Purdy, G.; et al. Key Edaphic Properties Largely Explain Temporal and Geographic Variation in Soil Microbial Communities across Four Biomes. PLoS ONE 2015, 10, 1–23. [Google Scholar] [CrossRef] [PubMed]
  23. Issaka, N.R.; Mohammed, M.; Tobita, S.; Nakamura, S.; Owusu-Adjei, E. Indigenous Fertilizing Materials to Enhance Soil Productivity in Ghana. In Soil Fertility Improvement and Integrated Nutrient Management—A Global Perspective; Whalen, K.J., Ed.; InTech: Rijeka, Croatia, 2012; pp. 119–134. [Google Scholar]
  24. Omari, R.A.; Aung, H.P.; Hou, M.; Yokoyama, T.; Onwona-Agyeman, S.; Oikawa, Y.; Fujii, Y.; Bellingrath-Kimura, S.D. Influence of Different Plant Materials in Combination with Chicken Manure on Soil Carbon and Nitrogen Contents and Vegetable Yield. Pedosphere 2016, 26, 510–521. [Google Scholar] [CrossRef]
  25. Abera, G.; Wolde-meskel, E.; Bakken, L.R. Carbon and Nitrogen Mineralization Dynamics in Different Soils of the Tropics Amended with Legume Residues and Contrasting Soil Moisture Contents. Biol. Fertil. Soils 2012, 48, 51–66. [Google Scholar] [CrossRef]
  26. Austin, A.T.; Vivanco, L.; González-Arzac, A.; Pérez, L.I. There’s No Place like Home? An Exploration of the Mechanisms behind Plant Litter-Decomposer Affinity in Terrestrial Ecosystems. New Phytol. 2014, 204, 307–314. [Google Scholar] [CrossRef] [PubMed]
  27. Brammer, H. Classification of Ghanaian soils. In Agriculture and Land Use in Ghana; Wills, J.B., Ed.; Oxford University Press: London, UK, 1962; pp. 90–126. [Google Scholar]
  28. Flavel, T.C.; Murphy, D.V. Carbon and Nitrogen Mineralization Rates after Application of Organic Amendments to Soil. J. Environ. Qual. 2006, 35, 183–193. [Google Scholar] [CrossRef] [PubMed]
  29. Swain, T.; Hillis, W.E. The phenolics constituents of Prunus domestica. I. The quantitative analysis of phenolic constituents. J. Sci. Food Agr. 1959, 10, 63–68. [Google Scholar] [CrossRef]
  30. Parsons, T.R.; Maita, Y.; Lalli, C.M. A Manual of Chemical and Biological Methods for Seawater Analysis, 1st ed.; Pergamon Press: Oxford, UK, 1984; p. 173. [Google Scholar]
  31. US Environmental Protection Agency. Methods for Chemical Analysis of Water and Wastes; Environmental Protection Agency: Washington, DC, USA, 1983; p. 491.
  32. Mohanty, M.; Reddy, K.S.; Probert, M.E.; Dalal, R.C.; Rao, A.S.; Menzies, N.W. Modelling N Mineralization from Green Manure and Farmyard Manure from a Laboratory Incubation Study. Ecol. Model. 2011, 222, 719–726. [Google Scholar] [CrossRef]
  33. Sistani, K.R.; Adeli, A.; McGowen, S.L.; Tewolde, H.; Brink, G.E. Laboratory and Field Evaluation of Broiler Litter Nitrogen Mineralization. Bioresour. Technol. 2008, 99, 2603–2611. [Google Scholar] [CrossRef] [PubMed]
  34. Nelson, D.W.; Sommers, L.E. Total carbon, organic carbon and organic matter. In Methods of Soil Analyses, Part 3, Chemical Methods; Sparks, D.L., Page, A.L., Helmke, P.A., Loeppert, R.H., Eds.; Soil Science Society of America: Madison, WI, USA, 1996; pp. 961–1010. [Google Scholar]
  35. Hu, S.; Coleman, D.C.; Carroll, C.R.; Hendrix, P.F.; Beare, M.H. Labile Soil Carbon Pools in Subtropical Forest and Agricultural Ecosystems as Influenced by Management Practices and Vegetation Types. Agric. Ecosyst. Environ. 1997, 65, 69–78. [Google Scholar] [CrossRef]
  36. Hobbie, S.E. Chloroform Fumigation Direct Extraction (CFDE) Protocol for Microbial Biomass Carbon and Nitrogen. Available online: https://web.stanford.edu/group/Vitousek/chlorofume.html (accessed on 10 September 2018).
  37. Joergensen, R.G. The fumigation-extraction method to estimate soil microbial biomass: Calibration of the KEC factor. Soil Biol. Biochem. 1996, 28, 25–31. [Google Scholar] [CrossRef]
  38. Masunga, R.H.; Uzokwe, V.N.; Mlay, P.D.; Odeh, I.; Singh, A.; Buchan, D.; De Neve, S. Nitrogen Mineralization Dynamics of Different Valuable Organic Amendments Commonly Used in Agriculture. Appl. Soil Ecol. 2016, 101, 185–193. [Google Scholar] [CrossRef]
  39. Khalil, M.I.; Hossain, M.B.; Schmidhalter, U. Carbon and Nitrogen Mineralization in Different Upland Soils of the Subtropics Treated with Organic Materials. Soil Biol. Biochem. 2005, 37, 1507–1518. [Google Scholar] [CrossRef]
  40. Li, L.J.; Han, X.Z.; You, M.Y.; Yuan, Y.R.; Ding, X.L.; Qiao, Y.F. Carbon and Nitrogen Mineralization Patterns of Two Contrasting Crop Residues in a Mollisol: Effects of Residue Type and Placement in Soils. Eur. J. Soil Biol. 2013, 54, 1–6. [Google Scholar] [CrossRef]
  41. De Neve, S.; Hofman, G. Influence of Soil Compaction on Carbon and Nitrogen Mineralization of Soil Organic Matter and Crop Residues. Biol. Fertil. Soils. 2000, 30, 544–549. [Google Scholar] [CrossRef]
  42. Kaleem Abbasi, M.; Mahmood Tahir, M.; Sabir, N.; Khurshid, M. Impact of the Addition of Different Plant Residues on Nitrogen Mineralization-Immobilization Turnover and Carbon Content of a Soil Incubated under Laboratory Conditions. Solid Earth 2015, 6, 197–205. [Google Scholar] [CrossRef]
  43. Paul, K.I.; Black, A.S.; Conyers, M.K. Effect of Plant Residue Return on the Development of Surface Soil pH Gradients. Biol. Fertil. Soils. 2001, 33, 75–82. [Google Scholar] [CrossRef]
  44. Sakala, G.M.; Rowell, D.L.; Pilbeam, C.J. Acid-Base Reactions between an Acidic Soil and Plant Residues. Geoderma 2004, 123, 219–232. [Google Scholar] [CrossRef]
  45. Xu, J.M.; Tang, C.; Chen, Z.L. The Role of Plant Residues in pH Change of Acid Soils Differing in Initial pH. Soil Biol. Biochem. 2006, 38, 709–719. [Google Scholar] [CrossRef]
  46. Ofori-Boateng, C.; Lee, K.T. The Potential of Using Cocoa Pod Husks as Green Solid Base Catalysts for the Transesterification of Soybean Oil into Biodiesel: Effects of Biodiesel on Engine Performance. Chem. Eng. J. 2013, 220, 395–401. [Google Scholar] [CrossRef]
  47. Gregorich, E.G.; Voroney, P.; Kachanoski, R.G. Turnover of Carbon through the Microbial Biomass in Soils with Different Textures. Soil Biol. Biochem. 1991, 23, 1–3. [Google Scholar] [CrossRef]
  48. Zimmerman, A.R.; Gao, B.; Ahn, M.Y. Positive and Negative Carbon Mineralization Priming Effects among a Variety of Biochar-Amended Soils. Soil Biol. Biochem. 2011, 43, 1169–1179. [Google Scholar] [CrossRef]
  49. Mandal, B.; Majumder, B.; Bandyopadhyay, P.K.; Hazra, G.C.; Gangopadhyay, A.; Samantaray, R.N.; Mishra, A.K.; Chaudhury, J.; Saha, M.N.; Kundu, S. The Potential of Cropping Systems and Soil Amendments for Carbon Sequestration in Soils under Long-Term Experiments in Subtropical India. Glob. Chang. Biol. 2007, 13, 357–369. [Google Scholar] [CrossRef]
  50. Kukal, S.S.; Rehana-Rasool; Benbi, D.K. Soil Organic Carbon Sequestration in Relation to Organic and Inorganic Fertilization in Rice-Wheat and Maize-Wheat Systems. Soil Tillage Res. 2009, 102, 87–92. [Google Scholar] [CrossRef]
  51. Diacono, M.; Montemurro, F. Long-Term Effects of Organic Amendments on Soil Fertility. A Review. Agron. Sustain. Dev. 2010, 30, 401–422. [Google Scholar] [CrossRef]
  52. Saber, M.; Hejazi, M.J.; Hassan, A.S. Effects of azadirachtin/neemazal on different stages and adult life table parameters of Trichogramma cacoeciae (Hymenoptera: Trichogrammatidae). J. Econ. Entomol. 2004, 97, 905–910. [Google Scholar] [CrossRef] [PubMed]
  53. Xuan, T.D.; Elzaawely, A.A.; Deba, F.; Fukuta, M.; Tawata, S. Mimosine in Leucaena as a Potent Bio-Herbicide. Agron. Sustain. Dev. 2006, 26, 89–97. [Google Scholar] [CrossRef]
  54. Takemura, T.; Kamo, T.; Sakuno, E.; Hiradate, S.; Fujii, Y. Discovery of Coumarin as the Predominant Allelochemical in Gliricidia sepium. J. Trop. Sci. 2013, 25, 268–272. [Google Scholar]
Figure 1. Inorganic N content of contrasting crop residues in three soil types over 120 days incubation. The following crop residues were tested: CK: control, Leu: Leucaena, Cen: Centrosema, Gli: Gliricidia, Pue: Pueraria, Aza: Azadirachta, The: Theobroma. Nya: Nyankpala, Tec: Techiman, Leg: Lego Error bars show the standard deviation of three replications.
Soilsystems 02 00063 g001
Table 1. Physicochemical properties of the studied soils.
Soil ParameterNyaTecLego
Sand (g kg−1)790750340
Silt (g kg−1)180130590
Clay (g kg−1)3012070
Total C (g kg−1)3.2 ± 0.06.6 ± 0.27.2 ± 0.1
Total N (g kg−1)1.8 ± 0.12.6 ± 0.12.3 ± 0.0
CN ratio1.82.53.2
NO3 (mg N kg−1)57.8 ± 0.581.3 ± 0.218.8 ± 1.3
NH4 (mg N kg−1)13.5 ± 0.011.3 ± 0.217.8 ± 0.1
SOM (%)0.72.11.7
DOC (mg C kg−1)47.4 ± 0.245.9 ± 0.061.6 ± 0.4
pH (1:2 H2O)6.17.16.0
The error bar indicates the standard deviation of three replicates. SOM: Soil organic matter, DOC: Dissolved organic carbon.
Table 2. Chemical quality composition of the organic residues.
Organic ResiduesTC
(g kg−1)
TN
(g kg−1)
CN
Ratio
PP
(mg GAE g−1)
Leucaena
Leucaena leucocephala
463.8 ± 21.7 ab41.1 ± 1.3 a1111.6 ± 1.8 b
Centrosema
Centrosema pubescence
443.3 ± 8.0 bcd35.2 ± 0.8 b132.6 ± 0.1 e
Gliricidia
Gliricidia sepium
446.2 ± 8.8 abc30.7 ± 0.9 c158.8 ± 0.4 c
Pueraria
Pueraria phaseoloides
415.1 ± 8.9 d24.4 ± 0.9 d174.4 ± 0.2 d
Azadirachta
Azadirachta indica
467.9 ± 2.5 a24.5 ± 0.4 d1917.1 ± 1.8 a
Theobroma
Theobroma cacao
423.9 ± 15.0 cd10.8 ± 0.3 e391.6 ± 0.0 e
LSD0.0530.82.1 1.6
p-value0.002**0.01** 0.01**
TC: total carbon, TN: total nitrogen, CN ratio: carbon-to-nitrogen ratio, PP: polyphenol. Values are the means of three replicates. Means with different letters in the same column are significantly different from each other according to Tukey test at p < 0.05 probability level. Significance levels: ns: p > 0.05, *: p < 0.05, **: p < 0.01.
Table 3. Net inorganic N content (NH4+-N & NO3-N (mg N kg−1)) at successive incubation days in three different soil types amended with contrasting ORs.
OR/ST Days of Incubation
30D60D90D120D
NyaTecLegoNyaTecLegoNyaTecLegoNyaTecLego
Leucaena190.5 ± 25.7 ab95.9 ± 10.8 c94.4 ± 4.8 b144.7 ± 18.6 ab65.9 ± 17.5 b179.5 ± 12.6 b32.1 ± 12.2 ab57.8 ± 26.3ab16.3 ± 13.2 bc144.7 ± 36.5 b137.6 ± 30.1 a84.8 ± 63.4 ab
Centrosema97.3 ± 7.3 bc62.5 ± 7.8 d48.7 ± 0.9 c74.8 ± 31.7 c39.2 ± 8.8 b57.0 ± 20.2cd−0.6 ± 9.3 b8.9 ± 8.7 cd137.2 ± 55.7 a2.3 ± 7.5 de62.3 ± 7.4 a−70.7 ± 56.1 cd
Gliricidia251.0 ± 36.9 a205.4 ± 5.1 a190.9 ± 16.2 a181.5 ± 14.0 a209.2 ± 32.8a269.7 ± 24.2 a105.2 ± 64.9 a85.4 ± 10.4a77.7 ± 22.2 ab279.5 ± 25.5a179.7 ± 86.8 a153.1 ± 118.5 a
Pueraria137.7 ± 7.7 bc33.6 ± 6.9 e19.3 ± 9.4 d97.3 ± 5.0 bc23.1 ± 4.2 b14.7 ± 23.8 d4. 9 ± 15.7 b−12.0 ± 18.5d18.5 ± 26.5 bc−29.0 ± 4.7 e132.5 ± 52.5 a−16.1 ± 12.5 bc
Azadirachta136.6 ± 6.5 bc150.5 ± 5.5 b86.0 ± 5.9 b149.8 ± 24.3 ab92.4 ± 46.9 b263.6 ± 30.4 a4.4 ± 13.7 b17.4 ± 14.9bcd19.7 ± 22.8 bc38.2 ± 2.0 dc171.3 ± 39.8 a51.8 ± 42.1 abc
Theobroma92.4 ± 74.0 c3.3 ± 0.6 f11.1 ± 5.1 d136.6 ± 7.4 ab21.8 ± 12.9 b113.3 ± 21.6 bc32.5 ± 14.6 ab33.6 ± 3.9 bc−42.6 ± 22.9 c78. 8 ± 10.9c−134.3 ± 3.9 b−165.6 ± 31.0 d
Mean129.4 A78.7 B64.3 B112.1 B64.5 C128.3 A25.5 A27.3 A32.4 A73.5 A78.5 A5.3 B
p-value (ST)<0.01<0.01 0.74 ns<0.01
p-value (OR)<0.03<0.01<0.01<0.03<0.01<0.01<0.04<0.03<0.021<0.01<0.01<0.01
ST x OR<0.02<0.01<0.01<0.01
OR: Organic residue, ST: Soil type, Nya: Nyankpala, Tec: Techiman, Leg: Lego. 30D, 60D, 90D and 120D represent 30, 60, 90 and 120 days after residue amendment to the soil. Values are the means of three replicates. Means with different are significantly different from each other according to Tukey test at p < 0.05 probability level. Small letters (a, b, c) represent mean difference among OR treatments and capital letters (A, B, C) represent mean difference among STs. Significance levels: ns: p > 0.05, *: p < 0.05, **: p < 0.01.
Table 4. Nitrogen mineralization and rate constant in three different soil types following amendments with contrasting ORs.
OR/STMineralization at t = 0 (intercept)
(mg N kg−1 soil )
Mineralization rate at (K) (at 25 °C)
(mg N kg−1 soil day−1)
R2
NyaTecLegoNyaTecLegoNyaTecLego
Control67.9 ± 1.6 b46.3 ± 1.3 cd−1.9 ± 5.7 d0.7 ± 0.1cd1.2 ± 0.1 bc1.4 ± 0.3 a0.90.60.8
Leucaena144.1 ± 3.0 a70.3 ± 8.9 bc54.8 ± 4.7 b1.1 ± 0.2 b2.0 ± 0.3 a1.7 ± 0.2 a0.30.80.6
Centrosema121.4 ± 7.5 a66.7 ± 2.9 bcd43.2 ± 2.5 bc0.4 ± 0.1 de1.4 ± 0.1 ab1.3 ± 0.2 a0.20.70.6
Gliricidia148.7 ± 11.2 a134.4 ± 24.9 a97.8 ± 28.8 a2.1 ± 0.1 a2.0 ± 0.6 a2.1 ± 0.8 a0.50.60.6
Pueraria148.3 ± 3.9 a37.9 ± 10.4 c12.0 ± 4.3 cd0.1 ± 0.2 e1.9 ± 0.3 a1.3 ± 0.1 a0.10.60.9
Azadirachta144.7 ± 7.8 a90.7 ± 5.9 b74.9 ± 6.8 ab0.5 ± 0.1 d1.9 ± 0.2 a1.6 ± 0.2 a0.10.50.4
Theobroma116.4 ± 27.4 a78.9 ± 3.9 b58.3 ± 4.8 b1.0 ± 0.3 bc0.4 ± 0.1 c0.2 ± 0.0 b0.50.30.1
Mean127.4 A75.0 B48.5 C0.8 B1.5 A1.4 A
p-value (ST)<0.01<0.01
p-value (OR)<0.01<0.01<0.01<0.01<0.01<0.01
ST x OR<0.01<0.01
OR: Organic residue, ST: Soil type, Nya: Nyankpala, Tec: Techiman, Leg: Lego. Values are the means of three replicates. Means with different are significantly different from each other according to Tukey test at p < 0.05 probability level. Small letters (a, b, c) represent mean difference among OR treatments and capital letters (A, B, C) represent mean difference among STs. Significance levels: ns: p > 0.05, *: p < 0.05, **: p < 0.01.
Table 5. Summary of the analysis of variance for soil pH, soil DOC, and soil microbial biomass C following amendment of seven contrasting residues in three soil types.
SOVDFpH DOC
(mg C kg−1)
MBC
(mg C kg−1)
Means of Squaresp-ValueMeans of Squaresp-ValueMeans of Squaresp-Level
Site24.0**18,359.9**579,554.8**
OR64.2**7,032.1**198,137.2**
Site x OR120.05**1449.8**101,523.8**
Error400.00 25.6 108.3
Total60
R2 0.9 0.9 0.9
Significance levels: ns: p > 0.05, *: p < 0.05, **: p < 0.01. SOV: Source of variation, MBC: microbial biomass C, DOC: Dissolved organic carbon.
Table 6. Effect of contrasting organic residues on soil pH after 120 days of incubation.
OR/STSoil pH
NyaTecLego
Control6.8 ± 0.01 e6.4 ± 0.02 f6.1 ± 0.01 g
Leucaena7.3 ± 0.01 d6.9 ± 0.01 d6.3 ± 0.01 f
Centrosema7.5 ± 0.02 c7.0 ± 0.01 c6.8 ± 0.01 b
Gliricidia7.5 ± 0.02 c6.9 ± 0.02 d6.7 ± 0.01 c
Pueraria7.9 ± 0.01 b7.1 ± 0.01 b6.6 ± 0.01 d
Azadirachta7.3 ± 0.02 d6.8 ± 0.01 e6.5 ± 0.01 e
Theobroma9.0 ± 0.01 a8.7 ± 0.01 a8.1 ± 0.01 a
Mean7.6 A7.1 B6.8 C
p-value (ST)<0.01<0.01<0.01
p-value (OR)<0.01<0.01<0.01
ST x OR<0.01<0.01<0.01
OR: Organic residue, ST: Soil type, Nya: Nyankpala, Tec: Techiman, Leg: Lego. Values are the means of three replicates. Means with different are significantly different from each other according to Tukey test at p < 0.05 probability level. Small letters (a, b, c) represent mean difference among OR treatments and capital letters (A, B, C) represent mean difference among STs. Significance levels: ns: p > 0.05, *: p < 0.05, **: p < 0.01.
Table 7. Soil organic C and microbial biomass C (mg C kg−1) of three different soil types amended with contrasting organic residues after 120-day incubation.
OR/STDOC (mg C kg−1) MBC (mg C kg−1)
NyaTecLegoMeanNyaTecLegoMean
Control34.0 ± 1.4 g18.6 ± 0.3 e32.1 ± 0.1 f28.2686.3 ± 4.8 b594.9 ± 17.9 b677.2 ± 8.6 f652.8
Leucaena133.8 ± 1.6 c64.8 ± 0.3 c67.8 ± 0.7 c88.865.4 ± 13.3 e648.9 ± 8.0 a714.3 ± 15.3 e476.2
Centrosema91.6 ± 0.5 f59.3 ± 0.2 d52.4 ± 1.4 d67.8565.2 ± 10.9 c563.8 ± 9.6 c890.7 ± 18.1 b673.3
Gliricidia101.4 ± 0.3 d94.6 ± 0.6 b74.3 ± 0.3 b90.1572.6 ± 10.6 c224.8 ± 2.5 d753.1 ± 17.7 d516.8
Pueraria98.5 ± 0.1 e64.7 ± 0.3 c53.3 ± 0.1 d72.2862.7 ± 33.3 a668.8 ± 12.0 a971.6 ± 16.3 a834.3
Azadirachta166.4 ± 0.1 b100.0 ± 1.1 a86.8 ± 0.4 a117.7427.7 ± 14.6 d35.8 ± 0.3 e734.7 ± 12.3 de399.4
Theobroma170.1 ± 0.7 a65.1 ± 2.4 c47.0 ± 0.4 e94.1658.8 ± 7.6 b584.8 ± 7.2 bc802.2 ± 20.7 c681.9
Mean113.7 A66.7 B59.1 C 548.4 B474.5 C791.7 A
p-value (ST)<0.01 <0.01
p-value(OR)<0.01 <0.01<0.01 <0.01 <0.01<0.01
ST x OR<0.01 <0.01
OR: Organic residue, ST: Soil type, Nya: Nyankpala, Tec: Techiman, Leg: Lego. MBC: Microbial biomass carbon, DOC: Dissolved organic carbon. Values are the means of three replicates. Means with different are significantly different from each other according to Tukey test at p < 0.05 probability level. Small letters (a, b, c) represent mean difference among OR treatments and capital letters (A, B, C) represent mean difference among STs. Significance levels: ns: p > 0.05, *: p < 0.05, **: p < 0.01.
Table 8. Regression analysis (R2) between initial soil properties and organic residue qualities on the resultant soil properties after 120 days incubation of different soils with contrasting organic residues (n = 18).
Parameter Resultant soil property
Organic Residue QualityMBCDOCpHCINK
TC0.21* (−5.4)0.02ns0.21* (−0.02)0.12ns0.05ns
TN0.01ns0.04ns0.44** (−0.05)0.48* (8.5)0.14ns
CN ratio0.01ns0.02ns0.79** (0.06)0.20* (−11.6)0.22* (−0.03)
PP0.08ns0.03ns0.20* (−0.06)0.11ns0.02ns
Interaction (TC x TN x CN ratio x PP) (A)nsns**nsns
Initial soil property
TN0.01ns0.38* (−66.8)0.09ns0.02ns0.20ns
TC0.08ns0.61** (−15.9)0.24* (−0.2)0.09ns0.17ns
CN ratio0.22* (200.5)0.54** (−45.2)0.26* (−0.6)0.12ns0.09ns
SOM0.06ns0.21* (−27.4)0.03ns0.00ns0.17ns
Interaction (TC x TN x CN ratio x SOM) (B)***nsnsns
Soil texture
Sand0.34* (−7.3)0.30* (0.9)0.20* (0.01)0.11ns0.02ns
Silt0.36* (7.5)0.20* (−0.7)0.15ns0.09ns0.002ns
Clay0.02ns0.32* (−5.5)0.07ns0.01ns0.20* (0.08)
Interaction (sand x silt x clay) (C)***nsnsns
Interaction (A*B*C)*****NSNS
TC: total carbon, TN: total nitrogen, CN ratio: carbon-to-nitrogen ratio, PP: polyphenol, MBC: microbial biomass C, DOC: Dissolved organic carbon, CIN: Cumulative inorganic N, SOM: Soil organic matter, K: mineralization rate constant. Significance levels: ns: p > 0.05, *: p < 0.05, **: p < 0.01. Values in each bracket are the slope coefficients for each combination.
Table 9. Pearson correlation coefficient (r) for the linear interrelationships among soil properties after 120-day incubation following amendment with contrasting organic residues (n = 18)
Parameter KCINDOCMBCpH
K
CIN0.63**
DOC−0.17ns0.44*
MBC −0.20ns−0.53*−0.48*
pH−0.63**−0.26ns0.37ns0.04ns
MBC: microbial biomass carbon, DOC: Dissolved organic carbon, CIN: cumulative inorganic N, K: Mineralization rate constant. Significance levels: ns: p > 0.05, *: p < 0.05, **: p < 0.01.

