Article

Critical Decline of Earthworms from Organic Origins under Intensive, Humic SOM-Depleting Agriculture

1
VermEcology, 101 Suidomichi, Nogeyama, Yokohama-shi, Kanagawa-ken 231-0064, Japan
2
C/- Kanagawa Prefectural Museum of Natural History, Odawara, Kanagawa-ken 247-0007, Japan
Soil Syst. 2018, 2(2), 33; https://doi.org/10.3390/soilsystems2020033
Submission received: 15 February 2018 / Revised: 22 March 2018 / Accepted: 18 May 2018 / Published: 1 June 2018

Abstract

:
In view of recent reports of critical declines of microbes, plants, insects and other invertebrates, birds and other vertebrates, the situation pertaining to neglected earthworms was investigated. Entomological reports found the probable cause of general loss was lack of recruitment from surrounding fields (except for pest species). Earthworm decline under agricultural intensification compared to organic fertilizing is herein charted from several long-term agronomic trials, some operational >170 years. Relative biomass losses of –50–100% (with a mean of –83.3 %) match or exceed those reported for other faunal groups, thus earthworms are conclusively shown to be similarly depleted from their optima in agrichemical fields. Concomitant mean loss of SOC/SOM humus is –56.8% and soil moisture is reduced by –22.3%. Organic farming lessens humic degradation and topsoil erosion, conserves essential soil moisture and biota, and produces equivalent or higher crop and pasture yields (on average +17.8% in this study) at lower cost. Loss of earthworms adds weight for rational re-evaluation of viable means for food production compatible with environmental conservation (agroecology), hence various interlinked benefits of organic husbandry in terms of yields, soil restoration, biodiversity and economics are briefly discussed. Persistence with failing chemical agriculture makes neither ecological nor economic sense.

1. Introduction

In 2017 a startling study from Germany reported around 80 percent decline of total flying insect biomass from protected nature reserves in just 27 years (1989–2014) [1]. The authors attributed the plausible cause of this major and hitherto unrecognized loss of insects to “agricultural intensification” in surrounding areas. They noted few similar studies citing just one previous report from Rothamsted Insect Survey (RIS) that plotted a decline over a 30 year period (1973–2002) in one of four UK sites [2]. This UK report noted rapid agricultural intensification from the 1950s and suspected that three stable sites—having much lower biomass and this mainly of insect pest species—had already collapsed before monitoring commenced in the 1970s. This situation is characteristic of a broader and critical extinction issue [3,4]. Authors of a global review (Rockström et al. 2009) [5] identified both “rate of biodiversity loss” and synthetic fertilizer overuse as the most severe and pressing of global problems, more so than climate change, solutions for which they suggest as an immediate 25% reduction in N fertilizers and: “Agricultural systems that better mimic natural processes (e.g., complex agro-ecosystems)”. A good measure of proper ecological functioning of such systems is past and current status of soil fauna, in particular earthworms (Oligochaeta: Megadrilacea)—the subjects of this report—that both monitor and mediate natural soil processes.
While comprehensive summaries of earthworm ecology, their role in humic SOM (soil organic matter) formation, and absolute population values are available following Darwin (1881) [6,7,8], comparative information is quite limited such that a recent meta-analysis of soil biodiversity under organic farming [9] entirely excluded earthworms “due to small sample sizes (n < 5).”
The present article is a quantitative re-analysis of the scant historical data on earthworm biomass from long-term studies in an attempt to derive similar starting references as in the two insect biomass reports. However, earthworm survey results often differ considerably depending upon soil, season, or sampling method, thus relative or relational findings are required. In lieu of consistent historical records, comparative sites that have not undergone extreme agricultural intensification are sought to provide de facto control metrics. Irregular earthworm surveys have been conducted at Sir John Lawes’ Rothamsted Research Station, the earliest established and longest-running Long-Term Experiment (LTE) facility to test agronomic effects of agricultural chemicals, with various levels of controls, during its 175 year operation since 1843. Reports of soil faunal surveys at Rothamsted conducted between 1921 and 2014 are available [10,11,12,13,14]. Another set of earthworm data [15,16,17] of intensified versus organic soil management is from Lady Eve Balfour’s Haughley Experiment that ran for more than forty years from 1939 to 1984 [18,19]. Other comparable earthworm data are from the Swiss FiBL DOK agronomic field trials that have been operational for almost forty years, since 1978, on land that, as for parts of the other two sites, was originally pasture grassland [20,21].
The a priori assumption in the current study is that the non-intensified plots or sections of these facilities would support an earthworm fauna not dissimilar in composition and scale to those present before agrichemical intensification. The chemical fields or plots typically represent contemporary management regimes but, prior to this, Rothamsted estate and Haughley farm have heritage from Roman times (about two millennia ago) or subsequent Anglo-Saxon settlement (about 1500 years ago), respectively. To forestall the obvious argument that Rothamsted plots with zero fertilizer application are a better control check, it is certain that no current nor historical farmer would consider such an unproductive operation. However, when available, nil fertilizer data are included for the sake of thoroughness.
Rothamsted’s Broadbalk arable, Barnfield roots and Park Grass pasture experiments—begun in 1843 (or 1839?), 1843 and 1856, respectively—are the world’s oldest operational ecological experiments; before this Broadbalk is thought to have been in arable cropping since at least 1623 and Park Grass similarly under pasture for many centuries [22]. Regarding statistical reliability of long-term studies, it is unrealistic and impossible to wholly replicate such unique sites as chemical Rothamsted or organic Haughley without great commitment in time and investment in funds, nevertheless their insightful findings provide most useful scientific indicators [23,24].
Whilst giving no account of Haughley’s resident populations, estimated numbers of earthworms in the soils of the Rothamsted Experimental Station were quoted by Balfour (1948: 203) [25] as roughly 8.6, 2.8 and 0.5 million worms per acre in grassland, manured arable and unmanured land, and she also noted that both earthworms and fungi appear particularly sensitive to sulphate of ammonia fertilizer. Her information was seemingly based upon studies by earlier workers: Morris (1922: 303) [10] gave Rothamsted’s Broadbalk earthworm counts of about one million in manured arable plots and 0.46 million per acre in nil “control” plots (equivalent to 250 m2 and 113 m2 or a decline of about –55%). More in-depth surveys for Barnfield recorded starker loss of invertebrates and for earthworms alone declines up to –100% (Morris 1927: Table 1; Figures 1 and 3) [11]. These data are summarized in Table 1.
Thus, 80 years since introduction of the world’s first synthetic fertilizer at Rothamsted, deleterious soil effects were so severe that remedial reversions to traditional management methods (e.g., liming or marling and crop-ley or fallow rotations) were required [12,22].
The present analysis reasonably compares such historical surveys to most recent studies from the same and from similar agronomic sites and concludes that, as with the insects, the earthworms too remain in jeopardy.

2. Methods

For flying insects, recent Rothamsted RIS data [2] as quoted by the German study [1] are normalized (untransformed) for better comparison with these latest German findings, and the historical soil invertebrate surveys at Rothamsted [10,11,12] are re-evaluated.
Earthworm data from field surveys by various authors are re-analyzed as comparative data for intensified (i.e., synthetic agrichemical) versus non-intensified (i.e., organic) farm soils. Rothamsted surveys are of Broadbalk, Park Grass and Barnfield long-term trial sites [10,11,12,13,14,22] (Figure 1, Figure 2 and Figure 3).
From 1939, Haughley farm in Suffolk, UK was divided into three (with approval of Rothamsted researchers) comprising self-contained Organic, Mixed and Stockless non-organic sections [16,18] as shown in Figure 4.
The Swiss FiBL-DOK trial [for bio-dynamic (D), organic (O) and conventional (K from German: “konventionell”)] has several treatment combinations but, for comparison to these other two LTE sites, only survey data from their Organic, Mixed and Conventional wheat crops [20,21] are considered.
As tropical organic reports are particularly scarce, a recent Philippines eco-taxonomic earthworm study on organic paddy rice and broad-acre sugarcane is included [17] for comparison.
The premise for survey review is that, firstly, the organically fertilized plots best preserve the soil situation more typical of the prevailing management before agricultural intensification and thus represent the probable starting condition of earthworm (and other invertebrate) populations from earlier times. Therefore, the continuous organically fertilized Broadbalk or Barnfield arable and Park Grass pasture sites that are thought to have been so for prior centuries at Rothamsted, as with the 1000 year-old “Saxon” permanent pastures at Haughley, best represent the antecedent state prior to cultivation and/or synthetic fertilization. Secondly, any crop, soil, plant or soil biota changes are reasonably assumed to be due to the cumulative agronomic management effects. Thirdly, any geological, seasonal or sampling variables are nullified by simultaneity and sympatric proximity using the same method of earthworm extraction per site and per author.
Whereas most other reports give misconstrued values as open-ended percentage increases from the lowest biodiversity figure, the present study—possibly uniquely—measures relative changes from assumed optimal starting points giving statistical changes (declines ranging from 0–100%) rather than as percentage differences. The formula used is:
Percentage change (%) = ((y2 − y1)/y1) × 100
where y1 is original and y2 is final value.
Throughout, FYM is Farm-Yard-Manure (or coarse compost), N-P-K are chemical fertilizers, and SOM (Soil Organic Matter) is humus that, from a van Bemmelen factor, is ~58% carbon (SOC).
Supplementary source data is uploaded to archive.org with details appended.

3. Results

3.1. Insect Data

RIS findings from the UK [2], when untransformed to approximate absolute values to comply with German results as these were originally presented [1], show a similar decline rate (Figure 5).

3.2. Invertebrate Data

Rothamsted’s e-RA website (http://www.era.rothamsted.ac.uk/) provides only three records for comprehensive soil invertebrate surveys [10,11,12] which are re-evaluated herein (Figure 6).
In each case for Figure 6, the FYM plots are taken to preserve or best represent the original state at inception since fields were traditionally farmed for many centuries prior to the 1840s [22]. The later 1974 survey for Park Grass pasture [12] is incomplete and incomparable with several totals miscounted and the densities seemingly miscalculated by a factor of two (pers. obs.). Moreover, their data (Edwards & Lofty 1975: Table 1) appears to counter-indicate invertebrate population trends seen in prior surveys [10,11] in that nil treatment (plots 2ad that had had FYM from 1856–1863) gave highest mean count of 163,500 m−2 (here recalculated as 83,399 m−2). Park Grass soil invertebrate totals [12], even when corrected, were 20 times above those found earlier [10,11] indicating unreliability of counts vs. biomass (as was used for the flying insects); nevertheless, the population declines in NPK (plots 14b–c) vs. FYM (plots 13b–d) are by −15.8%.

3.3. Earthworm Data

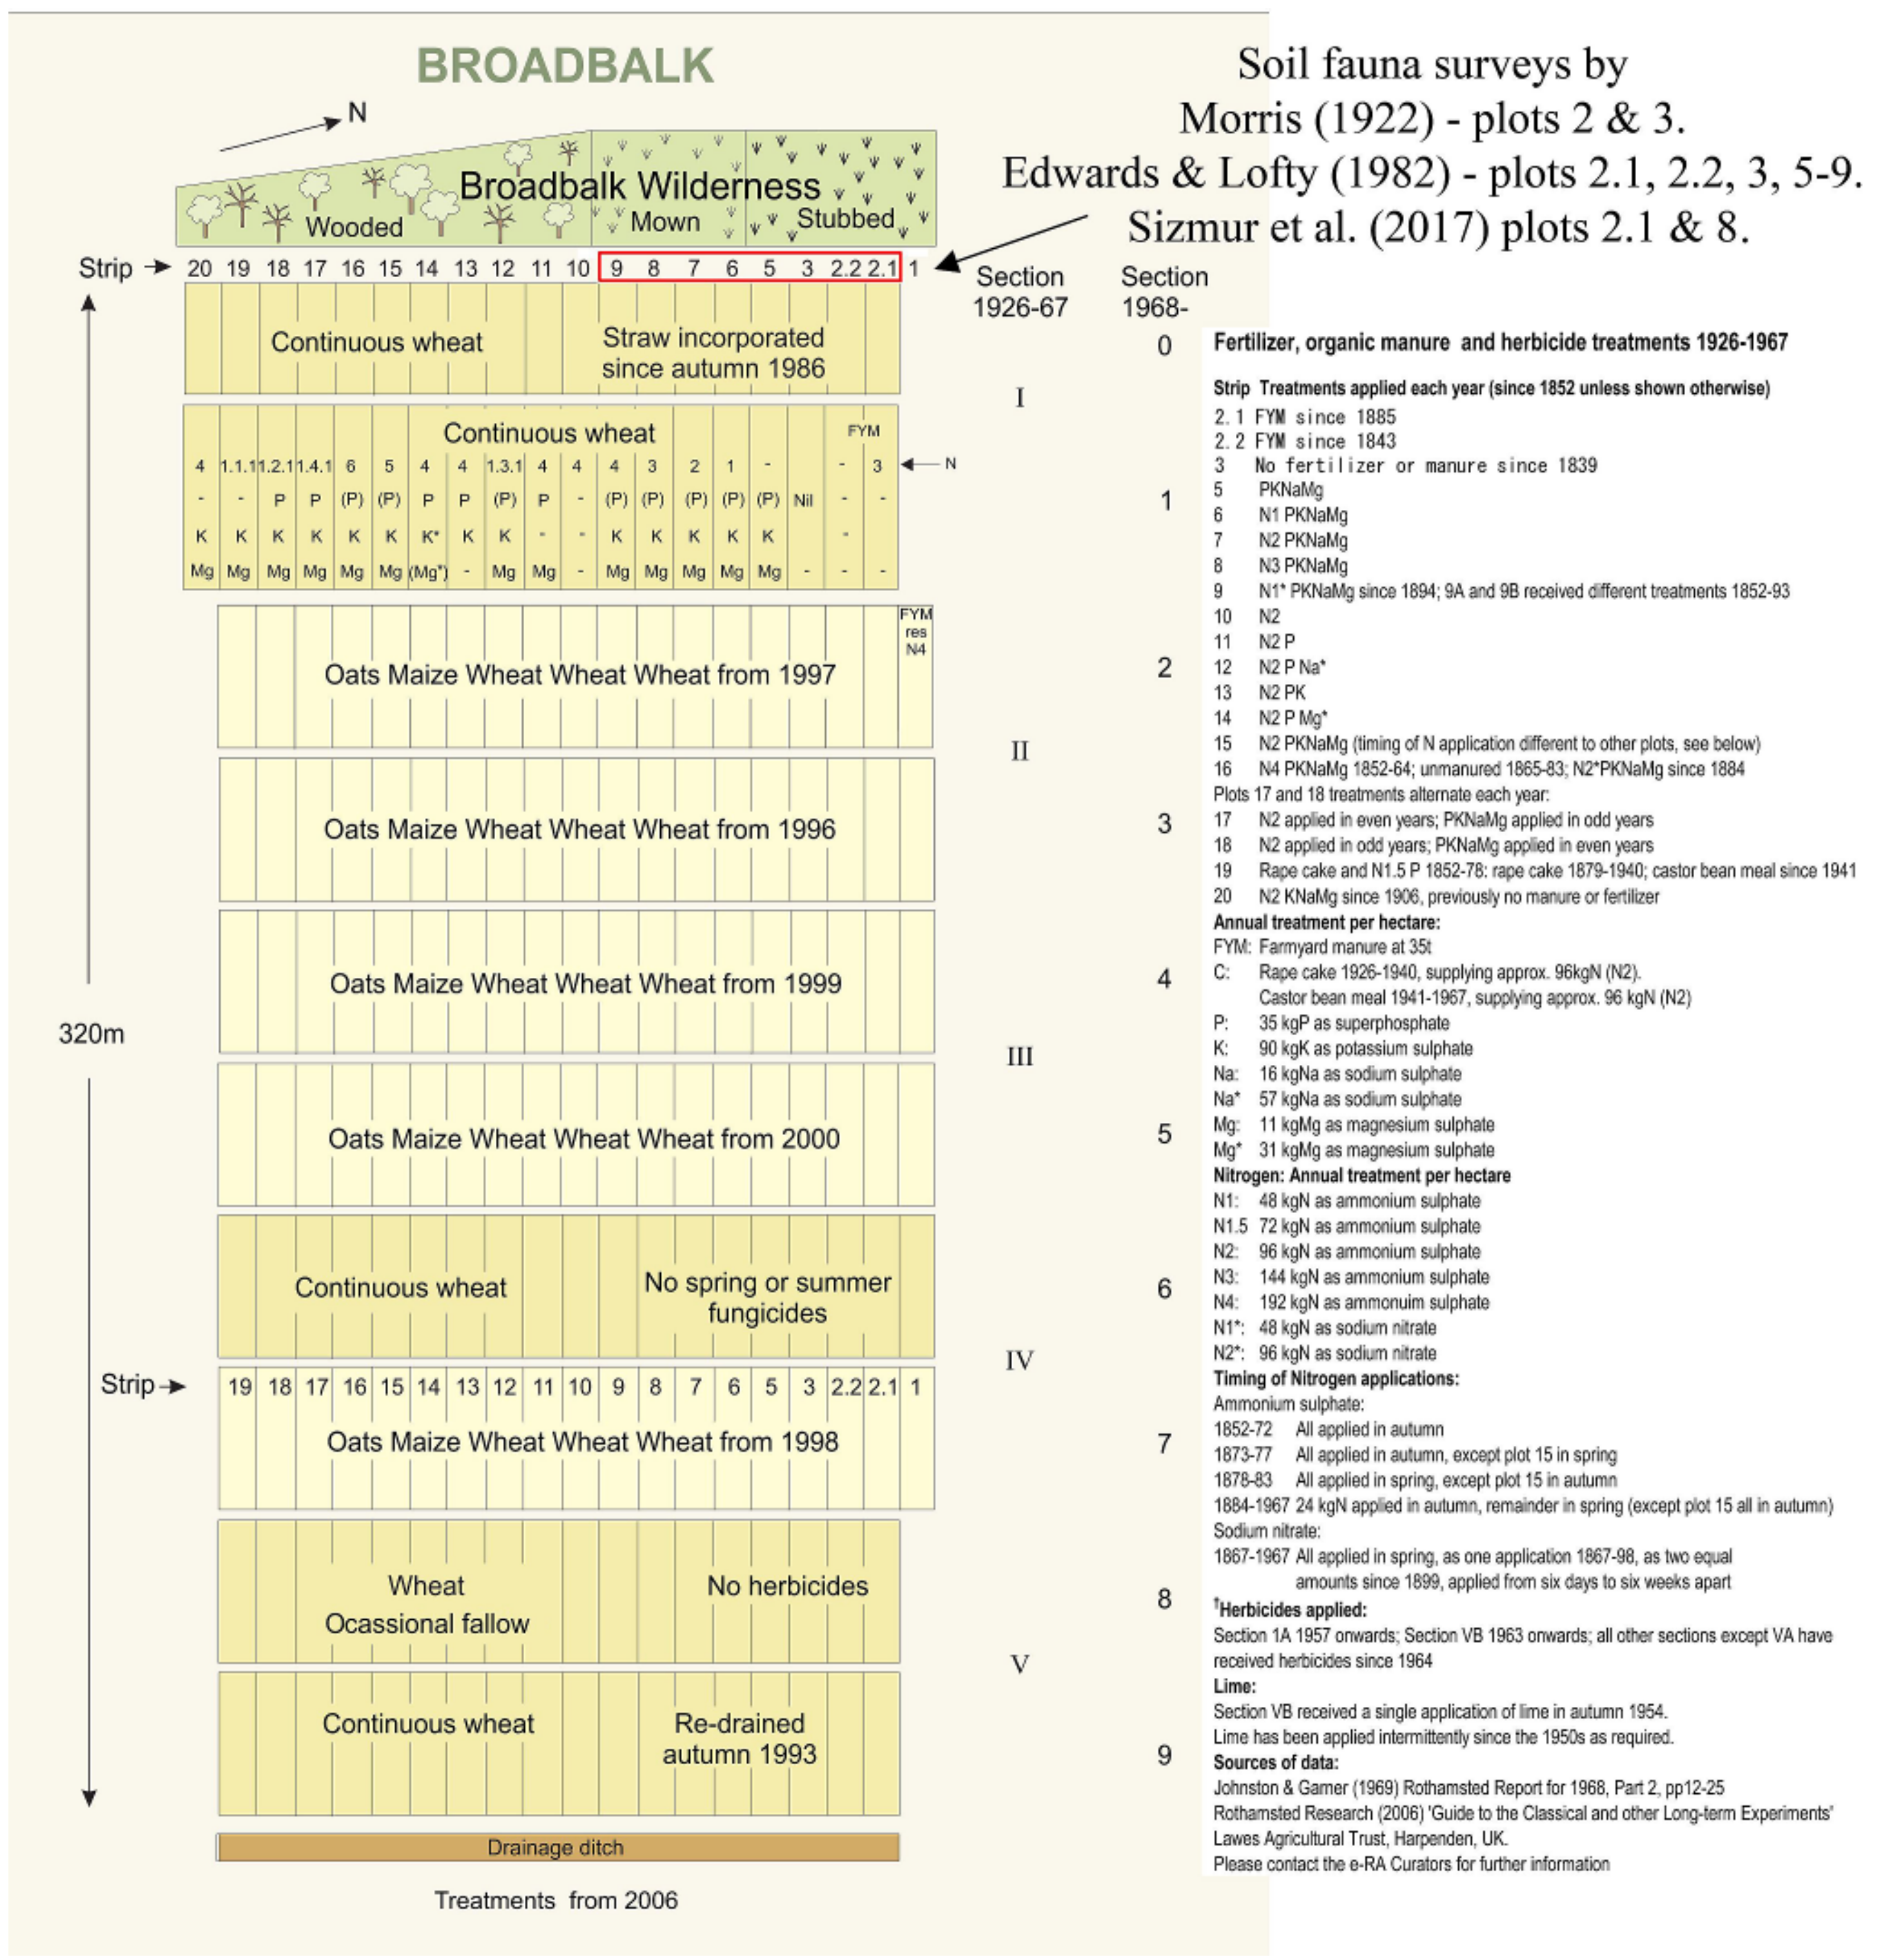
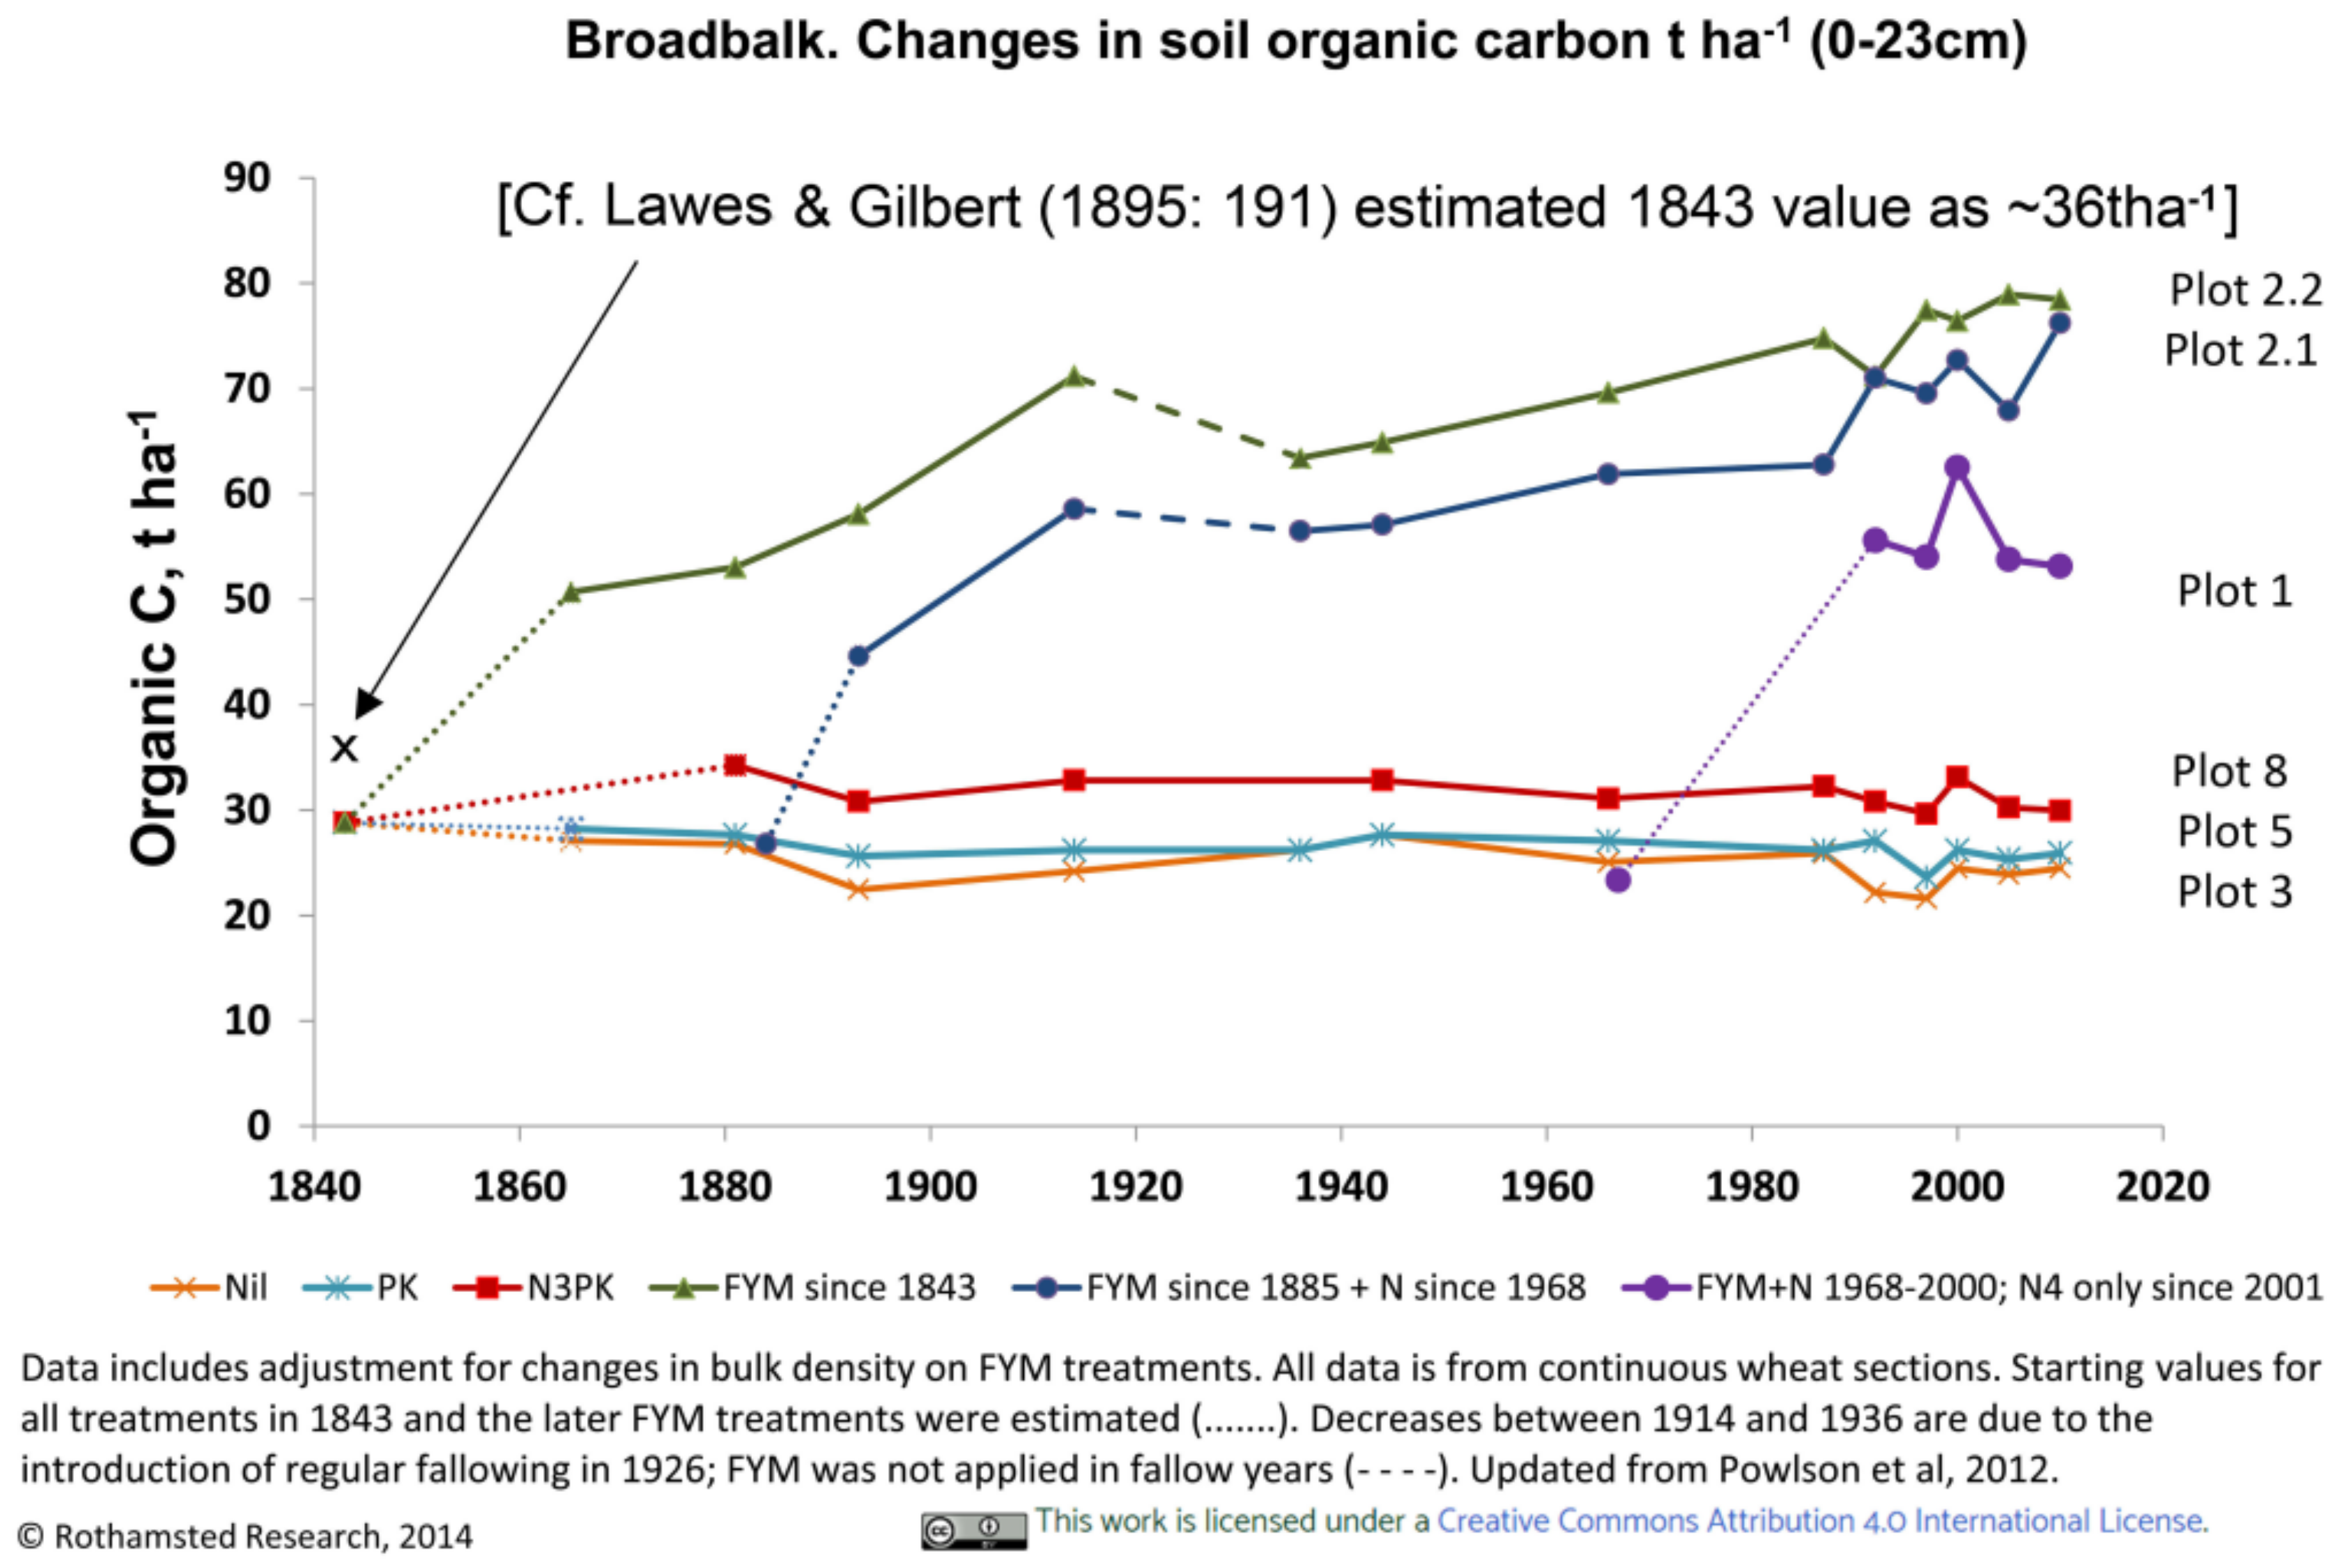
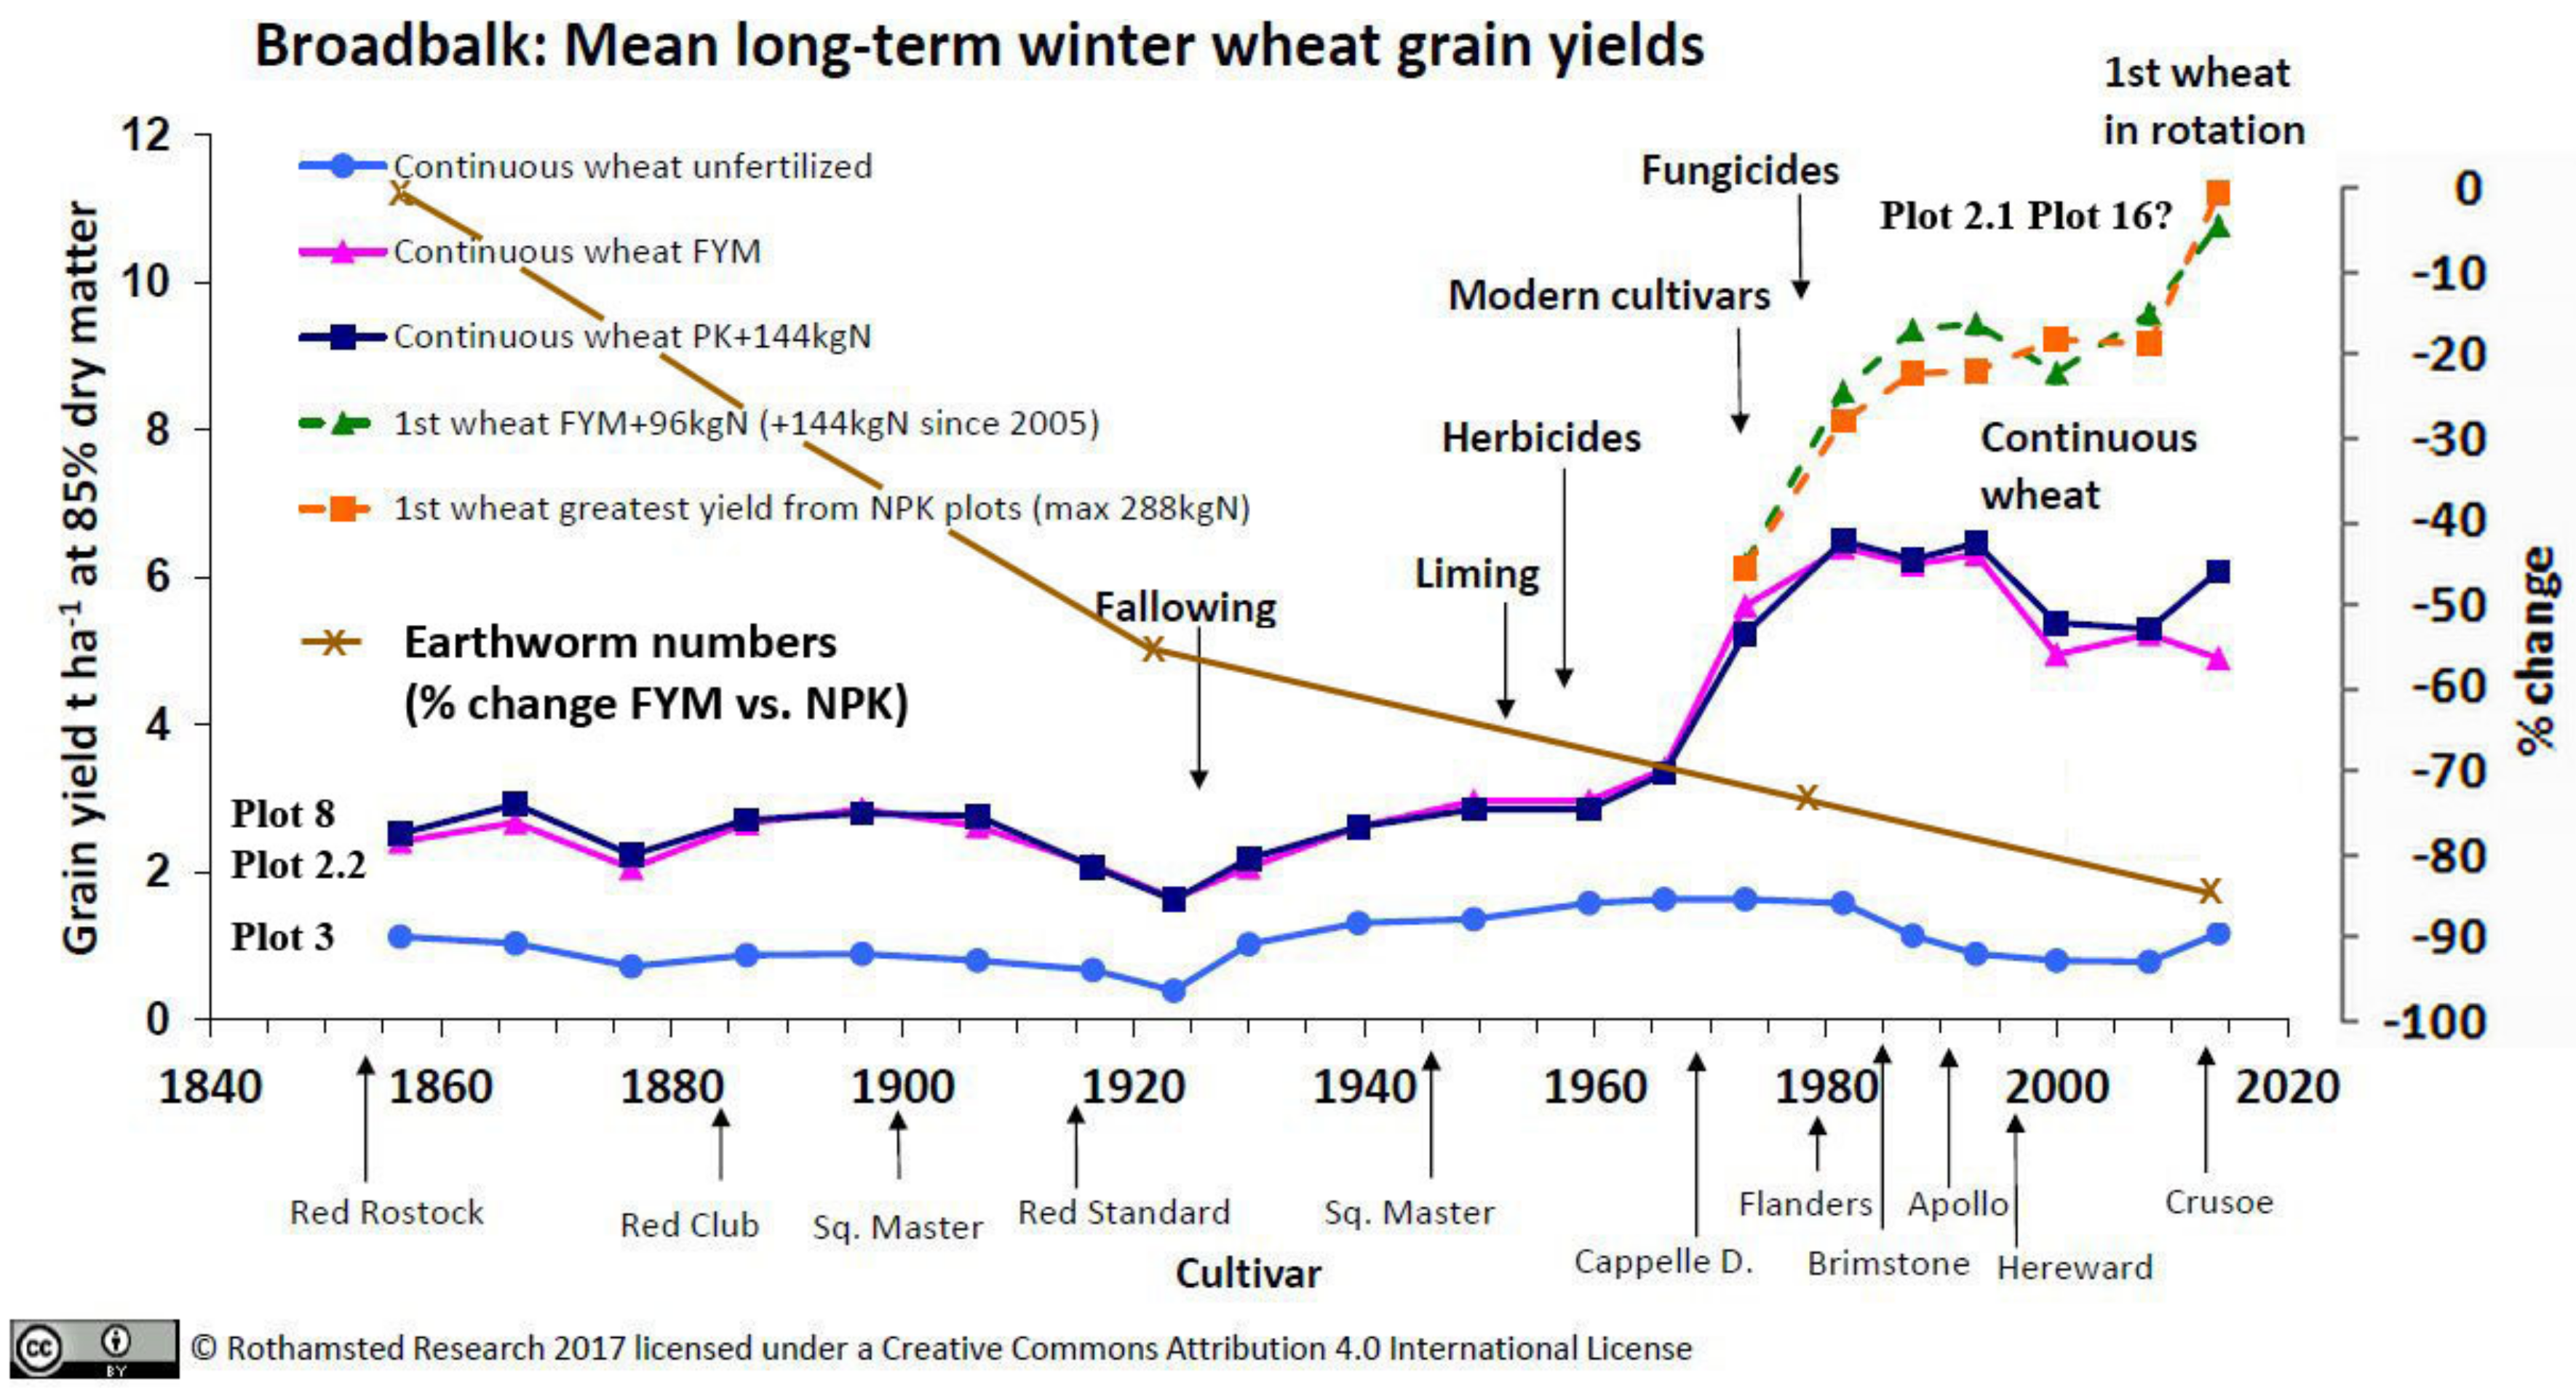
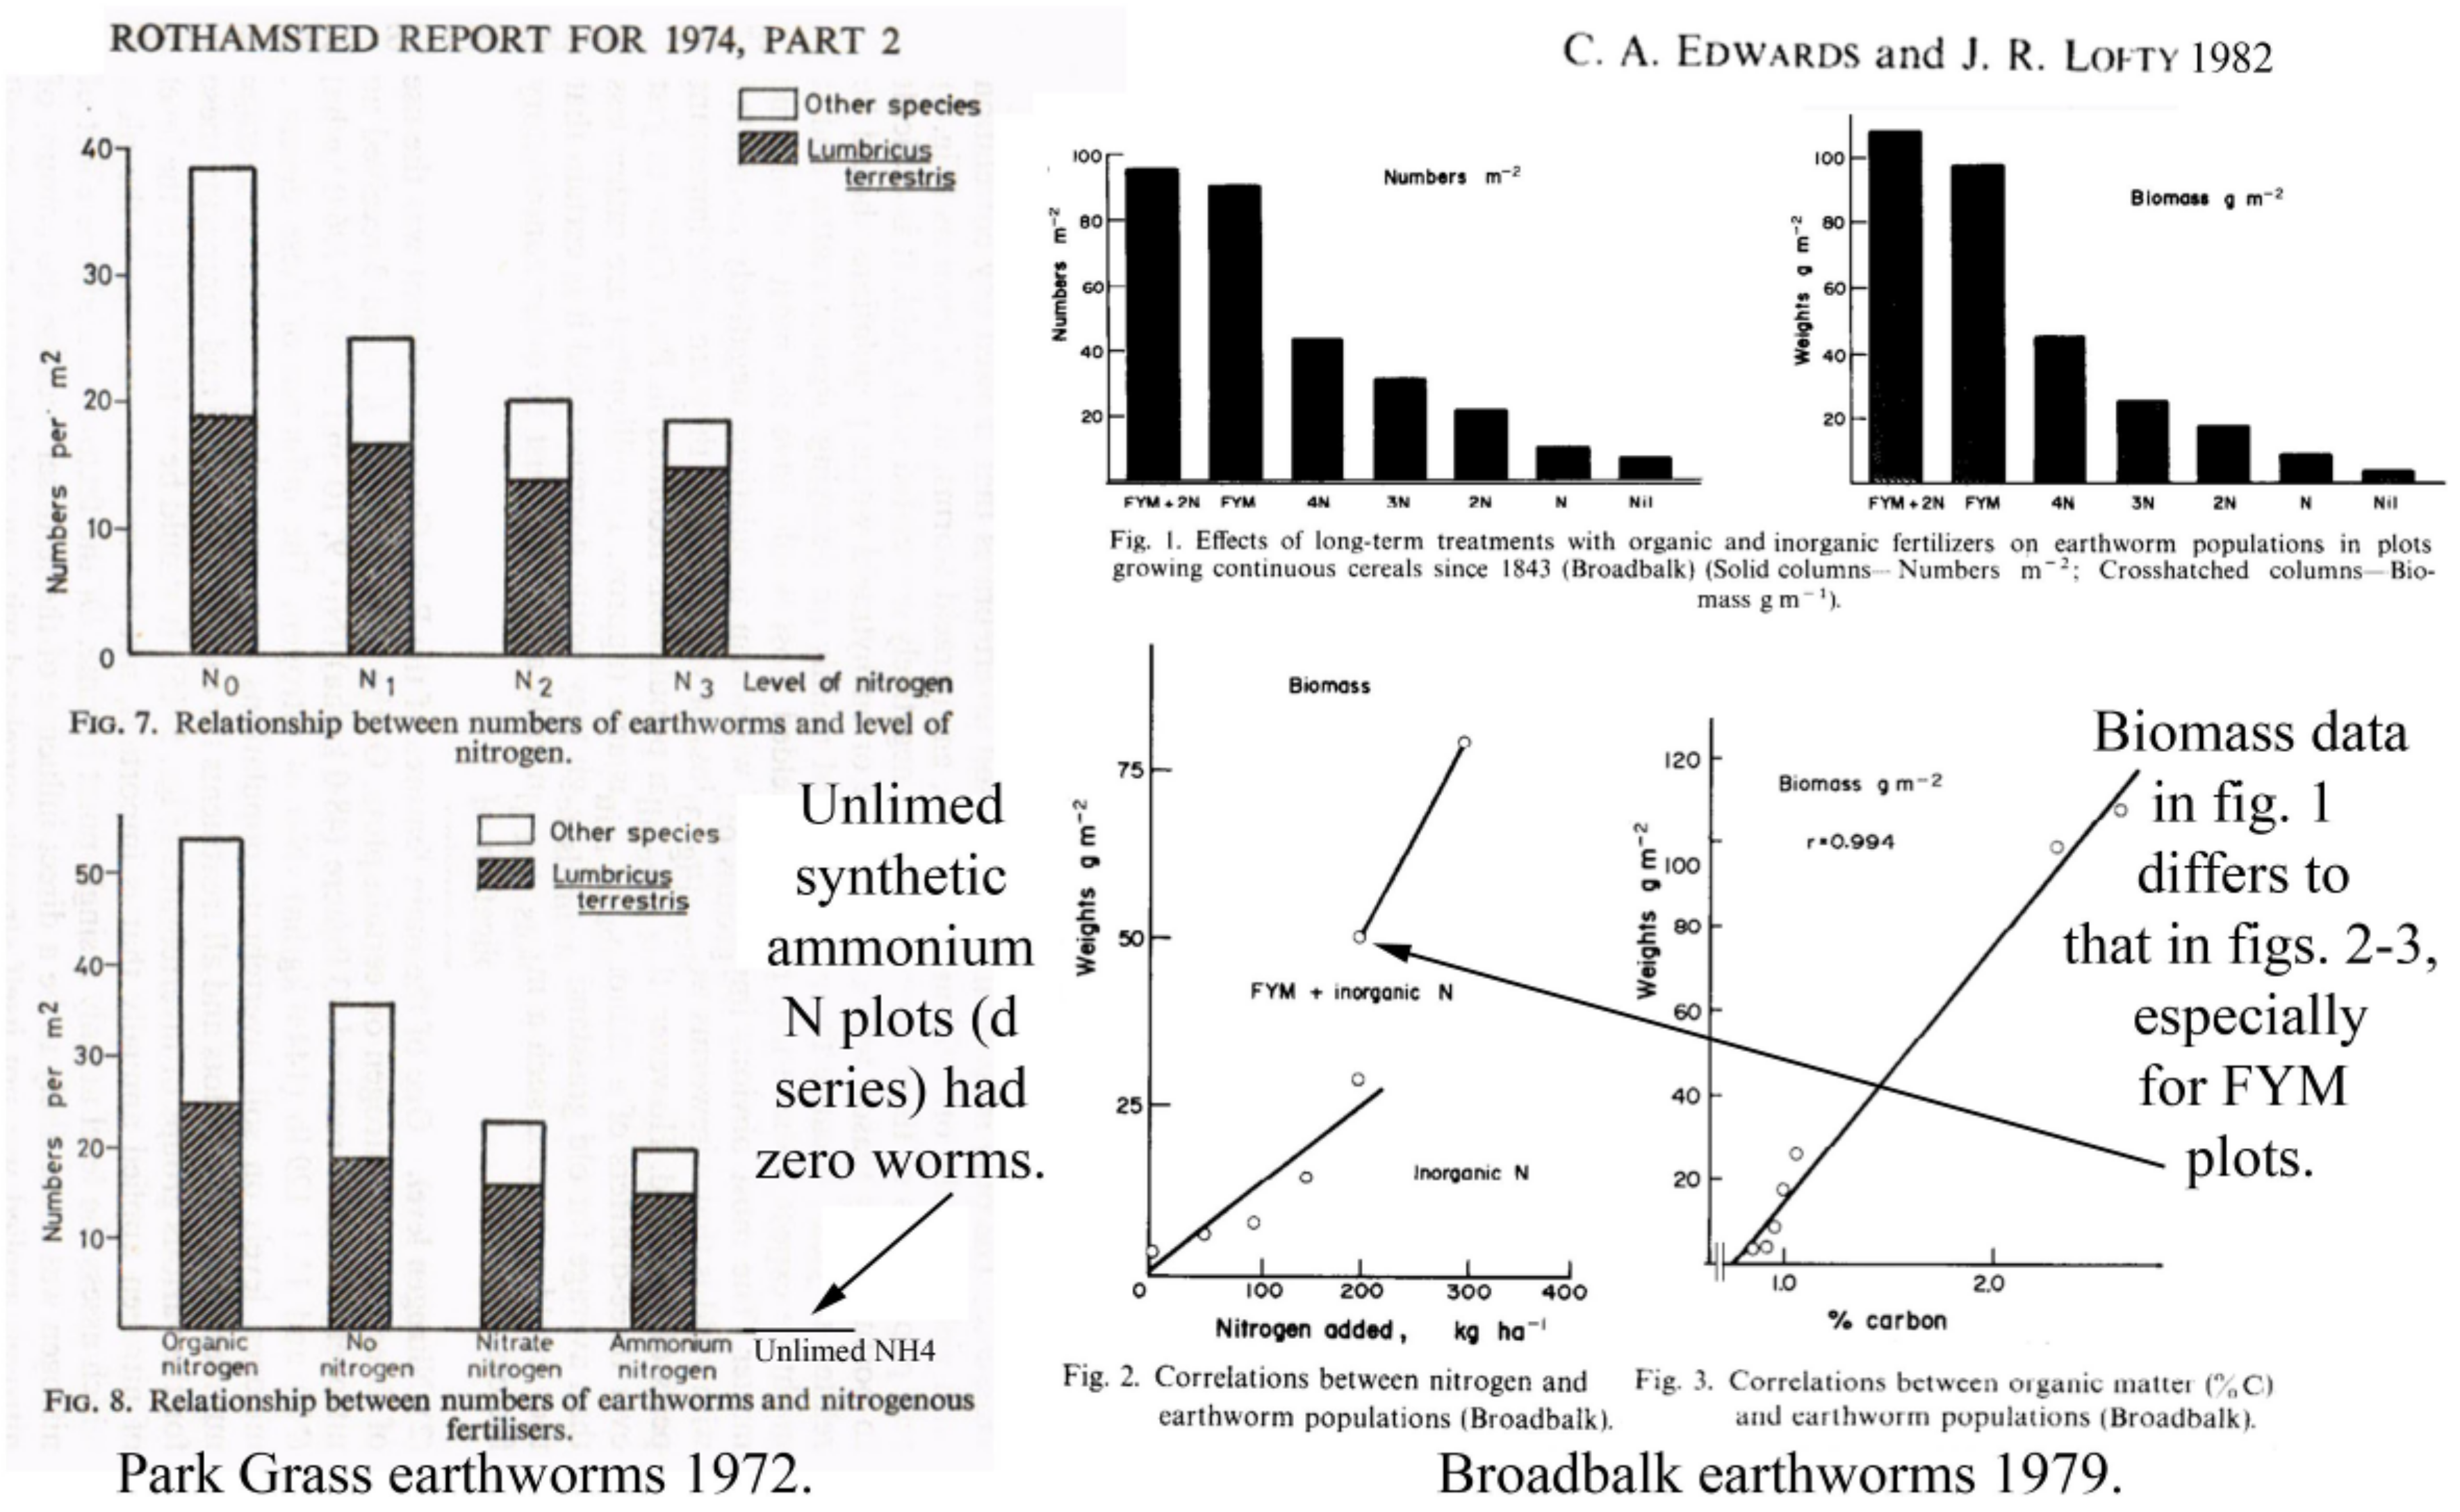
3.3.1. Rothamsted, UK
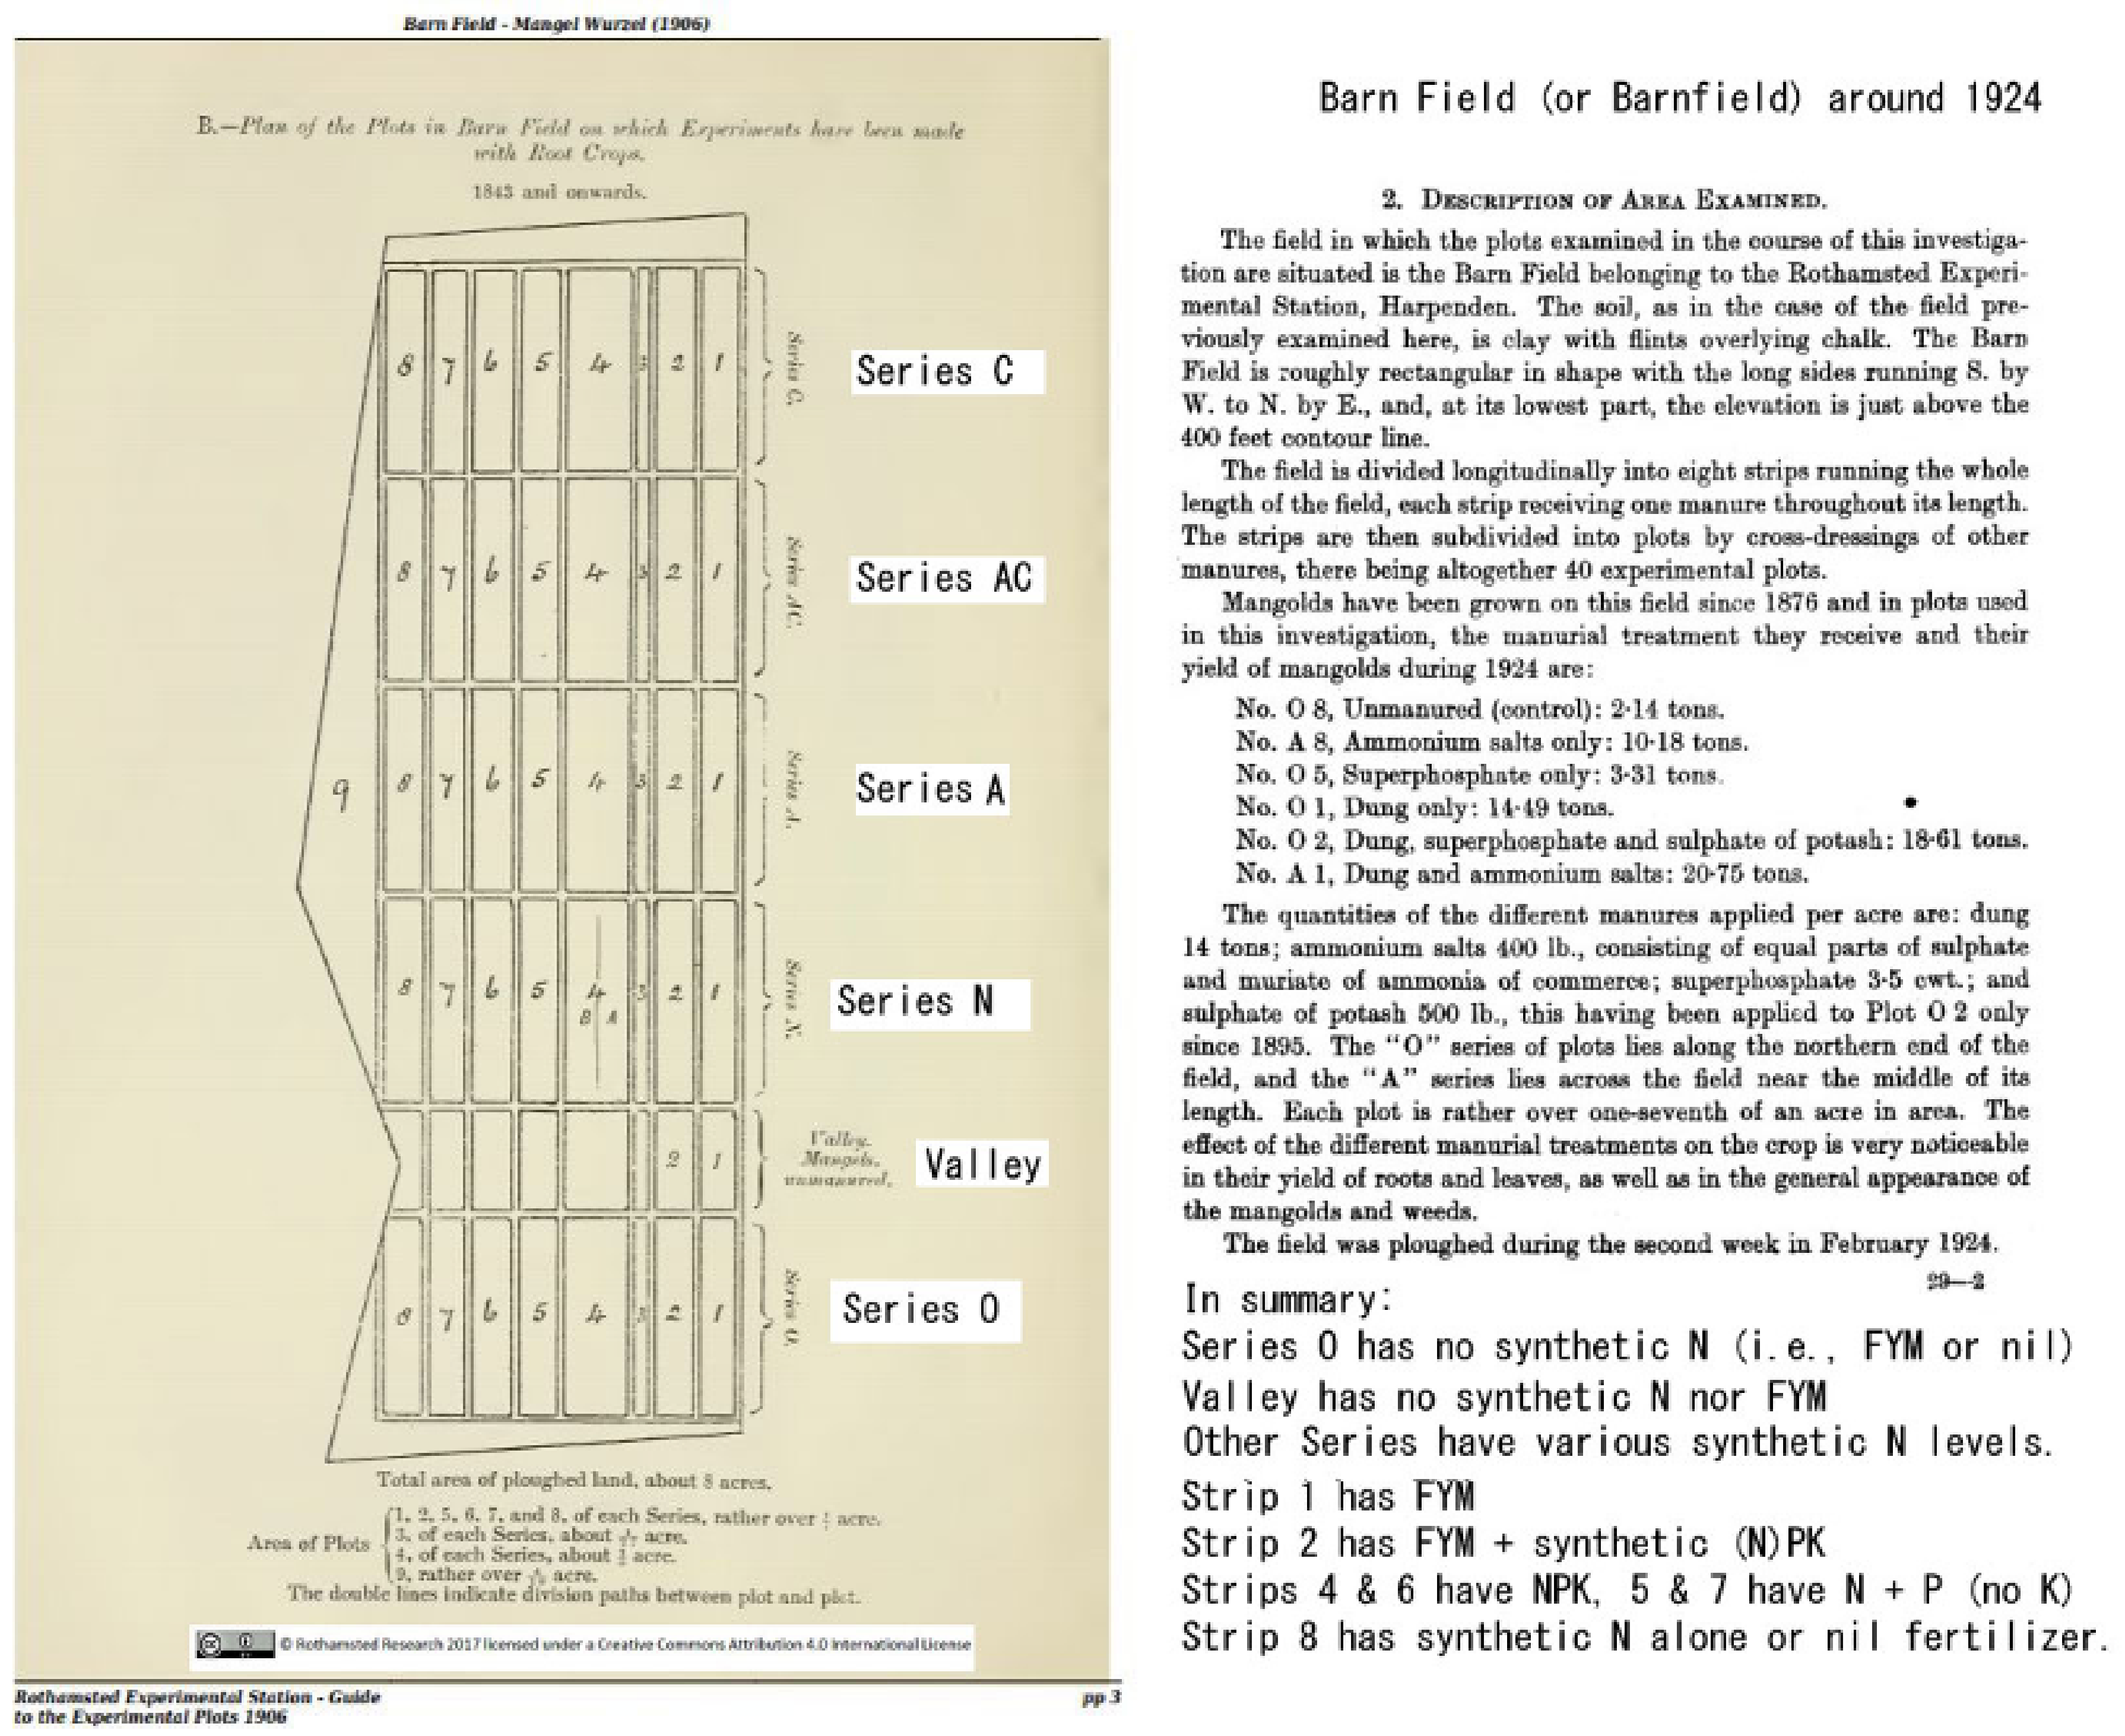
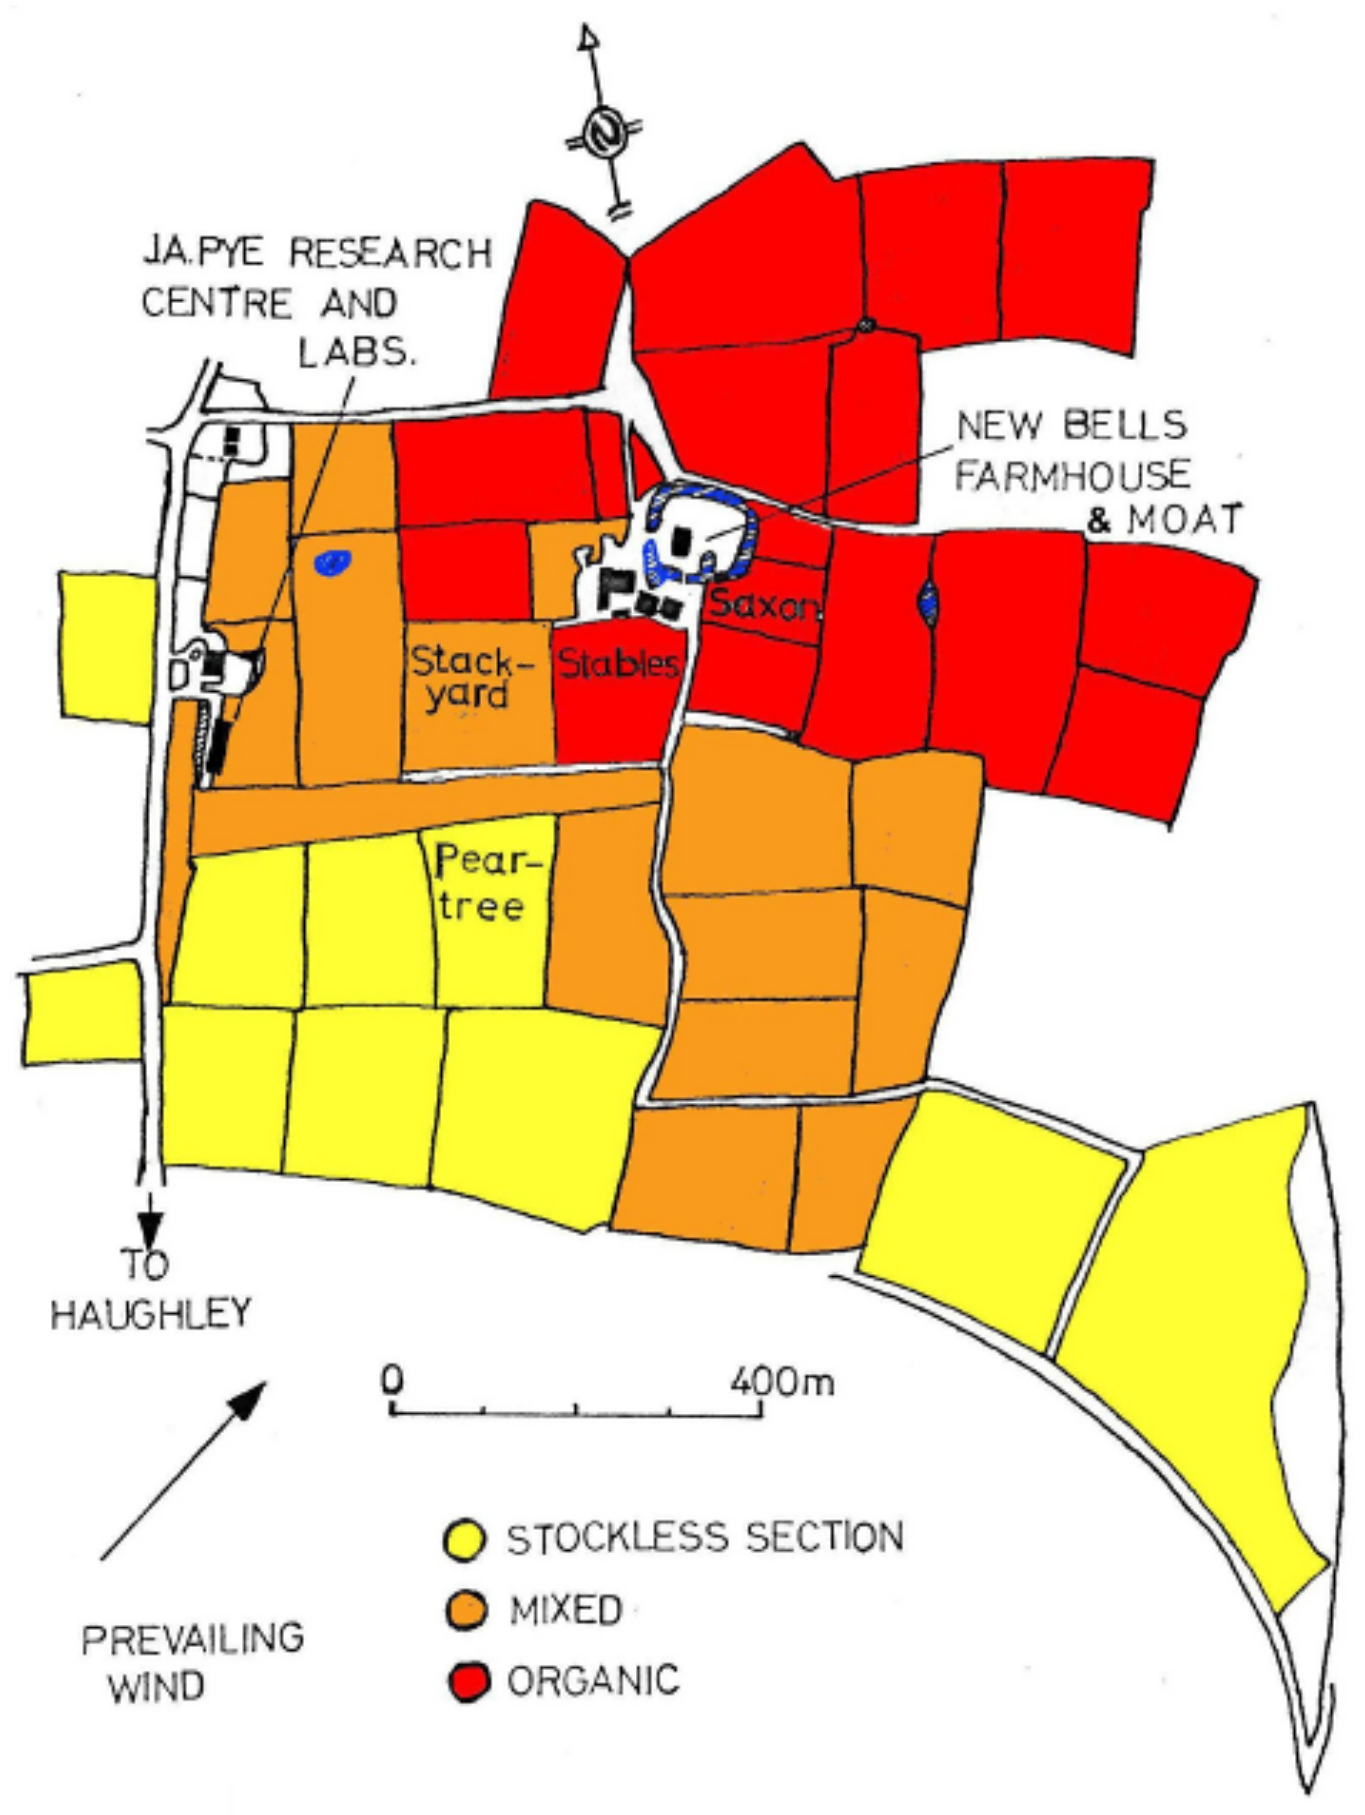
Layout designs, management and findings from Rothamsted’s various long-term experiments are available [22,26]. Results of their earthworm surveys [10,11,12,13,14] are presented in Table 2, Table 3, Table 4, Table 5, Table 6 and Table 7.
Data in Table 2, Table 3 and Table 4 show FYM plots had much higher earthworms; and Edwards & Lofty (1975: Figure 7) [12] plotted an earthworm abundance inversely proportional to the synthetic nitrogen rates, which was opposite to their subsequent Edwards & Lofty (1982: Figure 2) [13] Broadbalk synthetics result where abundance was directly proportional to N (but not significantly) (cf. Figure 9 below).
In 1975 it was noted [12] that in other NPK treatments (Park Grass plots 9–11) the earthworms were completely eliminated by pH <4.0 but mean abundance and biomass (n = 16) were 23.5 m−2 and 20 gm−2, i.e., −57% and −70% compared to the FYM plot totals. Edwards & Lofty (1982: Table 4) [13] have the same Park Grass data somewhat differently presented (here recalculated as 54.1 m−2 and 64.9 gm−2 for FYM and 47.1 m−2 and 44.2 g m−2 for Nil fertilizer plots that would be different by just −36.3% and −46.6%). Misdating the start of the 1856 experiment as 1836 or 1843, their subsequent paper further misconstrues earthworm populations as raised by 11% on adding FYM compared to Nil fertilizer, and entirely omits the NPK plot data—see Discussion.
Rothamsted’s Barnfield experiment on continuous mangel-wurzels (mainly turnips) ran from 1876–1959, but the land had similar fertilizers for other root crops since 1856 and was originally started in 1843 [22]. Earthworm survey [11,13] are recalculated as summarized in Table 5, Table 6 and Table 7.
These Barnfield data in Table 7 are for numbers of Megadrile earthworms (“Terricolae”); however, in FYM plots over 50% of all invertebrates were worms that included Nematodes, Microdriles and Megadriles. Total of all invertebrate counts in FYM plots was 2711 m−2 compared to just 358.5 m−2 in “undunged” plots (Morris, 1927: Table 1) [11], i.e., a severe total invertebrates decline of −86.8% (see Table 1, Figure 3 and Figure 6). Yields in 1924 for Ammonium NH4 (plot A8) vs. FYM (plot O1) are −29.7% or, conversely, FYM vs. NH4 yields are +42.7% (cf. summary in Table 15).

3.3.2. Haughley, UK

Surveys at Haughley in 1980–1981, i.e., after 35–40 yrs (from 1939 or 1945) [15,16,17], of winter wheat crops at equivalent stages of cultivation in all three sections are re-evaluated in Table 8 and Table 9.
Although Haughley started in 1939, Balfour (1948: 145, Figure 6) [25] shows some fields still under pasture in 1945 thus the trial period is a bit less, likely about 35 yrs. The “Saxon” Permanent Pasture was believed to have been maintained for 1000 years and the arable field history at Haughley are shown in the following table after Blakemore (2000: Table 1) [16].

3.3.3. Swiss DOK Field Trials

Earthworm data (Pfiffner & Mäder, 1997: Figures 1 and 2; Table 3) [20] from 1978–1991, i.e., after 13 years, for wheat only to allow comparison with the Broadbalk and Haughley trials, are given in Table 10.
Later DOK’s non-organic wheat plots were found with about −60% lower earthworm abundance (no biomass data) after 27 years (1978–2005) (Birkhofer 2008) [21].

3.3.4. Philippines Organic Farm Surveys

Earthworms were depleted by −36–97% under adjacent (i.e., same soil/climate) organic vs. conventional fields [17]. Corresponding improvement in organic soil quality, with soil moisture (except in flood paddy) raised by +11.5% while soil carbon as SOM humus ranged +26–40% (mean +33.1%), plus yields were higher by +33–80% in tropical paddy rice and sugarcane.
Correlation (r = 0.807) of earthworms was with crop yield and both soil H2O & SOC storage, hence potentially contributing to mitigation & atmospheric CO2 reduction via photosynthesis & humification [17].

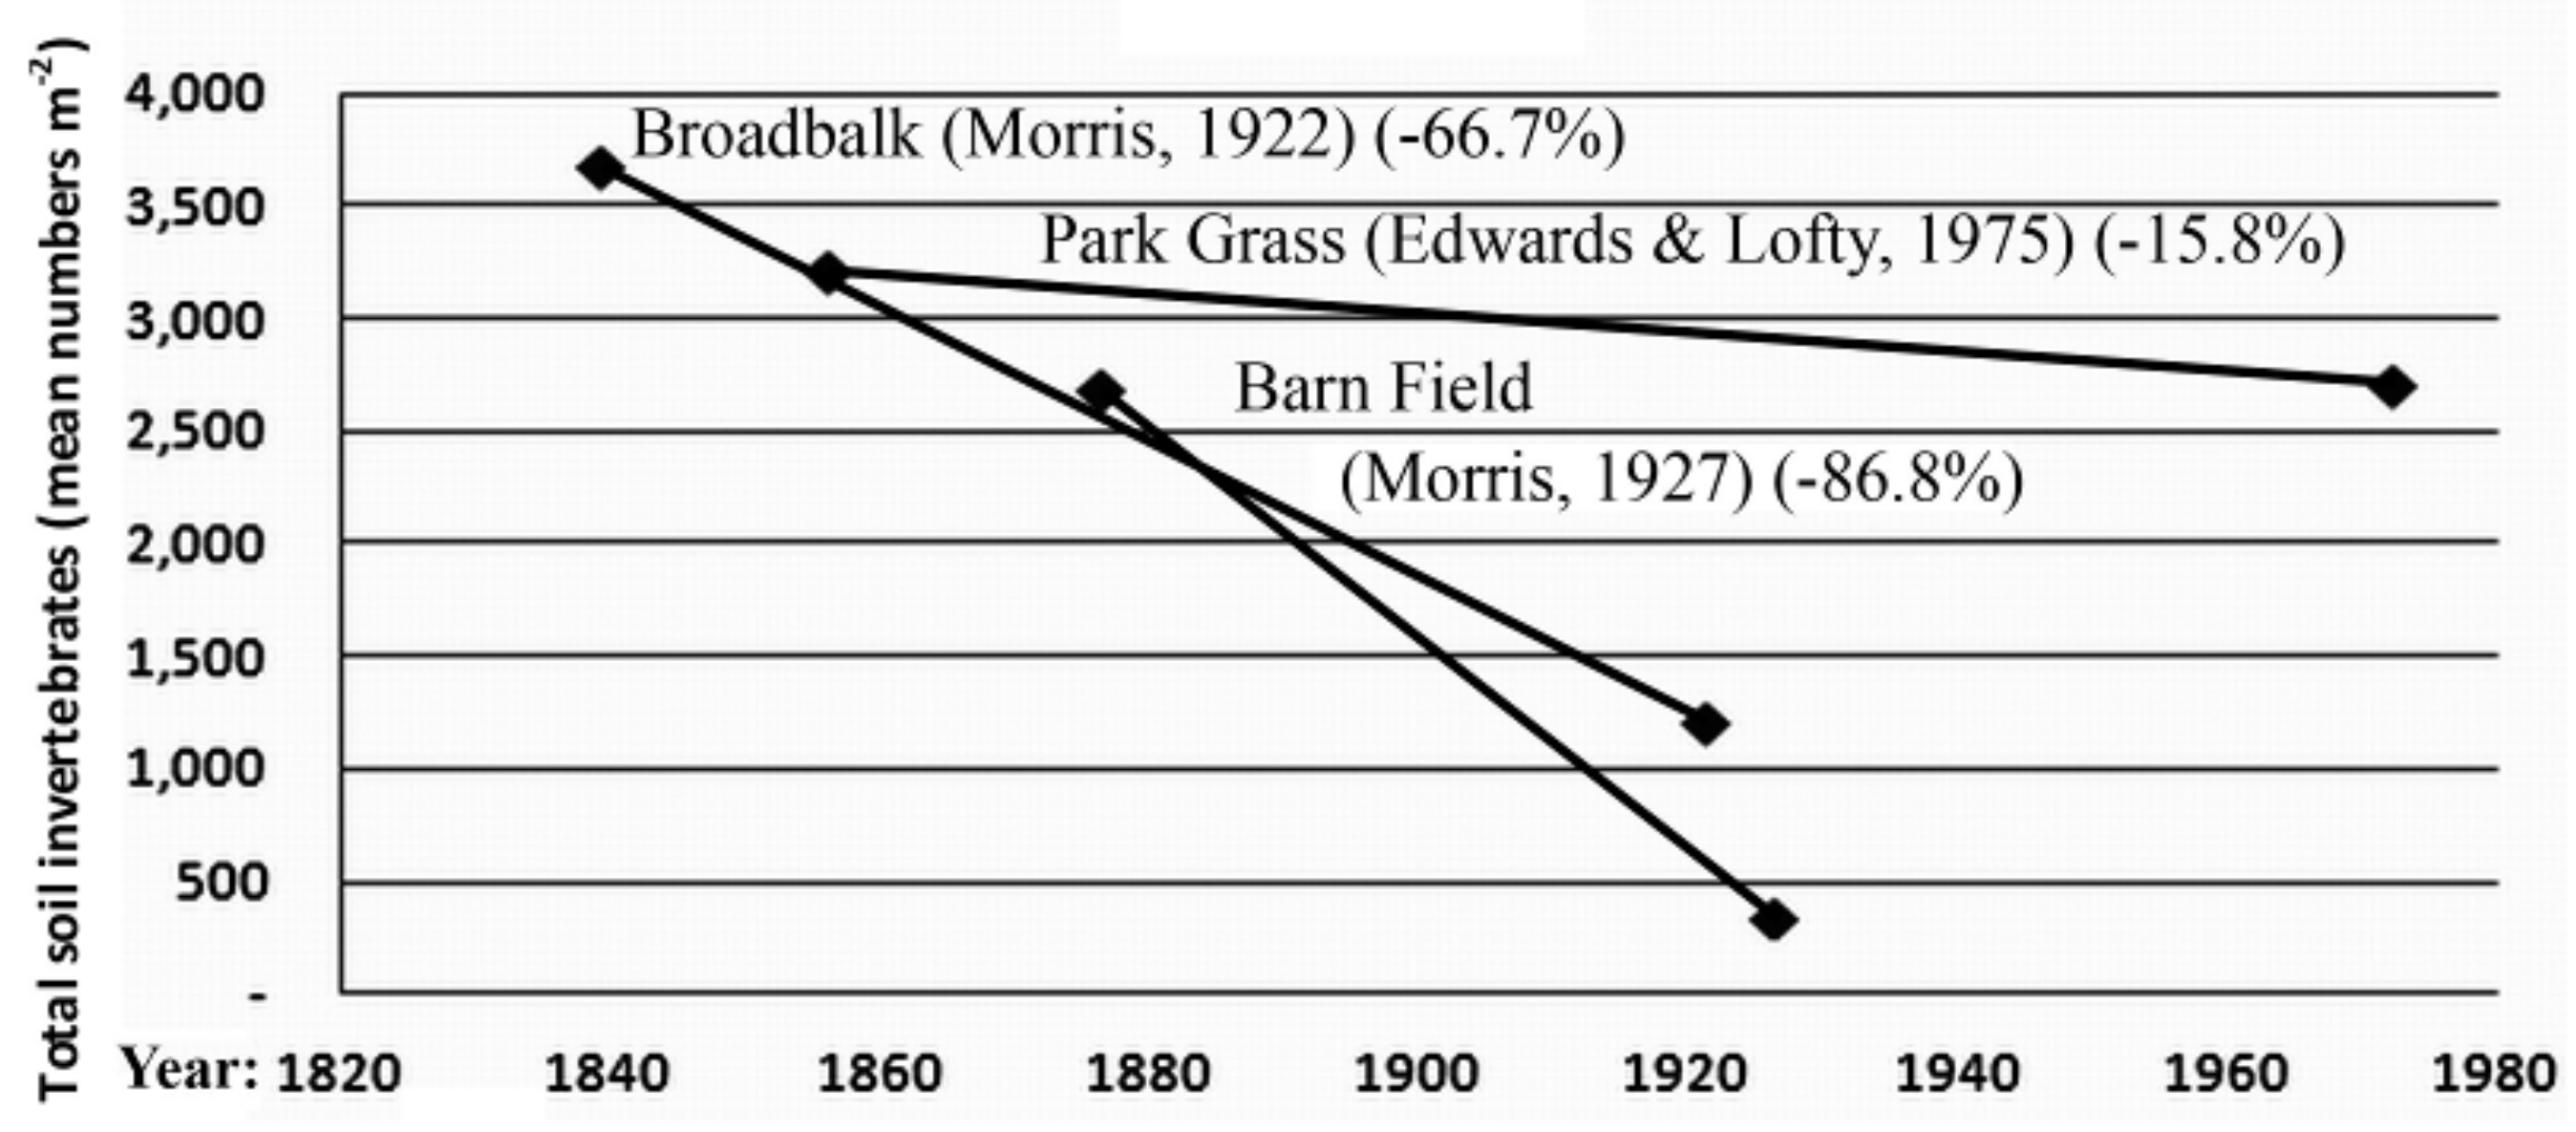
3.3.5. Summary of Earthworm Surveys

Summary data from tables above and from the Philippine trials are given in Table 11.
Assumed rates of earthworm biomass changes as plotted in Figure 7 for Rothamsted and Haughley allow comparison with the flying insect biomass reports (Figure 5) (excluded PI and DOK data are for shorter durations, omit biomass, or are relatively heteroscedastic).
An Excel best-fit or mean regression line analysis (Figure 7) is also significant (n = 5, r2 = 0.577, *** p = 0.01), i.e., significant biomass decline by (−83.3%) is with agrichemical intensification/duration, although initial loss rates may have been higher at implementation. It is assumed that earthworm populations under FYM or other long-term organic treatment will have been near optimal since inception, thus represent antecedent or historical states when compared to contemporary values for agrichemical intensifications at each site. In no case were earthworms, nor other soil invertebrate populations, increased by synthetic agrichemical intensification in these dozen or so studies. Conservation tillage aspects are raised in the Discussion.

3.4. Soil Characteristics Relating to Earthworm Activity

Relevant soil data for Rothamsted’s Broadbalk and Haughley are presented in Table 12 and Table 13.
Rothamsted Research (2012: p. 15) [22] reports that microbial biomass of the FYM plots is approximately twice that of those plots given either NPK or no fertilizers—actually what they show is depletion of microbes by ~−50% with synthetics. Other soil data can be found on their e-RA website (http://www.era.rothamsted.ac.uk/) and in diverse published reports.
Mean SOC (=SOM humus) losses in non-organic fields (in Table 12 and Table 13; n = 5) is −56.8%, or, conversely, SOC is more than doubled in organic fields. Similarly, soil moisture H2O decline is by −22.3% on average or, conversely, it is increased by +28.7% in organic fields.

3.5. Crop Yields and Economic Return

Crop yields are often highly variable: for Rothamsted’s Broadbalk and the Haughley study sites contemporary data are presented in Table 14, Table 15 and Table 16, other yield data are from cited sources.
Regarding yields, published data on Broadbalk show that FYM plots have consistently matched, or cumulatively out-yielded, even the best NPK chemical plots since inception, with grain yields, now conventionally presented as “85% DM” (dry matter), for wheat, oats & maize (data from Rothamsted Research 2012: Figures 1 and 2, Table 1) [22] as in Figure 8 (modified with earthworm data).
This Rothamsted report [22] also states for Barnfield that: “A feature of the continuous roots and subsequent arable crops was the superiority of yield on soils given FYM, even where large amounts of N were applied in combination with the minerals.” Barnfield yields given in Table 7 of FYM vs. NH4 are 14.7 t vs. 10.3 t, or a +42.7% increase (see Table 17).
Park Grass yields of dry hay (t/ha) in FYM, Nil and NPK plots corresponding to earthworm data are 8.8, 3.0 and 9.0 (Edwards & Lofty 1975: Figure 1) [12], or FYM vs NPK have a slight −2.2% decrease that is not statistically significant (t = −0.29, p = 0.4 NS; see also [22] Table 2).
For Haughley farm, Widdowson (1987: Table 9.3) [32] summarized the Land Economics Division of Cambridge University report from around 1981/1982, corresponding to the earthworm survey period [15,16], showing average organic section yields higher by +7.7% (Table 16).
Haughley wheat had shoots significantly increased by +13.9% and roots by +10.8% under organic management [15,16,17]. Moreover, Balfour (1977) [19] concluded that yields in terms of both plant growth and nutrient status from the Organic section remained consistently as high, and, despite chemically grown fodder having higher water content, the healthier Organic dairy produced around +15% more milk than the Mixed over a 20-year period (this contrast was not due to a genetic factor for the separate Guernsey herds as the same bull was used), plus poultry egg yields were higher. However, due to large inter-annual variations, none of the initial ~20 years Haughley yield differences was considered significant during the period from 1952–1966 [34].
Summary of the Swiss DOK trial results reported crop yields to be −20% lower in the organic systems after 21 years, although input of fertilizers and energy costs were reduced by −34% and −53%, pesticide input by −97%, plus the unquantifiable biodiversity benefits were much higher [35].
Accompanying the earthworm data for the Philippines organic farms [17], summarized yields were higher by 33.3% and 80% (mean +56.7%) in tropical paddy rice and sugarcane, with soil moisture higher by +11.5% and humic soil organic carbon (SOC) by +33.1% on average when compared to that on neighbouring conventional farms.
Yield summaries of organic vs. synthetic fertilizers have mean increase of +17.8% in Table 17.

4. Discussion

4.1. Soils and Earthworms

As shown in the soil data tables above, reduced humic soil organic matter (SOM)—due to lower above and below-ground crop yields and lack of recycling—along with lower soil moisture that interactively results from reduced earthworm activity, are probable prime causes of earthworm declines. These losses are intensified by toxic poisoning by agrichemicals and by over-cultivation and exposure of topsoils.
A 2014 survey of Rothamsted’s Broadbalk arable earthworms [14] reported that application of 35 tha−1 yr−1 of farmyard manure (FYM) after “171 years” (this should be 129 years since 1885) increased the earthworm numbers by 469% and biomass by “1290%” (here recalculated as 1700%) when compared to synthetic N fertilized soil plots. Rather, in my view, what they found was that earthworms are actually depleted by −80–95% due to lack of organic amendments. This confirms a continued earthworm decline from earlier data provided by Morris (1922) [10] (depletion by −55%) and Edwards & Lofty (1975) [12] (depletion by −70%) from the same plots.
Edwards & Lofty’s (1982) [13] summary also differs from the current reinterpretation of their rather contradictory data (herein using probably the most reliable of their varied results). Their conclusions were not supported by data when they stated that: “There was a strong positive correlation (r = 0.9825) between amounts of inorganic N applied and populations of earthworms. Plots receiving both inorganic and organic N had the largest populations”. Contrarily, their findings showed how synthetic fertilizers actually reduced earthworms by more than −70% and it was FYM (Farm Yard Manure or “% carbon”) that determined earthworms also at “r = 0.983” in their Figure 3 showing FYM plots with about 2.5% and non-FYM with ~1% SOC. Mixing inorganic fertilizer to organic FYM (plots 2.1 vs. 2.2) had negligible benefit for earthworms as their mean increases of +2.6% in numbers and +23.6% in biomass are both here determined as not statistically significant (df = 6 ; t = 0.129; p = 0.901; NS for numbers; t = 0.53613; p = 0.61; NS for biomass). Their data graphs are shown in Figure 9.
The earlier survey of Park Grass pasture at Rothamsted (Edwards & Lofty 1975) [12] also showed how addition of sulphate of ammonia had been devastating to earthworms, in part by acidification with pH < 3.0 reduction requiring lime remediation, whereas the organic FYM plots had both higher earthworms and higher or equivalent yields. This Park Grass site had been in grass for several centuries and such old pastures would have been regularly dunged, at least by grazing draught animals (now rarely used), deer and other stock. Thus earthworms, plants and invertebrates in the FYM plots may most closely resemble original biotic states compared to the transformations induced by subsequent synthetic agrichemicals. This finding supports results determined at Haughley [15,16,17] that Organic arable worm populations are indeed closer to a permanent pasture’s (but approximately halved), and that non-organic soils had greater depletion, on average by ~−50% again, in both Mixed compromise or Stockless wholly agrichemical fields.

4.2. Do Long-Term Controls Reasonably Represent Original States?

Whether organic arable treatments are more representative of historical states before introduction of synthetic chemicals, and are thus proper ‘upper’ controls, is perhaps self-evident in view of the supposed prior histories of the experimental fields. Rothamsted was farmland since Roman times in which case organic composts would likely have been used as Marcus Porcius Cato (234-149 BCE) described composting in his “De Agri Cultura” (Concerning Culture of the Fields) and Cais Plinius Secundus (CE 23-79), better known as Pliny the Elder, discussed various animal manures and recommended the use of many kinds of green manures [36]. The early English agriculturalist, Jethro Tull (1674–1740), was also a compost and ley-rotation advocate as described by Loudon (1826) [37]. Thus, even if not exactly at original levels, it is probable that soil-faunal populations are closest to optimal, as would be found in traditional farms, since maintaining earthworm activity is a prime practical objective, or an unintended consequence, in organically managed soils. Correspondingly, soil organic carbon (SOC) for Broadbalk shows steady increase with continued (excess?) FYM applications and depletion with NPK [38] in Figure 10.
In my view, low original SOC values are unlikely as more judicious use of well-prepared heritage composts before 1843 would surely give starting levels higher than those manifest on subsequent non-organically fertilized plots of Broadbalk. Moreover, Lawes & Gilbert’s original Rothamsted design had both the FYM and the nil fertilizer plots as “standards” (= controls) for comparison to their chemical fertilizer additions that were, confusingly, also called “manures” in those early days [26]. Whether too much FYM was added is both moot and untested.
In the 1840s, Lawes & Gilbert had calculated that 14 tons per acre (=35 tha−1) ‘average’ FYM contained 200 lb total N, or about equivalent to 224 kg ha−1 and so Poulson (1996: Figure 1) [14] gives the content as 225 kg N ha−1 yr−1. But other figures give fresh FYM containing 0.5% N and application of 10 tonnes providing just 50 kg [39], thus 35 t would supply just 175 kg ha−1 by this reckoning. Confusingly too, Edwards & Lofty (1982) [13] state: “Annual fertilizer treatments were farmyard manure (48 and 96 kg N ha−1)” suggesting an even lower rate especially since 96 kg is Rothamsted’s “2N” that augmented the FYM (from 1885) in plot 2.1 since 1968 and which was raised to “3N” or 144 kg N ha−1 since 2005.
Regardless of actual concentrations, provision rates of artificial NPK are much less important in historic and modern organic systems which rely more upon preserving humic SOC, soil moisture and vital soil fauna & flora (earthworms & microbes that by themselves supply plant nutrients).
Sizmur et al. (2017) [14] had higher Broadbalk earthworm counts from plot 2.1 in spring 2014, albeit ANOVA test of Edwards & Lofty’s 1979 [13] data from both plots 2.1 and 2.2 differed insignificantly and thus are herein combined. Counts are possibly confounded or compromised in part by worm (and other invertebrates!) trans-migrations between plots only 6 m wide as, for example, several earthworm species reportedly migrate >20 m overnight [40]. Compromise Broadbalk plot 2.1 using FYM plus synthetic fertilizers intermeshes with the Mix sections of Barnfield [11] (cf. Tables 1 and 6), Haughley “Mixed”, and with DOK’s mixed-hybrid fertilizer trials that were all found to be almost as deleterious to earthworms, soils, and crop yields as were their fully chemical sections. This also suggests that even Rothamsted’s full FYM (plot 2.2 from 1843) is yet relatively inadequate with regards to wholly organic treatments and may partly explain why earthworm biomass in Swiss DOK’s organic arable sections at 300 gm−2 (equivalent to 3 tha−1) [20] is three times above Rothamsted’s highest records [14].

4.3. Comparison with Other Earthworm Monitoring Studies

Although some long-term monitoring of earthworm populations does occur [16], data are unreliable for comparison due to different soils, seasons and sampling methods. Side-by-side simultaneous study data, as reported here, are particularly scarce. In the USA, a 2015 review [41] show that conversion (reversion?) to organic production compares favourably to conventional in terms of healthy soil and yields, but unfortunately does not specifically address biodiversity. Moreover that review makes no mention at all of earthworms, not even from Rodale Institute’s Farming Systems Trial (FST) operational since 1981. Thus the opportunity for survey of respective earthworm faunal populations in the six cited long-term trials in the USA is open for future research. In Europe there are other initiatives, for example in Holland the Netherlands Soil Monitoring Network, since 1997 in 6-year cycles, has highest abundance at about 500 worms m−2 in pastures (Rutgers et al. 2009: Figure 3) [42]; and several surveys in Germany are summarized by Jänsch et al. (2013: Table 3) [43]. The average density and diversity across all sites in Germany from this latter report is low, here calculated as about 44 worms m−2 and just 3.8 species per site (maximum 5.3 ± 2.5 = ~8 species per site). Their case study of contaminated against uncontaminated grasslands (Figure 10) had approximate earthworm declines of −85% for abundance and −80% for species diversity, viz. from ten to two species on average. One Bavarian study (Bauchhenss 2005: Figures 16 and 17) [44] showed a slight upward trend in earthworm populations at 110 arable sites over 20 years due to better soil management (or a return to less deleterious organic management?), but populations were still about −74% below those in natural grasslands.
Gaps in knowledge or deficiencies in assessment for EU soil monitoring were reported as lack of data on earthworm communities and their roles [45], this despite another compilation by Rutgers et al. (2016: Table 3) [46]. This latter report noted that earthworms were surprisingly under-represented or neglected taxa considering their key ecological importance whilst provided means, here recalculated, as 106.6 worms m−2 and just 4.1 species per site (maximum 10 ± 0.95 = ~11 species per site) for eight countries. Why earthworms are omitted from most biodiversity surveys and ecological analyses, even of soil fauna, is quite inexplicable and most inexcusable.
As well as scarcity, these studies only provide baseline data rather than allowing specific comparative analysis: For example, the German earthworm sampling [46] deliberately excludes “records from sites with anthropogenic impact other than physical soil cultivation measures (e.g., heavy metals, pollution, pesticide application, excessive nitrogen deposition)”, or as found under intensive agriculture that now occupies the majority of habitable land! Thus much of this information is incomplete or irrelevant to the current study and differs from the author’s experience whereby contaminated sites may have zero, whilst survey of more natural or organically managed soils give much higher abundance and biodiversity of earthworms. An ISO soil sampling text [8], has proper eco-taxonomic field survey revealing over twenty megadrile species from disparate sites in Australia, Tasmania, Japan and SE Asia. For example, a mixed farm in Queensland, Australia had 24 earthworm species whilst an organic farm studied in the Philippines had 23 [17,47,48]. In one instance, 13 species were unearthed from gardens at Y Plas House at Machynlleth, Wales in half-a-day’s collection in 2013 [49] matching the earthworm diversity reported at another UK site sampled for an entire 10-year period (1990–2000) [50].
Supporting the insect and vertebrate species’ extinction trajectory, soils in some surveyed regions that are poorly managed, intensively cultivated, and/or chemically poisoned have earthworms severely depleted or completely annihilated from some fields in both temperate and tropical climes [8,17,47,48]. Indeed, Rutgers et al. (2016: Table 3) [46] reported zero worms in about 6% of all their reports. Surveys of palm-oil plantations in Malaysia [51] revealed low numbers, remarkably of only one species: cosmopolitan, neotropical Pontoscolex corethrurus (Müller, 1857)—an ubiquitous interloper often dominant in tropical soils in various stages of degradation [8,17].

4.4. Agriculture—The Primary Causal Factor of Biotic Declines

The present report clearly proves that, from its earliest days, chemical farming as at Rothamsted has been detrimental to soil life and certainly is responsible for killing the soil. The recent German insect study [1] posits a plausible cause of the ~80% reduction in biomass of flying insects in just 27 years (1989–2016) as agricultural intensification with the authors giving examples of: “pesticide usage, year-round tillage, increased use of fertilizers and frequency of agronomic measures”. They further note that this rate exceeds the estimated decline by −58% in global abundance of wild vertebrates over a 42-year period (1970–2012) [3], and was comparable to the only other long term study on flying insect biomass from the UK [2]. This latter study of 30 years (1973–2002) by Rothamsted Insect Survey (RIS) researchers used different methodology, viz. suction tubes at 12.2 m height mainly designed to monitor flying aphids, rather than generalist malaise traps at ground level to 1 m. The RIS survey had a decline in only one of four stations but concluded the other three possibly already crashed due to prior “agricultural intensification” from the 1950s as they all had much lower insect biomasses even than the declining site’s final value (see Figure 5). Moreover, aphids seem especially enhanced rather than depleted by agrichemicals, as was determined from Haughley organic farm’s data (Widdowson 1987: 70; Lee et al. 1983; Birkhofer et al. 2008: Figure 5c) [21,32,52]. The latter Swiss report had approximately double the aphids in conventional chemical plots, despite use of insecticides.
Likely reasons for higher pest levels are because organic plants are more resilient to attack and disease; pesticides differentially kill pest predators; plus the more rapidly reproducing insect pest species soon develop resistance. This aphid problem was recognized but unsolved in Rothamsted’s controversial and failed GMO wheat trials. Heaton (2001) [53] similarly concurred that: “Crop losses due to insects have increased by around 20 per cent since 1945 despite a 3,300 per cent increase in the amount of pesticides used.” This is restated as “While insecticide use increased tenfold since the 1940s, crop losses to insects doubled” (Soule & Piper 1992: 46) [54]. Related to this issue is the discussion in Pimental (2005) [55]. Biocides are responsible for both benign or beneficial insect (and earthworm) declines.
A number of often chemical-industry-funded agronomic trials of conservation, reduced or minimum tillage/direct drill treatments show earthworm increases: e.g., Briones & Schmidt (2017) [56] have numbers and biomass raised on average by 132% and 148%, respectively. However, as the total numbers are often much lower than those under proper organic production, then any conclusions are contextual (cf. α vs. β curves as in Figure 5). Moreover, these farm methods often rely upon excess herbicides which, like the pesticides, are toxic to earthworms and other biota (or to their microbial symbionts) and cause resistant weeds, whereas organic minimum tillage practices use rotation, cover-crops, mulches and mechanical/flame weeding. Certain ‘weeds’ may even be encouraged for reasons of nitrogen-fixation, biodiversity aesthetics and as predator or pollinator reservoir refuges. Direct tillage comparison determined that, in the medium term (up to 4 yrs), earthworms under organic management are two or three times the levels found in agrichemical fields (or, rather, populations are depleted by −50–70% by agrichemicals!), thereby far overriding claims of reduced cultivation/herbicide treatment benefits [57]. Humic SOM and soil moisture were higher too, seemingly by just 7.5% & 6.6%, in these organic fields (Crittenden et al. 2014: Table 6, state “g kg−2sic lapsus for gkg1) but, unfortunately, comparable crop yields were unavailable [57].

4.5. The Growing Failures of Synthetic Fertilizers

Despite best efforts for over 175 years, Rothamsted has been unable to demonstrate that synthetic fertilizers have any advantage over more natural organic fertilizer (FYM) in terms of yield, input costs, nor conservation of soil and its vital soil biota, such as earthworms [22]. Moreover, the organic fertilizers and management practices used at Rothamsted are inadequate compared to proper organic husbandry. For example, Sir Albert Howard (1947: 72) [58] was highly critical of their plot designs, weed control, poor heritage seed bank stocks, and lack of rotations (that were later implemented). In addition, Lady Eve Balfour when she visited in 1948 [59] said the FYM ‘composts’ were substandard, hardly qualifying as such, thus any conclusions coming from Rothamsted about efficacy of proper organic composts were automatically invalid. In 1948 she noted: “A recent visit to Rothamsted revealed the fact that no tests have been made with properly made organic compost.” On the other hand, enhanced worm-processed vermicomposts can produce long-term beneficial results [17].
Negative effect of synthetic fertilizers are also for symbiotic fungi, as summarized by Treseder (2004) [60] with mycorrhizal abundance decreasing 15% under N fertilization and 32% under P fertilization. The self-perpetuating chemical solution to this artificially induced problem, ironically, is to replace natural mineralization with yet more synthetic fertilizers and mineral supplements.
Other problems of chemical agriculture (as noted from early days at Rothamsted) are of soil acidity rate due to NO3 from synthetic fertilizer use. Currently NOx from farms in acid rain is more rapid and severe than the total ocean acidification attributed to CO2 from fossil fuels. A 2015 summary paper [61] show soil pH globally has acidified by an average of 0.26 in 20 years (ca. 100% change), while NOAA [62] has the pH of the surface ocean decreased by just 0.11 (which corresponds to approximately 30% change in pH) in the last 200 years. In Chinese soils the effects are even more stark with an overall 0.5 pH reduction in the last 20 years which is equivalent to a 216% change in acidity, or about twice the global soil average [63]. This latter study says that acidification has already lessened crop production by 30–50% in some areas of China. The UK soils fare no better with 2.2 million tonnes of topsoil eroded annually and 17% of arable land with signs of erosion requiring greater use of grasslands such that around 18% of SOM present in 1980 has been lost by 1995 [64,65]. The situation is so dire that possibly as few as just another 100 harvests are left from UK soils [66,67], this supporting the UN’s FAO summary that as little as 50–60 years of crops were possible with unsustainable intensive-agricultural practices [68,69].
Even without the current data on earthworm decline, it is increasingly obvious that drastic re-evaluation of farm production methods are urgently needed. A starting point, often completely neglected, is restoration aimed at soil fauna, in particular earthworm ‘ecosystem engineers’ helping rebuild healthy soils, they being particularly sensitive to pH, SOM levels and to soil moisture [7].

4.6. Significance of Decreasing Biodiversity

The method presented here of assessing biomass and biodiversity changes in soils degraded by unsound management relative to more appropriate soil conservation (viz. organic husbandry or mere FYM addition) allows previous data, such as from Rothamsted, to be re-evaluated and compared to more recently observed trends. Extrapolation of the German insect data [1] charts the trajectory of a rapid elimination of flying insect biomass in less than 30 years, or more likely with stability at a new nadir of much lower biomass, and this composed more of pest species—as found by Morris (1927) [11] and recently by RIS [2], and as noted in a meta-analysis by Tuck et al. (2014) [9]. These latter authors claimed a conservative 30% increased biodiversity in organic fields (or, rather, a −23% reduction under intensification?), but omitted several relevant studies, including several cited herein. Thus their conclusion that “organic farming has large positive effects on biodiversity compared with conventional” is actually the converse: viz. conventional farming has large negative effects.
Another meta-analysis by Bengtsson et al. (2005) [70] found on average, except for pest species, organisms were +50% more abundant in organic farming systems (or, rather, −33.3% lower in non-organic systems?). This was corroborated by Ewald et al. (2015) [71] who charted only slight decline in abundance in 42 years (1970–2011) in 26 invertebrate groups (including pests, despite pesticide intensification) in agrichemical cereal fields in southern UK suggesting stability, albeit at a new and much lower biodiversity level (β curve as in Figure 5). However, since no uncultivated nor organic controls were compared, biomass was unmeasured, and as they especially omitted earthworms, this latter work is therefore not particularly relevant. A growing body of other studies consistently reveals earthworm and invertebrate declines, lower yields and soil degradation as manifest conclusively at Rothamsted and as researched at Haughley and DOK. This relates to UN’s FAO prediction (noted above [68,69]) of just 50–60 harvests left at the current rates of intensive agricultural soil degradation, leaving no rational choice but for a change of production policy and priority.

4.7. Practicability of Organic Restoration

Founder of Rothamsted, Sir John Lawes in 1893 [72] made this definition; “Practical agriculture consists in the artificial accumulation of certain constituents to be employed either as food for man or other animals, upon a space of ground incapable of supporting them in its natural state.” He thus advocated simplistic synthetic/artificial chemicals to replace nature, at that time with little understanding of ecological complexity, and omitting the key concept of sustainability.
Whether it is responsible to advocate reversion to more environmentally benign and sustainable organic farming as a practical solution to soil degradation, whilst maintaining food supply, has received some support from several key studies. Certainly the data presented here show the organic sites studied had equivalent, or often much higher, yields on average. The broad conversion to organic farming/permaculture as a priority may yet “Feed Us All” says Worldwatch Institute [73] simultaneously preserving biodiversity, sequestering carbon and saving both water and fossil energy. According to a 2010 UN summary study [74] agroecology led to an average crop yield gain of +79% and potential to store in soil humus 5.5 to 6 Gt of CO2-equivalent per year by 2030. Organic farm humification alone may entirely offset global CO2 emissions [17,48].
Using various models, Muller et al. (2017) [75] indicated that it is possible for organic farming to supply all needs but would require more land, unless food waste and arable land producing animal feed were both reduced. However, there appear to be several flaws in this study such as the yield gap as cited was around −20%. Yet Badgley et al. (2007: Table 1, Appendix 1) [76] presented summary result of yield ratio of 1.32 for organic plants and animals, on average, for 293 reports, i.e., +32% higher than on conventional farms. Stanhill (1990) [34] too found an average ratio from 205 comparisons of organic vs. conventional of 0.91 and concluded that “(organic) yields within 10% of those obtained in conventional agriculture have been achieved without the use of (synthetic) agrochemicals”. This should be tempered with the higher mineral content of organic yields (or, rather, a higher water content of chemical yields) that is often around 10–20%. It was already known [8,77,78] and from Widdowson (1987: 146) [32] that the dry matter content of Haughley’s organic crops and fodder were about 15% higher than the chemical crops, further increasing meaningful yields. One of the latter references (Stonehouse 1981: 290) [78] reported a 12-year experiment (by Schuphan 1974) that found gross organic vegetable yields −24% down, but their dry-matter on average +23 % above the conventional chemical crops, entirely canceling out any gross yield difference.
Nutritional value of organic produce is a further consideration as mineral, vitamin and water contents of some UK foods differ significantly over the period 1940–2002 (e.g., Thomas 2007) [79]. A 22-year Swedish study further proved organic wheat flour had higher ash content as a percentage of fresh weight with mean value 0.53 for conventional versus 0.67 for organic, i.e., organic grain had +26% extra minerals (0.47 vs. 0.33 or a true differences of ±14 percentage points) (Jorhem et al. 2013: Table 4) [80]. Routine reports of moisture contents of organic vs. conventional crops are rare but may be an important consideration. Furthermore, some crop comparisons are invalidated by just considering monoculture, whereas organic rotations and mixed-farming (rather than “mixed” organic plus synthetic fertilizers compromises) offer both higher and more diverse yields from the same “space of ground”.

4.8. Does Organic Farming Truly Require More Land?

The argument that organic farming would require more land has been partly answered above in regards to true dry-matter yield values and soil degradation issues. Several other factors also require consideration [81]. Claims that organic farming has equivalent irrigation needs and soil erosion losses in the Muller et al. (2017) [75] report is perhaps fallacious as organic farming and Permaculture are very much attuned to water conservation with humus and topsoil restoration (e.g., Mollison 1988 [82]). This is accompanied by better soil moisture relationships, for example, with higher infiltration and +28.7% water storage, as shown in reports from Rothamsted’s Broadbalk soils and the Haughley soil data presented above (Table 12 and Table 13). Interestingly, Rothamsted’s erstwhile director, Sir John Russell (1940) [83] found Broadbalk’s FYM plot had less run-off compared to the adjacent Nil plot: from 1903–1914 they drained on ten against 232 days, respectively, showing not only that water is stored in humus and at depth in soil (due mainly to earthworm activities), but also how soil erosion and nutrient leaching may be almost entirely reduced even with mediocre organic management.
It is important to realize that the dominant agricultural intensification system prevailing in the last century has already been associated with a 20–50% loss of soil fertility by erosion (as is noted below) and this is coupled with the dramatic and rapid annihilation of both vertebrates and invertebrates—as the main topic in this current report. Evidence shows a need for more balanced management to protect our finite soil ecosystem. UN’s severe criticism of chemicals is for damaging health and the environment yet not providing any improved crop protection for the last 40 years (UN 2017 original; and newspaper summary) [84,85]. This UN report also noted that in China 20% of arable land is rendered unfarmable due to chemical pollution, 33% of China’s surface water is polluted and >80% of its aquifer well water is unfit to drink or bathe in (Wong 2014; Zhou & Zhang 2016; USCC 2017: 16) [86,87,88]. In India the situation may be worse with 50% land degraded in some way, almost all water polluted and the annual direct cost of land loss put at $8.5 billion per year (Bhattacharyya et al. 2015) [89]. These facts point to intensive agriculture itself increasingly requiring more land in order to provide the same yields whilst, in contrast, organic production both ups yield and simultaneously conserves biodiversity thus integrating with nature reserves.

4.9. Earthworm Benefits

Whilst not considering organic farming per se, a recent meta-analysis [90] confirmed crop yield increases of +25% corresponding to presence of earthworms which, as the current study shows, are adversely depleted by agricultural intensification. This supports research over a century earlier by Wollny (1890: 381) [91] where adding earthworms led to a marked increases with some grain production doubled by up to 94% and straw higher by 107%. Inexplicably, earthworm benefits were not widely promoted since and are still mostly neglected with most agronomic glasshouse experiments using sterilized soils to avoid the inconvenient embarrassment of an earthworm. Yet it is impossible to replace or artificially engineer the myriad beneficial processes and services freely provided by earthworms [6,7]. In just one instance, their burrows in SOM-enriched pastures may extend up to 9000 km ha−1 [92] allowing ingress of air & water and providing living space for other soil organisms—including millions km ha1 of Vesicular Arbuscular Mycorrhiza (VAM) fungal hyphae, the spores of which are spread by worms (from www.davidmoore.org.uk/21st_Century_Guidebook_to_Fungi_PLATINUM/Ch01_05.htm). Earthworm activities thereby enhance natural mineralization in synchrony with plant needs in situ within the root zone catchments of soils.

4.10. Economic Considerations

It would be remiss to omit some broader economic evaluation. An updated 2017 review [93] estimates the value of ‘free’ ecological services with a median value of US$135 trillion per year that is almost double the global economic GDP of around $75 trillion [94]. Thus Ecology appears inarguably more important than Economy. Ecological losses from land use changes (mainly due to industrial-chemical agriculture) [93] are estimated at around $4 trillion per year which is about double the global combined Agriculture, Forestry and Fisheries contribution of $1.9 trillion [95]. A 2013 cost-benefit analysis estimated that environmental and human health damages caused by agricultural N pollution in the EU exceeded their economic benefits of increased agricultural production by about fourfold [96], supporting Rockström et al.’s (2009) [5] call for immediate reduction in synthetic nitrogen fertilizers by 25%. A recent UK report further shows chemical food incurs hidden costs that double the real price, mainly due to pollution and healthcare costs [97] making organic restoration an even more appealing and sensible option in terms of ecology, health and economy. Economic implications of climate change factors are also imminent (Figure 11).

5. Conclusions

We must turn all our resources to repairing the natural world” (Dr Bill Mollison, 1928–2016).
Critical biotic declines are linked to widespread intensive agrichemical practices that use simplistic chemical synthetics in non-laboratory settings as a replacement for natural processes. As stated in the laws of thermodynamics, it takes energy to maintain any system in a complex, ordered and sustainable state, and proportionately it takes twice the effort to double a vital resource (e.g., 50 to 100 is +100%) than to halve it (e.g., 100 to 50 is −50%). Rothamsted’s long-term trials clearly demonstrate that supply of organic FYM fertilizer (SOM) is most crucial to preservation of earthworms that otherwise decline by −50–100%, and that differing levels of synthetic fertilizers provide little, if any, overall benefit. Higher abundance and biodiversity appear attainable only when organic husbandry is fully implemented. Cases using mixed (i.e., combination of organic and chemical) compromises were demonstrated at Rothamsted’s Broadbalk or Barnfield, as at Haughley and in the Swiss DOK trials, to be just as deleterious as agrichemicals alone. Although this was less conclusively shown at Rothamsted, neither were fully non-chemical, organic methods meaningfully applied nor sought to be tested there.
Thus is it concluded that cascading soil fauna depletion occurs when woodland is cleared for pasture, when pasture is cultivated for crops, when synthetic fertilizers replaced organics, especially after WW1, and when excessive toxic and systemic biocides are introduced, especially after WW2, followed by the onslaught of alien/invasive species and diseases. Continued catastrophic trajectory for earthworms—the builders of fertile topsoils and humic SOM, upon which most life on Earth ultimately depends—seems as serious as for insects and most other organisms. Demonstrated solutions to restore biotic abundance and curtail loss of biodiversity are to readopt or to re-invest in more natural farming by recycling organic fertilizers and avoiding both waste and chemical poisons. Concomitant with a shift by farmers and consumers, governments may need to reallocate funding from agri-chemistry that continues to seek stop-gap solutions to problems often caused by chemical toxins themselves, and to raise support for practical, applied agro-ecology and sustainable Permaculture for efficient and flexible natural designs. It is timely to restore earthworms in order to rebuild topsoil humus thus allowing organic transition farming to rapidly reach its full capacity and to finally go “Beyond Organic” [98].
The findings of this report support the conclusions that excess N in agriculture leads to soil acidification, accelerates soil-organic-matter turnover and alters and/or disrupts soil faunal and microfloral communities [99]. This has resulted in declines in over half of UK wildlife species in recent decades with one in ten now heading towards extinction with the key drivers being “intensive agricultural practices and climate change” [100]. On a positive note, an incontrovertible loss of regional plant biodiversity due to atmospheric and soil nitrogen pollution reversed in just 20 years after synthetic fertilizer application ceased on some Rothamsted plots [101]. Although as yet unobserved in a wider landscape, such restoration, if pertaining to animals too, indicates a viable solution to earthworm depletions and, from this, a possible reversal in the insect and other species declines too.
Further monitoring with survey standardization is required on well-managed organic farms that likely retain heritage soil faunas, as well as in reservoir refuges which may yet support healthy earthworm populations for re-colonization and species recruitment into the intensified non-organic/agrichemical neighbours. Currently only limited information is available such that Global Biodiversity Information Facility search (www.gbif.org/search?q=earthworms%20organic, December 2017) yields one report, underscoring a deficit in knowledge of basic agroecosystem functioning and soil ecology. Our biospheric focus needs to shift from flying organisms to the vital underground web-of-life keeping our soils, and us, alive.

Supplementary Materials

Excel data file is available at https://archive.org/details/S1AppendixWormMSRJB that, as its final entry, debunks the UN FAO’s widely misconstrued “70% more food needed by 2050” claim.

Funding

This research received no external funding, although the earlier Haughley survey, completed in 1981 to mark the Centenary of Darwin’s ‘Earthworm’ book, was on a student grant by East Suffolk County Council. Some travel costs for Philippines’ surveys 2013–2014 were partly reimbursed by APN, Kobe, Japan.

Acknowledgments

Dr Margaret Glendining (e-RA curator) at Rothamsted Research Ltd. supplied open-access (i.e., without “non-disclosure”) information on long-term field trials. The Soil Association’s Martin Parkinson kindly photocopied some of Lady Eve Balfour’s original ‘Mother Earth’ articles. Constructive comments of anonymous referees, the editors (Kacey Wang and colleagues) and Dr Steph Greshon, are much appreciated.

Conflicts of Interest

The author declares no conflict of interest.

References

  1. Hallmann, C.A.; Sorg, M.; Jongejans, E.; Siepel, H.; Hofland, N.; Schwan, H.; Stenmans, W.; Müller, A.; Sumser, H.; Hörren, T.; et al. More than 75 percent decline over 27 years in total flying insect biomass in protected areas. PLoS ONE 2017, 12, e0185809. [Google Scholar] [CrossRef] [PubMed]
  2. Shortall, C.R.; Moore, A.; Smith, E.; Hall, M.J.; Woiwod, I.P.; Harrington, R. Long-term changes in the abundance of flying insects. Insect Conserv. Divers. 2009, 2, 251–260. [Google Scholar] [CrossRef] [Green Version]
  3. Ceballos, G.; Ehrlich, P.R.; Dirzo, R. Biological annihilation via the ongoing sixth mass extinction signaled by vertebrate population losses and declines. Proc. Natl. Acad. Sci. USA 2017. [Google Scholar] [CrossRef] [PubMed]
  4. WWF International. Living Planet Report 2016: Risk and Resilience in a New Era. Gland, Switzerland. 2016. Available online: http://wwf.panda.org/about_our_earth/all_publications/lpr_2016/ (accessed on 10 May 2018).
  5. Rockström, J.; Steffen, W.; Noone, K.; Persson, Å.; Chapin, F.S., III; Lambin, E.F. A safe operating space for humanity. Nature 2009, 461, 472–475. [Google Scholar] [CrossRef] [PubMed] [Green Version]
  6. Darwin, C.R. The Formation of Vegetable Mould through the Action of Worms, with Observation on Their Habits; Murray: London, UK, 1881. [Google Scholar]
  7. Lee, K.E. Earthworms: Their Ecology and Relationships with Soils and Land Use; Academic Press: Sydney, Australia, 1985. [Google Scholar]
  8. Blakemore, R.J. Cosmopolitan Earthworms—An Eco-Taxonomic Guide to the Peregrine Species of the World, 6th ed.; VermEcology: Yokohama, Japan, 2016. [Google Scholar]
  9. Tuck, S.L.; Winqvist, C.; Mota, F.; Ahnström, J.; Turnbull, L.A.; Bengtsson, J. Land-use intensity and the effects of organic farming on biodiversity: A hierarchical meta-analysis. J. Appl. Ecol. 2014, 51, 746–755. [Google Scholar] [CrossRef] [PubMed]
  10. Morris, H.M. The insect and other invertebrate fauna of arable land at Rothamsted. Ann. Appl. Biol. 1922, 9, 282–305. [Google Scholar] [CrossRef]
  11. Morris, H.M. The insect and other invertebrate fauna of arable land at Rothamsted. Part II. Ann. Appl. Biol. 1927, 14, 442–464. [Google Scholar]
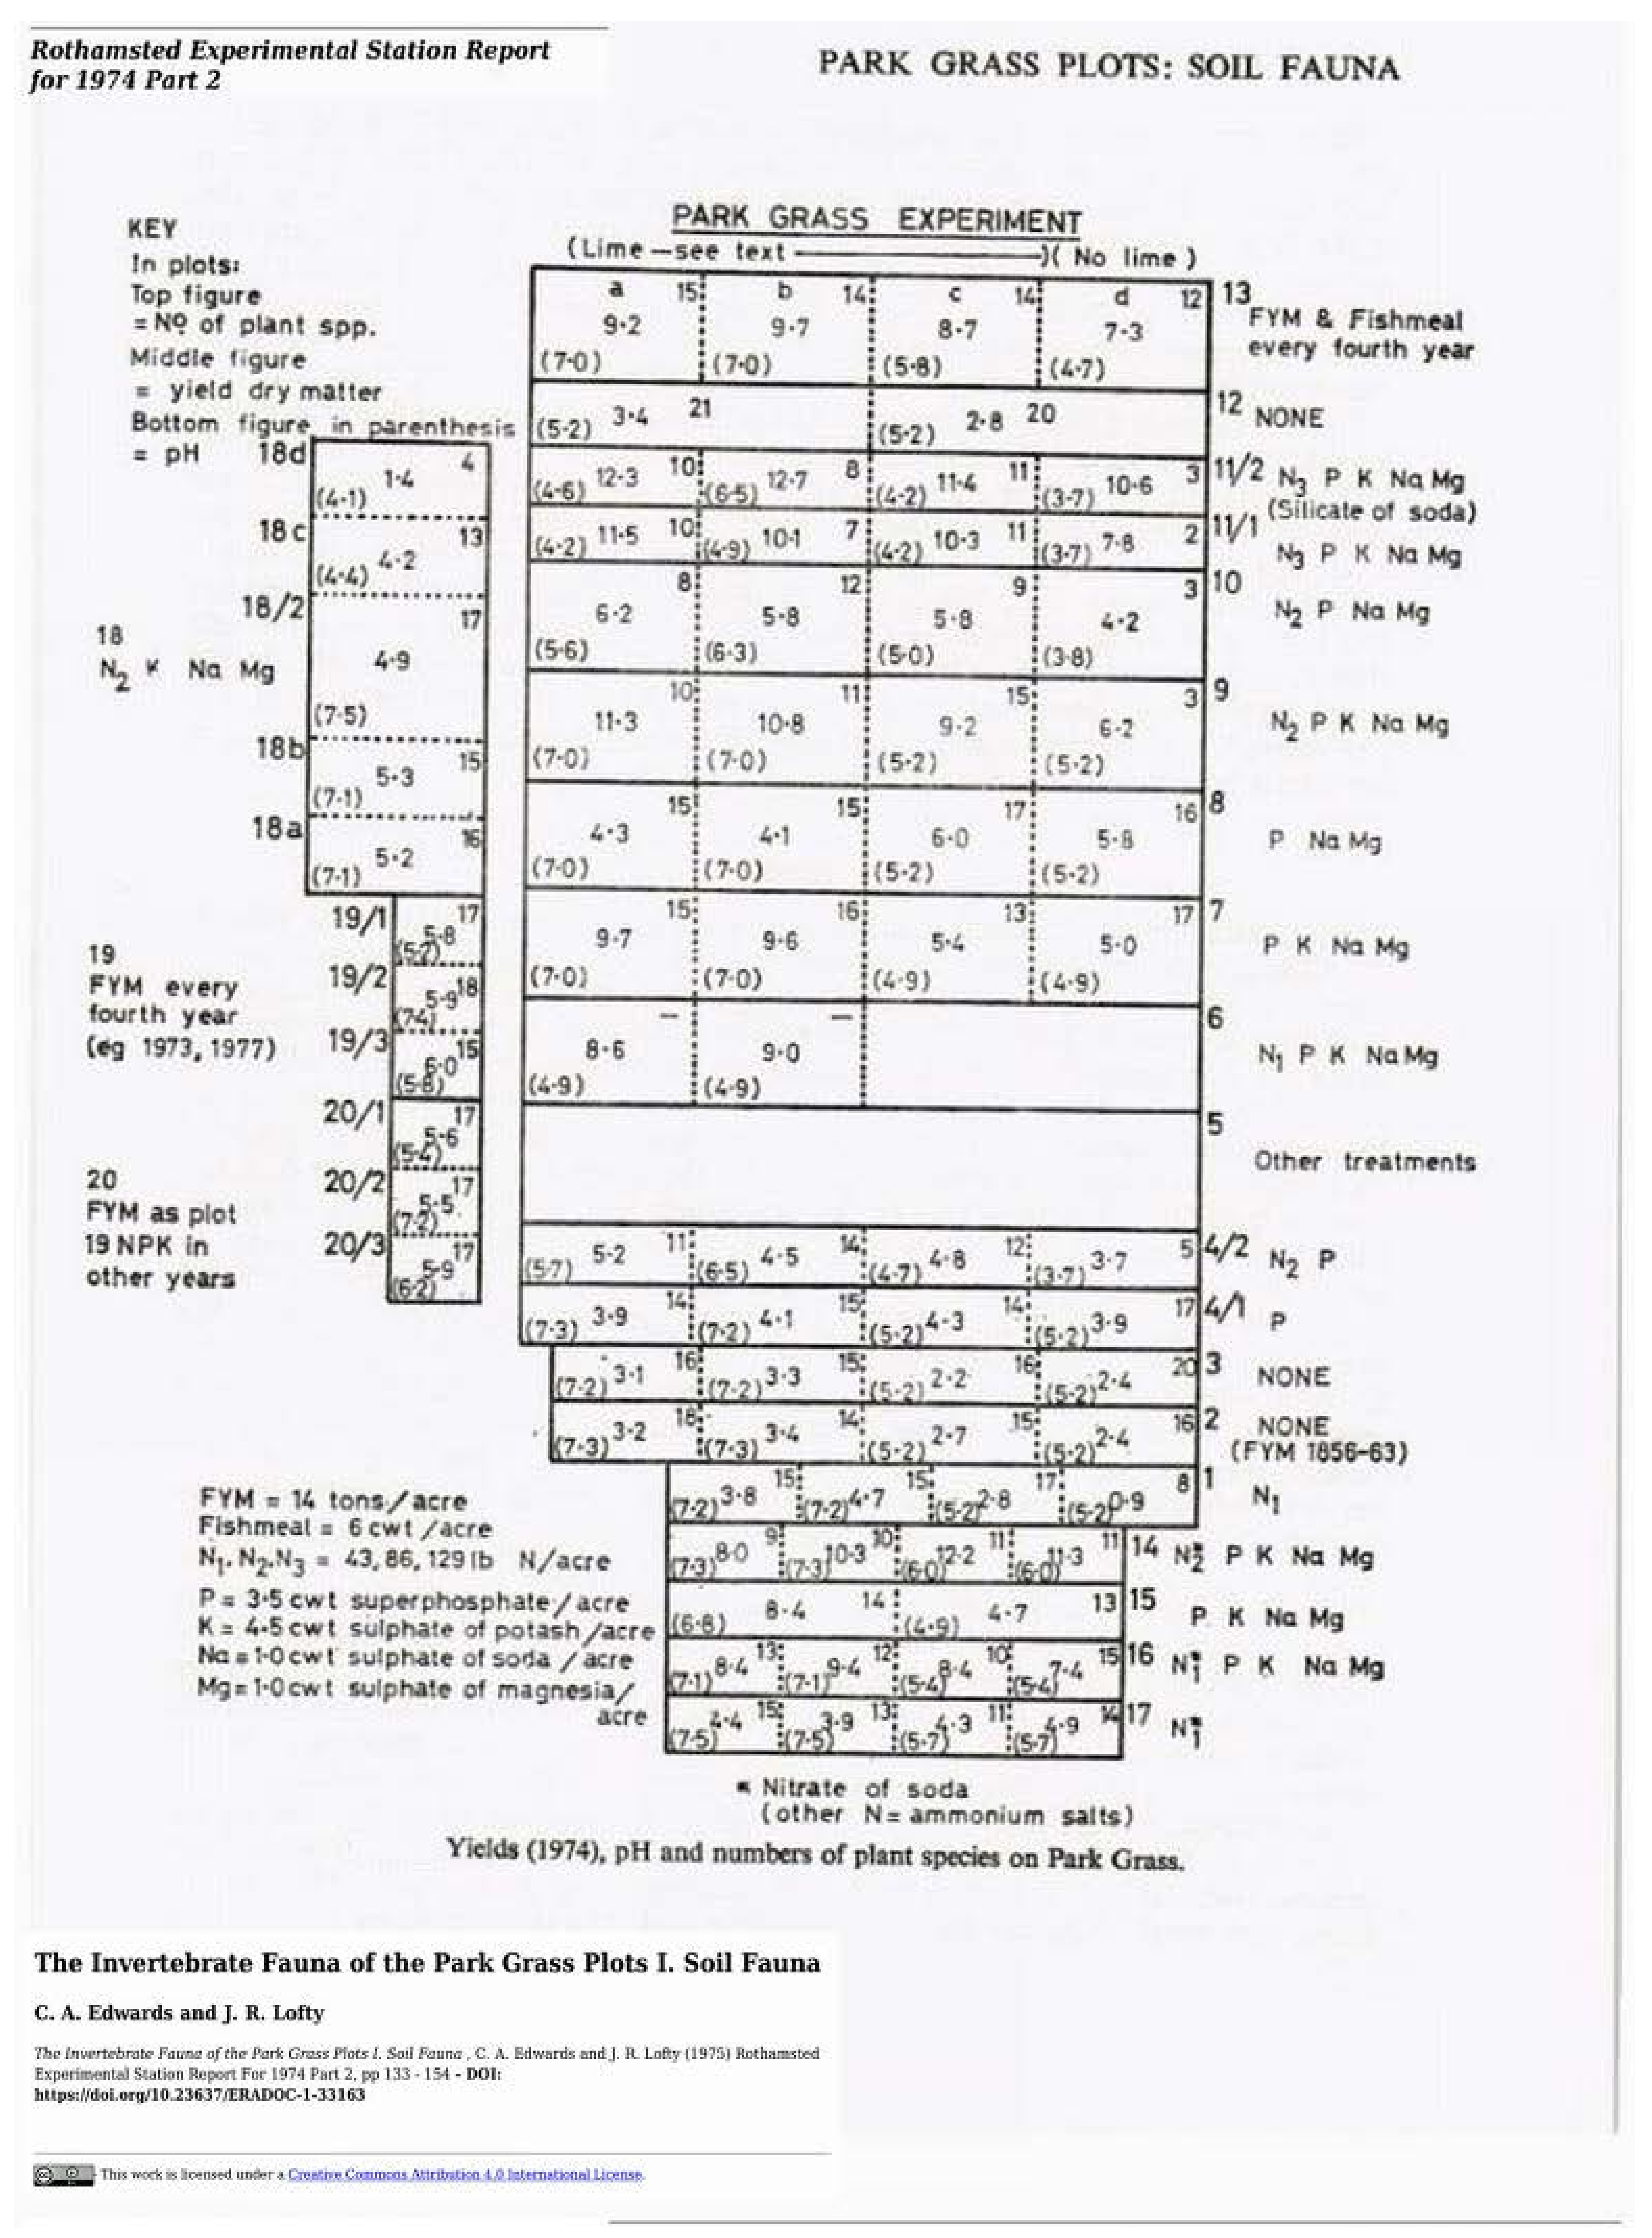
  12. Edwards, C.A.; Lofty, J.R. The invertebrate fauna of the Park Grass Plots. I. Soil fauna. Rothamsted Exp. Stn. Rep. 1974, 133–154. [Google Scholar]
  13. Edwards, C.A.; Lofty, J.R. Nitrogenous fertilizers and earthworms populations in agricultural soils. Soil Biol. Biochem. 1982, 147, 515–521. [Google Scholar] [CrossRef]
  14. Sizmur, T.; Martin, E.; Wagner, K.; Parmenteir, E.; Watts, C.; Whitmore, A.P. Milled cereal straw accelerates earthworm (Lumbricus terrestris) growth more than selected organic amendments. Appl. Soil Ecol. 2017, 113, 166–177. [Google Scholar] [CrossRef] [PubMed]
  15. Blakemore, R.J. Ecology of Earthworms under Different Fertilizer Regimes in Agriculture. BSc (Hons.) Bachelor’s Dissertation, Westminster University, London, UK, 1981. [Google Scholar]
  16. Blakemore, R.J. Ecology of earthworms under the “Haughley Experiment” of organic and conventional management regimes. Biol. Agric. Hortic. 2000, 18, 141–159. Available online: http://orgprints.org/30000/ (accessed on 10 May 2018). [CrossRef]
  17. Blakemore, R.J. Veni, Vidi, Vermi—II. Earthworms in organic fields restore SOM & H2O and fix CO2. Verm Ecol. Occas. Pap. Veop 2016, 2, 1–26. [Google Scholar]
  18. Balfour, E.B. The Living Soil and the Haughley Experiment, 2nd ed.; Faber & Faber: London, UK, 1975. [Google Scholar]
  19. Balfour, E.B. Towards a Sustainable Agriculture The Living Soil. Address to an International Federation of Organic Agricultural Movements (IFOAM) Conference in Switzerland. 1977. Available online: http://www.soilandhealth.org/01aglibrary/010116Balfourspeech.html (accessed on 10 May 2018).
  20. Pfiffner, L.; Mäder, P. Effects of Biodynamic, Organic and Conventional Production Systems on Earthworm Populations. Biol. Agric. Hortic. 1997, 15, 3–10. [Google Scholar] [CrossRef]
  21. Birkhofer, K.; Bezemer, T.M.; Bloem, J.; Bonkowski, M.; Christensen, S.; Dubois, D.; Setälä, H. Long-term organic farming fosters below and aboveground biota: Implications for soil quality, biological control and productivity. Soil Biol. Biochem. 2008, 40, 2297–2308. [Google Scholar] [CrossRef]
  22. Rothamsted Research. Guide to the Classical and other Long-term Experiments, Datasets and Sample Archive. Lawes Agricultural Trust. 2012, p. 51. Available online: www.rothamsted.ac.uk/sites/default/files/LongTermExperiments_PDF.pdf (accessed on 10 May 2018).
  23. Franklin, J.F. Importance and justification of long-term studies in ecology. In Long-Term Studies in Ecology; Likens, G.E., Ed.; Springer-Verlag: New York, NY, USA, 1989; pp. 3–19. [Google Scholar]
  24. Poulson, P.R. The Rothamsted long-term experiments: Are they still relevant? Can. J. Plant Sci. 1996, 76, 559–571. [Google Scholar] [CrossRef] [Green Version]
  25. Balfour, E.B. The Living Soil: Evidence of the Importance to Human Health of Soil Vitality, with Special Reference to Post-War Planning, 7th ed.; Faber and Faber Ltd.: London, UK, 1948. [Google Scholar]
  26. Johnston, A.E.; Garner, H.V. Rothamsted Experimental Station Report for 1968—Part 2. 1969, pp. 12–25. Available online: http://www.era.rothamsted.ac.uk/eradoc/OCR/ResReport1968p2-12-25 (accessed on 10 May 2018).
  27. Clark, I.M.; Buchkina, N.; Jhurreea, D.; Goulding, K.W.; Hirsch, P.R. Impacts of nitrogen application rates on the activity and diversity of denitrifying bacteria in the Broadbalk Wheat Experiment. Philos. Trans. R. Soc. Lond. B Biol. Sci. 2012, 367, 1235–1244. [Google Scholar] [CrossRef] [PubMed] [Green Version]
  28. Martindale, W. The Rothamsted Long Term Agricultural Experiments. 2001. Available online: https://waynemartindale.files.wordpress.com/2017/04/oecdfellowship1004.pdf (accessed on 10 May 2018).
  29. Jones, K.C.; Johnston, A.E. Cadmium in cereal grain and herbage from long-term experimental plots at Rothamsted, UK. Environ. Pollut. 1989, 57, 199–216. [Google Scholar] [CrossRef]
  30. Addiscott, T.M. Nitrate, Agriculture, and the Environment; CABI Publishing: Wallingford, UK, 2005. [Google Scholar]
  31. Rothamsted Research. Open Access e-RA Report. December 2017. Available online: www.era.rothamsted.ac.uk/metadata/broad/Broadbalk_YieldsJune2017.xlsx (accessed on 10 May 2018).
  32. Widdowson, R.W. Towards Holistic Agriculture: A Scientific Approach; Pergammon: London, UK, 1987. [Google Scholar]
  33. Hogg, D. Technological Change in Agriculture: Locking in to Genetic Uniformity; St. Martin’s Press: New York, NY, USA, 2000; p. 296. [Google Scholar]
  34. Stanhill, G. The comparative productivity of organic agriculture. Agric. Ecosyst. Environ. 1990, 30, 1–26. [Google Scholar] [CrossRef]
  35. Mäder, P.; Fließbach, A.; Dubois, D.; Gunst, L.; Fried, P.; Niggli, U. Soil fertility and biodiversity in organic farming. Science 2002, 296, 1694–1697. [Google Scholar] [CrossRef] [PubMed]
  36. Korcak, R.F. Early Roots of the Organic Movement: A Plant Nutrition Perspective. Hort. Technol. 1992, 2, 263–267. [Google Scholar]
  37. Loudon, J.C. An Encyclopædia of Agriculture; Longmans: London, UK, 1826. [Google Scholar]
  38. Rothamsted Research. Open Access e-RA Report. December 2017. Available online: http://www.rothamsted.ac.uk/sites/default/files/LongTermExperiments_PDF.pdf (accessed on 10 May 2018).
  39. Researchgate.net Article. December 2017. Available online: www.researchgate.net/post/What_are_the_typical_N_P_and_K_values_of_farmyard_manure (accessed on 10 May 2018).
  40. Blakemore, R.J. The diversity of exotic earthworms in Australia—A status report. In Proceedings of “The Other 99%”; Transactions of the Royal Zoological Society of NSW; Ponder, W., Lunney, D., Eds.; Royal Zoological Society of NSW: Sydney, NSW, Australia, 1999; pp. 182–187. Available online: http://www.annelida.net/earthworm/Australasian%20Earthworms/Australian%20Exotics.pdf (accessed on 10 May 2018).
  41. Delate, K.; Cambardella, C.; Chase, C.; Turnbull, R. A review of long-term organic comparison trials in the U.S. Sustain. Agric. Res. 2015, 4, 5–14. [Google Scholar] [CrossRef]
  42. Rutgers, M.; Schouten, A.; Bloem, J.; Van Eekeren, N.; De Goede, R.; Jagersop Akkerhuis, G.; van der Wal, A.; Mulder, C.; Brussaard, L.; Breure, A.M. Biological measurements in a nationwide soil monitoring network. Eur. J. Soil Sci. 2009, 60, 820–832. [Google Scholar] [CrossRef]
  43. Jänsch, S.; Steffens, L.; Höfer, H.; Horak, F.; Roß-Nickoll, M.; Russell, D.; Nickoll, R.; Römbke, J. State of knowledge of earthworm communities in German soils as a basis for biological soil quality. Soil Org. 2013, 85, 215–233. [Google Scholar]
  44. Bauchhenß, J. Zeitliche veränderungen der regenwurm-taxozönosen auf grünland und auf ackerflachen. In 20 Jahre Bodendauerbeobachtung in Bayern. Zwischenbilanz der wichtigsten Ergebnisse 1985–2005; LfL-Schriftenreihe 8/2005; Bayerische Landesanstalt für Landwirtschaft: Freising, Germany, 2005; pp. 41–48. Available online: https://www.lfl.bayern.de/mam/cms07/publikationen/daten/schriftenreihe/p_19778.pdf (accessed on 10 May 2018).
  45. Van Leeuwen, J.P.; Saby, N.; Jones, A.; Louwagie, G.; Micheli E Rutgers, M. Gap assessment in current soil monitoring networks across Europe for measuring soil functions. Environ. Res. Lett. 2007, 12, 124007. [Google Scholar] [CrossRef]
  46. Rutgers, M.; Orgiazzi, A.; Gardi, C.; Römbke, J.; Jänsch, S.; Keith, A.M. Mapping earthworm communities in Europe. Appl. Soil Ecol. 2016, 97, 98. [Google Scholar] [CrossRef]
  47. Blakemore, R.J. Earthworms of South-East Queensland and Their Agronomic Potential in Brigalow Soils. Ph.D. Thesis, University of Queensland, St. Lucia, QLD, Australia, 1994; p. 605. [Google Scholar]
  48. Blakemore, R.J. Veni, Vidi, Vermi—I. On the contribution of Darwin’s ‘humble earthworm’ to soil health, pollution-free primary production, organic ‘waste’ management & atmospheric carbon capture for a safe and sustainable global climate. Verm Ecol. Occas. Pap. Veop. 2016, 2, 1–34. Available online: https://veop.files.wordpress.com/2016/09/vvv-i.pdf (accessed on 10 May 2018).
  49. Blakemore, R.J. Miscellaneous earthworm types in the Natural History Museum, London (Annelida: Oligochaeta: Megadrilacea: Eudrilidae, Lumbricidae, Megascolecidae, Moniligastridae, Octochaetidae). Opusc. Zool. Inst. Zoosyst. Oecol. Univ. Bp. 2014, 45, 119–155. [Google Scholar]
  50. Hutcheon, A.; Iles, D.R.; Kendall, D.A. Earthworm populations in conventional and integrated farming systems in the LIFE Project (SW England) in 1990–2000. Ann. Appl. Biol. 2001, 139, 361–372. [Google Scholar] [CrossRef]
  51. Sabrina, D.T.; Hanafi, M.M.; Nor Azwady, A.A.; Mahmud, T.M.M. Earthworm populations and cast properties in the soils of oil palm plantations. MJSS 2009, 13, 29–42. [Google Scholar]
  52. Lee, J.A.; McNeil, S.; Rorison, L.H. (Eds.) Nitrogen as an Ecological Parameter: Cereal Aphids; Blackwell Scientific Press: Oxford, UK, 1979; pp. 283–300. [Google Scholar]
  53. Heaton, S. Organic Farming, Food Quality and Human Health; Soil Association Report; Soil Association: Bristol, UK, 2001; p. 87. [Google Scholar]
  54. Soule, J.; Piper, J. Farming in Nature’s Image; Island Press: Washington, DC, USA, 1992. [Google Scholar]
  55. Pimentel, D. Environmental and economic costs of the application of pesticides primarily in the United States. Environ. Dev. Sustain. 2005, 7, 229–252. [Google Scholar] [CrossRef]
  56. Briones, M.J.I.; Schmidt, O. Conventional tillage decreases the abundance and biomass of earthworms and alters their community structure in a global meta-analysis. Glob. Chang. Biol. 2017. [Google Scholar] [CrossRef] [PubMed]
  57. Crittenden, S.J.; Eswaramurthy, T.; de-Goede, R.G.M.; Brussaard, L.; Pulleman, M.M. Effect of tillage on earthworms over short- and medium-term in conventional and organic farming. Appl. Soil Ecol. 2014, 83, 140–148. [Google Scholar] [CrossRef]
  58. Howard, A. An Agricultural Testament; Oxford University Press: London, UK, 1947. [Google Scholar]
  59. Gill, E. Lady Eve Balfour and the British Organic Food and Farming Movement. Ph.D. Thesis, Aberystwyth University, Aberystwyth, UK, 2010. [Google Scholar]
  60. Treseder, K.K. A meta-analysis of mycorrhizal responses to nitrogen, phosphorus, and atmospheric CO2 in field studies. New Phytol. 2004, 164, 347–355. [Google Scholar] [CrossRef] [Green Version]
  61. Tian, D.; Niu, S. A global analysis of soil acidification caused by nitrogen addition. Environ. Res. Lett. 2015, 10. [Google Scholar] [CrossRef]
  62. NOAA. A Primer on pH. 2017. Available online: https://www.pmel.noaa.gov/co2/story/A+primer+on+pH (accessed on 10 May 2018).
  63. Gilbert, N. Acid soil threatens Chinese farms. Nature 1989. [Google Scholar] [CrossRef]
  64. UK Government Reports. UK Soil Degradation. July 2006 Number 265. Available online: http://www.parliament.uk/documents/post/postpn265.pdf (accessed on 10 May 2018).
  65. Research. Open Access e-RA Report. December 2017. Available online: https://www.rothamsted.ac.uk/sites/default/files/soil-health.pdf (accessed on 10 May 2018).
  66. Edmondson, J.L.; Davies, Z.G.; Gaston, K.J.; Leake, J.R. Urban cultivation in allotments maintains soil qualities adversely affected by conventional agriculture. J. Appl. Ecol. 2014. [Google Scholar] [CrossRef] [PubMed]
  67. Withnall, A. Independent Newspaper Article. 2014. Available online: http://www.independent.co.uk/news/uk/home-news/britain-facing-agricultural-crisis-as-scientists-warn-there-are-only-100-harvests-left-in-our-farm-9806353.html (accessed on 10 May 2018).
  68. Crawford, J. What if the World’s Soil Runs Out? Time, 14 December 2012. Available online: http://world.time.com/2012/12/14/what-if-the-worlds-soil-runs-out/(accessed on 10 May 2018).
  69. Arsenault, C.; Only 60 Years of Farming Left if Soil Degradation Continues. Sci. Am. 2014. Available online: https://www.scientificamerican.com/article/only-60-years-of-farming-left-if-soil-degradation-continues/ (accessed on 10 May 2018).
  70. Bengtsson, J.; Ahnstrom, J.; Weibull, A.C. The effects of organic agriculture on biodiversity and abundance: A meta-analysis. J. Appl. Ecol. 2015, 42, 261–269. [Google Scholar] [CrossRef]
  71. Ewald, J.A.; Wheatley, C.J.; Aebischer, N.J.; Moreby, S.J.; Duffield, S.J.; Crick, H.Q. Influences of extreme weather, climate and pesticide use on invertebrates in cereal fields over 42 years. Glob. Chang. Biol. 2015, 21, 3931–3950. [Google Scholar] [CrossRef] [PubMed]
  72. Lawes, J.B.; Gilbert, J.H. The Rothamsted Memoirs on Agricultural Chemistry and Physiology. Vol. I: Reports of Field Experiments, &c, &c; Clowes & Sons: London, UK, 1893. [Google Scholar]
  73. Worldwatch Institute. Can Organic Farming Feed Us All? 2006. Available online: http://www.worldwatch.org/node/4060 (accessed on 10 May 2018).
  74. UN Report 2010. Available online: http://www2.ohchr.org/english/issues/food/docs/A-HRC-16-49.pdf (accessed on 10 May 2018).
  75. Muller, A.; Schader, C.; Scialabba, N.E.H.; Brüggemann, J.; Isensee, A.; Erb, K. Strategies for feeding the world more sustainably with organic agriculture. Nat. Commun. 2017, 8, 1290. [Google Scholar] [CrossRef] [PubMed] [Green Version]
  76. Badgley, C.; Moghtader, J.; Quintero, E.; Zakem, E.; Chappell, M.J.; Aviles-Vazquez, K. Organic agriculture and the global food supply. Renew. Agric. Food Syst. 2007, 22, 86–108. [Google Scholar] [CrossRef]
  77. Mayall, S. An English Organic Farm; Soil Association: Haughley, UK, 1965. [Google Scholar]
  78. Stonehouse, B. Biological Husbandry: A Scientific Approach to Organic Farming; Butterworths: London, UK, 1981. [Google Scholar]
  79. Thomas, D. The mineral depletion of foods available to us as a nation (19402002)—A review of the 6th Edition of McCance & Widdowson. Nutr. Health 2007, 19, 21–55. [Google Scholar] [PubMed]
  80. Jorhem, L.; Sundström, B.; Engman, J. Trends in Cadmium and Certain. Other Metal in Swedish Household. Wheat and Rye Flours 1983–2009: National Food Agency, Sweden. Livsmedels. Verket. Rapport 16, 2013. Available online: https://www.livsmedelsverket.se/globalassets/rapporter/2013/2013-national-food-agency-16---trends-in-cadmium-and-certain-other-metal-in-swedish-household-wheat-and-rye-flours-1983-2009.pdf (accessed on 10 May 2018).
  81. Johnson, N. Do Industrial Agricultural Methods Actually Yield More Food Per Acre Than Organic Ones? grist.org Commentary, 14 October 2015. Available online: http://grist.org/food/do-industrial-agricultural-methods-actually-yield-more-food-per-acre-than-organic-ones/(accessed on 10 May 2018).
  82. Mollison, B. Permaculture: A Designers’ Manual; Tagari Publications: Sisters Creek, Australia, 1988. [Google Scholar]
  83. Russell, E.J. A Student’s Book on Soils & Manures, 3rd ed.; Cambridge University Press: Cambridge, UK, 1940. [Google Scholar]
  84. UN Report December 2017. Available online: https://documents-dds-ny.un.org/doc/UNDOC/GEN/G17/017/85/PDF/G1701785.pdf?OpenElement (accessed on 10 May 2018).
  85. Guardian Newspaper. 7 March 2017. UN Experts Denounce Myth that Pesticides are Necessary to Feed the World. Available online: https://www.theguardian.com/environment/2017/mar/07/un-experts-denounce-myth-pesticides-are-necessary-to-feed-the-world (accessed on 10 May 2018).
  86. Wong, E. One-Fifth of China’s Farmland is Polluted, State Study Finds. The New York Times, 17 April 2014. [Google Scholar]
  87. Zhou, C.; Zhang, Y.; China’s Tainted Soil Initiative Lacks Pay plan. Caixinglobal. 2016. Available online: https://www.caixinglobal.com/2016-06-08/101011627.html (accessed on 10 May 2018).
  88. USCC Report. 14 February 2017. Available online: https://www.uscc.gov/sites/default/files/Research/The%2013th%20Five-Year%20Plan_Final_2.14.17_Updated%20%28002%29.pdf (accessed on 10 May 2018).
  89. Bhattacharyya, R.; Ghosh, B.N.; Mishra, P.K.; Mandal, B.; Rao, C.S.; Sarkar, D. Soil degradation in India: Challenges and potential solutions. Sustainability 2015, 7, 3528–3570. [Google Scholar] [CrossRef]
  90. Van Groenigen, J.W.; Lubbers, I.M.; Vos, H.M.J. Earthworms increase plant production: A meta-analysis. Sci. Rep. 2014, 4, 6365. [Google Scholar] [CrossRef] [PubMed]
  91. Wollny, E. Forschungen auf der Gebiet der Agrikultur-Physik; Carl Winter´s Universitätsbuchhandlung: Heidelberg, Germany, 1890. [Google Scholar]
  92. Kretzschmar, A. Description des galeries de vers de terre et variations saisonnières des réseaux (observations en conditions naturelles). Rev. Ecol. Biol. Sol. 1982, 19, 579–591. [Google Scholar]
  93. Costanza, R.; Groot RS de Sutton, P.; Ploeg S van der Anderson, S.J. Changes in the global value of ecosystem services. Global Environ. Chang. Hum. Policy Dimens. 2014, 26, 52–158. [Google Scholar] [CrossRef]
  94. Fitzpatrick, I. Valuing Nature and the Hidden Costs of Biodiversity Loss. 2017. Available online: http://sustainablefoodtrust.org/articles/valuing-nature-and-the-hidden-costs-of-biodiversity-loss/?utm_source=SFT+Newsletter&utm_campaign=5117bb6a15-Newsletter_26_10_2017&utm_medium=email&utm_term=0_bf20bccf24-5117bb6a15-105104433 (accessed on 10 May 2018).
  95. UN-FAO Report. 2015. Available online: www.fao.org/fileadmin/templates/ess/documents/GDP/IND_NewsRelease_EN__27Apr2015_.pdf (accessed on 10 May 2018).
  96. Van Grinsven, H.J.; Holland, M.; Jacobsen, B.H.; Klimont, Z.; Sutton, M.A.; Jaap Willems, W. Costs and benefits of nitrogen for Europe and implications for mitigation. Environ. Sci. Technol. 2013, 47, 3571–3579. [Google Scholar] [CrossRef] [PubMed]
  97. Fitzpatrick, I.; Young, R.; Perry, M.; Rose, E. The Hidden Cost of UK Food: Summary Report November 2017, p. 20. Available online: http://sustainablefoodtrust.org/wp-content/uploads/2013/04/Summary-PDF-9-Nov-for-online.pdf (accessed on 10 May 2018).
  98. Reganold, J.P.; Wachter, J.M. Organic agriculture in the twenty-first century. Nat. Plants 2016, 2, 15221. [Google Scholar] [CrossRef] [PubMed]
  99. Cheeke, T.E.; Coleman, C.; Wall, D.H. Microbial Ecology in Sustainable Agroecosystems; CRC Press: Boca Raton, FL, USA, 2013. [Google Scholar]
  100. UK National Trust “The State of Nature Report 2016”. Available online: https://www.nationaltrust.org.uk/features/the-state-of-nature-report-2016 (accessed on 10 May 2018).
  101. Storkey, J.; Macdonald, A.J.; Poulton, P.R.; Scott, T. Grassland biodiversity bounces back from long-term nitrogen addition. Nature 2015, 528, 401–404. [Google Scholar] [CrossRef] [PubMed]
Figure 1. Rothamsted’s Broadbalk LTE, started in 1843, with survey plots indicated. [Creative Commons Attribution 4.0 licenses by www.era.rothamsted.ac.uk, Rothamsted Research Ltd.].
Soilsystems 02 00033 g001
Figure 2. Rothamsted’s Park Grass layout (from Edwards & Lofty, 1975: Figure 1).
Soilsystems 02 00033 g002
Figure 3. Rothamsted’s Barn Field (or Barnfield) layout when surveyed by F. Raw in c. 1959 as reported by Edwards & Lofty (1982) [13], and site description (from Morris’s, 1927 survey report) [11].
Soilsystems 02 00033 g003
Figure 4. Haughley Experimental farm as in operation 1939–1985, with survey fields indicated.
Soilsystems 02 00033 g004
Figure 5. UK high-flying insect biomass (g/day) untransformed to comply with German malaise trap data with 95% confidence intervals added; populations with α curves are in decline, β curve fluctuations are for lesser populations that seemingly already collapsed prior to survey.
Soilsystems 02 00033 g005
Figure 6. Rothamsted’s soil invertebrate abundance (biomass unavailable): Broadbalk mean numbers m−2 for FYM vs. Nil (Morris 1922) [10]; Barnfield FYM vs. no FYM (i.e., minerals or Nil started in “1876”) (Morris 1927) [11]; and Park Grass FYM vs. NPK (Edwards & Lofty 1975, their values given as 1/20th for comparison) [12]; including or excluding megadriles makes little difference to total counts. Mean decline rate is −56.4%.
Soilsystems 02 00033 g006
Figure 7. Comparative earthworm biomass (g/m2) plotted against experimental duration [means = 68.6 ± 24.4 vs. 18.9 ± 10.8 (−72.5%), ANOVA *** p = 0.003, i.e., significant α decline]; abbreviations for field sites are the same as in Table 11.
Soilsystems 02 00033 g007
Figure 8. Rothamsted’s Broadbalk wheat yields from 1855–2017 or >130 years (e-RA [22]) showing FYM equivalent to NPK yields throughout; here overlain with unsustained earthworm counts (from Morris 1922, Edwards & Lofty 1982, Sizmur et al. 2017) as % change in FYM vs. NPK (or, only in 1921, unfertilized) plots, clearly showing that chemicals kill worms. Note that the highest periodic rotation wheat yields of ~10 tha−1 just match wheat yields of 9.9 tha−1 as certified from an organic farm in Bhopal, India—three times (or +200%) the local Indian average [48: Appendix].
Soilsystems 02 00033 g008
Figure 9. Inconsistent data from Edwards & Lofty (1975: Table 4, Figures 7 and 8; 1985: Figures 1–3).
Soilsystems 02 00033 g009
Figure 10. SOC at Rothamsted’s Broadbalk (from e-RA), with comment that starting values may have been higher, even than Lawes & Gilbert (1985) estimated; note too that FYM plots’ SOC are plateauing whilst in NPK, or PK alone, it remains depleted. Often correlating with SOC/SOM, earthworms in FYM plots 1–2 are likely nearest original/optima as found in fields organically managed by tradition/convention prior to introduction of synthetics fertilizers in the 1840s.
Soilsystems 02 00033 g010
Figure 11. Air temperature chart at Rothamsted showing Kyoto (COP 10, 21) +2 ºC levels nearly exceeded, highlighting the immediate actions now required to restore SOC to reduce CO2 [17], even though climate change is the least of our most urgent environmental issues [5]. Note that organic Haughley soil at 10 cm depth simultaneously differed ±2 ºC in adjacent fields (Table 13).
Soilsystems 02 00033 g011
Table 1. Soil insect and other invertebrate summary from Rothamsted’s “Barn Field” during 1923–1926 survey, i.e., ~80 years since 1843, recalculated from Morris (1927: Table 1) [11] (% change).
Treatment − Plot CodeTotals m−2 (% Change)Earthworms m−2 (%)
Farm-yard manure (FYM) − O13198 (0%)237 (0%)
Mix FYM + NH4 salts − A12597 (−19%)153 (−35%)
Mix FYM + PK − O22334 (−27%)137.9 (−42%)
Superphosphate − O5428 (−87%)0 (−100%)
Ammonium NH4 salts − A8348 (−89%)4 (−98%)
Nil fertilizer − O8298 (−98%)6 (−98%)
Table 2. Broadbalk (wheat) earthworms, Spring 2014 at 170 years (Sizmur et al. 2017: Figure 2, Tables A1 and A2) in manure (FYM) and synthetic Nitrogen (NPK) fertilizer plots [14] (% change).
Treatment (Plot)Abundance m−2 (% Change)Biomass gm−2 (% Change)
Mean FYM (plot 2.1; n = 2)400.00 (0%) a108.90 (0%) c
Mean NPK (plot 8; n = 2)70.35 (−82.4%) b**6.05 (−94.4%) d***
Sample plots are 2.1 and 8 in sections 0 (straw) and 1 (no straw) (T. Sizmur pers. comm.). Note that according to Rothamsted information, FYM in 2.1 was applied from 1885, not 1843 as in plot 2.2; subsequently plot 2.1 FYM was augmented with synthetic N (at 2N, a rate of 96 kg N ha−1 after 1968, raised to 3 N or 144 kg N ha−1 after 2005). Superscript mismatches differ significantly (column t-tests; ** p = < 0.05; *** p = < 0.01).
Table 3. Broadbalk (wheat) earthworm survey in 1979 after 135 years (Edwards & Lofty 1982: Table 2 —note these data differ considerably from their Figures 1b, 2 and 3 values) [13] (% change).
Treatment (Plot)Abundance m−2 (%)Biomass gm−2 (%)
FYM (plots 2.1, 2.2; n = 2) #(94.2 + 89.4)/2 = 91.8 (0%)(71 + 44)/2 = 57.1 (0%)
4N (plot 9, n = 4)42.9 (−53.3%)25.9 (−54.6%)
3N (plot 8, n = 4)30.6 (−66.7%)13.7 (−76.0%)
2N (plot 7, n = 4)20.9 (−77.2%)6.2 (−89.1%)
1N (plot 6, n = 4)10.0 (−89.1%)4.7 (−91.8%)
Mean of all four N plots26.1 (−71.6%)12.6 (−77.9%)
Nil fertilizers (plots 5, 3; n = 2)(7.5 + 5.6)/2 = 6.5 (−92.9%)(8.9 + 2.7)/2 = 5.8 (−89.8%)
# Combining of FYM plot data is justified by 2-way ANOVA showing no significant difference (p = 0.62, NS); plots 2.1 and 8 were also surveyed by Sizmur et al. (2017) [14]; and plots 2 and 3 were first surveyed by Morris (1922) [10] giving populations of “Oligochaeta (Terricolae)” of 1,010,101 in FYM manure vs. 457,912 per acre in Nil fertilizer (= 250 vs. 113 m−2), a % change of −55%.
Table 4. Rothamsted’s Park Grass (pasture) in 1973–1974 survey after 118 yrs, recalculated from original (correct?) data in Edwards & Lofty (1975: Table 4) [12] that differs somewhat from the same data proffered in Edwards & Lofty (1982: Table 4) [13] (% change).
Treatment (Plot)Abundance m−2 (% Change)Biomass gm−2 (% Change)
FYM Plot 13 (n = 4) #55.0 (0%)66.9 (0%)
Nil fertilizer Plots 2, 3, 12 (n = 8)37.9 (−31.1%)43.1 (−43.16%)
NPK Plots 14, 16 (n = 4)17.3 (−68.6%)21.8 (−67.5%)
# FYM at 35 t ha−1 was generally applied every fourth year, supplemented with fishmeal; Edwards & Lofty (1975: 146) [12] noted that “Satchell (1955)”, in an unpublished PhD study, used unreliable electrical methods on Park Grass, thus his data (with a mean loss −67%) are excluded.
Table 5. Rothamsted’s 1843 Barn Field (or Barnfield) root crops, 1959 earthworm survey, i.e., >116 years, recalculated from Edwards & Lofty (1982: Table 3) [13] (% change).
Treatment (and Plots?) #Abundance m−2 (%)Biomass gm−2 (%)
FYM (n = 1, O1)78.7 (0%)43.7 (0%)
FYM + 2N (NH4) (A1+?)76.8 (−2.4%)46.4 (6.2%)
FYM + 2N (NaNO3) (O2?)35.8 (−54.5%)17.1 (−60.9%)
2N + superphosphate28.9 (−63.3%)19.2 (−56.1%)
Nil fertilizer (n = 1, O8?)10.6 (−86.5%)6.9 (−84.2%)
# Actual plot codes were not provided; and possibly plots with zero worms were deliberately excluded (cf. Tables 1 and 6 data for Barnfield plot O5 from Morris (1927) [11]), or else interim management changes may have partially restored the depleted fauna. Although uncited [13], Table 5 data was partly extracted from a Rothamsted annual report by F. Raw (1961: 156; online: www.era.rothamsted.ac.uk/eradoc/article/ResReport1960-154-167). For completeness and comparison, Raw’s original data is presented in Table 6.
Table 6. Rothamsted’s Barnfield root crops, 1959 (Raw, 1961) earthworm biomass (gm−2).
Plot Series (Treatment)“Dung (14 t/yr)”P-K-Na-Mg“No Manure”
AC, (NaNO3 + rape)78.819.324.1
N, ((HN4)2SO4)106.21.72.5
A, (NaNO3)62.430.310.2
O, no Nitrogen49.50.63.9
Mean of totals (gm−2)74.2412.9510.17
Total means % change0.0%−82.6%−86.3
It is not entirely clear how Raw’s figures relate to Edwards & Lofty (1982: Table 3) data [13].
Table 7. Earthworm survey summary from Barnfield during 1923–1926, i.e., >50 years under continuous mangolds since 1876, with yields in 1924 (in Imperial tons, here converted to metric tonnes) as recalculated from Morris (1927: 443, Table 1) [11] (% change).
Treatment − PlotAbundance m−2 (%)Root Crop Yield t (%) *
FYM − O1237.2 (0%)14.7 (0%)
Mix FYM + NH4 salts − A1153.2 (−35.4%)21.1 (43.2%)
Mix FYM + PK − O2137.9 (−41.9%)18.9 (28.4%)
[Mean of both “mixed” plots]145.5 (−38.6%)20.0 (35.5%)
Superphosphate − O50 (−100%)3.4 (−77.2%)
Ammonium NH4 salts − A83.7 (−98.4%)10.3 (−29.7%)
[Mean of both synthetic plots]1.9 (−98.9%)6.9 (−53.4%)
Nil fertilizer − O85.7 (−97.6%)2.2 (−85.2%)
* Pearson’s r = 0.7839 (n = 6, p = 0.073, significant p < 0.10), i.e., a strong positive correlation is of crop yield with earthworm abundance (no biomass data was provided).
Table 8. Summary of Haughley earthworm surveys [15,16,17] with comparative % changes.
Abundance m−2 (% Change)Biomass gm−2 (% Change)
Organic Permanent Pasture424.0 a (+137.4)117.6 d (+77.6%)
Organic (wheat)178.6 b (0%)66.2 e (0%)
Mixed (wheat)97.5 c (−45.4%)35.4 f (−46.5%)
Stockless/Chemical (wheat)100.0 c (−44.0%)34.7 f (−47.6%)
Mean values with different superscripts differ significantly (** p < 0.05) from ANOVA test.
Table 9. Summary of Haughley Experimental farm field management histories in 1980.
Field (Section)Stables (Organic)Stackyard (Mixed)Peartree (Stockless)
Size (ha)2.433.242.83
Sown26 September 198026 September 198026 September 1980
FertilizedFYM & mulchFYM, mulch & NPKNPK
Ploughed8 August 198024 September 198025 July 1980
Previous crop3 year ley3 year ley3 year ley
Previous (1976)barleybarleybarley
Previous (1975)beansbeanswinter wheat
General rotation4 yr arable/ 4 yr ley (pasture before 1945)4 yr arable/ 4 yr ley (pasture before 1945)4 year corn and root crops, reduced ley
Fields and pastures on the Organic and Mixed sections had been mulched annually with between 7–30 t ha−1 of roughly composted animal manure and crop residues from their own section.
Table 10. Swiss DOK earthworm data (Pfiffner & Mäder, 1997: Figures 1 and 2; Table 3) [20].
TreatmentNo. m−2% Changegm−2% Change
Organic350.0 a0.0300.0 a0.0
Conventional (Mixed)120.0 b−65.7100.0 b−66.7
Mineral (Chemical)100.0 b−71.498.0 b−67.3
Mean % changes −68.6 −67.0
Means with different superscript letters differ significantly (ANOVA ** p < 0.05). Note that some other crops had much higher values (up to 650 worms m−2 after beetroot and 400 gm−2 after potatoes) [20].
Table 11. Summary of earthworms at optimal or historically organic values and (bracketed) simultaneous % change in adjacent agrichemical surveys, ordered by trial duration in years.
YearsNo. m−2 (%)Biomass gm−2 (%)Comparative Crop Study
536.0 (−36.1)13.8 (−97.1)Filipino PI paddy rice (Blakemore 2016a) [17]
1044.3 (−54.9)-Filipino PI sugarcane (Blakemore 2016a) [17]
13350 (−65.7)300 (−66.7)FiBL DOK wheat Mix (Pfiffner & Mäder 1997) [20]
13350 (−71.4)300 (−67.3)FiBL DOK wheat Chem (Pfiffner & Mäder 1997) [20]
27148 (−59.5)-DOK (Birkhofer 2008) [21]
35(40)179.6 (−45.4)66.2 (−46.5)Haughley winter wheat Mix (Blakemore 2000) [16]
35(40)179.6 (−44.0)66.2 (−47.6)Haughley winter wheat Chem (Blakemore 2000) [16]
50 (80)175.9 (−98.2)-Roth BF (Morris 1927) [11]
80250 (−54.8)-Roth BB (Morris 1922) [10]
11678.7 (−63.3)43.7 (−56.1)Roth BF (Edwards & Lofty 1982) [13]
13591.8 (−71.6)57.1 (−77.8)Roth BB (Edwards & Lofty 1982) [13]
14355.0 (−68.6)66.9 (−67.5)Roth PG (Edwards & Lofty 1975) [12]
170400 (−82.4)108.9 (−94.4)Roth BB (Sizmur et al. 2017) [14]
Mean163.3 (−62.7%)93.8 (−69.0%) Corresponding to c. 1.6 million ha−1 and 0.94 tha−1
PI—Philippine Isles; Mix—mixed organic/chemical, Chem—agrichemical only; Roth—Rothamsted (BF—Barnfield roots, BB—Broadbalk grain, PG—Park Grass pasture). Most of the original matched pairs differed significantly in original reports. The greatest changes are −98.2 % for abundance (Rothamsted BF roots) and −97.1 % for biomass (Filipino PI rice), with mean biomass decline of −69%.
Table 12. Rothamsted Broadbalk soils plus microbes and Cadmium accumulation in grain of crops.
Treatment H2O % (%)BD (gcm−3)pHSOC % (%)MicrobesCd (mg/kg)
Woodland41 (+28%)0.97.73.45 (+22%)Highest-
FYM (plot 2.2)32 (0%)1.17.82.83 (0%)Higher40–46
N288 (plot 16)25 (−22%)1.27.81.2 (−58%)Reduced-
N144 (plot 8)27 (−16%)1.27.31.13 (−60%)Reduced71–83
N0 (plot 5)25 (−22%)1.28.10.9 (−68%)Reduced-
BD—Bulk density; SOC—soil organic carbon (=humus). Soil data from 2005 from Clark et al. (2012: Table 1) [27] (cf. Figure 10); Cd in grain harvests between 1877–1984 from [28] and Jones & Johnston (1989: Figure 2) [29]. Plots 2.2 and 8 were surveyed by Sizmur et al. (2016) [14] and/or Edwards & Lofty (1982) [13]. Note too that regenerated woodland had much higher moisture H2O and SOC.
Table 13. Haughley soil characteristics from Blakemore (2000) [16] at time of earthworm survey.
TreatmentH2O % (%)BD (gcm−3) (%)pHSOC % (%)Temp. °C
Perm. Pasture42 (+36%)0.9 (+13%)7.59.9 (+148%)-
Organic (wheat)31 (0%)0.8 (0%)7.24.0 (0%)2.5
Mixed (wheat)24 (−23%)0.8 (0%)7.62.3 (−42%)1.5
Stockless (wheat)22 (−29%)1.1 (+38%)7.51.8 (−56%)0.5
Stockless is agrichemical; BD—Bulk density; SOC—soil organic carbon (Pasture SOC estimated from its SOM = humus); Temperature is on same day/time in January 1981 at 10 cm depth. Note that permanent pasture had much higher moisture and SOC.
Table 14. Initial Broadbalk wheat yield in 1844 (after Addiscott 2005: Table 1.1) [30].
Treatment (in 1843)Grain (tha−1)Straw (tha−1)Total (% Change)
Nil (FYM in 1839)1.031.262.29 (−26.0)
FYM (35 tha1)1.431.663.09 (0.0)
Ash from FYM0.991.242.24 (−27.6)
PK minerals (no N)1.131.292.42 (−21.6)
NPK (0.073 tha−1 N)1.431.603.03 (−2.0)
Raw data is unavailable for statistical comparison, however, FYM yield just out matches NPK.
Table 15. Broadbalk mean cumulative wheat grain yields, tha−1 at 85% dry matter 1852–2016 (i.e., 165 years) on plots or treatments corresponding to the Broadbalk earthworm surveys.
Plot 3/NilPlot 2.2/FYMPlot 8/3NPK
Cumulative yield21.38 a72.55 b74.63 b
% change−70.50.0+2.9
Open access data from Rothamsted Research (e-RA 2017) (www.era.rothamsted.ac.uk/metadata/broad/Broadbalk_YieldsJune2017.xlsx) [31]. Superscripts show ANOVA results with no difference (NS) for FYM vs. NPK mean +2.9 (or v.v. mean = −2.8%).
Table 16. Haughley farm yields (modified from Widdowson 1987: Table 9.3 [32]/Hogg 2000: Table 1.5 [33]) for 1981/1982 corresponding to the earthworm survey period (£ = UK sterling).
CropOrg.Org.Chem.Chem.Yield (% Change)
Yield (t/ha)Gross (£/ha)Yield (t/ha)Gross (£/ha)Org. v. Chem.
Winter wheat5.295935.7449—7.2
Spring barley5.045004.24322.7+18.9
Oats5.174994.64353.8+11.4
Means5.2£530.64.9£375.2+7.7%
Gross margin for organic vs. chemical crops was £155/ha but this less an extra 16% labour required for organic crops (costing £23/ha at that time), to give Net = £132 (+38%) profit. Factors are organic sales premium and lower chemical & fertilizer costs, albeit these are often subsidized. Raw data are unavailable for statistical tests.
Table 17. Yield summaries for earthworm study sites for organic vs. chemical (%).
Earthworm Survey Site Crops [Reference]Org. vs. Chem. Yield (% Change)
Rothamsted Broadbalk wheat [31]−2.8
Rothamsted Barnfield root crops [11]+42.7
Rothamsted Park Grass pasture [12]−2.2
Haughley grains [32,33]+7.7
Haughley wheat below-ground roots [16]+10.8
Haughley wheat above-ground shoots [16]+13.9
Haughley milk [18,19]+15
Swiss DOK crops (overall) [20,35]−20
Philippines PI paddy rice [17]+33.3
Philippines PI sugarcane [17]+80.0
Overall mean yield Org. vs. Chem. (n = 10)+17.8

