
Article

FTIR–Fluorescence Two-Dimensional Correlation Spectroscopy of Soil Water-Extractable Particle Fractions by Sequential Membrane Filtration

by
Dmitry S. Volkov
,
Olga B. Rogova
,
Svetlana T. Ovseyenko
and
Mikhail A. Proskurnin
*
Chemistry Department, M.V. Lomonosov Moscow State University, Moscow 119991, Russia
*
Author to whom correspondence should be addressed.
Soil Syst. 2026, 10(2), 31; https://doi.org/10.3390/soilsystems10020031
Submission received: 15 November 2025 / Revised: 6 February 2026 / Accepted: 10 February 2026 / Published: 13 February 2026

Abstract

The distribution of water-soluble organic matter (or dissolved organic matter DOM) in narrow (nano-and micrometer) fractions of chernozem was studied by sequential filtration on track-etched membranes. Multimodal (IR and fluorescence) two-dimensional correlation (2D-COS) spectroscopy was used. Protocols for attenuated total reflectance (ATR) FTIR of DOM were proposed. ATR-FTIR 2D-COS provides a larger volume of information on characteristic bands compared to traditional FTIR, especially in C–H ranges (3000–2800 and 1450–1300 cm−1). The fluorescence excitation–emission matrix 2D-COS showed that the indexes and ratios of humic- to protein-like compounds are reproducible, and exhibit significant variation among size fractions, with maximum amounts of saturated humic-like compounds in the largest (2–10 μm) and finest fractions (0.01–0.03 μm), while medium fractions (0.05–1 μm) are dominated by fulvic acids and fresh organic matter. Heterospectral fluorescence–IR 2D-COS enhanced the accuracy of identification and assessment of DOM group composition and showed that C–H IR band intensities correlate with tyrosine-like EEM bands and biogenic fluorescence indexes, while carboxylic components have humate-like bands and humification fluorescence indexes. Element profiles in DOM fractions correlate with fluorescence indexes; humification indexes with P, S, Cr, Mg, Ca, Cu, and Zn; biogenic with Mg, P, Cr, Cd, K, S, and Ca.

1. Introduction

The formation and existence of soil organic matter (SOM) is directly related to the mineral matrix, which are fine mineral fractions of soils that make up elementary soil particles. The size fractions of primary soil particles, the most mobile and capable of migrating with water flows, are 10–20 μm, including colloidal sizes (less than 2 μm or even less than 1 μm) [1,2,3,4,5]. In the soil, this part of organic matter exists in the form of aggregated solid organic substrates (detritus) and organic matter bound to a mineral matrix in the form of organo-clay particles, complex organometallic compounds, and salts.
Dissolved organic matter (DOM) is found in varying amounts in all the types of natural waters [6]. The criteria by which DOM is determined and distinguished are now mainly reduced to separation fractions with a particle size of less than 0.45 μm from the solution. Thus, DOM can be considered as part of a colloidal and true solution of substances that make up the silty fraction of soils. Obviously, these fractions are quite heterogeneous and include particles not only of various sizes, but also of different nature (including inorganic) [7]. The roles of DOM in nature are diverse: the substances that make it up are not only a source of energy and nutrients for soil microflora and terrestrial plants, but also carry out the transportation of substances of various nature within the soil profile, determine the redistribution of matter in the landscape, and participate in the cycles of carbon and nitrogen at the global, planetary level [1,8].
DOM composition and properties are influenced by the nature and intensity of agricultural cultivations, which change the composition of SOM as a whole and soil structure [9,10]. A change in DOM composition indicates a change in SOM as a whole [11]; the material composition of DOM and the ratio of its constituent chemical phases are specific for different sources and may serve an indicator of the origin of organic matter of naturally existing substances [8] as well as anthropogenically altered areas, e.g., storm sewage [12]. As a carrier of exogenous chemicals, DOM affects their mobility and ability to transform, thus changing their bioavailability or toxicity [6,13].
However, there are no detailed studies of SOM based on the analysis of separate fractions isolated from the colloidal, the most mobile component of the soil phase [3]. This underscores the importance of developing methods for isolating and analyzing these fractions and using existing and related techniques in combination.
As shown previously [14], track-etched membranes can be used to isolate and separate DOM. The rapid development of membrane separation and purification technologies has led to the new generation of membranes obtained by high-energy ion beam bombardment (track-etched membranes), which are characterized by straight through channels with the same width and narrow size distribution (deviations from the nominal amount are units of percent) like on sieves [15,16]. However, there are also certain drawbacks, primarily related to the effects of the interaction of the surface charge and the charges of the separated particles, which may affect the separation; particles with a smaller size do not pass through the channels due to the occurrence of electrostatic repulsion. Nevertheless, this effect can be reduced by selecting separation conditions (e.g., by recharging the surface of membranes or particles with neutral salt buffers) [17,18]. The choice of filter material is also important. Membranes made of organic and inorganic materials are now available. Among the organic materials, polycarbonate and PET seem to be optimum as they are transparent and colorless in the UV/vis range, thus providing direct absorption spectra and optical microscopic measurements directly on membranes without sample removal. The absence of the own fluorescence of these materials makes it possible to carry out spectrofluorometric measurements on membranes as well.
Among the methods for DOM, fluorescence spectrometry is currently most often used for its qualitative composition [19,20,21,22,23,24,25,26,27]. This method provides high sensitivity and allows for non-destructive analysis [26]. Various variants of spectrofluorimetry are used. However, over the last 25 years, one of the most used variants of fluorescence spectrometry for DOM analysis is fluorescence excitation–emission matrix (EEM or total synchronous fluorescence) techniques [28,29]. This method separates a given set of EEM into the data on fluorescing components of different types that correspond to certain groups of constituent compounds [30].
IR spectroscopy also has a special position in studying the molecular composition of soils, and especially the structural and group composition of SOM [31,32,33,34,35,36,37,38,39,40,41]. On the one hand, it is possible to obtain structural-group information about the entire molecular composition of the soil, including SOM [31,33,34,35,37,38,39,40,41,42,43,44,45,46]. On the other hand, data by IR spectroscopy can be compared with NMR or mass spectrometry data [47]. Also, it is important that FTIR enables studying differences in narrow soil fractions [48,49].
Elemental analysis is one of the most common methods for analyzing fractions of natural organic matter [50,51]. ICP–AES analysis combined with direct injection of suspensions developed for nanomaterials [52] provides information on the bulk contents of elements to determine the total mineral composition of the studied samples without preliminary decomposition (in the case of membrane washouts) [14,36,53]. Recently, combined analysis of complex samples using both molecular and atomic analytical techniques (multimodal spectroscopy) have shown the possibility to reveal a large volume of new information on such samples including soils [54,55,56]. Here, the main approach is to use correlation analysis [57], including more complex techniques like generalized two-dimensional correlation spectroscopy (2D-COS).
The technique of 2D-COS is an enhancement on traditional spectroscopic methods, which turns one-dimensional spectra into two-dimensional maps (matrices) to identify correlations between individual bands in the spectrum [58,59]. The mathematical basis of 2D-COS makes it possible to find the relationship between individual features in a single spectrum (homospectral 2D-COS) or in two spectra for the same test object—in different regions or for the spectra by different methods (both are heterospectral 2D-COS). Apart from revealing the correlations between spectral features due to various mechanisms of interaction, 2D-COS simplifies complex spectra with many overlapping bands and may increase spectral resolution by separating overlapping bands along the second axis of the correlation map. The spectral sets in 2D-COS are built by affecting the test sample by various factors, which are called external perturbations (sample-changing factors). Usually, they are heating [60,61,62,63,64,65], pH [66], or selective chemical reactions [67,68].
However, any physical or chemical fractionation, separating the sample into characteristic size fractions, is also a very efficient external perturbation for 2D-COS [48]. In fluorescence spectroscopy, 2D-COS is used for studying fluorescence quenching factors and changes, mainly conformational, in biomolecules [69]. Fluorescence 2D-COS can resolve overlapping spectral information and reveal the predominant types of soil organic matter [70] and aid in finding changes in humic substances due to pollutant binding and environmental factors [71].
In IR spectroscopy, 2D-COS aids in identifying overtones and Raman bands, as well correlations between the bands of inorganic and organic constituents [72,73,74,75]. 2D-COS is used in IR spectroscopy to study polymers or living objects [76,77]. In soil analysis, IR 2D-COS expands the volume of data on SOM for similar samples without additional sample preparation. In particular, IR 2D-COS reveals the bands of functional groups on the soil particle surface, as well as both aromatic and aliphatic components of SOM, including in the long-wavelength region (1000 cm−1 and below), with predominant mineral component contribution [78,79], and can aid in identifying the land use type [48]. Heterospectral 2D COS of soils based on FTIR and fluorescence techniques is not widespread and is used for obtaining increased information volume of the whole SOM structure, interactions, and spatial distribution [80,81]. There is almost no data on the use of multimodal 2D-COS on soil particles, especially narrow and fine fractions of DOM.
Thus, the aim of this study was to characterize the distribution patterns of organic matter and elements in wet-sieved narrow fractions of chernozem soil to demonstrate the capabilities of multimodal fluorescence and IR spectroscopy, as well as atomic-emission spectroscopy combined with two-dimensional correlation, for the analysis of narrow fractions of soil particles in the nano- to micrometer-scale size range.

2. Materials and Methods

2.1. Samples and Chemicals

Samples of Kursk chernozem (Haplic chernozem) were taken from the territory of the Federal State Budgetary Institution “Kursk Federal Agrarian Scientific Center” were used to prepare water-extractable particulate organic matter and used to extract waterproof microaggregates and primary soil micro- and nanoparticles including water-soluble solid organic compounds [48,82].
All aqueous solutions were prepared in deionized water (Type I, 18.2 MΩ cm at 25 °C; a Milli-Q Academic system, Merck Millipore, Darmstadt, Germany). Sodium azide that was used to preserve the samples was from Molekula Ltd. (Darlington, UK, purity > 99.5%). To acidify, samples were treated with nitric acid (69%, PA-ACS-ISO grade) from Panreac (Barcelona, Spain).

2.2. Fractionation

At the first stage, soil samples were sieved using an AS 200 sieving machine from Retsch (Haan, Germany) equipped with sieves with diameters of 40, 20, 10, and 5 μm (Precision Eforming LLC, Cortland, NY, USA). After the first round (an amplitude, 0.85 mm; time, 5 min), the whole set of sieves was cleansed with 50 mL of deionized water, and the sample was sieved another round under the same conditions. Extraction of organic matter was made for cold extracts. At the first stage, air-dried samples of chernozem, preliminarily ground in a jasper mortar, were placed in Erlenmeyer flasks. Then, deionized water at room temperature (at volume ratio of soil:water of 1:10) was added [83]. The resulting suspension was shaken on a laboratory shaker for 1 h [84] and then kept for 30 min and then filtrated with the sieving machine with screens with pore diameters of 40, 20, 10, and 5 μm (Precision Eforming LLC, Cortland, NY, USA).
Fractionation by sequential membrane filtration was used as described previously [14] and given in the Supplementary Information (Procedure S3). Sets of track-etched membranes were made of polycarbonate (GVS Filter Technology, Bologna, Italy; pore size, 5.0, 2.0, 1.0, 0.8, 0.4, 0.2, 0.1, 0.05, 0.03, and 0.01 µm) and used throughout. Fractionation was carried out on a Mark 410 oil-free vacuum pump (Rocker Scientific Co., Ltd., Kaohsiung, Taiwan) and a home-made setup containing two 1 L vacuum filtration flasks equipped with a porous glass filter, glass funnel, and an aluminum clamp (Borosil Ltd., Mumbai, India). Before each filtration step, the system was rinsed with 100 mL of deionized water to remove the remaining plasticizer from membranes and wash the vessels. Thus, the following fractions were obtained: 5–10 µm, 2–5 µm, 1–2 µm, 0.8–1 µm, 0.4–0.8 µm, 0.2–0.4 µm, 0.1–0.2 µm, 0.05–0.1 µm, 0.03–0.05 µm, 0.01–0.03 µm, and <0.01 µm. Washing particles from membranes were used exactly as described previously [14] and given in the Supplementary Information (Procedure S4).
Membrane plasticizer leaching was used as described previously [14] and given in the Supplementary Information (Procedure S1). The sequential passing of 50 mL of deionized water (a total of 250 mL) through a membrane with a pore size of 0.05 μm was performed to check the leaching of the plasticizer in dynamics.

2.3. ATR-FTIR Measurements and Data Processing

A Vertex 70 (Bruker Optik GmbH, Ettlingen, Germany) with a KBr beam splitter, a DLATGS detector, and a diamond ATR crystal with a temperature controller (GladiATR™, Pike Technologies, Madison, WI, USA) were used for ATR-FTIR of aqueous samples as films produced by heating the ATR crystal to a preset temperature. FTIR spectra were processed using OPUS Software, version 8.5 (SP1) build 8, 7, 10 (Bruker Optik GmbH, Ettlingen, Germany). Conditions are given in Table 1. The procedure for the FTIR measurements is also given in detail in Appendix A.

2.4. Fluorescence Measurements

A Fluorolog FL3-22-Tau fluorescence spectrometer (Horiba Jobin Yvon, Montpellier, France) equipped with a 450 W xenon lamp and two double-emission was used. To analyze the fluorescent organic constituents, EEMs were obtained. Conditions of fluorescence measurements are summarized in Table S2, Supplementary Materials. To eliminate the influence of the internal filter effect and self-absorption, the samples were diluted with deionized water so that the absorbance of the solutions did not exceed 0.1 at a wavelength of 254 nm.
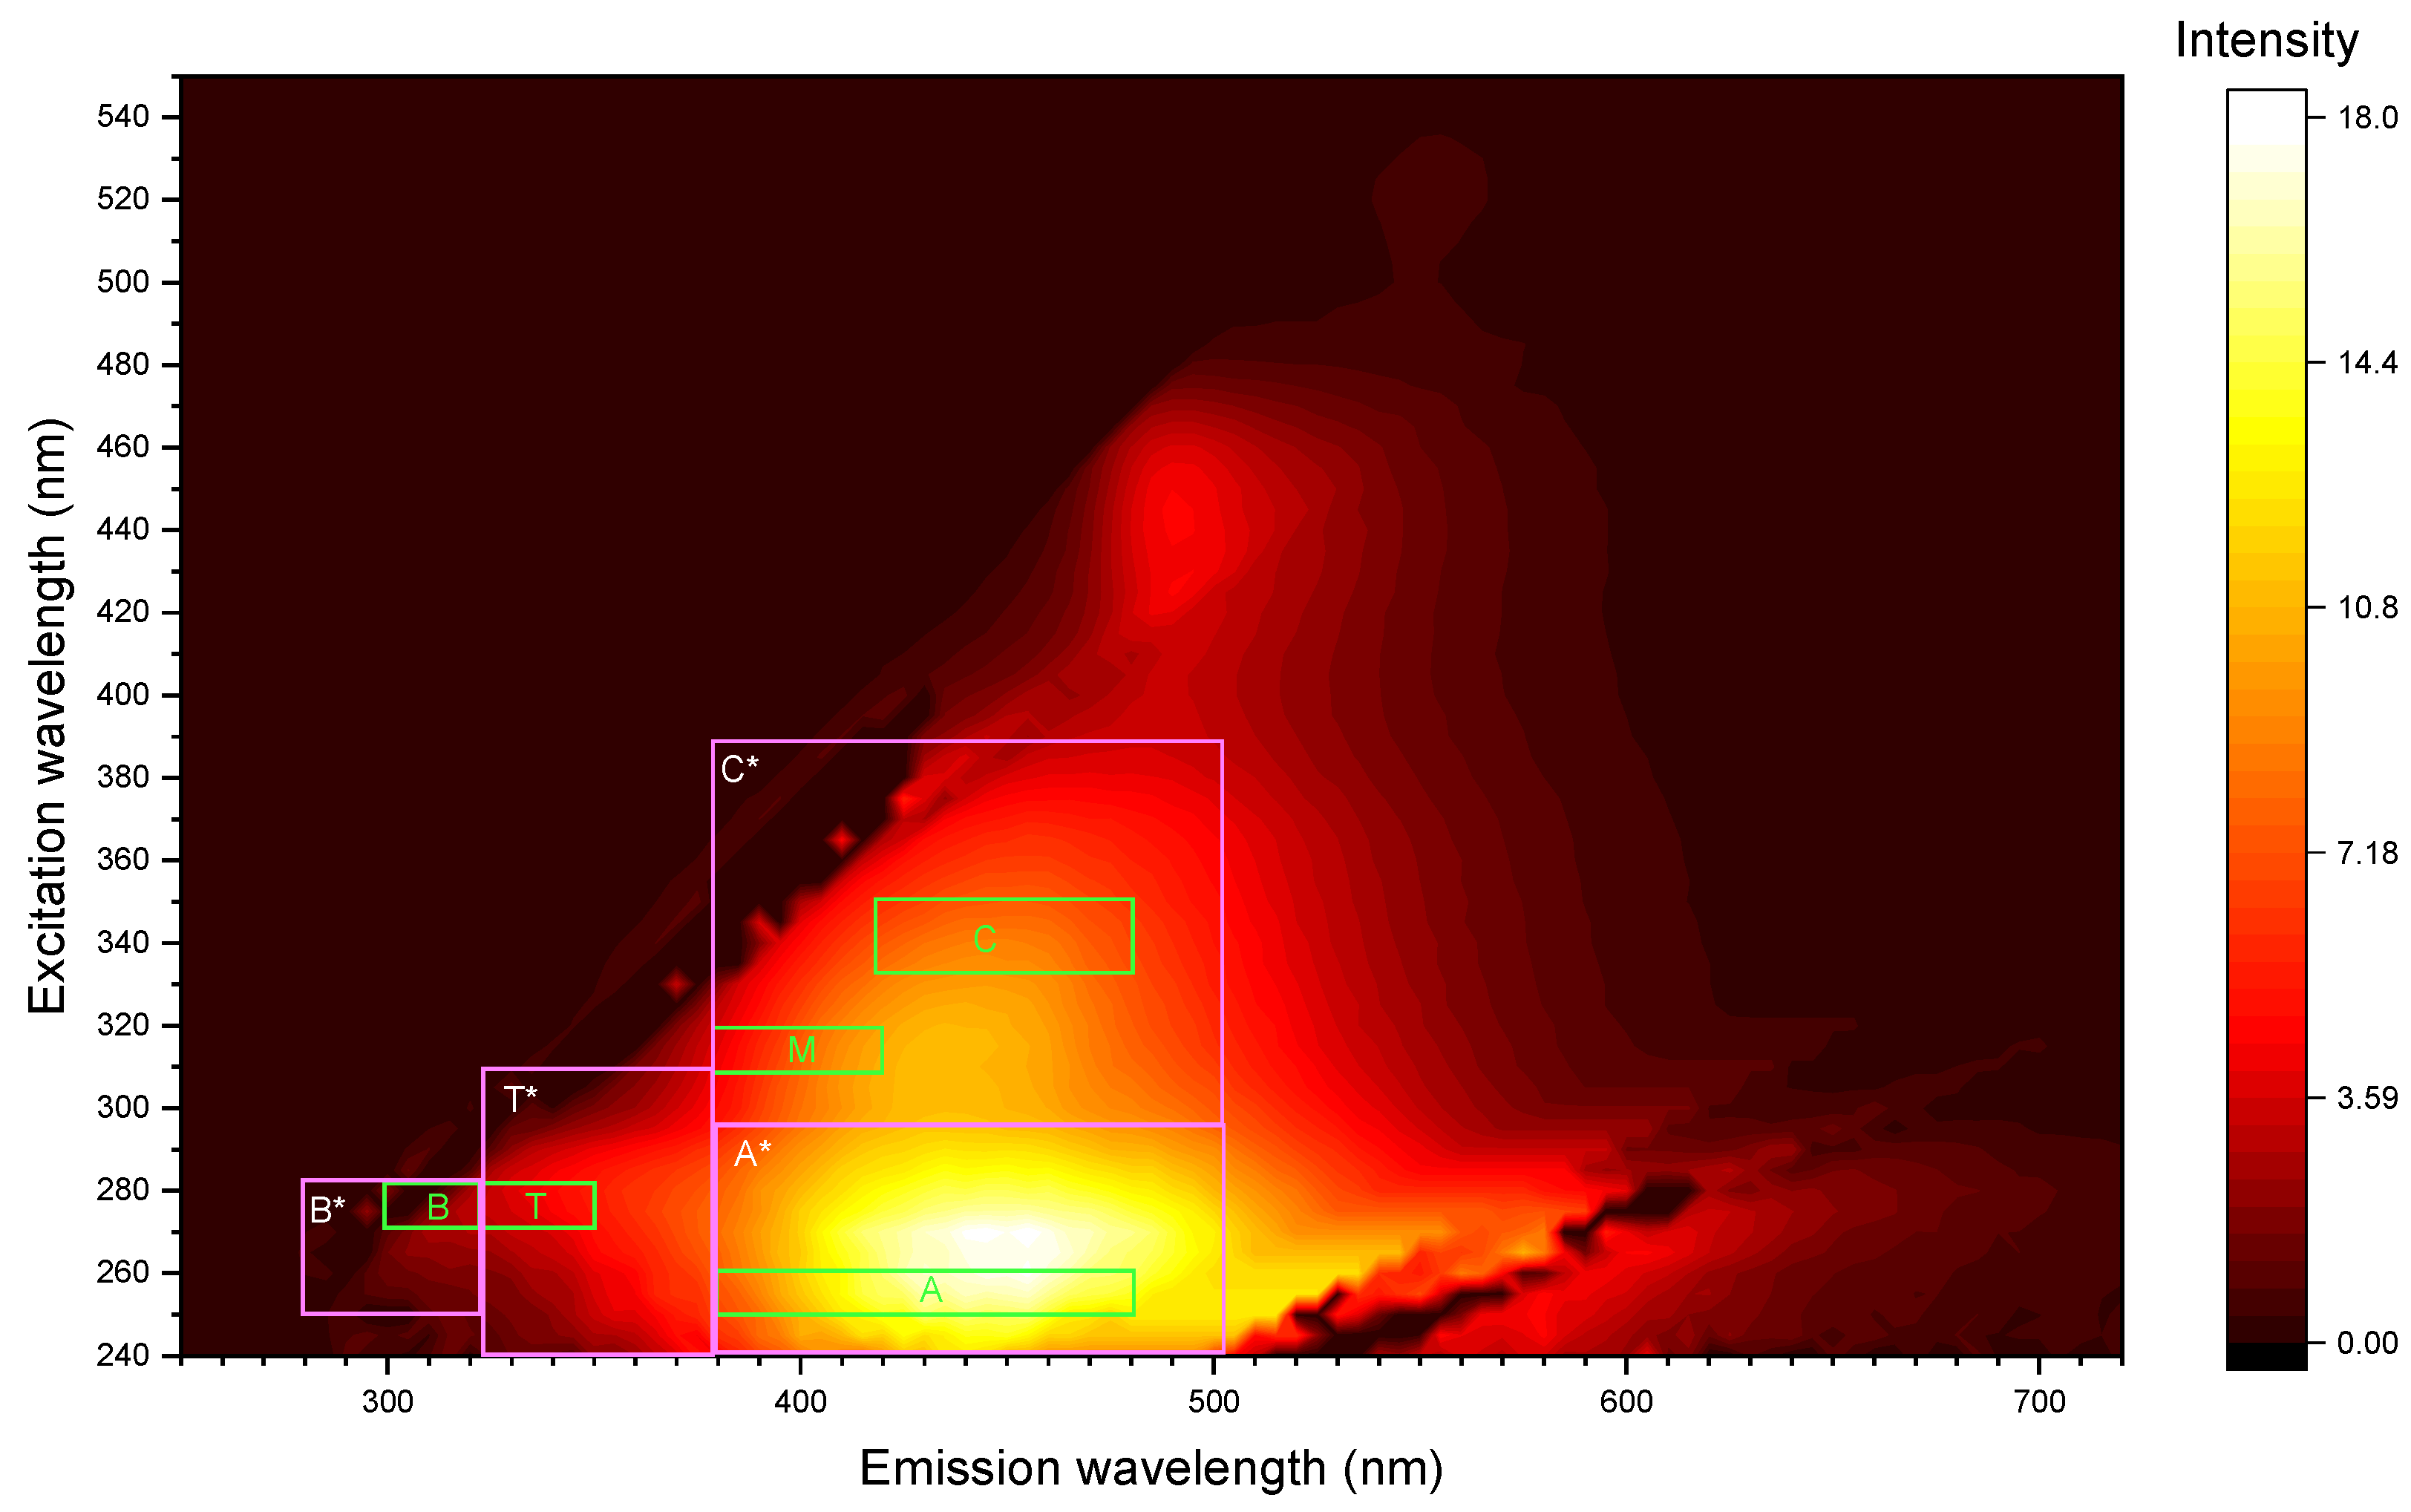
Regions of the excitation–emission matrix corresponding to certain groups of compounds—humic-like (A and C), tyrosine- and protein-like (B), and tryptophan-, phenol-, and protein-like—were selected according to [85,86], Figure 1 (green frames; their values are summed up in Table S3, Supplementary Information) and Table S3 (Supplementary Information). Also, to test and increase selectivity and sensitivity, broader (expanded) regions based on the data of [85,86] were selected in the form of A*, B*, C*, and T*, and shown in Figure 1 (light magenta frames); they are summed up in Table 2.
It was assumed that the integration of the selected regions (fluorescence regional integration) represents the cumulative response of the DOM components [27]. Thus, the volume under the surface of the i-th region of an EEM can be calculated using Equation (1). However, the resulting excitation–emission matrices are discrete, so Equation (2) is correct in this case. The fraction for each area is as follows according to Equation (3) [27]:
Φ i = E x E m I λ E x , λ E m d λ E x d λ E m ,
Φ i = E x E m I λ E x , λ E m λ E x λ E m ,
P i = Φ i / Φ i × 100 %
where I(λEx, λEm) is the fluorescence intensity at the excitation wavelength λEx and the emission wavelength λEm; ∆λEx is the excitation wavelength step; ∆λEm is the emission wavelength step; and Pi is the partial sum fraction by volume for the i-th area of the excitation–emissions matrix, whereby using it makes it possible to estimate the fluorescent component ratios.
Fluorescence indexes according to [25] the humification index (HIXEM) for diluted solutions (for ex 254 nm a ratio of areas under em 435–480 nm and em 300–345 nm), freshness index (BIX) (β/α), fluorescence index (FI), and T/C peak ratio were calculated as per the protocol described in [85,87,88,89,90,91,92,93,94]; the descriptions of the indexes are summed up in Table S4, Supplementary Information.
Also, the ratios of total intensities of regions corresponding to humic-like substances (A + C or A* + C*) and biologically active compounds (regions B + T or B* + T*) were calculated. Also, the approach of two regions IV and V reflects the integral fluorescence signals (signatures) of humic-like (Region IV, em = 405–450 nm at ex = 290–310 nm, also aromatic structures) and protein-like (Region V, em = 400–410 nm at ex 275–300 nm, fresh organic sources) materials [27].

2.5. Other Equipment and Measurements

For element analysis, an axial ICP–OES 720-ES instrument with an SPS3 autosampler (Agilent Technologies, Santa Clara, CA, USA) was used throughout. The details and conditions of measurements were as in [14] and are summarized in the Supplementary Materials. To study the leaching of the plasticizer from polycarbonate analytical track membranes during membrane filtration, the absorption spectra of aqueous filtrates and flushing water in the visible and ultraviolet regions were recorded using a Cary 4000 spectrophotometer (Agilent Technologies, Santa Clara, CA, USA) and a quartz spectrophotometric cell (optical path length, 1 cm).

2.6. Correlation Analysis and 2D-COS Analysis

Simple correlation analysis for the values of fluorescence indexes and parameters and element quantities (molar fraction and element concentrations in μg/g) was made using the ordinary tools of Origin Pro software 2021b (64-bit) ver. 9.8.0.200 (OriginLab, Northampton, MA, USA). The building of 2D-COS maps was implemented using the Origin Pro 2D Correlation Spectroscopy Analysis app [95].
Matrix spectra (assemblies) for 2D-COS were assembled with the sieved fraction size as a perturbation variable. The spectral assemblies were built by the size increase from fine to coarse fractions. In all cases in this study, the spectra were averaged by taking into account the average numerical size of fractions and a Pareto function was used to reduce the dominance of large peaks.
For the purposes of 2D-COS data processing, the numerical values of the average fraction sizes (0.01, 0.02, 0.075, 0.15, 0.3, 0.6, 0.9, 1.5, 3.5, 7.5, and 10 µm) were used as the values for the perturbation variable in 2D-COS calculations.
Homospectral synchronous and asynchronous maps were built for each size fraction for the whole measured ranges of FTIR and fluorescence measurements. Synchronous maps were not normalized; asynchronous maps were normalized to the average value of all the correlation. Heterospectral FTIR synchronous and asynchronous maps were built for each size fraction for the whole studied range and for characteristic ranges 700–650 cm−1, 900–800 cm−1, 1800–1200 cm−1, and 3000–2800 cm−1. The normalization was the same as for homospectral 2D-COS.
Heterospectral FTIR–fluorescence synchronous and asynchronous maps were built for the characteristic range of 280–510 nm of the fluorescence spectrum (excitation, 265 nm) and for each of the characteristic IR ranges, 700–650 cm−1, 900–800 cm−1, 1800–1200 cm−1, and 3000–2800 cm−1, with fraction size as a perturbation variable. The normalization was the same for homospectral 2D-COS.

3. Results and Discussion

From the viewpoint of fraction analysis, the studied soil fractions were divided into four groups: large, 3.5–10 μm; medium, 0.9–1.5 μm (mainly clay minerals and iron species); fine, 0.15–0.6 μm; and nanoparticles of less than 0.15 μm.

3.1. Degree of Plasticizer Extraction from Membranes During Membrane Filtration

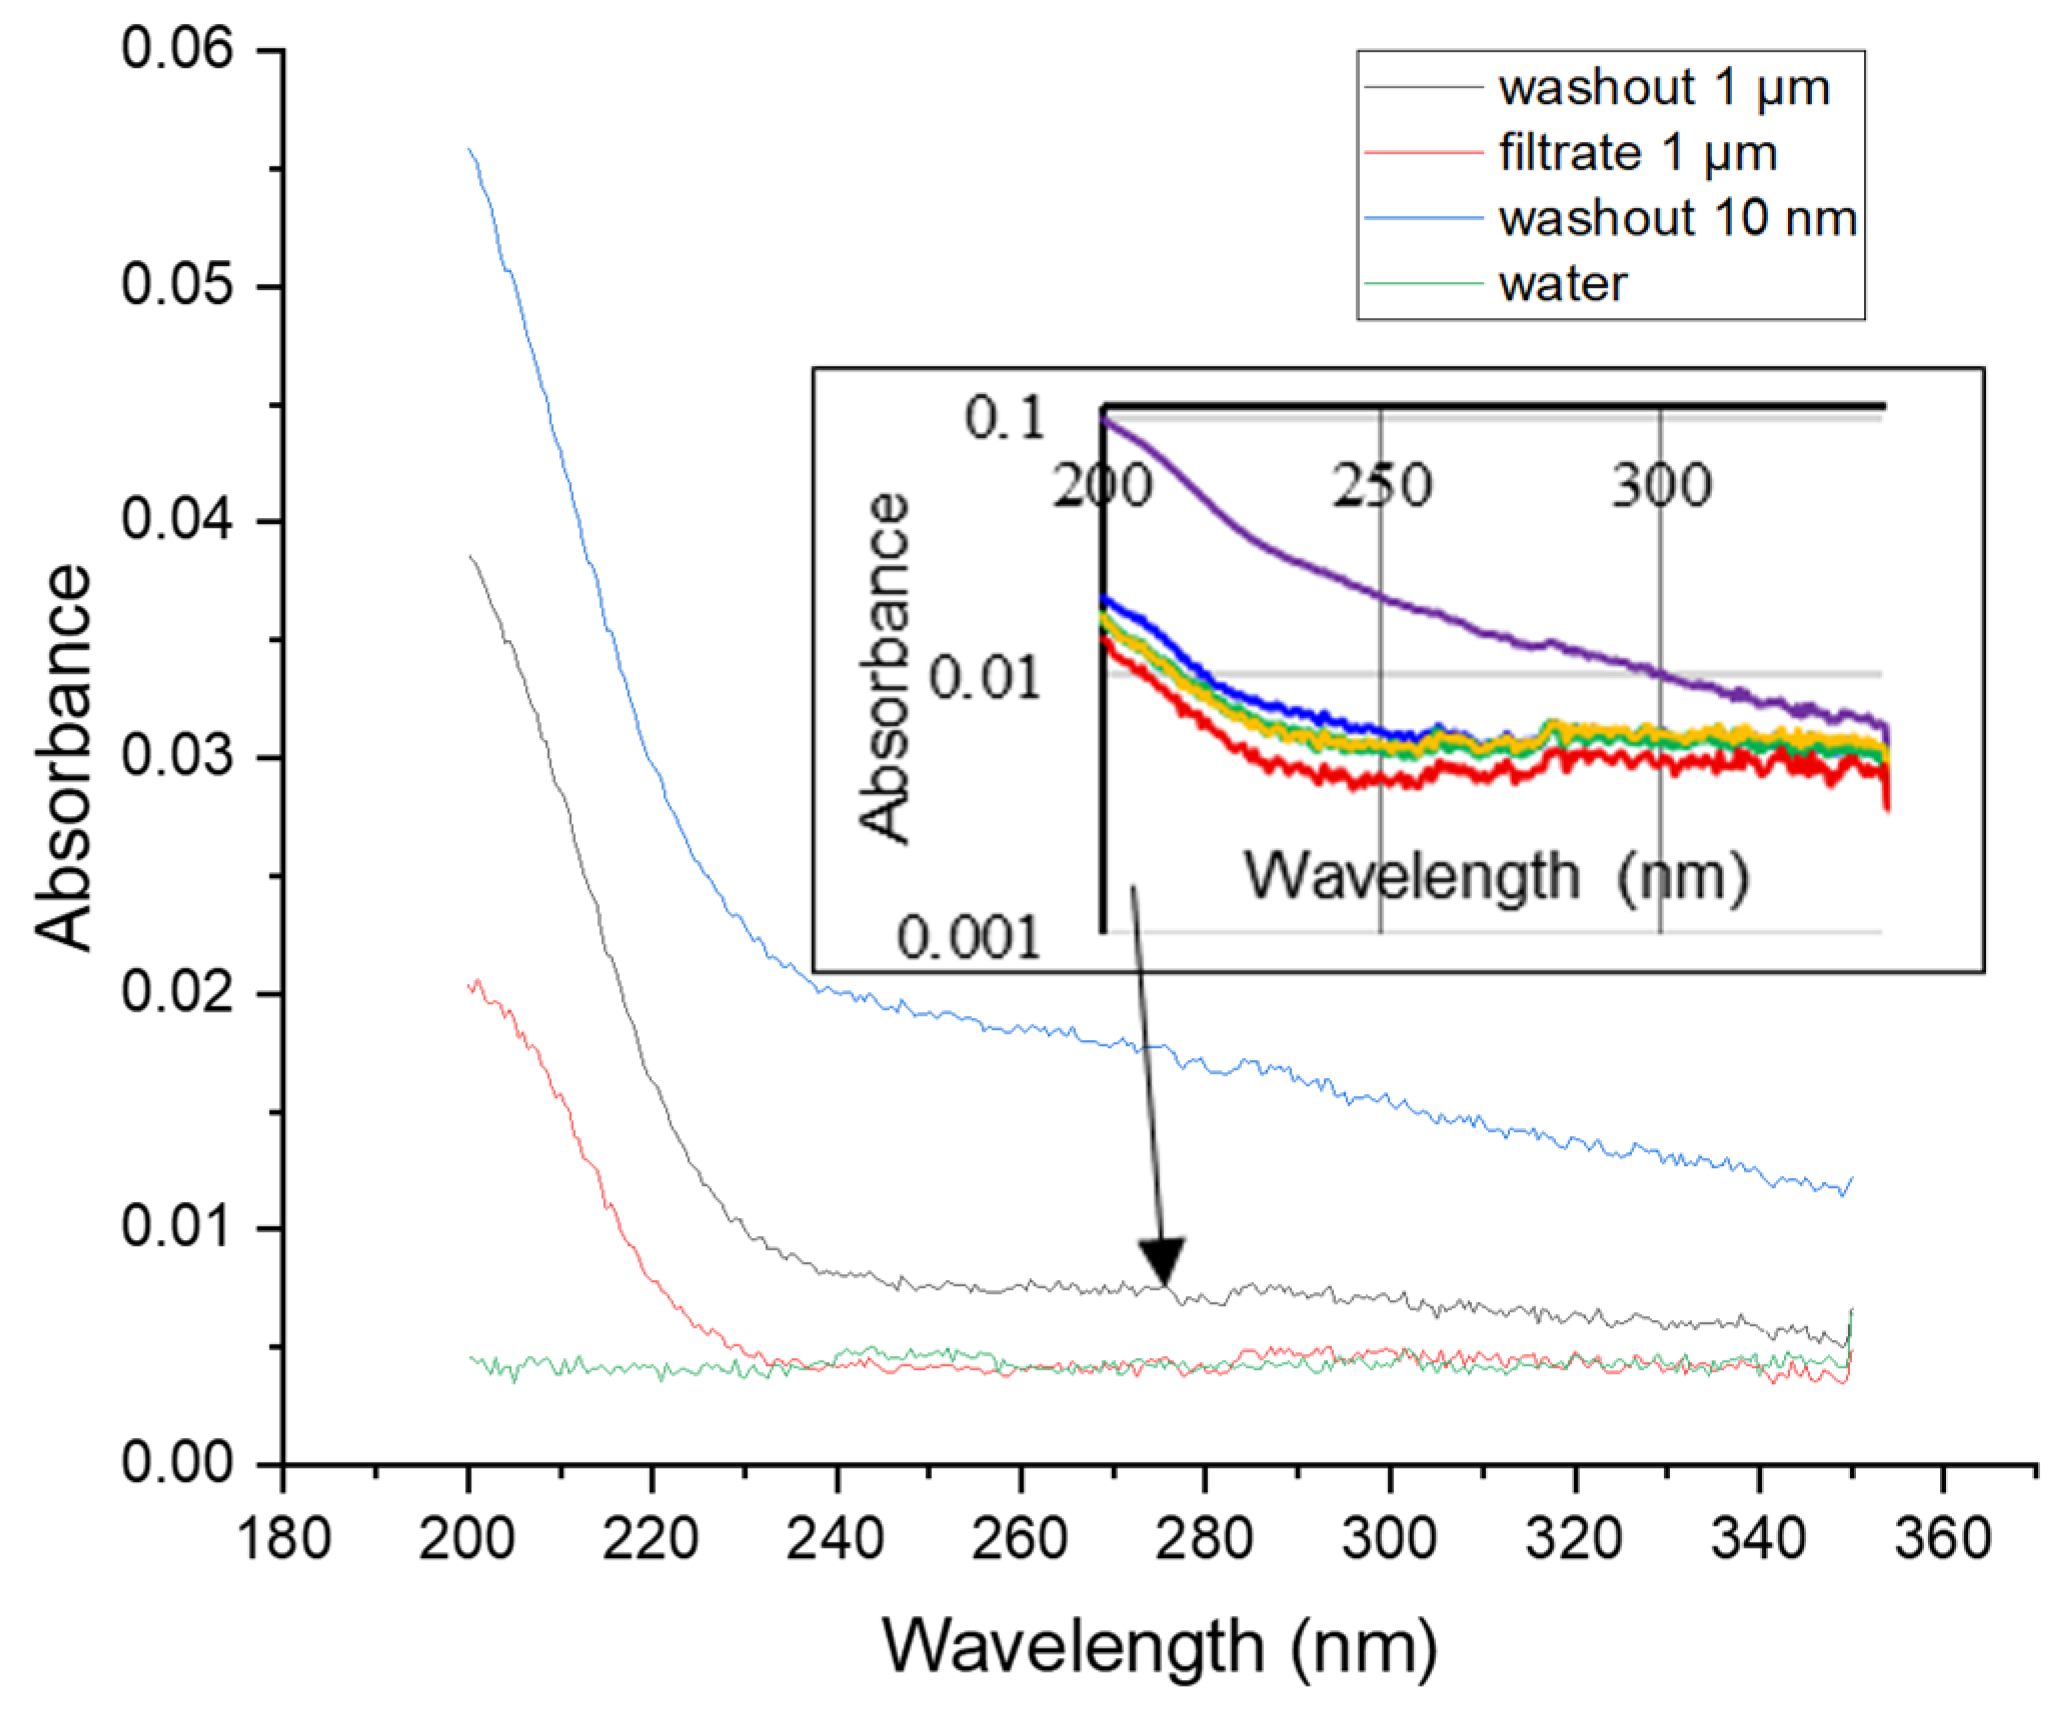
The first stage was to study the effect of the membrane material on the resulting fractions, since in addition to the main component (in this case, polycarbonate), membranes also contain a plasticizer. For this purpose, spectrophotometry was used to assess the total content of leachable organic compounds (and with fluorescence spectrometry, we analyzed flushing water and filtrates obtained during blank experiments). The absorption spectra in the UV/visible range (Figure 2) show that the highest absorbance is observed for a flush water sample obtained from a membrane with a pore size of 0.01 μm (0.055 at λ = 200 nm). The lowest value is for a membrane filtrate of 1 μm (0.02 at λ = 200 nm). This difference can be explained by the duration of filtration: for membranes with smaller pore sizes, the process took a longer time, thus a larger amount of the plasticizer passed into the solution.
During the leaching test of the plasticizer from a membrane with a pore size of 0.05 μm over time (Figure 2 inset), it was found that the highest absorbance was observed when the membrane was washed with the first 50 mL of water (0.1 at λ = 200 nm). For subsequent runs of washing water volumes of 50 mL, the absorbance was less than 0.02 (all curves except violet in Figure 2 inset); therefore, it can be assumed that most of the plasticizer was washed out during the first two stages of washing.
Spectrofluorimetric analysis (Figure S1, Supplementary Information) showed the presence of organic matter, including humic-like compounds, in the washes and filtrate for membranes with a pore size of 1 and 0.01 μm, which is indicated by the characteristic outlines of the obtained fluorescent matrices. The latter may be associated with the vital activity of microorganisms in the samples prepared. The obtained intensities for these fluorescent EEMs are significantly lower (at a level of 0.05 or below) than for that characteristic to fractions of SOM. Based on the data obtained, it was decided that the membranes should be washed with 100 mL of fresh deionized water before use, to wash out the plasticizer completely (Figure 2 inset).
Thus, we showed that the initial hypothesis that the plasticizer can be extracted from the membranes during the fractionation process and affects the quantification of organic substances. However, such an impact can be estimated as insignificant on the methods of analysis that are used in the work. However, a procedure for washing 100 mL of deionized water has been proposed to reduce this effect, primarily on fluorescence spectra.

3.2. FTIR Analysis

For division into inorganic and SOM constituents, the entire examined mid-IR/far IR range (4000–150 cm−1) was separated into four regions. These regions are the hydrogen-bond and CH-region (3775–2800 cm−1), SOM region (1700–1170 cm−1), Matrix I region, and Matrix II region. The first region (3775–2800 cm−1) is the region of hydrogen bonds and CH, which characterizes hydrated compounds of organic and inorganic nature, including hydrates of mineral oxides, soil clay minerals, as well as organic aliphatic compounds of plant or microbiological nature (polysaccharides, organic acids, etc.). The second, SOM, region (1700–1170 cm−1) refers to and characterizes specific soil (humic-like) organic substances, condensed to varying degrees: humic and fulvic acids and lignin. The Matrix I region (the region of quartz overtones, 1170–800 cm−1) and Matrix II region (quartz lattice region, 800–150 cm−1) [35,46,48,49,96,97] are mainly associated with the features of the mineral matrix of soils in the totality of silicate and non-silicate crystallized (Matrix II) and amorphous (Matrix I) minerals characteristic of cellulose and lignin. The regions listed include predominant SOM bands or matrices and can be undoubtedly and consistently divided into separate groups for all comparable samples. Some particularly interesting ranges for the description of soil systems can be singled out, such as 1170 and 1700 cm−1 [46]. The ranges of 4000–3775 and 2560–2000 cm−1, containing bands of atmospheric water, carbon dioxide and artifacts, and associated with the ATR–FTIR diamond crystal absorption, were not considered. The bands are summed up in Table 3.

3.2.1. Hydrogen-Bond and CH Regions (3775–2800 cm−1)

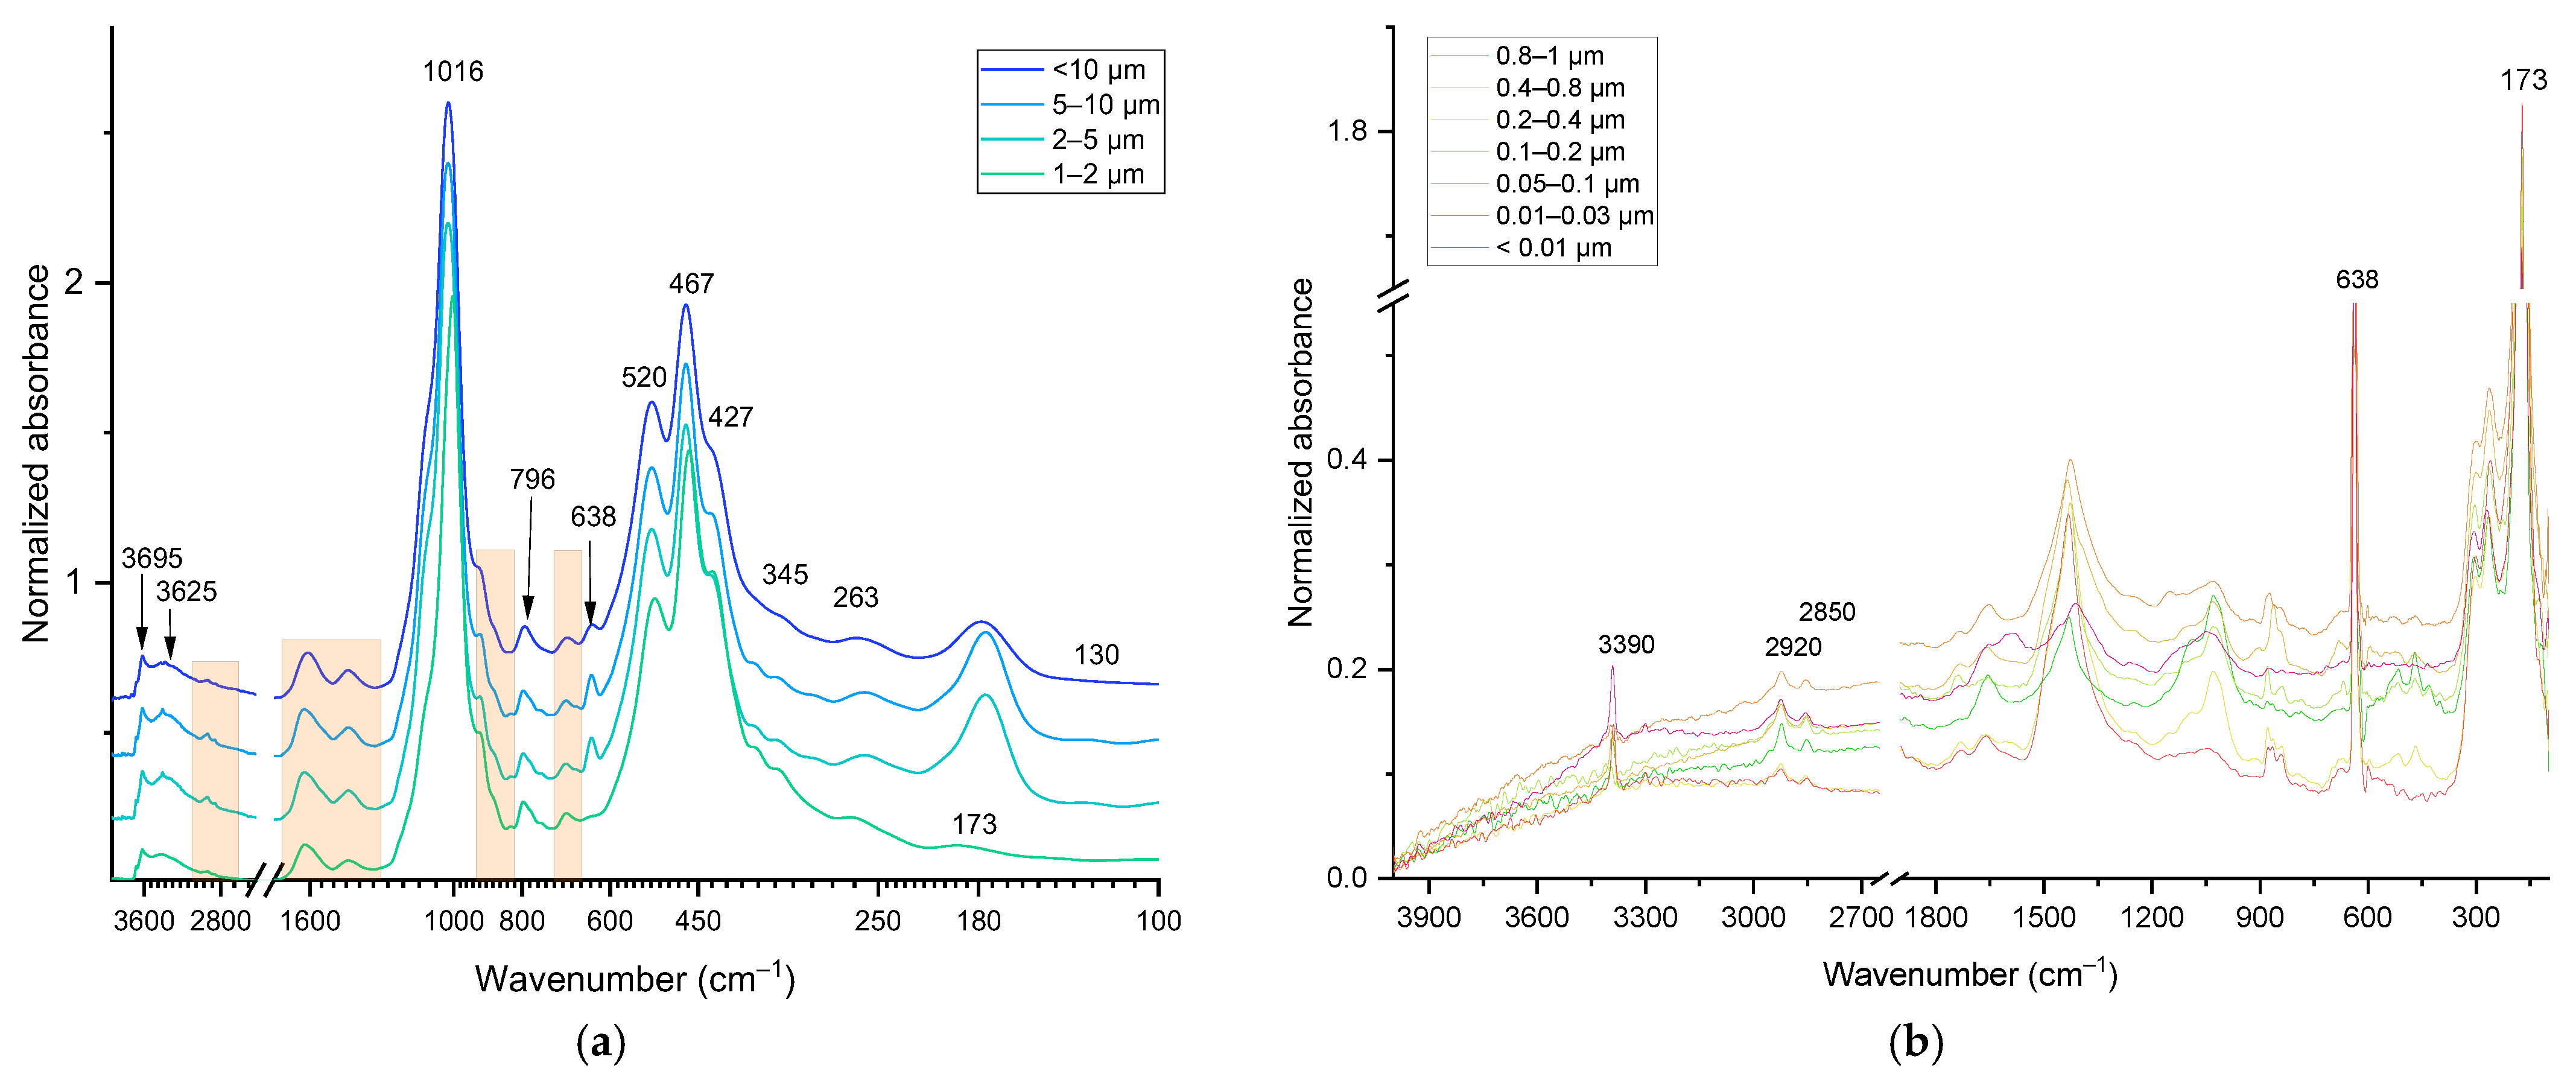
This range of SOM IR spectra is largely related to the vibrations of OH groups in clay minerals, absorbed water, as well as aliphatic carbon-chain stretching, e.g., for large fractions of 3.5–10 μm on the shoulder of a wide band of OH-groups (Figure 3), and bands of hydroxyl groups associated with quartz, partly with clayey aluminosilicates and with finely dispersed non-silicate iron minerals that are largely visible.
According to [142], these fractions are dominated by finely dispersed hematite, goethite, and lepidocrocite in trace amounts, at 3696 and 3620 cm−1. The relatively narrow bands at 2926 and 2854 cm−1 are also of great interest. In the existing data [97], these bands are often associated with C–H stretching in aliphatic chains. It must be mentioned that unlike other bands, those assigned to C–H stretching are pronounceable both for large (>1 μm, Figure 3a) and medium and fine (<1 μm, Figure 3b) size fractions. This suggests that organic compounds of aliphatic structure, microparticles of detritus or products of destruction of initial substances of plant origin sorbed on the surfaces of mineral particles are found in all size fractions of the identified water-resistant (microaggregates of 2–10 μm) and water-soluble (forming colloidal and true (less than 0.1 μm)) solutions of structures.
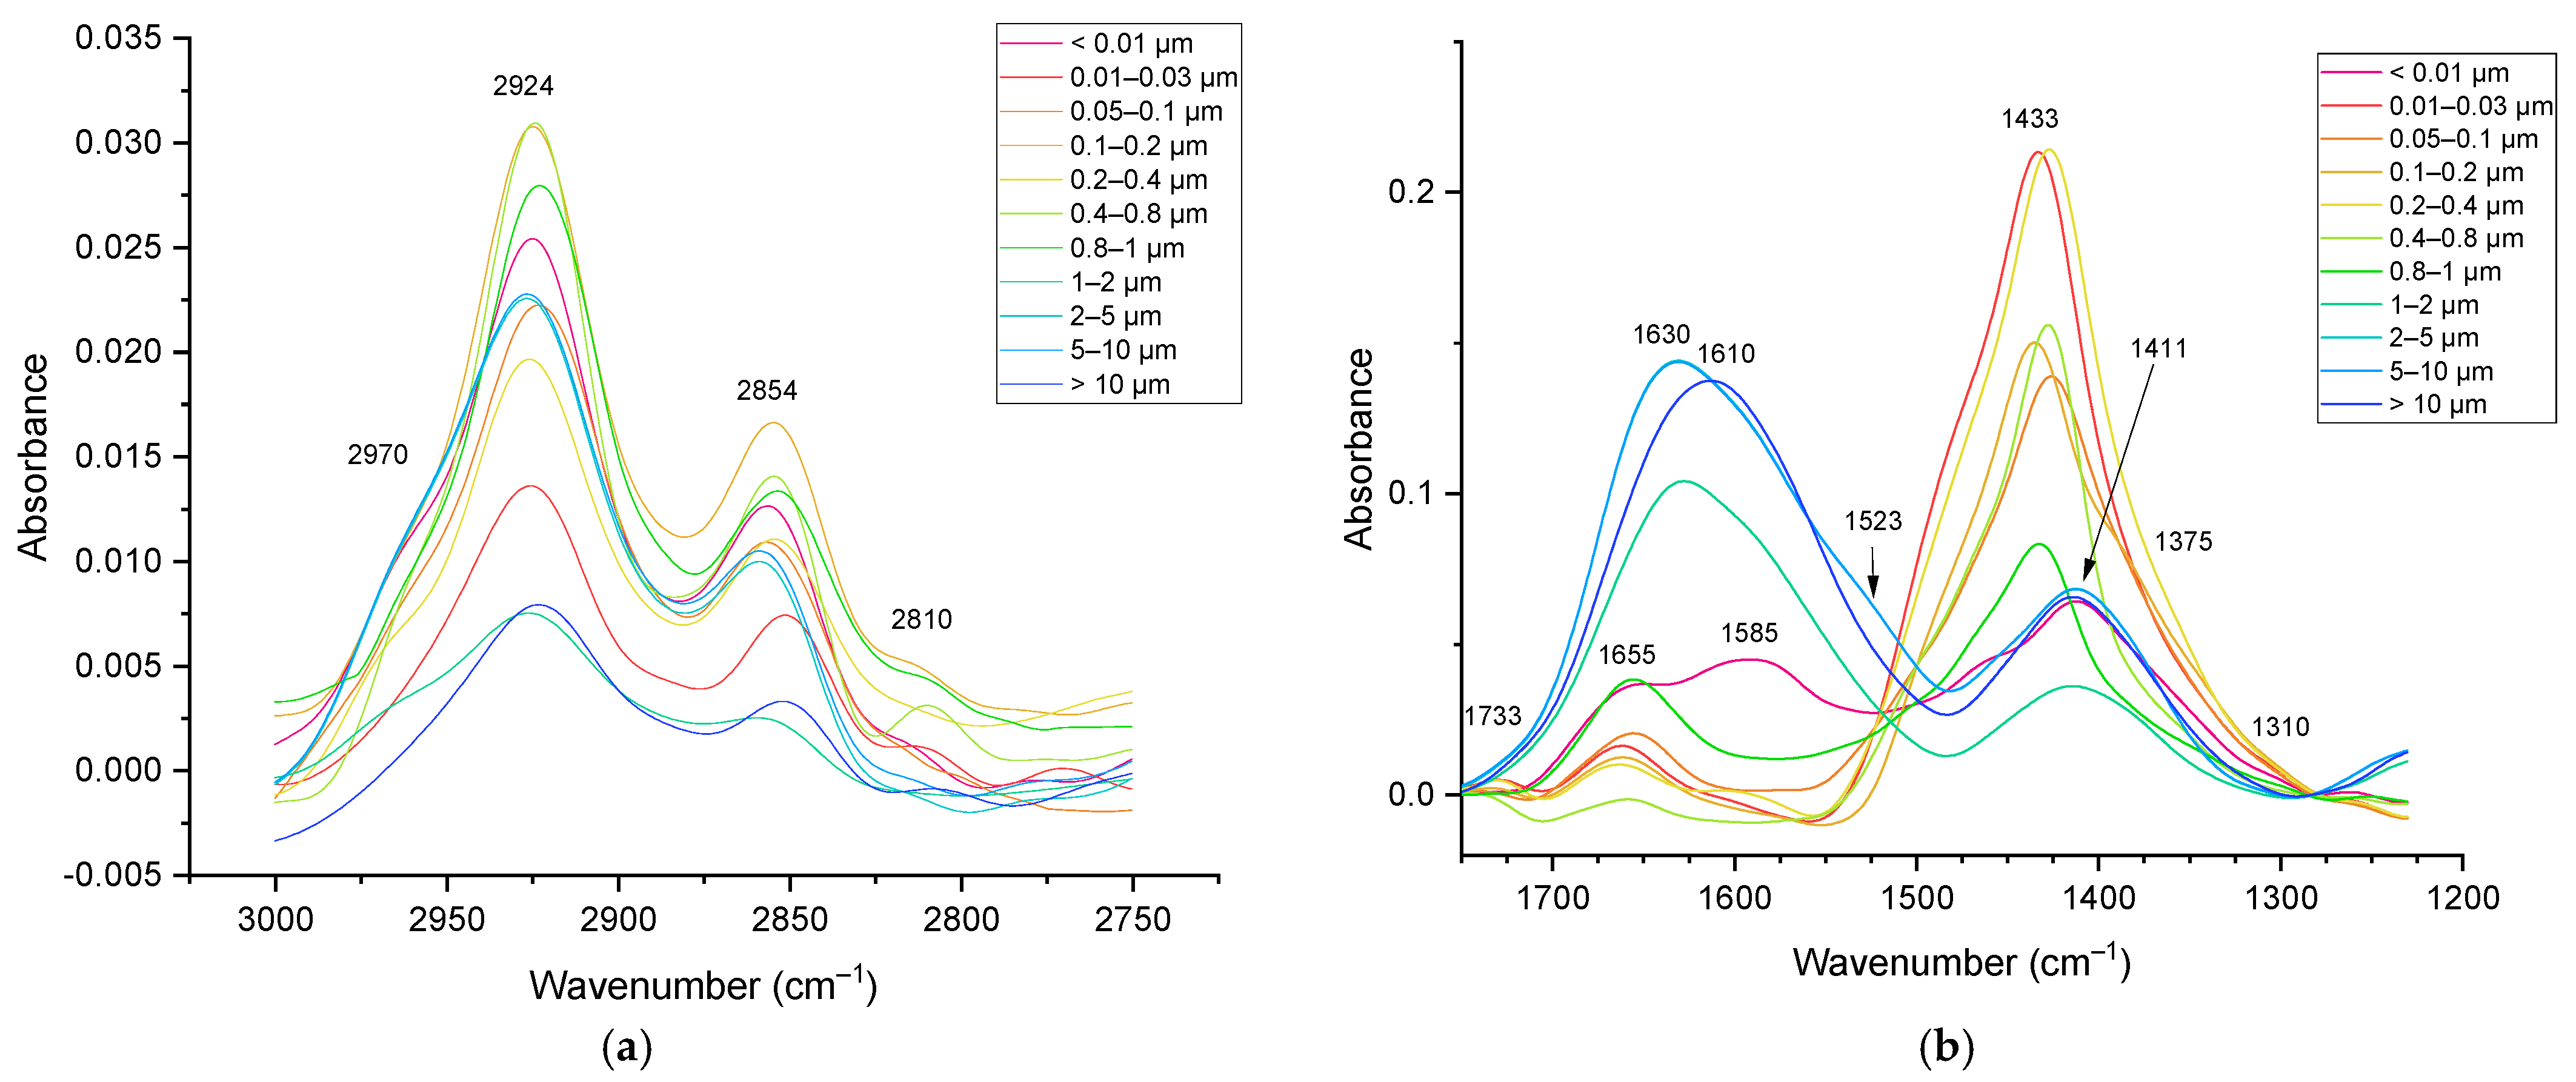
However, some differences in the structure of these substances are obvious. In the CH range (Figure 4a), in general, a greater number of methylene groups in medium and fine fractions are found. This may indicate the branching of the chains of aliphatic hydrocarbons; in combination with the predominance of methylene groups in the medium fractions, and the presence of carbohydrates, acids, and alcohols, as well as products of microbial metabolism in them, while in large fractions (3.5–10 μm), terminal methyl groups predominate. Thus, they contain either relatively small or more likely highly branched and less oxidized aliphatic compounds, which can be the primary products of microbiological destruction of the incoming organic matter.
Notably, in the middle fractions, the band at 2800 cm−1, which usually corresponds to ‘aldehyde’ neighboring C–H, is manifested (which may be the reflection of sugar contents). This distribution of organic functional groups is consistent with the data obtained in the analysis of the CN/C ratio in the 0.2–2 µm and 2–6.3 µm fractions [143]. A significant increase in this parameter is shown in larger fractions, which means a higher content of amino acids and other nitrogen-containing detrital compounds in them.
A narrow band at 3390 cm−1 is characteristic of sodium azide, which was used as a preservative. It should be noted that this band was not observed in all fractions, which may be due to problems in depositing the sample in the form of a film on the ATR diamond crystal (see below).

3.2.2. SOM Region (1700–1170 cm−1)

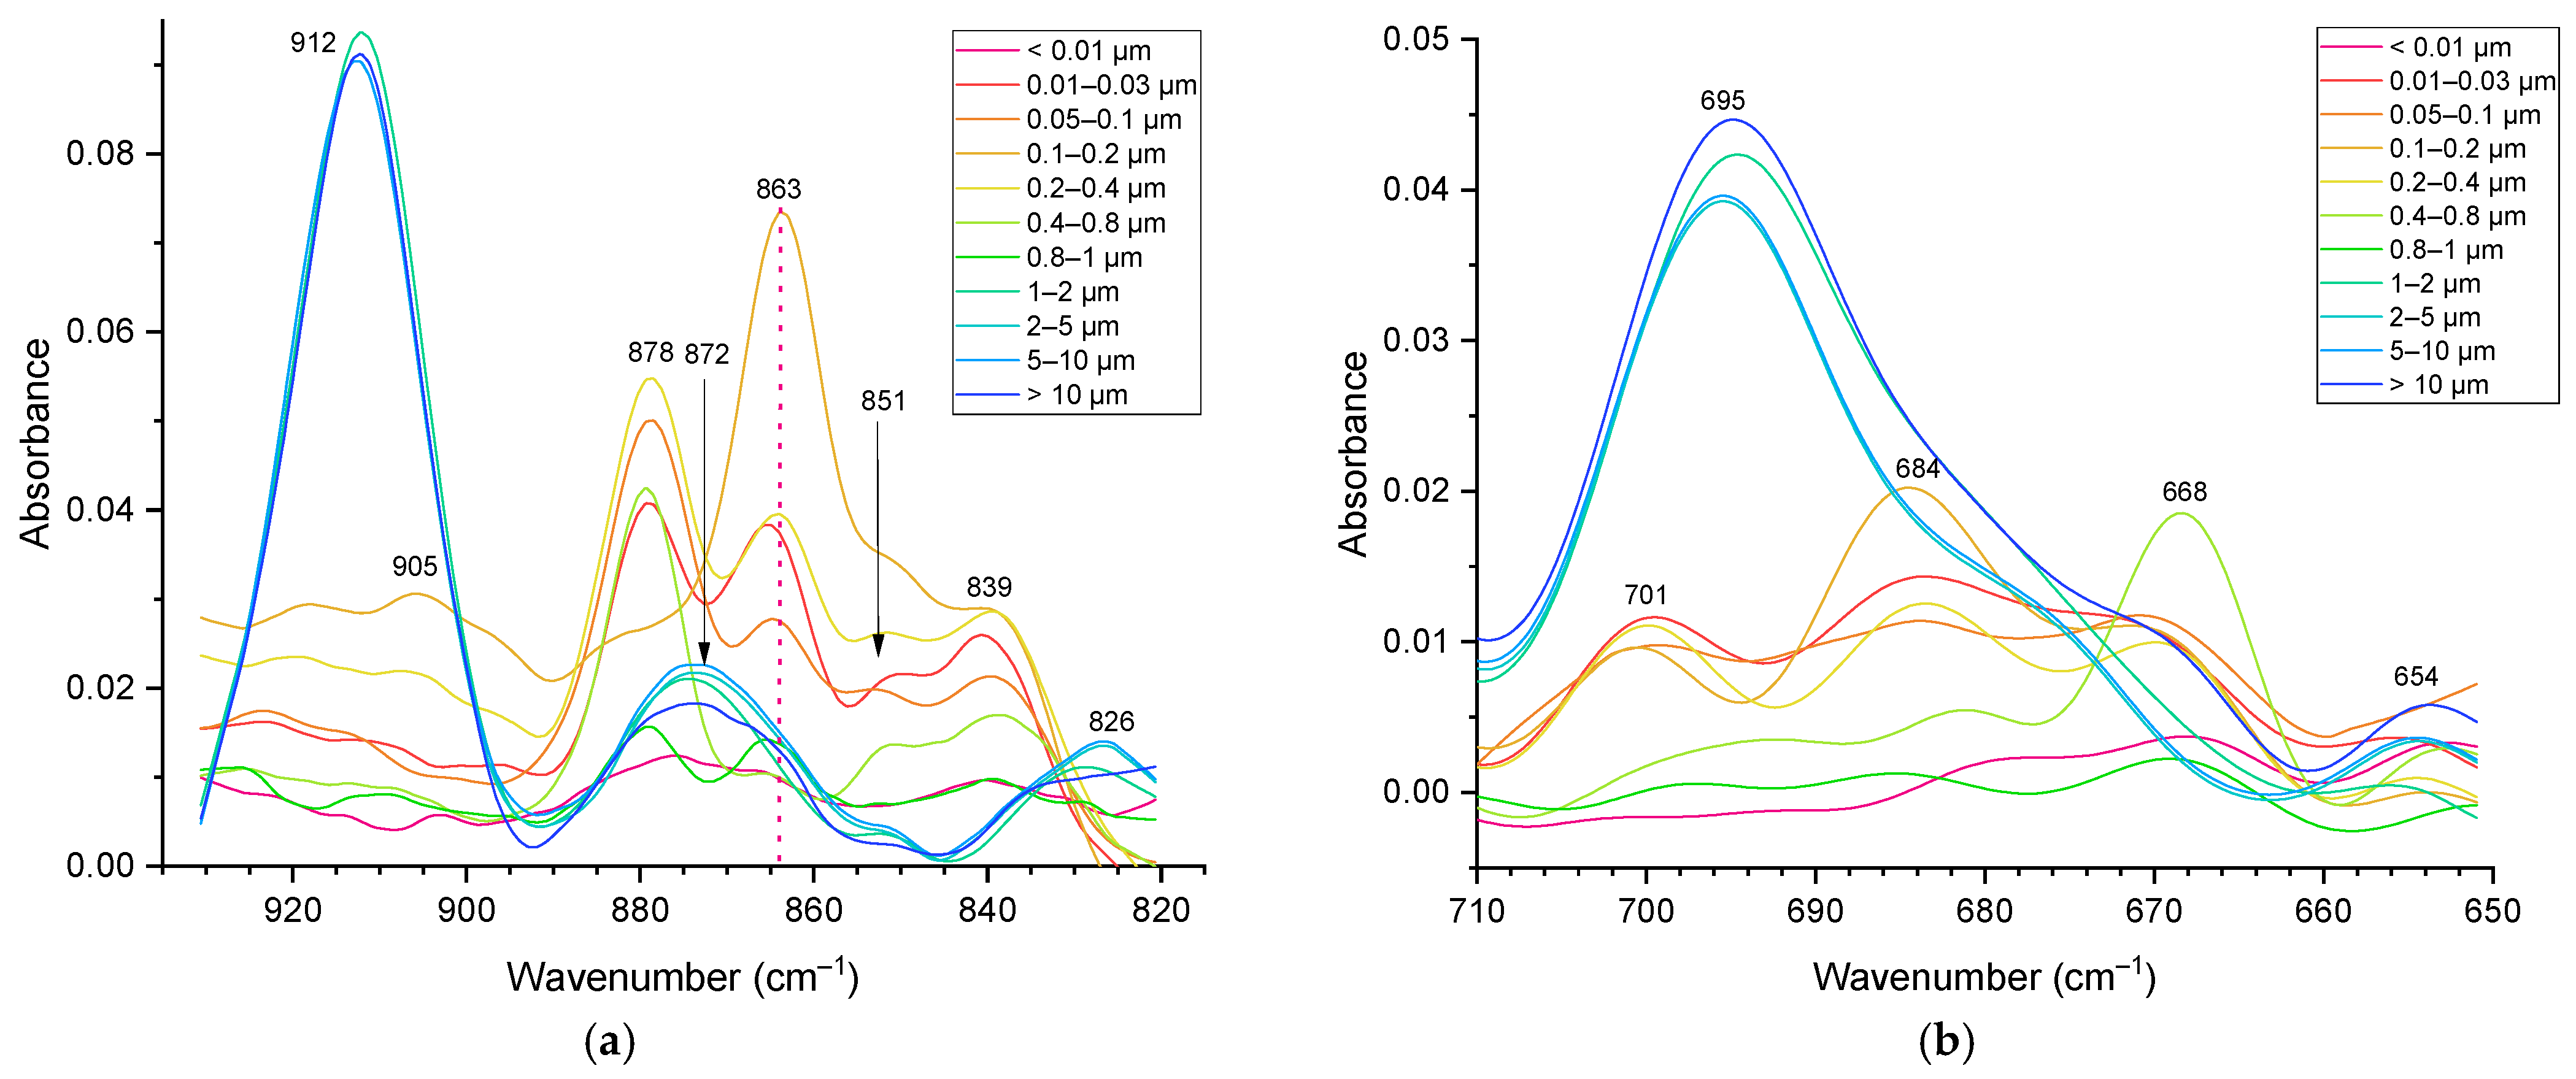
In the range of 2500–1250 cm−1 (Table 3 and Figure 4b), only two distinct bands were observed for all fractions with a particle size greater than 1 µm. The first of them, the composite band at 1630 cm−1, is associated in the existing literature with stretching vibrations –C=C– in aromatic compounds that are part of soil organic matter [49]. Since many researchers, including [144], have shown that quartz predominates in the mineralogical composition of fractions larger than 1 μm, this band can be a manifestation of vibrations in soil water and SiO2 (Table 3). Also, bands in the range of 1650–1600 cm−1 can be associated with antisymmetric carboxylate vibrations, which may indicate the presence of lignin and/or various aromatic and/or aliphatic carboxylates in these fractions [145]. This band is also discussed below. The band at 1410 cm−1, in turn, can be attributed to vibrations of the hydroxyl group associated with magnesium [109].
In large fractions, the band of water absorption is visible, which practically disappears in medium and fine fractions (Figure 4b); there is no crystalline quartz and almost no ferruginous minerals; clay silicates of the smectite group and illites prevail [144,146]. Carboxyl compounds are found in all fractions (Figure 4b), which confirm and complement the data obtained during the analysis of the shortwave IR range. While in the nano-size fractions (true solutions), they appear as ionic bands of carboxylates; in the remaining fractions, they are bands of undissociated carboxylic acids. Figure 4 shows that in fine fractions, the bands corresponding to CH groups at 1500 and 1300 cm−1 are more pronounced.

3.2.3. Matrix II and I Regions (1170–800 and 800–150 cm−1)

In the range of 1250–100 cm−1 (Figure 5) of the obtained IR spectra, bands related to the inorganic soil matrix predominate [97]. Most of the intense bands in the spectra are associated with Si–O vibrations in quartz or silicates (Table 3), e.g., the band centered at 1020 cm−1 is attributed to Si–O stretching vibrations in quartz and/or clay minerals. Also, in this range, there are bands related to vibrations of the Mg(Al)–OH group (915, 780, 750, and 430 cm−1) in clay minerals such as kaolinite and smectite, and iron oxides (655 cm−1). At the same time, the organic component also contributes to many of these bands. In several studies [147,148], these bands are also associated with the presence of cellulose and lignin (1090 and 1030 cm−1) in SOM, with C–H vibrations in aromatic and aliphatic compounds (800 and 605 cm−1).
In general, in the long-wavelength range of the spectrum (less than 800 cm−1), vibration bands of carbonates, quartz, and iron oxides predominate. However, at the same time, C–H vibration bands in aromatic compounds and/or N–H vibrations (out-of-plane vibrations in primary amines and wagging vibrations in secondary amines) can be present in this range [99]. In the spectra of fractions larger than 1 μm, α-quartz predominates (Figure 3). For smaller fractions, quartz bands are almost invisible, and no new bands appear (Figure 3). All fractions are available in four ranges: 3000–2750 (CH), 1750–1200 (SOM), 900–800, and 700–650 cm−1 (both are silicate, possibly SOM); Figure 4 and Figure 5.
In general, the data of the IR spectroscopy show that fractions of different sizes differ qualitatively in the composition of both mineral and organic components and largely correspond to the data obtained earlier by other methods. It has been confirmed that quartz predominates in large fractions (Figure 5, carbon dioxide bands are visible in the middle fractions). In large fractions, quartz dominates, partially with primary silicates (Figure 5b) and non-silicate ferruginous minerals, which was shown by X-ray diffractometry, Mössbauer spectroscopy and thermomagnetic analysis [142,144] in smaller fractions, whereby more intense Al–O bands are found, corresponding to clayey (secondary) aluminosilicates and aluminum oxide [14,146,149]. The data correlate well with elemental analysis of these fractions [14]. In medium and fine fractions, Al–O bands are manifested (satisfactorily correlated with elemental analysis, [14]); see Figure 5b. Carbonate bands appear everywhere (pronounced in large areas, shoulder bands in small- and medium-sized ones); see Figure 5b.
Regarding the qualitative differences in the composition of the organic matter of the fractions, all fractions larger than 1 μm contain bands associated with a specific organic matter of humic nature. At the same time, large (3.5–10 μm) fractions contain many highly branched aliphatic compounds enriched with terminal CH3 groups, which may be products of the primary destruction of the incoming detrital mass. The medium-, fine-, and nano-sized fractions contain more oxidized aliphatic compounds. It can be assumed that the lengths of the chains decrease as the size of the particles decreases.

3.3. IR Correlations

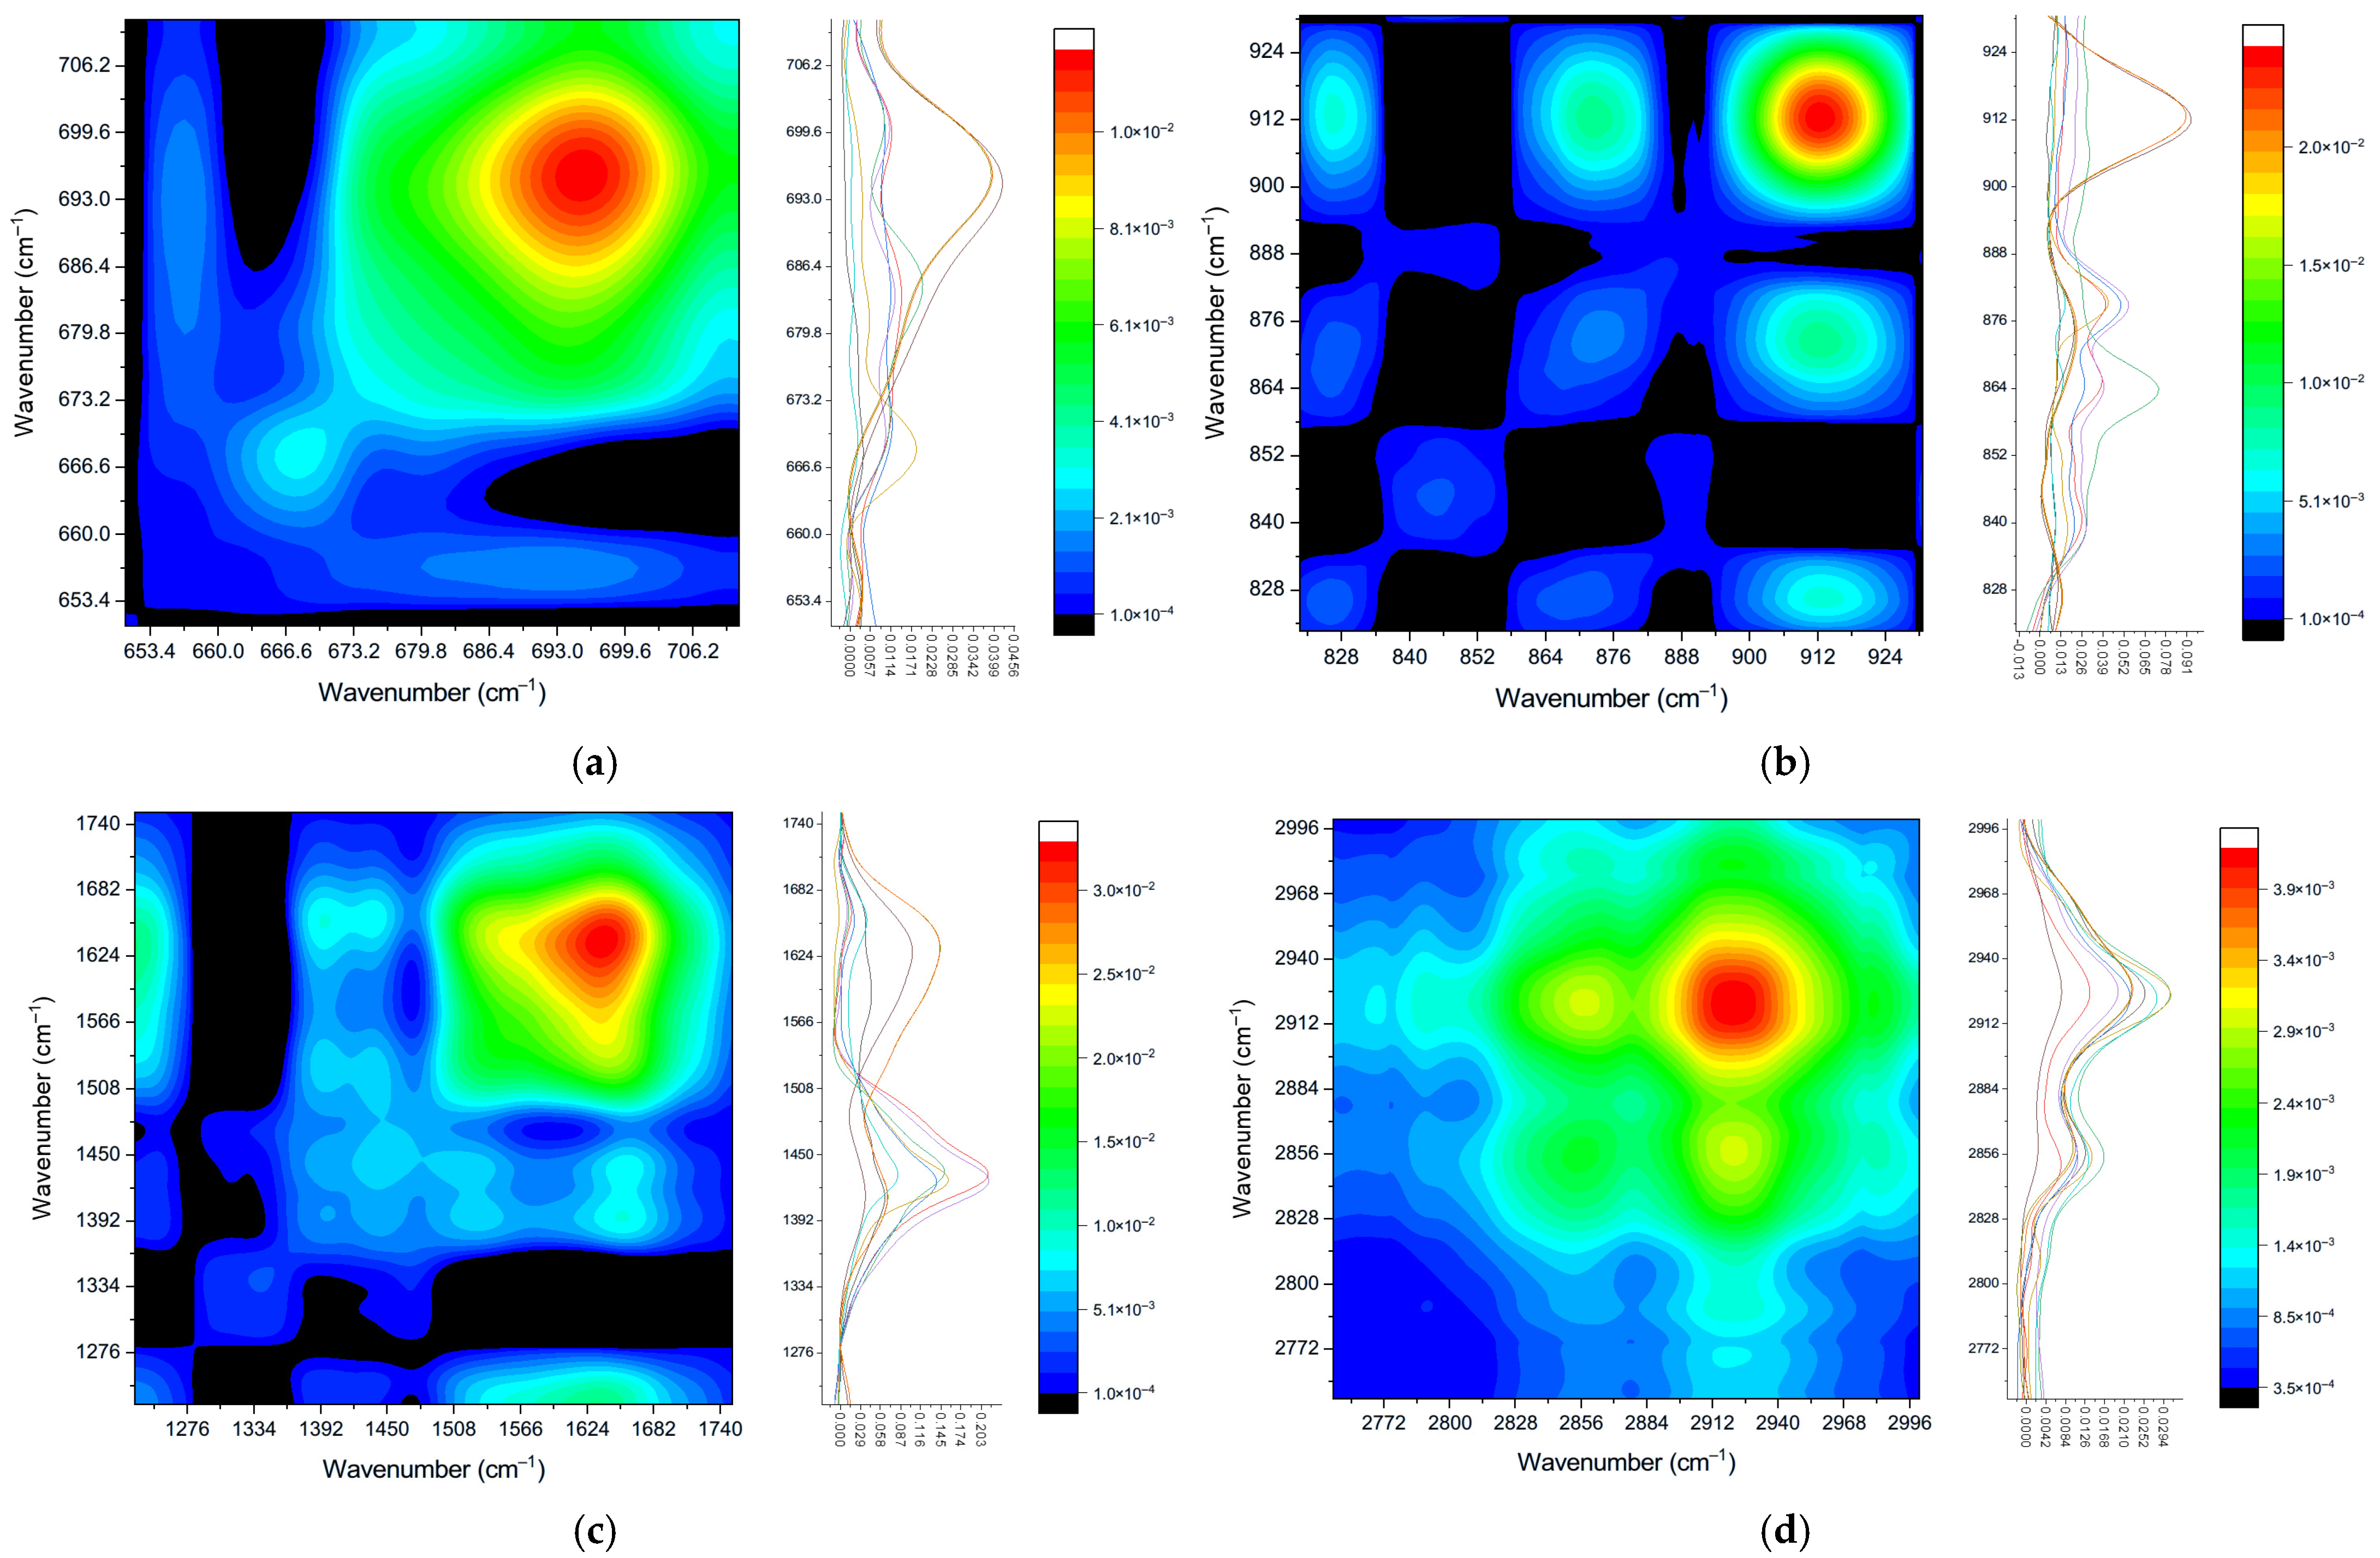
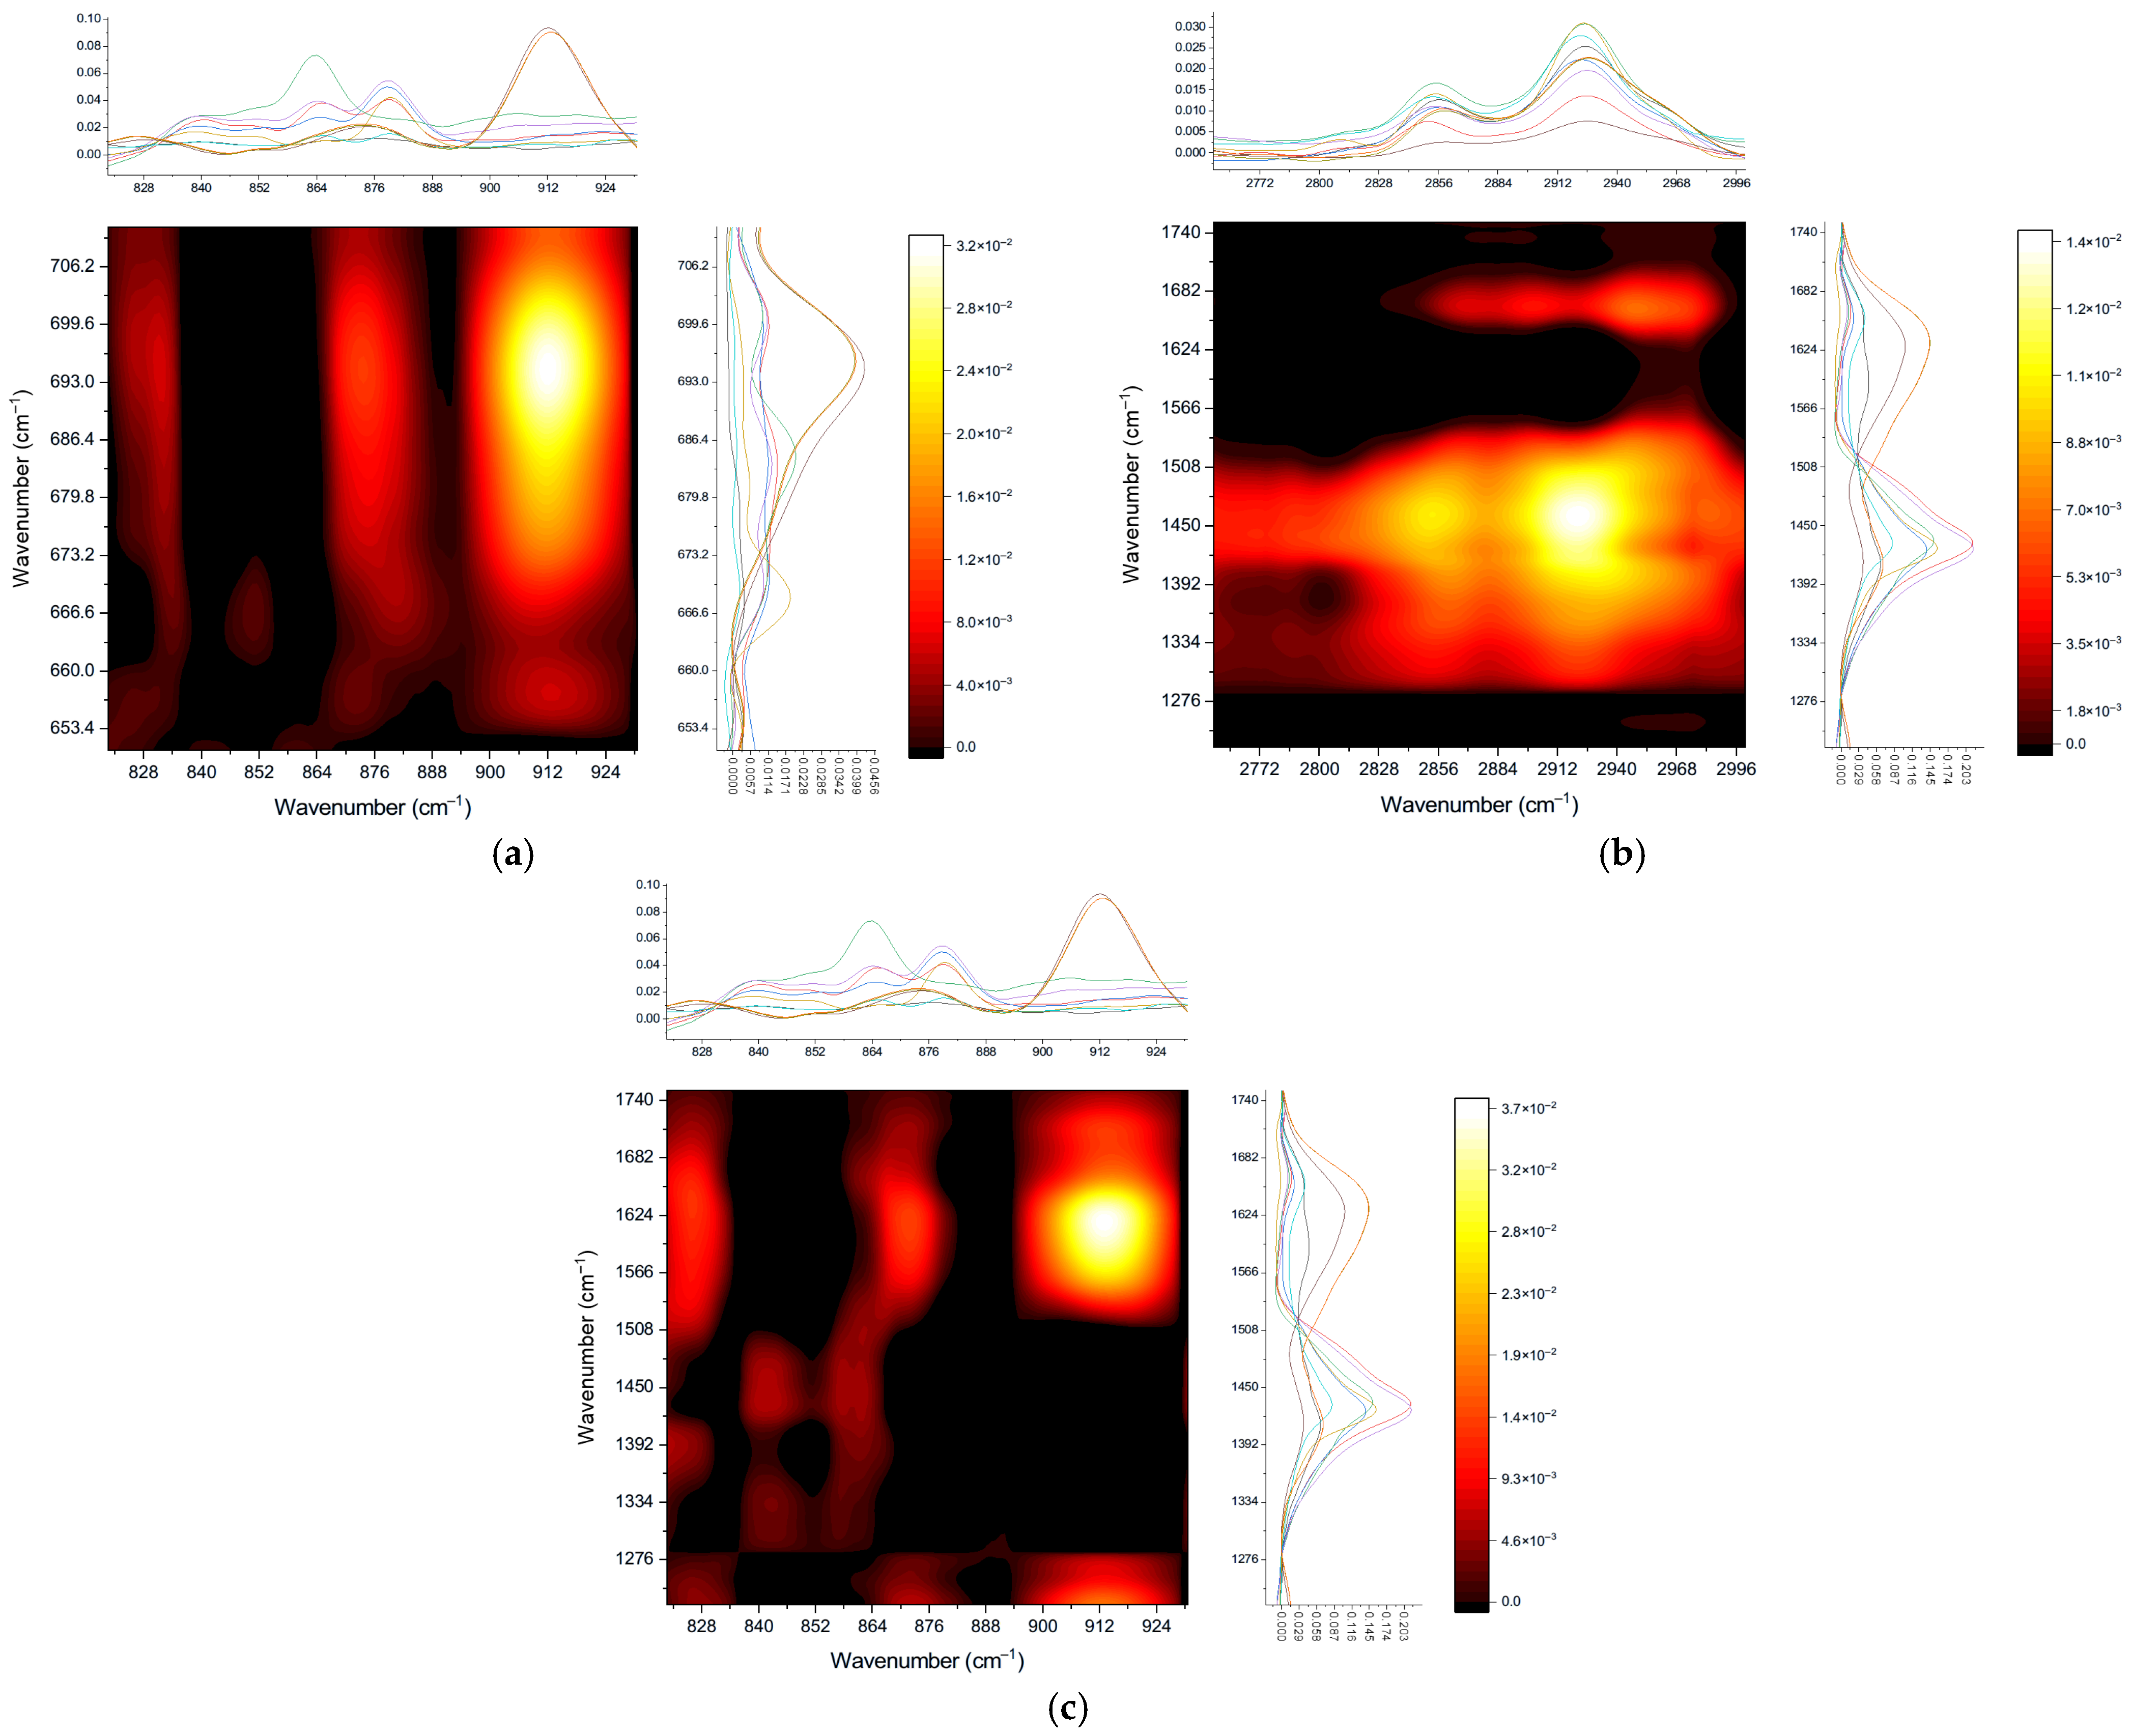
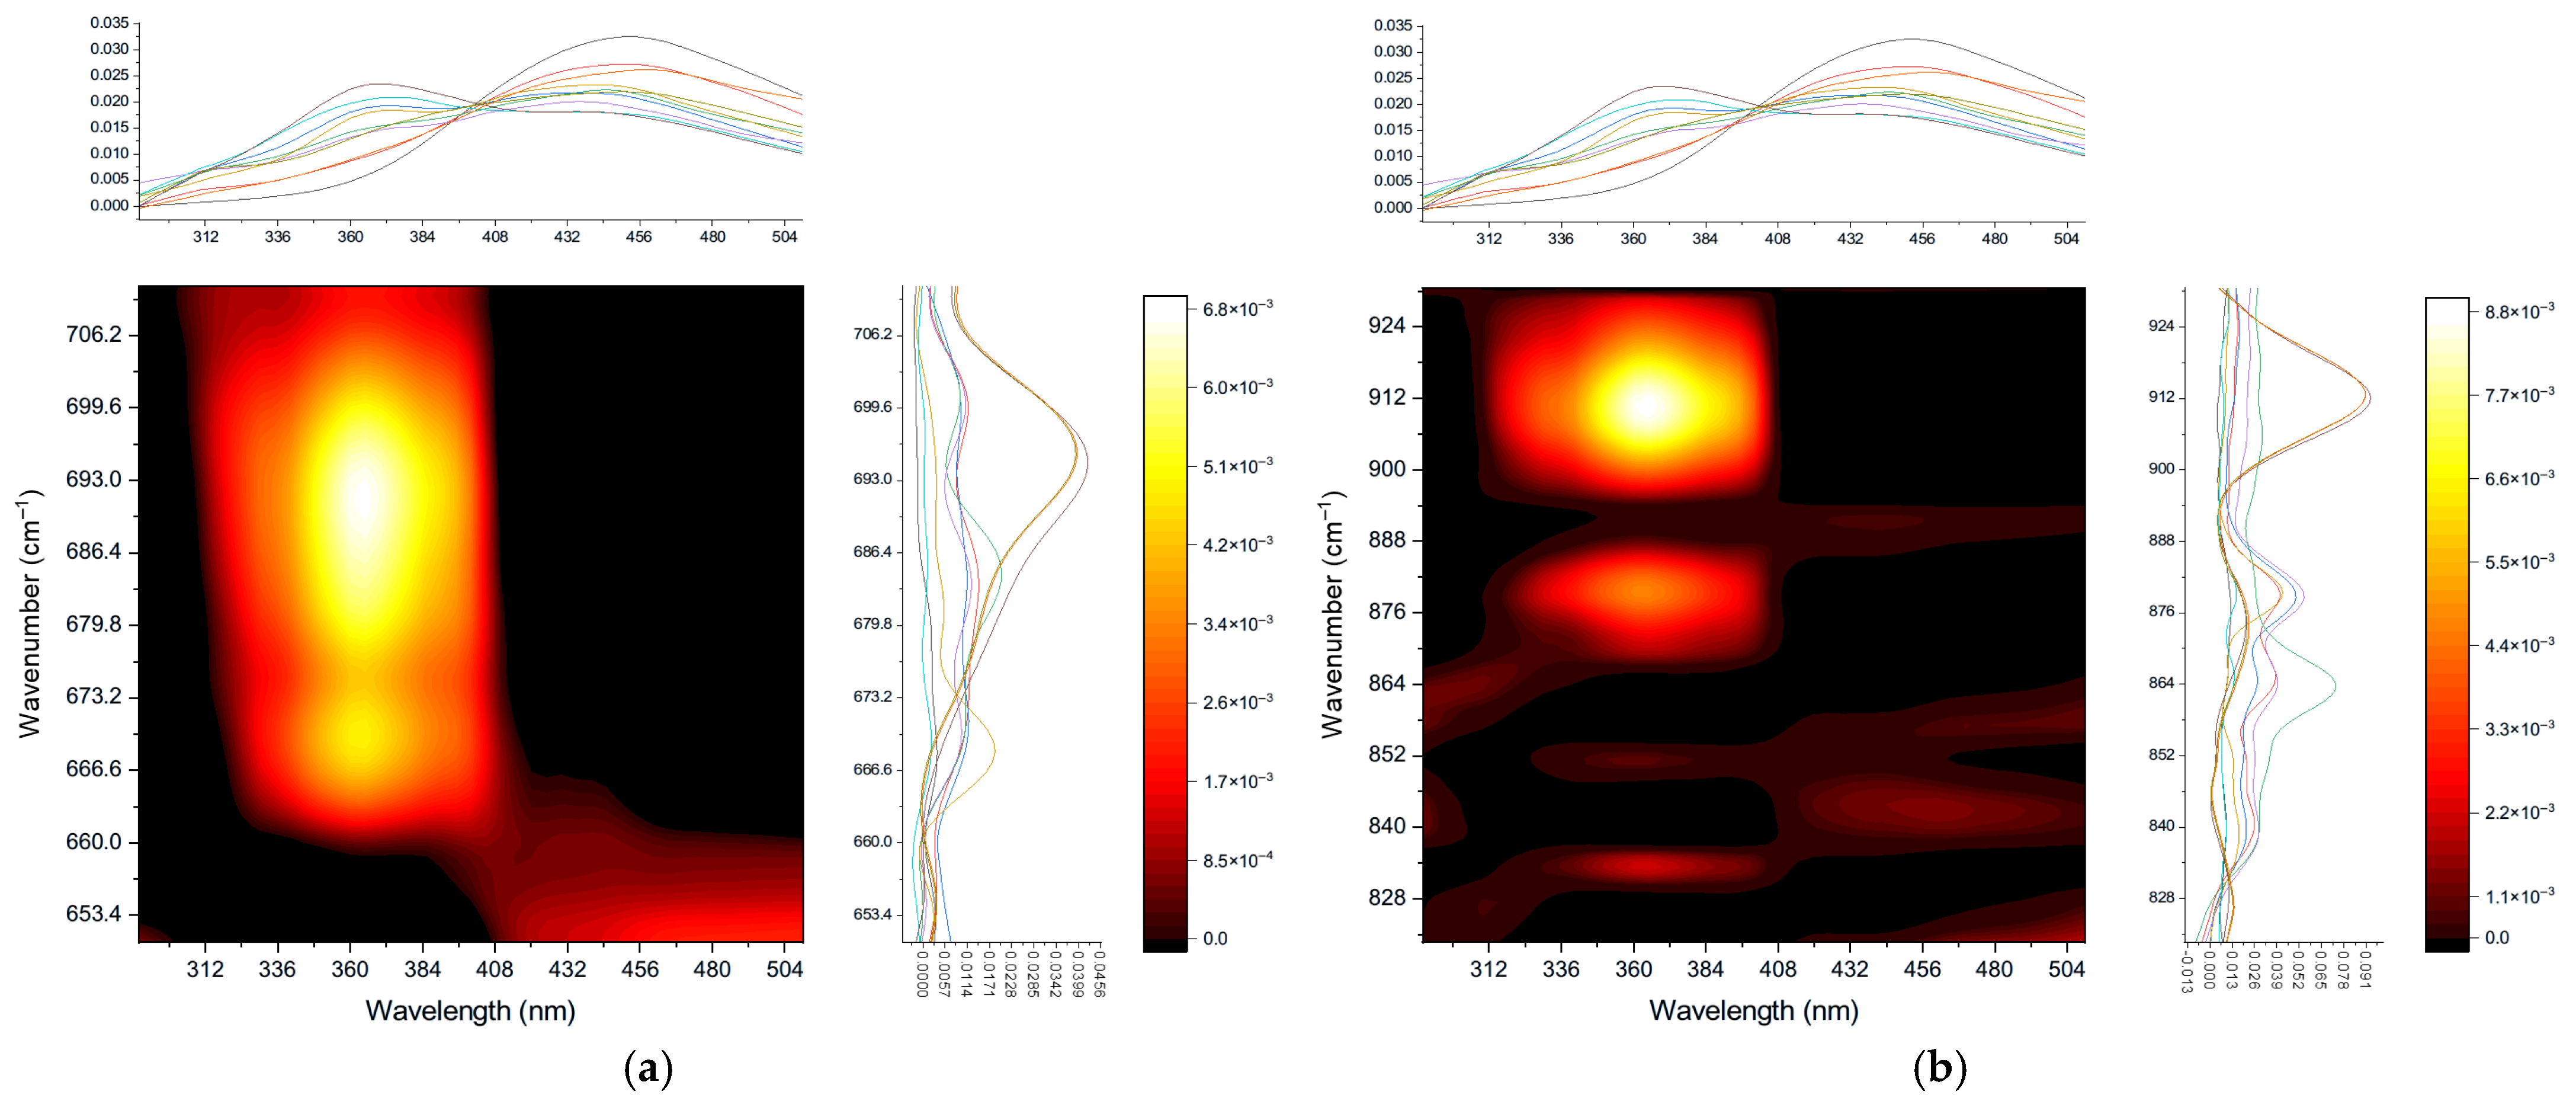
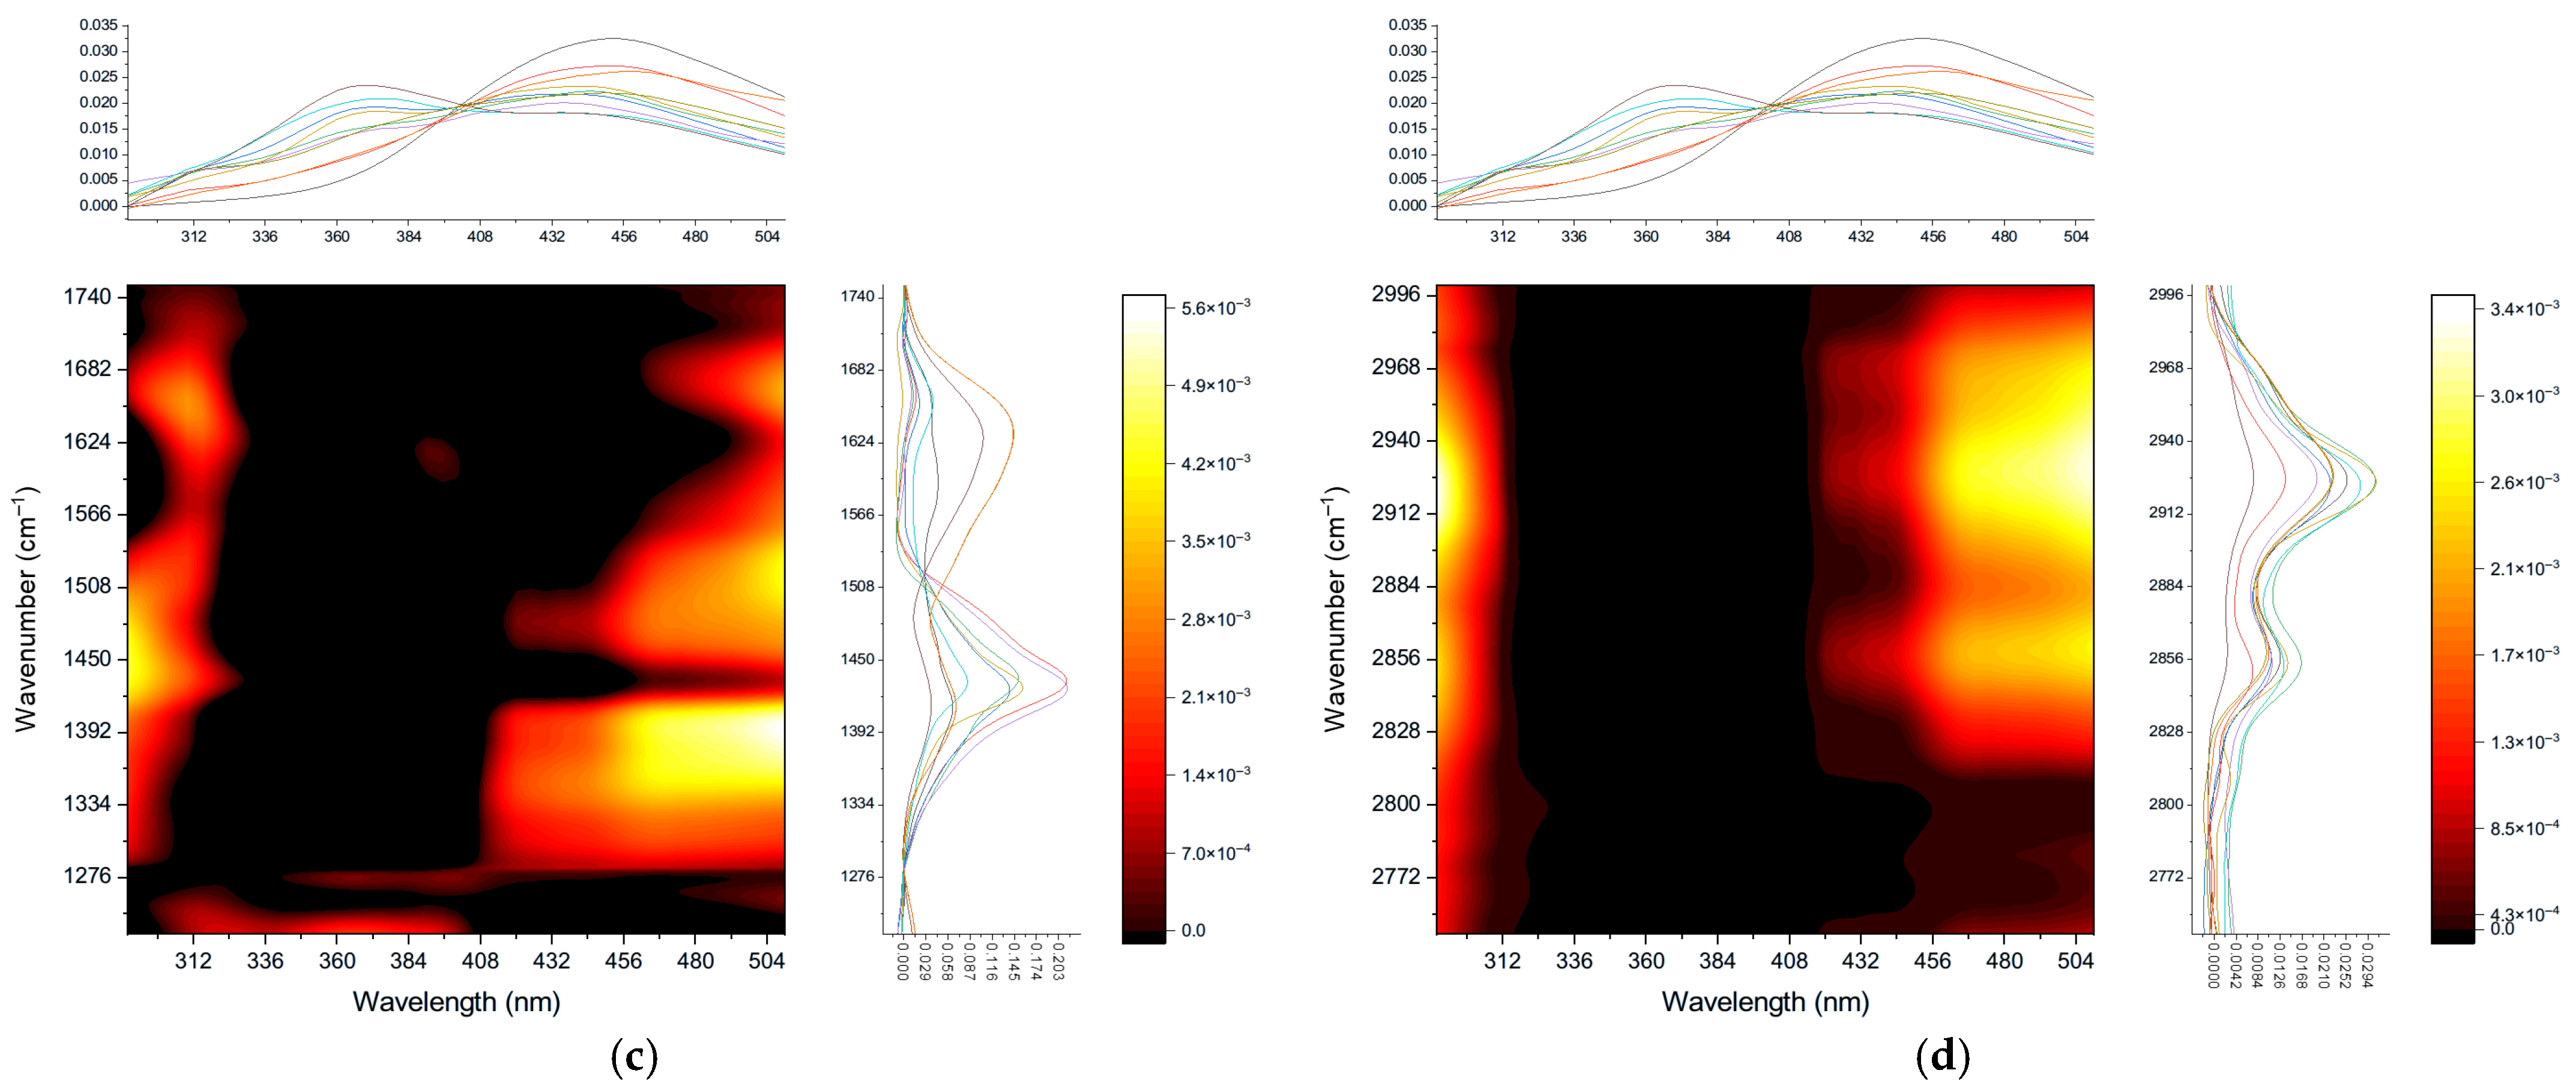
To test the band attribution hypotheses, homospectral and heterospectral 2D-COS maps were constructed; see Figure 6 and Figure 7. Fraction size was used as a 2D-COS perturbation variable as the main concept was to show the overall changes and the trends among size fractions.
Synchronous maps (Figure 6) reveal self-correlations driven by coherent compositional variations across fractions. In the silicate range of 700–650 cm−1 (Figure 6a), the quartz band of 697 cm−1, as expected, exhibits the strongest autopeak (prominent red region), reflecting its dominance in the composition, and the whole range 710–670 cm−1 shows positive correlation from the whole coupled Si–O lattice vibrations in heterogeneous silicate and quartz matrices in all the fractions. In the range of 900–800 cm−1 (Figure 6b), the same is observed for the autopeak of carbonate band at 912 cm−1, and the band at 880 cm−1 is well-correlated with other SiO2 bands. In the range of 1800–1200 cm−1 (Figure 6c), the water band at 1624 cm−1 dominates (the autopeak); and there is a weak but distinct correlation of carboxylates (1390 and 1580 cm−1) with one another and with the OH band at 1624 cm−1. Finally, in the range of 3000–2800 cm−1 (Figure 6d), synchronous maps show an obvious correlation of both antisymmetric and symmetric stretch of methylene groups at 2920 cm−1 (the main autopeak) and 2850 cm−1, showing the dominant contribution of alkyl chains in this region. Thus, IR homospectral synchronous correlations mainly confirm the attribution of the bands in IR spectra and highlight fraction-specific coherencies.
Asynchronous maps (Figure S6, Supplementary Information) in the performed experiments reveal changes in characteristic components with the fraction size. In the silicate range of 700–650 cm−1, all the quartz ranges change synchronously (Figure S6a); in the range of 900–800 cm−1 (Figure S6b), the carbonate band of 880 cm−1 changes similarly to the bands of Al–O and not like bands of quartz, which points to the larger amounts of aluminosilicates in fine fractions. In the range of 1800–1200 cm−1 (Figure S6c), carboxylate bands change in an opposite way to C–H, pointing to changed oxidation shares of SOM and in the range of 3000–2800 cm−1 (Figure 6d); methylene and methyl bands show a different behavior, revealing a possible change in the chain length. Overall, the asynchronous maps show the correlation of Al and Si, which is consistent with [14] and reveals the difference in fraction by carboxylate and C–H components, which is discussed below.
The comparison of ‘inorganic’, low-wavenumber ranges of 700–650 cm−1 and 900–800 cm−1 related to quartz and aluminosilicates by synchronous heterospectral correlations (Figure 7a) shows the correlation of most silicate bands found by IR spectra and homospectral IR correlations. By comparing the SOM-dominating ranges, 1800–1200 cm−1 and 3000–2800 cm−1 (Figure 7b) show excellent correlation of the ranges of bending and stretch vibrations of –C–H. This fact confirms that the range of 1500–1390 cm−1, which cannot be exactly elucidated from direct FTIR measurements, is C–H vibrations. Interregional heterospectral correlation of regions of 1800–1200 cm−1 and 900–800 cm−1 (Figure 7c) shows that the adsorbed water band at 1630–1610 cm−1 correlates with silicate (bands at 900 and 700 cm−1).
Thus, most of the conclusions on the band assignment made by direct IR spectra are confirmed. However, heterospectral IR–IR correlations of the same spectra show a much larger volume of information and provide a way to extend the information on the bands, based on the C–H range, confirming other hydrocarbon groups.

3.4. Fluorescence Measurements

Correspondence of various regions of EEM to certain groups of compounds was first made in 1996 [86], in which individual bands but not regions corresponding to these regions were marked. So, the authors wrote that the B band of tyrosine- and protein-like substances can be detected at a pair of wavelengths (ex, em) = (275, 310 nm), and the T band (tryptophan- and protein-like compounds) at a pair (275, 340 nm). The two identified bands which are correlated with humic-like substances (bands A and C) can be found at (ex, em) = (260, 380–460 nm) and (ex, em) = (350, 420–480 nm), respectively. The existence of the region of marine humic-like compounds should also be noted. However, this does not mean that it cannot be present in such samples, since this band was found in a non-marine environment [25]. In this study, marine-origin humic-like substances were not considered as the preliminary studies, which showed that the corresponding range shows very weak and irreproducible intensities in EEMs.
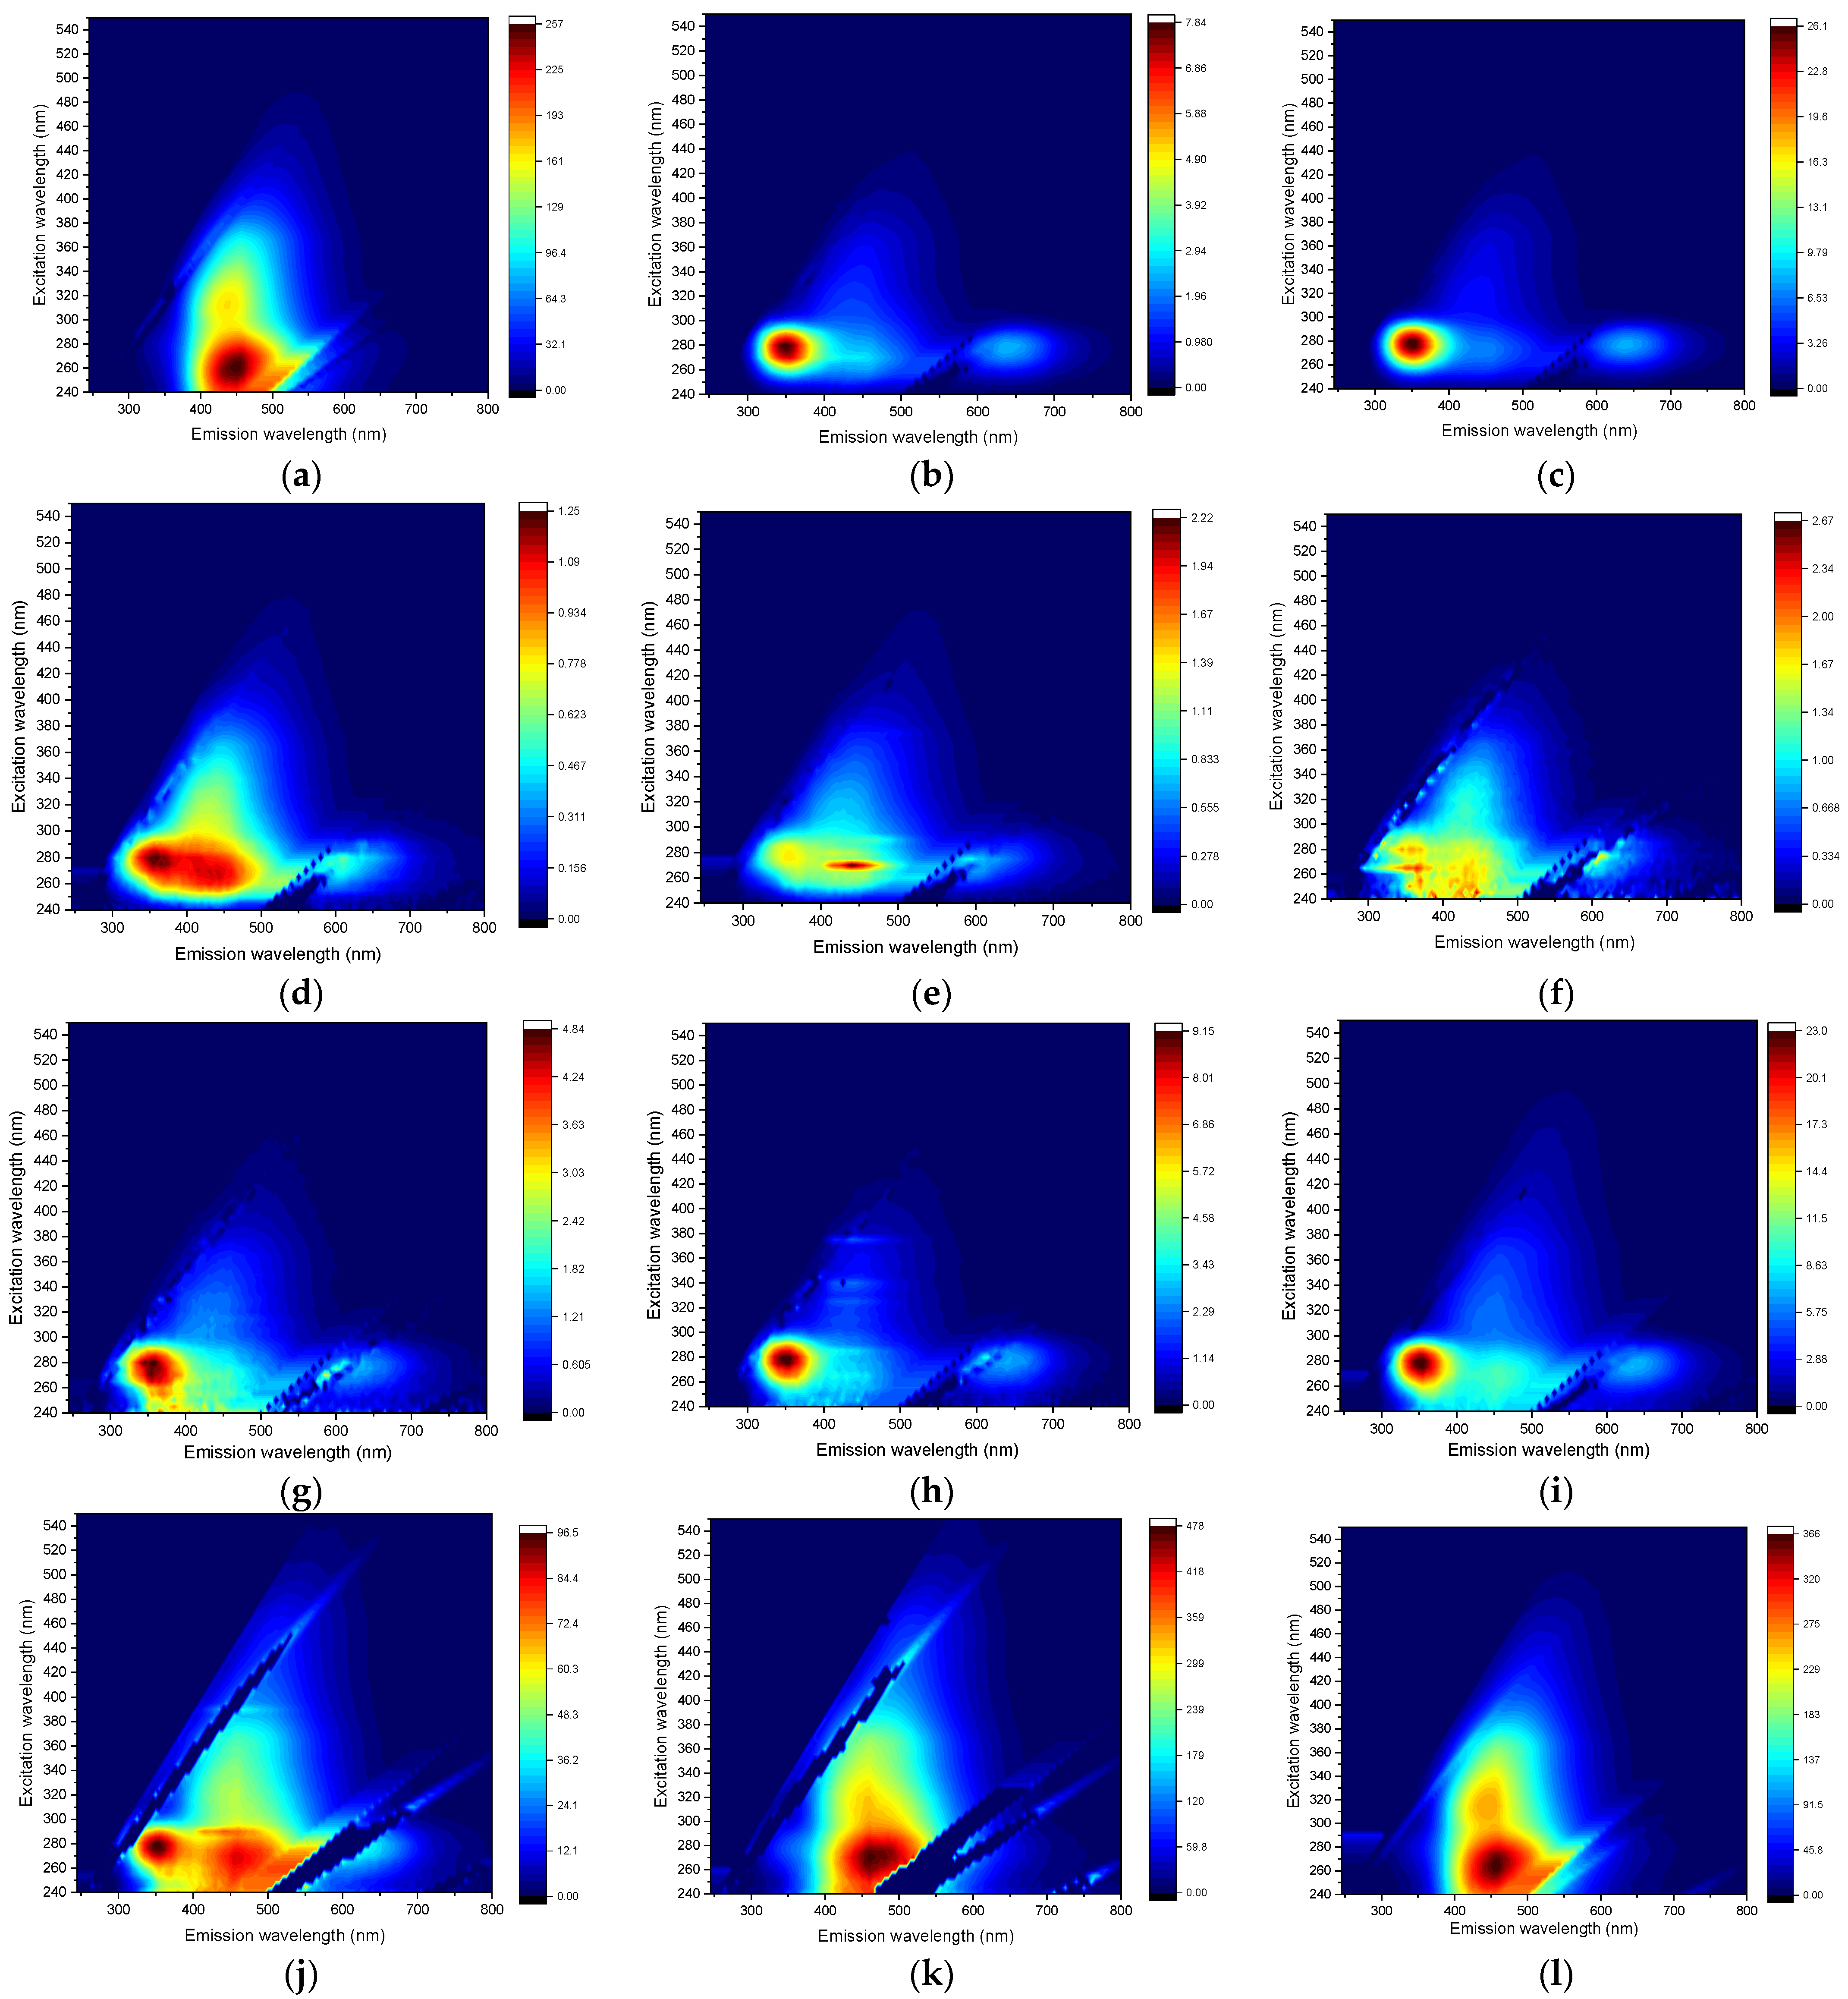
In [85], the intervals above were somewhat expanded: the bands became regions. The authors [85] also introduced slightly different notations for these areas (Table S3, Supplementary Information). In later papers, the ranges were also slightly expanded [25,150], and new groups of compounds were added in addition to those already mentioned. Thus, in [150], groups of compounds such as hydrophobic fulvic acids or soluble waste products of microbes can be distinguished, while not dividing the area of humic acids into two areas, as in previous works. The EEM fluorescence spectra for different size fractions are shown, with the fluorescence intensity being normalized on xenon lamp emission intensity (Figure 8). Based on the existing data [85,86] and due to the real regions (Figure 1 and Figure 8), expanded regions were selected (A*, B*, C*, and T*, Figure 1). The comparison of regions A*, B*, C*, and T* and the traditional boundaries (A, B, C, and T) show that expanded regions provide better sensitivity for low intensities for fractions with low amounts and almost no changes in the ratios and fluorescence indexes.
In general, the shape of the matrices was comparable for all the obtained fractions and expectedly, the marine-based peak of humic substances was negligible in all the fractions, and it was excluded from the consideration (Table S3, Supplementary Information). However, integral intensities and the positions of fluorescence-intensity maxima of the resulting peaks (A, B, C, and T; A*, B*, C*, and T*) and their ratios varied significantly throughout the size profile. For fractions above 10 µm, 5–10 µm, 2–5 µm, 0.05–0.1 µm (less intense than other fractions in this list; Figure 8i–l), and also below 0.01 µm (Figure 8a), peaks at (ex, em) = (260–270; 450–490 nm) (A) and (ex, em) = (315–330; 420–460 nm) (C) designated to humic-like substances are the most pronounceable (Figure 8). According to [151], A and C peak positions depend on their origin, fulvic or humic acids. In all the fractions, the above major peak positions show that they are contributions from mainly fulvic components of SOM. However, secondary, redshifted peaks in regions A and C at (ex, em) = (260–270; 510–540 nm) for A and (ex, em) = (350–365; 510–540 nm) for C are rather clearly seen for all the above fractions and also for the fraction 0.2–0.4 µm (Figure 8f), which is quite different from all other fractions. This is evidence of the contribution of humic acids [151], which seem to dominate the fractions of 2–5 µm and 0.2–0.4 µm.
The other group consists of fractions of 1–2 µm, 0.8–1 µm, 0.4–0.8 µm, 0.1–0.2 µm, 0.03–0.05 µm, and 0.01–0.03 µm (Figure 8b,c,g–i). For these samples, the tyrosine-like substances, such as peak B at (ex, em) = (270–280; 300–320 nm), are more distinguishable than humic- or tryptophan-like bands. The rest of the samples (2–5 µm, 0.2–0.4 µm, and 0.1–0.2 µm) (Figure 8e,f,j) contained bands corresponding both with humic-like and tyrosine-like substances. The most intense EEMs were for fractions above 10 µm, 5–10 µm, and below 0.01 µm when the fluorescence intensities of other fractions were much less in their values. It is worth mentioning that the largest and finest fractions show similar EEMs, quite different from medium fractions.
Obtained fractions significantly differ from each other in terms of the fluorescent components content of organic matter. Figure 8 shows that the large and fine fractions are identical to each other in composition (in this case, a change in the content of less than five units was not considered significant). However, the medium fractions differ very significantly from them. Thus, from large to medium fractions, there is a tendency for a decrease in the total content of humic-like compounds and an increase in the content of tyrosine-like substances with a maximum value of 50.3% for a fraction of 0.03–0.05 μm. At the same time, the content of tryptophan-like compounds for all fractions is <1%, which may be due to insufficient coverage of this EEM region during the study. In many studies, e.g., in [27], the main band of tryptophan-like compounds is at λex = 200–250 nm, but in this study, the excitation wavelength range of λex = 240–550 nm was analyzed.
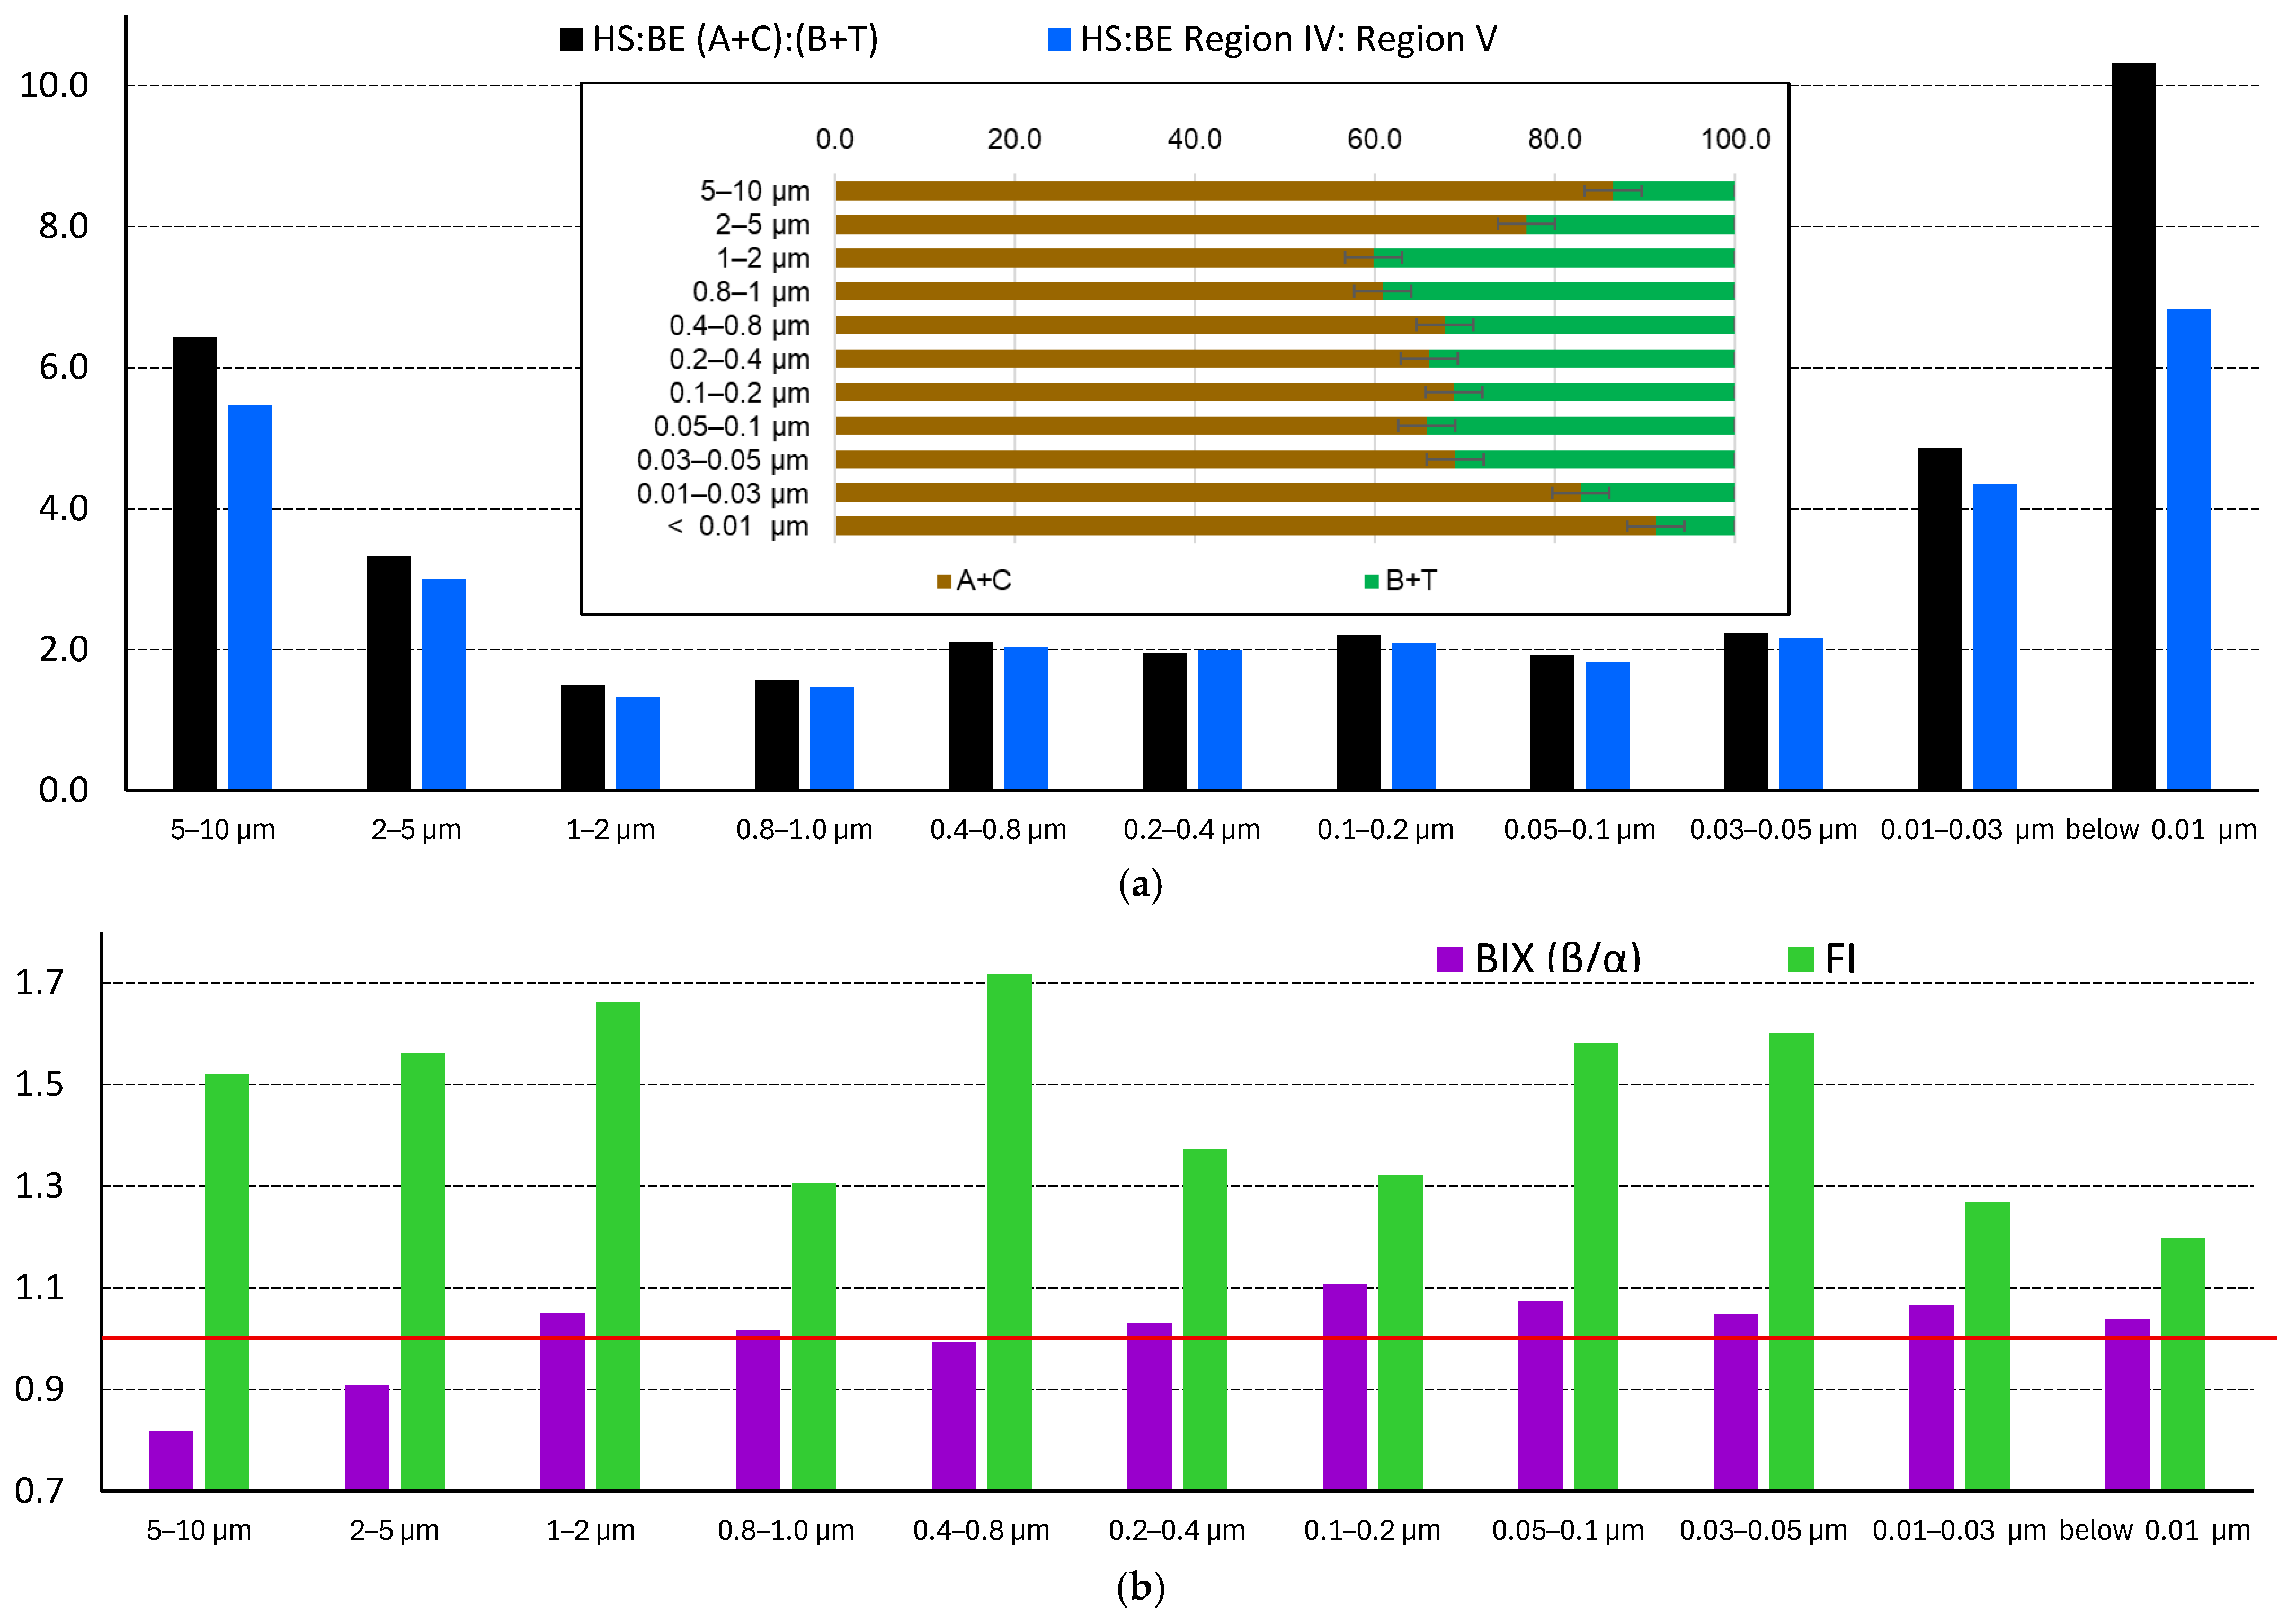
The analysis of main fluorescence parameters shows that the approaches to select humic-like and non-humic compounds by A, C, B, and T (A*, B*, C*, and T*) ranges [85,86] and Regions IV and V [27] show the same picture (Figure 9a); both decrease for fine fractions below 1 µm and then start to increase for fractions below 0.1 µm; the finest fractions show the values close to large fractions. The difference in data for regions selected in the previous studies (Table S3 [85,86]) and the regions expanded from the experimental values (Table 2) is negligible. However, the reproducibility of values obtained for expanded ranges is better because the excitation ranges for the studied samples are redshifted compared to previous studies, and the regions are broader, which is accounted for in the expanded ranges A*, C*, B*, and T* used in this study.
Figure S2 shows that the contribution of peak A to the total value of humic-like compounds is approximately the same, and the main difference in the amounts of humic-like compounds is peak C, mainly to the contribution of the secondary band at 525 nm of more condensed humic substances in the largest and finest fractions (Figure 8). This is well-correlated with the increase in methylene groups in IR spectra at 2925 and 2860 cm−1 (Figure 4a) and heterospectral correlations (Figure 7b).
Figure 9a inset shows the profile of the sums of humic-like and non-humic components along the profile (a detailed picture for all the expanded ranges A*, C*, B*, and T* is given in the Supplementary Information; Figure S2). It shows the similarity of the largest fraction of 5–10 μm and the finest fraction of below 0.01 μm. Similarly, the next large fraction of 2–5 μm and the second-finest fraction of 0.01–0.03 μm also show the same values. For all these fractions, the humic-like compounds dominate (80%). For medium fractions, in the range of 0.03–2 μm, the ratio of humic- to protein-like compounds decreases (Figure S3, Supplementary Information) three-fold compared to the largest and finest fractions, and the percentage of humic-like compounds is around 60%. Also, in the medium fractions, the ratio of tryptophan-like (Band T*) to tyrosine-like compounds (band B*) decreases significantly (Figure S2) and is seven to ten compared to 30–50 for large and fine fractions.
As for main fluorescence indicators, their values along the profile of size fractions are different (Figure 9b). FI changes rather significantly, while there are no certain trends of the values along the size profile. FI values for the majority of fractions are ca. 1.2, which evidences mainly terrestrially derived (allochthonous, plant-produced) DOM, while for fractions 0.03–0.05, 0.05–0.1, 0.4–0.8, and above 1 μm, the values are ca. 1.5, which shows an increase in the contribution from autochthonous (microbially derived, recently produced) sources. The BIX index also has little change; the values are around one, meaning a considerable share of newly produced, fresh biogenic DOM [152]. The changes in BIX correlate well (reciprocally) with the changes in the ratio of humic-like and non-humic compounds (Figure 9a,b): the lower BIX values of fractions of 5–10 μm and 2–5 μm indicate higher humic-like substance amounts.
The T/C index changes to the maximum extent (Figure S4a); medium fractions are the largest, and the values for fractions of 2–0.03 μm show values above one, in the range 0.8–2, which indicates recently appeared organic constituents, probably of fresh (microbial) origin [153]. For the largest and the finest fractions, T/C values are significantly below 0.5, showing the dominance of condensed organic compounds. This indicator is well-correlated with the IR data: the medium fractions show methylene groups in IR spectra at 2925 and 2860 cm−1 (Figure 4a), as well as much higher intensities of bands, corresponding to CH at C–O bands at 2800 cm−1 (Figure 4a) and carboxylic acids (Figure 4b).
HIXEM humification index values also differ significantly (Figure S4b, Supplementary Information) and correlate well with the total intensities of the bands and regions (Figure 9a). HIXEM decreases rather significantly in medium fractions compared to two largest and two finest, from the values of 0.9–1 to 0.7. This is the indication of less condensed constituents in medium fractions [88], which correlates with dominating fulvic components indicated by BIX and FI and the redshifted secondary bands in regions A* and C* (Figure 8). The BIX values for the fractions of 0.8–1.0 (Figure 9b) and HIX of 3–5 (Figure S4b) probably indicate the weak humic character of SOM with strong contribution from autochthonous components [154]. Much higher values of HIXEM (above 10) for the largest and finest fractions, according to [88], result from lower H/C ratios in SOM (more aromatic, less hydrogen-saturated), i.e., from more condensed, terrestrially derived, well-humified DOM leading to the redshifted fluorescence emission.
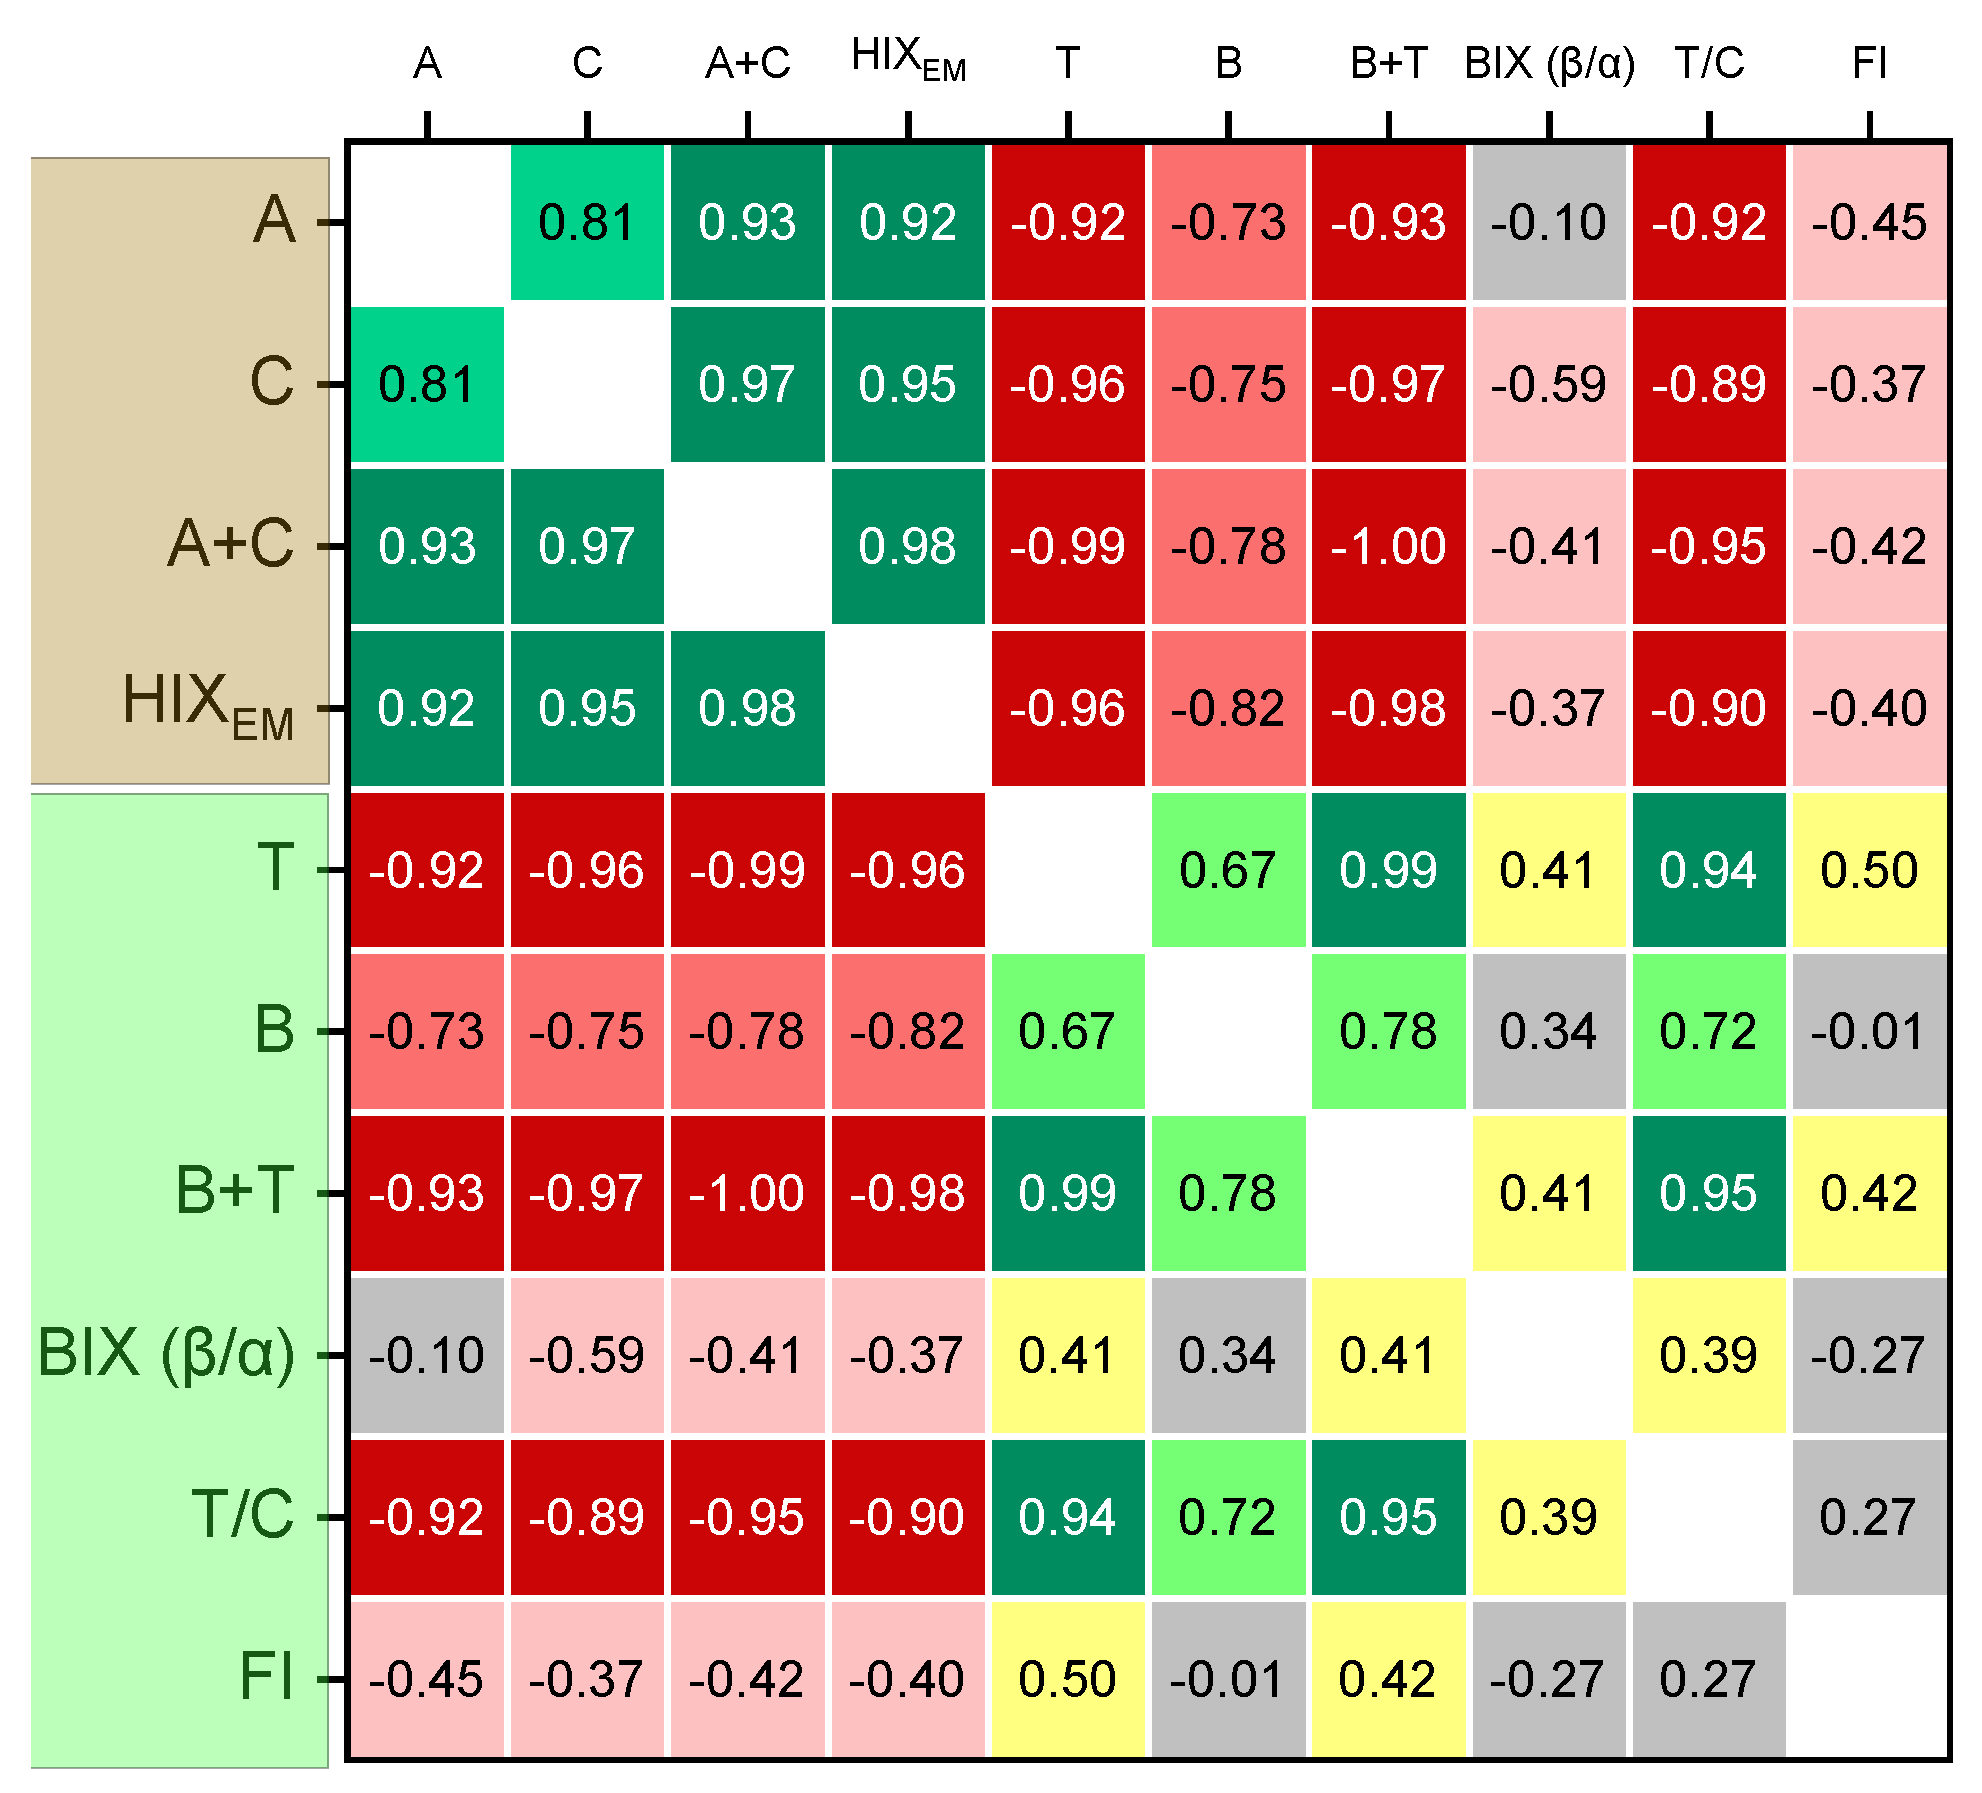
This conclusion supports the conclusion on BIX and F/I indexes. In total, HIXEM is well-correlated with intensities of A and C peaks, and their sum (Figure 10).
Correlations of other indexes—BIX, T/C peak ratio, and FI—are expectedly correlated with intensities of B* and T* bands and their sum (Figure 10). As B peak has the minimum intensity of all the regions, its contribution to total correlations is lower than for peak T.
In total, indexes are well-correlated with intensities of whole areas (Figure 9a; either as the sum of corresponding bands A* + C* or B* + T*) (Table 3 and Table S3, Supplementary Information) or Regions IV and V according to [27].
Among all the fluorescence indexes, the lowest correlation with other indexes is for FI. Also, HIXEM and T/C values are reversely correlated; other indexes are not significantly correlated.
Thus, Figure 10 demonstrates a clear separation of fluorescent markers associated with humified organic matter (A, C) and that of microbial and root plant origin (T, B). It should be noted that the BIX, which is actually an indicator of fresh organic matter, weakly positively correlates with B (tyrosine-like structures), T (tryptophan-like), and A + T structures, and weakly negatively with humified (A, C, and A + C), indicating a generally low biological activity associated with the isolated microbiota fractions. A similar conclusion was made in the previous study of water-soluble SOM of similar soil as a whole [11].
Thus, fluorescence data, including both excitation–emission matrices and the main fluorescence indicators, show a non-contradictory picture of the most condensed non-oxidized DOM in largest particles above 5 μm and below 0.03 μm, and in higher amounts of less condensed and more oxidized SOM in the middle fractions, with the domination of fulvic acids and a much higher contribution of fresh (tryptophan-like) organic matter in these fractions. These data agree well with the data from IR spectra and IR–IR 2D-COS correlations.

3.5. IR–Fluorometry Heterospectral Correlations

A synchronous 2D-COS correlation of the fluorescence spectra of all the fractions at an excitation of 265 nm (Figure S5, Supplementary Information) with characteristic bands of IR spectra was carried out (Figure 11). The excitation wavelength was selected from EEM experiments as it provides the characteristic and most intense three main fluorescence bands A*, B*, and T* (Figure 1); the fluorescence range for 2D-COS was 280–510 nm. The experiments with fluorescence spectra at other excitation wavelengths close to 265 nm provided no extended or different information (only with a drop in intensity of A*, B*, and T* bands). The selection of the excitation wavelength of 340 nm (to make a heterospectral correlation with the region C*) was not expedient due to lower intensities and higher effects from artifacts due to Raleigh scattering contribution.
Synchronous map of correlation of fluorescence spectra with the IR region of 700–650 cm−1 (Figure 11a) shows that quartz silicate correlates with the region of tryptophan-like compounds (320–400 nm) and does not correlate with tyrosine-like (up to 300 nm) and humic-like (400 nm and above). This fully agrees with the heterospectral correlation with silicate bands in the IR region of 900–800 cm−1, while humic-like substances tend to show (though weaker) correlations with aluminosilicate bands (Figure 11b and Table 3).
On the contrary, synchronous correlation maps of fluorescence spectra with the IR region of 1700–1200 cm−1 show that the bands attributed to tyrosine-like and phenylalanine-like compounds (300–320 nm) correlate with C–H and –C=C– IR bands at 1480–1300 cm−1 of aliphatic and aromatic fragments, while fluorescence bands of humic-like compounds at 380–500 nm (attributed to aromatic compounds with a high content of oxygen-containing functional groups [85,86]) correlate well with carboxylate and carboxylic functional groups (1690–1650, 1570–1450, and 1390–1270 cm−1), and no IR band correlates with tryptophan-like ones (Figure 11c), mainly due to nitrogen-containing heterocyclic structures of autochthonous origin [85,86] absent in these IR spectral ranges. Also, this agrees well with the conclusion on fulvic-acid amounts as a difference in the medium versus the large and fine fractions (see the previous section). Adsorbed water IR bands do not correlate with any fluorescence spectral features.
The synchronous 2D-COS correlation of fluorescence spectra with the IR region of 3000–2800 cm−1 (Figure 11d) fully confirms the 2D-COS data for the region of 1700–1200 cm−1: the entire range of 2950–2810 cm−1 correlates with band B* up to 310 nm as it shows aliphatic and aromatic bands of tyrosine-like and phenylalanine-like compounds; there are no correlations of IR bands in this range with tryptophan-like substances (band T*) in the fluorescence spectra. The humate-like fluorescence band A* correlates with the IR range of 2810–2970 cm−1, with main correlation patterns at 2860 and 2930 cm−1 (methylene) and 2900 cm−1 (C–H in peptides and amino acids [155]) and 2970 cm−1, which are probably polyaromatic bands [156]. Thus, heterospectral fluorescence–FTIR 2D-COS not only makes direct correlations between the types of organic matter based on certain functional groups in IR spectra, but it provides a more detailed confirmation of fluorescence EEM regions and indexes. In the case studied, it fully confirms the contribution of low-molecular (fulvic) acids in the medium fractions of DOM and the higher contribution of fresh (microbial-based) organic matter in these fractions.
Thus, the fluorescence data of both the excitation–emission matrices and the main indicator of fluorescence show a consistent picture: the most condensed non-oxidized organic matter is found in the largest particles larger than 5 μm and less than 0.03 μm, and the medium fractions contain more less condensed and more oxidized organic matter, with a predominance of fulvic acids and a much larger proportion of fresh (tryptophan-like) organic matter in these fractions. These data are in good agreement with the data of the IR spectra.
The data obtained indicate the predominant removal of SOM with water flows and the accumulation of detrital poorly processed mass in the form of sediments. Humic-like components associated with finely dispersed clay minerals with a size of 0.8–1 μm can exist in the form of suspensions, with the fraction finer than 0.8 μm containing both the finest particles of dispersed mixed-layer minerals and associated humic substances (as shown below, of a fulvic acid nature); and true solutions of organic and inorganic compounds are mainly subject to active migration in surface waters.

3.6. Correlations of Fluorescence Indexes with ICP-AES

To extend the possibilities of 2D-COS and to connect the multimodal molecular spectroscopy studies, we connected the fluorescence and FTIR data obtained in this study with the elemental composition of these fractions previously found by ICP–AES [14]. In this case, fraction size was also used as a 2D-COS perturbation variable, and the element profile found for each fraction was used as an element spectrum.
2D-COS of FTIR and element analysis showed no reliable information on most trace elements. Thus, only simple correlation analysis was used (band intensity vs. concentrations found by ICP–AES), and showed good correlation of Si contents with all major quartz and silicate bands, which agrees well with the previous data on humic substances [36]. A moderate correlation of Ca and carbonate bands in IR spectra (Figure 4b and Figure 5a) is revealed, and the coefficient of correlation is above 0.7. However, the data obtained in this study show some extra handing of IR spectra, especially of complex samples such as concentrated narrow-size particle fractions to exclude the artifact correlations with some background or noise features; hence, it should be the subject of a separate study.
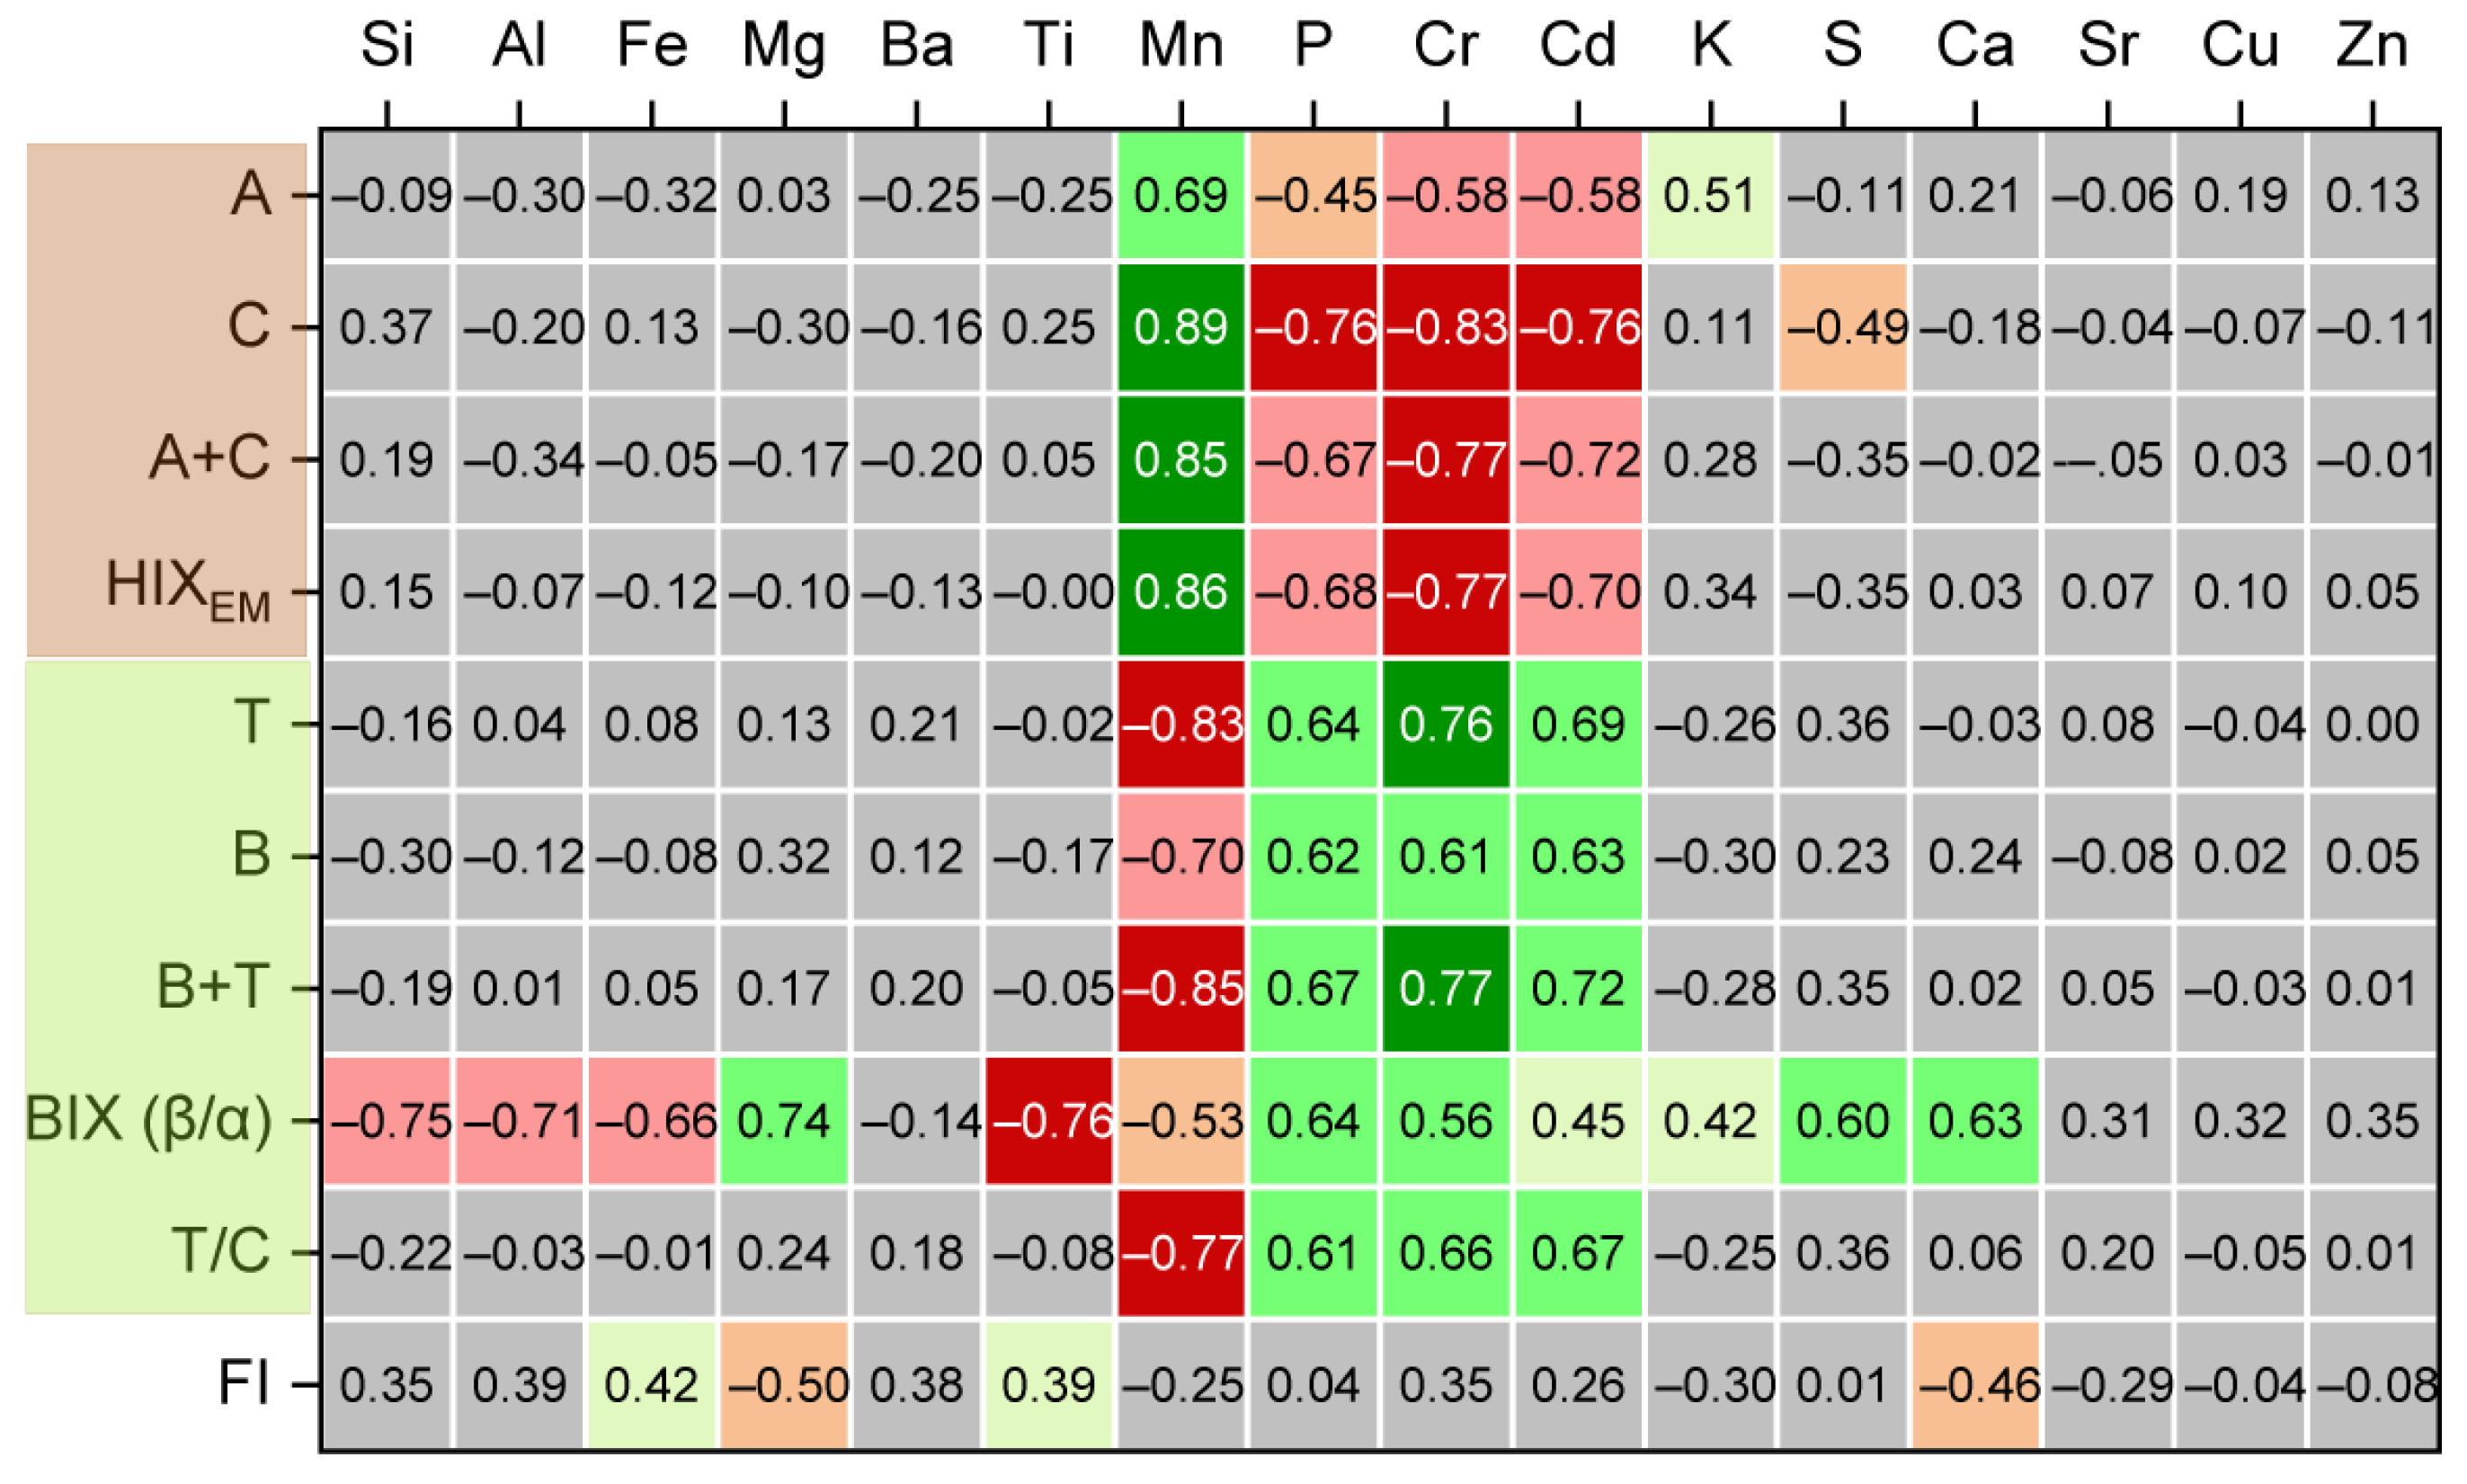
The same is true for the fluorescence spectra or EEM; direct 2DCOS correlations are not possible without extra protocols (or algorithms) on data handling to exclude high false positive 2D-COS correlation bands with background signals. On the contrary, fluorescence indexes and other integrated parameters of EEM or fluorescence spectra are easy to correlate with similar discrete element profiles (Figure 12).
It was found that there are distinct correlations between fluorescent indexes of organic matter composition and gross element fraction composition. It is obvious that the indicators associated with humification state (peaks A and C, as well as the HIXEM humification and Fl indexes) are weakly positively correlated with the elements associated with the mineral silicate component (Si and K). This probably indicates (and confirms) the predominant role of aggregates with sizes of 2–10 μm characterized mainly by silicate, namely silicon–silicate mineralogical composition [149], in humification processes [157].
The only element that has a strong positive correlation with intensities of A* and C* bands as well as with the HIXEM humification index is Mn (Figure 12). Manganese actively forms complex compounds with organic ligands [158] and are usually found in humic substances in relatively large amounts [36]. In same time, in concordance with the data of fluorescence and IR and multimodal 2D-COS, Mn shows strong negative correlations with B* and T* bands related to fresh organic matter and corresponding indexes of T/C peak ratio as well as BIX.
The same is true for biogenic elements. The correlation of humification indicators with P, S, Cr, Mg, Ca, Cu, and Zn is either strong negative or absent, which indicates a significant degree of transformation of the initial organic matter, which agrees with the humate-related bands of carboxylic acids in IR spectra and HIXEM values above five for largest and finest fractions.
Indexes associated with predominantly fresh biogenic (microbial, peak T* and root peak B*) tryptophan- and tyrosine-like constituents, on the contrary, show direct and rather strong correlations with biogenic elements, Mg, P, Cr, Cd, K, S, and Ca (Figure 12). It is worth mentioning that BIX shows a considerably high coefficient of correlation of ca. 0.6 with Ca and S, which agrees with the existing data on BIX correlation with bioavailable nutrient elements as well as microbial activity, which in turn often is associated with increased contents of Ca and S in both soils and aquatic systems [159]. These biogenic indexes show a negative correlation with Si, Al, Fe, and Ti, which is due to the origin of these substances, their low degree of transformation and preservation in the composition of associates.

4. Conclusions

The study showed that the narrow size fractions of water-soluble organic matter in the nanometer range of chernozem are characterized by serious heterogeneity of the material composition. The size-profile distribution of both organic matter and trace elements showed quite distinct patterns associated with significantly different fractions, which can be divided into two parts. The first part consists of the two largest (2–10 μm) and two smallest fractions (0.01–0.03 μm) characterized by lower amounts of carboxylated and saturated humic-like substances, according to fluorescence and IR spectroscopies, which prevail over fresh (biogenic) organic matter. The mineralogical composition of the coarse fractions mainly consists of quartz (primary silicates) and non-silicate ferruginous minerals in the smallest fractions dissolved, or amorphous forms of silicon and aluminum are found, that is essentially the final decomposition stage of the secondary silicates. The other group is formed by the middle fractions (0.05–1 μm), which are characterized by a higher content of fulvic acids and a larger percentage of fresh organic matter apparently associated with clay minerals. More in-depth studies of different soil types are needed to approximate these findings, but this study demonstrates that it is possible to obtain characteristic data on nano- and micrometer-sized soil particles.
The use of multimodal (fluorescence and IR spectroscopy) heterospectral two-dimensional correlation analysis of narrow soil fractions showed an increase in the amount of information from 2D-COS analysis. 2D-COS modality in FTIR increased the reliability of band assignment, especially in the range 1800–1100 cm−1, where bands from inorganic, carboxylic, and hydrocarbon components are significantly overlapped. Heterospectral IR–fluorescence 2D-COS was even more relevant as it provided the cross-confirmation of IR bands in various regions and showed the correlations of various bands in EEM for fresh (biogenic, non-humic) and humic-like components. We also believe that inclusion of atomic-emission spectroscopy into two-dimensional correlation analysis on soil fractions is a very promising technique and the further work should also be focused on full-scale two-dimensional correlation analysis of ICP–AES in size profiles with molecular-spectroscopy techniques.
Taking into account that the study [160] has convincingly shown that the stability and migratory capacity of soil organic matter entering aquatic ecosystems depend on their association with the inorganic matrix, the approach proposed in this study seems to be relevant for a wide range of particle sizes. The proposed approach demonstrates the need to develop strict standardized methods for the fractionation of dissolved organic matter, which can be used to study its composition, properties, migration, and accumulation.

Supplementary Materials

The following supporting information can be downloaded at https://www.mdpi.com/article/10.3390/soilsystems10020031/s1; Table S1: Conditions of ICP–AES measurements; Table S2: Conditions of EEM fluorescence measurements; Table S3: Regions of the excitation (Ex)–emission (Em) matrix corresponding to certain groups of compounds; Table S4: Fluorescence indexes calculated for DOM fractions; Figure S1: Excitation–emission matrices for (a) a filtrate after passing water through 1 μm; (b) a 1 μm membrane flush; and (c) a 0.01 μm membrane flush during blank experiments using polycarbonate analytical track-etched membranes; Figure S2: Relative abundances of humic and non-humic components according to individual fluorescence integrated intensity regions A and C (humic-like compounds) and B and T (non-humic-like compounds); Figure S3: Ratio of the proportions of humic and biochemical compounds to the average particle size of fractions; Figure S4: Distribution of integral indicators, (a) T/C peak ratio and (b) humification index (HIXEM), between narrow fractions; Figure S5: Smoothed fluorescence spectra at 265 nm excitation, normalized for total fluorescence for each spectrum; Figure S6: Asynchronous homospectral ATR FTIR 2D-COS maps of particulate SOM for the ranges (a) 700–650 cm−1; (b) 900–800 cm−1; (c) 1800–1200 cm−1; and (d) 3000–2800 cm−1.

Author Contributions

Conceptualization, M.A.P., D.S.V. and O.B.R.; methodology, D.S.V., S.T.O. and O.B.R.; formal analysis, M.A.P.; investigation, S.T.O. and O.B.R.; resources, D.S.V.; data curation, S.T.O. and M.A.P.; writing—original draft preparation, M.A.P.; writing—review and editing, M.A.P., D.S.V. and O.B.R.; visualization, M.A.P.; supervision, M.A.P.; project administration, M.A.P.; funding acquisition, M.A.P. All authors have read and agreed to the published version of the manuscript.

Funding

This work was supported by the Russian Science Foundation; grant no. 25-13-00088.

Institutional Review Board Statement

Not applicable.

Informed Consent Statement

Not applicable.

Data Availability Statement

The original contributions presented in the study are included in the article/Supplementary Materials; further inquiries can be directed to the corresponding author.

Conflicts of Interest

The authors declare no conflicts of interest.

Abbreviations

The following abbreviations are used in this manuscript:
2D-COStwo-dimensional correlation spectroscopy
ATR attenuated total reflection
DOMdissolved organic matter
EEMexcitation–emission matrix
FTIRFourier-transform infrared (spectroscopy)
HShumic substances
ICP-AESatomic-emission spectroscopy with inductively coupled plasma
SOMsoil organic matter
DOMwater-extractable organic matter

Appendix A. Methodological Features of the Analysis of Size Fractions of Soil Water-Soluble Matter Using ATR IR Spectroscopy

We chose ATR-FTIR spectroscopy to study the obtained size fractions since it is possible to obtain and analyze aqueous samples in the form of a film by heating the diamond crystal of the ATR attachment to a given temperature. In addition, ATR IR provides more opportunities for analyzing spectra in the inorganic soil matrix region containing many bands associated with silicates and clay minerals [46]. Based on the existing literature data, the analysis of aqueous size fractions using this method has not been previously carried out. However, the structural analysis of soil fractions with a particle size of 20 µm to 5 mm obtained by dry sieve fractionation using ATR FTIR was performed, which allows the study of aqueous fractions with smaller size particles.
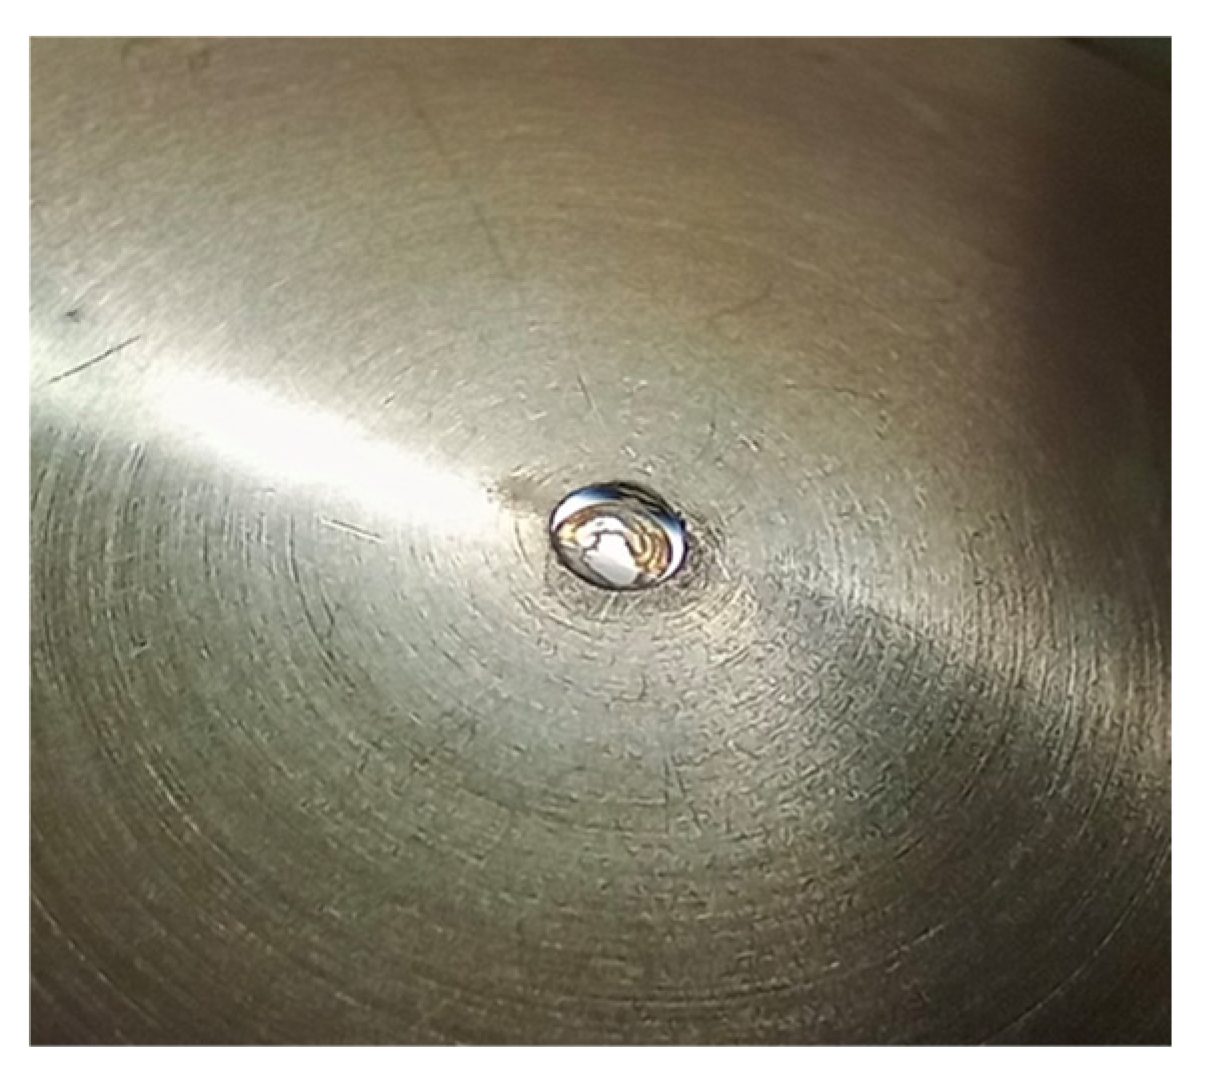
In terms of the shape of the spectrum and the intensity ratio of the bands, the reproducibility of the obtained fraction spectra using ATR FTIR is quite high. However, some bands (638 and 174 cm−1 are assigned to sodium azide) may be absent. This discrepancy between the spectra of the same fraction can be explained by how the sample was deposited on the ATR diamond crystal. The obtained spectrum is influenced both by the volume of the sample and, accordingly, its crystallization on the surface of the diamond crystal of the ATR unit of the IR spectrometer (Figure A1). This issue is especially important for the quantitative comparison of spectra, but this requires separate research and was beyond the scope of this work.
Figure A1. Film of sodium azide (4 μL, 2.5 g/L) on a diamond crystal of an ATR FTIR spectrometer.
Soilsystems 10 00031 g0a1
Thus, this method can in principle be used to obtain the spectra of narrow fractions using the technique of drying a drop on the ATR crystal surface. This technique allows microvolumes of fraction. If necessary, the signal-to-noise ratio can be increased by repeated drying. However, a quantitative comparison of the obtained spectra is significantly complicated by the effect of solution crystallization. Nevertheless, we believe that this can be overcome in the future by choosing the drying conditions (drying rate and salt composition) and by applying a drop onto a crystal.

References

  1. Xenopoulos, M.A.; Barnes, R.T.; Boodoo, K.S.; Butman, D.; Catalán, N.; D’Amario, S.C.; Fasching, C.; Kothawala, D.N.; Pisani, O.; Solomon, C.T.; et al. How humans alter dissolved organic matter composition in freshwater: Relevance for the Earth’s biogeochemistry. Biogeochemistry 2021, 154, 323–348. [Google Scholar] [CrossRef] [Scilit]
  2. Chen, X.; Seo, H.; Han, H.; Seo, J.; Kim, T.; Kim, G. Conservative behavior of terrestrial trace elements associated with humic substances in the coastal ocean. Geochim. Cosmochim. Acta 2021, 308, 373–383. [Google Scholar] [CrossRef] [Scilit]
  3. Yu, W.; Huang, W.; Weintraub-Leff, S.R.; Hall, S.J. Where and why do particulate organic matter (POM) and mineral-associated organic matter (MAOM) differ among diverse soils? Soil Biol. Biochem. 2022, 172, 108756. [Google Scholar] [CrossRef] [Scilit]
  4. Corvasce, M.; Zsolnay, A.; D’Orazio, V.; Lopez, R.; Miano, T.M. Characterization of water extractable organic matter in a deep soil profile. Chemosphere 2006, 62, 1583–1590. [Google Scholar] [CrossRef] [Scilit]
  5. Yudina, A.V.; Fomin, D.S.; Kotelnikova, A.D.; Milanovskii, E.Y. From the Notion of Elementary Soil Particle to the Particle-Size and Microaggregate-Size Distribution Analyses: A Review. Eurasian Soil Sci. 2018, 51, 1326–1347. [Google Scholar] [CrossRef] [Scilit]
  6. Zhang, H.; Zheng, Y.; Wang, X.C.; Wang, Y.; Dzakpasu, M. Characterization and biogeochemical implications of dissolved organic matter in aquatic environments. J. Environ. Manag. 2021, 294, 113041. [Google Scholar] [CrossRef] [Scilit]
  7. Karavanova, E.I. Dissolved organic matter: Fractional composition and sorbability by the soil solid phase (Review of literature). Eurasian Soil Sci. 2013, 46, 833–844. [Google Scholar] [CrossRef] [Scilit]
  8. Ding, Y.; Shi, Z.; Ye, Q.; Liang, Y.; Liu, M.; Dang, Z.; Wang, Y.; Liu, C. Chemodiversity of Soil Dissolved Organic Matter. Environ. Sci. Technol. 2020, 54, 6174–6184. [Google Scholar] [CrossRef] [Scilit]
  9. Bu, R.; Ren, T.; Lei, M.; Liu, B.; Li, X.; Cong, R.; Zhang, Y.; Lu, J. Tillage and straw-returning practices effect on soil dissolved organic matter, aggregate fraction and bacteria community under rice-rice-rapeseed rotation system. Agric. Ecosyst. Environ. 2020, 287, 106681. [Google Scholar] [CrossRef] [Scilit]
  10. Mielnik, L.; Hewelke, E.; Weber, J.; Oktaba, L.; Jonczak, J.; Podlasiński, M. Changes in the soil hydrophobicity and structure of humic substances in sandy soil taken out of cultivation. Agric. Ecosyst. Environ. 2021, 319, 107554. [Google Scholar] [CrossRef] [Scilit]
  11. Kulikova, N.A.; Kholodov, V.A.; Farkhadov, Y.R.; Ziganshina, A.R.; Zavarzina, A.G.; Karpukhin, M.M. Dissolved Organic Matter of Chernozems of Different Use: The Relationship of Structural Features and Mineral Composition. Mosc. Univ. Soil Sci. Bull. 2024, 79, 19–27. [Google Scholar] [CrossRef] [Scilit]
  12. Zhu, Y.; Chen, H.; Jia, Q.; Liu, H.; Ye, J. Interactions of anthropogenic and terrestrial sources drive the varying trends in molecular chemodiversity profiles of DOM in urban storm runoff, compared to land use patterns. Sci. Total Environ. 2022, 817, 152990. [Google Scholar] [CrossRef] [Scilit] [PubMed]
  13. Chen, X.; Zheng, M.; Zhang, G.; Li, F.; Chen, H.; Leng, Y. The nature of dissolved organic matter determines the biosorption capacity of Cu by algae. Chemosphere 2020, 252, 126465. [Google Scholar] [CrossRef] [Scilit]
  14. Volkov, D.S.; Rogova, O.B.; Ovseenko, S.T.; Odelskii, A.; Proskurnin, M.A. Element Composition of Fractionated Water-Extractable Soil Colloidal Particles Separated by Track-Etched Membranes. Agrochemicals 2023, 2, 561–580. [Google Scholar] [CrossRef] [Scilit]
  15. Mashentseva, A.A.; Sutekin, D.S.; Rakisheva, S.R.; Barsbay, M. Composite Track-Etched Membranes: Synthesis and Multifaced Applications. Polymers 2024, 16, 2616. [Google Scholar] [CrossRef] [Scilit] [PubMed]
  16. Kaya, D.; Keçeci, K. Review—Track-Etched Nanoporous Polymer Membranes as Sensors: A Review. J. Electrochem. Soc. 2020, 167, 037543. [Google Scholar] [CrossRef] [Scilit]
  17. Armstrong, J.A.; Bernal, E.E.; Yaroshchuk, A.; Bruening, M.L. Separation of ions using polyelectrolyte-modified nanoporous track-etched membranes. Langmuir 2013, 29, 10287–10296. [Google Scholar] [CrossRef] [Scilit] [PubMed]
  18. de Grooth, J.; Oborný, R.; Potreck, J.; Nijmeijer, K.; de Vos, W.M. The role of ionic strength and odd–even effects on the properties of polyelectrolyte multilayer nanofiltration membranes. J. Membr. Sci. 2015, 475, 311–319. [Google Scholar] [CrossRef] [Scilit]
  19. Huguet, A.; Vacher, L.; Saubusse, S.; Etcheber, H.; Abril, G.; Relexans, S.; Ibalot, F.; Parlanti, E. New insights into the size distribution of fluorescent dissolved organic matter in estuarine waters. Org. Geochem. 2010, 41, 595–610. [Google Scholar] [CrossRef] [Scilit]
  20. Xie, W.; Zhang, S.; Ruan, L.; Yang, M.; Shi, W.; Zhang, H.; Li, W. Evaluating Soil Dissolved Organic Matter Extraction Using Three-Dimensional Excitation-Emission Matrix Fluorescence Spectroscopy. Pedosphere 2017, 27, 968–973. [Google Scholar] [CrossRef] [Scilit]
  21. Ly, Q.V.; Hur, J. Further insight into the roles of the chemical composition of dissolved organic matter (DOM) on ultrafiltration membranes as revealed by multiple advanced DOM characterization tools. Chemosphere 2018, 201, 168–177. [Google Scholar] [CrossRef] [Scilit]
  22. Xiao, K.; Shen, Y.; Sun, J.; Liang, S.; Fan, H.; Tan, J.; Wang, X.; Huang, X.; Waite, T.D. Correlating fluorescence spectral properties with DOM molecular weight and size distribution in wastewater treatment systems. Environ. Sci. Water Res. Technol. 2018, 4, 1933–1943. [Google Scholar] [CrossRef] [Scilit]
  23. Bao, T.; Wang, P.; Hu, B.; Shi, Y. Investigation on the effects of sediment resuspension on the binding of colloidal organic matter to copper using fluorescence techniques. Chemosphere 2019, 236, 124312. [Google Scholar] [CrossRef] [Scilit]
  24. Shi, M.S.; Huang, W.S.; Hsu, L.F.; Yeh, Y.L.; Chen, T.C. Fluorescence of Size-Fractioned Humic Substance Extracted from Sediment and Its Effect on the Sorption of Phenanthrene. Int. J. Environ. Res. Public Health 2019, 16, 5087. [Google Scholar] [CrossRef] [Scilit] [PubMed]
  25. Gabor, R.S.; Baker, A.; McKnight, D.M.; Miller, M.P. Fluorescence Indices and Their Interpretation. In Aquatic Organic Matter Fluorescence; Coble, P.G., Lead, J., Baker, A., Reynolds, D.M., Spencer, R.G.M., Eds.; Cambridge Environmental Chemistry Series; Cambridge University Press: Cambridge, UK, 2014; pp. 303–338. [Google Scholar]
  26. Zsolnay, Á. Dissolved organic matter: Artefacts, definitions, and functions. Geoderma 2003, 113, 187–209. [Google Scholar] [CrossRef] [Scilit]
  27. Chen, W.; Westerhoff, P.; Leenheer, J.A.; Booksh, K. Fluorescence excitation-emission matrix regional integration to quantify spectra for dissolved organic matter. Environ. Sci. Technol. 2003, 37, 5701–5710. [Google Scholar] [CrossRef] [Scilit]
  28. Matilainen, A.; Gjessing, E.T.; Lahtinen, T.; Hed, L.; Bhatnagar, A.; Sillanpaa, M. An overview of the methods used in the characterisation of natural organic matter (NOM) in relation to drinking water treatment. Chemosphere 2011, 83, 1431–1442. [Google Scholar] [CrossRef] [Scilit] [PubMed]
  29. Sillanpää, M.; Matilainen, A.; Lahtinen, T. Characterization of NOM. In Natural Organic Matter in Water; Sillanpää, M., Ed.; Butterworth-Heinemann: Woburn, MA, USA, 2015; pp. 17–53. [Google Scholar]
  30. He, W.; Hur, J. Conservative behavior of fluorescence EEM-PARAFAC components in resin fractionation processes and its applicability for characterizing dissolved organic matter. Water Res. 2015, 83, 217–226. [Google Scholar] [CrossRef] [Scilit]
  31. Du, C.; Linker, R.; Shaviv, A. Characterization of soils using photoacoustic mid-infrared spectroscopy. Appl. Spectrosc. 2007, 61, 1063–1067. [Google Scholar] [CrossRef] [Scilit] [PubMed]
  32. Du, C.; Linker, R.; Shaviv, A. Identification of agricultural Mediterranean soils using mid-infrared photoacoustic spectroscopy. Geoderma 2008, 143, 85–90. [Google Scholar] [CrossRef] [Scilit]
  33. Du, C.; Zhou, J.; Wang, H.; Chen, X.; Zhu, A.; Zhang, J. Determination of soil properties using Fourier transform mid-infrared photoacoustic spectroscopy. Vib. Spectrosc. 2009, 49, 32–37. [Google Scholar] [CrossRef] [Scilit]
  34. Volkov, D.S.; Rogova, O.B.; Proskurnin, M.A. Photoacoustic and photothermal methods in spectroscopy and characterization of soils and soil organic matter. Photoacoustics 2020, 17, 100151. [Google Scholar] [CrossRef] [Scilit]
  35. Volkov, D.; Rogova, O.; Proskurnin, M. Temperature Dependences of IR Spectra of Humic Substances of Brown Coal. Agronomy 2021, 11, 1822. [Google Scholar] [CrossRef] [Scilit]
  36. Karpukhina, E.; Mikheev, I.; Perminova, I.; Volkov, D.; Proskurnin, M. Rapid quantification of humic components in concentrated humate fertilizer solutions by FTIR spectroscopy. J. Soils Sed. 2018, 19, 2729–2739. [Google Scholar] [CrossRef] [Scilit]
  37. Boguta, P.; Sokolowska, Z.; Skic, K. Use of thermal analysis coupled with differential scanning calorimetry, quadrupole mass spectrometry and infrared spectroscopy (TG-DSC-QMS-FTIR) to monitor chemical properties and thermal stability of fulvic and humic acids. PLoS ONE 2017, 12, e0189653. [Google Scholar] [CrossRef] [Scilit]
  38. Morra, M.J.; Marshall, D.B.; Lee, C.M. FT-IR analysis of aldrich humic acid in water using cylindrical internal reflectance. Commun. Soil Sci. Plant Anal. 2008, 20, 851–867. [Google Scholar] [CrossRef] [Scilit]
  39. Tatzber, M.; Stemmer, M.; Spiegel, H.; Katzlberger, C.; Haberhauer, G.; Mentler, A.; Gerzabek, M.H. FTIR-spectroscopic characterization of humic acids and humin fractions obtained by advanced NaOH, Na4P2O7, and Na2CO3 extraction procedures. J. Plant Nutr. Soil Sci. 2007, 170, 522–529. [Google Scholar] [CrossRef] [Scilit]
  40. Tanykova, N.; Petrova, Y.; Kostina, J.; Kozlova, E.; Leushina, E.; Spasennykh, M. Study of Organic Matter of Unconventional Reservoirs by IR Spectroscopy and IR Microscopy. Geosciences 2021, 11, 277. [Google Scholar] [CrossRef] [Scilit]
  41. Dudek, M.; Kabała, C.; Łabaz, B.; Mituła, P.; Bednik, M.; Medyńska-Juraszek, A. Mid-Infrared Spectroscopy Supports Identification of the Origin of Organic Matter in Soils. Land 2021, 10, 215. [Google Scholar] [CrossRef] [Scilit]
  42. Woolverton, P.; Dragila, M.I. Characterization of hydrophobic soils: A novel approach using mid-infrared photoacoustic spectroscopy. Appl. Spectrosc. 2014, 68, 1407–1410. [Google Scholar] [CrossRef] [Scilit] [PubMed]
  43. Yuan, Y.; Cai, X.; Tan, B.; Zhou, S.; Xing, B. Molecular insights into reversible redox sites in solid-phase humic substances as examined by electrochemical in situ FTIR and two-dimensional correlation spectroscopy. Chem. Geol. 2018, 494, 136–143. [Google Scholar] [CrossRef] [Scilit]
  44. Slaný, M.; Jankovič, Ľ.; Madejová, J. Structural characterization of organo-montmorillonites prepared from a series of primary alkylamines salts: Mid-IR and near-IR study. Appl. Clay Sci. 2019, 176, 11–20. [Google Scholar] [CrossRef] [Scilit]
  45. Madejová, J.; Sekeráková, Ľ.; Bizovská, V.; Slaný, M.; Jankovič, Ľ. Near-infrared spectroscopy as an effective tool for monitoring the conformation of alkylammonium surfactants in montmorillonite interlayers. Vib. Spectrosc. 2016, 84, 44–52. [Google Scholar] [CrossRef] [Scilit]
  46. Volkov, D.; Rogova, O.; Proskurnin, M. Organic Matter and Mineral Composition of Silicate Soils: FTIR Comparison Study by Photoacoustic, Diffuse Reflectance, and Attenuated Total Reflection Modalities. Agronomy 2021, 11, 1879. [Google Scholar] [CrossRef] [Scilit]
  47. Machado, W.; Franchini, J.C.; de Fatima Guimaraes, M.; Filho, J.T. Spectroscopic characterization of humic and fulvic acids in soil aggregates, Brazil. Heliyon 2020, 6, e04078. [Google Scholar] [CrossRef] [Scilit]
  48. Proskurnin, M.A.; Volkov, D.S.; Rogova, O.B. Two-Dimensional Correlation IR Spectroscopy of Humic Substances of Chernozem Size Fractions of Different Land Use. Agronomy 2023, 13, 1696. [Google Scholar] [CrossRef] [Scilit]
  49. Krivoshein, P.K.; Volkov, D.S.; Rogova, O.B.; Proskurnin, M.A. FTIR Photoacoustic and ATR Spectroscopies of Soils with Aggregate Size Fractionation by Dry Sieving. ACS Omega 2022, 7, 2177–2197. [Google Scholar] [CrossRef] [Scilit]
  50. Krasner, S.W.; Croué, J.P.; Buffle, J.; Perdue, E.M. Three approaches for characterizing NOM. J. AWWA 1996, 88, 66–79. [Google Scholar] [CrossRef] [Scilit]
  51. Abbt-Braun, G.; Frimmel, F.H. Basic characterization of Norwegian NOM samples? Similarities and differences. Environ. Int. 1999, 25, 161–180. [Google Scholar] [CrossRef] [Scilit]
  52. Volkov, D.S.; Proskurnin, M.A.; Korobov, M.V. Elemental analysis of nanodiamonds by inductively-coupled plasma atomic emission spectroscopy. Carbon 2014, 74, 1–13. [Google Scholar] [CrossRef] [Scilit]
  53. Karpukhina, E.A.; Vlasova, E.A.; Volkov, D.S.; Proskurnin, M.A. Comparative Study of Sample-Preparation Techniques for Quantitative Analysis of the Mineral Composition of Humic Substances by Inductively Coupled Plasma Atomic Emission Spectroscopy. Agronomy 2021, 11, 2453. [Google Scholar] [CrossRef] [Scilit]
  54. Lu, B.; Wang, X.; Hu, C.; Xing, J.; Zhu, S.; Li, X. On-site rapid quantitative assessment of wet soil nutrients based on laser-induced breakdown spectroscopy fingerprint spectral lines corrected by near-infrared spectroscopy. Comput. Electron. Agric. 2025, 237, 110741. [Google Scholar] [CrossRef] [Scilit]
  55. Lu, B.; Wang, X.; Hu, C.; Zhu, S.; Li, X. Comparing atomic spectroscopy, molecular spectroscopy and multi-source spectroscopy synergetic fusion for quantitation of total potassium in culture substrates. J. Anal. At. Spectrom. 2025, 40, 1536–1551. [Google Scholar] [CrossRef] [Scilit]
  56. Newland, T.G.; Pitts, K.; Lewis, S.W. Multimodal spectroscopy with chemometrics for the forensic analysis of Western Australian sandy soils. Forensic Chem. 2022, 28, 100412. [Google Scholar] [CrossRef] [Scilit]
  57. Hayes, E.; Greene, D.; O’Donnell, C.; O’Shea, N.; Fenelon, M.A. Spectroscopic technologies and data fusion: Applications for the dairy industry. Front. Nutr. 2022, 9, 1074688. [Google Scholar] [CrossRef] [Scilit] [PubMed]
  58. Noda, I. Generalized Two-Dimensional Correlation Method Applicable to Infrared, Raman, and other Types of Spectroscopy. Appl. Spectrosc. 1993, 47, 1329–1336. [Google Scholar] [CrossRef] [Scilit]
  59. Czarnecki, M.A. Interpretation of Two-Dimensional Correlation Spectra: Science or Art? Appl. Spectrosc. 1998, 52, 1583–1590. [Google Scholar] [CrossRef] [Scilit]
  60. Müller, M.; Buchet, R.; Fringeli, U.P. 2D-FTIR ATR Spectroscopy of Thermo-Induced Periodic Secondary Structural Changes of Poly-(L)-lysine: A Cross-Correlation Analysis of Phase-Resolved Temperature Modulation Spectra. J. Phys. Chem. 1996, 100, 10810–10825. [Google Scholar] [CrossRef] [Scilit]
  61. Noda, I.; Liu, Y.; Ozaki, Y. Two-Dimensional Correlation Spectroscopy Study of Temperature-Dependent Spectral Variations of N -Methylacetamide in the Pure Liquid State. 1. Two-Dimensional Infrared Analysis. J. Phys. Chem. 1996, 100, 8674–8680. [Google Scholar] [CrossRef] [Scilit]
  62. Shin, H.; Jung, Y.M.; Lee, J.; Chang, T.; Ozaki, Y.; Bin Kim, S. Structural Comparison of Langmuir−Blodgett and Spin-Coated Films of Poly(tert-butyl methacrylate) by External Reflection FTIR Spectroscopy and Two-Dimensional Correlation Analysis. Langmuir 2002, 18, 5523–5528. [Google Scholar] [CrossRef] [Scilit]
  63. Zhang, J.; Tsuji, H.; Noda, I.; Ozaki, Y. Weak Intermolecular Interactions during the Melt Crystallization of Poly(l-lactide) Investigated by Two-Dimensional Infrared Correlation Spectroscopy. J. Phys. Chem. B 2004, 108, 11514–11520. [Google Scholar] [CrossRef] [Scilit]
  64. Yang, I.-S.; Jung, Y.M.; Bin Kim, S.; Klein, V.M. Two-Dimensional Correlation Analysis of Superconducting YNi2B2C Raman Spectra. Int. J. Mod. Phys. B 2005, 19, 281–284. [Google Scholar] [CrossRef] [Scilit]
  65. Jeong Kim, H.; Bin Kim, S.; Kim, J.; Jung, Y.M.; Yeol Ryu, D.; Lavery, K.A.; Russell, T.P. Phase Behavior of a Weakly Interacting Block Copolymer by Temperature-Dependent FTIR Spectroscopy. Macromolecules 2006, 39, 408–412. [Google Scholar] [CrossRef] [Scilit]
  66. Liu, Y.; Chen, Y.R.; Ozaki, Y. Two-dimensional visible/near-infrared correlation spectroscopy study of thermal treatment of chicken meats. J. Agric. Food Chem. 2000, 48, 901–908. [Google Scholar] [CrossRef] [Scilit]
  67. Nakano, T.; Shimada, S.; Saitoh, R.; Noda, I. Transient 2D IR Correlation Spectroscopy of the Photopolymerization of Acrylic and Epoxy Monomers. Appl. Spectrosc. 1993, 47, 1337–1342. [Google Scholar] [CrossRef] [Scilit]
  68. Wang, Y.; Murayama, K.; Myojo, Y.; Tsenkova, R.; Hayashi, N.; Ozaki, Y. Two-Dimensional Fourier Transform Near-Infrared Spectroscopy Study of Heat Denaturation of Ovalbumin in Aqueous Solutions. J. Phys. Chem. B 1998, 102, 6655–6662. [Google Scholar] [CrossRef] [Scilit]
  69. Ghosh, A.; Enderlein, J. Advanced fluorescence correlation spectroscopy for studying biomolecular conformation. Curr. Opin. Struct. Biol. 2021, 70, 123–131. [Google Scholar] [CrossRef] [Scilit]
  70. Liu, D.; Hao, Y.; Gao, H.; Yu, H.; Li, Q. Applying synchronous fluorescence spectra with Gaussian band fitting and two-dimensional correlation to characterize structural composition of DOM from soils in an aquatic-terrestrial ecotone. Sci. Total Environ. 2023, 859, 160081. [Google Scholar] [CrossRef] [Scilit]
  71. Xia, M.-M.; Dong, G.-M.; Yang, R.-J.; Li, X.-C.; Chen, Q. Study on fluorescence interaction between humic acid and PAHs based on two-dimensional correlation spectroscopy. J. Mol. Struct. 2020, 1217, 128428. [Google Scholar] [CrossRef] [Scilit]
  72. Noda, I.; Dowrey, A.E.; Marcott, C. Recent Developments in Two-Dimensional Infrared (2D IR) Correlation Spectroscopy. Appl. Spectrosc. 1993, 47, 1317–1323. [Google Scholar] [CrossRef] [Scilit]
  73. Noda, I.; Dowrey, A.E.; Marcott, C.; Story, G.M.; Ozaki, Y. Generalized Two-Dimensional Correlation Spectroscopy. Appl. Spectrosc. 2000, 54, 236A–248A. [Google Scholar] [CrossRef] [Scilit]
  74. Noda, I.; Ozaki, Y. Two-Dimensional Correlation Spectroscopy—Applications in Vibrational and Optical Spectroscopy; Wiley: Hoboken, NJ, USA, 2004. [Google Scholar]
  75. Noda, I. Advances in two-dimensional correlation spectroscopy. Vib. Spectrosc. 2004, 36, 143–165. [Google Scholar] [CrossRef] [Scilit]
  76. Buchet, R.; Wu, Y.; Lachenal, G.; Raimbault, C.; Ozaki, Y. Selecting Two-Dimensional Cross-Correlation Functions to Enhance Interpretation of Near-Infrared Spectra of Proteins. Appl. Spectrosc. 2001, 55, 155–162. [Google Scholar] [CrossRef] [Scilit]
  77. Noda, I. Progress in two-dimensional (2D) correlation spectroscopy. J. Mol. Struct. 2006, 799, 2–15. [Google Scholar] [CrossRef] [Scilit]
  78. Yu, H.; Qu, F.; Zhang, X.; Shao, S.; Rong, H.; Liang, H.; Bai, L.; Ma, J. Development of correlation spectroscopy (COS) method for analyzing fluorescence excitation emission matrix (EEM): A case study of effluent organic matter (EfOM) ozonation. Chemosphere 2019, 228, 35–43. [Google Scholar] [CrossRef] [Scilit]
  79. Wang, S.; Cheng, X.; Zheng, D.; Song, H.; Han, P.; Yuen, P. Prediction of the Soil Organic Matter (SOM) Content from Moist Soil Using Synchronous Two-Dimensional Correlation Spectroscopy (2D-COS) Analysis. Sensors 2020, 20, 4822. [Google Scholar] [CrossRef] [Scilit]
  80. Chen, W.; Habibul, N.; Liu, X.Y.; Sheng, G.P.; Yu, H.Q. FTIR and synchronous fluorescence heterospectral two-dimensional correlation analyses on the binding characteristics of copper onto dissolved organic matter. Environ. Sci. Technol. 2015, 49, 2052–2058. [Google Scholar] [CrossRef] [Scilit]
  81. Yu, G.H.; Tang, Z.; Xu, Y.C.; Shen, Q.R. Multiple fluorescence labeling and two dimensional FTIR-13C NMR heterospectral correlation spectroscopy to characterize extracellular polymeric substances in biofilms produced during composting. Environ. Sci. Technol. 2011, 45, 9224–9231. [Google Scholar] [CrossRef] [Scilit] [PubMed]
  82. Volkov, D.S.; Rogova, O.B.; Proskurnin, M.A.; Farkhodov, Y.R.; Markeeva, L.B. Thermal stability of organic matter of typical chernozems under different land uses. Soil Tillage Res. 2020, 197, 104500. [Google Scholar] [CrossRef] [Scilit]
  83. Kalbitz, K.; Angers, D.; Kaiser, K.; Chantigny, M. Extraction and Characterization of Dissolved Organic Matter. In Soil Sampling and Methods of Analysis, 2nd ed.; Carter, M.R., Gregorich, E.G., Eds.; CRC Press: Boca Raton, FL, USA, 2007. [Google Scholar]
  84. Chantigny, M.H.; Harrison-Kirk, T.; Curtin, D.; Beare, M. Temperature and duration of extraction affect the biochemical composition of soil water-extractable organic matter. Soil Biol. Biochem. 2014, 75, 161–166. [Google Scholar] [CrossRef] [Scilit]
  85. Parlanti, E.; Wörz, K.; Geoffroy, L.; Lamotte, M. Dissolved organic matter fluorescence spectroscopy as a tool to estimate biological activity in a coastal zone submitted to anthropogenic inputs. Org. Geochem. 2000, 31, 1765–1781. [Google Scholar] [CrossRef] [Scilit]
  86. Coble, P.G. Characterization of marine and terrestrial DOM in seawater using excitation-emission matrix spectroscopy. Mar. Chem. 1996, 51, 325–346. [Google Scholar] [CrossRef] [Scilit]
  87. Zsolnay, A.; Baigar, E.; Jimenez, M.; Steinweg, B.; Saccomandi, F. Differentiating with fluorescence spectroscopy the sources of dissolved organic matter in soils subjected to drying. Chemosphere 1999, 38, 45–50. [Google Scholar] [CrossRef] [Scilit]
  88. Ohno, T. Fluorescence inner-filtering correction for determining the humification index of dissolved organic matter. Environ. Sci. Technol. 2002, 36, 742–746. [Google Scholar] [CrossRef] [Scilit]
  89. Huguet, A.; Vacher, L.; Relexans, S.; Saubusse, S.; Froidefond, J.M.; Parlanti, E. Properties of fluorescent dissolved organic matter in the Gironde Estuary. Org. Geochem. 2009, 40, 706–719. [Google Scholar] [CrossRef] [Scilit]
  90. Wilson, H.F.; Xenopoulos, M.A. Effects of agricultural land use on the composition of fluvial dissolved organic matter. Nat. Geosci. 2008, 2, 37–41. [Google Scholar] [CrossRef] [Scilit]
  91. McKnight, D.M.; Boyer, E.W.; Westerhoff, P.K.; Doran, P.T.; Kulbe, T.; Andersen, D.T. Spectrofluorometric characterization of dissolved organic matter for indication of precursor organic material and aromaticity. Limnol. Oceanogr. 2001, 46, 38–48. [Google Scholar] [CrossRef] [Scilit]
  92. Cory, R.M.; McKnight, D.M. Fluorescence spectroscopy reveals ubiquitous presence of oxidized and reduced quinones in dissolved organic matter. Environ. Sci. Technol. 2005, 39, 8142–8149. [Google Scholar] [CrossRef] [Scilit]
  93. Baker, A. Fluorescence excitation-emission matrix characterization of some sewage-impacted rivers. Environ. Sci. Technol. 2001, 35, 948–953. [Google Scholar] [CrossRef] [Scilit] [PubMed]
  94. Miller, M.P.; McKnight, D.M.; Cory, R.M.; Williams, M.W.; Runkel, R.L. Hyporheic exchange and fulvic acid redox reactions in an Alpine stream/wetland ecosystem, Colorado Front Range. Environ. Sci. Technol. 2006, 40, 5943–5949. [Google Scholar] [CrossRef] [Scilit]
  95. OriginLab. 2D Correlation Spectroscopy Analysis. Available online: https://www.originlab.com/fileExchange/details.aspx?fid=497 (accessed on 25 January 2026).
  96. Proskurnin, M.A.; Volkov, D.S.; Rogova, O.B. Temperature Dependences of IR Spectral Bands of Humic Substances of Silicate-Based Soils. Agronomy 2023, 13, 1740. [Google Scholar] [CrossRef] [Scilit]
  97. Krivoshein, P.K.; Volkov, D.S.; Rogova, O.B.; Proskurnin, M.A. FTIR photoacoustic spectroscopy for identification and assessment of soil components: Chernozems and their size fractions. Photoacoustics 2020, 18, 100162. [Google Scholar] [CrossRef] [Scilit] [PubMed]
  98. Saleem, S.; Ashiq, M.N.; Manzoor, S.; Ali, U.; Liaqat, R.; Algahtani, A.; Mujtaba, S.; Tirth, V.; Alsuhaibani, A.M.; Refat, M.S.; et al. Analysis and characterization of opto-electronic properties of iron oxide (Fe2O3) with transition metals (Co, Ni) for the use in the photodetector application. J. Mater. Res. Technol. 2023, 25, 6150–6166. [Google Scholar] [CrossRef] [Scilit]
  99. Peltre, C.; Bruun, S.; Du, C.; Thomsen, I.K.; Jensen, L.S. Assessing soil constituents and labile soil organic carbon by mid-infrared photoacoustic spectroscopy. Soil Biol. Biochem. 2014, 77, 41–50. [Google Scholar] [CrossRef] [Scilit]
  100. Bryant, J.I. Vibrational Spectrum of Sodium Azide Single Crystals. J. Chem. Phys. 1964, 40, 3195–3203. [Google Scholar] [CrossRef] [Scilit]
  101. Attenuated Total Reflectance Infrared (ATR-IR) Spectrum of Sodium Azide. Available online: https://spectrabase.com/spectrum/9i9JWsCo4j4 (accessed on 25 January 2026).
  102. Koike, C.; Noguchi, R.; Chihara, H.; Suto, H.; Ohtaka, O.; Imai, Y.; Matsumoto, T.; Tsuchiyama, A. Infrared Spectra of Silica Polymorphs and the Conditions of Their Formation. Astrophys. J. 2013, 778, 60. [Google Scholar] [CrossRef] [Scilit]
  103. Yu, H.-G.; Nyman, G. The Infrared and Uv-Visible Spectra of Polycyclic Aromatic Hydrocarbons Containing (5, 7)-Member Ring Defects: A Theoretical Study. Astrophys. J. 2012, 751, 3. [Google Scholar] [CrossRef] [Scilit]
  104. Changwen, D.; Jianmin, Z.; Goyne, K.W. Organic and inorganic carbon in paddy soil as evaluated by mid-infrared photoacoustic spectroscopy. PLoS ONE 2012, 7, e43368. [Google Scholar] [CrossRef] [Scilit]
  105. Lucas, S.; Tognonvi, M.T.; Gelet, J.L.; Soro, J.; Rossignol, S. Interactions between silica sand and sodium silicate solution during consolidation process. J. Non-Cryst. Solids 2011, 357, 1310–1318. [Google Scholar] [CrossRef] [Scilit]
  106. Changwen, D.; Jing, D.; Jianmin, Z.; Huoyan, W.; Xiaoqin, C. Characterization of Greenhouse Soil Properties Using Mid-infrared Photoacoustic Spectroscopy. Spectrosc. Lett. 2011, 44, 359–368. [Google Scholar] [CrossRef] [Scilit]
  107. Calderón, F.J.; Reeves, J.B.; Collins, H.P.; Paul, E.A. Chemical Differences in Soil Organic Matter Fractions Determined by Diffuse-Reflectance Mid-Infrared Spectroscopy. Soil Sci. Soc. Am. J. 2011, 75, 568–579. [Google Scholar] [CrossRef] [Scilit]
  108. Calderón, F.J.; Mikha, M.M.; Vigil, M.F.; Nielsen, D.C.; Benjamin, J.G.; Reeves, J.B. Diffuse-Reflectance Mid-infrared Spectral Properties of Soils under Alternative Crop Rotations in a Semi-arid Climate. Commun. Soil Sci. Plant Anal. 2011, 42, 2143–2159. [Google Scholar] [CrossRef] [Scilit]
  109. Hofmeister, A.M.; Bowey, J.E. Quantitative Infrared Spectra of Hydrosilicates and Related Minerals. Mon. Not. R. Astron. Soc. 2006, 367, 577–591. [Google Scholar] [CrossRef] [Scilit]
  110. Tan, C.Z. Optical interference in overtones and combination bands in α-quartz. J. Phys. Chem. Solids 2003, 64, 121–125. [Google Scholar] [CrossRef] [Scilit]
  111. Madejová, J.; Komadel, P. Baseline Studies of the Clay Minerals Society Source Clays: Infrared Methods. Clays Clay Miner. 2024, 49, 410–432. [Google Scholar] [CrossRef] [Scilit]
  112. Russell, J.D.; Fraser, A.R. Infrared methods. In Clay Mineralogy: Spectroscopic and Chemical Determinative Methods; Wilson, M.J., Ed.; Springer: Dordrecht, The Netherlands, 1994; pp. 11–67. [Google Scholar]
  113. Kronenberg, A.K. Hydrogen Speciation and Chemical Weakening of Quartz. In Silica; De Gruyter: Berlin, Germany, 1994; Chapter 4; pp. 123–176. [Google Scholar]
  114. Nguyen, T.T.; Janik, L.J.; Raupach, M. Diffuse reflectance infrared fourier transform (DRIFT) spectroscopy in soil studies. Aust. J. Soil Res. 1991, 29, 49–67. [Google Scholar] [CrossRef] [Scilit]
  115. Lin-Vien, D.; Colthup, N.B.; Fateley, W.G.; Grasselli, J.G. The Handbook of Infrared and Raman Characteristic Frequencies of Organic Molecules; Elsevier Science: Amsterdam, The Netherlands, 1991. [Google Scholar]
  116. Colthup, N.B.; Daly, L.H.; Wiberley, S.E. Introduction to Infrared and Raman Spectroscopy; Elsevier Science: Amsterdam, The Netherlands, 1990. [Google Scholar]
  117. Asselin, M.; Sandorfy, C. Anharmonicity and Hydrogen Bonding. The in-plane OH Bending and its Combination with the OH Stretching Vibration. Can. J. Chem. 1971, 49, 1539–1544. [Google Scholar] [CrossRef] [Scilit]
  118. Bock, J.A.N.; Su, G.J. Interpretation of the Infrared Spectra of Fused Silica. J. Am. Ceram. Soc. 1970, 53, 69–73. [Google Scholar] [CrossRef] [Scilit]
  119. Spitzer, W.G.; Kleinman, D.A. Infrared Lattice Bands of Quartz. Phys. Rev. 1961, 121, 1324–1335. [Google Scholar] [CrossRef] [Scilit]
  120. So, R.T.; Blair, N.E.; Masterson, A.L. Carbonate mineral identification and quantification in sediment matrices using diffuse reflectance infrared Fourier transform spectroscopy. Environ. Chem. Lett. 2020, 18, 1725–1730. [Google Scholar] [CrossRef] [Scilit]
  121. Schütz, M.K.; Lopes, N.F.; Cenci, A.; Ketzer, J.M.M.; Einloft, S.; Dullius, J.; Ligabue, R. Influence of Alkaline Additives and Buffers on Mineral Trapping of CO2 under Mild Conditions. Chem. Eng. Technol. 2018, 41, 573–579. [Google Scholar] [CrossRef] [Scilit]
  122. Max, J.J.; Chapados, C. Isotope effects in liquid water by infrared spectroscopy. III. H2O and D2O spectra from 6000 to 0 cm(-1). J. Chem. Phys. 2009, 131, 184505. [Google Scholar] [CrossRef] [Scilit] [PubMed]
  123. Invernizzi, C.; Rovetta, T.; Licchelli, M.; Malagodi, M. Mid and Near-Infrared Reflection Spectral Database of Natural Organic Materials in the Cultural Heritage Field. Int. J. Anal. Chem. 2018, 2018, 7823248. [Google Scholar] [CrossRef] [Scilit]
  124. Gunasekaran, S.; Anbalagan, G.; Pandi, S. Raman and infrared spectra of carbonates of calcite structure. J. Raman Spectrosc. 2006, 37, 892–899. [Google Scholar] [CrossRef] [Scilit]
  125. Myszka, B.; Schussler, M.; Hurle, K.; Demmert, B.; Detsch, R.; Boccaccini, A.R.; Wolf, S.E. Phase-specific bioactivity and altered Ostwald ripening pathways of calcium carbonate polymorphs in simulated body fluid. RSC Adv. 2019, 9, 18232–18244. [Google Scholar] [CrossRef] [Scilit]
  126. Rogovska, N.; Laird, D.A.; Chiou, C.-P.; Bond, L.J. Development of field mobile soil nitrate sensor technology to facilitate precision fertilizer management. Precis. Agric. 2018, 20, 40–55. [Google Scholar] [CrossRef] [Scilit]
  127. Coates, J. Interpretation of Infrared Spectra, A Practical Approach. In Encyclopedia of Analytical Chemistry; Meyers, R.A., McKelvy, M.L., Eds.; Wiley: Hoboken, NJ, USA, 2000. [Google Scholar]
  128. Traore, M.; Kaal, J.; Martinez Cortizas, A. Differentiation between pine woods according to species and growing location using FTIR-ATR. Wood Sci. Technol. 2018, 52, 487–504. [Google Scholar] [CrossRef] [Scilit]
  129. Bishop, J.L.; Lane, M.D.; Dyar, M.D.; King, S.J.; Brown, A.J.; Swayze, G.A. Spectral properties of Ca-sulfates: Gypsum, bassanite, and anhydrite. Am. Mineral. 2014, 99, 2105–2115. [Google Scholar] [CrossRef] [Scilit]
  130. Kunimatsu, K.; Samant, M.G.; Seki, H. In-situ FT-IR spectroscopic study of bisulfate and sulfate adsorption on platinum electrodes. J. Electroanal. Chem. Interfacial Electrochem. 1989, 258, 163–177. [Google Scholar] [CrossRef] [Scilit]
  131. Ellerbrock, R.; Stein, M.; Schaller, J. Comparing amorphous silica, short-range-ordered silicates and silicic acid species by FTIR. Sci. Rep. 2022, 12, 11708. [Google Scholar] [CrossRef] [Scilit] [PubMed]
  132. Ellerbrock, R.H.; Stein, M.; Schaller, J. Comparing silicon mineral species of different crystallinity using Fourier transform infrared spectroscopy. Front. Environ. Chem. 2024, 5, 1462678. [Google Scholar] [CrossRef] [Scilit]
  133. Launer, P.J.; Arkles, B. Infrared Analysis of Organosilicon Compounds. In Silicon Compounds: Silanes & Silicones, 3rd ed.; Gelest Inc.: Morrisville, PA, USA, 2013. [Google Scholar]
  134. Hofmeister, A.M.; Keppel, E.; Speck, A.K. Absorption and reflection infrared spectra of MgO and other diatomic compounds. Mon. Not. R. Astron. Soc. 2003, 345, 16–38. [Google Scholar] [CrossRef] [Scilit]
  135. Taylor, W.R. Application of infrared spectroscopy to studies of silicate glass structure: Examples from the melilite glasses and the systems Na2O-SiO2 and Na2O-Al2O3-SiO2. J. Earth Syst. Sci. 1990, 99, 99–117. [Google Scholar] [CrossRef] [Scilit]
  136. Brusentsova, T.N.; Peale, R.E.; Maukonen, D.; Harlow, G.E.; Boesenberg, J.S.; Ebel, D. Far infrared spectroscopy of carbonate minerals. Am. Mineral. 2010, 95, 1515–1522. [Google Scholar] [CrossRef] [Scilit]
  137. Rodionov, A.N. Vibration Spectra and Structures of the Simplest Aromatic Derivatives of Group I–VI Elements. Russ. Chem. Rev. 1973, 42, 998–1010. [Google Scholar] [CrossRef] [Scilit]
  138. Parolo, M.E.; Savini, M.C.; Loewy, R.M. Characterization of soil organic matter by FT-IR spectroscopy and its relationship with chlorpyrifos sorption. J. Environ. Manag. 2017, 196, 316–322. [Google Scholar] [CrossRef] [Scilit] [PubMed]
  139. Chang, Z.; Yue, Y.; Qu, Y.; Li, S.; Wu, F.; Liu, H. Properties of Aluminosilicate Glasses Prepared by Red Mud with Various [Al2O3]/[CaO] Mass Ratios. J. Wuhan Univ. Technol.-Mater. Sci. Ed. 2018, 33, 363–367. [Google Scholar] [CrossRef] [Scilit]
  140. Rana, D.; Upterworth, A.L.; Winghart, M.O.; Sebastiani, D.; Nibbering, E.T.J. Azide Anion Interactions with Imidazole and 1-Methylimidazole in Dimethyl Sulfoxide. J. Phys. Chem. B 2025, 129, 8192–8200. [Google Scholar] [CrossRef] [Scilit]
  141. Richter, T.A.; Malhotra, M.L.; Möller, K.D. Far infrared absorption of lattice modes of solid sodium azide. Mater. Res. Bull. 1970, 5, 203–206. [Google Scholar] [CrossRef] [Scilit]
  142. Malyshev, V.V.; Alekseev, A.O. Iron Compounds in Steppe Soils of the East-European Plain: Association with Soil Processes, Paleoclimatic Aspects. Eurasian Soil Sci. 2024, 57, 1461–1473. [Google Scholar] [CrossRef] [Scilit]
  143. Schweizer, S.A.; Mueller, C.W.; Höschen, C.; Ivanov, P.; Kögel-Knabner, I. The role of clay content and mineral surface area for soil organic carbon storage in an arable toposequence. Biogeochemistry 2021, 156, 401–420. [Google Scholar] [CrossRef] [Scilit]
  144. Alekseev, A.O.; Malyshev, V.V.; Alekseeva, T.V. Mineralogy and Geochemistry of Granulometric Fractions As a Tool for Studying Transformations of Solid Phase of Soils. Mosc. Univ. Soil Sci. Bull. 2025, 80, 50–58. [Google Scholar] [CrossRef] [Scilit]
  145. Artz, R.R.E.; Chapman, S.J.; Jean Robertson, A.H.; Potts, J.M.; Laggoun-Défarge, F.; Gogo, S.; Comont, L.; Disnar, J.-R.; Francez, A.-J. FTIR spectroscopy can be used as a screening tool for organic matter quality in regenerating cutover peatlands. Soil Biol. Biochem. 2008, 40, 515–527. [Google Scholar] [CrossRef] [Scilit]
  146. Papish, I.Y.; Chizhikova, N.P.; Poznyak, S.P.; Varlamov, E.B. Clay mineralogy in agrochernozems of western Ukraine. Eurasian Soil Sci. 2016, 49, 1161–1173. [Google Scholar] [CrossRef] [Scilit]
  147. Latham, K.G.; Matsakas, L.; Figueira, J.; Rova, U.; Christakopoulos, P.; Jansson, S. Examination of how variations in lignin properties from Kraft and organosolv extraction influence the physicochemical characteristics of hydrothermal carbon. J. Anal. Appl. Pyrolysis 2021, 155, 105095. [Google Scholar] [CrossRef] [Scilit]
  148. Javier-Astete, R.; Jimenez-Davalos, J.; Zolla, G. Determination of hemicellulose, cellulose, holocellulose and lignin content using FTIR in Calycophyllum spruceanum (Benth.) K. Schum. and Guazuma crinita Lam. PLoS ONE 2021, 16, e0256559. [Google Scholar] [CrossRef] [Scilit]
  149. Petrofanov, V.L. Role of the soil particle-size fractions in the sorption and desorption of potassium. Eurasian Soil Sci. 2012, 45, 598–611. [Google Scholar] [CrossRef] [Scilit]
  150. Qiao, W.; Wang, X.; Liu, X.; Zhen, X.; Guo, J.; Wang, S.; Yang, F.; Chen, G.; Zhang, B. Characterization of Dissolved Organic Matter in Deep Geothermal Water from Different Burial Depths Based on Three-Dimensional Fluorescence Spectra. Water 2017, 9, 266. [Google Scholar] [CrossRef] [Scilit]
  151. Sierra, M.M.; Giovanela, M.; Parlanti, E.; Soriano-Sierra, E.J. Fluorescence fingerprint of fulvic and humic acids from varied origins as viewed by single-scan and excitation/emission matrix techniques. Chemosphere 2005, 58, 715–733. [Google Scholar] [CrossRef] [Scilit]
  152. Moore, O.C.; Holt, A.D.; Richards, L.A.; McKenna, A.M.; Spencer, R.G.M.; Lapworth, D.J.; Polya, D.A.; Lloyd, J.R.; van Dongen, B.E. Characterisation of dissolved organic matter in two contrasting arsenic-prone sites in Kandal Province, Cambodia. Org. Geochem. 2024, 198, 104886. [Google Scholar] [CrossRef] [Scilit]
  153. He, J.; Wu, X.; Zhi, G.; Yang, Y.; Wu, L.; Zhang, Y.; Zheng, B.; Qadeer, A.; Zheng, J.; Deng, W.; et al. Fluorescence characteristics of DOM and its influence on water quality of rivers and lakes in the Dianchi Lake basin. Ecol. Indic. 2022, 142, 109088. [Google Scholar] [CrossRef] [Scilit]
  154. Wang, X.; Tong, Y.; Chang, Q.; Lu, J.; Ma, T.; Zhou, F.; Li, J. Source identification and characteristics of dissolved organic matter and disinfection by-product formation potential using EEM-PARAFAC in the Manas River, China. RSC Adv. 2021, 11, 28476–28487. [Google Scholar] [CrossRef] [Scilit] [PubMed]
  155. Barth, A. Infrared spectroscopy of proteins. Biochim. Biophys. Acta 2007, 1767, 1073–1101. [Google Scholar] [CrossRef] [Scilit]
  156. Brown, P.J.N.; Mooney, E.F. The infrared spectra of fluorinated aromatic compounds—I Methyl substituted 2, 3, 4, 5, 6-pentafluorodiphenyls. Spectrochim. Acta Part A Mol. Spectrosc. 1968, 24, 1317–1320. [Google Scholar] [CrossRef] [Scilit]
  157. Semenov, V.M.; Tulina, A.S.; Semenova, N.A.; Ivannikova, L.A. Humification and nonhumification pathways of the organic matter stabilization in soil: A review. Eurasian Soil Sci. 2013, 46, 355–368. [Google Scholar] [CrossRef] [Scilit]
  158. Kabata-Pendias, A. Trace Elements in Soils and Plants; CRC Press: Boca Raton, FL, USA, 2010. [Google Scholar]
  159. Liu, Y.; Sun, J.; Wang, X.; Liu, X.; Wu, X.; Chen, Z.; Gu, T.; Wang, W.; Yu, L.; Guo, Y.; et al. Fluorescence Characteristics of Chromophoric Dissolved Organic Matter in the Eastern Indian Ocean: A Case Study of Three Subregions. Front. Mar. Sci. 2021, 8, 742595. [Google Scholar] [CrossRef] [Scilit]
  160. Lehmann, J.; Kleber, M. The contentious nature of soil organic matter. Nature 2015, 528, 60–68. [Google Scholar] [CrossRef] [Scilit] [PubMed]
Figure 1. Regions of the excitation–emission matrix that correspond to certain groups of compounds. Green frames correspond to previously used boundaries, A, B, C, and T, which were proposed previously [85,86] in light magenta frames, and to broader boundaries A*, B*, C*, and T* proposed in this study; fraction of 0.01–0.03 µm. Details of the regions are summed up in Table 2.
Soilsystems 10 00031 g001
Figure 2. Absorption spectra of flushing water and filtrates obtained during blank experiments using polycarbonate track-etched membranes with different pore sizes after 50 mL of water and (inset) absorption spectra (with a logarithmic Y axis) of a series of filtrates obtained sequentially by the volumes of 50 mL (violet, 1st run; blue, 2nd run; green, 3rd run; yellow, 4th run; and red, 5th run) using membranes with a pore size of 0.05 μm.
Soilsystems 10 00031 g002
Figure 3. Full smoothed normalized IR spectra (4000–100 cm−1) for (a) four largest fractions with a particle size of 1 to 10 µm; azide bands of 3390 and 638 cm−1 are removed. For clarity, the abscissa axis is represented on a logarithmic scale, and the spectra are shifted from each other (orange rectangles indicate areas where most absorption bands of narrow fine fractions appear) and (b) fractions with particle sizes of less than 1 μm. Numbers at peaks show band maxima (cm−1).
Soilsystems 10 00031 g003
Figure 4. Smoothed IR spectra with baseline correction for the selected range of wavenumbers: (a) 3100–2700 cm−1 and (b) 1800–1200 cm−1. Numbers at peaks show band maxima (cm−1).
Soilsystems 10 00031 g004
Figure 5. Smoothed spectra with baseline correction for the selected range of wavenumbers; (a) 930–810 and (b) 710–650 cm−1. Numbers at peaks show band maxima (cm−1).
Soilsystems 10 00031 g005
Figure 6. Synchronous homospectral ATR FTIR 2D-COS maps of particulate SOM for the ranges (a) 700–650 cm−1; (b) 900–800 cm−1; (c) 1800–1200 cm−1; and (d) 3000–2800 cm−1.
Soilsystems 10 00031 g006
Figure 7. Synchronous heterospectral ATR FTIR 2D-COS maps of particulate SOM for the ranges (a) 700–650 cm−1 and 900–800 cm−1; (b) 1800–1200 cm−1 and 3000–2800 cm−1; and (c) 1800–1200 cm−1 and 900–800 cm−1.
Soilsystems 10 00031 g007
Figure 8. Excitation–emission matrices for obtained narrow size fractions of chernozem soils: (a) below 0.01 µm; (b) 0.01–0.03 µm; (c) 0.03–0.05 µm; (d) 0.05–0.1 µm; (e) 0.1–0.2 µm; (f) 0.2–0.4 µm; (g) 0.4–0.8 µm; (h) 0.8–1 µm; (i) 1–2 µm; (j) 2–5 µm; (k) 5–10 µm; (l) above 10 µm.
Soilsystems 10 00031 g008
Figure 9. Distribution of fluorescent organic-matter components, (a) region and peak area ratios and (b) integral indicators (freshness index (BIX) (β/α) and fluorescence index (FI)) between narrow fractions. Insets in (a) are relative abundances of humic (HS) and non-humic (BE) components according to sums of AC–BT intensities; the red line in (b) marks the value of one. Red line is the value of 1.
Soilsystems 10 00031 g009
Figure 10. Correlations of area intensities and fluorescence indicators (humification index (HIXEM), freshness index (BIX) (β/α), fluorescence index (FI), and T/C peak ratio), divided into mainly highly humified (brown background) and freshly created SOM (green background).
Soilsystems 10 00031 g010
Figure 11. Synchronous heterospectral IR–fluorescence 2D-COS maps of particulate SOM for the ranges: (a) 300–500 nm (fluorescence) and 650–750 cm−1 (FTIR); (b) 300–500 nm (fluorescence) and 800–950 cm−1 (FTIR); (c) 300–500 nm (fluorescence) and 1800–1200 cm−1 (FTIR); and (d) 300–500 nm (fluorescence) and 3000–2700 cm−1 (FTIR).
Soilsystems 10 00031 g011aSoilsystems 10 00031 g011b
Figure 12. Correlations of fluorescence indexes and molar fractions of elements in fractions with ICP-AES, except for the fraction of 5–10 μm, due to high amounts of all the elements in this fraction that distort overall correlations.
Soilsystems 10 00031 g012
Table 1. Conditions for registration of ATR-FTIR spectra.
ParameterValue
Measuring range, cm−14000–100
Resolution, cm−12
Number of background scans128
Number of sample scans128
Phase resolution16
Phase correctionMertz
Apodization functionBlackman–Harris, 3-term
Zero fill factor2
Aperture, mm8
Sourcemid-IR
Beam splitterwide from mid-IR to far IR (Si)
Table 2. Expanded regions (marked with the asterisk) of the excitation (Ex)–emission (Em) matrix corresponding to certain groups of compounds [85,86].
Band Name Ex Wavelength Range, nmEm Wavelength Range, nmGroups of Substances
A*240–300380–505humic-like
B*250–285280–320tyrosine-, phenylalanine-, protein-like
C*300–390380–505humic-like
T*250–285320–400tryptophan-, phenol-, protein-like
Table 3. Band assignments for DOM size fractions by ATR–FTIR [34,97,98,99,100,101,102,103,104,105,106,107,108,109,110,111,112,113,114,115,116,117,118,119,120,121,122,123,124,125,126,127,128,129,130,131,132,133,134,135,136,137,138].
Wavenumber, cm−1Inorganic (Matrix) ConstituentsOrganic Constituents
3695–3690unbonded SiO–H stretch, tilted (kaolinite, clay) [113]
3625–3620hydrogen-bonded SiO–HH2O stretch (amorphous species) [111,112]
3390combination band NaN3 ≅ 1350 + 2043 [100,101]
3390 and 3270antisymmetric and symmetric hydrogen-bond ensembles
2960antisymmetric stretch of (alkene) methylene groups [104,106,107,108]
2940–2920 and
2855–2850
antisymmetric and symmetric stretch of methylene groups [104,106,107,108]
2810(?) C–H stretching adjacent to carbonyls
2770
2670hydrogen-bonded O–H stretching vibrations in carboxylic acids [49]
2380ambient CO2
2340ambient CO2
2040NaN3
1740–1730Carbonyl, conjugated or esters
1680–1670Carboxyl, antisymmetric stretch, or Amide I
alkene –C=C– stretch,
(?) substituted aromatics
1645–1630bend (v2) of the covalent bonds of liquid absorbed water [122] and OH groups, O–H stretch
1620–1615hydrogen-bonded SiOHH2O, HO–H stretch (amorphous) [113]
1580Carboxylate, antisymmetric stretch
1520Aromatic C=C stretch
Amide II band (primarily –N–H bending and C–N stretching)
SiO2 combination band [110]
1500aromatic C=C stretch
1480–1460Scissoring C–H bend (deformation)
antisymmetric bending in –CH3 [123]
C=C stretching and ring breathing vibrations in aromatic compounds
1450–1440carbonate, antisymmetric stretch [114], dolomite [124]
1415–1405carbonate, antisymmetric stretch calcite [125], clay or carbonate minerals [109]
1390–1380Carboxylate, symmetric stretch
nitrate from nitrogen fertilizers [126]
symmetric bend in –CH3 [127]
1310–1300–C–H bend (deformation) vibrations, including amorphous and crystalline cellulose [128]
1280Carboxyl, antisymmetric stretch
or SiO2 combination band
1120–1100and O–Si–O stretch in crystalline/amorphous SiO2 species
1090Carbonate, symmetric stretch [125]Cellulose
1070–1050SiO2, (kaolinite, illite)
O–Si–O lattice antisymmetric stretch [119,131,132]
1035quartz lattice O–Si–O stretchCarbohydrates + PO43 stretching (1100–1000 cm−1) [138]
1017–1010Si–O–Si stretch [131,132]Carbohydrates + PO43 stretching (1100–1000 cm−1) [138]
975amorphous silica, Si–OH including biogenic [131,132]
930Silicate, aluminosilicate, overtone [118]
912–Si–O [105]; overtone SiO2 ≅ 2 × 450 in aluminosilicates and silicates + Al–OH bending [99]
900Si–O stretching in silicates
890Si–O–Si stretch in quartz
880–875Carbonate, out-of-plane bend [125]
865Si–O–Si stretching (sheet silicates, some aluminosilicates [131,139]
850Si–O (quartz/silicate, aluminosilicates)
840–Si–O [105]
825Si–O stretch in feldspars and aluminosilicates [131,139]
810–805symmetric stretching vibration Si–O–Si, silica, amorphous [102]
797–796O–Si–O stretchC–H bending (non-aromatic)
715Carbonate, in-plane bend [125]
697Si–O–Si bend (including aluminosilicates) [131,139]C–H aromatic compounds, bending
685Si–O–Si (crystalline forms, aluminosilicates) [131]
668CO2
655Al–O–Si in aluminosilicates
638NaN3 out-of-plane bending [140]
525–520silicate O–Si–O bend [119], including bending or deformation modes of silicate frameworks or associated alumina environments in complex silicates [135]
510O–Si–O or Si–O–Si bending in both crystalline and amorphous silica species
470–460O–Si–O bending of bridging oxygens
430–427O–Si–O bending of bridging oxygens Mg–OH, Al–OH (clay minerals)C–C in-phase vibrations
375R(SiO4) [109]
347–345SiO2
308crystalline matrix (clay or carbonate minerals) [136]
296lattice vibrations
263α-quartz [102]
225lattice vibrational modes in minerals and crystalline materials (involving collective movement of atoms or ions in the crystal lattice) [137]
200–190crystalline matrix (clay or carbonate minerals) [136]
174NaN3 lattice [141]
130crystalline matrix (clay or carbonate minerals)
Disclaimer/Publisher’s Note: The statements, opinions and data contained in all publications are solely those of the individual author(s) and contributor(s) and not of MDPI and/or the editor(s). MDPI and/or the editor(s) disclaim responsibility for any injury to people or property resulting from any ideas, methods, instructions or products referred to in the content.