
Comparison of Allplex™ 2019-nCoV and TaqPath™ COVID-19 Assays

 ,
,  ,
,  and
and 
Abstract
:1. Introduction
2. Materials and Methods
- (i).
- 200 μL of UTM was extracted for Allplex™ 2019-nCoV Assay (Seegene-Seoul, South Korea) with the fully Automated Liquid Handling Workstations NIMBUS which also arrange the PCR plate and the Real-Time PCR System from Bio-Rad CFX96™ Dx (Bio-Rad, Hercules, CA, USA);
- (ii).
- TaqPath™ COVID-19 CE-IVD RT-PCR Kit (after this referred to as TaqPath™ COVID-19) with semi-automatic KingFisher Duo Prime by Thermofisher. Briefly, by extracting a 200 μL aliquot of specimen in UTM using the MagMAX™ Viral/Pathogen Nucleic Acid isolation kit on the KingFisher Flex Purification system (Thermo Fisher Scientific, Waltham, MA, USA). Before RNA extraction, 10 μL of Proteinase K was added to each well in the KingFisher™ Deep 96-well Plate. In addition, 10 μL of the MS2 Phage Control was added to all specimens together with 10 μL of magnetic beads.
2.1. Allplex™ 2019-nCoV Assay
2.2. TaqPath™ COVID-19
2.3. Sequencing SARS-CoV-2
2.4. Statistical Analysis
3. Results and Discussion
4. Conclusions
Author Contributions
Funding
Institutional Review Board Statement
Informed Consent Statement
Data Availability Statement
Conflicts of Interest
References
- Clinical Characteristics of COVID-19. Available online: https://www.ecdc.europa.eu/en/covid-19/latest-evidence/clinical (accessed on 25 June 2021).
- Yuen, K.S.; Ye, Z.W.; Fung, S.Y.; Chan, C.P.; Jin, D.Y. SARS-CoV-2 and COVID-19: The most important research questions. Cell Biosci. 2020, 10, 40. [Google Scholar] [CrossRef] [PubMed] [Green Version]
- Recommendations for National SARS-CoV-2 Testing Strategies and Diagnostic Capacities. Available online: https://www.who.int/publications/i/item/WHO-2019-nCoV-Surveillance_Case_Definition-2020.2 (accessed on 7 September 2021).
- Kostaki, E.G.; Pavlopoulos, G.A.; Verrou, K.M.; Ampatziadis-Michailidis, G.; Harokopos, V.; Hatzis, P.; Moulos, P.; Siafakas, N.; Pournaras, S.; Hadjichristodoulou, C.; et al. Molecular Epidemiology of SARS-CoV-2 in Greece Reveals Low Rates of Onward Virus Transmission after Lifting of Travel Restrictions Based on Risk Assessment during Summer 2020. mSphere 2021, 6, e0018021. [Google Scholar] [CrossRef] [PubMed]
- Luciani, F.; Cione, E.; Caroleo, M.C.; Colosimo, M.; Zanolini, A.; Barca, A.; Cosimo, S.; Pasqua, P.; Gallelli, L. SARS-CoV-2 Translocate from Nasopharyngeal to Bronchoalveolar Site: A Case Presentation. Reports 2020, 3, 23. [Google Scholar] [CrossRef]
- Kohmer, N.; Eckermann, L.; Böddinghaus, B.; Götsch, U.; Berger, A.; Herrmann, E.; Kortenbusch, M.; Tinnemann, P.; Gottschalk, R.; Hoehl, S.; et al. Self-Collected Samples to Detect SARS-CoV-2: Direct Comparison of Saliva, Tongue Swab, Nasal Swab, Chewed Cotton Pads and Gargle Lavage. J. Clin. Med. 2021, 10, 5751. [Google Scholar] [CrossRef] [PubMed]
- Naqvi, A.A.T.; Fatima, K.; Mohammad, T.; Fatima, U.; Singh, I.K.; Singh, A.; Atif, S.M.; Hariprasad, G.; Hasan, G.M.; Hassan, M.I. Insights into SARS-CoV-2 genome, structure, evolution, pathogenesis and therapies: Structural genomics approach. Biochim. Biophys. Acta Mol. Basis Dis. 2020, 1866, 165878. [Google Scholar] [CrossRef] [PubMed]
- Coronavirus COVID-19 Global Cases by Johns Hopkins. Available online: https://coronavirus.jhu.edu/map.html (accessed on 22 January 2022).
- Rambaut, A.; Holmes, E.C.; O’Toole, Á.; Hill, V.; McCrone, J.T.; Ruis, C.; du Plessis, L.; Pybus, O.G. A dynamic nomenclature proposal for SARS-CoV-2 lineages to assist genomic epidemiology. Nat. Microbiol. 2020, 5, 1403–1407. [Google Scholar] [CrossRef] [PubMed]
- Peronace, C.; Tallerico, R.; Colosimo, M.; De Fazio, M.; Pasceri, F.; Talotta, I.; Panduri, G.; Pintomalli, L.; Oteri, R.; Calantoni, V.; et al. BA.1 Omicron Variant of SARS-CoV-2: First Case Reported in Calabria Region, Italy. COVID 2022, 2, 211–215. [Google Scholar] [CrossRef]
- Seegene. Allplex 2019-nCoV Assay (Version 2.2; 15 April 2021), Instruction for Use. Available online: https://www.fda.gov/media/137178/download (accessed on 4 December 2021).
- TaqPath™ COVID-19 CE-IVD RT-PCR Kit MAN0019215, Revision F.0. Available online: https://assets.thermofisher.com/TFS-Assets/LSG/manuals/MAN0019215_TaqPathCOVID-19_CE-IVD_RT-PCR%20Kit_IFU.pdf (accessed on 4 December 2021).
- Classification of Omicron (B.1.1.529): SARS-CoV-2 Variant of Concern. Available online: https://www.who.int/news/item/26-11-2021-classification-of-omicron-(b.1.1.529)-sars-cov-2-variant-of-concern (accessed on 1 January 2022).
- COVID-19 Diagnostics Resource Centre. Available online: https://www.finddx.org/covid-19/ (accessed on 29 December 2021).
- Stadhouders, R.; Pas, S.D.; Anber, J.; Voermans, J.; Mes, T.H.; Schutten, M. The effect of primer-template mismatches on the detection and quantification of nucleic acids using the 5′ nuclease assay. J. Mol. Diagn. 2010, 12, 109–117. [Google Scholar] [CrossRef] [PubMed]
- Rabaan, A.A.; Tirupathi, R.; Sule, A.A.; Aldali, J.; Mutair, A.A.; Alhumaid, S.; Muzaheed Gupta, N.; Koritala, T.; Adhikari, R.; Bilal, M.; et al. Viral Dynamics and Real-Time RT-PCR Ct Values Correlation with Disease Severity in COVID-19. Diagnostics 2021, 11, 1091. [Google Scholar] [CrossRef] [PubMed]
- Larremore, D.B.; Wilder, B.; Lester, E.; Shehata, S.; Burke, J.M.; Hay, J.A.; Tambe, M.; Mina, M.J.; Parker, R. Test sensitivity is secondary to frequency and turnaround time for COVID-19 screening. Sci. Adv. 2021, 7, eabd5393. [Google Scholar] [CrossRef] [PubMed]
- Mina, M.J.; Parker, R.; Larremore, D.B. Rethinking Covid-19 Test Sensitivity—A Strategy for Containment. N. Engl. J. Med. 2020, 383, e120. [Google Scholar] [CrossRef] [PubMed]
- Cione, E.; Siniscalchi, A.; Gangemi, P.; Cosco, L.; Colosimo, M.; Longhini, F.; Luciani, F.; De Sarro, G.; G&SPWorking Group Berrino, L.; D’Agostino, B.; et al. Neuron-specific enolase serum levels in COVID-19 are related to the severity of lung injury. PLoS ONE 2021, 16, e0251819. [Google Scholar] [CrossRef] [PubMed]
- Bentivegna, E.; Sentimentale, A.; Luciani, M.; Speranza, M.L.; Guerritore, L.; Martelletti, P. New IgM seroconversion and positive RT-PCR test after exposure to the virus in recovered COVID-19 patient. J. Med. Virol. 2021, 93, 97–98. [Google Scholar] [CrossRef] [PubMed]
- Smith, R.L.; Gibson, L.L.; Martinez, P.P.; Ke, R.; Mirza, A.; Conte, M.; Gallagher, N.; Conte, A.; Wang, L.; Fredrickson, R.; et al. Longitudinal Assessment of Diagnostic Test Performance Over the Course of Acute SARS-CoV-2 Infection. J. Infect. Dis. 2021, 224, 976–982. [Google Scholar] [CrossRef] [PubMed]


| Developer | Commercial Name | Gene | Regulatory | ||||
|---|---|---|---|---|---|---|---|
| ORF1ab | RdRP | E | N | S | |||
| Seegene, Inc. | Allplex™ 2019-nCoV | USA EUA; CE-IVD | |||||
| Thermo Fisher | TaqPath™ COVID-19 | CE-IVD | |||||
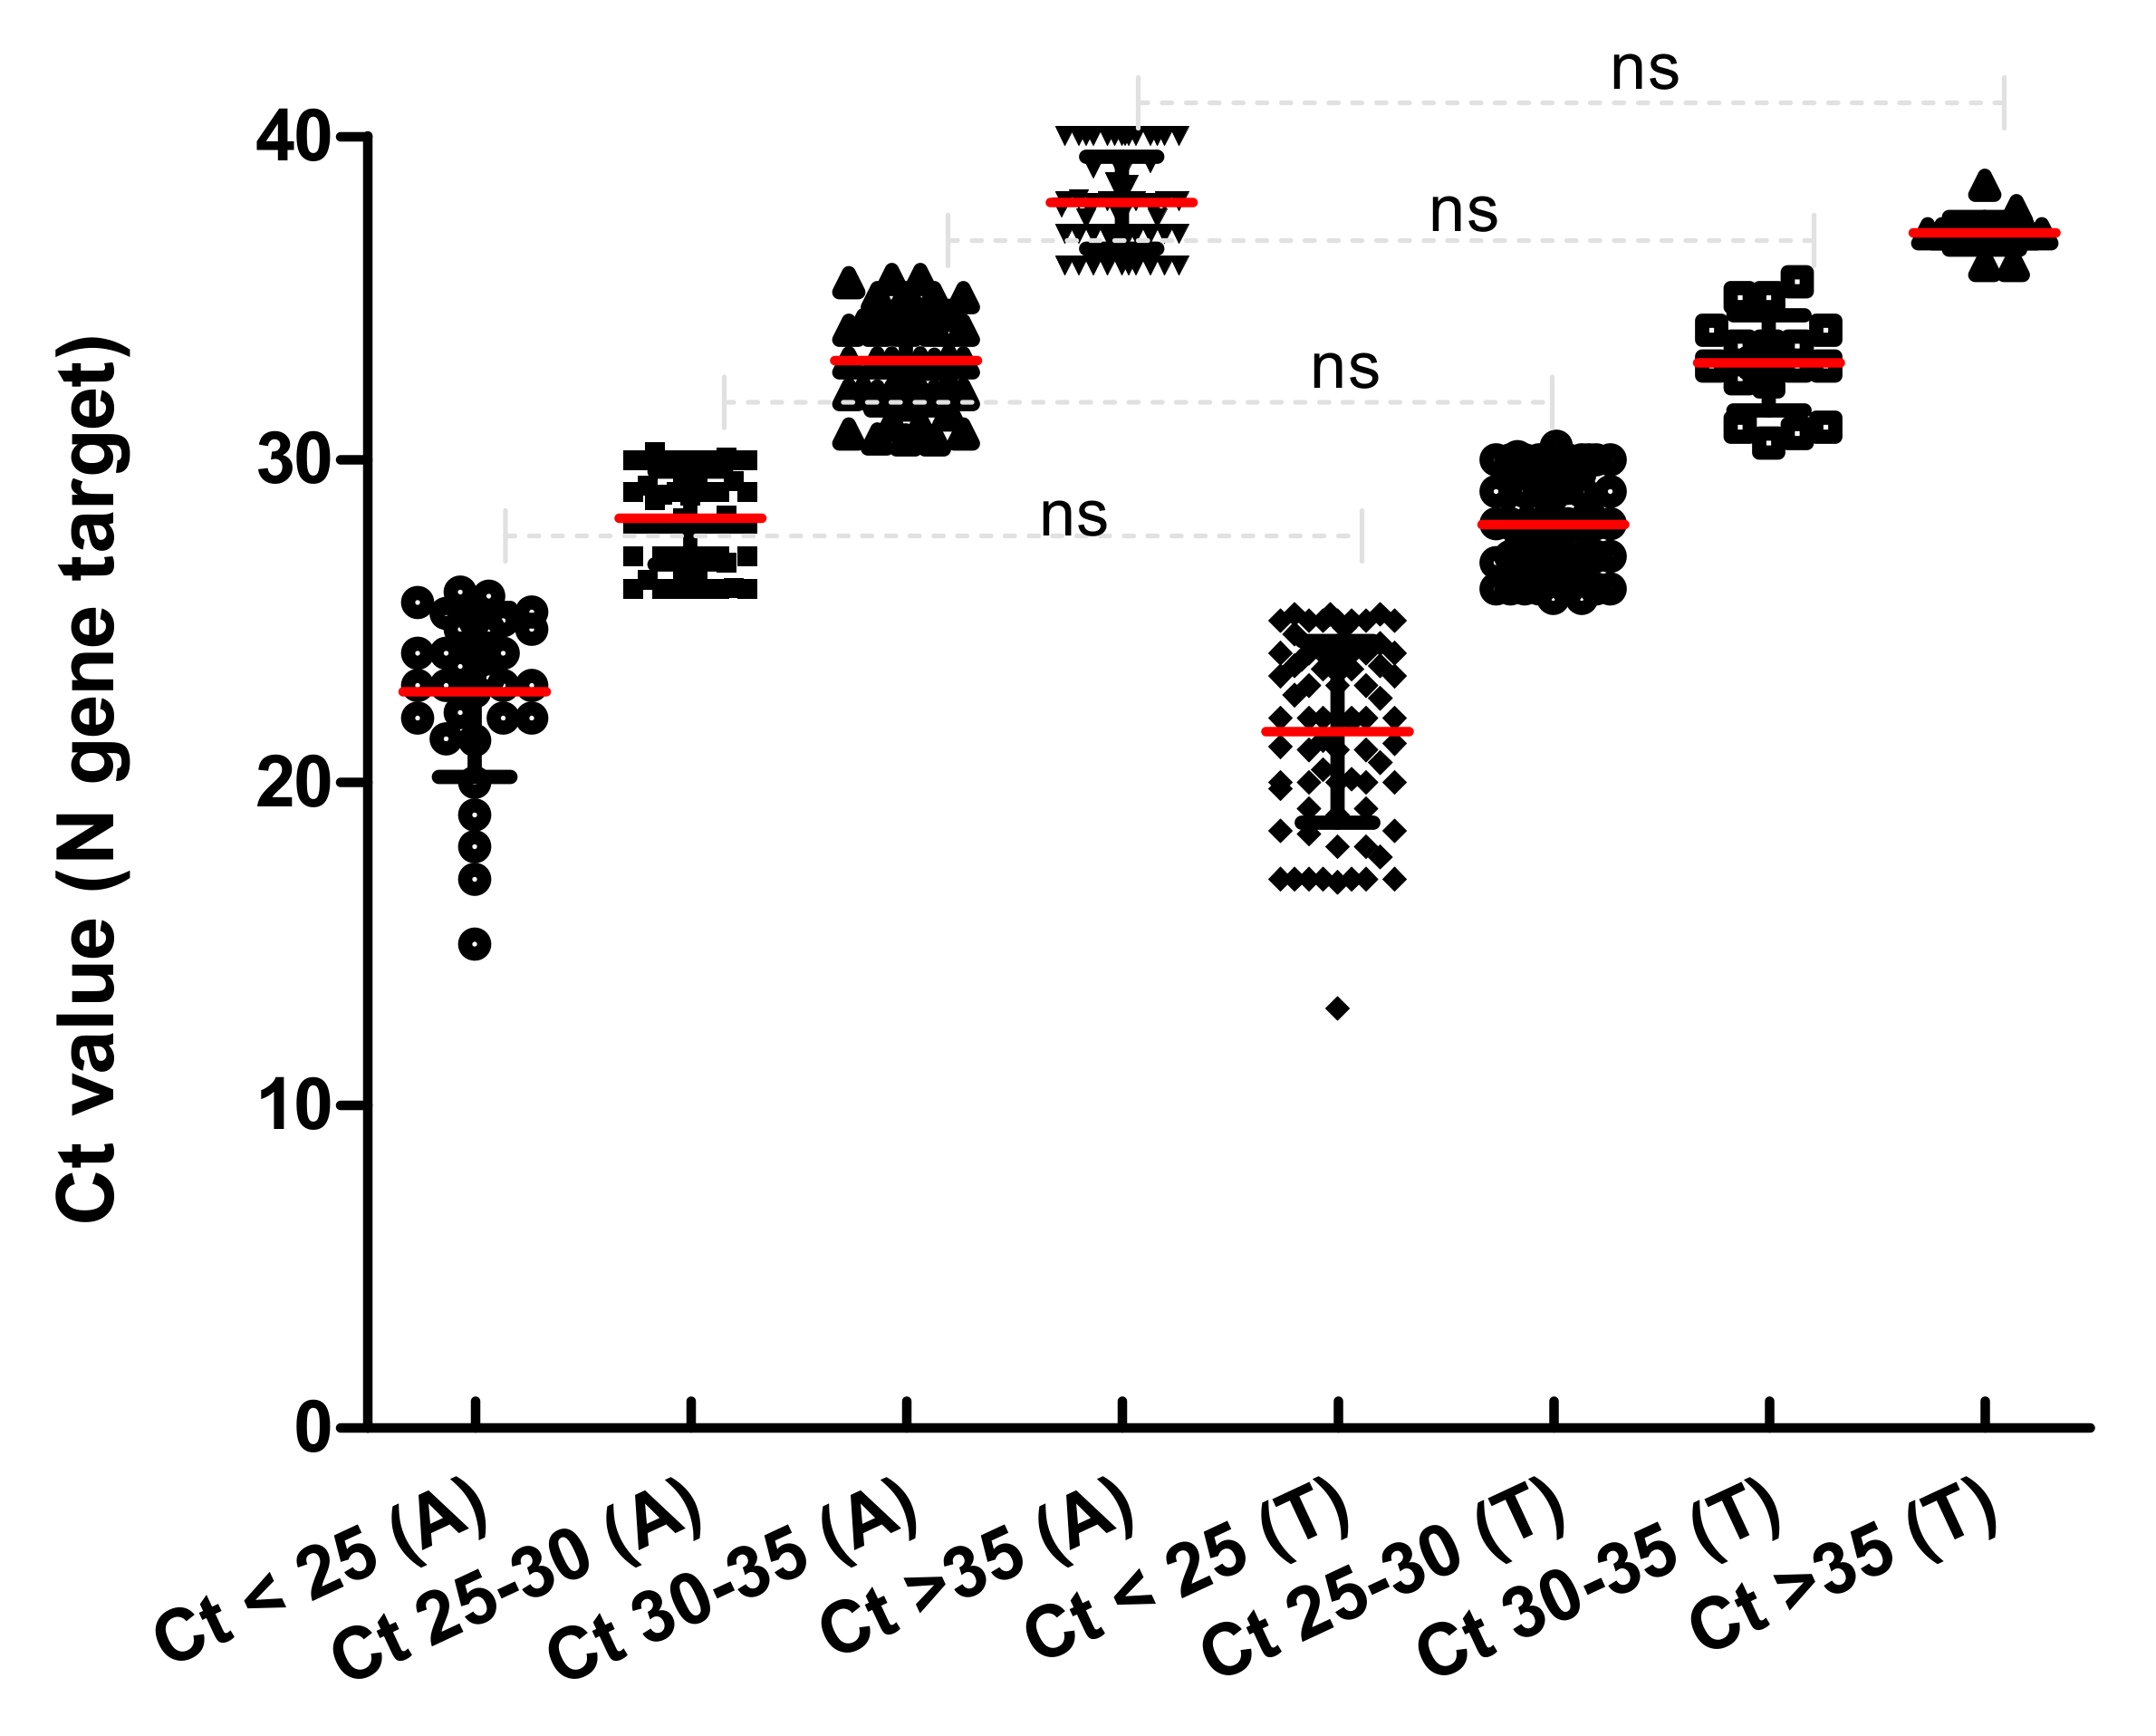
| Commercial Name | N Gene Target | Range Ct | |||
|---|---|---|---|---|---|
| Ct < 25 | Ct 25–30 | Ct 30–35 | Ct > 35 | ||
| Allplex™ 2019-nCoV | 22.79 ± 2.66 (n = 31) | 28.18 ± 1.45 (n = 55) | 33.05 ± 1.54 (n = 42) | 37.90 ± 1.43 (n = 56) | ≤40 |
| TaqPath™ COVID-19 | 21.61 ± 2.83 (n = 87) | 27.98 ± 1.47 (n = 61) | 32.99 ± 1.51 (n = 17) | 37.01 ± 0.51 (n = 19) | ≤37 with MS2 ≤ 32 |
| Lineage | VOC | Clade | Gene | |||
|---|---|---|---|---|---|---|
| S | Orf1ab | N | ||||
| 1 | BA.1 | OMICRON | 21k | A67V; IHV68I_del; T95I; GVYY142D_del; NL211I_del; D215EPED; G339D; S371L; S373P; S375F; K417N; N440K; G446S; T547K; D614G; H655Y; N679K; P681H; N764K; N856K; Q954H; N969K; D1146. | K38R; F106; A889; SL1265I_del; A1892T; T492I; P132H; LSGF105F_del; I189V; V57; P323L; N600; L749M. | P13L; ERS30G_del; R203K; G204R. |
| 2 | BA.1 | OMICRON | 21k | A67V; IHV68I_del; T95I; GVYY142D_del; NL211I_del; D215EPED; G339D; S371L; S373P; S375F; K417N; F456; T547K; D614G; H655Y; N679K; P681H; N764K; N856K; Q954H; N969K; D1146. | K38R; F106; D174; A889; V1069I; SL1265I_del; T492I; P132H; LSGF105F_del; I189V; V57; P323L; N600. | P13L; GERS30G_del; R203K; G204R. |
| 3 | BA.1 | OMICRON | 21k | A67V; IHV68I_del; T95I; GVYY142D_del; NL211I_del; D215EPED; G339D; S371L; S373P; S375F; K417N; Y449F; T547K; D614G; H655Y; N679K; P681H; N764K; N856K; Q954H; N969K; L981F; D1146. | K38R; F106; D174; A889; V1069I; SL1265I_del; T492I; P132H; LSGF105F_del; I189V; V57; P323L; N600. | P13L; GERS30G_del; R203K; G204R. |
| 4 | B.1.1.529 | OMICRON | 21k | T95I; V143; NL211I_del; D215EPED; G339D; K417N; Y449F; L452R; T547K; H655Y; P681R; N764K; G799D; N856K; N969K; L981F; D1146. | F106; D174; A889; V1069I; S1265; T492I; P132H; V57; P323L; A448G; I466L; N600; E204D; P429; A430S; L216. | P13L; ERS30G_del; D63G; R203K; 204R. |
Publisher’s Note: MDPI stays neutral with regard to jurisdictional claims in published maps and institutional affiliations. |
© 2022 by the authors. Licensee MDPI, Basel, Switzerland. This article is an open access article distributed under the terms and conditions of the Creative Commons Attribution (CC BY) license (https://creativecommons.org/licenses/by/4.0/).
Share and Cite
Colosimo, M.; Minchella, P.; Tallerico, R.; Talotta, I.; Peronace, C.; Gallelli, L.; Di Mizio, G.; Cione, E. Comparison of Allplex™ 2019-nCoV and TaqPath™ COVID-19 Assays. Reports 2022, 5, 14. https://doi.org/10.3390/reports5020014
Colosimo M, Minchella P, Tallerico R, Talotta I, Peronace C, Gallelli L, Di Mizio G, Cione E. Comparison of Allplex™ 2019-nCoV and TaqPath™ COVID-19 Assays. Reports. 2022; 5(2):14. https://doi.org/10.3390/reports5020014
Chicago/Turabian StyleColosimo, Manuela, Pasquale Minchella, Rossana Tallerico, Ilenia Talotta, Cinzia Peronace, Luca Gallelli, Giulio Di Mizio, and Erika Cione. 2022. "Comparison of Allplex™ 2019-nCoV and TaqPath™ COVID-19 Assays" Reports 5, no. 2: 14. https://doi.org/10.3390/reports5020014
APA StyleColosimo, M., Minchella, P., Tallerico, R., Talotta, I., Peronace, C., Gallelli, L., Di Mizio, G., & Cione, E. (2022). Comparison of Allplex™ 2019-nCoV and TaqPath™ COVID-19 Assays. Reports, 5(2), 14. https://doi.org/10.3390/reports5020014