
Vitamin D Status in a Rural Italian Population

 ,
,
Abstract
:1. Introduction
2. Materials and Methods
2.1. Study Population
2.2. Measurement of 25-Hydroxyvitamin D Concentrations and Risk Factors
2.3. Statistical Analysis
3. Results
4. Discussion
Supplementary Materials
Author Contributions
Funding
Institutional Review Board Statement
Informed Consent Statement
Data Availability Statement
Acknowledgments
Conflicts of Interest
References
- Holick, M.F. Resurrection of vitamin D deficiency and rickets. J. Clin. Investig. 2006, 116, 2062–2072. [Google Scholar] [CrossRef] [Green Version]
- Bikle, D.D. Vitamin D: Newer concepts of its metabolism and function at the basic and clinical level. J. Endocr. Soc. 2020, 4, 1–20. [Google Scholar] [CrossRef]
- Bikle, D.D. Vitamin D Metabolism and Function in the Skin. Molecular and cellular endocrinology. Mol. Cell. Endocrinol. 2011, 347, 80–89. [Google Scholar] [CrossRef] [Green Version]
- Slominski, A.T.; Kim, T.K.; Shehabi, H.Z.; Semak, I.; Tang, E.K.; Nguyen, M.N.; Benson, H.A.; Korik, E.; Janjetovic, Z.; Chen, J.; et al. In vivo evidence for a novel pathway of vitamin D 3 metabolism initiated by P450scc and modified by CYP27B1. FASEB J. 2012, 26, 3901–3915. [Google Scholar] [CrossRef] [Green Version]
- Slominski, A.T.; Kim, T.K.; Shehabi, H.Z.; Tang, E.K.; Benson, H.A.; Semak, I.; Lin, Z.; Yates, C.R.; Wang, J.; Li, W.; et al. In vivo production of novel vitamin D2 hydroxy-derivatives by human placentas, epidermal keratinocytes, Caco-2 colon cells and the adrenal gland. Mol. Cell. Endocrinol. 2014, 383, 181–192. [Google Scholar] [CrossRef] [PubMed] [Green Version]
- Slominski, A.T.; Li, W.; Kim, T.K.; Semak, I.; Wang, J.K.; Zjawiony, J.; Tuckey, R.C. Novel activities of CYP11A1 and their potential physiological significance. J. Steroid Biochem. Mol. Biol. 2015, 151, 25–37. [Google Scholar] [CrossRef] [PubMed] [Green Version]
- Slominski, A.T.; Kim, T.K.; Li, W.; Postlethwaite, A.; Tieu, E.W.; Tang, E.K.Y.; Tuckey, R.C. Detection of novel CYP11A1-derived secosteroids in the human epidermis and serum and pig adrenal gland. Sci. Rep. Gr. 2015, 5, 14875. [Google Scholar] [CrossRef] [PubMed] [Green Version]
- Jenkinson, C.; Desai, R.; Slominski, A.T.; Tuckey, R.C.; Hewison, M.; Handelsman, D.J. Simultaneous measurement of 13 circulating vitamin D3 and D2 mono and dihydroxy metabolites using liquid chromatography mass spectrometry. Clin. Chem. Lab. Med. 2021, 59, 1642–1652. [Google Scholar] [CrossRef] [PubMed]
- Slominski, R.M.; Tuckey, R.C.; Manna, P.R.; Jetten, A.M.; Postlethwaite, A.; Raman, C.; Slominski, A.T. Extra-adrenal glucocorticoid biosynthesis: Implications for autoimmune and inflammatory disorders. Genes Immun. 2020, 21, 150–168. [Google Scholar] [CrossRef]
- Slominski, R.M.; Raman, C.; Elmets, C.; Jetten, A.M.; Slominski, A.T.; Tuckey, R.C. The significance of CYP11A1 expression in skin physiology and pathology. Mol. Cell. Endocrinol. 2021, 530, 111238. [Google Scholar] [CrossRef]
- Nagpal, S.; Na, S.; Rathnachalam, R. Noncalcemic Actions of Vitamin D Receptor Ligands. Endocr. Rev. 2005, 26, 662–687. [Google Scholar] [CrossRef]
- Al Mheid, I.; Quyyumi, A.A. The Present and Future State-of-the-Art Review Vitamin D and Cardiovascular Disease Controversy Unresolved. JACC 2017, 70, 89–100. [Google Scholar] [CrossRef] [PubMed]
- Marino, R.; Misra, M. Extra-skeletal effects of vitamin D. Nutrients 2019, 11, 1460. [Google Scholar] [CrossRef] [Green Version]
- Al Nozha, O.M. Vitamin D and extra-skeletal health: Causality or consequence. Int. J. Health Sci. 2016, 10, 443–452. [Google Scholar] [CrossRef]
- Wang, T.J.; Pencina, M.J.; Booth, S.L.; Jacques, P.F.; Ingelsson, E.; Lanier, K.; Benjamin, E.J.; D’Agostino, R.B.; Wolf, M.; Vasan, R.S. Vitamin D deficiency and risk of cardiovascular disease. Circulation 2008, 117, 503–511. [Google Scholar] [CrossRef] [Green Version]
- Jensen, M.K.; Bertoia, M.L.; Cahill, L.E.; Agarwal, I.; Rimm, E.B.; Mukamal, K.J. Novel metabolic biomarkers of cardiovascular disease. Nat. Rev. Endoc. 2014, 10, 659–672. [Google Scholar] [CrossRef] [PubMed]
- Zittermann, A.; Schleithoff, S.S.; Tenderich, G.; Berthold, H.K.; Körfer, R.; Stehle, P. Low Vitamin D Status: A Contributing Factor in the Pathogenesis of Congestive Heart Failure? J. Am. Coll. Cardiol. 2003, 41, 105–112. [Google Scholar] [CrossRef] [Green Version]
- Tsugawa, N. Cardiovascular Diseases and Fat Soluble Vitamins: Vitamin D and Vitamin K. J. Nutr. Sci. Vitaminol. 2015, 61 (Suppl. S1), S170–S172. [Google Scholar] [CrossRef] [Green Version]
- Van Staa, T.P.; Carr, D.F.; O’Meara, H.; McCann, G.; Pirmohamed, M. Predictors and outcomes of increases in creatine phosphokinase concentrations or rhabdomyolysis risk during statin treatment. Br. J. Clin. Pharmacol. 2014, 78, 649–659. [Google Scholar] [CrossRef] [Green Version]
- Bischoff-Ferrari, H.A.; Fischer, K.; Orav, E.J.; Dawson-Hughes, B.; Meyer, U.; Chocano-Bedoya, P.O.; Meyer, O.W.; Ernst, R.; Schietzel, S.; Eberli, F.; et al. Statin Use and 25-Hydroxyvitamin D Blood Level Response to Vitamin D Treatment of Older Adults. J. Am. Geriatr. Soc. 2017, 65, 1267–1273. [Google Scholar] [CrossRef] [PubMed]
- D’Amelio, P.; Quacquarelli, L. Hypovitaminosis D and Aging: Is There a Role in Muscle and Brain Health? Nutrients 2020, 12, 628. [Google Scholar] [CrossRef] [PubMed] [Green Version]
- Scimeca, M.; Centofanti, F.; Celi, M.; Gasbarra, E.; Novelli, G.; Botta, A.; Tarantino, U. Vitamin D Receptor in Muscle Atrophy of Elderly Patients: A Key Element of Osteoporosis-Sarcopenia Connection. Aging Dis. 2018, 9, 952–964. [Google Scholar] [CrossRef] [Green Version]
- Woo, J. Relationships among diet, physical activity and other lifestyle factors and debilitating diseases in the elderly. Eur J. Clin. Nutr. 2000, 54 (Suppl. 3), S143–S147. [Google Scholar] [CrossRef] [PubMed] [Green Version]
- Meltzer, D.O.; Best, T.J.; Zhang, H.; Vokes, T.; Arora, V.M.; Solway, J. Association of vitamin D status and other clinical characteristics with COVID-19 test results. JAMA Netw. Open 2020, 3, e2019722. [Google Scholar] [CrossRef]
- Ricci, A.; Pagliuca, A.; D’Ascanio, M.; Innammorato, M.; De Vitis, C.; Mancini, R.; Giovagnoli, S.; Facchiano, F.; Sposato, B.; Anibaldi, P.; et al. Circulating Vitamin D levels status and clinical prognostic indices in COVID-19 patients. Respir. Res. 2021, 22, 76. [Google Scholar] [CrossRef] [PubMed]
- Adami, G. Vitamin D and disease severity in coronavirus disease 19 (COVID-19). Reumatismo 2021, 72, 189–196. [Google Scholar] [CrossRef] [PubMed]
- Adami, S.; Romagnoli, E.; Carnevale, V.; Scillitani, A.; Giusti, A.; Rossini, M.; Gatti, D.; Nuti, R.; Minisola, S. Linee guida su prevenzione e trattamento dell’ipovitaminosi D con colecalciferolo. Guidelines on prevention and treatment of vitamin D deficiency. Italian Society for Osteoporosis, Mineral Metabolism and Bone Diseases (SIOMMMS) Reumatismo 2011, 63, 129–147. [Google Scholar] [CrossRef] [PubMed]
- Charoenngam, N.; Shirvani, A.; Holick, M.F. The ongoing D-lemma of Vitamin D supplementation for nonskeletal health and bone health. Curr. Opin. Endocrinol. Diabetes Obes. 2019, 26, 301–305. [Google Scholar] [CrossRef] [PubMed]
- Holick, M.F. Vitamin D: A D-Lightful health perspective. Nutr. Rev. 2008, 66 (Suppl. 2), S182–S194. [Google Scholar] [CrossRef]
- Donfrancesco, C.; Palleschi, S.; Palmieri, L.; Rossi, B.; Lo Noce, C.; Pannozzo, F.; Spoto, B.; Tripepi, G.; Zoccali, C.; Giampaoli, S. Estimated Glomerular Filtration Rate, All-Cause Mortality and Cardiovascular Diseases Incidence in a Low Risk Population: The MATISS Study. PLoS ONE 2013, 8, e78475. [Google Scholar] [CrossRef] [PubMed] [Green Version]
- Palmieri, L.; Donfrancesco, C.; Giampaoli, S.; Trojani, M.; Panico, S.; Vanuzzo, D.; Pilotto, L.; Cesana, G.; Ferrario, M.; Chiodini, P.; et al. Favorable cardiovascular risk profile and 10-year coronary heart disease incidence in women and men: Results from the Progetto CUORE. Eur. J. Prev. Cardiol. 2006, 13, 562–570. [Google Scholar] [CrossRef] [PubMed]
- Zeller, T.; Hughes, M.; Tuovinen, T.; Schillert, A.; Conrads-Frank, A.; Den Ruijter, H.; Schnabel, R.B.; Kee, F.; Salomaa, V.; Siebert, U.; et al. BiomarCaRE: Rationale and design of the European BiomarCaRE project including 300,000 participants from 13 European countries. Eur. J. Epidemiol. 2014, 29, 777–790. [Google Scholar] [CrossRef] [Green Version]
- Cavalier, E.; Lukas, P.; Bekaert, A.C.; Carlisi, A.; Le Goff, C.; Delanaye, P.; Souberbielle, J.C. Analytical and clinical validation of the new Abbot Architect 25(OH)D assay: Fit for purpose? Clin. Chem. Lab. Med. 2017, 55, 378–384. [Google Scholar] [CrossRef] [PubMed]
- Ferrario, M.; Chiodini, P.; Chambless, L.E.; Cesana, G.; Vanuzzo, D.; Panico, S.; Sega, R.; Pilotto, L.; Palmieri, L.; Giampaoli, S.; et al. Prediction of coronary events in a low incidence population. Assessing accuracy of the CUORE Cohort Study prediction equation. Int. J. Epidemiol. 2005, 34, 413–421. [Google Scholar] [CrossRef] [Green Version]
- Tunstall-Pedoe, H.; Kuulasmaa, K.; Tolonen, H.; Davidson, M.; Mendis, S. MONICA, Monograph and Multimedia Sourcebook: World’s Largest Study of Heart Disease, Stroke, Risk Factors, and Population Trends 1979–2002; World Health Organization: Geneva, Switzerland, 2003; 244p. [Google Scholar]
- Rosecrans, R.; Dohnal, J.C. Seasonal vitamin D changes and the impact on health risk assessment. Clin. Biochem. 2014, 47, 670–672. [Google Scholar] [CrossRef] [PubMed]
- Bischoff-Ferrari, H.A.; Giovannucci, E.; Willett, W.C.; Dietrich, T.; Dawson-Hughes, B. Estimation of optimal serum concentrations of 25-hydroxyvitamin D for multiple health outcomes. Am. J. Clin. Nutr. 2006, 84, 18–28. [Google Scholar] [CrossRef]
- Rodríguez-Rodríguez, E.; Aparicio Vizuete, A.; Sánchez-Rodríguez, P.; Lorenzo Mora, A.M.; López-Sobaler, A.M.; Ortega, R.M. Vitamin D deficiency in Spanish population. Importance of egg on nutritional improvement. Nutricion Hospitalaria 2019, 36, 3–7. [Google Scholar] [CrossRef] [PubMed]
- Grant, W.B.; Fakhoury, H.M.A.; Karras, S.N.; Al Anouti, F.; Bhattoa, H.P. Variations in 25-hydroxyvitamin d in countries from the middle east and europe: The roles of uvb exposure and diet. Nutrients 2019, 11, 2065. [Google Scholar] [CrossRef] [PubMed] [Green Version]
- Dimakopoulos, I.; Magriplis, E.; Mitsopoulou, A.V.; Karageorgou, D.; Bakogianni, I.; Micha, R.; Michas, G.; Chourdakis, M.; Ntouroupi, T.; Tsaniklidou, S.M.; et al. Association of serum vitamin D status with dietary intake and sun exposure in adults. Clin. Nutr. Espen. 2019, 34, 23–31. [Google Scholar] [CrossRef] [PubMed]
- Slominski, R.M.; Stefan, J.; Athar, M.; Holick, M.F.; Jetten, A.M.; Raman, C.; Slominski, A.T. Background COVID-19 and Vitamin D: A lesson from the skin. Exp. Dermatol. 2020, 29, 885–890. [Google Scholar] [CrossRef]
- Italian Drug Agency. Il Consumo Di Statine a Livello Internazionale E Nel Contesto Italiano. Farmacoutilizzazione 2001, 4–5, BIF Lug–Ott. 194–201. Available online: http://www.agenziafarmaco.gov.it/wscs_render_attachment_by_id/111.54513.1150382906301de0d.pdf?id=111.54518.1150382906751 (accessed on 19 December 2021).


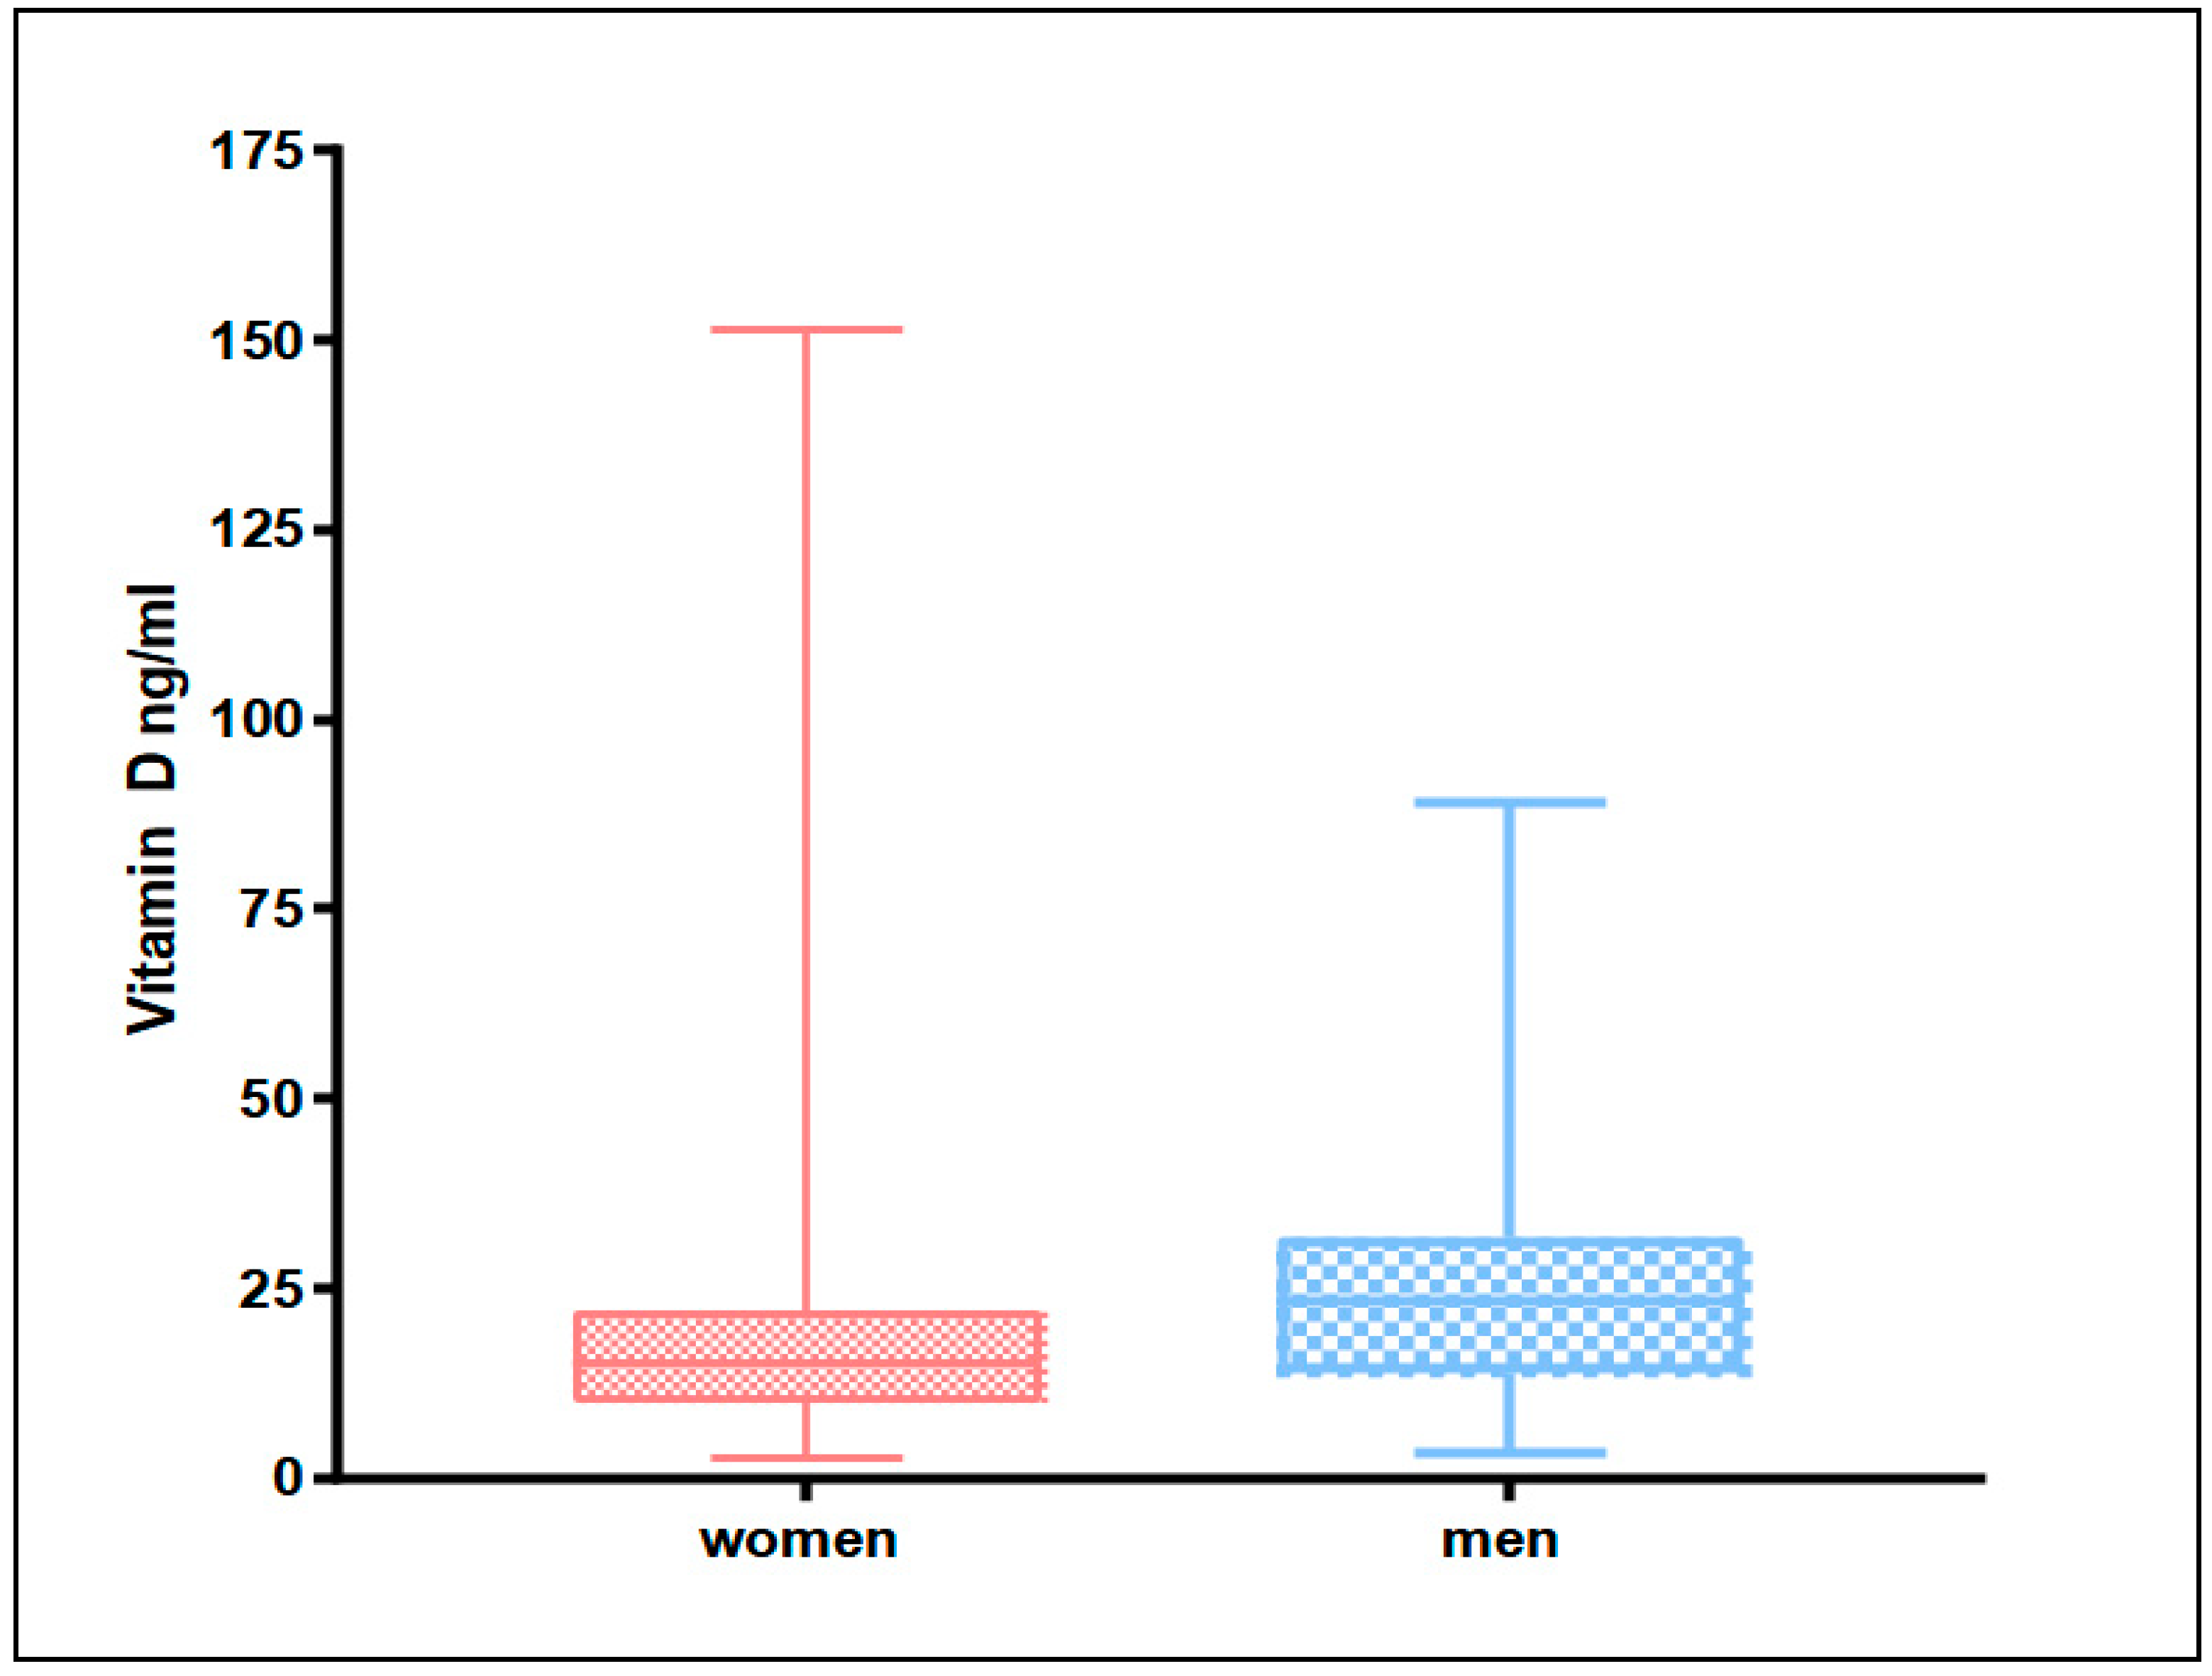
| WOMEN | MEN | ||||||||
|---|---|---|---|---|---|---|---|---|---|
| n | Mean | SD | 95% CI | n | Mean | SD | 95% CI | ||
| 2274 | 17.2 | 10.0 | 16.8 | 17.6 | 1174 | 24.1 | 12.6 | 23.3 | 24.8 |
| WOMEN | MEN | |||||||
|---|---|---|---|---|---|---|---|---|
| Vitamin D Status ng/mL | n | % | 95% CI | n | % | 95% CI | ||
| <20 Deficiency | 1560 | 68.6 | 66.7 | 70.5 | 477 | 40.6 | 37.8 | 43.4 |
| 20–30 Insufficiency | 500 | 22.0 | 20.3 | 23.7 | 354 | 30.2 | 27.5 | 32.8 |
| ≥30 Sufficiency | 213 | 9.4 | 8.2 | 10.6 | 343 | 29.2 | 26.6 | 31.8 |
| ≥150 Toxic | 1 | 0.04 | - | - | 0 | 0 | - | - |
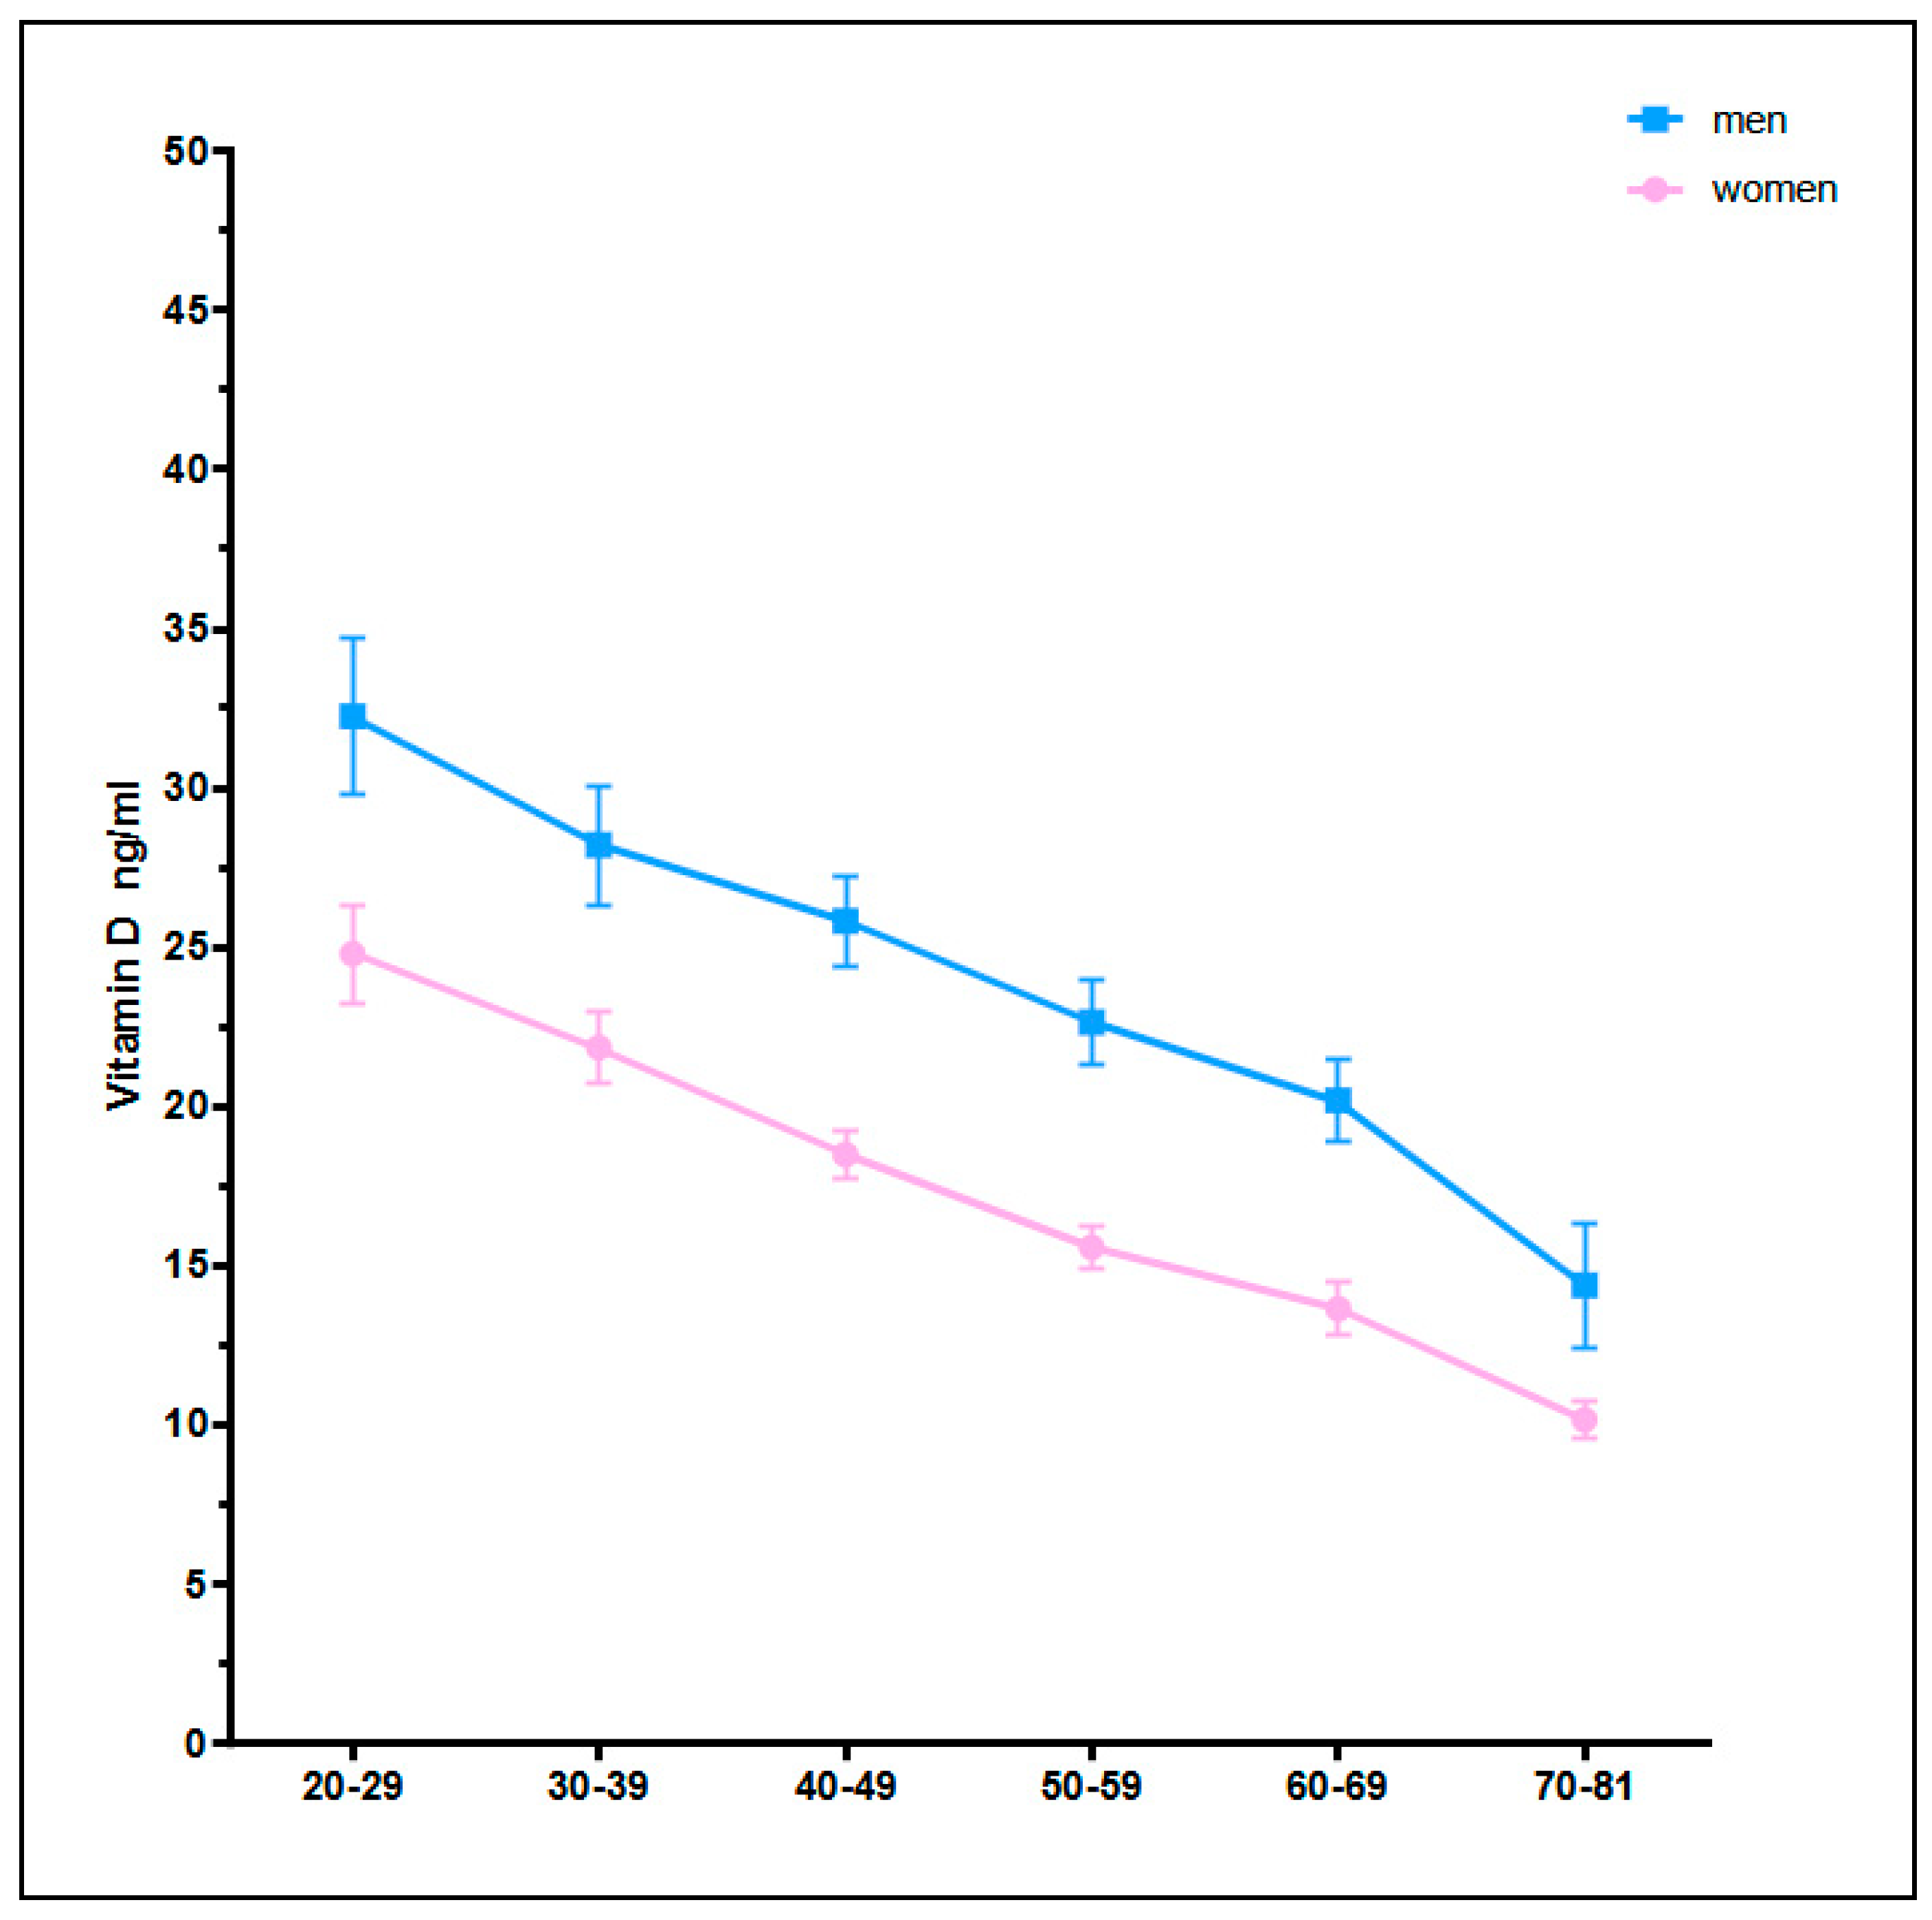
| WOMEN | MEN | |||||||||
|---|---|---|---|---|---|---|---|---|---|---|
| Age Classes (Years) | n | Mean | SD | 95% CI | n | Mean | SD | 95% CI | ||
| 20–29 | 233 | 24.8 | 11.9 | 23.2 | 26.3 | 116 | 32.3 | 13.2 | 29.8 | 34.6 |
| 30–39 | 373 | 21.9 | 11.3 | 20.7 | 23.0 | 230 | 28.2 | 14.4 | 26.3 | 30.0 |
| 40–49 | 471 | 18.5 | 8.5 | 17.7 | 19.2 | 264 | 25.8 | 11.6 | 23.0 | 25.8 |
| 50–59 | 478 | 15.6 | 7.7 | 14.8 | 16.2 | 255 | 22.6 | 10.8 | 21.3 | 23.9 |
| 60–69 | 487 | 13.6 | 9.2 | 12.8 | 14.4 | 231 | 20.2 | 10.1 | 18.8 | 21.5 |
| 70–81 | 232 | 10.2 | 4.8 | 9.5 | 10.7 | 78 | 14.4 | 8.7 | 12.4 | 16.3 |
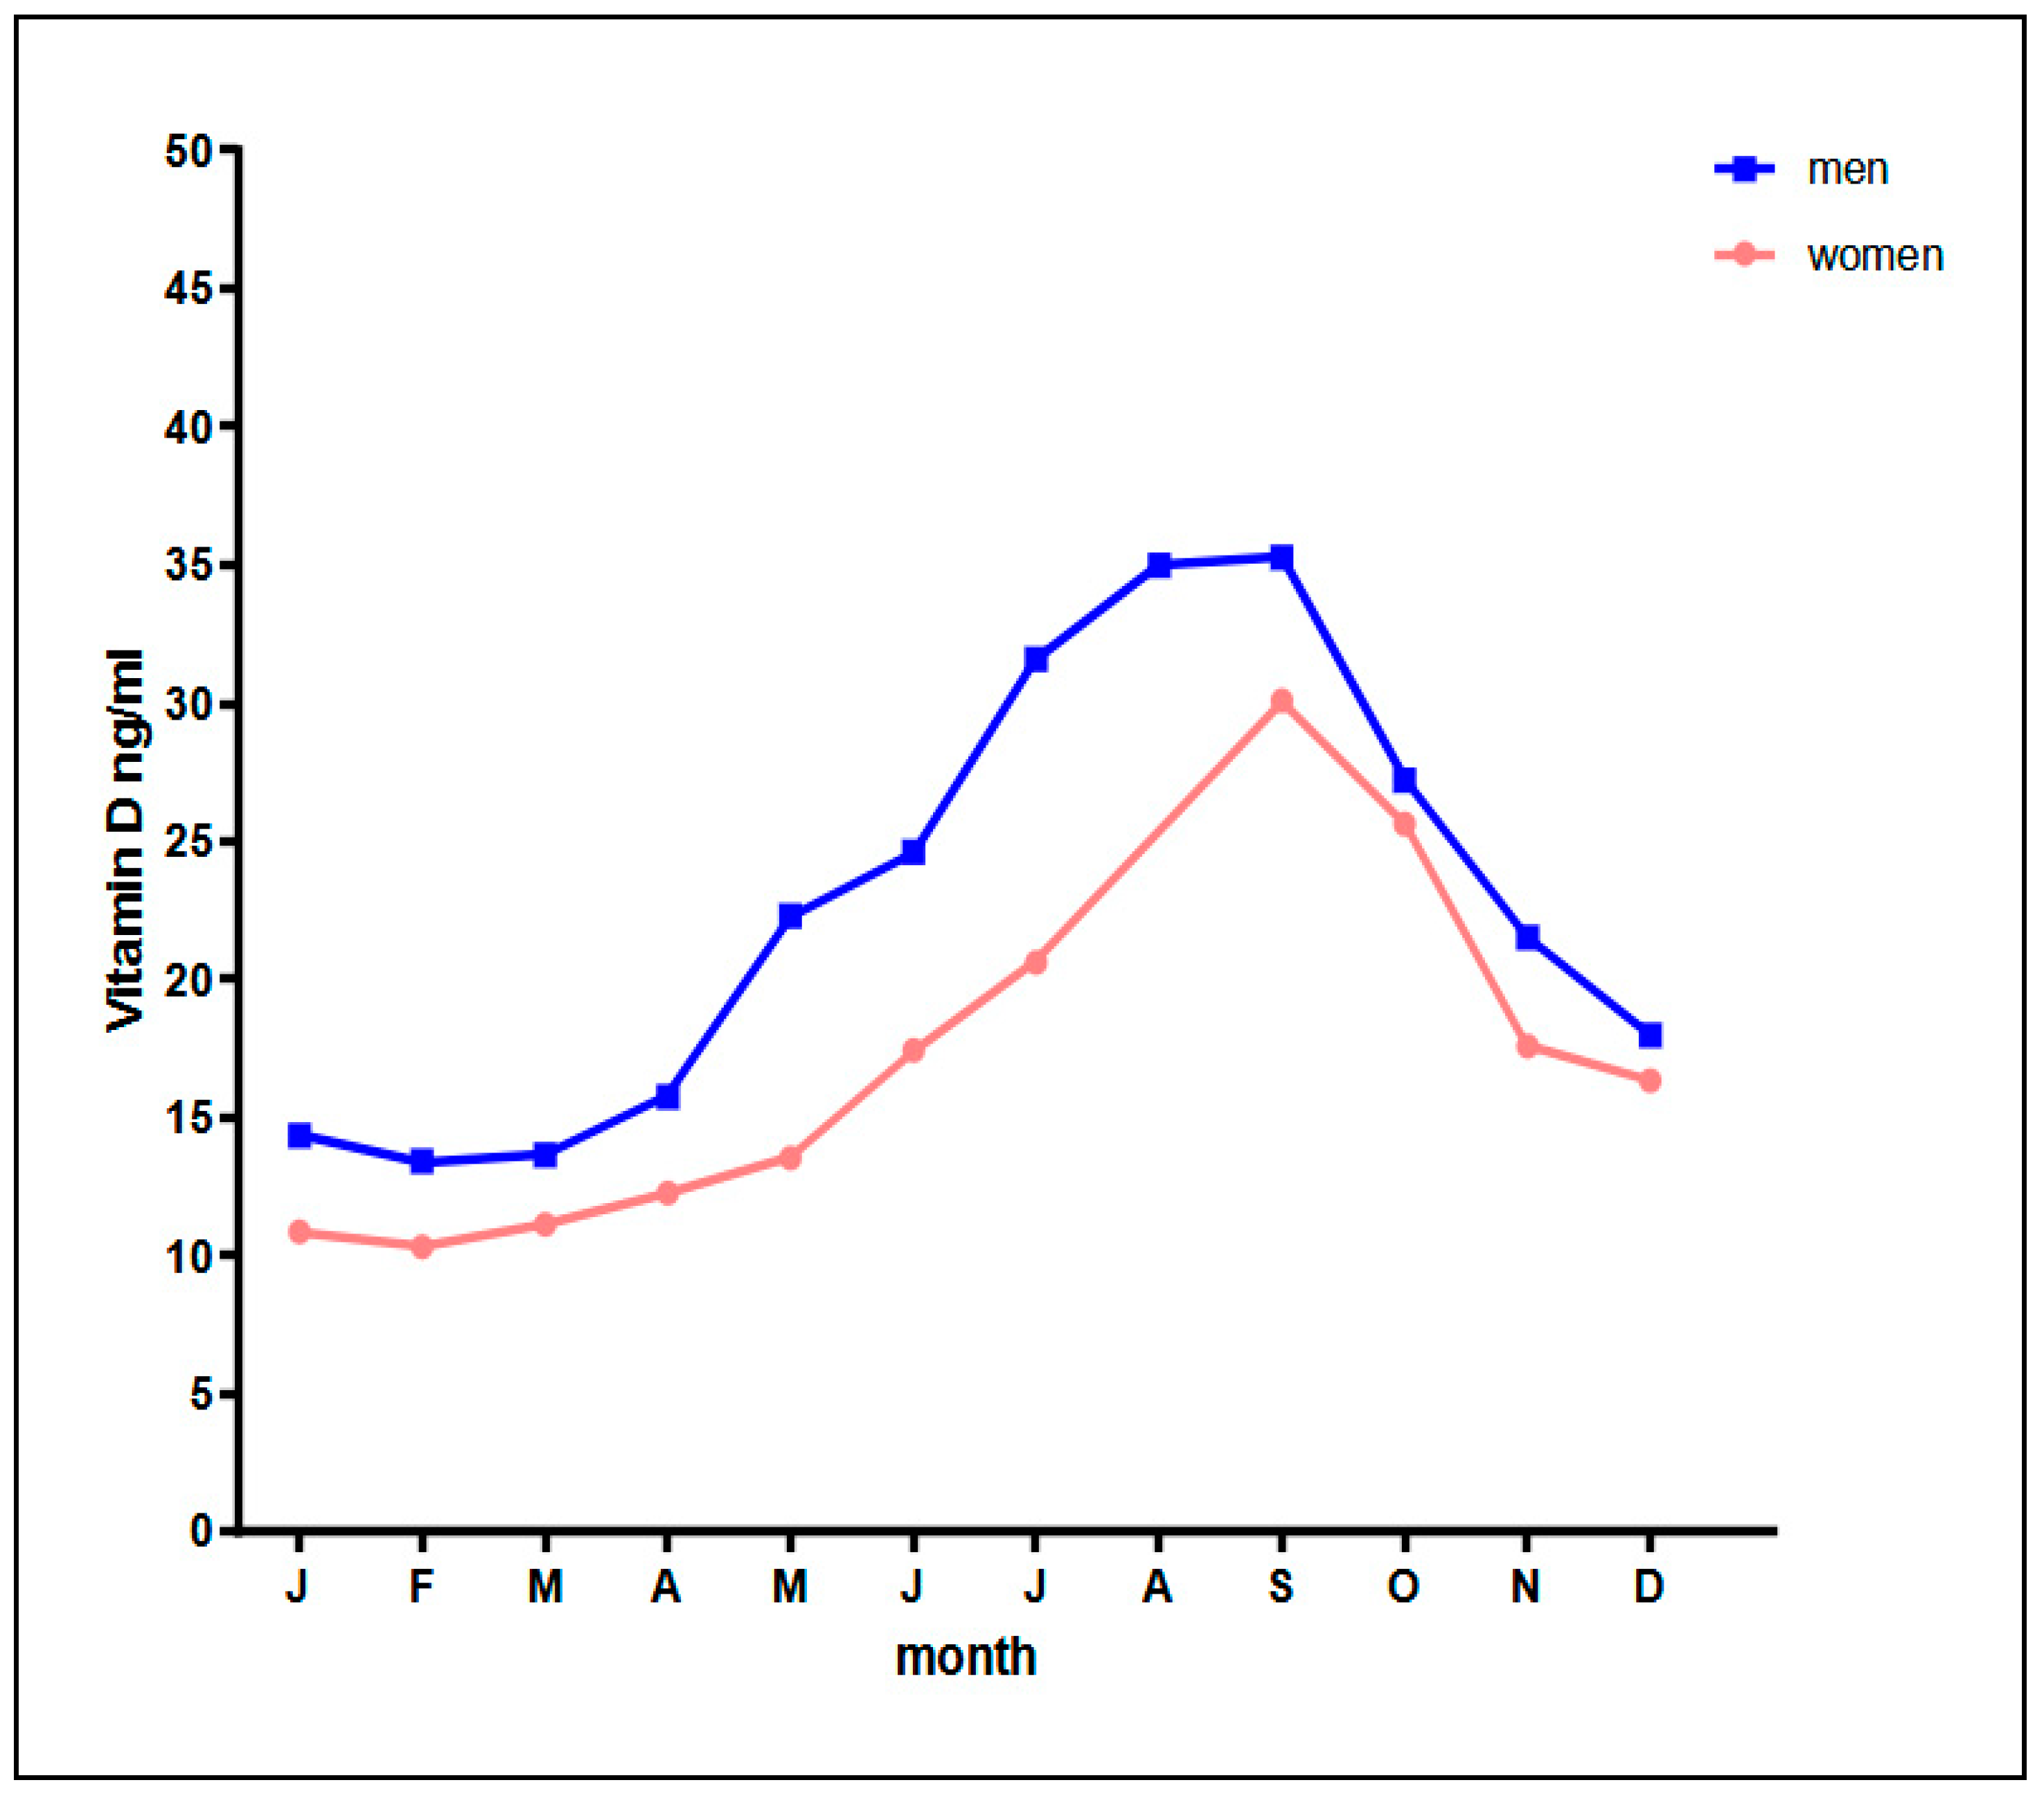
| WOMEN | MEN | |||||||||
|---|---|---|---|---|---|---|---|---|---|---|
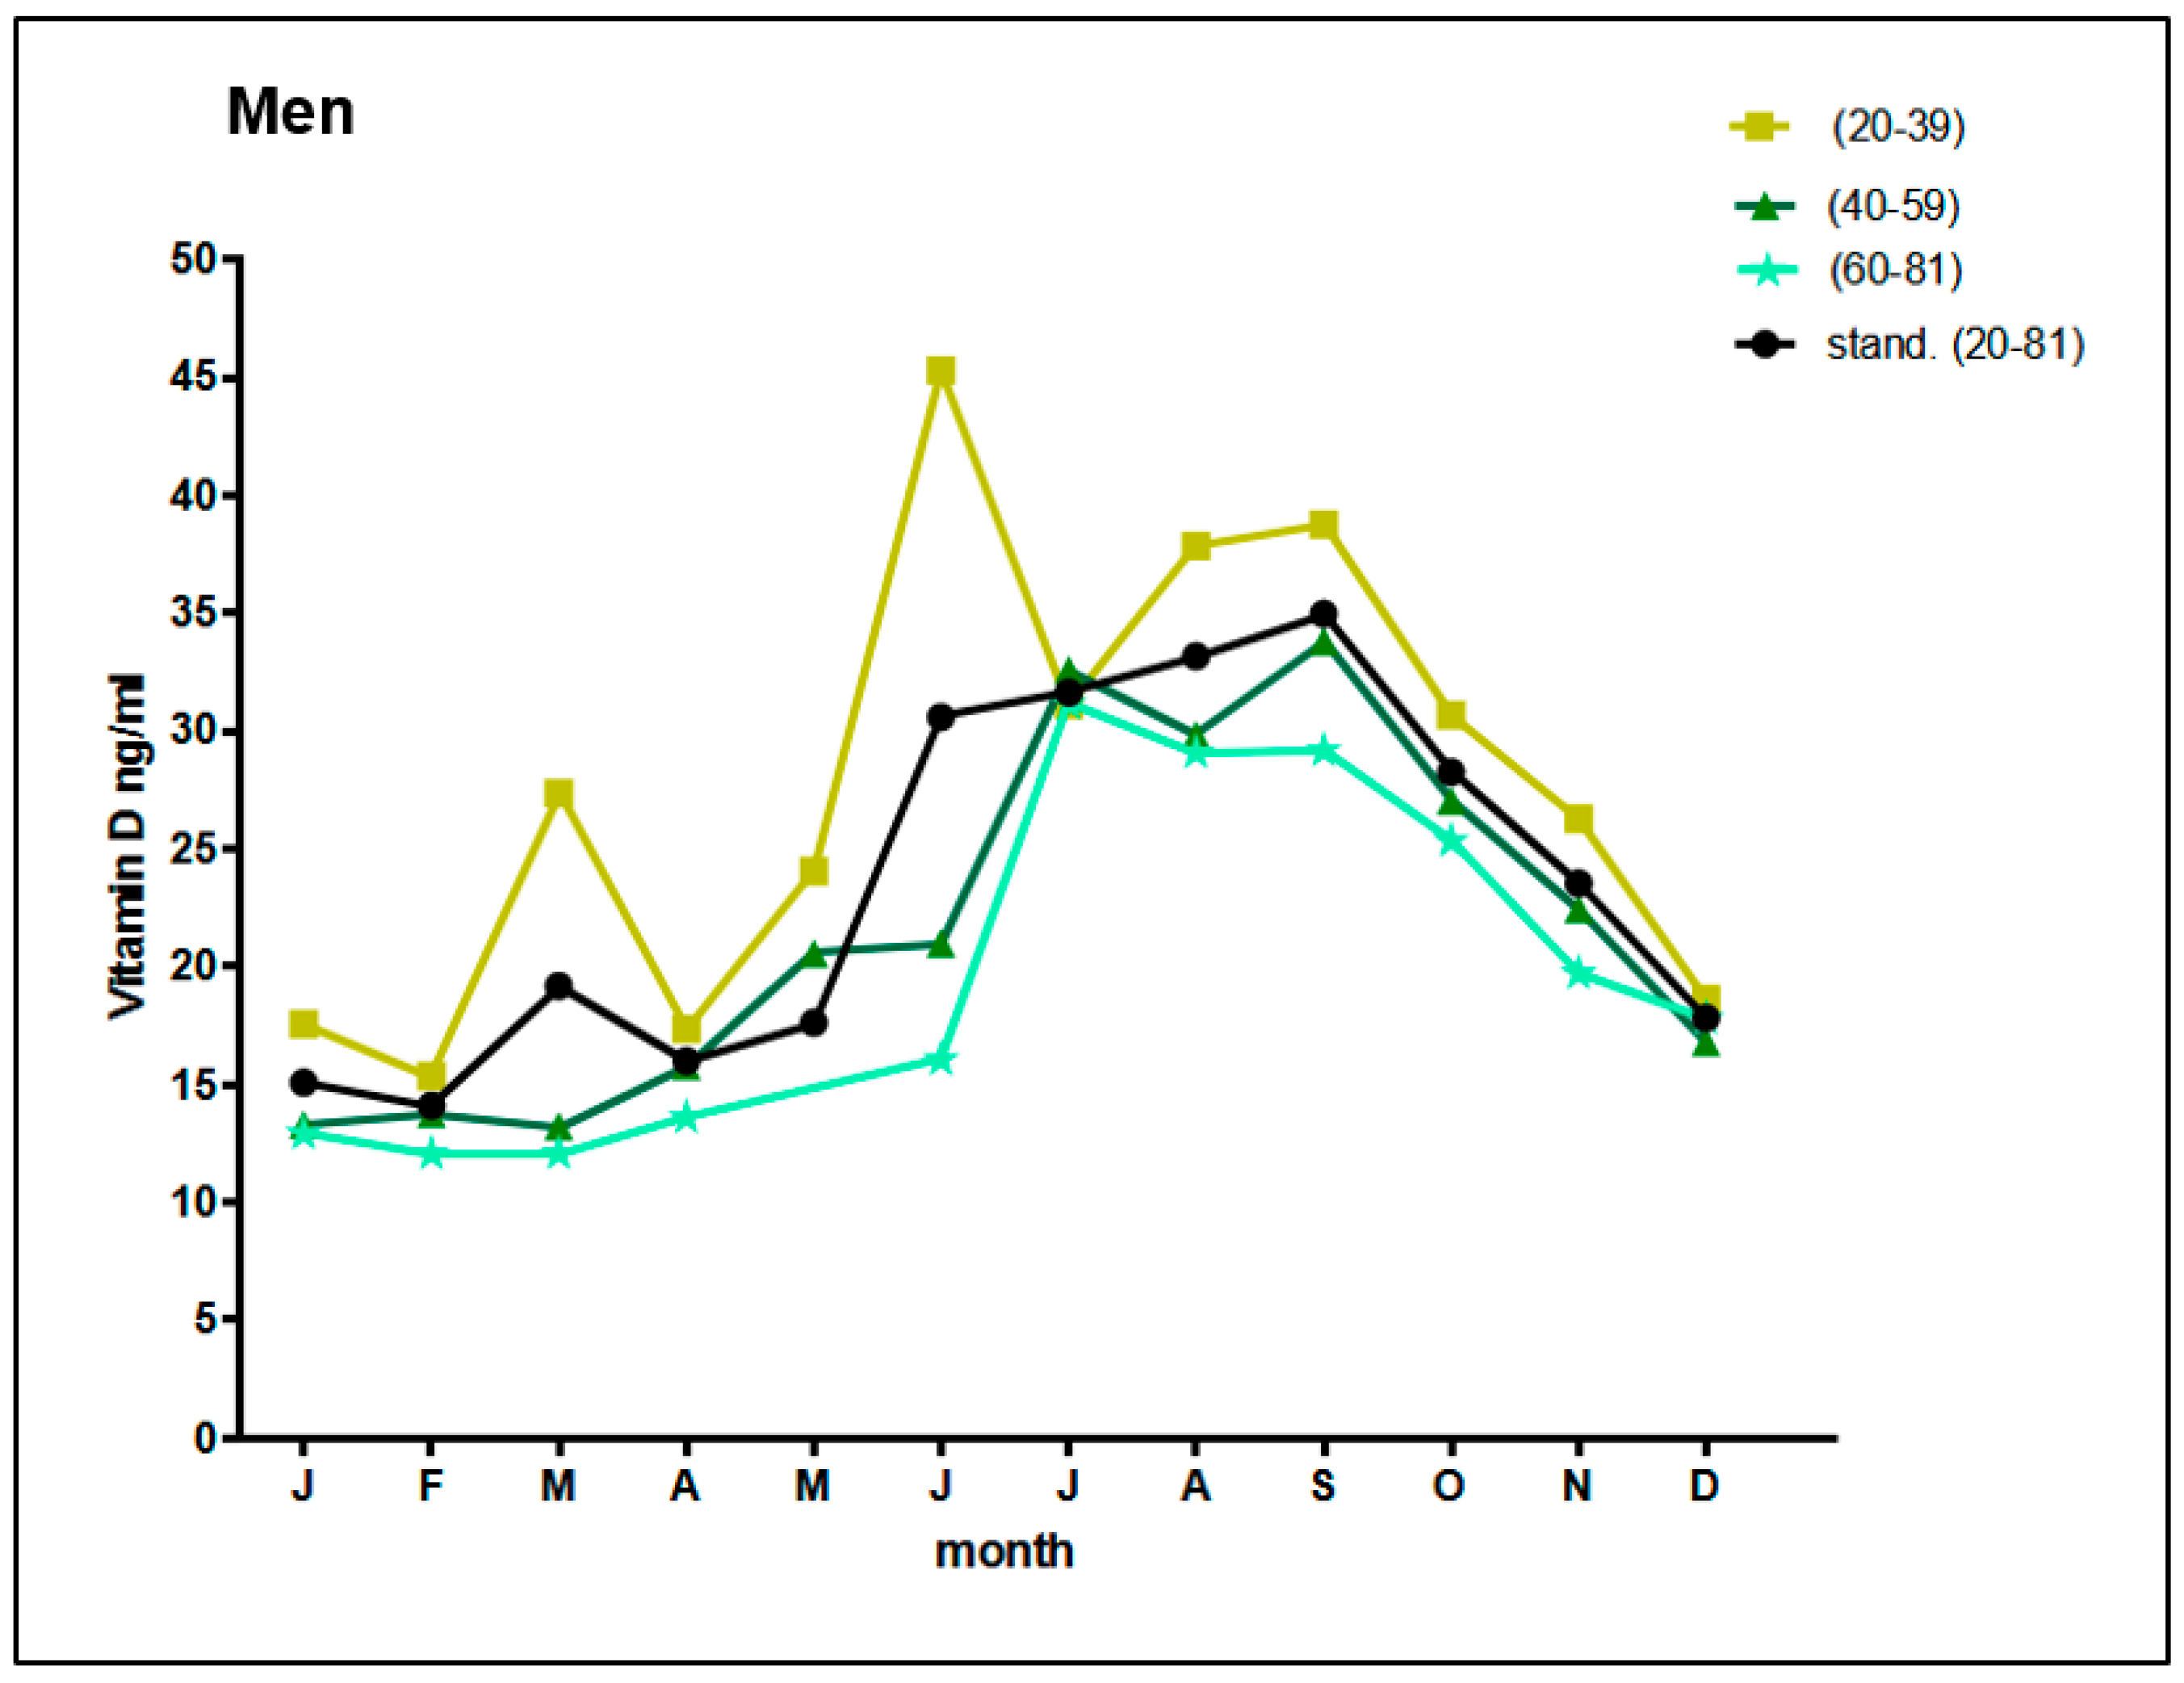
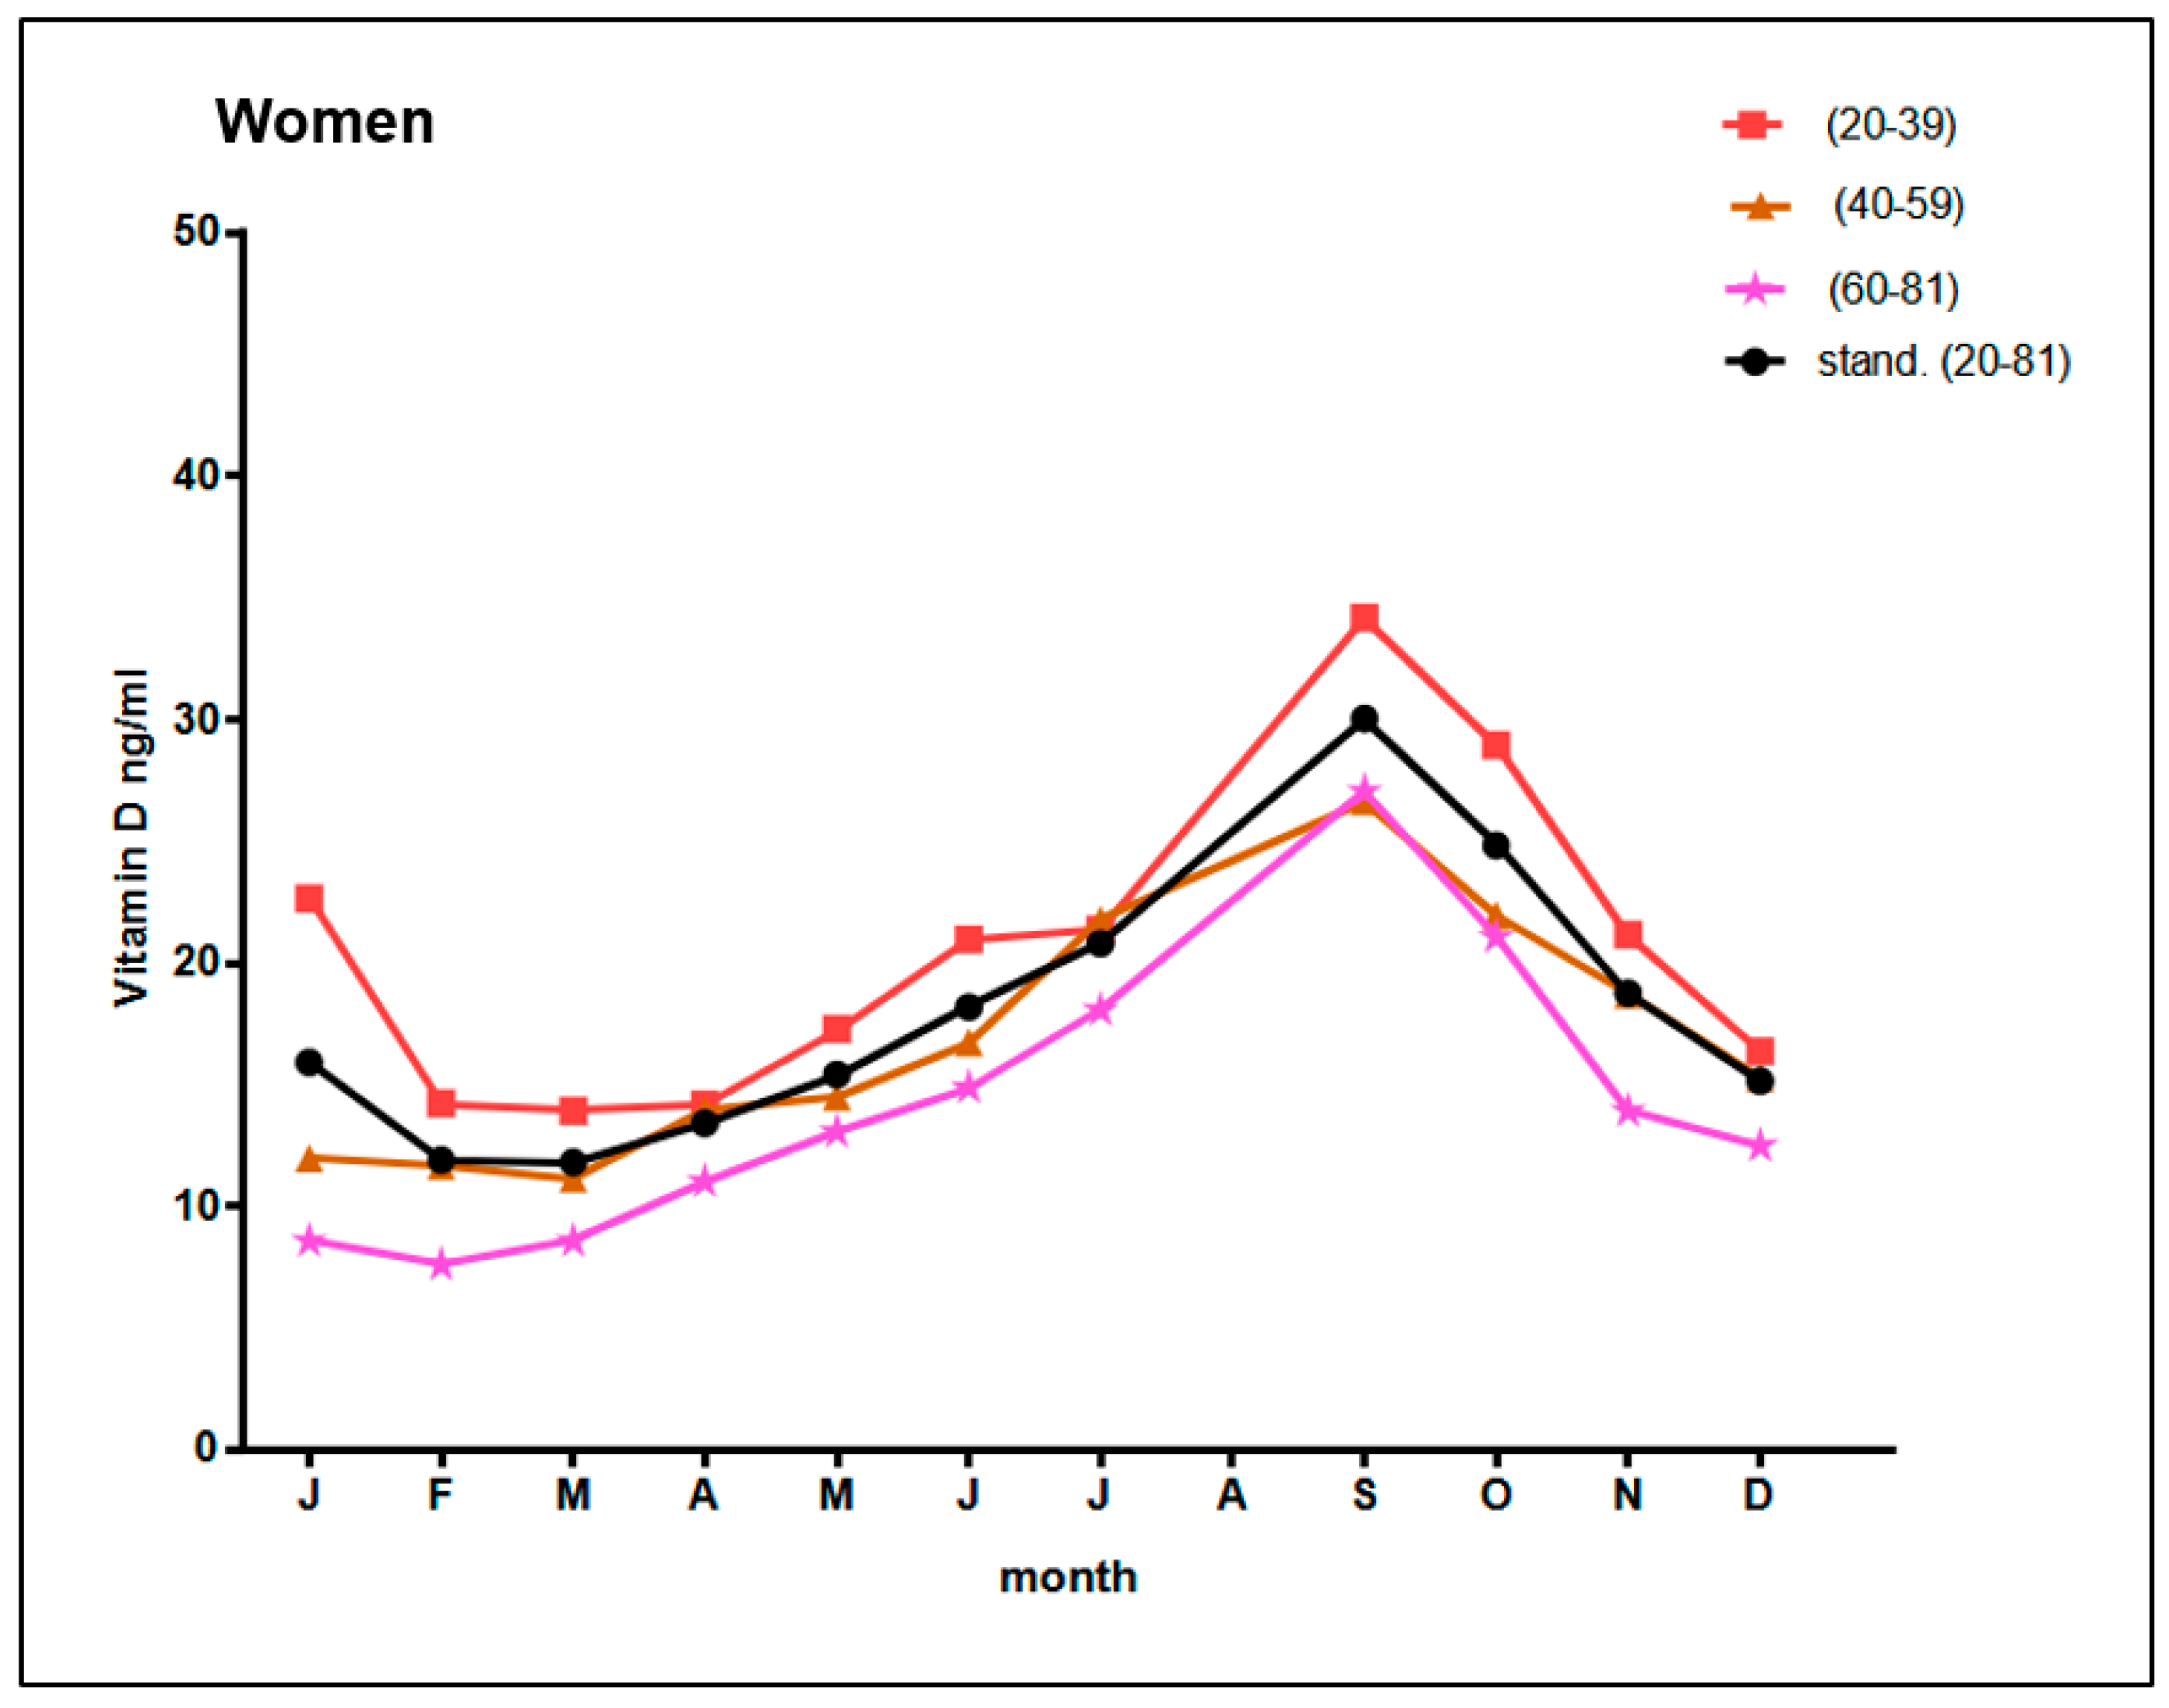
| Month of the Year | n | Mean | SD | 95% CI | n | Mean | SD | 95% CI | ||
| J | 58 | 10.9 | 5.9 | 9.3 | 12.4 | 131 | 14.4 | 6.4 | 13.2 | 15.4 |
| F | 174 | 10.3 | 7.4 | 9.2 | 11.4 | 218 | 13.4 | 6.9 | 12.4 | 14.3 |
| M | 296 | 11.1 | 5.0 | 10.5 | 11.7 | 41 | 13.7 | 7.6 | 11.2 | 16.0 |
| A | 235 | 12.3 | 5.3 | 11.5 | 12.9 | 60 | 15.7 | 6.8 | 13.9 | 17.4 |
| M | 313 | 13.5 | 9.4 | 12.4 | 14.5 | 4 | 22.3 | 6.7 | - | - |
| J | 112 | 17.4 | 6.8 | 16.1 | 18.7 | 4 | 24.6 | 14.9 | - | - |
| J | 122 | 20.6 | 6.5 | 19.4 | 21.9 | 48 | 31.6 | 9.5 | 28.8 | 34.3 |
| A | serum sample not available | 161 | 35.0 | 12.4 | 33.0 | 36.9 | ||||
| S | 254 | 30.1 | 11.1 | 28.7 | 31.4 | 141 | 35.3 | 11.9 | 33.2 | 37.2 |
| O | 223 | 25.6 | 9.4 | 24.3 | 26.8 | 311 | 27.2 | 8.6 | 26.2 | 28.1 |
| N | 385 | 17.6 | 7.2 | 16.8 | 18.3 | 48 | 21.5 | 8.2 | 19.1 | 23.9 |
| D | 102 | 16.3 | 7.5 | 14.8 | 17.8 | 7 | 18.0 | 5.7 | - | - |
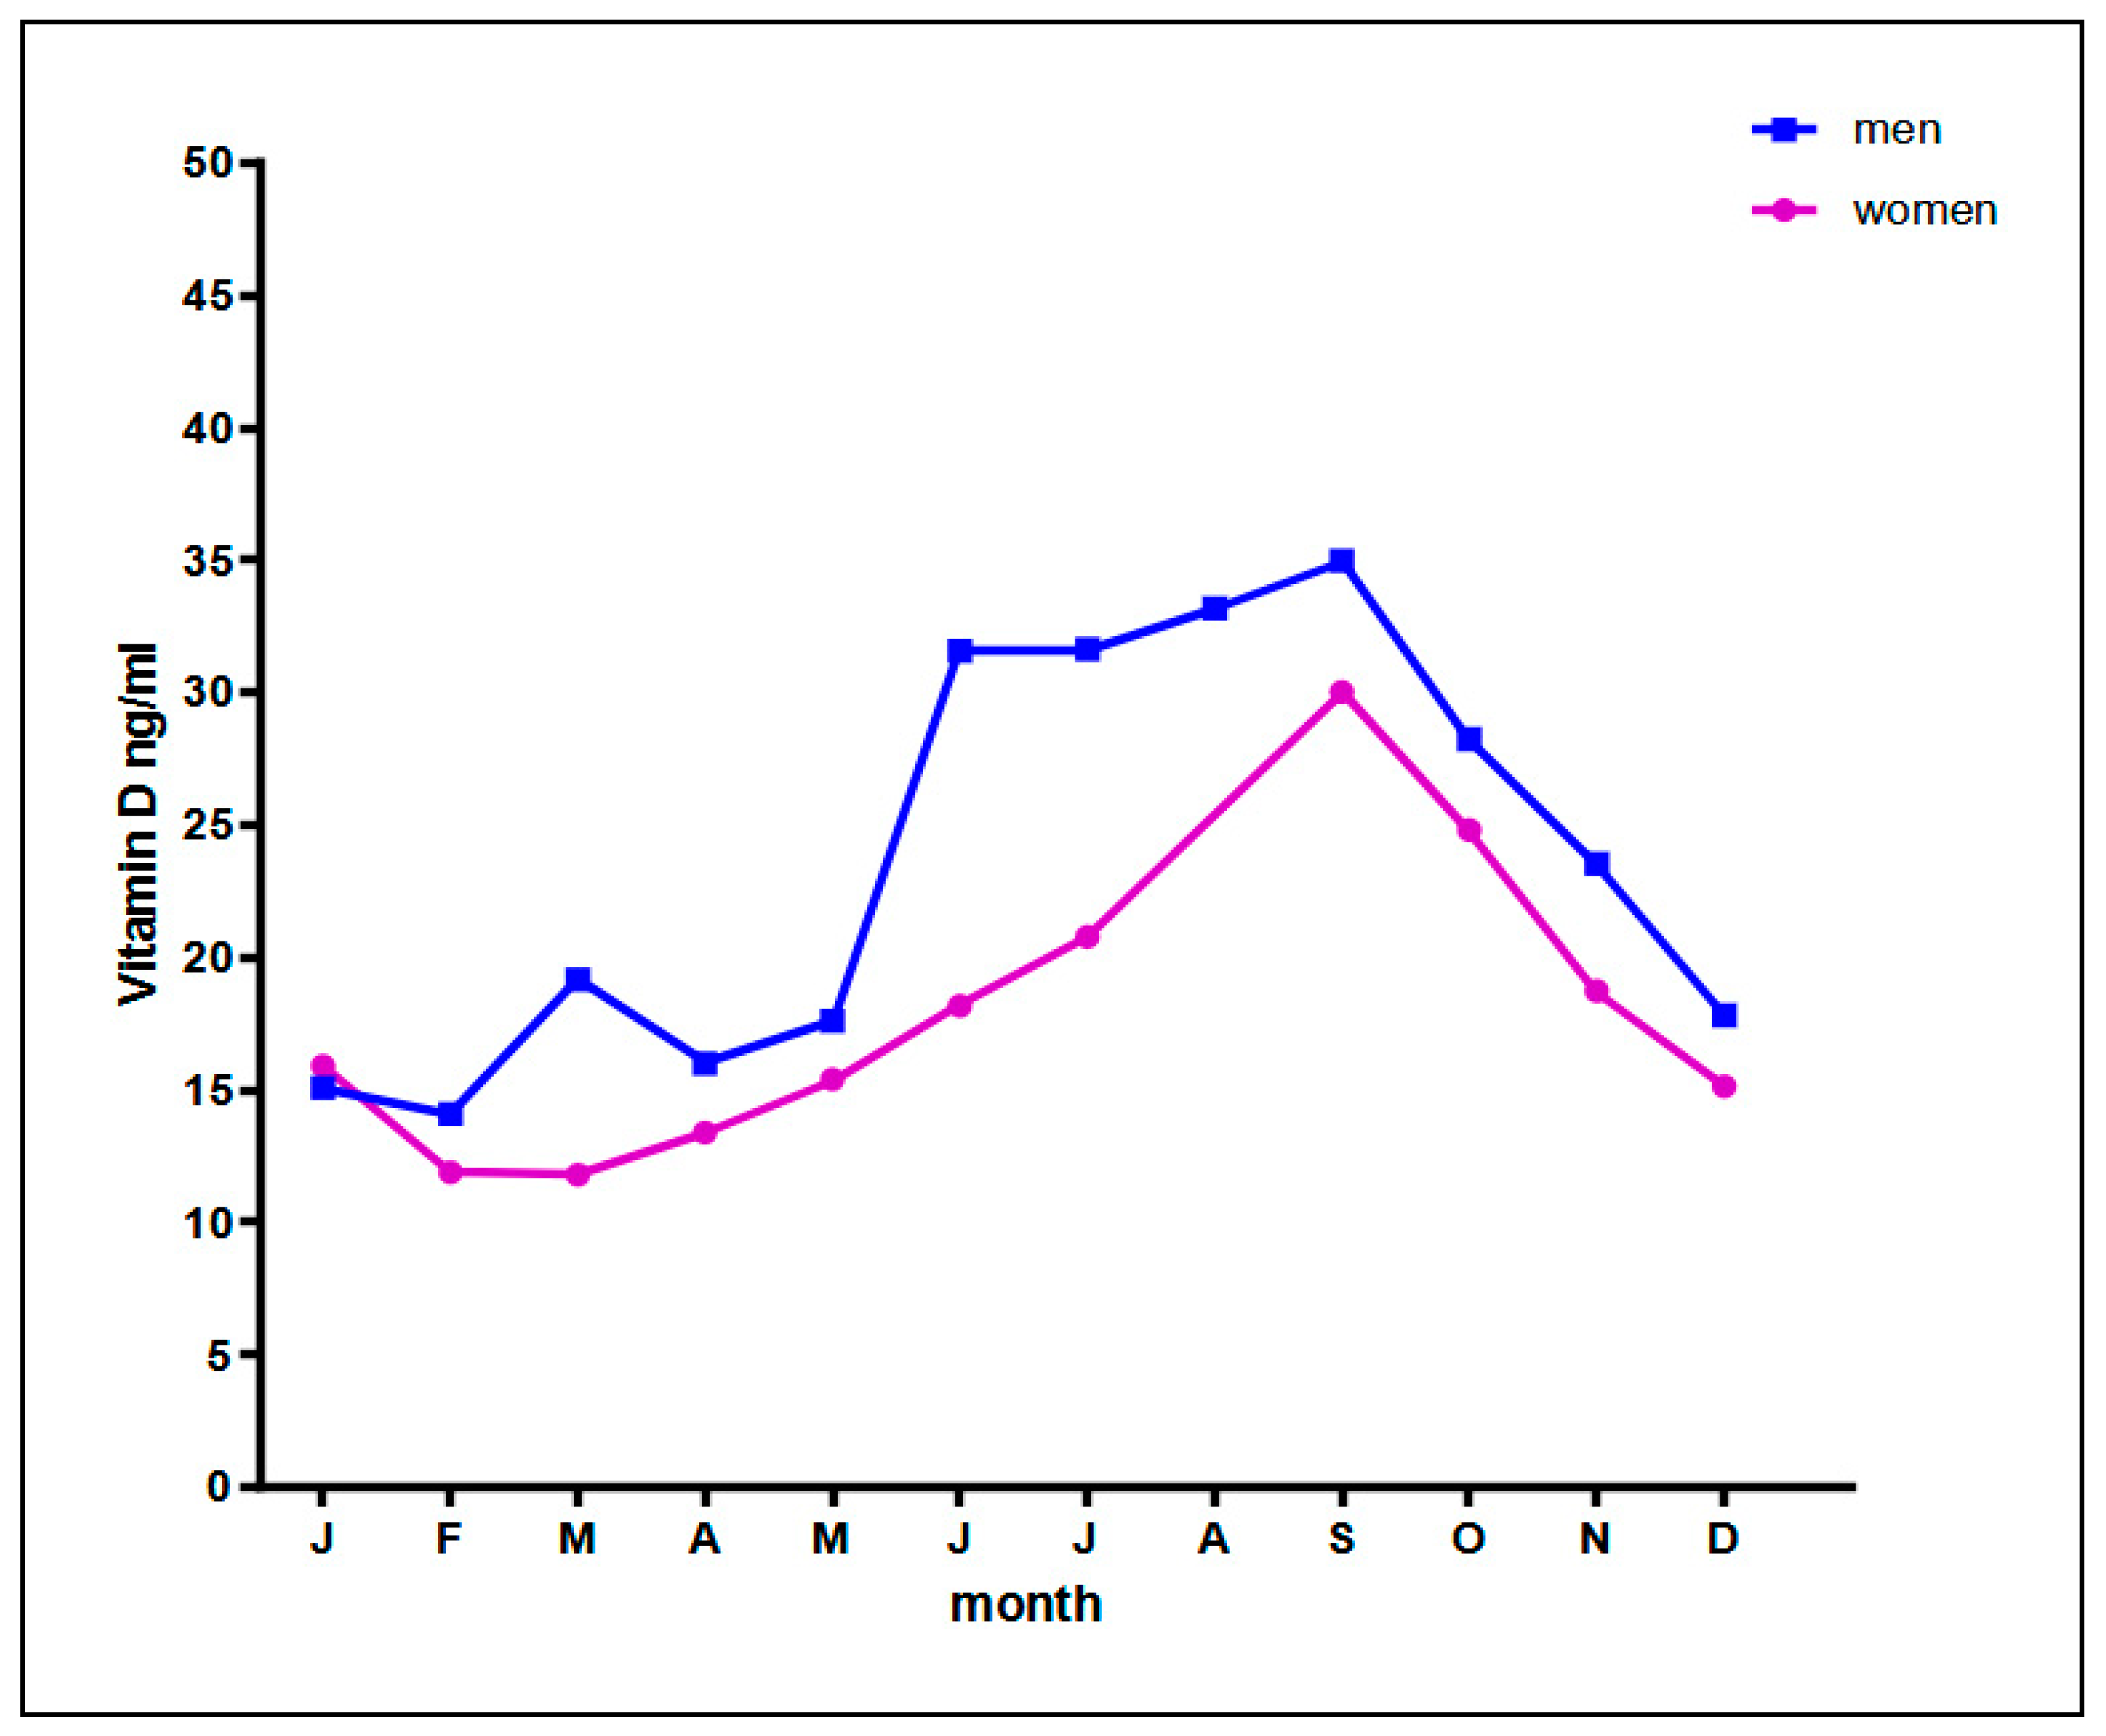
| WOMEN | MEN | |||||||||
|---|---|---|---|---|---|---|---|---|---|---|
| Month of the Year | n | Mean | SD | 95% CI | n | Mean | SD | 95% CI | ||
| J | 58 | 15.9 | 5.3 | 14.5 | 17.3 | 131 | 15.1 | 6.2 | 14.0 | 16.1 |
| F | 174 | 11.9 | 7.4 | 10.8 | 13.0 | 218 | 14.1 | 6.9 | 13.2 | 15.0 |
| M | 296 | 11.8 | 4.6 | 11.3 | 12.3 | 41 | 19.2 | 7.0 | 17.0 | 21.3 |
| A | 235 | 13.4 | 5.3 | 12.7 | 14.1 | 60 | 16.0 | 6.6 | 14.3 | 17.7 |
| M | 313 | 15.4 | 10.1 | 14.3 | 16.5 | 4 | 17.6 | 8.1 | - | - |
| J | 112 | 18.2 | 6.3 | 17.0 | 19.3 | 4 | 31.6 | 27.6 | - | - |
| J | 122 | 20.8 | 6.3 | 19.7 | 21.9 | 48 | 31.6 | 8.8 | 29.1 | 34.1 |
| A | serum sample not available | 161 | 33.2 | 12.0 | 31.3 | 35.0 | ||||
| S | 254 | 30.0 | 10.7 | 28.7 | 31.3 | 141 | 35.0 | 11.9 | 33.0 | 36.9 |
| O | 223 | 24.8 | 8.9 | 23.6 | 26.0 | 311 | 28.2 | 8.3 | 27.3 | 29.2 |
| N | 385 | 18.7 | 6.8 | 18.0 | 19.4 | 48 | 23.5 | 7.9 | 21.3 | 25.8 |
| D | 102 | 15.1 | 7.1 | 13.8 | 16.5 | 7 | 17.8 | 4.9 | - | - |
Publisher’s Note: MDPI stays neutral with regard to jurisdictional claims in published maps and institutional affiliations. |
© 2021 by the authors. Licensee MDPI, Basel, Switzerland. This article is an open access article distributed under the terms and conditions of the Creative Commons Attribution (CC BY) license (https://creativecommons.org/licenses/by/4.0/).
Share and Cite
Morsilli, O.; Guerriero, R.; Palmieri, L.; Lo Noce, C.; Zeller, T.; Blankenberg, S.; Di Lonardo, A.; Vannucchi, S.; Gabbianelli, M.; Donfrancesco, C. Vitamin D Status in a Rural Italian Population. Reports 2022, 5, 1. https://doi.org/10.3390/reports5010001
Morsilli O, Guerriero R, Palmieri L, Lo Noce C, Zeller T, Blankenberg S, Di Lonardo A, Vannucchi S, Gabbianelli M, Donfrancesco C. Vitamin D Status in a Rural Italian Population. Reports. 2022; 5(1):1. https://doi.org/10.3390/reports5010001
Chicago/Turabian StyleMorsilli, Ornella, Raffaella Guerriero, Luigi Palmieri, Cinzia Lo Noce, Tanja Zeller, Stefan Blankenberg, Anna Di Lonardo, Serena Vannucchi, Marco Gabbianelli, and Chiara Donfrancesco. 2022. "Vitamin D Status in a Rural Italian Population" Reports 5, no. 1: 1. https://doi.org/10.3390/reports5010001
APA StyleMorsilli, O., Guerriero, R., Palmieri, L., Lo Noce, C., Zeller, T., Blankenberg, S., Di Lonardo, A., Vannucchi, S., Gabbianelli, M., & Donfrancesco, C. (2022). Vitamin D Status in a Rural Italian Population. Reports, 5(1), 1. https://doi.org/10.3390/reports5010001