


Sixteen Years of Gamma-Ray Discoveries and AGN Observations with Fermi-LAT †


Abstract
1. Introduction
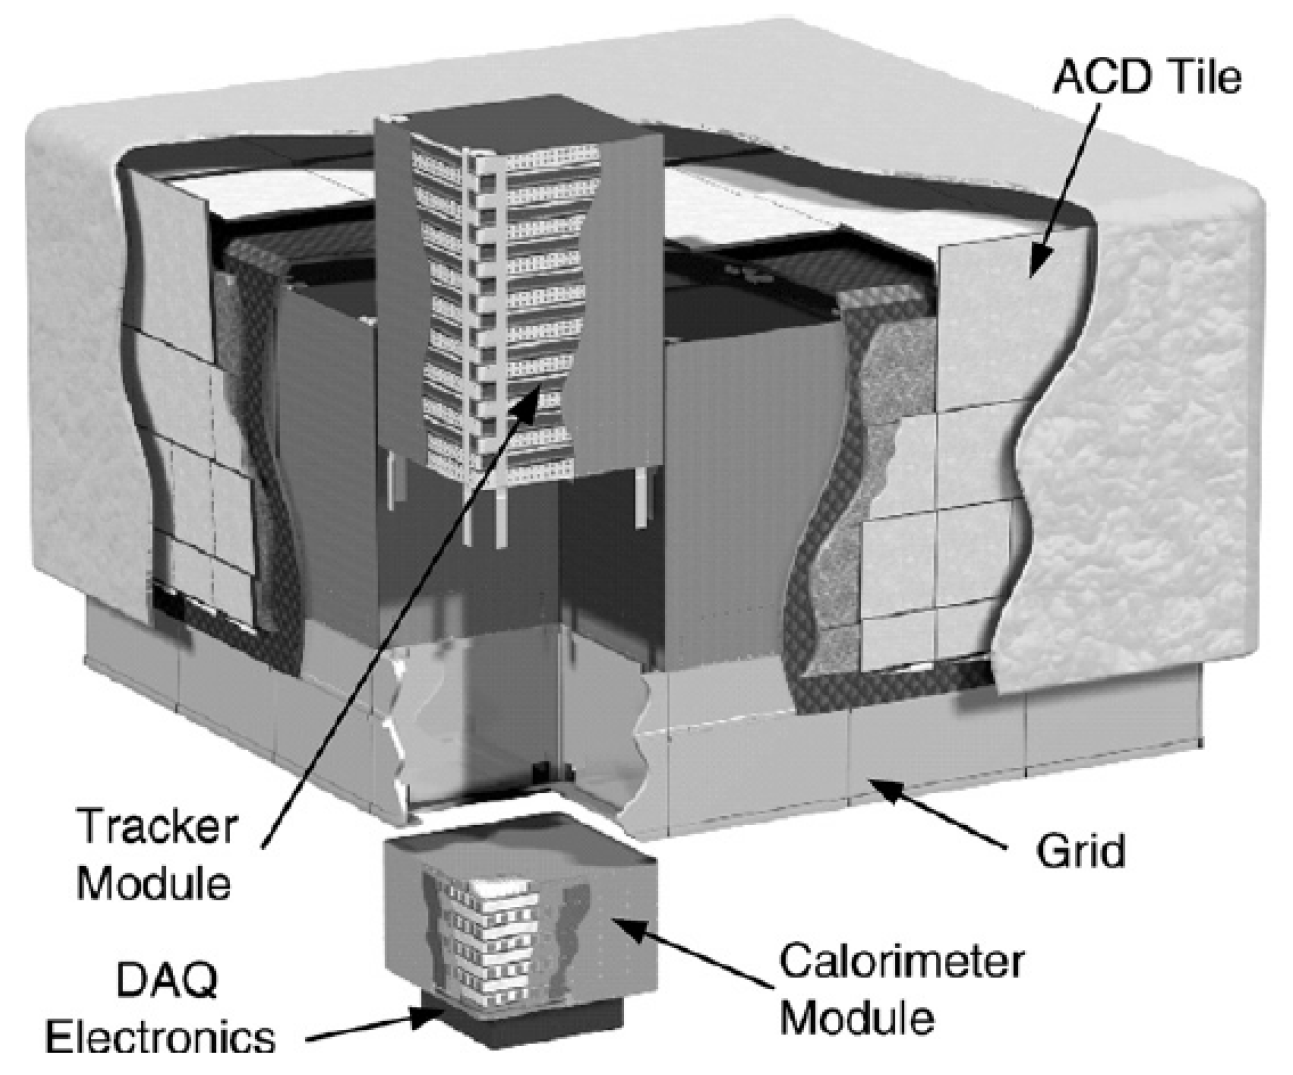
2. The Fermi Large Area Telescope (Fermi-LAT)
3. Selected, Recent, Science Highlights from Fermi-LAT
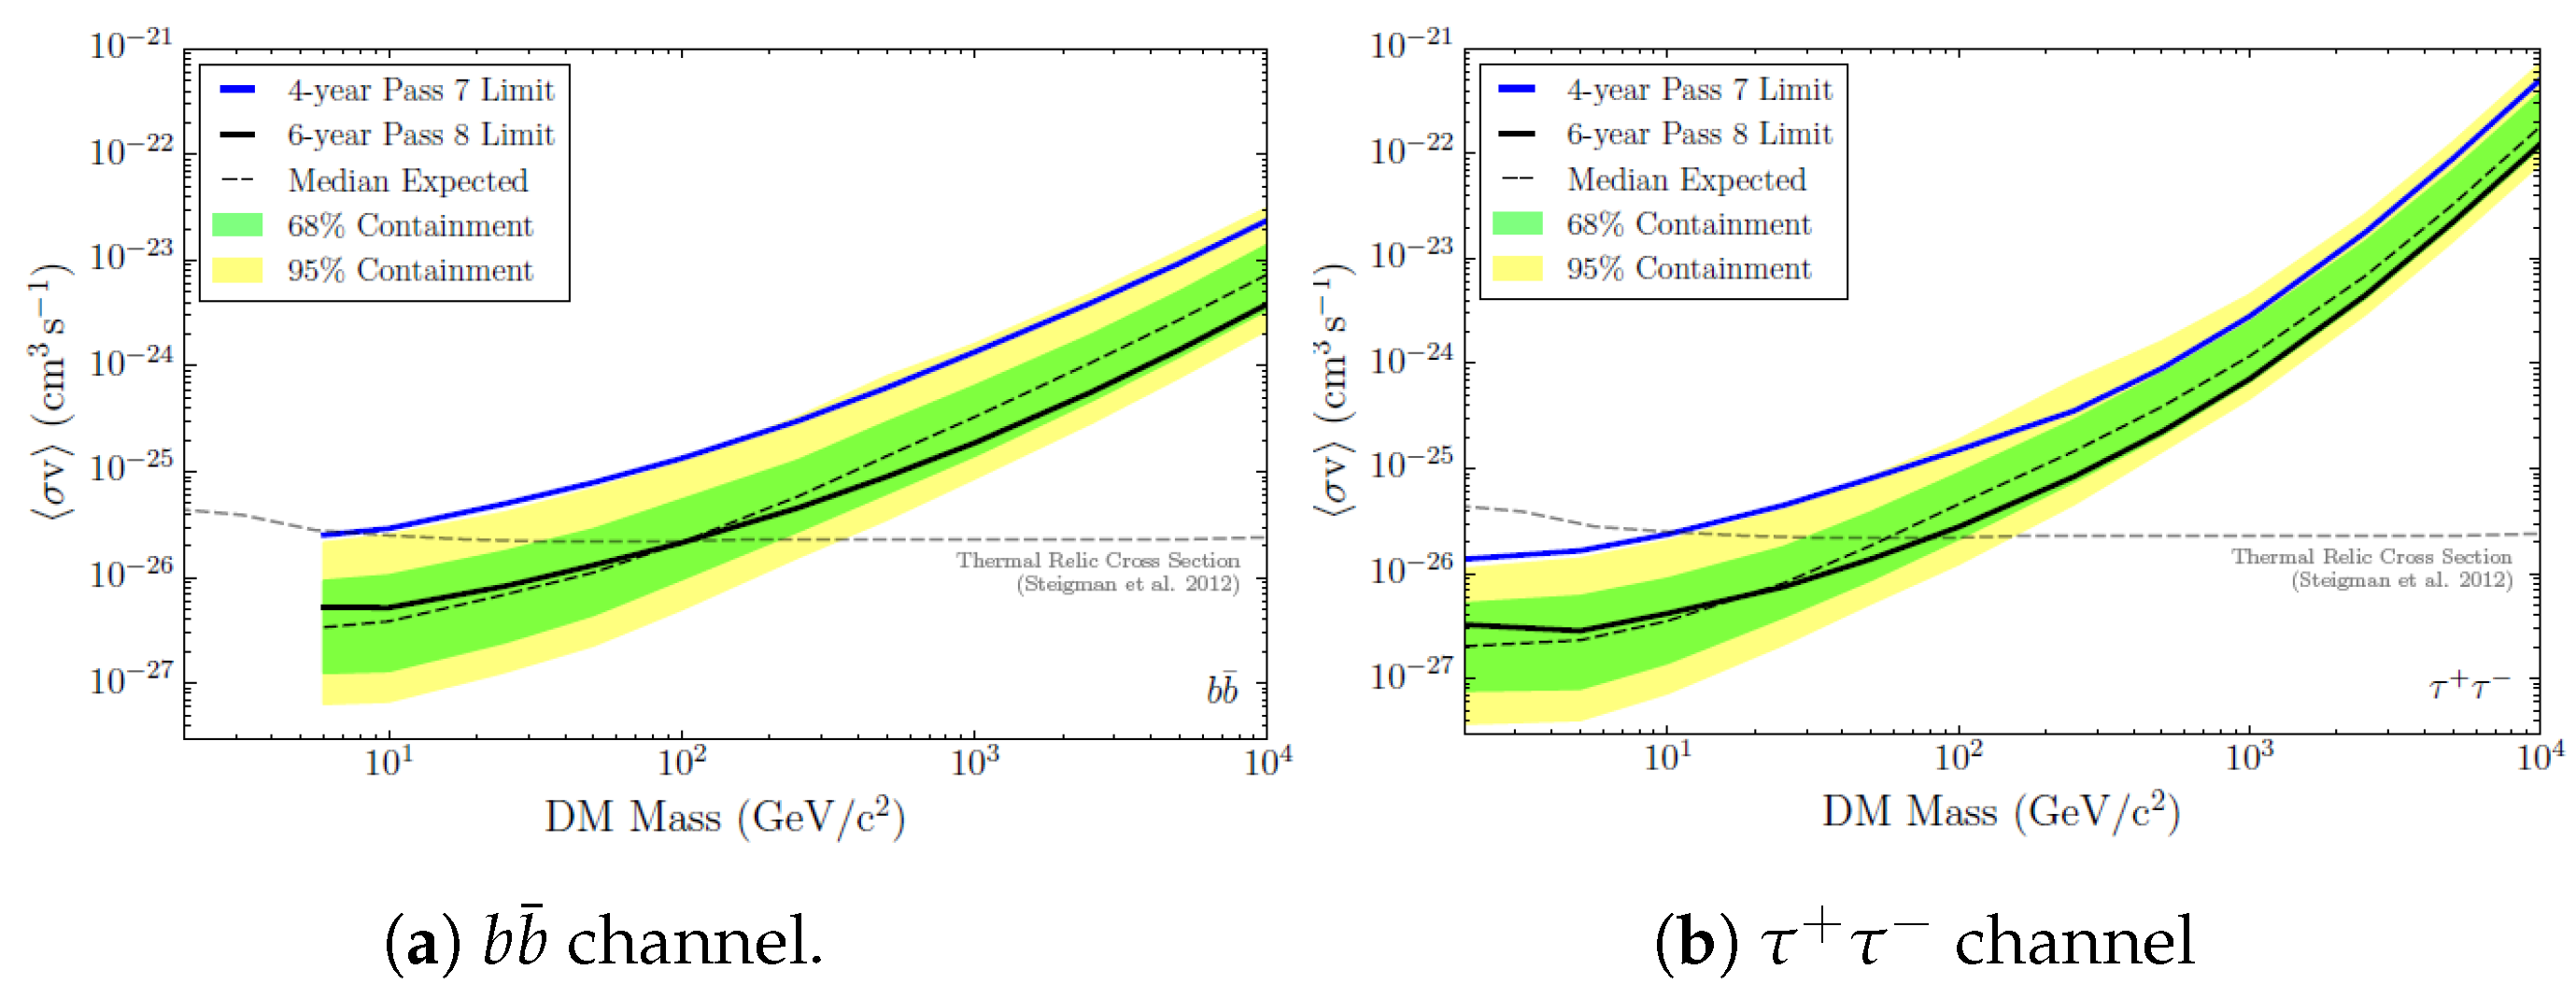
3.1. Indirect DM Search with Fermi-LAT
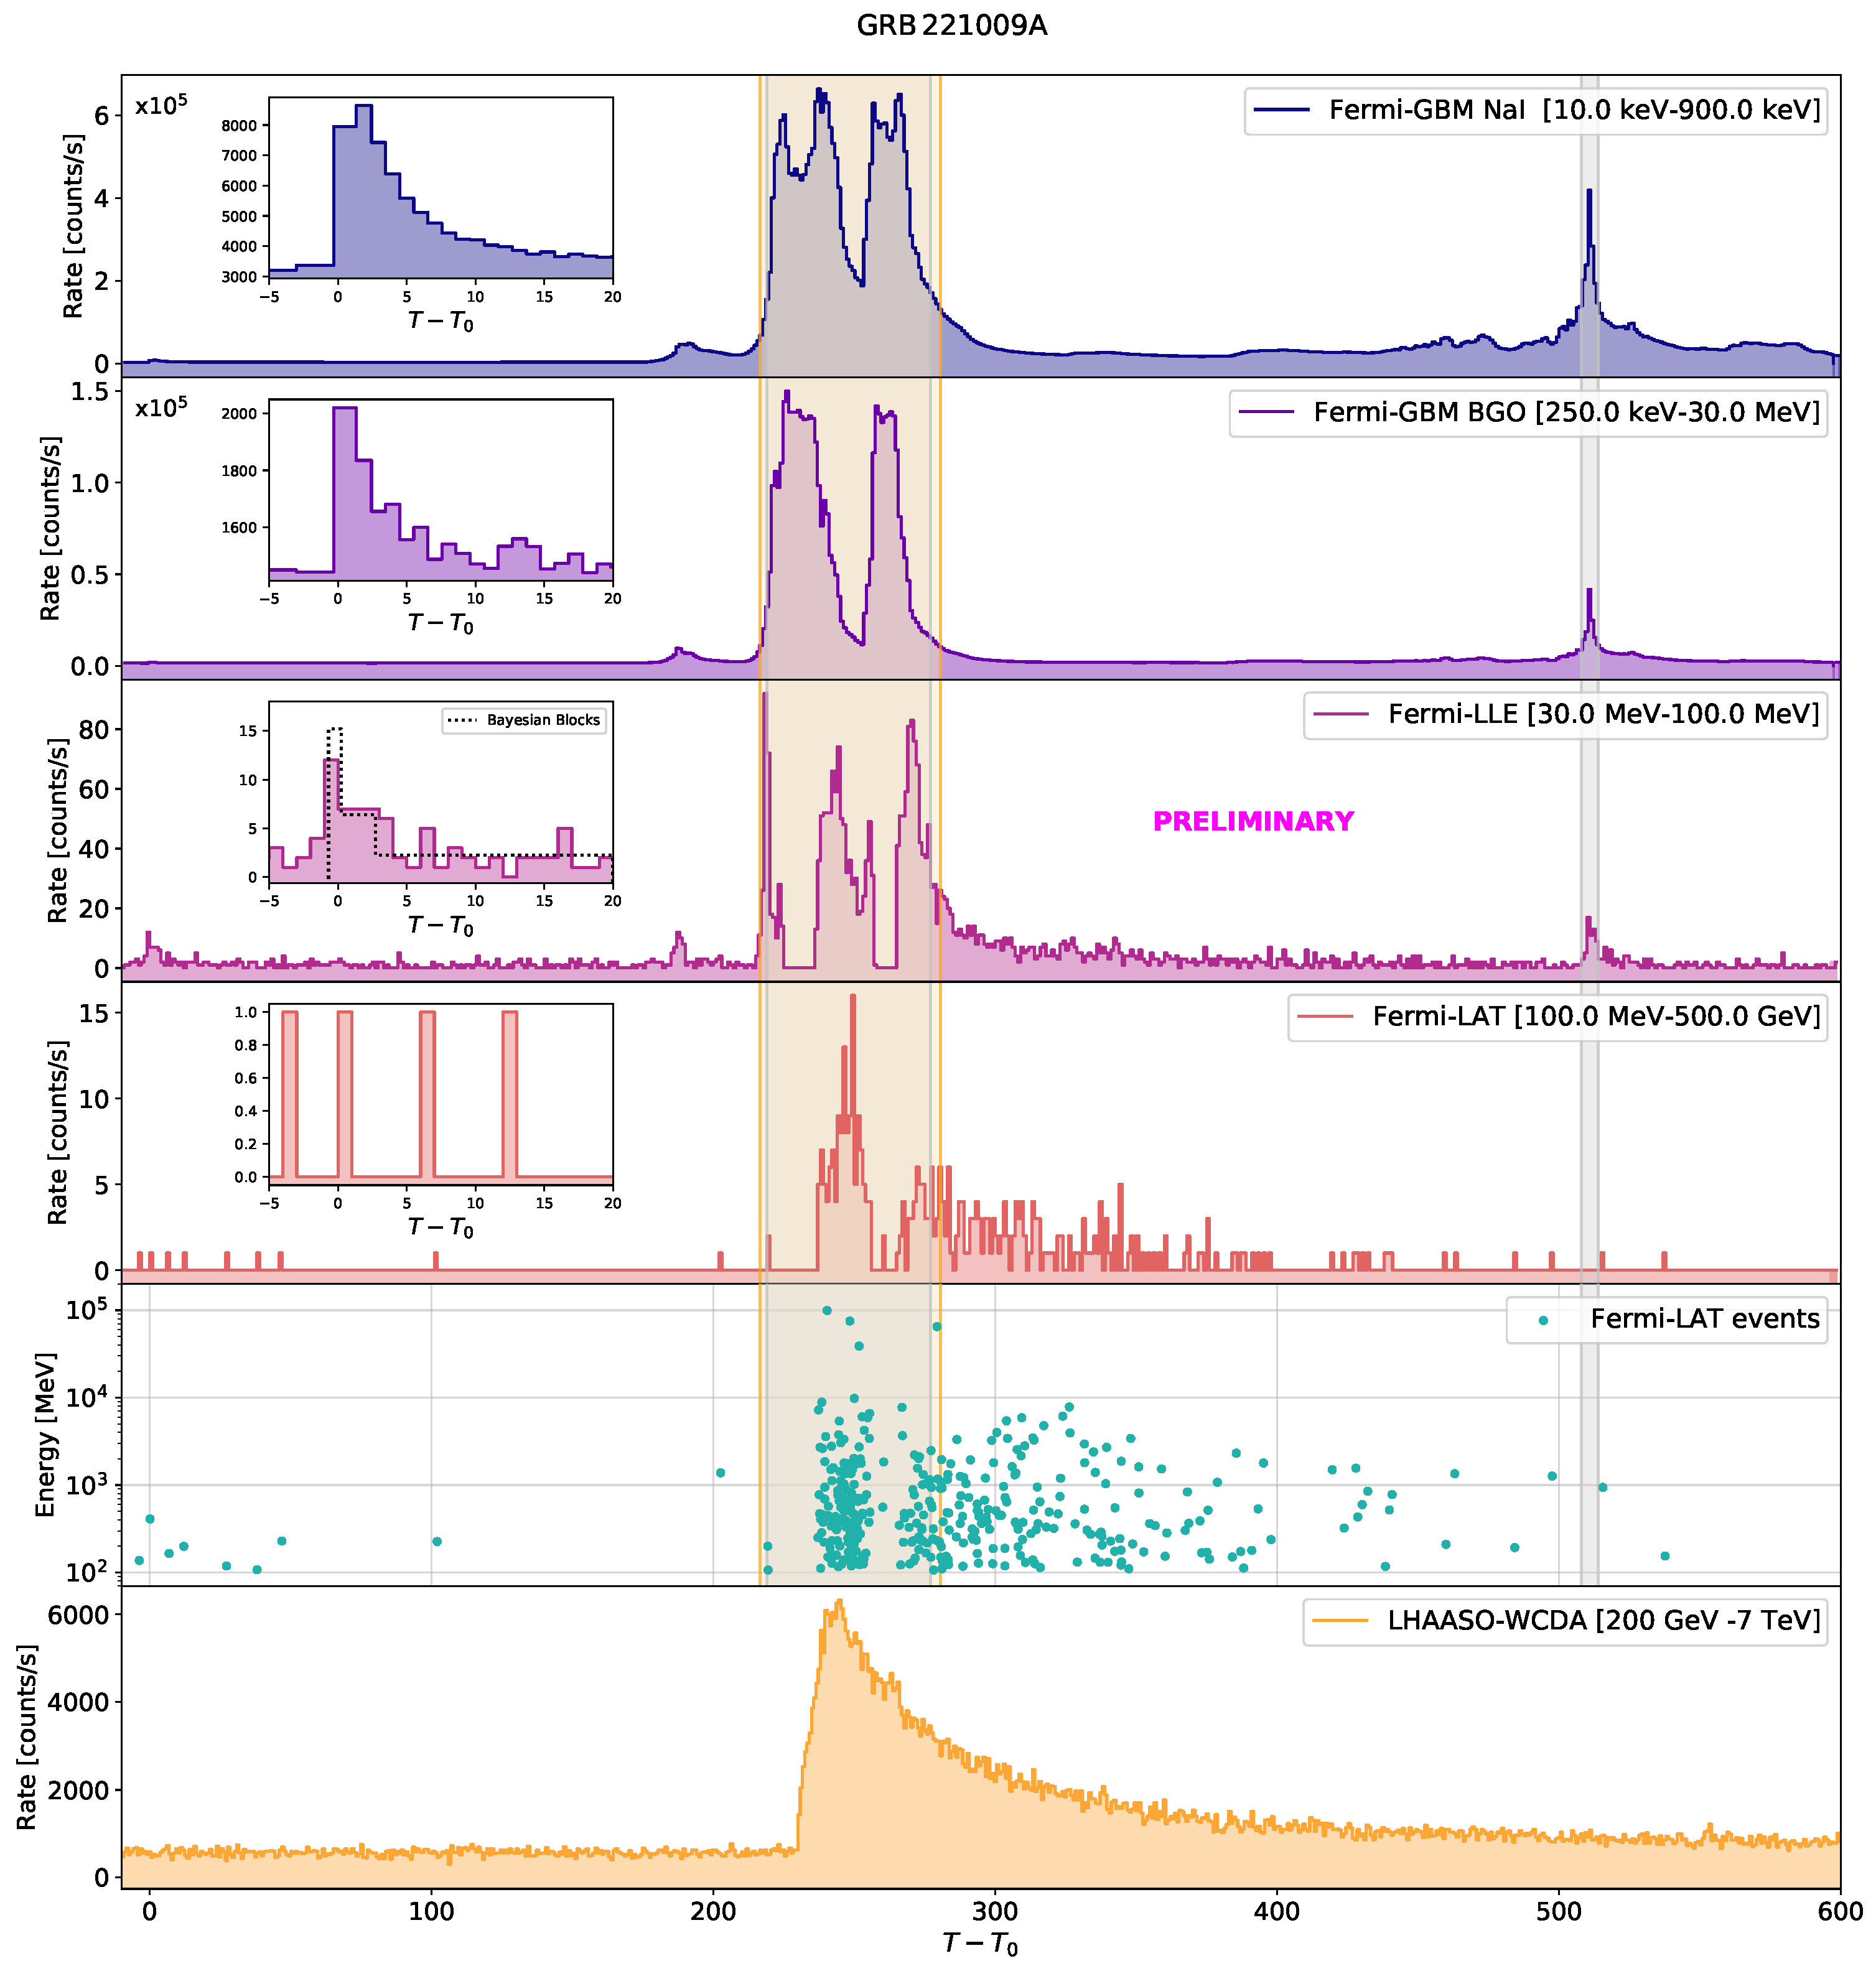
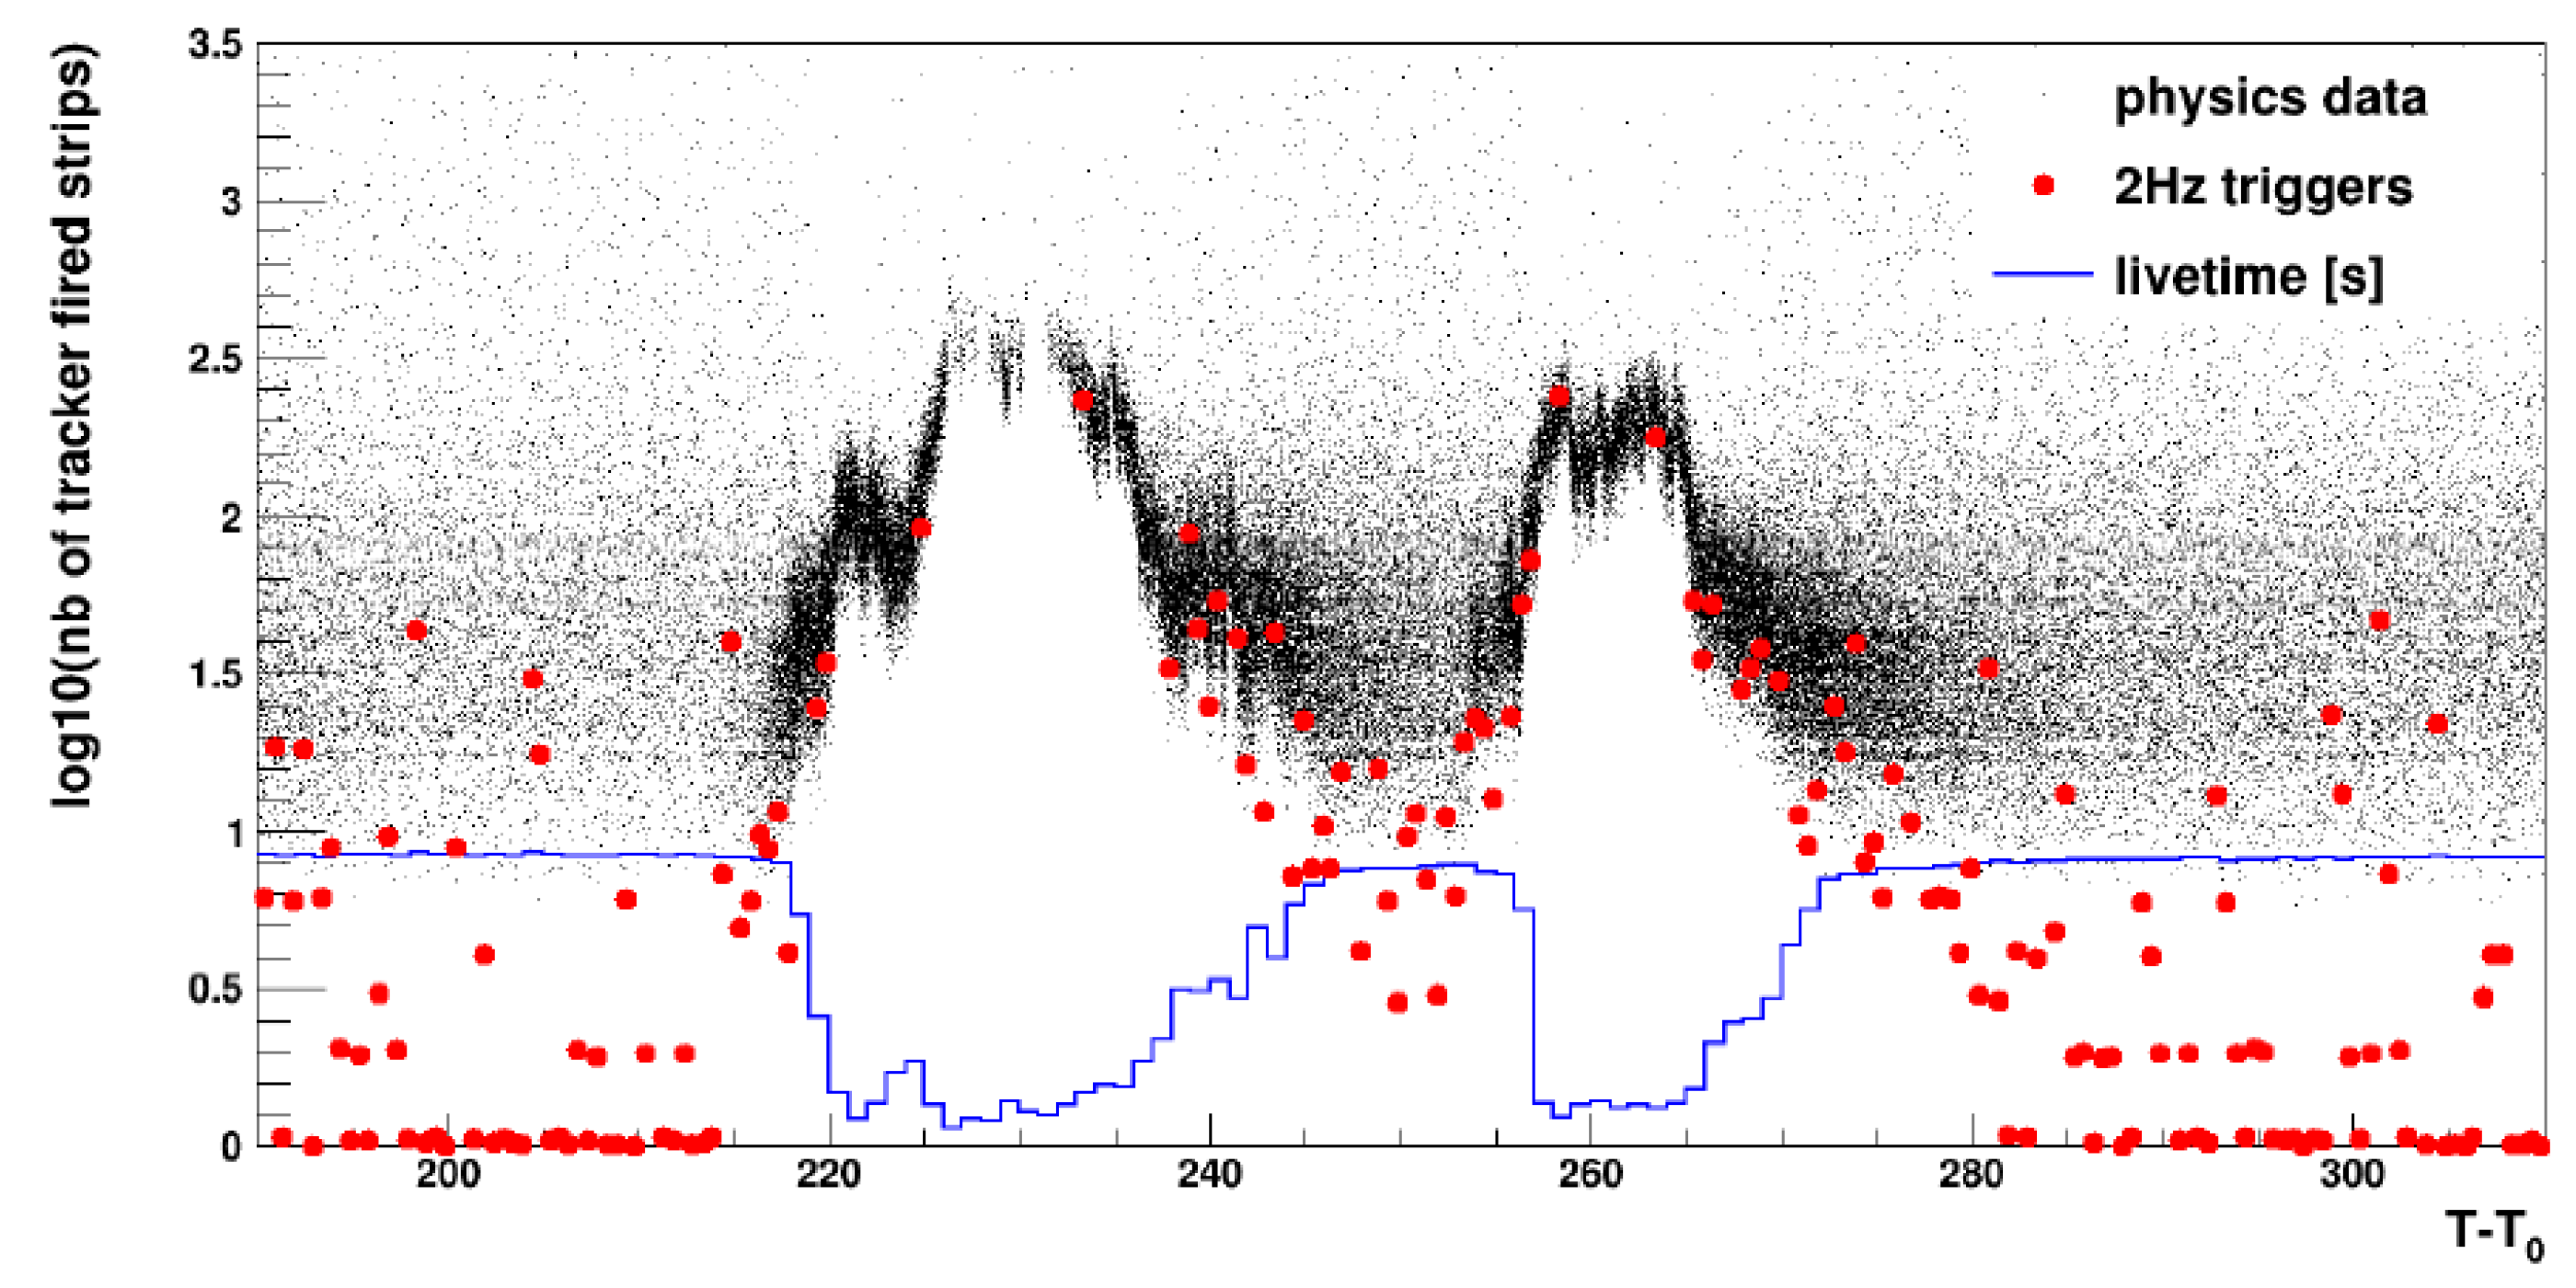
3.2. The Brightest of All Time (BOAT) GRB
3.3. Periodic Modulation of the -Ray Flux of PG 1553+113
4. Fermi-LAT Catalogs
5. The ASI—Space Science Data Center (ASI-SSDC)
Fermi-LAT at ASI-SSDC
6. Conclusions
Author Contributions
Funding
Data Availability Statement
Acknowledgments
Conflicts of Interest
Abbreviations
| 4FGL | Fermi large area telescope fourth catalog |
| 4FGL-DR3 | 4FGL-data release 3 |
| 4FGL-DR4 | 4FGL-data release 4 |
| ACD | anti-coincidence detector |
| AGN | Active Galactic Nucleus |
| AI | artificial intelligence |
| ALP | Axion-Like Particle |
| ALPSII | Any Light Particle Search II |
| AMEGO | All-sky Medium Energy Gamma-ray Observatory |
| ASI | Agenzia Spaziale Italiana |
| ASI-SSDC | ASI—Space Science Data Center |
| ASTRI | Astrofisica con Specchi a Tecnologia Replicante Italiana |
| BAT | Burst Alert Telescope |
| BOAT | Brightest of All Time |
| BNO | Baksan Neutrino Observatory |
| BTI | bad time interval |
| CAL | caloremeter |
| CSN2 | Commissione Scientifica Nazionale 2 |
| CTA | Čerenkov Telescope Array |
| CL | confidence level |
| COSI | Compton Spectrometer and Imager |
| CR | Cosmic Ray |
| DAQ | data acquisition |
| DM | dark matter |
| DR3 | data release 3 |
| dSph | dwarf spheroidal galaxy |
| EAS | extensive air shower |
| EBL | extragalactic background light |
| ESA-ESRIN | ESA—European Space Research Institute |
| Fermi-GBM | Fermi Gamma-ray Burst Monitor |
| Fermi-LAT | Fermi Large Area Telescope |
| FGST | Fermi Gamma-Ray Space Telescope |
| FODA | Fermi-LAT online data analysis |
| FRED | fast rise exponential decay |
| GCE | galactic center excess |
| GRB | Gamma-Ray Burst |
| IAXO | International Axion Observatory |
| ICNFP | International Conference on New Frontiers in Physics |
| IMBH | intermediate-mass black holes |
| IT | information technology |
| INAF | Istituto Nazionale di Astrofisica |
| INFN | Istituto Nazionale di Fisica Nucleare |
| IRF | Instrument Response Functions |
| ISOC | Instrument Science Operation Center |
| IT | information technology |
| IXPE | Imaging X-ray Polarimetry Explorer |
| KAIT | Katzman Automatic Imaging Telescope |
| LIV | lorentz invariance violation |
| LLE | LAT low energy |
| LHAASO | Large High Altitude Air Shower Observatory |
| LP | log-parabola |
| MMIA | multi-mission interactive archive |
| NASA-KSC | Cape Canaveral Kennedy Space Center |
| NFW | Navarro-Frenk-White |
| NGSO | Neil Gehrels Swift observatory |
| NGXP | Next Generation X-ray Polarimeter |
| OVRO | Owens valley radio observatory |
| PMT | photo-multiplier tube |
| PTA | pulsar timing array |
| quasar | quasi-stellar radio source |
| QPO | quasi-periodic oscillation |
| ROI | region of interest |
| SMBH | super massive black hole |
| SSC | synchrotron self-compton |
| SED | spectral energy distribution |
| SKA | Square Kilometre Array |
| SSD | silicon strip detector |
| SRT | Sardinia Radio Telescope |
| Swift-BAT | Swift Burst Alert Telescope |
| ToO | target of opportunity |
| TKR | tracker |
| TS | test statistic |
| UL | upper limit |
| UTC | coordinated universal time |
| UV | ultra violet |
| UVOT | ultraviolet and optical telescope |
| VHE | very high energy |
| WIMP | weakly interacting massive particle |
| XRT | X-ray telescope |
References
- Abdollahi, S.; Baldini, L.; Barbiellini, G.; Bellazzini, R.; Berenji, B.; Bissaldi, E.; Blandford, R.D.; Bonino, R.; Bruel, P.; Buson, S.; et al. Periodic Gamma-Ray Modulation of the Blazar PG 1553+113 Confirmed by Fermi-LAT and Multiwavelength Observations. Astrophys. J. 2024, 976, 203. [Google Scholar] [CrossRef]
- Peterson, B.M. An Introduction to Active Galactic Nuclei; Cambridge University Press: Cambridge, UK, 1997. [Google Scholar]
- Krolik, J.H. Active Galactic Nuclei: From the Central Black Hole to the Galactic Environment; Princeton University Press: Princeton, NJ, USA, 1999; Volume 60. [Google Scholar]
- Atwood, W.B.; Abdo, A.A.; Ackermann, M.; Althouse, W.; Anderson, B.; Axelsson, M.; Baldini, L.; Ballet, J.; Band, D.L.; Barbiellini, G.; et al. The Large Area Telescope on the Fermi Gamma-Ray Space Telescope Mission. Astrophys. J. 2009, 697, 1071–1102. [Google Scholar] [CrossRef]
- Thompson, D.J.; Wilson-Hodge, C.A. Fermi Gamma-Ray Space Telescope. In Handbook of X-Ray and Gamma-Ray Astrophysics; Springer: Singapore, 2022; pp. 1–31. [Google Scholar] [CrossRef]
- Meegan, C.; Lichti, G.; Bhat, P.N.; Bissaldi, E.; Briggs, M.S.; Connaughton, V.; Diehl, R.; Fishman, G.; Greiner, J.; Hoover, A.S.; et al. The Fermi Gamma-ray Burst Monitor. Astrophys. J. 2009, 702, 791–804. [Google Scholar] [CrossRef]
- Levan, A. Gamma-Ray Bursts; 2514-3433; IOP Publishing: Bristol, UK, 2018. [Google Scholar] [CrossRef]
- Abdo, A.A.; Ackermann, M.; Arimoto, M.; Asano, K.; Atwood, W.B.; Axelsson, M.; Baldini, L.; Ballet, J.; Band, D.L.; Barbiellini, G.; et al. Fermi Observations of High-Energy Gamma-Ray Emission from GRB 080916C. Science 2009, 323, 1688–1693. [Google Scholar] [CrossRef] [PubMed]
- NASA LAT Collaboration. Fermi-LAT Pictorial View. Available online: https://fermi.gsfc.nasa.gov/science/constellations/pages/inc/img/fermi/Fermi_Artwork.jpg (accessed on 8 February 2025).
- Fermi Collaboration. Fermi Gamma-Ray Space Telescope. 2008. Available online: https://fermi.gsfc.nasa.gov/ (accessed on 8 February 2025).
- Strigari, L.E. Galactic searches for dark matter. Phys. Rep. 2013, 531, 1–88. [Google Scholar] [CrossRef]
- Ajello, M.; Atwood, W.B.; Axelsson, M.; Bagagli, R.; Bagni, M.; Baldini, L.; Bastieri, D.; Bellardi, F.; Bellazzini, R.; Bissaldi, E.; et al. Fermi Large Area Telescope Performance after 10 Years of Operation. Astrophys. J. Suppl. Ser. 2021, 256, 12. [Google Scholar] [CrossRef]
- GLAST Facility Science Team; Gehrels, N.; Michelson, P. GLAST: The next-generation high energy gamma-ray astronomy mission. Astropart. Phys. 1999, 11, 277–282. [Google Scholar] [CrossRef]
- ASI-SSDC. Fermi-LAT Pictorial View. Available online: https://fermi.ssdc.asi.it/images/imgfermiasdc4.png (accessed on 8 February 2025).
- Netchitailo, V. Dark Matter Particles. J. High Energy Phys. Gravit. Cosmol. 2023, 09, 1004–1020. [Google Scholar] [CrossRef]
- Queiroz, F. WIMP Theory Review. arXiv 2017, arXiv:1711.02463. [Google Scholar] [CrossRef]
- Luque, P.D.L.T.; Smirnov, J.; Linden, T. Gamma-Ray Lines in 15 Years of Fermi-LAT Data: New Constraints on Higgs Portal Dark Matter. arXiv 2023, arXiv:2309.03281. [Google Scholar]
- Ackermann, M.; Albert, A.; Anderson, B.; Atwood, W.; Baldini, L.; Barbiellini, G.; Bastieri, D.; Bechtol, K.; Bellazzini, R.; Bissaldi, E.; et al. Searching for Dark Matter Annihilation from Milky Way Dwarf Spheroidal Galaxies with Six Years of Fermi-LAT Data. Phys. Rev. Lett. 2015, 115, 231301. [Google Scholar] [CrossRef]
- Ackermann, M.; Ajello, M.; Albert, A.; Anderson, B.; Atwood, W.B.; Baldini, L.; Barbiellini, G.; Bastieri, D.; Bellazzini, R.; Bissaldi, E.; et al. Updated search for spectral lines from Galactic dark matter interactions with pass 8 data from the Fermi Large Area Telescope. Phys. Rev. D 2015, 91, 122002. [Google Scholar] [CrossRef]
- Foster, J.W.; Park, Y.; Safdi, B.R.; Soreq, Y.; Xu, W.L. Search for dark matter lines at the Galactic Center with 14 years of Fermi data. Phys. Rev. D 2023, 107, 103047. [Google Scholar] [CrossRef]
- Lesage, S.; Veres, P.; Briggs, M.S.; Goldstein, A.; Kocevski, D.; Burns, E.; Wilson-Hodge, C.A.; Bhat, P.N.; Huppenkothen, D.; Fryer, C.L.; et al. Fermi-GBM Discovery of GRB 221009A: An Extraordinarily Bright GRB from Onset to Afterglow. Astrophys. J. Lett. 2023, 952, L42. [Google Scholar] [CrossRef]
- Barthelmy, S.D.; Barbier, L.M.; Cummings, J.R.; Fenimore, E.E.; Gehrels, N.; Hullinger, D.; Krimm, H.A.; Markwardt, C.B.; Palmer, D.M.; Parsons, A.; et al. The Burst Alert Telescope (BAT) on the SWIFT Midex Mission. Space Sci. Rev. 2005, 120, 143–164. [Google Scholar] [CrossRef]
- Aptekar, R.L.; Frederiks, D.D.; Golenetskii, S.V.; Ilynskii, V.N.; Mazets, E.P.; Panov, V.N.; Sokolova, Z.J.; Terekhov, M.M.; Sheshin, L.O.; Cline, T.L.; et al. Konus-W gamma-ray burst experiment for the GGS Wind spacecraft. Space Sci. Rev. 1995, 71, 265–272. [Google Scholar] [CrossRef]
- Bissaldi, E.; Bruel, P.; Omodei, N.; Pillera, R.; Di Lalla, N. GRB 221009A: The brightest burst of all time as seen by Fermi-LAT. PoS 2023, ICRC2023, 847. [Google Scholar] [CrossRef]
- Stern, B.; Tkachev, I. GRB 221009A, its precursor and two afterglows in the Fermi data. arXiv 2023, arXiv:2303.03855. [Google Scholar] [CrossRef]
- Di Sciascio, G. The LHAASO experiment: From Gamma-Ray Astronomy to Cosmic Rays. Nucl. Part. Phys. Proc. 2016, 279–281, 166–173. [Google Scholar] [CrossRef]
- Xia, Z.Q.; Wang, Y.; Yuan, Q.; Fan, Y.Z. A delayed 400 GeV photon from GRB 221009A and implication on the intergalactic magnetic field. Nat. Commun. 2024, 15, 4280. [Google Scholar] [CrossRef] [PubMed]
- The LHAASO Collaboration. Very high-energy gamma-ray emission beyond 10 TeV from GRB 221009A. Sci. Adv. 2023, 9, eadj2778. [Google Scholar] [CrossRef] [PubMed]
- Sahu, S.; Medina-Carrillo, B.; Sánchez-Colón, G.; Rajpoot, S. Deciphering the ∼18 TeV Photons from GRB 221009A. Astrophys. J. Lett. 2023, 942, L30. [Google Scholar] [CrossRef]
- Dzhappuev, D.D.; Petkov, V.B.; Kudzhaev, A.U.; Klimenko, N.F.; Lidvansky, A.S.; Troitsky, S.V. Search for cosmic gamma rays with the Carpet-2 extensive air shower array. arXiv 2015, arXiv:1511.09397. [Google Scholar]
- Galanti, G.; Nava, L.; Roncadelli, M.; Tavecchio, F.; Bonnoli, G. Observability of the Very-High-Energy Emission from GRB 221009A. Phys. Rev. Lett. 2023, 131, 251001. [Google Scholar] [CrossRef]
- Řípa, J.; Takahashi, H.; Fukazawa, Y.; Werner, N.; Münz, F.; Pál, A.; Ohno, M.; Dafčíková, M.; Mészáros, L.; Csák, B.; et al. The peak flux of GRB 221009A measured with GRBAlpha. Astron. Astrophys. 2023, 677, L2. [Google Scholar] [CrossRef]
- Vercellone, S.; Bigongiari, C.; Burtovoi, A.; Cardillo, M.; Catalano, O.; Franceschini, A.; Lombardi, S.; Nava, L.; Pintore, F.; Stamerra, A.; et al. ASTRI Mini-Array core science at the Observatorio del Teide. J. High Energy Astrophys. 2022, 35, 1–42. [Google Scholar] [CrossRef]
- Hermann, G. Towards the future Cherenkov telescope array CTA. Nucl. Instrum. Methods Phys. Res. Sect. A Accel. Spectrom. Detect. Assoc. Equip. 2010, 623, 408–409. [Google Scholar] [CrossRef]
- Sgrò, C. The Imaging X-ray Polarimetry Explorer (IXPE). Nucl. Instrum. Methods Phys. Res. Sect. A Accel. Spectrom. Detect. Assoc. Equip. 2019, 936, 212–215. [Google Scholar] [CrossRef]
- Soffitta, P.; Bucciantini, N.; Churazov, E.; Costa, E.; Dovciak, M.; Feng, H.; Heyl, J.; Ingram, A.; Jahoda, K.; Kaaret, P.; et al. A polarized view of the hot and violent universe. Exp. Astron. 2021, 51, 1109–1141. [Google Scholar] [CrossRef]
- Tomsick, J.A.; Boggs, S.E.; Zoglauer, A.; Wulf, E.; Mitchell, L.; Phlips, B.; Sleator, C.; Brandt, T.; Shih, A.; Roberts, J.; et al. The Compton Spectrometer and Imager Project for MeV Astronomy. arXiv 2021, arXiv:2109.10403. [Google Scholar]
- Kierans, C.A. AMEGO: Exploring the extreme multi-messenger universe. In Proceedings of the Space Telescopes and Instrumentation 2020: Ultraviolet to Gamma Ray, Online, 14–18 December 2020; den Herder, J.W.A., Nakazawa, K., Nikzad, S., Eds.; SPIE: Bellingham, WA, USA, 2020. [Google Scholar] [CrossRef]
- Diaz Ortiz, M.; Gleason, J.; Grote, H.; Hallal, A.; Hartman, M.; Hollis, H.; Isleif, K.S.; James, A.; Karan, K.; Kozlowski, T.; et al. Design of the ALPS II optical system. Phys. Dark Universe 2022, 35, 100968. [Google Scholar] [CrossRef]
- Armengaud, E.; Attié, D.; Basso, S.; Brun, P.; Bykovskiy, N.; Carmona, J.; Castel, J.; Cebrián, S.; Cicoli, M.; Civitani, M.; et al. Physics potential of the International Axion Observatory (IAXO). J. Cosmol. Astropart. Phys. 2019, 2019, 047. [Google Scholar] [CrossRef]
- Galanti, G. Observing GRB 221009A at Very-High Energy. 2024. Available online: https://agenda.infn.it/event/38056/contributions/244601/ (accessed on 8 February 2025).
- Pillera, R. Development of Plastic Scintillators with SiPM Readout for Satellite-Borne Astroparticle Physics Experiments. Ph.D. Thesis, Politecnico di Bari, Bari, Italy, 2024. Available online: https://iris.poliba.it/retrieve/7ab28342-e7de-4022-bfe6-362ace375453/36%20ciclo-PILLERA%20Roberta.pdf (accessed on 8 February 2025).
- Ackermann, M.; Ajello, M.; Albert, A.; Atwood, W.B.; Baldini, L.; Ballet, J.; Barbiellini, G.; Bastieri, D.; Gonzalez, J.B.; Bellazzini, R.; et al. Multiwavelength evidence for quasi-periodic modulation in the gamma-ray blazar PG 1553+113. Astrophys. J. Lett. 2015, 813, L41. [Google Scholar] [CrossRef]
- Burrows, D.N.; Hill, J.E.; Nousek, J.A.; Kennea, J.A.; Wells, A.; Osborne, J.P.; Abbey, A.F.; Beardmore, A.; Mukerjee, K.; Short, A.D.T.; et al. The Swift X-Ray Telescope. Space Sci. Rev. 2005, 120, 165–195. [Google Scholar] [CrossRef]
- Krimm, H.A.; Holland, S.T.; Corbet, R.H.D.; Pearlman, A.B.; Romano, P.; Kennea, J.A.; Bloom, J.S.; Barthelmy, S.D.; Baumgartner, W.H.; Cummings, J.R.; et al. The Swift/BAT Hard X-Ray Transient Monitor. Astrophys. J. Suppl. Ser. 2013, 209, 14. [Google Scholar] [CrossRef]
- Roming, P.W.A.; Kennedy, T.E.; Mason, K.O.; Nousek, J.A.; Ahr, L.; Bingham, R.E.; Broos, P.S.; Carter, M.J.; Hancock, B.K.; Huckle, H.E.; et al. The Swift Ultra-Violet/Optical Telescope. Space Sci. Rev. 2005, 120, 95–142. [Google Scholar] [CrossRef]
- Li, W.D.; Filippenko, A.V.; Treffers, R.R.; Friedman, A.; Halderson, E.; Johnson, R.A.; King, J.Y.; Modjaz, M.; Papenkova, M.; Sato, Y.; et al. The Lick Observatory Supernova Search. In Proceedings of the Cosmic Explosions: Tenth AstroPhysics Conference, College Park, MD, USA, 11–13 October 2000; Holt, S.S., Zhang, W.W., Eds.; American Institute of Physics Conference Series. AIP: Melville, NY, USA, 2000; Volume 522, pp. 103–106. [Google Scholar] [CrossRef]
- Christensen, E.; Larson, S.; Boattini, A.; Gibbs, A.; Grauer, A.; Hill, R.; Johnson, J.; Kowalski, R.; McNaught, R. The Catalina Sky Survey: Current and Future Work. AAS/Div. Planet. Sci. Meet. Abstr. 2012, 44, 210–213. [Google Scholar]
- Stanley, G.J. Owens Valley Radio Observatory, California Institute of Technology, Big Pine, California. Observatory report. Bull. Am. Astron. Soc. 1973, 5, 222–225. [Google Scholar]
- Dewdney, P.E.; Hall, P.J.; Schilizzi, R.T.; Lazio, T.J.L.W. The Square Kilometre Array. IEEE Proc. 2009, 97, 1482–1496. [Google Scholar] [CrossRef]
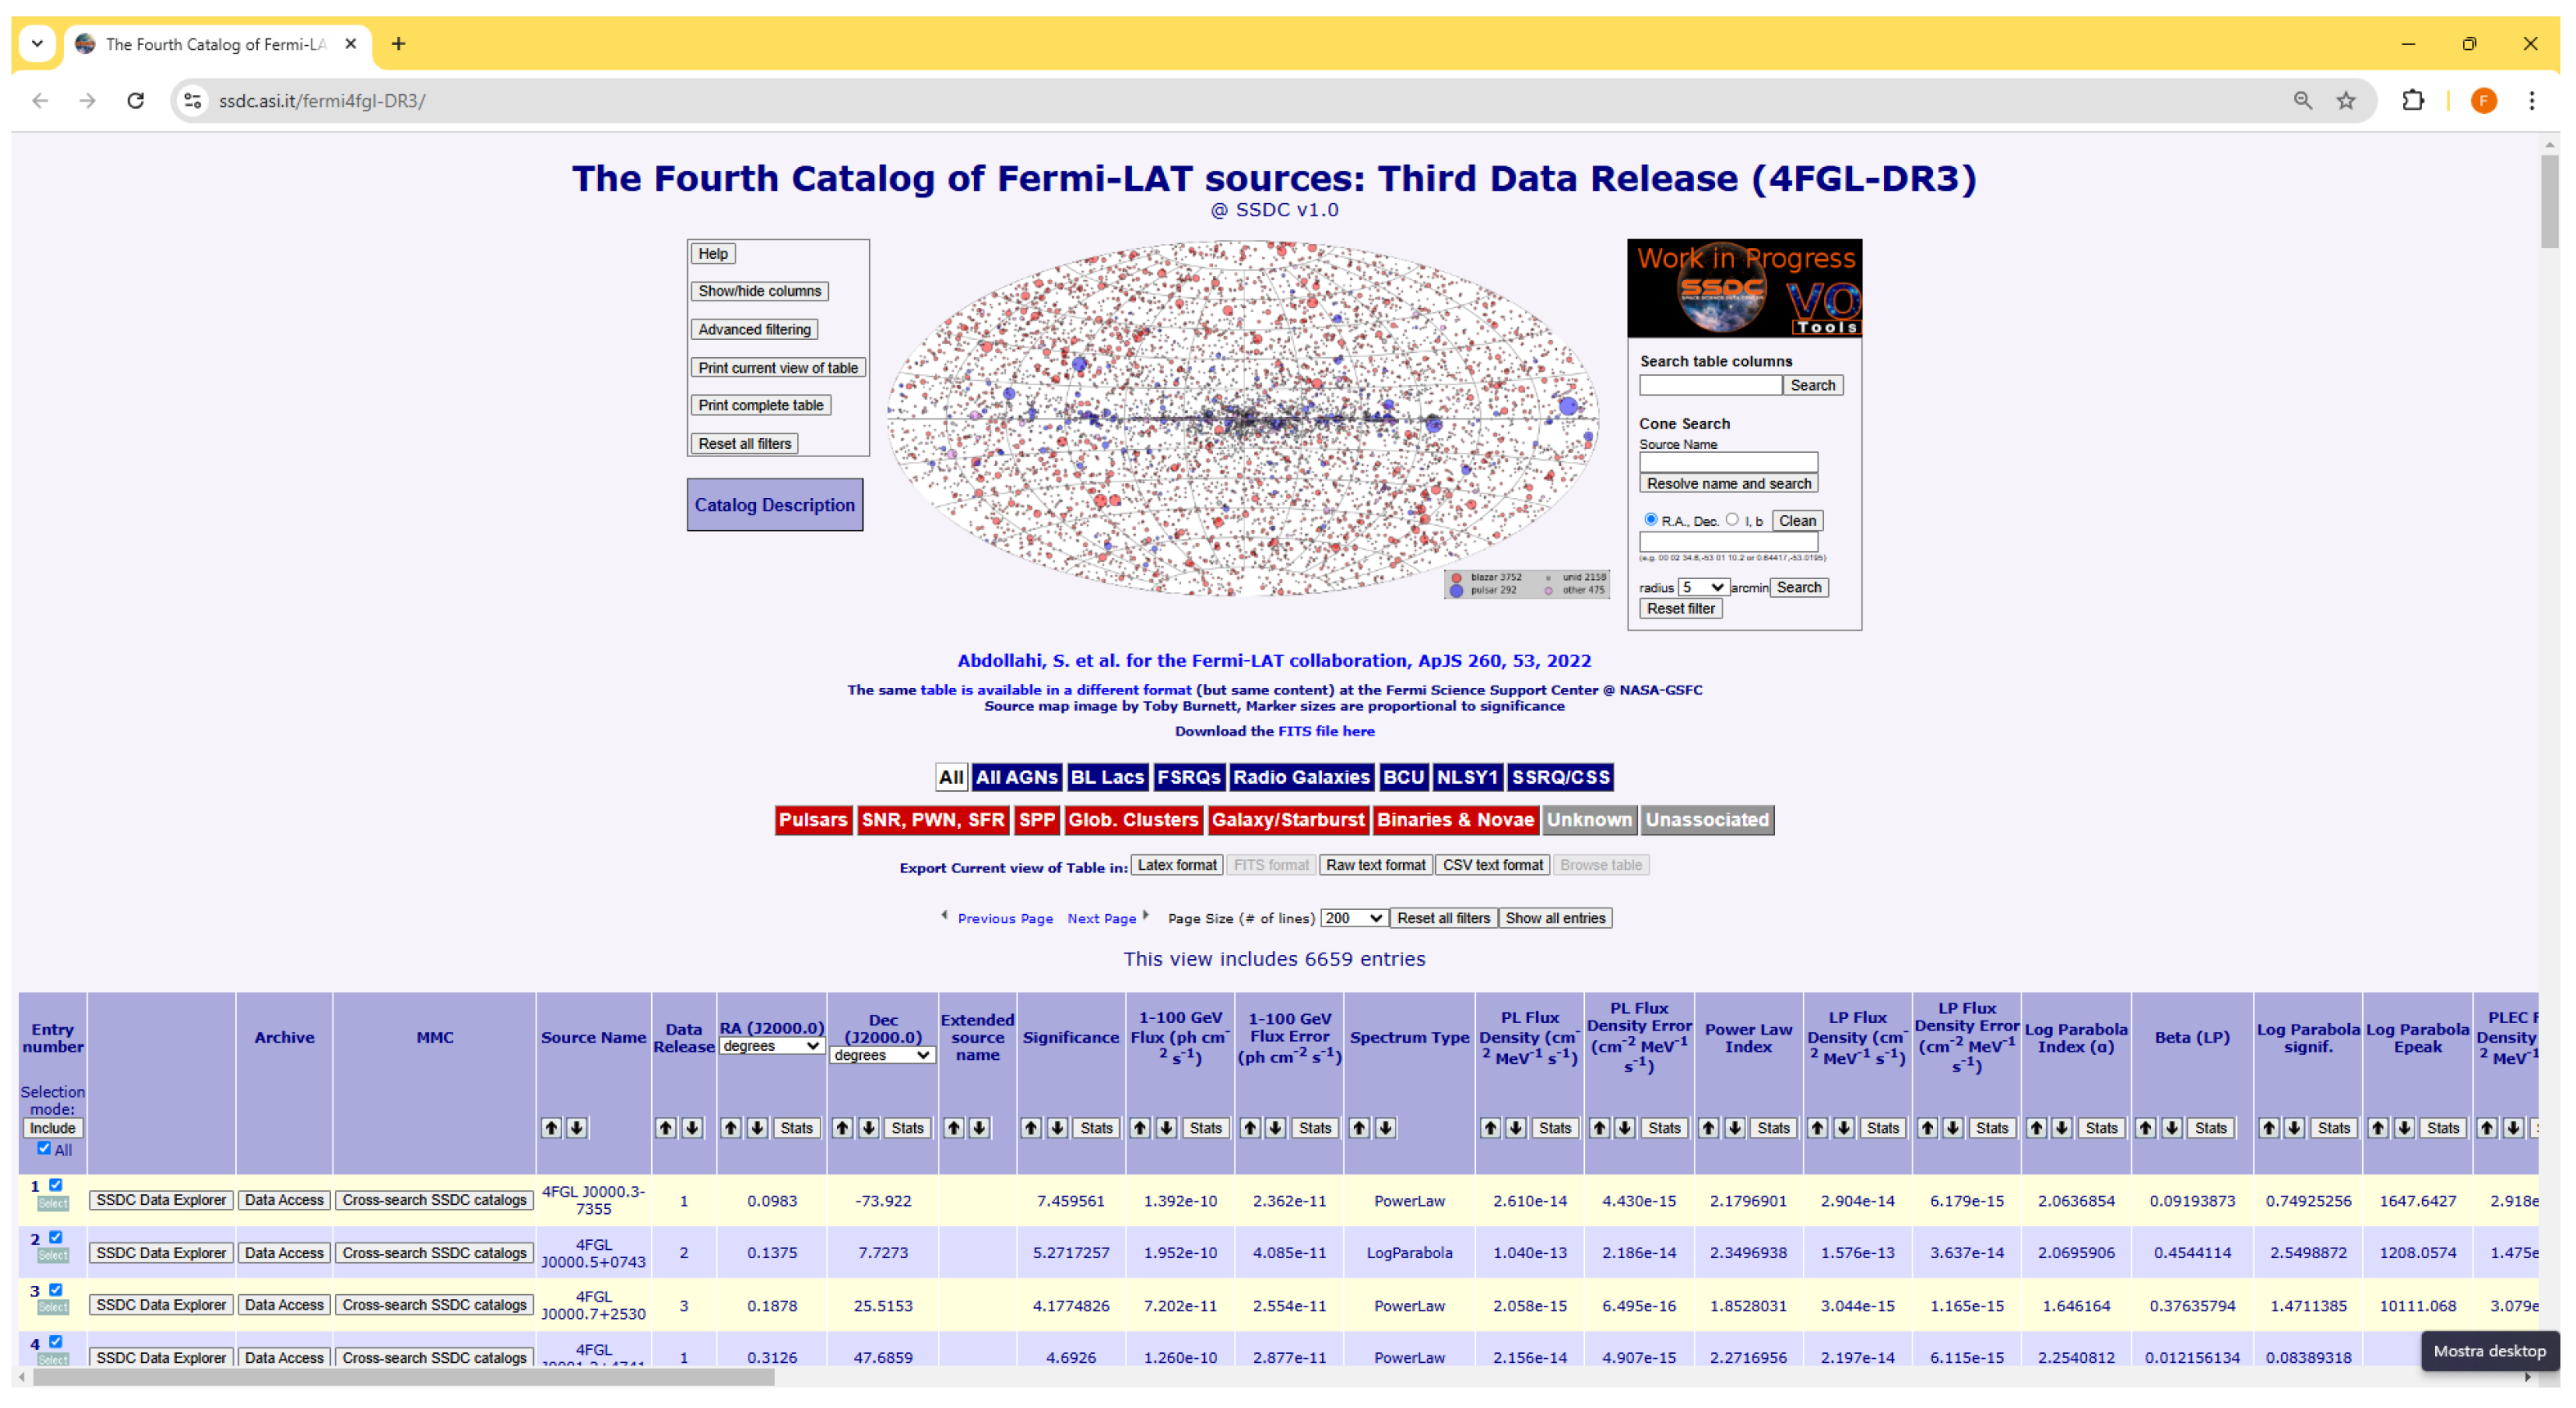
- SSDC ASI. Fermi 4FGL-DR3 Sky Map. Available online: https://www.ssdc.asi.it/fermi4fgl-DR3/fermi4fgldr3.png (accessed on 8 February 2025).
- Ballet, J.; Bruel, P.; Burnett, T.H.; Lott, B. Fermi Large Area Telescope Fourth Source Catalog Data Release 4 (4FGL-DR4). arXiv 2024, arXiv:2307.12546. [Google Scholar]
- SSDC Collaboration. Space Science Data Center. 2024. Available online: https://www.ssdc.asi.it/ (accessed on 8 February 2025).
- Boella, G.; Butler, R.C.; Perola, G.C.; Piro, L.; Scarsi, L.; Bleeker, J.A. BeppoSAX, the wide band mission for X-ray astronomy. Astron. Astrophys. Suppl. Ser. 1997, 122, 299–307. [Google Scholar] [CrossRef]
- SSDC Collaboration. SSDC—MMA. 2024. Available online: https://www.ssdc.asi.it/mma.html (accessed on 8 February 2025).
- SSDC Collaboration. SSDC—SED Builder. 2024. Available online: https://tools.ssdc.asi.it/SED/ (accessed on 8 February 2025).
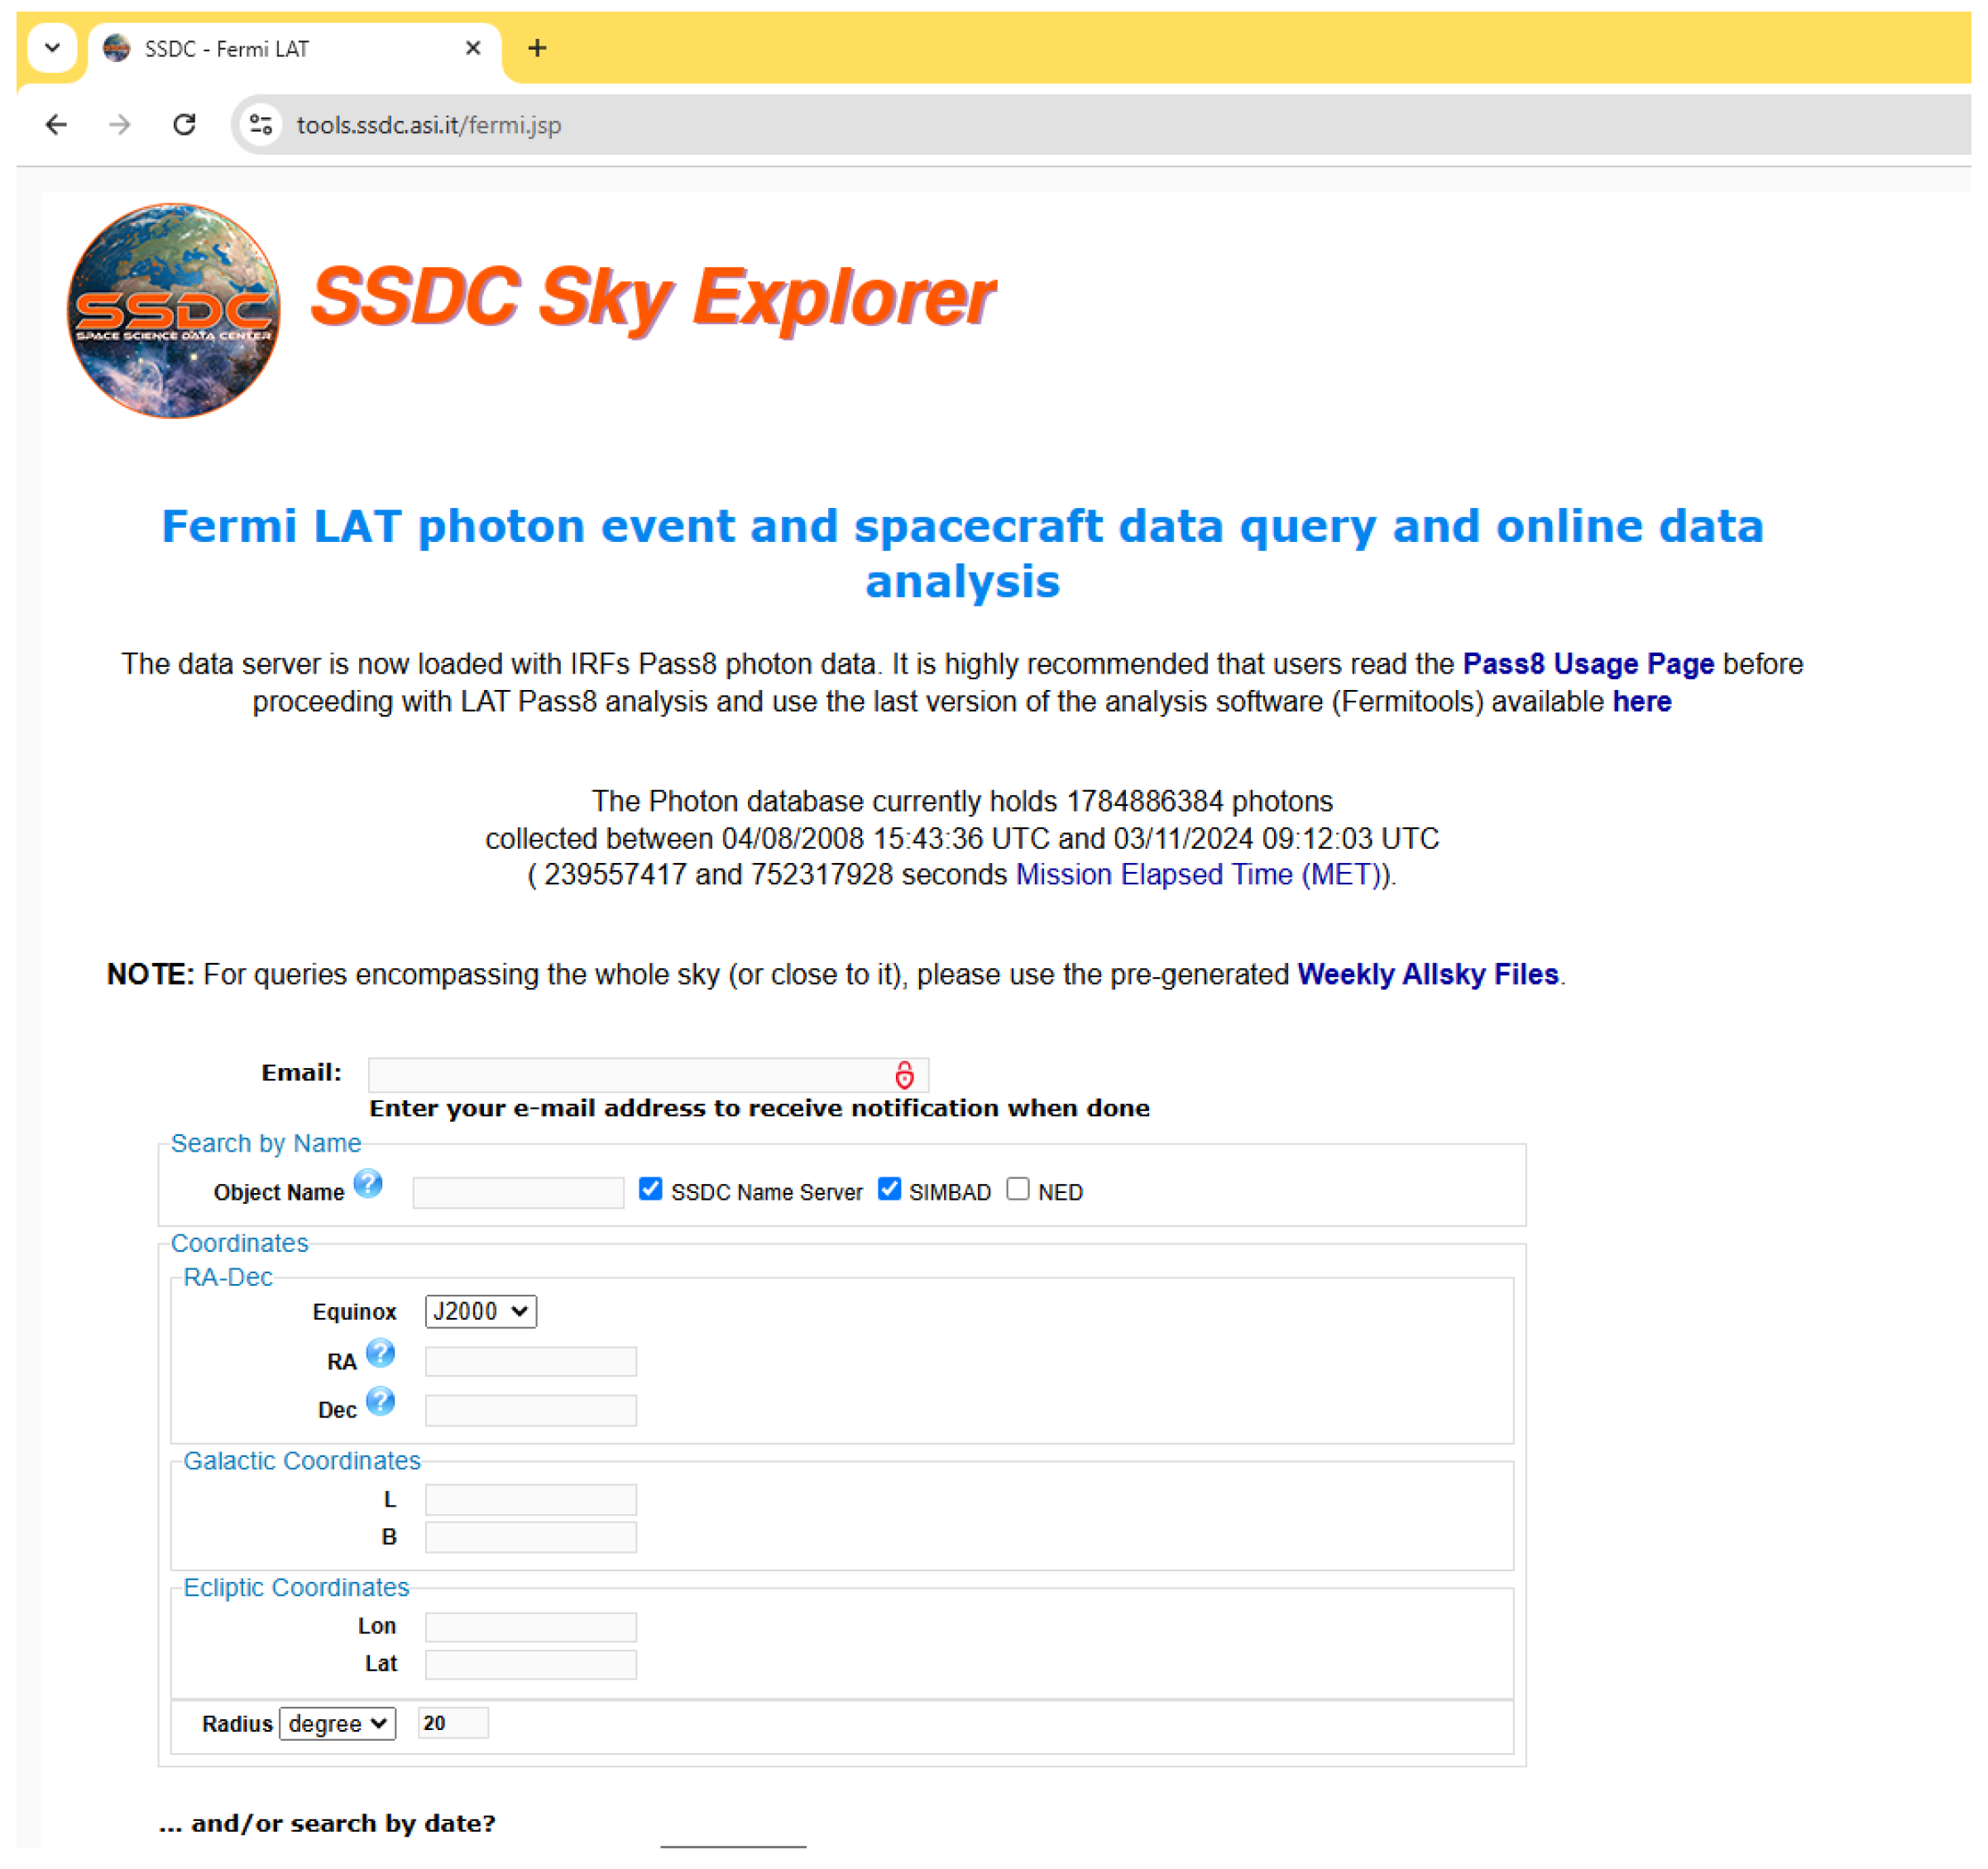
- SSDC Collaboration. SSDC—Sky Explorer. 2024. Available online: http://tools.ssdc.asi.it/ (accessed on 8 February 2025).
- ASI Collaboration. Infrastruttura Informatica di SSDC. 2024. Available online: https://www.asi.it/wp-content/uploads/2021/04/CT-All.5-Infrastruttura-Informatica-di-SSDC.pdf (accessed on 8 February 2025).
- Ciprini, S.; Casaburo, F.; Giacchino, F.; Cheung, C.C. Fermi LAT Detection of GeV Gamma-Ray Activity from FR-I Radio Galaxy SBS 1343+537 and the FSRQ TXS 0946+181. 2024. Available online: https://www.astronomerstelegram.org/?read=16671 (accessed on 8 February 2025).
- Gehrels, N. The Swift Gamma-Ray Burst Mission. AIP Conf. Proc. 2004, 727, 637–641. [Google Scholar] [CrossRef]
- Giacchino, F.; Casaburo, F.; Ciprini, S.; Verrecchia, F. Swift XRT follow up observations of the SBS 1343+537. 2024. Available online: https://www.astronomerstelegram.org/?read=16699 (accessed on 8 February 2025).
- Prandoni, I.; Murgia, M.; Tarchi, A.; Burgay, M.; Castangia, P.; Egron, E.; Govoni, F.; Pellizzoni, A.; Ricci, R.; Righini, S.; et al. The Sardinia Radio Telescope—From a technological project to a radio observatory. Astron. Astrophys. 2017, 608, A40. [Google Scholar] [CrossRef]


Disclaimer/Publisher’s Note: The statements, opinions and data contained in all publications are solely those of the individual author(s) and contributor(s) and not of MDPI and/or the editor(s). MDPI and/or the editor(s) disclaim responsibility for any injury to people or property resulting from any ideas, methods, instructions or products referred to in the content. |
© 2025 by the authors. Licensee MDPI, Basel, Switzerland. This article is an open access article distributed under the terms and conditions of the Creative Commons Attribution (CC BY) license (https://creativecommons.org/licenses/by/4.0/).
Share and Cite
Casaburo, F.; Ciprini, S.; Gasparrini, D.; Giacchino, F. Sixteen Years of Gamma-Ray Discoveries and AGN Observations with Fermi-LAT. Particles 2025, 8, 17. https://doi.org/10.3390/particles8010017
Casaburo F, Ciprini S, Gasparrini D, Giacchino F. Sixteen Years of Gamma-Ray Discoveries and AGN Observations with Fermi-LAT. Particles. 2025; 8(1):17. https://doi.org/10.3390/particles8010017
Chicago/Turabian StyleCasaburo, Fausto, Stefano Ciprini, Dario Gasparrini, and Federica Giacchino. 2025. "Sixteen Years of Gamma-Ray Discoveries and AGN Observations with Fermi-LAT" Particles 8, no. 1: 17. https://doi.org/10.3390/particles8010017
APA StyleCasaburo, F., Ciprini, S., Gasparrini, D., & Giacchino, F. (2025). Sixteen Years of Gamma-Ray Discoveries and AGN Observations with Fermi-LAT. Particles, 8(1), 17. https://doi.org/10.3390/particles8010017