Article

Weibull Reliability Based on Random Vibration Performance for Fiber Optic Connectors

by
Jesús M. Barraza-Contreras
,
Manuel R. Piña-Monárrez
*,
María M. Hernández-Ramos
and
Secundino Ramos-Lozano
Industrial and Manufacturing Department, Engineering and Technological Institute, Universidad Autónoma de Ciudad Juárez, Chihuahua 32310, Mexico
*
Author to whom correspondence should be addressed.
Vibration 2025, 8(3), 46; https://doi.org/10.3390/vibration8030046
Submission received: 7 July 2025 / Revised: 7 August 2025 / Accepted: 8 August 2025 / Published: 12 August 2025

Abstract

Communication via optical fiber is increasingly being used in harsh applications where environmental vibration is present. This study involves a Weibull reliability analysis focused on the performance of fiber optic connectors when they are subjected to mechanical random vibration stress to simulate real-world operating conditions, and the insertion loss (IL) degradation is measurable. By analyzing the testing times and stress levels, the Weibull shape ( β ) and scale ( η ) parameters are estimated directly from the maximal and minimal principal IL stresses ( σ 1 , σ 2 ), enabling the prediction of the connector’s reliability with efficiency. The sample size n is derived from the desired reliability (R(t)), and the GR-326 mechanical vibration test (2.306 Grms for six hours) is performed on optical SC angled physical contact (PC) polish fiber endface connectors that are monitored during testing to evaluate the IL transient change in the optical transmission. The method is verified by an experiment performed with σ 1 = 0.3960 and σ 2 = 0.1910 where the IL measurements are captured with an Agilent N7745A source-detector optical equipment, and the Weibull statistical results provide a connector’s reliability R(t) = 0.8474, with a characteristic value of η = 0.2750 dB and β = 3. Finally, the connector’s reliability is as worthy of attention as the telecommunication sign conditions.

1. Introduction

Vibration reliability is an important factor in several fiber equipment and fiber optic technologies that are playing an increasingly important role in modern telecommunications [1,2]. As the demand for high-speed services such as the internet and data communication continues to increase, the requirements for optical connectors in terms of more critical and diverse conditions are also increasing because they are crucial components in the telecommunications industry [3,4,5]. The vibration significantly impacts the overall system reliability of the optical connectors, and their longevity and performance are vital to avoid telecommunication problems [6]. With this direction, previous studies have investigated the reliability of fiber optic components under various environmental stresses, such as temperature and humidity, and strength under tensile stress [7,8]; however, the impact of random vibration fatigue on the statistical reliability of fiber optic connectors has not been extensively examined. On the other hand, existing standards such as MIL-STD-810 and IEC 61300-2-1 do provide general vibration tests but lack statistical reliability data. Besides that, IEC 61300-2-1 focuses on sinusoidal vibration, and MIL-STD-810 applies to rotating machinery or engines, tracked vehicles, rocket launches, and transport in cargo aircraft. On the other hand, GR-326 has the following failure modes under mechanical load conditions: wear or deformation of ferrules, loss of spring force, increased insertion loss (IL), connector detachment, connector loosening, or misalignment, fretting corrosion, and intermittent signal loss. Those factors mentioned degrade the fiber connector performance due to a combination of mechanical and optical factors. Some of them are repeated micro-movements, wear, excessive contact that causes signal attenuation, debris blocking optical paths that increases the IL, scratches on fiber endfaces that degrade signal transmission, and slight misalignment that leads to mode mismatch and signal loss. In summary, the combined effect is that fretting produces debris, debris induces misalignment, and misalignment worsens fretting.
In this context, the application of Weibull distribution and reliability R(t) analysis becomes increasingly important as it provides a statistical framework for modeling failure rates and assessing the reliability of fiber optic connectors under fatigue conditions [9,10,11]. This analysis is particularly relevant in the field of optical communications, where the performance and reliability of connectors are crucial for maintaining signal integrity under such conditions [12,13]. Therefore, due to its great significance, this research focuses on the relationship between Weibull reliability analysis and optical performance signals under random vibration [14,15].
The ratings of optical performance concerning the industrial standards are evaluated before, during, and after mechanical stress for most of the research [16], and the reliability can be addressed with the vibration-induced damage identification of fiber optic connectors under these scenarios. Here, a new approach is introduced for assessing Weibull reliability that focuses on the IL performance when the fiber optic connector (communication) is subjected to random vibration. This consideration arises from the fact that, in light of the growing demand for fiber optic technology, these connectors may undergo various changes in performance [17,18]. The innovation of this work lies in its pioneering investigation into the statistical reliability of fiber optic connectors under random vibration fatigue, offering a direct and efficient method for Weibull parameter estimation based on the effect that vibration stress has on the insertion loss of the fiber connector. This approach provides valuable insights for the telecommunications industry and contributes to the understanding of connector longevity in harsh environments.
In this paper, the laboratory vibration accelerated life testing is considered as a widely used technique to assess the reliability of the optical connectors under operating conditions [19]. In the testing analysis, the GR-326 mechanical vibration test with 2.306 Grms and six hours of testing time was used to simulate the vibration operational conditions. In the analysis, we used the IL transient change in the optical transmission signal as the critical functional variable. In the test, the IL variable was measurable based on the optical SC angled PC polish fiber endface connectors, monitored with an Agilent N7745A source-detector optical equipment (Agilent Scientific Instruments, Santa Clara, CA, USA). And to collect sufficient data to perform the reliability analysis, based on the zero-failures testing plan theory stated by GMW 3172 in appendix C [20], the used sample size n was determined based on a desired reliability span of R(t) = 0.9535; consequently, from Equation (16), n = 21 samples were tested without failure.
From collected IL data (see Section 4), the maximum values σ 1 = 0.3960   dB and σ 2 = 0.1910   d B were observed in the Z axis. Thus, based on the σ 1 and σ 2 values, from Equations (4) and (5), the corresponding Weibull parameters were β = 3 and η   = 0.275. However, it is important to notice that although the maximum observed IL value was σ 1 = 0.3960   d B, because the failure strength of the connector was 0.5000 dB, in the end, the addressed connector’s reliability was R(t) = 0.8474. Therefore, this work provides a needed statistical framework for understanding and predicting the reliability of fiber optic connectors in dynamic, vibration-prone environments, offering a more comprehensive assessment than prior research that focused on temperature, humidity, and tensile stress factors.
This paper is organized as follows. Section 2 includes the generalities of the Weibull distribution model, random vibration, and fiber optic connector measurements. Section 3 gives the methodology and experimental application. In Section 4, the results are depicted. Finally, in Section 5 and Section 6, the discussion and conclusions are provided, respectively.

2. Materials and Methods

The Weibull reliability analysis has a long, detailed, and rich development history and has been widely used for items such as various telecommunications components in the field of application [18]. Fiber optic connectors in various fields, regardless of the effects of external environments such as normal, extreme, or even catastrophic factors, exhibit the behavior of random dynamics. Recently, the analysis of fiber connectors has gradually deepened, and effective conclusions have been derived for some of them under certain environments. However, there is not much research in the literature reporting the random vibration life of fiber connectors [5].
The random vibration testing methodology has been classified into the following types after several researchers made significant contributions to the theoretical framework, such as the moment method, the maximum overload moment method, and the maximum probability linear execution algorithm [21,22,23]. Studies have indicated that the reliability characteristics of some devices exhibit small scattering characteristics or a long life, which can be expressed in statistical representation by the Weibull reliability index through minimum or maximum stress failure experiments. The evolutionary tendency, scale effect, and related laws are directly related to the accuracy in the prediction of device reliability, especially in the manufacture of fiber optic components and connectors. The fiber optical connection has become the channel for the transmission of modern narrowband and wideband wireless and cable signals and has gradually become the focus of national scientific research [24]. These evaluations often incorporate Weibull reliability analysis, which is essential for predicting failure rates and enhancing the durability of these critical components. Thus, let us introduce the generalities of the Weibull model.

2.1. Theoretical Foundations of Weibull Reliability Analysis

The Weibull parameters have been widely used in reliability engineering, and the Weibull distribution has three parameters: scale parameter, shape parameter, and location parameter [25]. The shape parameter constrains the shape of the probability density function of the Weibull distribution. The scale parameter in the Weibull function controls the amplitude of the data. It is also connected with the number of failures early in the life of a system. Similarly, the location parameter shifts the entire distribution to the left or right but does not change the shape. There are many methods that researchers and engineers have proposed to estimate Weibull parameters [26]. Some use the skewness of the graph to estimate the shape factor; others use the arithmetic mean and the median to estimate the shape and scale factors based on statistical methods. They utilize transformations and interpolation polynomial estimation. They use the maximum likelihood or the Bayesian method. Many have proposed the use of quantiles to estimate the parameters of the Weibull distribution. In this investigation, the Weibull parameters are determined directly from the IL change loss induced by the random vibration on the fiber optical connectors. This approach allows for an accurate estimation of the shape and scale parameters, which ultimately enhances the reliability predictions of fiber optic connectors under varying operational conditions. This study aims to evaluate in terms of efficiency and robustness when applied to the analysis of fiber optic connectors subjected to random vibrations. The results will provide insights into the reliability of fiber optic connectors, which are critical components in communication systems. Additionally, we will explore the statistical approach to Weibull analysis and its implications for understanding failure rates under dynamic loading conditions.
The Weibull probability density function f(t) and cumulative distribution function F(t) are developed by Equations (1) and (2), respectively [27].
f t = β η t η β 1 e x p t η β
F t = 1 e x p t η β
where t is the selected random variable (stress load). Regarding the corresponding reliability function R(t), it is presented as
R t = e x p t η β
According to [28], the Weibull stress-fatigue β and η parameters can be determined as
β = 4 μ y 0.995     l n σ 1 σ 2
η = e x p ( µ x )
where μ y represents the mean of the Y vector, and they are given as follows
Y i = L N ( L N ( 1 ( ( i 0.3 ) / ( n + 0.4 ) ) ) )
μ y = i = 1 n Y i n
The µ x represents the log-mean of the failure-time data, which, for this research, is determined directly from the IL measurements by Equation (8),
µ x = l n σ 1 σ 2 1 2
Here, we remark that the efficiency of the Weibull parameters β and η only depends on the accuracy with which the IL values are measured. In this case, they are performed by using an Agilent N7745A with an LED source-detector at 1310 nm and 1550 nm. Now, since the stress fatigue in this investigation is induced by random vibration, let us review it.

2.2. Random Vibration Analysis

Mechanical vibration is a phenomenon characterized by the oscillatory motion of an object around an equilibrium position. This oscillation can occur in a communication fiber-optical signal. Thus, the study of mechanical vibrations is crucial in telecommunications. In the literature, there exist two general kinds of vibrations, deterministic and random. In contrast to the deterministic approaches, random vibration testing can consider all the essential frequency parameters relating to the operation and stimulation frequencies in random form [29], as well as vibrational path amplitudes, changes in those amplitudes (both angular and positional), and duration over a half-period; thus, it can simulate real conditions [30]. Thus, when a repetitive movement excitation (force) is presented in a system or element, it is determined by Equation (9).
m x ¨ + c x ¨ + k x = F 0
where m, c, and k are the mass, damping, and stiffness of the system that represent its inertial, dissipative, and elastic properties, respectively, while Fo represents the force applied [5]. Therefore, random vibration testing is of interest to the relevant testing institutes for their specifications. Many institutes have established procedures for performing such tests. In this investigation, the GR-326 [31] vibration testing profile is the base applied to the fiber optical connectors [32] used in central offices and data center applications. The requirements for performing a random vibration test are structured by the ability to test and perform data acquisition, where the IL signal through the fiber optical connectors is measured and monitored by an optical source-detector Agilent N7745A while the connectors are submitted to the forces induced by the mechanical vibration system and the profile applied. The intensity of the random vibration applied is determined by using Equation (14) and Equations (10)–(13) as follows
A i = 10 l o g 2 P S D i 10 log 2 + m f i f i 1 f i 1 f i m 10 l o g ( 2 )
where Ai is the area of the ith row, PSDi is the amplitude, and fi is the frequency of the ith row of the vibration profile applied, while f (i-1) is the frequency of the (ith-1)-row of the testing’s profile, and m is the slope given as follows:
m = d B O c t a v e s
and
d B = 10 l o g P S D i P S D i 1
O c t a v e s = l o g f i f i 1 l o g ( 2 )
G r m s = A
Grms does represent the measure of the amplitude in gravity from the root mean square of the random process. Here, it is mentioned that a system produces a certain response when it is under excitation, and if the response motion is unpredictable, the system has a random vibration performance because the motion cannot be exactly predicted, but it can be described probabilistically. Also, random vibration testing is the most realistic method, where the most critical variables are mounting assembly location, vibration frequency f, amplitude PSD, and sample size n.
Now, we proceed to review the fiber optic connectors generalities and their measurements.

2.3. Fiber Optic Connectors

Fiber optic connectors are devices used to couple and decouple light launched into or received from an optical fiber [33,34,35]. They play a key role in optical communication systems, which are now used not just for telecommunication but also for automobile, data center, and space applications [30]. There are various types of these connectors. The LC types are small form-factor connectors used in a small, sealed access area, while the SC is a larger sub-assembly kind, many of which are assembled as part of a patch panel. The different connectors have different features that make them suited to certain types of applications, such as the physical contact mating of LC and the mechanical resonant system of the SC. Figure 1 shows the LC and SC connectors for reference.
Ideally, the design of the fiber optic connector must encompass functionality, strength, durability, and precision for connector alignment [35]. In the telecommunications industry, when fiber optic connectors are used, the IL value is of vital importance to have a functional system. The IL is determined by Equation (15) as follows
I L = 10 log P i n P o u t
Its measure is in dB (decibel), and Pin is the power input and Pout is the power output. Thus, the analyzed connector failures during the mechanical vibration testing experiments are determined by their IL value requirements; according to the International Telecommunication Union (UIT) [36], the IL limit value for a fiber optical connection submitted to mechanical stress is ≤0.5 dB at the wavelengths of 1310 and 1550 nanometers (nm), which are the wavelengths used in communications and applications with single-mode fibers that transmit optical power. On the other hand, for a new connection without any stress applied, the IL limit value is around 0.35 dB. Next, an experimental application is presented.

3. Methodology and Experimental Design

In this section, the experimental setup and test data collection methodology are presented, including detailed experimental parameters and settings. In the actual test content, considering typical usage frequency, different realization models, and operation duration, we select test samples, experimental processes, test parameters, and data collection methods. Within the validation process of the experimental results, indicators like the repeatability and reproducibility of the data are included. On this basis, the Weibull distribution model has a good agreement with experimental data. We calculate the two basic parameters in the Weibull module, β (shape parameter) and η (scale parameter), directly from the IL induced by the random vibration on the fiber optic connectors.
To truly reflect the use of basic connectors, Equation (16) from [37,38] is applied to determine the sample size n value
n = 1 l n R t
where R(t) is the desired reliability of the analysis; here, R(t) could be seen as the equivalent of a confidence interval level used in the quality field. In this case, by using R(t) = 0.9535, we obtain n = 21, but any desired R(t) index can be used.
Next, the vibration testing is performed in three mutually perpendicular axes (X, Y, and Z) for two hours (7200 seg.) at each axis; the profile is depicted in Table 1.
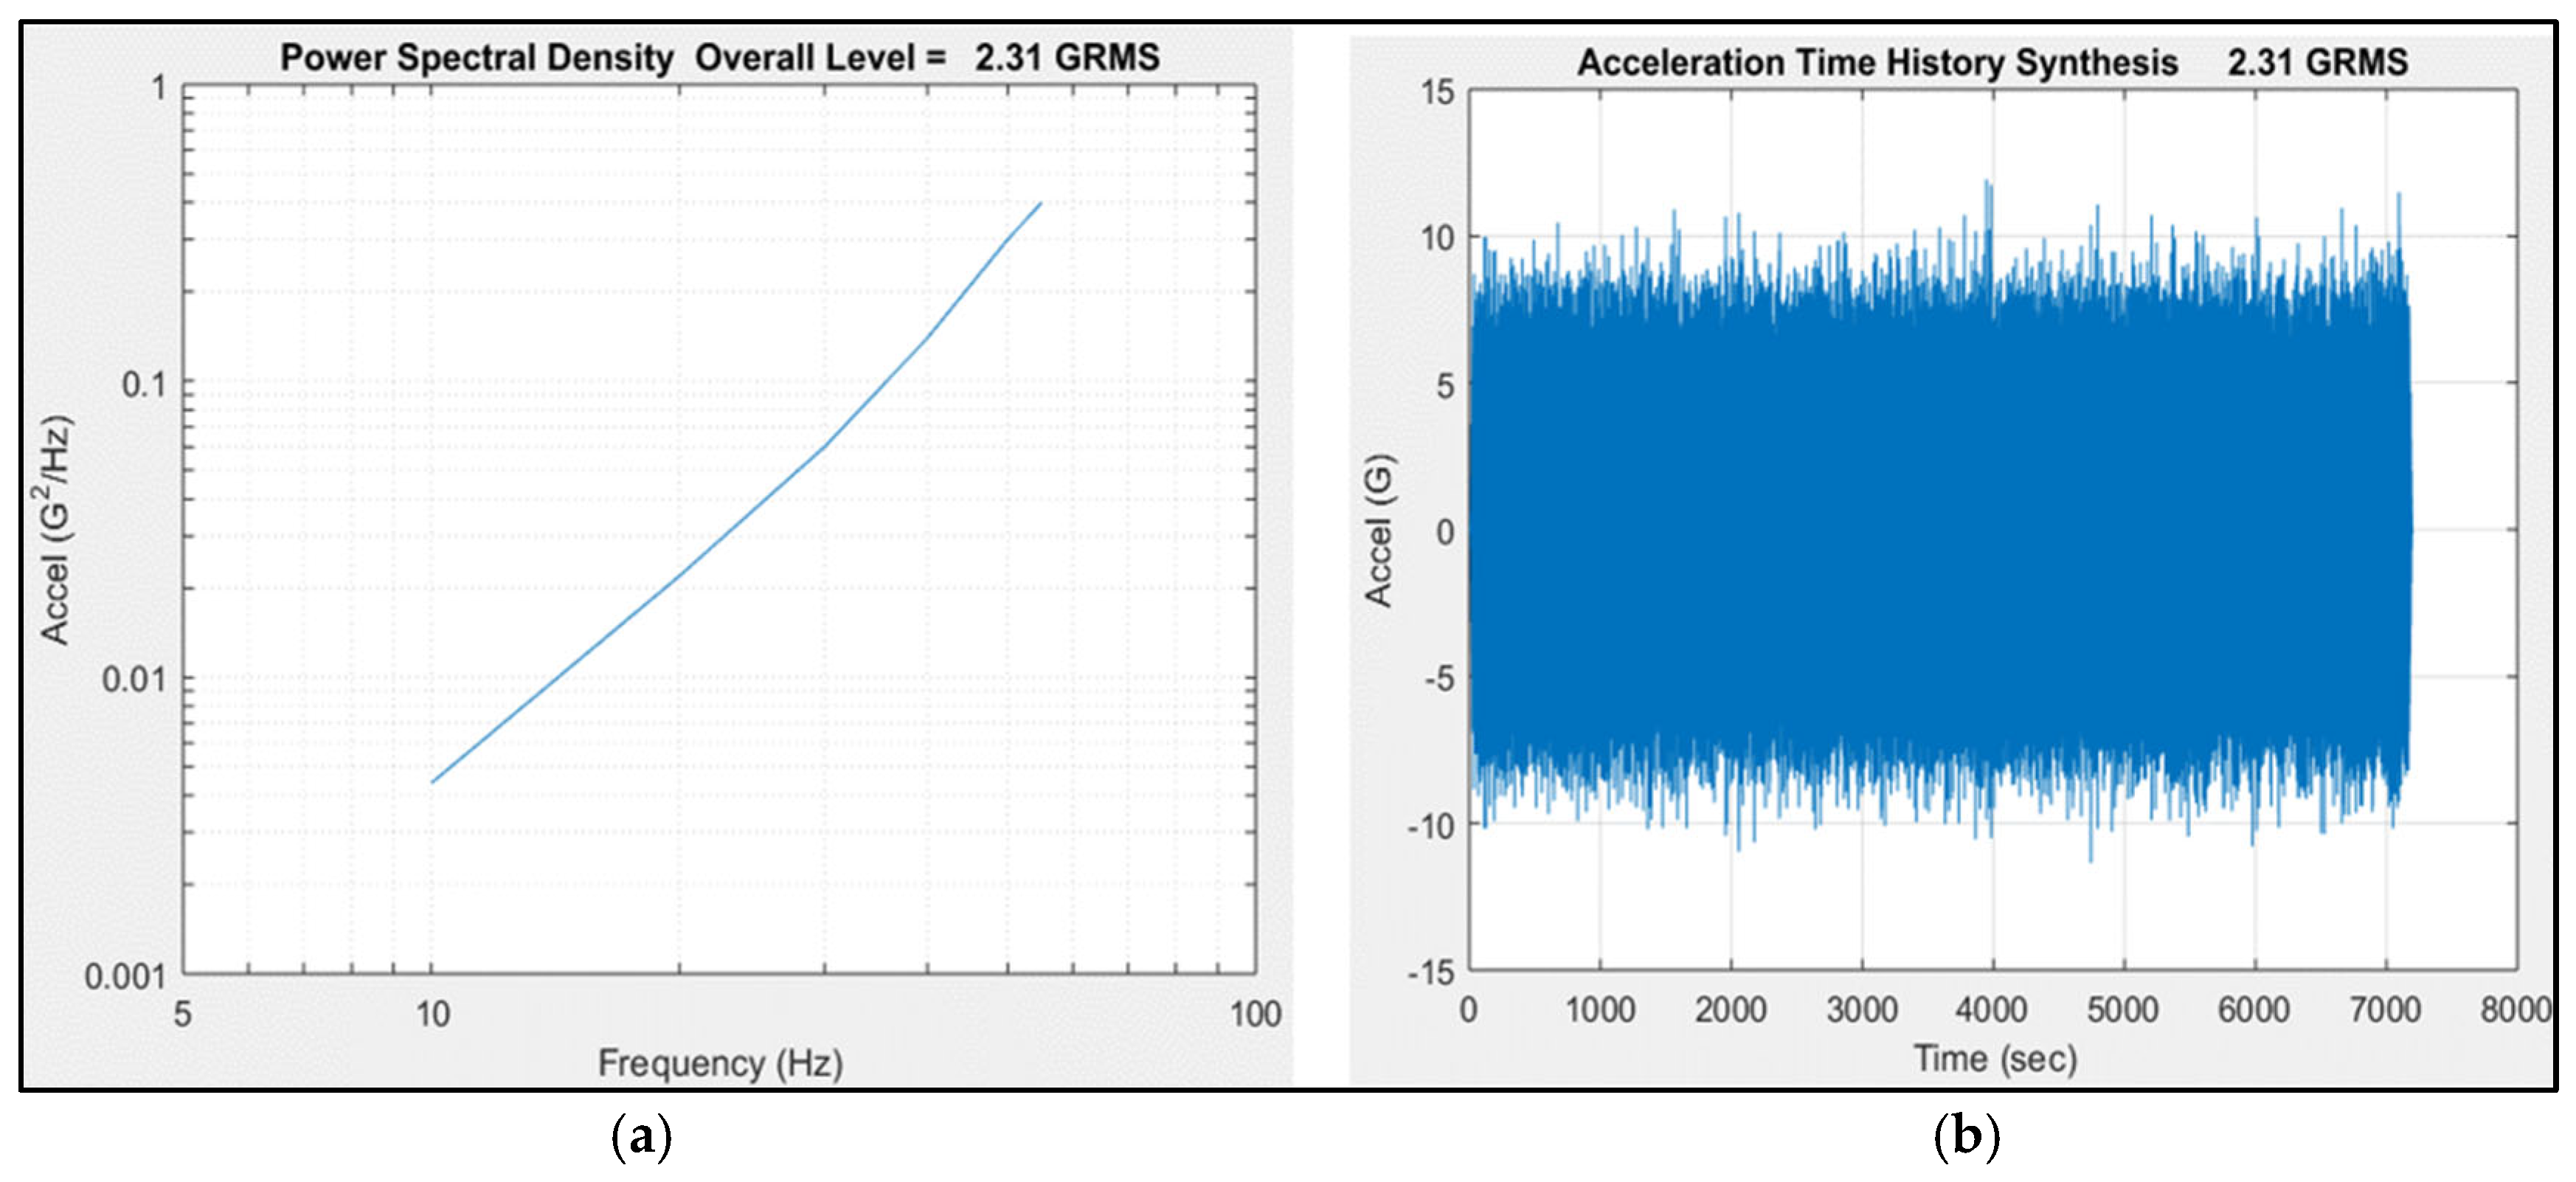
From Table 1, and by using Equation (14), the calculated Grms is 2.306, which represents the stress level of the forces induced by the mechanical vibration. Figure 2 shows the power spectral density (PSD) and its acceleration synthesis using the MATLAB R2024a software.
The next step consists of performing the mechanical vibration testing; the testing conditions are presented in Table 2.
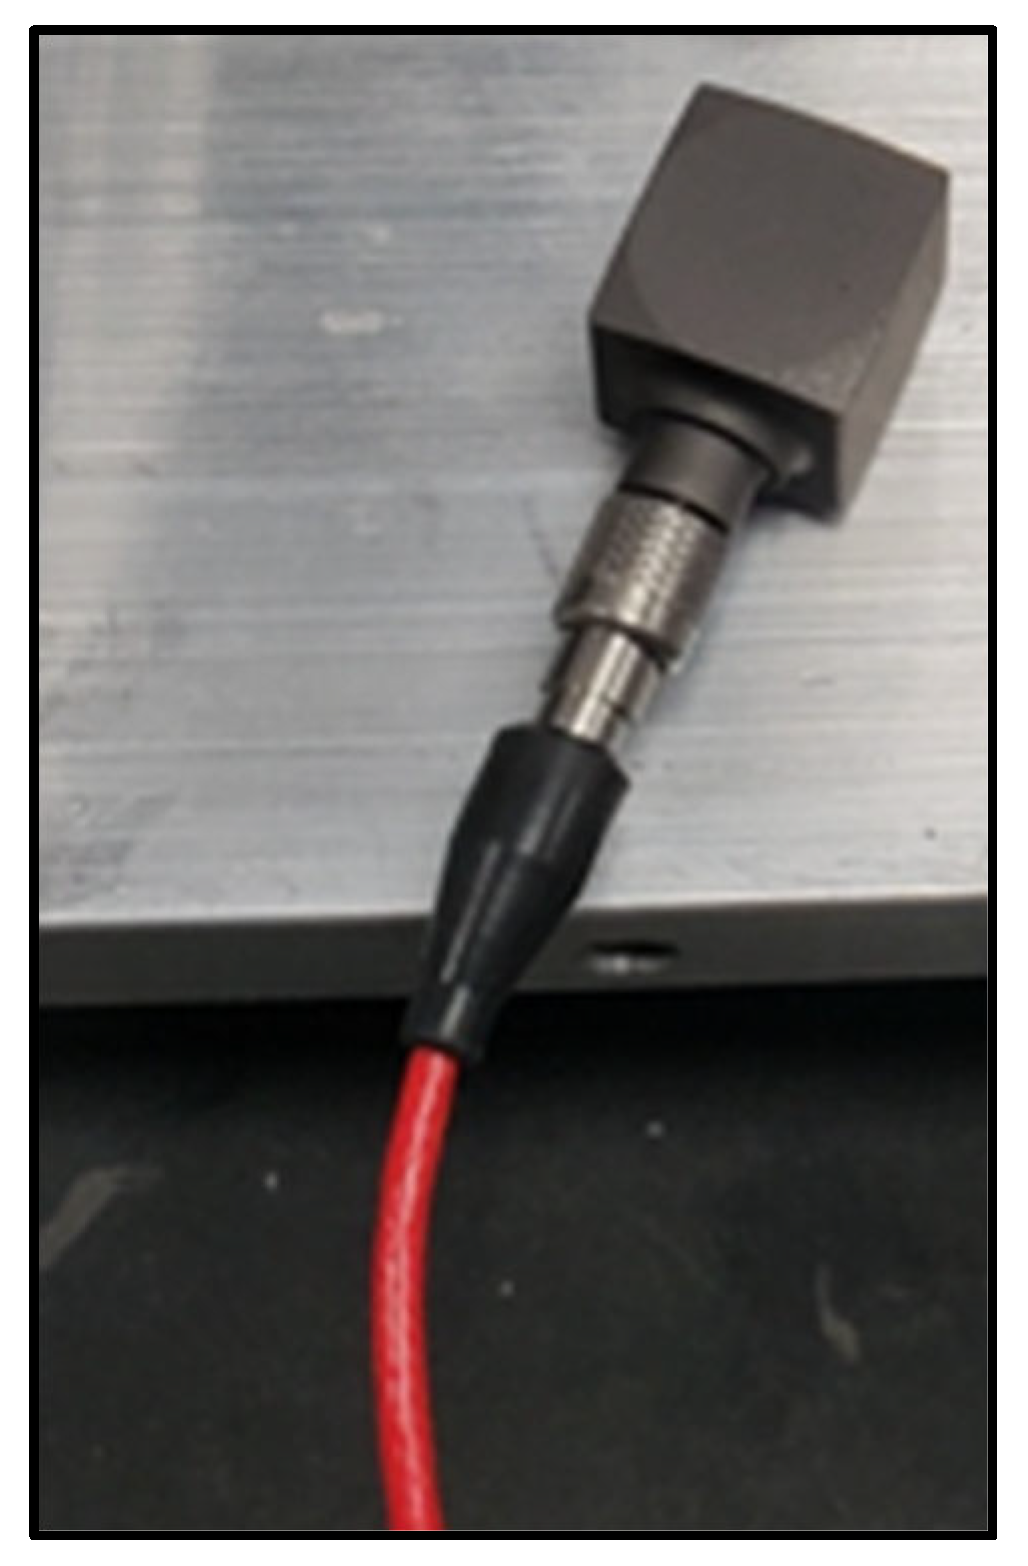
The vibration testing is performed by using a single-axis vibration electromechanical drum shaker PM250HP with a power amplifier and MB controller. The shaker’s fixture allows the fiber assembly connector-adapter to be installed in different orientations to test the fiber connectors in the three mutually perpendicular axes (X, Y, and Z). The piezoelectric accelerometer (see Figure 3) is placed near the connectors being tested to monitor the vibration level over the frequencies of interest stated by the vibration profile.
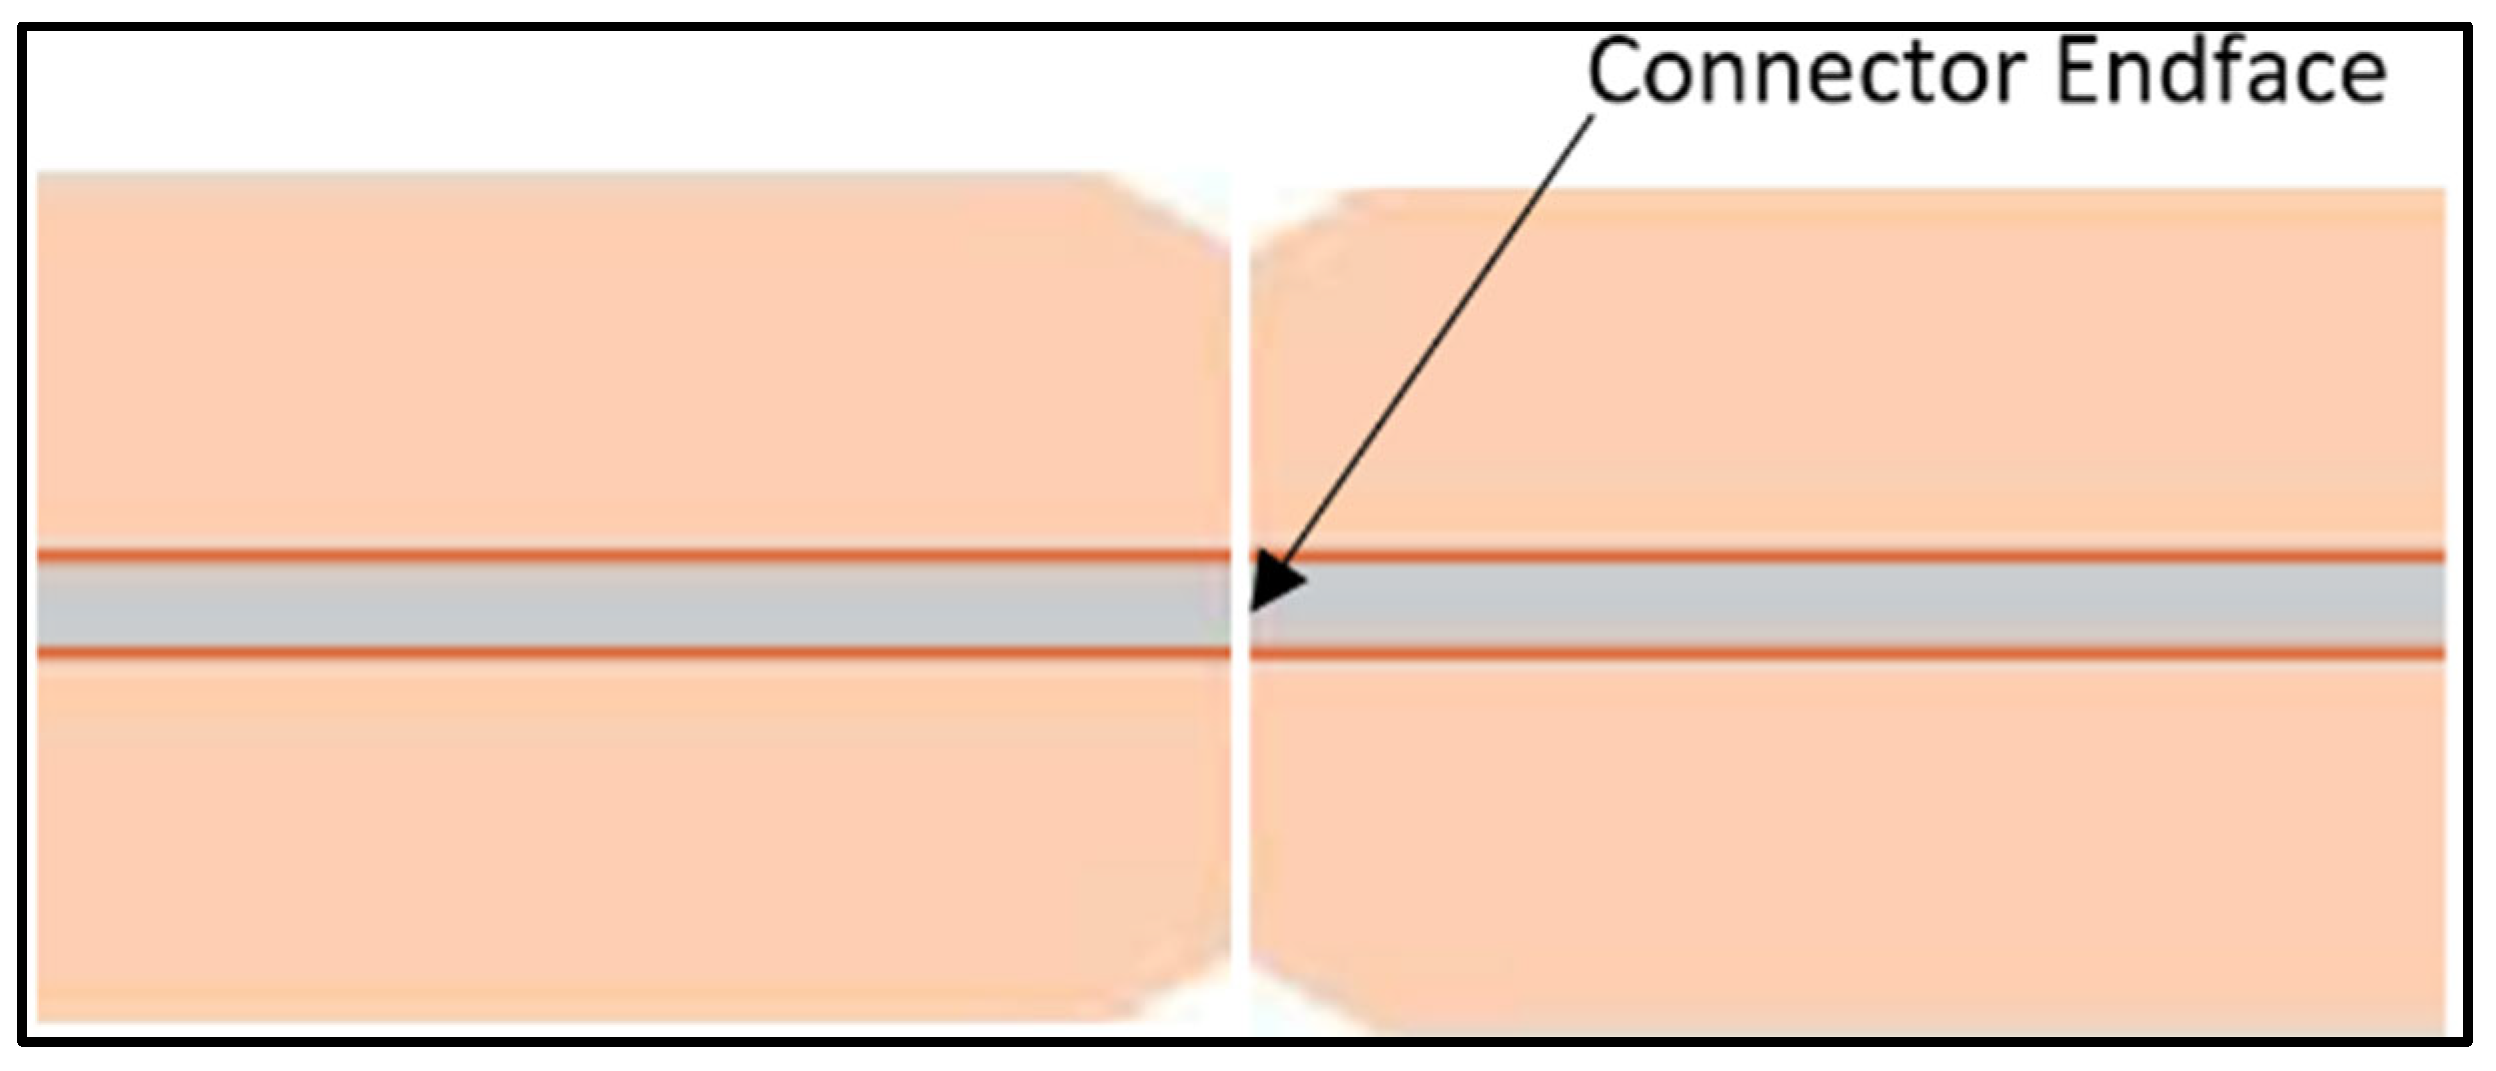
The samples to test are 21 optical SC angled PC polish fiber endface connectors [39], and their connection is according to Figure 4 [5].
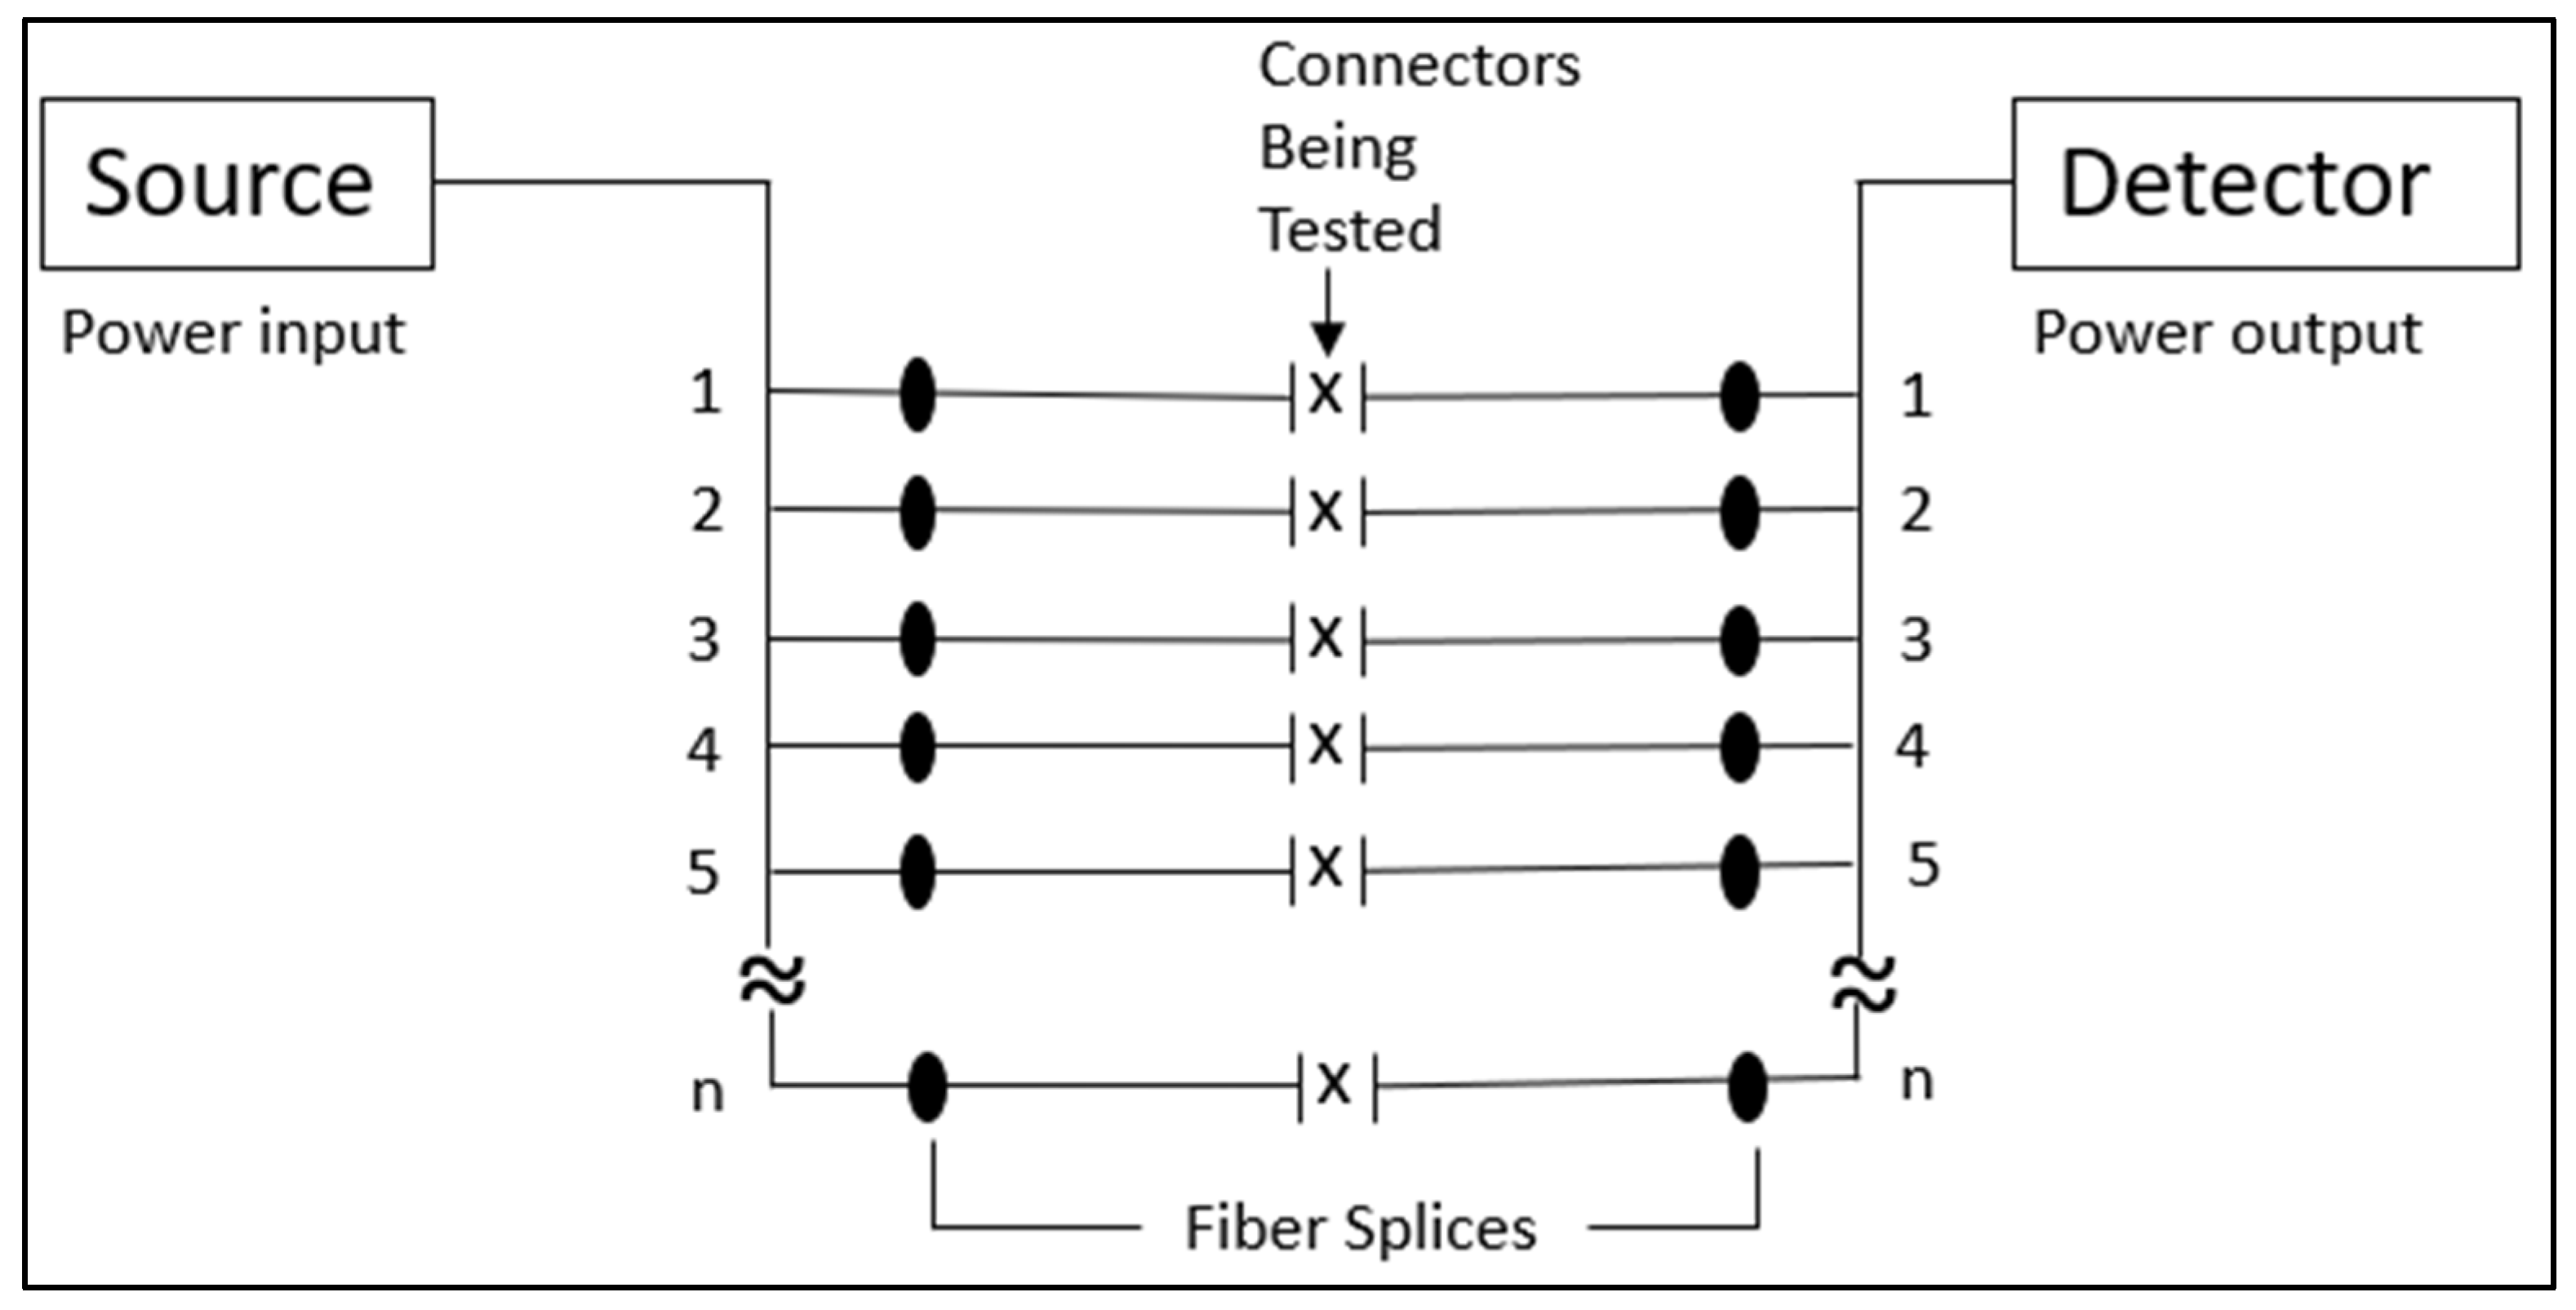
The samples are assembled in a mated pair configuration on the drum shaker, and at the same time the optical measurements are carried out by using the Agilent N7745A with dual LED source-detector at 1310 nm and 1550 nm. Standard fiber adapter SCs for the angled PC fiber connectors under test are used such that two endfaces are being tested during the experiment. The connector samples are examined to check for loosening before the vibration test. Then, the fiber splicing and connections are carried out according to the diagram shown in Figure 5 [5].

4. Results

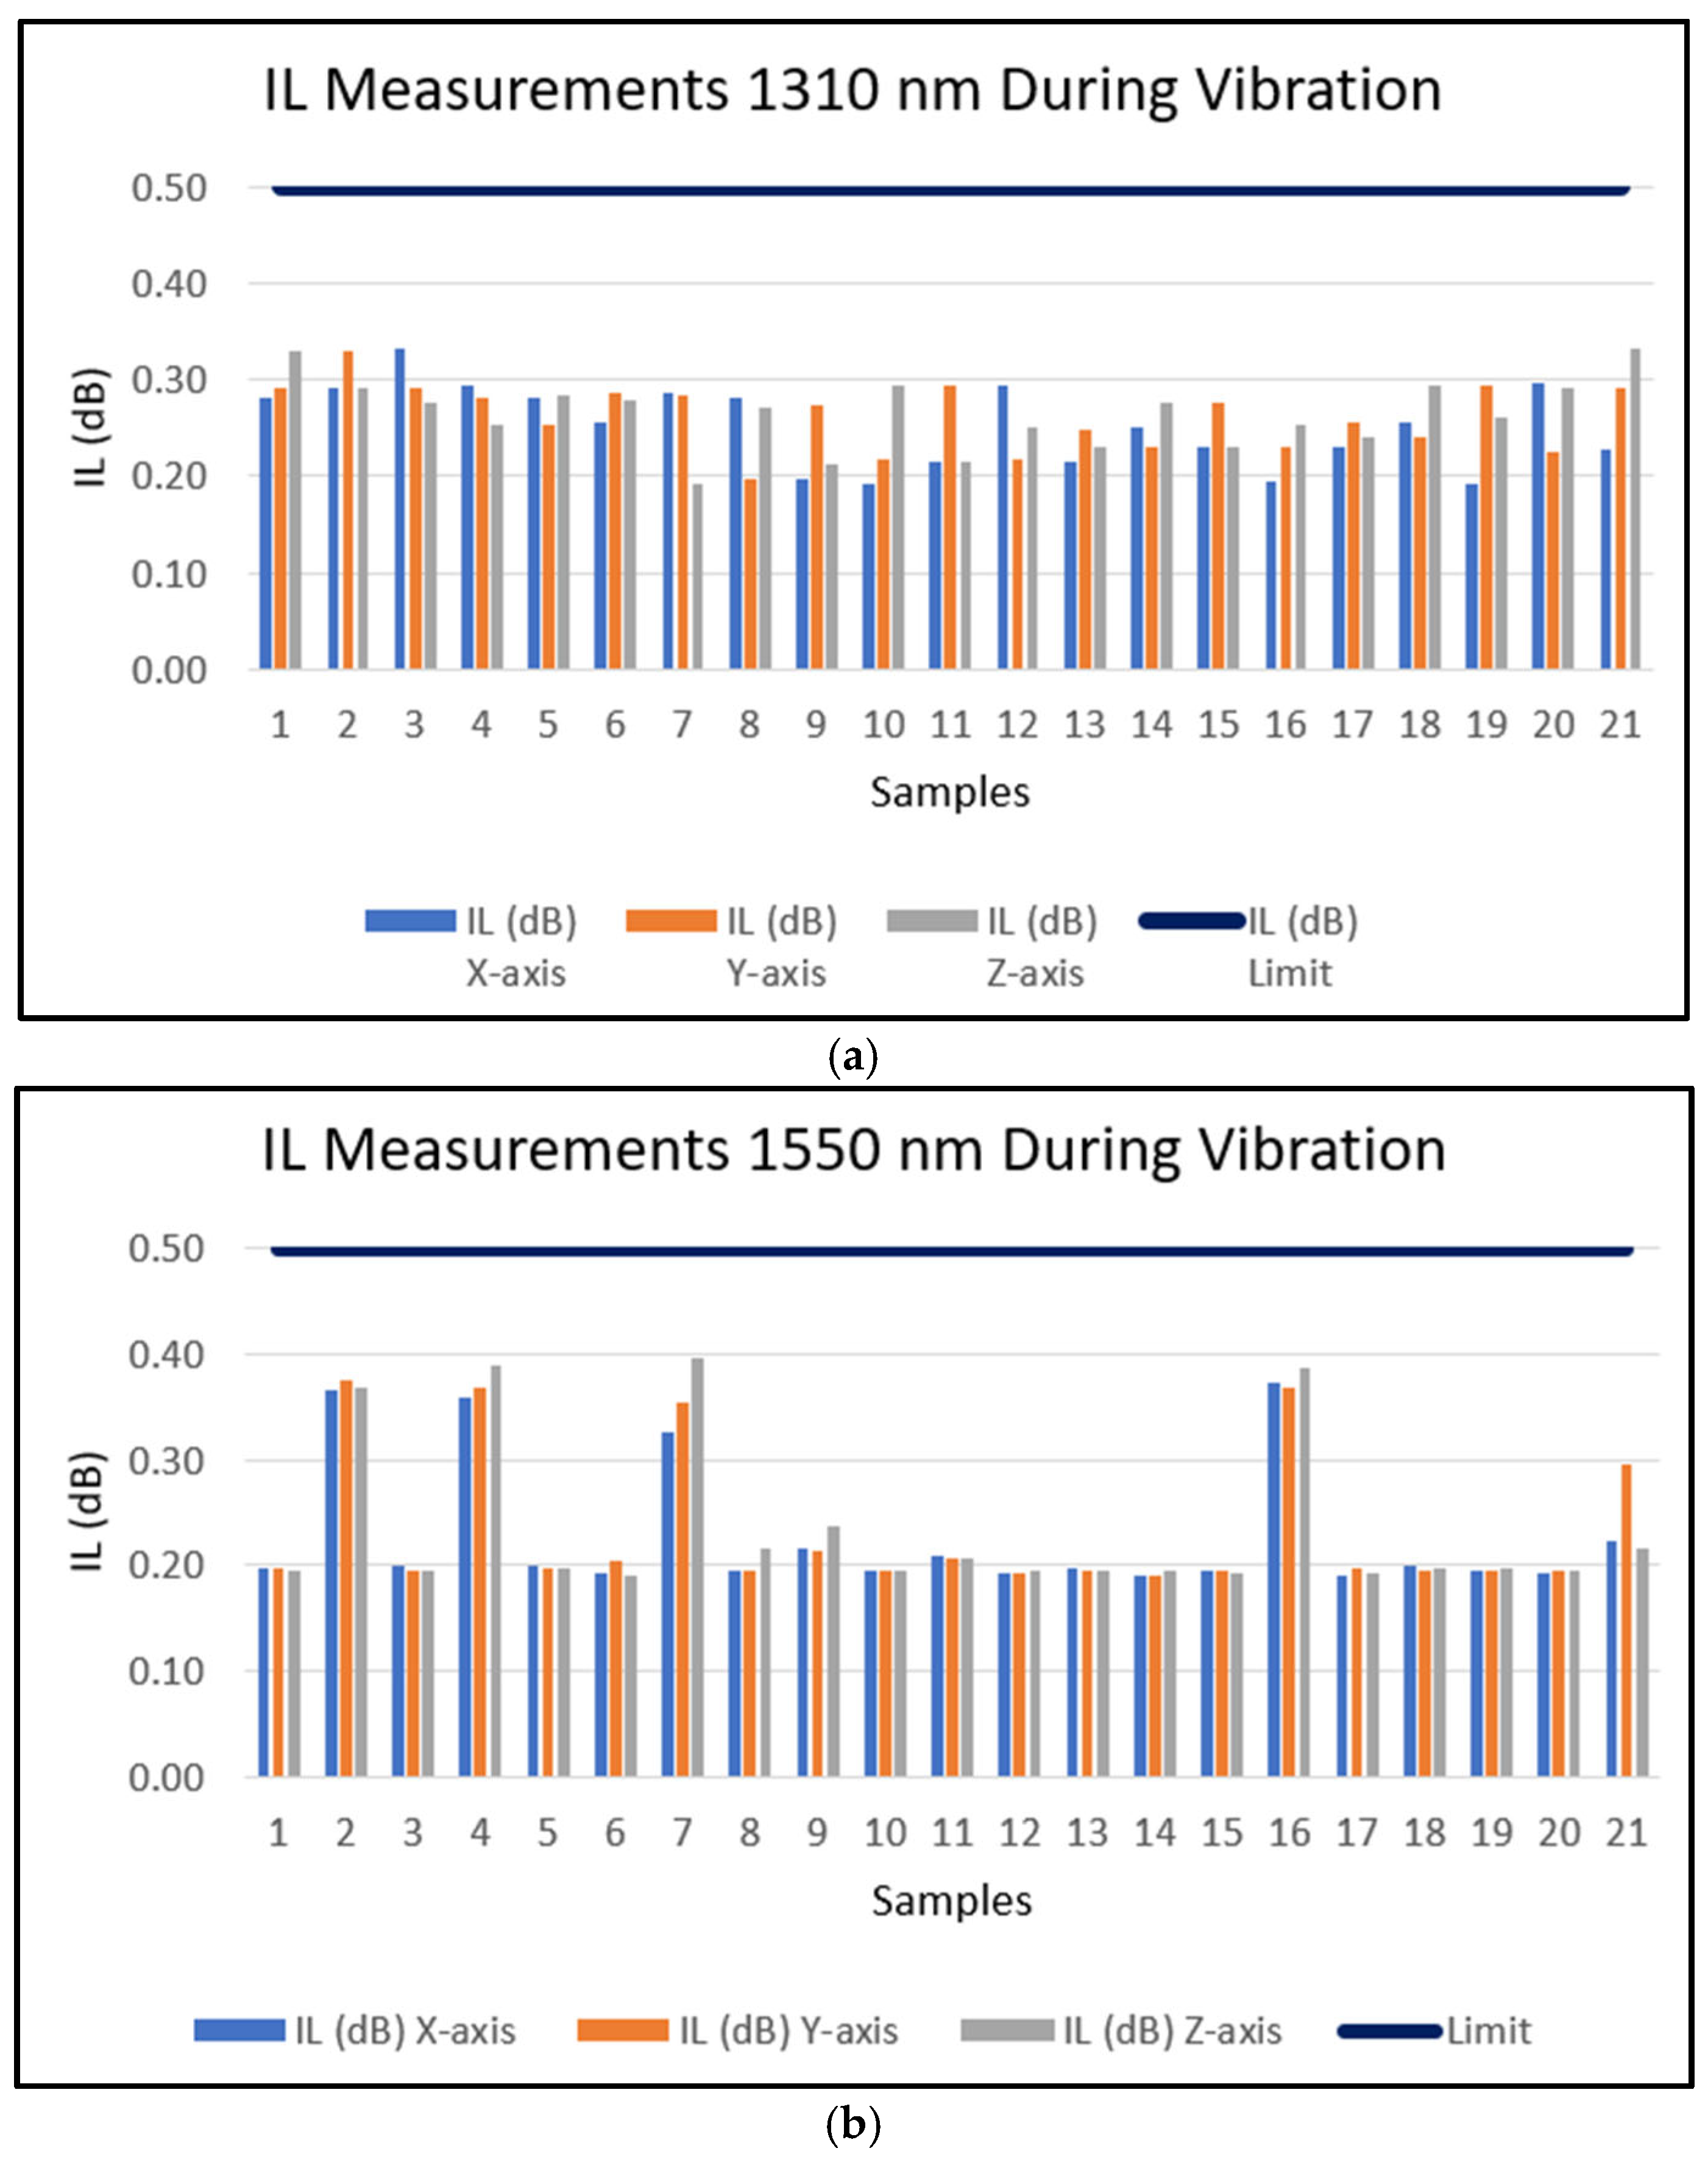
After performing the mechanical vibration testing under the conditions stated in Table 2, the samples’ IL measurements in dB are shown in Table 3 and in Figure 4, respectively, along the axis and wavelength designated. The 21 samples do meet the IL requirement under mechanical stress (≤0.5000 dB), and with those results, the Weibull statistical analysis is performed to determine the Weibull parameters and its reliability R(t).
From Table 3 and Figure 6, it is noticed that the maximum IL value is generated by the mechanical vibration induced in the Z-axis at 1550 nm. Thus, from these maximum ( σ 1 = 0.396 ) and minimum ( σ 2 = 0.191 ) IL values, with n = 21 in Equation (6), the Y i elements are determined. From Equation (7), its mean is μ y = 0.5456 . Consequently, from Equation (4), the Weibull shape parameter β I L is
β I L = ( 4 ) ( 0.5456 ) 0.9950 l n ( 0.3960 0.1910 ) = 3.0000
And since from Equation (8) the logarithm mean value is μ x = ln 0.396 × 0.1 . 91 = 1.2909 , then, from Equation (5), the Weibull parameter η I L is η I L = exp 1.2909 = 0.2750   d B . As a result, the corresponding Weibull IL family is W(3, 0.2750 dB). Using these Weibull parameters to perform the reliability analysis, for each of the 21 Y i elements, its corresponding t 0 i element is determined as
t 0 i = e x p { Y i / β I L }
Thus, the σ 1 i and σ 2 i values are determined, respectively, as
σ 1 i = η D / t 0 i
σ 2 i = η D   ×   t 0 i
Consequently, the t 0 i element that represents the observed σ 1 = 0.396 and σ 2 = 0.191 dB values is given as
t 01 = η I L / σ 1
By substituting the data in Equation (20), we have
t 01 = 0.2750 0.3960 = 0.6944
And the corresponding Y 1 value is given by
Y 1 = ln t 01 β I L
Y 1 = ln 0.6944 × 3 = 1.0967
Therefore, because from Equation (22), the Weibull reliability R(t) of the t 01 element is given by
R t = exp exp Y 1
then, the reliability of the element is R t = exp exp 1.0967 = 0.7153 . Here, it is essential to notice that this reliability index corresponds to an element that is experiencing an IL in the interval [0.1910 ≤ dB ≤ 0.3960], with a characteristic value of η = 0.2750 dB. The abovementioned results are depicted in Table 4.
Since the Max IL limit value (Strength) is η = 0.5000 dB, and the mean IL value is t = 0.2750 dB, with the value β = 3 , the reliability R(t) of the fiber optical connectors submitted to mechanical vibration in the experiment conducted is determined by using Equation (3) as follows
R t = e x p 0.2750 0.5000 3 = 0.8474
It should be noted that this reliability index corresponds to an element that is experiencing an IL in the interval [0.1910 ≤ dB ≤ 0.3960], with a characteristic value of η = 0.5000 dB. Thus, the Weibull statistic results from the experiment, following the formulation given in Section 3, are depicted in Table 5.

5. Discussion

In this investigation, since the β and η Weibull parameters completely represent the principal IL values, the significance of β = 3   typically indicates a failure rate that increases with time (wear-out phase), which is critical for understanding the degradation mechanism of fiber optic connectors under mechanical vibration stress. The η = 0.2570 represents the fiber connector’s characteristic life under the vibration testing conditions. The R(t)= 0.8474 means that at time t, there is an 84.74% probability that the fiber connector is still functioning without failure, which for network design might be acceptable but for preventive maintenance represents a ~15% chance of failure by time t. This suggests a need for scheduled inspections or replacements before reaching that time to avoid unexpected downtime. Previous studies were performed using service life program testing (temperature and humidity) as a stress factor and obtained a reliability R(t) = 0.6940. The difference is due to the service life testing program being more severe and causing more degradation to the connector’s IL than only vibration. The present methodology can be applied to different fiber connectors used in the telecommunication industry, such as LC, FC, ST, and MPT among others, but it is limited to inside plant applications. Also, the methodology can be used for other fiber components such as splitters and adapters. The theoretical contribution of this work lies in the direct estimation of Weibull parameters from maximal and minimal principal IL stresses which allows the reliability analysis. Regarding the results, the maximum IL values were obtained at a wavelength of 1550 nm in the Z-axis. The reasons for that are due to the Z-axis, which includes the accumulated vibration stress (fatigue) from testing of the X and Y axes. And the tensile stress caused by mechanical vibration loads induces fiber bending, which is reflected as a loss at 1550 nm. The experimental data reveal how the design of the SC connector and its materials respond to vibration fatigue. This can help manufacturers to optimize design (ferrule, housing, spring, and strain relief boot) for severe environments and improve connector selection for specific applications. From a test point of view, it should be noted that any change in test duration or vibration intensity will affect the Weibull parameter estimation results, and these results will need to be recalculated accordingly.

6. Conclusions and Future Directions

The reliability of fiber optic connectors is crucial because fiber connectors are responsible for maintaining precise alignment between fiber cores. The environmental vibration can cause micro-movements or misalignments, leading to increased IL, material fatigue in ferrules or housing, and the cracking or deformation of alignment structures. This reduces the lifespan and reliability of the connectors. Most existing studies focus on theoretical models or standardized tests. However, real-world vibration profiles, especially random vibration, are often less predictable. This study gives empirical data under realistic vibration conditions that provide insight into failure modes not captured by the deterministic vibration of standard tests. Also, the Weibull statistical distribution of IL induced by vibration stress with its confidence intervals for reliability estimates is given in Table 4. The reliability R(t) obtained was R(t) = 0.8474, with a characteristic value of η = 0.2750 dB. It was determined directly from the principal IL maximum and minimum values σ 1 = 0.3960 dB and σ 2   = 0.1910 dB. This Weibull analysis is proposed as vital in predicting the performance of fiber optic connectors required for service and applications in central offices and data centers, given the high importance of the optical transmission quality in the telecommunications industry. The experimental data reveals how the fiber connector responds to vibration fatigue and assists manufacturers in optimizing designs for rugged environments and improving connector selection for specific applications. The conducted Weibull analysis can be extended for future research, such as investigating the impact of combined environmental stresses, including vibration with temperature and humidity, or exploring different types of fiber optic connectors or vibration profiles [40]. Finally, based on the outcome of this study, future research may focus on developing advanced strategies to enhance the reliability of fiber optic connectors, thereby improving capabilities such as low-loss and ultrahigh data rates.

Author Contributions

Conceptualization, J.M.B.-C., M.R.P.-M. and S.R.-L.; methodology, J.M.B.-C., M.R.P.-M. and M.M.H.-R. data analysis, J.M.B.-C. and S.R.-L.; writing—original draft preparation, J.M.B.-C. and M.R.P.-M.; writing—review and editing, J.M.B.-C., M.R.P.-M. and S.R.-L.; supervision, M.R.P.-M. All authors have read and agreed to the published version of the manuscript.

Funding

The research received no external funding.

Data Availability Statement

The raw data supporting the conclusions of this article will be made available by the authors on request.

Acknowledgments

We appreciate the support of Secihti and the Autonomous University of Ciudad Juárez (UACJ) provided in this work.

Conflicts of Interest

The authors declare no conflicts of interest.

Abbreviations

The following abbreviations are used in this manuscript:
ILInsertion loss
dBDecibels
PCPhysical contact

References

  1. Fenta, M.C.; Potter, D.K.; Szanyi, J. Fibre Optic Methods of Prospecting: A Comprehensive and Modern Branch of Geophysics. Surv. Geophys. 2021, 42, 551–584. [Google Scholar] [CrossRef]
  2. Butt, M.A.; Voronkov, G.S.; Grakhova, E.P.; Kutluyarov, R.V.; Kazanskiy, N.L.; Khonina, S.N. Environmental Monitoring: A Comprehensive Review on Optical Waveguide and Fiber-Based Sensors. Biosensors 2022, 12, 1038. [Google Scholar] [CrossRef]
  3. Pandiaraj, S.; Krishnamoorthy, R.; Ushasukhanya, S.; Ramesh, J.V.N.; Alsowail, A.; Selvarajan, A. Optimization of IoT circuit for flexible optical network system with high speed utilization. Opt. Quantum Electron. 2023, 55, 1206. [Google Scholar] [CrossRef]
  4. Liu, X. Optical Communications in the 5G Era; Elsevier: London, UK, 2022; pp. 16–63. [Google Scholar]
  5. Barraza-Contreras, J.M.; Piña-Monarrez, M.R.; Hernández-Ramos, M.M.; Monclova-Quintana, O.; Ramos-Lozano, S. Acceleration of Service Life Testing by Using Weibull Distribution on Fiber Optical Connectors. Appl. Sci. 2024, 14, 6198. [Google Scholar] [CrossRef]
  6. Wang, R.; Xu, L.; Zhou, Y.; Li, Y. A Systematic Approach for the Reliability Evaluation of Electric Connector. J. Electr. Comput. Eng. 2021, 1, 1742. [Google Scholar] [CrossRef]
  7. Glaesemann, G.S. Optical Fiber Failure Probability Predictions from Long-Length Strength Distributions. In Proceedings of the 40th International Wire and Cable Symposium, St. Louis, MO, USA, 18 November 1991. [Google Scholar]
  8. Annovazzi-Ledi, V.; Donati, S.; Merlo, S.; Zapelloni, G. Statistical analysis of fiber failures under bending-stress fatigue. J. Light. Technol. 1997, 15, 288–293. [Google Scholar] [CrossRef]
  9. Zeng, Z.; Barros, A.; Coit, D. Dependent failure behavior modeling for risk and reliability: A systematic and critical literature review. Reliab. Eng. Syst. Saf. 2023, 239, 109515. [Google Scholar] [CrossRef]
  10. Shahriari, M.; Shahrasbi, H. Reliability analysis of lifetime systems based on Weibull distribution. Int. J Nonlinear Anal. Appl. 2024, 15, 321–329. [Google Scholar] [CrossRef]
  11. Gómez, Y.M.; Gallardo, D.I.; Marchant, C.; Sánchez, L.; Bourguignon, M. An In-Depth Review of the Weibull Model with a Focus on Various Parameterizations. Mathematics 2023, 12, 56. [Google Scholar] [CrossRef]
  12. Bhandari, K.B.; Shrestha, B.; Shrestha, S. Quantifying Optical Link Loss of Fiber-to-the-Home Infrastructure. Int. J. Adv. Smart Converg. 2024, 13, 48–58. [Google Scholar] [CrossRef]
  13. Khodayari, M. Vibration Analysis for Predictive Maintenance of Optical Fiber Cable Production Line. Master’s Thesis, Aalto University, Espoo, Finland, 2024. [Google Scholar]
  14. Wang, L.; Pan, Y.; Li, K.; He, L.; Wang, Q.; Wang, W. Modeling and Reliability Analysis of MEMS Gyroscope Rotor Parameters under Vibrational Stress. Micromachines 2024, 15, 648. [Google Scholar] [CrossRef]
  15. Bagri, I.; Tahiry, K.; Hraiba, A.; Touil, A.; Mousrij, A. Vibration Signal Analysis for Intelligent Rotating Machinery Diagnosis and Prognosis: A Comprehensive Systematic Literature Review. Vibration 2024, 7, 1013–1062. [Google Scholar] [CrossRef]
  16. Guo, P.; Xiong, Z.; Dong, Z.; Zhang, S. Spindle vibration induced optical performance deterioration and its trans-scale characterization for diamond turned large-aperture optics. Appl. Opt. 2024, 63, 8380–8388. [Google Scholar] [CrossRef]
  17. Papapavlou, C.; Paximadis, K.; Uzunidis, D.; Tomkos, I. Toward SDM-Based Submarine Optical Networks: A Review of Their Evolution and Upcoming Trends. Telecom 2022, 3, 234–280. [Google Scholar] [CrossRef]
  18. McKenzie, I.; Ibrahim, S.; Haddad, E.; Abad, S.; Hurni, A.; Cheng, L.K. Fiber Optic Sensing in Spacecraft Engineering: An Historical Perspective from the European Space Agency. Front. Phys. 2021, 9, 719441. [Google Scholar] [CrossRef]
  19. Indmeskine, F.; Saintis, L.; Kobi, A. Review on accelerated life testing plan to develop predictive reliability models for electronic components based on design-of-experiments. Qual. Reliab. Eng. Int. 2023, 39, 2594–2607. [Google Scholar] [CrossRef]
  20. Edson, L. The GMW3172 Users Guide; The Electrical Validation Engineers Handbook Series; Electrical Component Testing; General Motors Co.: Detroit, MI, USA, 2015. [Google Scholar]
  21. Woo, S. Introduction to the Necessity of Design Methodology. In Design of Mechanical Systems; Springer Series in Reliability Engineering; Springer: Berlin/Heidelberg, Germany, 2023; pp. 1–49. [Google Scholar]
  22. Ghazali, M.H.M.; Rahiman, W. Vibration Analysis for Machine Monitoring and Diagnosis: A Systematic Review. Shock. Vib. 2021, 1, 3148. [Google Scholar] [CrossRef]
  23. Rauber, T.W.; da Silva Loca, A.L.; Boldt, F.D.A.; Rodrigues, A.L.; Varejão, F.M. An experimental methodology to evaluate machine learning methods for fault diagnosis based on vibration signals. Expert Syst. Appl. 2021, 167, 114022. [Google Scholar] [CrossRef]
  24. Uzunidis, D.; Logothetis, M.; Stavdas, A.; Hillerkuss, D.; Tomkos, I. Fifty years of fixed optical networks evolution: A survey of architectural and technological developments in a layered approach. Telecom 2022, 3, 619–674. [Google Scholar] [CrossRef]
  25. Xu, M.; Mao, H. q-Weibull Distributions: Perspectives and Applications in Reliability Engineering. IEEE Trans. Reliab. 2024. Early Access. [Google Scholar] [CrossRef]
  26. Yadav, A.K.; Malik, H.; Yadav, V.; Alotaibi, M.A.; Márquez, F.G.; Afthanorhana, A. Comparative analysis of Weibull parameters estimation for wind power potential assessments. Results Eng. 2024, 23, 102300. [Google Scholar] [CrossRef]
  27. Weibull, W. A Statistical Theory of the Strength of Materials; Generalstabens Litografiska Anstalts Forlag: Stockholm, Sweden, 1939. [Google Scholar]
  28. Piña-Monarrez, M.R. Weibull stress distribution for static mechanical stress and its stress/strength analysis. Qual. Reliab. Eng. Int. 2018, 34, 229–244. [Google Scholar] [CrossRef]
  29. Tran, M.Q.; Sousa, H.S.; Ngo, T.V.; Nguyen, B.D.; Nguyen, Q.T.; Nguyen, H.X.; Baron, E.; Matos, J.; Dang, S.N. Structural Assessment Based on Vibration Measurement Test Combined with an Artificial Neural Network for the Steel Truss Bridge. Appl. Sci. 2023, 13, 7484. [Google Scholar] [CrossRef]
  30. Li, J.; Wang, Y.; Wang, P.; Bai, Q.; Gao, Y.; Zhang, H.; Jin, B. Pattern Recognition for Distributed Optical Fiber Vibration Sensing: A Review. IEEE Sensors J. 2021, 21, 11983–11998. [Google Scholar] [CrossRef]
  31. Telcordia. Generic Requirements for Singlemode Optical Connectors and Jumper Assemblies GR-326, 4th ed.; Telcordia: Piscataway, NJ, USA, 2010; pp. 4–17. [Google Scholar]
  32. Park, B.-C.; Seo, S. Development of a Handheld Optical Fusion Splicer with a Wing Sleeve Optical Connector. Electronics 2023, 12, 4629. [Google Scholar] [CrossRef]
  33. Psaila, N.; Nekkanty, S.; Shia, D.; Tadayon, P. Detachable Optical Chiplet Connector for Co-Packaged Photonics. J. Light. Technol. 2023, 41, 6315–6323. [Google Scholar] [CrossRef]
  34. Shi, Y.; Liu, X.; Ma, L.; Immonen, M.; Zhu, L.; He, Z. Optical printed circuit boards with multimode polymer waveguides and pluggable connectors for high-speed optical interconnects. Opt. Express 2023, 31, 27776–27789. [Google Scholar] [CrossRef]
  35. Brückner, V. Fiber Optic Connections and Couplers; Elements of Optical Networking; Springer: Berlin/Heidelberg, Germany, 2024; pp. 67–80. [Google Scholar]
  36. Unión Internacional de Telecomunicaciones. Empalmes de Fibra Óptica; Recomendación UIT-T L.12; UIT-T: Geneva, Switzerland, 2001; pp. 14–19. [Google Scholar]
  37. Piña-Monarrez, M.R.; Ramos-López, M.L.; Alvarado-Iniesta, A.; Molina-Arredondo, R.D. Robust sample size for Weibull demonstration test plan. DYNA 2016, 83, 52–57. [Google Scholar] [CrossRef]
  38. Piña-Monarrez, M.R. Weibull analysis for normal/accelerated and fatigue random vibration test. Qual. Reliab. Eng. Int. 2019, 35, 2408–2428. [Google Scholar] [CrossRef]
  39. Kamimura, K.; Fujimaki, Y.; Matsuda, K.; Nagase, R. Ferrule Endface Dimension Optimization for Standard Outer Diameter 4-Core Fiber Connector. IEICE Trans. Electron. 2023, E106, 781–788. [Google Scholar] [CrossRef]
  40. Fathi, E.; Belyadi, F.; Adenan, M.F.; Pacheco, C. Application of Fiber Optics for Completion Design Optimization: A Methodological Approach and Key Findings. Fuels 2024, 5, 33–52. [Google Scholar] [CrossRef]
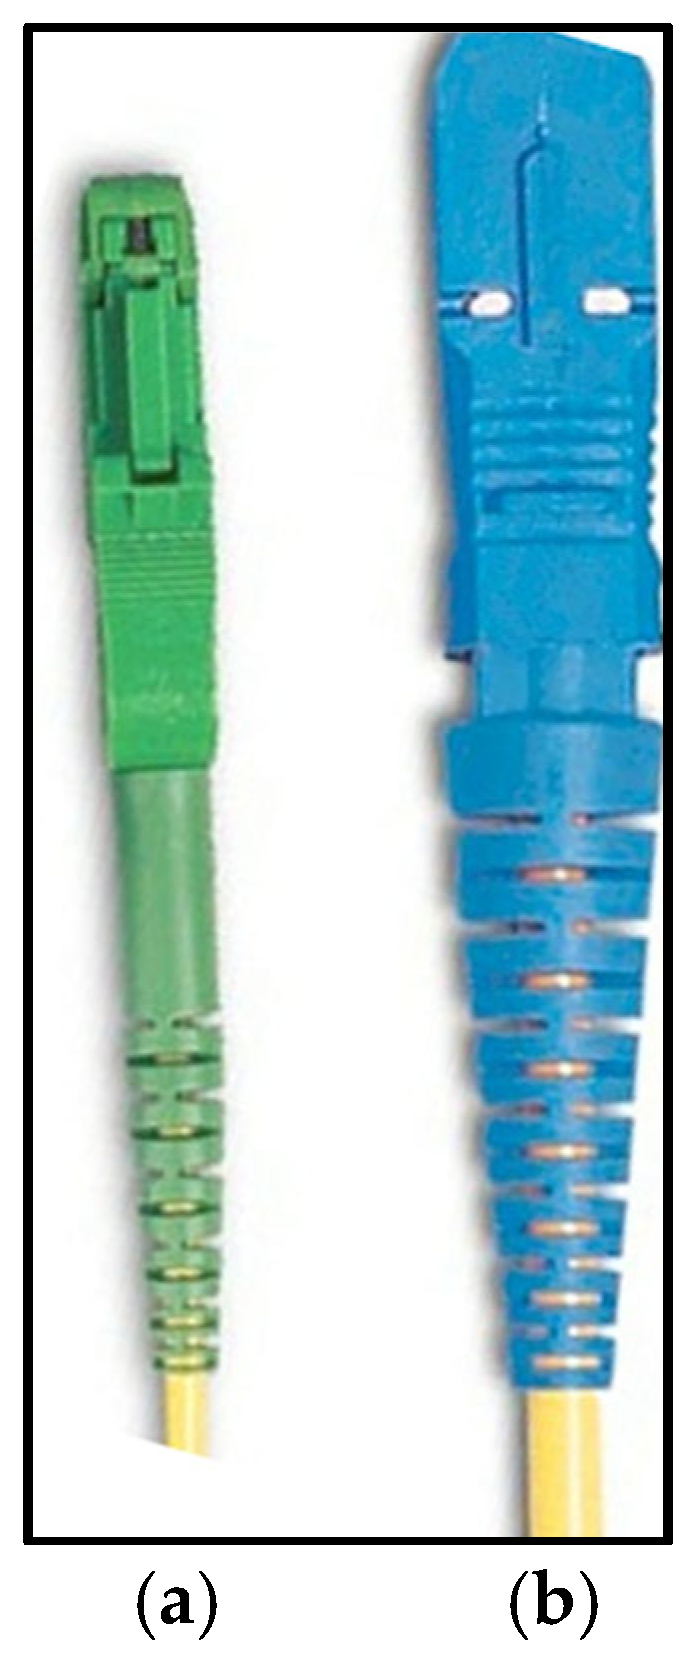
Figure 1. Fiber optical connectors. (a) LC. (b) SC.
Vibration 08 00046 g001
Figure 2. Vibration profile. (a) PSD. (b) Acceleration synthesis (7200 seg.).
Vibration 08 00046 g002
Figure 3. Piezoelectric accelerometer (10 mv/m/s2 sensitivity, 490 m/s2 range, 10–32 tapped hole).
Vibration 08 00046 g003
Figure 4. Representation of PC polish of fiber endface connection.
Vibration 08 00046 g004
Figure 5. Connection of the monitoring IL measurements in dB of the 21 connector samples under mechanical vibration stress.
Vibration 08 00046 g005
Figure 6. IL results during vibration test (a) at 1310 nm and (b) at 1550 nm.
Vibration 08 00046 g006
Table 1. GR-326 vibration profile.
fi (Hz)PSDi (G2/Hz)dB
Equation (12)
Oct
Equation (13)
m
Equation (11)
Ai
Equation (10)
Grms
Equation (14)
100.00400.00000.00000.00000.0400
200.02006.9901.00006.99000.1080
300.06004.7710.58508.15600.3770
400.14003.6800.41508.86600.9630
500.30003.3100.322010.28202.1290
550.40001.2490.13809.08601.7420
5.32002.3060
Table 2. Test conditions for environmentally induced vibration.
CategoryCondition
TestingGR-326 I4
Mechanical vibration 2.3060 Grms
with 2 h per axis
Optical MonitoringIL—During test at 1310 nm and 1550 nm
Table 3. Summary of IL results during mechanical vibration.
Sample IDIL (dB) X-AxisIL (dB) Y-AxisIL (dB) Z-Axis
1310 nm1550 nm1310 nm1550 nm1310 nm1550 nm
10.28100.19800.29100.19800.33000.1940
20.29200.36500.33000.37500.29100.3680
30.33300.19900.29200.19400.27500.1960
40.29400.35900.28100.36700.25200.3890
50.28200.19900.25300.19700.28400.1970
60.25600.19300.28600.20400.27900.1910
70.28600.32500.28300.35400.19300.3960
80.28100.19500.19600.19600.27100.2150
90.19800.21500.27300.21300.21300.2380
100.19200.19500.21700.19500.29300.1960
110.21500.20900.29500.20600.21500.2060
120.29500.19300.21700.19300.25000.1950
130.21600.19800.24900.19500.22900.1950
140.25000.19100.22900.19100.27500.1960
150.23100.19600.27500.19400.22900.1930
160.19400.37200.23000.36800.25400.3870
170.23100.19100.25500.19800.24000.1930
180.25600.19900.24100.19400.29500.1980
190.19300.19600.29500.19400.26000.1980
200.29700.19200.22500.19400.29100.1950
210.22800.22400.29100.29600.33100.2170
Max IL0.33300.37200.33000.37500.33100.3960
Min IL0.19200.19100.19600.19100.19300.1910
Table 4. Statistical analysis of Weibull IL induced by mechanical vibration experiment.
niYi
Equation (21)
µy
Equation (7)
toi
Equation (17)
R(toi)
Equation (22)
σ2i
Equation (19)
σ1i
Equation (18)
1−3.4035−0.17020.32260.96730.08870.8525
−3.0446−0.14500.36350.95350.10000.7567
2−2.4917−0.12460.43680.92060.12010.6296
3−2.0035−0.10020.51380.87380.14130.5353
−1.7982−0.59780.55000.84740.15130.5000
4−1.6616−0.08310.57560.82710.15830.4778
5−1.3944−0.06970.62910.78040.17300.4372
6−1.1721−0.05860.67730.73360.18630.4060
−1.0967−0.36460.69450.71610.19100.3960
7−0.9794−0.04900.72210.68690.19860.3808
8−0.8074−0.04040.76460.64020.21030.3597
9−0.6505−0.03250.80550.59350.22150.3414
10−0.5045−0.02520.84560.54670.23260.3252
11−0.3665−0.01830.88530.50000.24350.3107
12−0.2341−0.01170.92510.45330.25440.2973
13−0.1053−0.00530.96560.40650.26560.2848
140.02190.00111.00730.35980.27700.2730
150.14950.00751.05100.31310.28900.2617
160.27980.01401.09750.26640.30180.2506
170.41600.02081.14830.21960.31580.2395
180.56250.02811.20560.17290.33160.2281
190.72760.03641.27360.12620.35030.2159
200.92930.04651.36190.07940.37460.2019
211.22970.06151.50490.03270.41390.1827
β = 3.0000     ƞ = 0.2570   µy = −0.6344   σ1 = 0.3960   σ2 = 0.1910
Bold: The principal IL  σ 1 and σ 2 values induced by vibration, the R(t) index of 0.9535, and the R(t) index of the Max IL limit value of σ 1   = 0.5000 dB.
Table 5. Weibull vibration IL results.
WeibullMechanical Vibration Testing
Shape parameter ( β ) 3.0000
Scale parameter ( η ) 0.2570
Mean ( μ y ) −0.5456
Log-mean ( μ x ) −1.2909
Reliability [ R t ]0.8474
Disclaimer/Publisher’s Note: The statements, opinions and data contained in all publications are solely those of the individual author(s) and contributor(s) and not of MDPI and/or the editor(s). MDPI and/or the editor(s) disclaim responsibility for any injury to people or property resulting from any ideas, methods, instructions or products referred to in the content.