4.1. Solution of FPK Equation Based on GRBFNN
The Fokker–Planck–Kolmogorov (FPK) equation serves as a fundamental partial differential equation for describing the evolution of state probability density functions in complex nonlinear stochastic dynamical systems, playing a crucial role in analyzing probabilistic response characteristics. However, obtaining analytical solutions for FPK equations becomes increasingly challenging due to their high-dimensional and nonlinear nature, particularly for multi-degree-of-freedom systems. To overcome these difficulties, this study proposes a numerical solution methodology for Equation (45) based on Generalized Radial Basis Function Neural Networks (GRBFNNs). The GRBFNN approach approximates probability density functions through linear combinations of Gaussian basis functions, effectively handling high-dimensional problems while maintaining high computational accuracy and numerical stability.
The schematic diagram of the Radial Basis Function Neural Network (RBFNN) general structure and Gaussian-based implementation are displayed in
Figure 3 [
32].
The number of training samples collected within the domain
is
, and the number of sample points collected on the boundary
is
. Assuming the time-dependent response of the probability density function for the reliability function derived from the RBFNN algorithm is denoted as
, let
represent the solution at the
-th step, such that
, where
is the time step size. Consequently, the solution of the RBFNN with Gaussian kernels can be expressed as
where
represents the number of Gaussian basis functions; the number of the training data should be at least 4 times the number of neurons, i.e.,
, and
denotes the time-varying weight coefficient for the
-th basis function. The Gaussian basis function
is defined as the probability density function of a four-dimensional normal distribution:
Here,
represents the mean vector, and
denotes the covariance matrix. To simplify calculations and enhance numerical stability,
is typically chosen as a diagonal matrix [
32].
To ensure that the approximation function
satisfies the fundamental properties of probability density functions, the weight coefficients must fulfill the normalization condition:
An explicit finite difference scheme is employed for discretizing the time derivative:
where
represents the time step size,
indicates the time level, and
denotes the weight vector at the
-th time instant. Furthermore, substituting the time-discretized expression into the FPK equation, the residual function is defined as
where
represents the FPK operator, specifically the spatial differential operator on the right-hand side of the equation. Through further algebraic manipulation, the residual function can be reformulated as
This introduces an auxiliary function:
For convenience, a least-squares loss function is defined over the spatial discrete point set
:
Considering the normalization constraint condition, the Lagrange multiplier method is employed to construct the constrained optimization objective function:
where
represents the Lagrange multiplier. Defining the extended variable vector
, the objective function can be expressed in quadratic form [
33]:
where the coefficient matrices and vectors are defined as follows: the system matrix
, the load vector
and
, the basis function vector
, and the constant term
.
By taking the derivative of the objective function and setting it to zero, the optimality condition is obtained [
33]:
Since matrix
is symmetric, the final linear system can be expressed as
The optimal weight vector
and the corresponding Lagrange multiplier
can be extracted from the solved
. Consequently, the marginal probability density function of system state variable
can be obtained through integration of the joint probability density function. Within the GRBFNN framework, the marginal density function possesses an analytical expression 7:
where
and
represent the mean and standard deviation of the
-th Gaussian basis function for the
-th state component, respectively.
Taking the suspended cable characteristics of the Pearl River Huangpu Bridge from
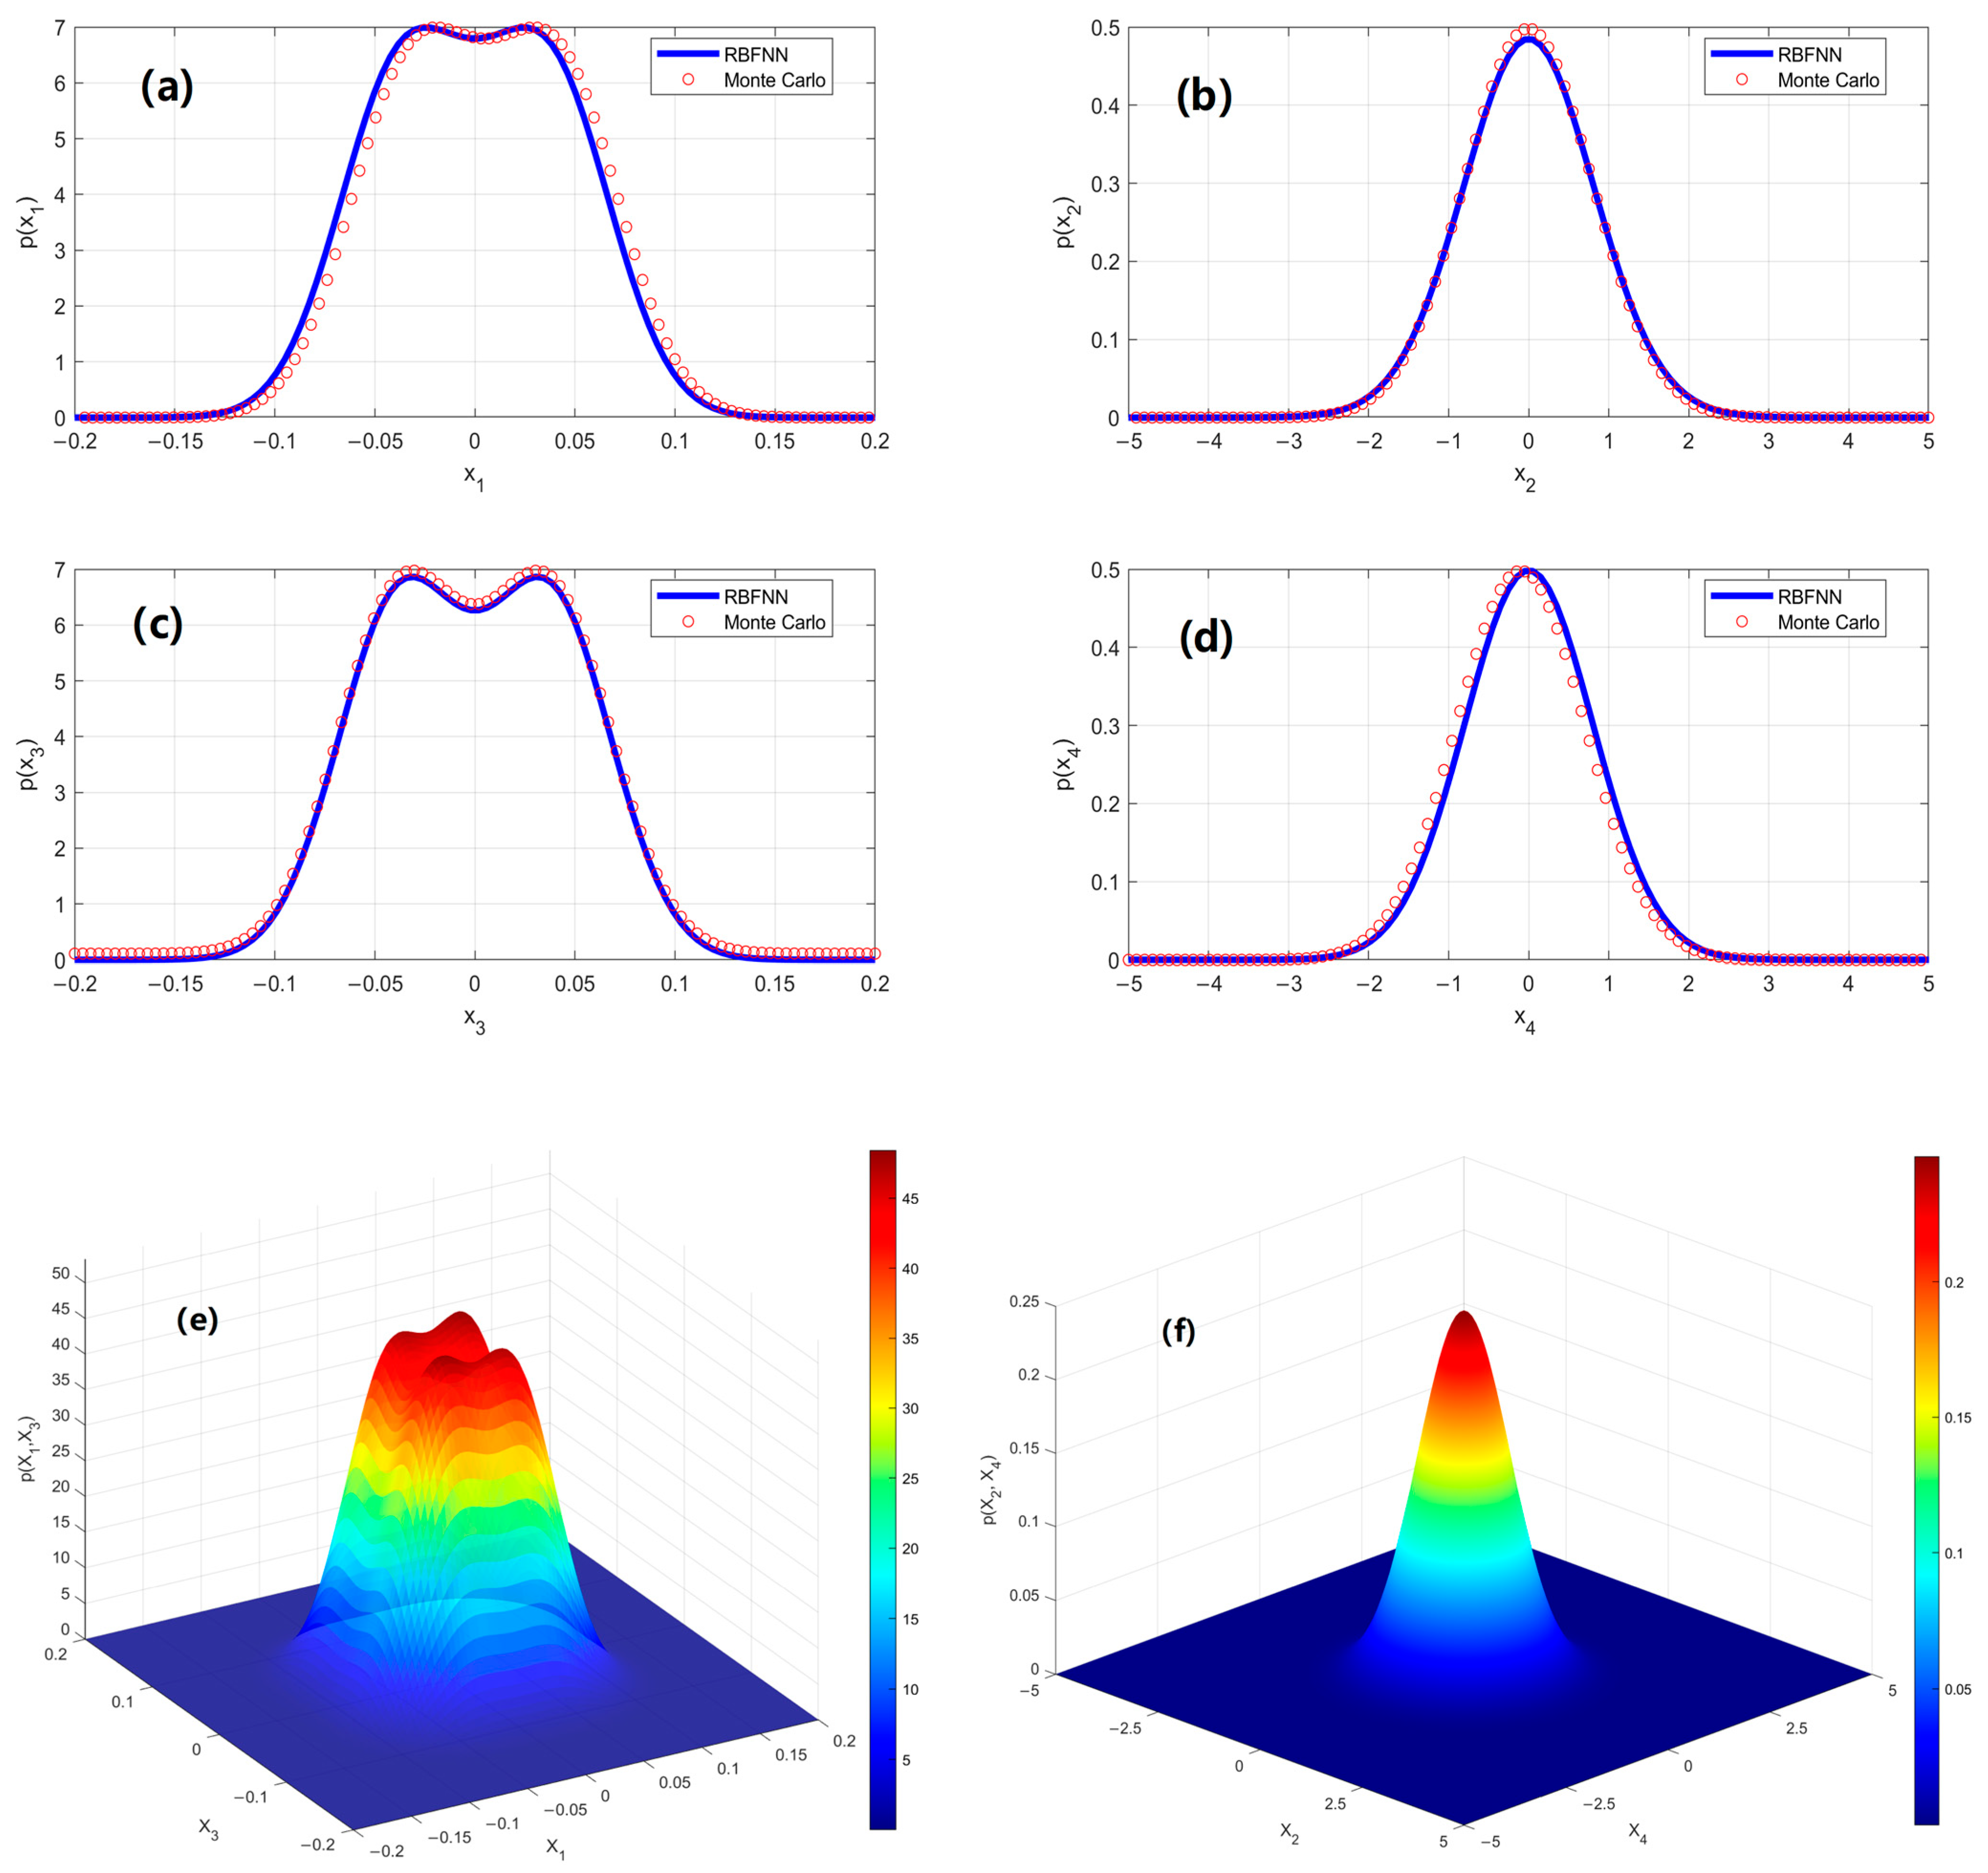
Section 2.4 as a case study, determine the probability density function (PDF) of the steady-state response of the suspended cables under specified damage conditions. All figures compare the results obtained from GRBFNN with those from the Monte Carlo simulation (MCS). The two sets of results show excellent agreement, demonstrating the accuracy and applicability of the GRBFNN method for such problems.
In
Figure 4, subplots (a) and (c) show unimodal symmetric distributions for the displacement PDFs, resembling Gaussian distributions but with higher kurtosis, indicating that system responses tend to concentrate near the mean under damage conditions. Specifically, the peak of the in-plane displacement in
Figure 4a is located near zero, while the out-of-plane displacement in
Figure 4c exhibits a noticeably wider range, suggesting greater variability, which may be closely associated with a reduction in out-of-plane stiffness due to damage.
Figure 4b,d present the velocity PDFs, both of which approximate standard normal distributions. However, the in-plane velocity shows a sharper and taller peak, indicating a more stable response. In contrast, the out-of-plane velocity distribution is flatter, suggesting it is more affected by damage and exhibits increased randomness.
Figure 4e shows the joint PDF of in-plane and out-of-plane displacements, which exhibits a saddle-shaped distribution, indicating a certain degree of negative correlation. This may result from coupling effects induced by damage, such as the suppression of out-of-plane responses by in-plane vibrations. In contrast, the joint PDF of velocities in
Figure 4f appears nearly circular, suggesting weak correlation between in-plane and out-of-plane velocities and indicating that their responses are approximately independent.
Figure 4.
The stationary response of PDFs of the cable system under the specified damage conditions: (a) the marginal PDFs p(X1) of in-plane displacement; (b) the marginal PDFs of in-plane velocity; (c) the marginal PDFs of out-of-plane displacement; (d) the marginal PDFs of out-of-plane velocity; (e) the joint PDFs of in-plane and out-of-plane displacement; (f) the joint PDFs of in-plane and out-of-plane velocity. The parameters of this system are = 0.4, = 0.2, = 0.3, D1 = D2 = 0.02 (Lines: GRBFNN solutions, Symbols: MCS results).
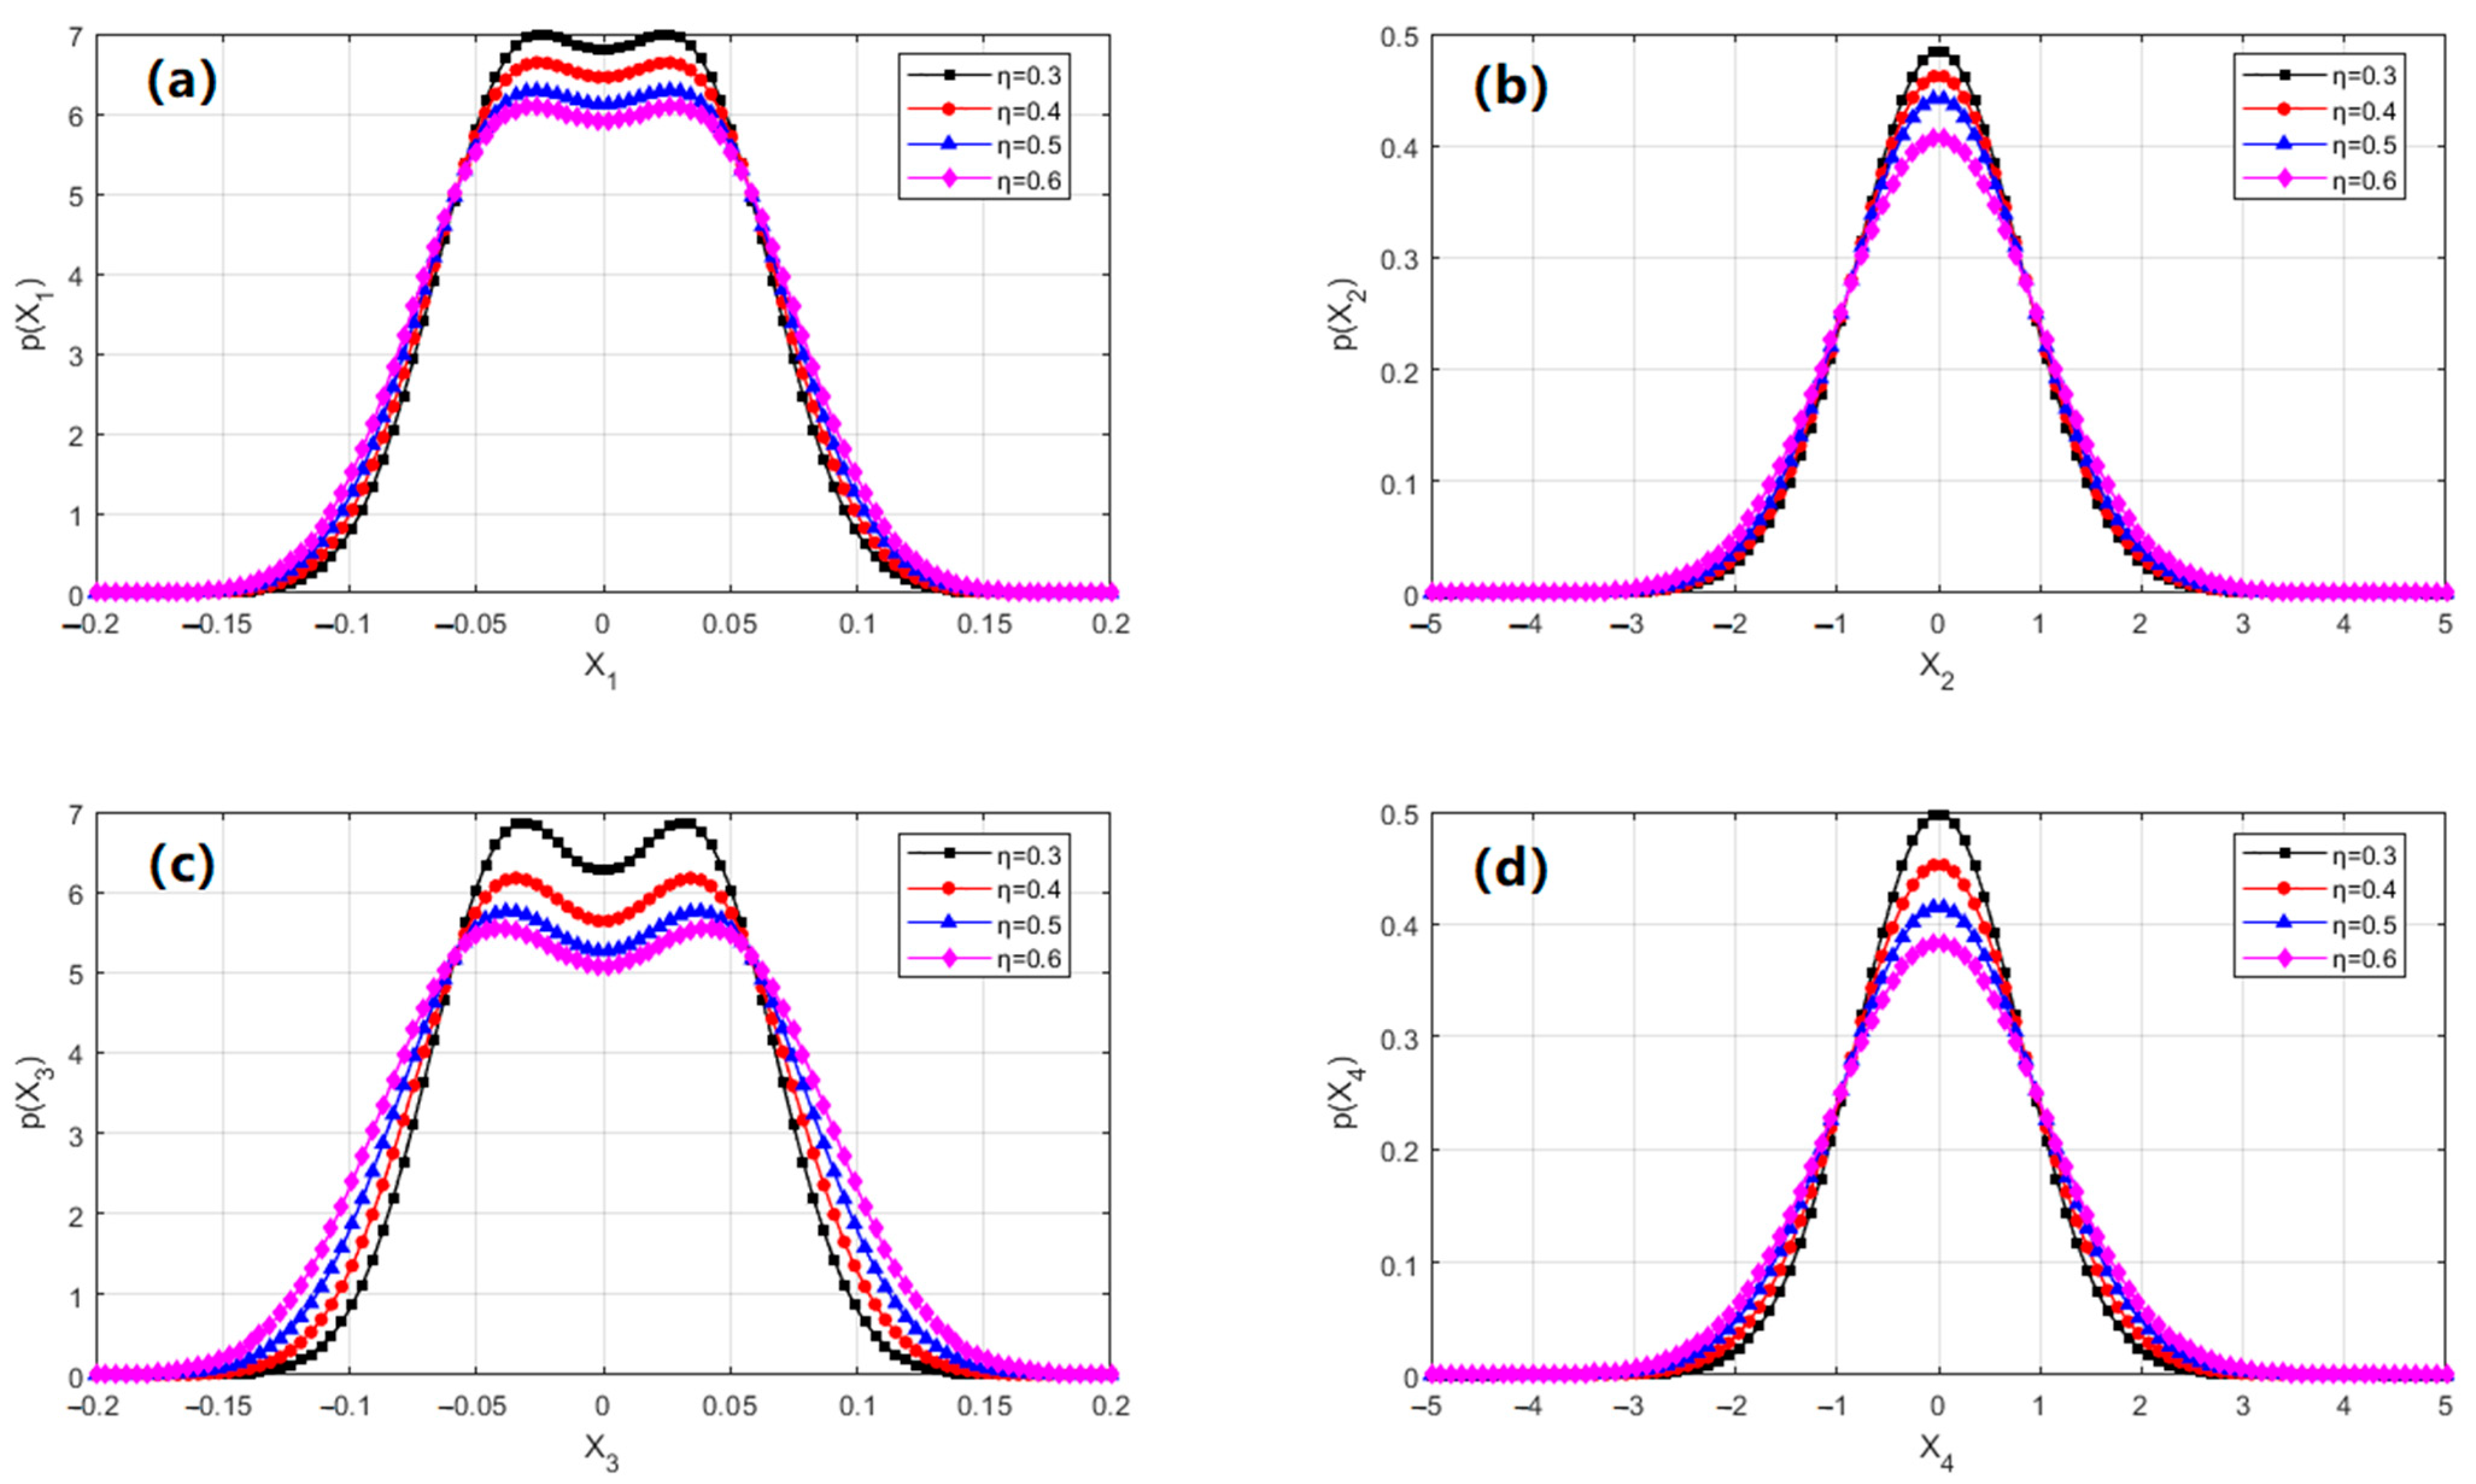
Figure 5 analyzes the effect of the damage severity parameter
η on the system’s steady-state probability density functions.
Figure 5a,c reveal that as
η increases (i.e., as the severity of damage intensifies), the distributions of displacement
and
broaden significantly, and their peak values decrease. For instance, when
η increases from 0.1 to 0.5, the peak of
decreases by approximately 30%, and the distribution tails become heavier, indicating a marked increase in uncertainty of the displacement response. The broadening of the out-of-plane displacement
is even more pronounced, suggesting greater sensitivity to the severity of damage. The velocity PDFs shown in
Figure 5b,d, namely
and
, also broaden with increasing
η, but to a lesser extent than the displacement variables. Notably, the kurtosis of
decreases more rapidly, and its overall distribution tends to approach uniformity.
Figure 5.
The changes of the stationary probability functions with different damage severity parameters: (a) the marginal PDFs p(X1) of in-plane displacement; (b) the marginal PDFs of in-plane velocity; (c) the marginal PDFs of out-of-plane displacement; (d) the marginal PDFs of out-of-plane velocity. The parameters of this system are = 0.4, = 0.2, D1 = D2 = 0.02 (Lines: GRBFNN solutions, Symbols: MCS results).
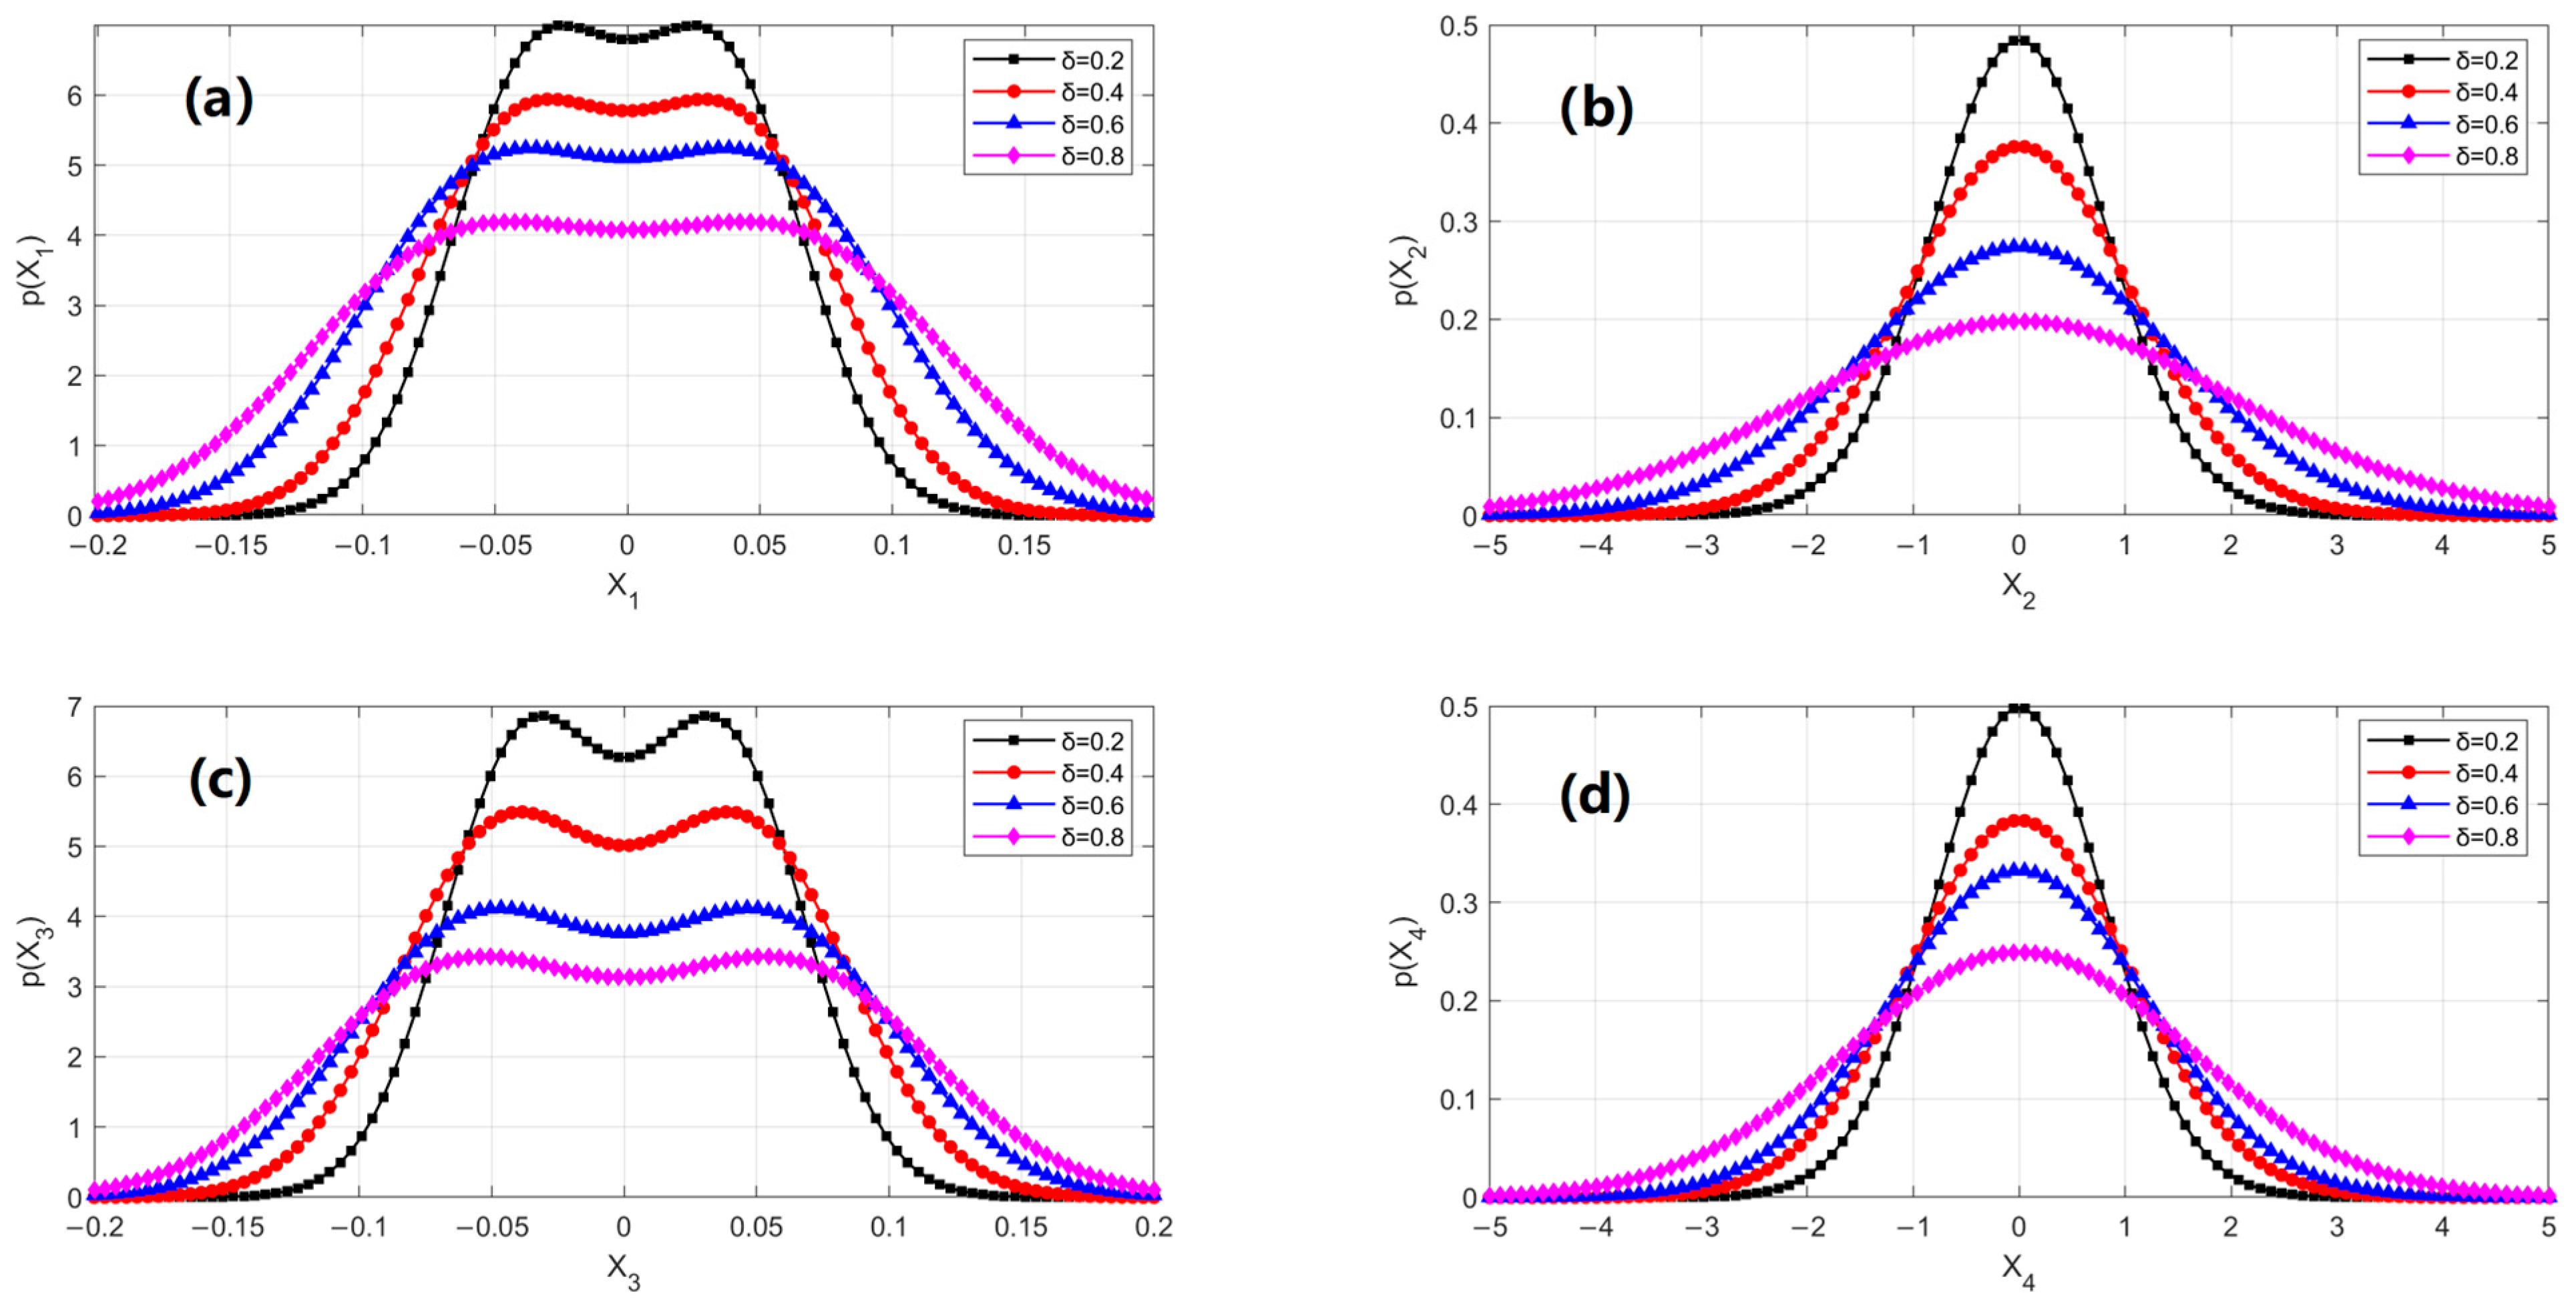
Figure 6 investigates the effect of the damage range parameter
δ on the PDFs. Overall, when
δ exceeds 0.3, the marginal distributions generally exhibit noticeable positive skewness, indicating an increased probability of large-magnitude displacements. As
δ increases, the symmetry of all distributions is preserved, but their peak values steadily decline. This behavior results from a wider damage range causing stiffness degradation over a larger portion of the cable, which in turn amplifies geometric nonlinearity in the out-of-plane response. Meanwhile, the mean of the in-plane displacement shifts due to changes in the mass distribution of the damaged region, which alters the system’s static equilibrium position.
Figure 6.
The changes of the stationary probability functions with different damage extent parameters: (a) the marginal PDFs p(X1) of in-plane displacement; (b) the marginal PDFs of in-plane velocity; (c) the marginal PDFs of out-of-plane displacement; (d) the marginal PDFs of out-of-plane velocity. The parameters of this system are = 0.4, = 0.3, D1 = D2 = 0.02 (Lines: GRBFNN solutions, Symbols: MCS results).
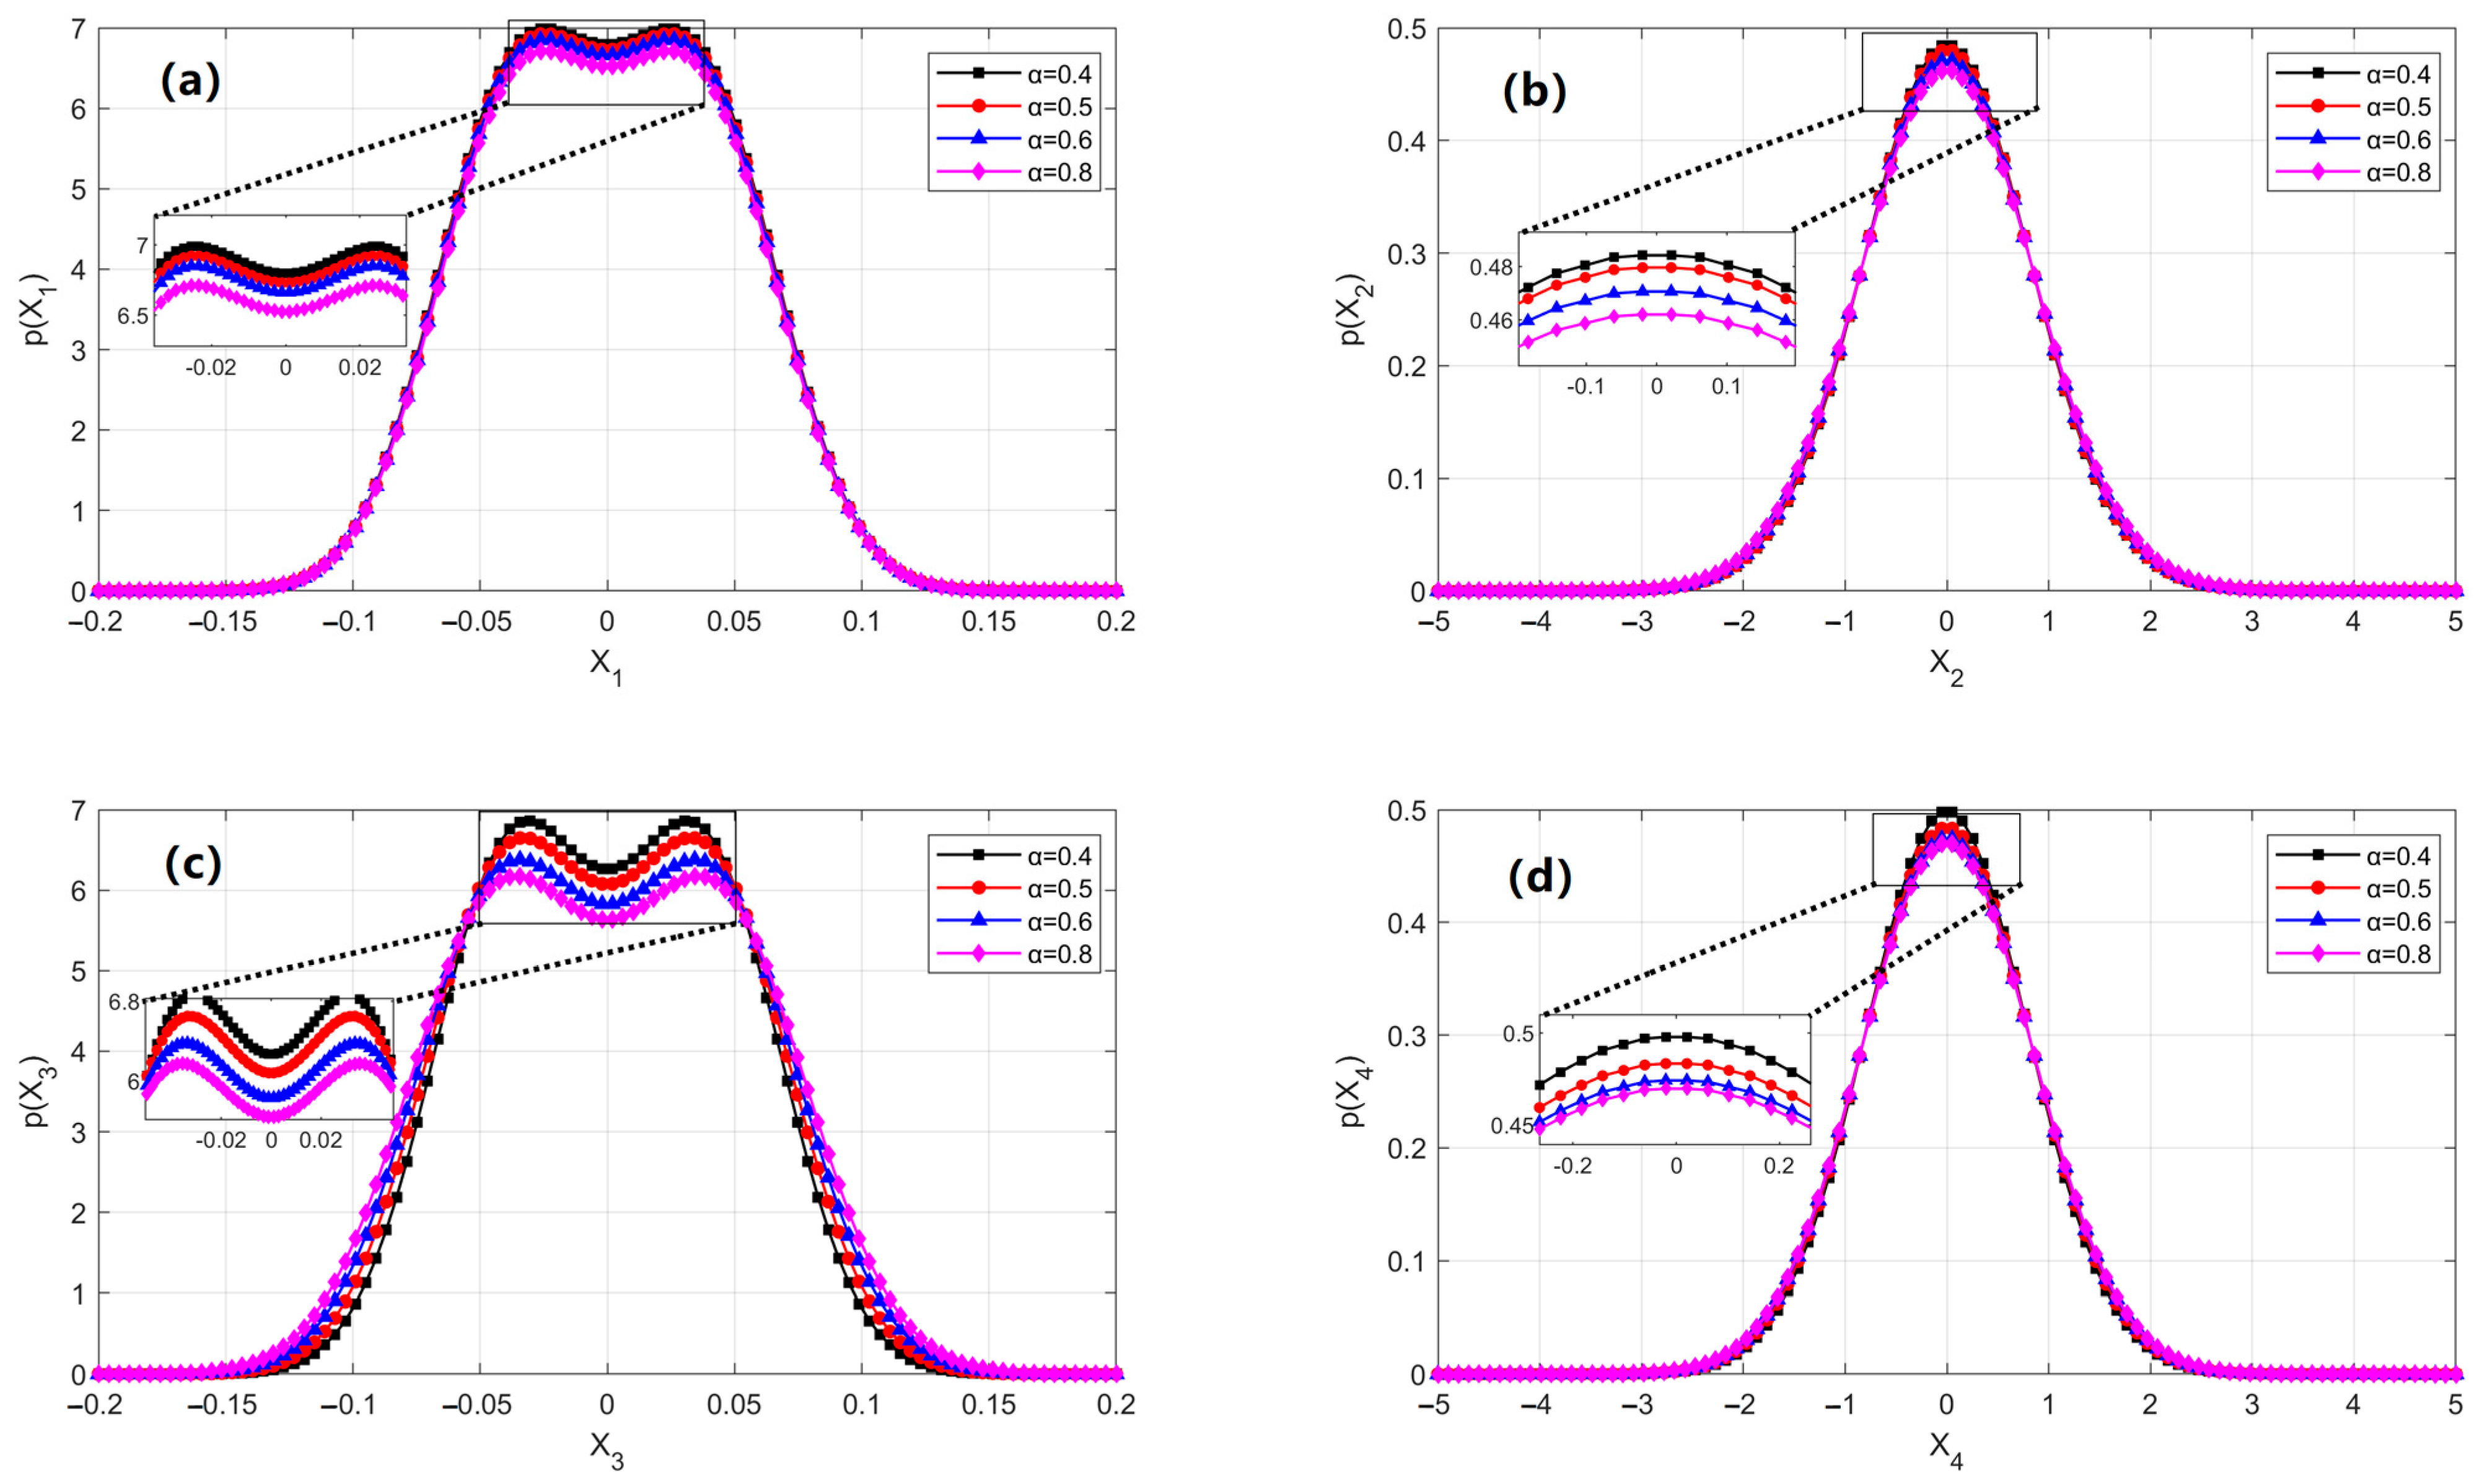
Figure 7 further demonstrates the influence of the damage location parameter
α on the marginal PDFs of displacement.
Figure 7b,d show that changes in damage location cause only minor variations in the marginal PDFs, indicating that velocity variables are relatively insensitive to damage location. However, in
Figure 7c, the out-of-plane displacement PDF exhibits a more complex multimodal distribution when the damage is located at the mid-span of the cable. This suggests that central damage more readily excites coupled responses among higher-order vibration modes. In contrast, when the damage is near the boundaries, its influence on the overall response is relatively limited.
Figure 7.
The changes of the stationary probability functions with different damage location parameters: (a) the marginal PDFs of in-plane displacement; (b) the marginal PDFs of in-plane velocity; (c) the marginal PDFs of out-of-plane displacement; (d) the marginal PDFs of out-of-plane velocity. The parameters of this system are = 0.2, = 0.3, D1 = D2 = 0.02 (Lines: GRBFNN solutions, Symbols: MCS results).
4.2. Reliability Analysis by GRBFNN and SORM
Although, from a strictly mathematical perspective, solving Equation (49) requires preserving the degrees of freedom in the state space, fixing the state variables and studying the time evolution of the density function
can be fully justified under certain conditions in practical applications. This approach can be regarded as a form of local reliability response analysis, commonly used to assess the time-varying failure risk of the system near critical state points, especially when these points lie close to the limit-state boundary or represent significant operating conditions. Therefore, due to the complexity of solving multi-variable differential Equation (49), the method of fixing state variables, while not capable of directly providing the overall failure probability, can still offer valuable pointwise information, boundary conditions, and model validation references for global analysis, making it practically meaningful and operationally feasible [
34].
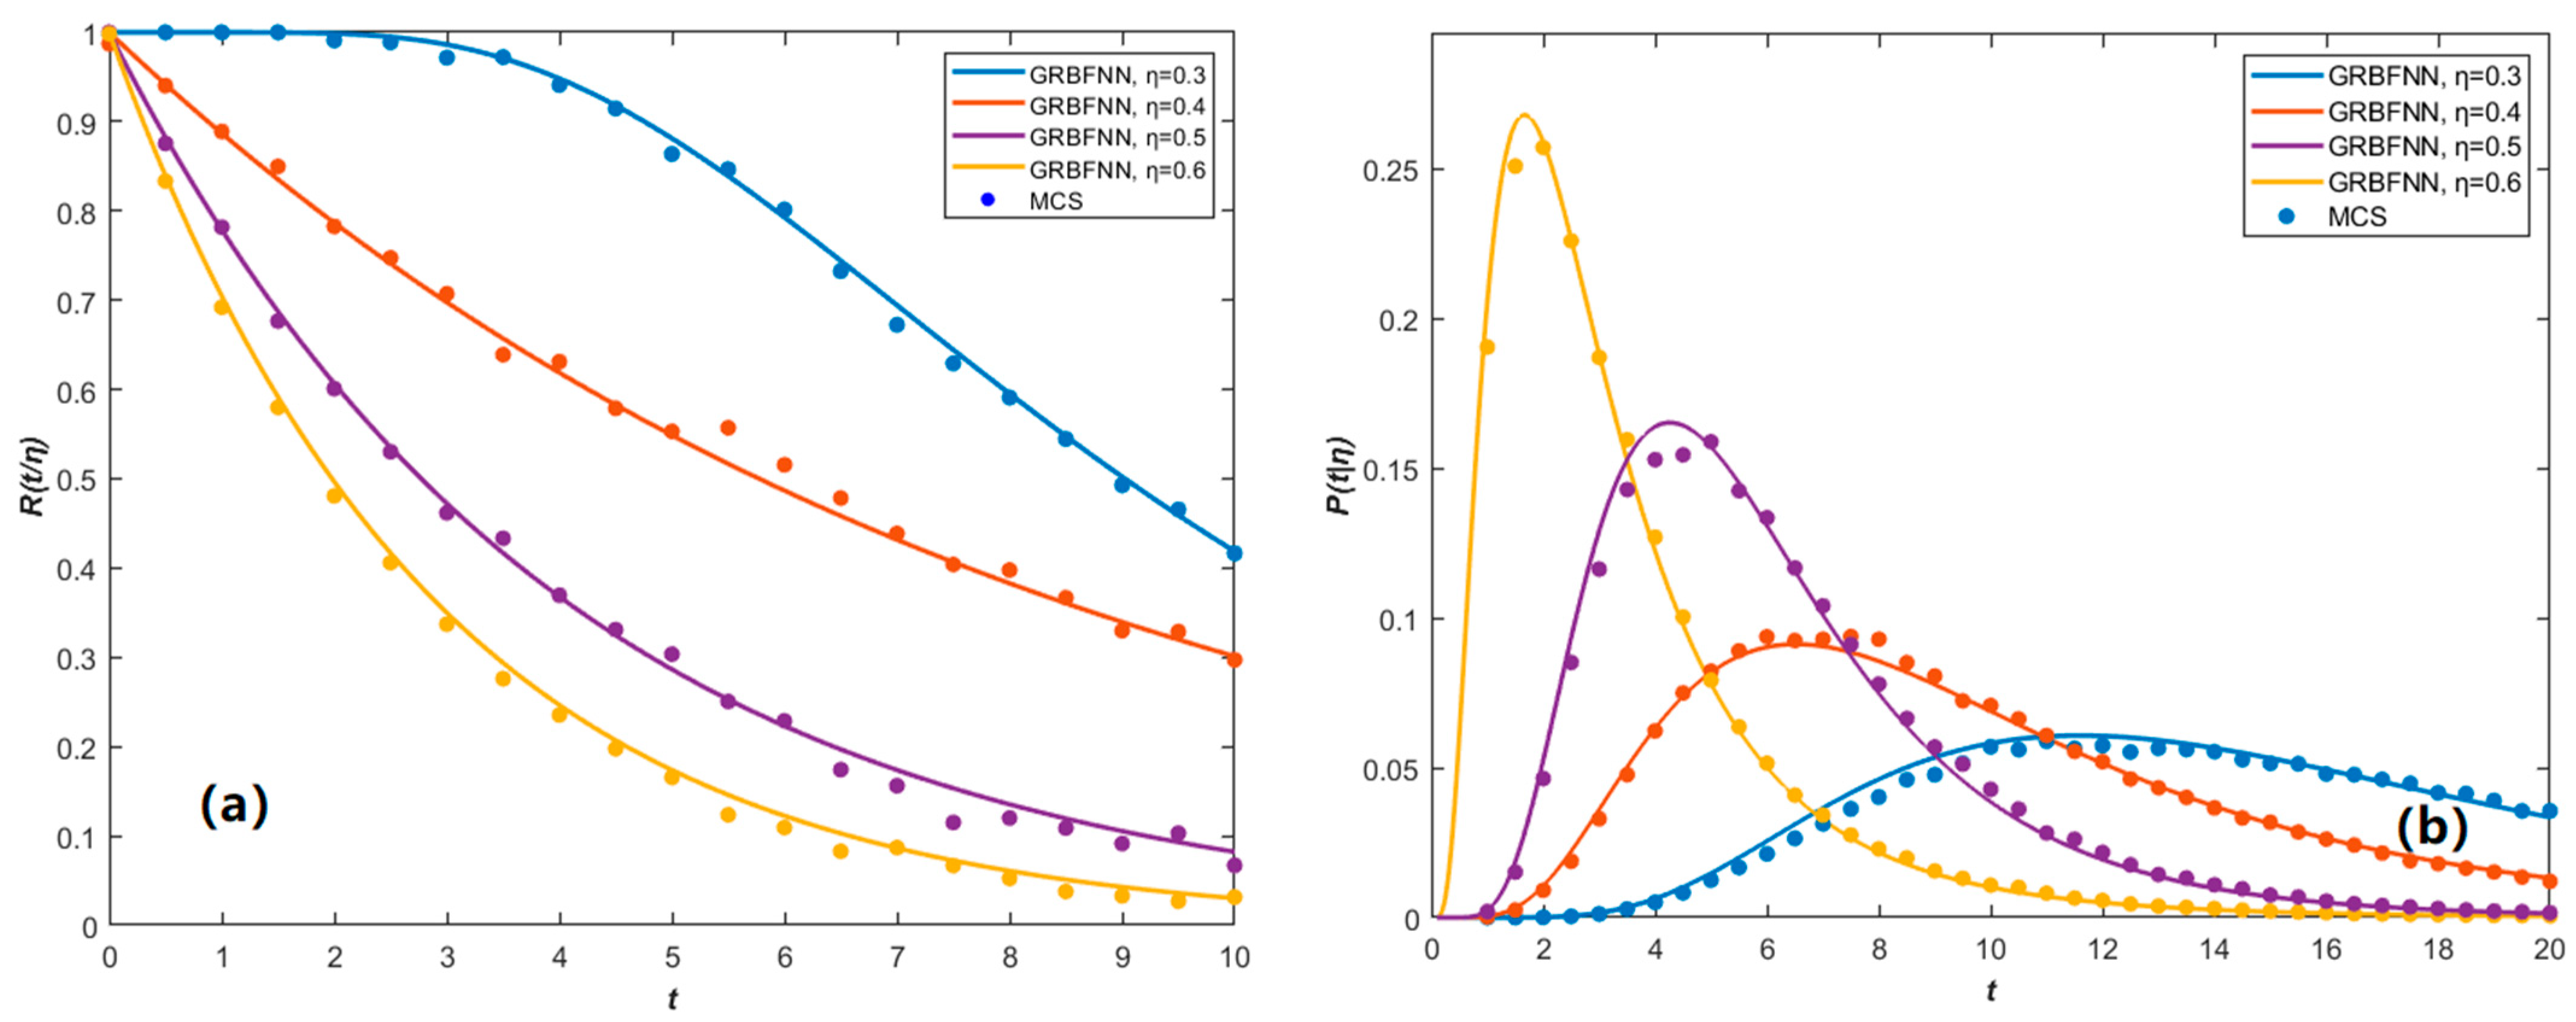
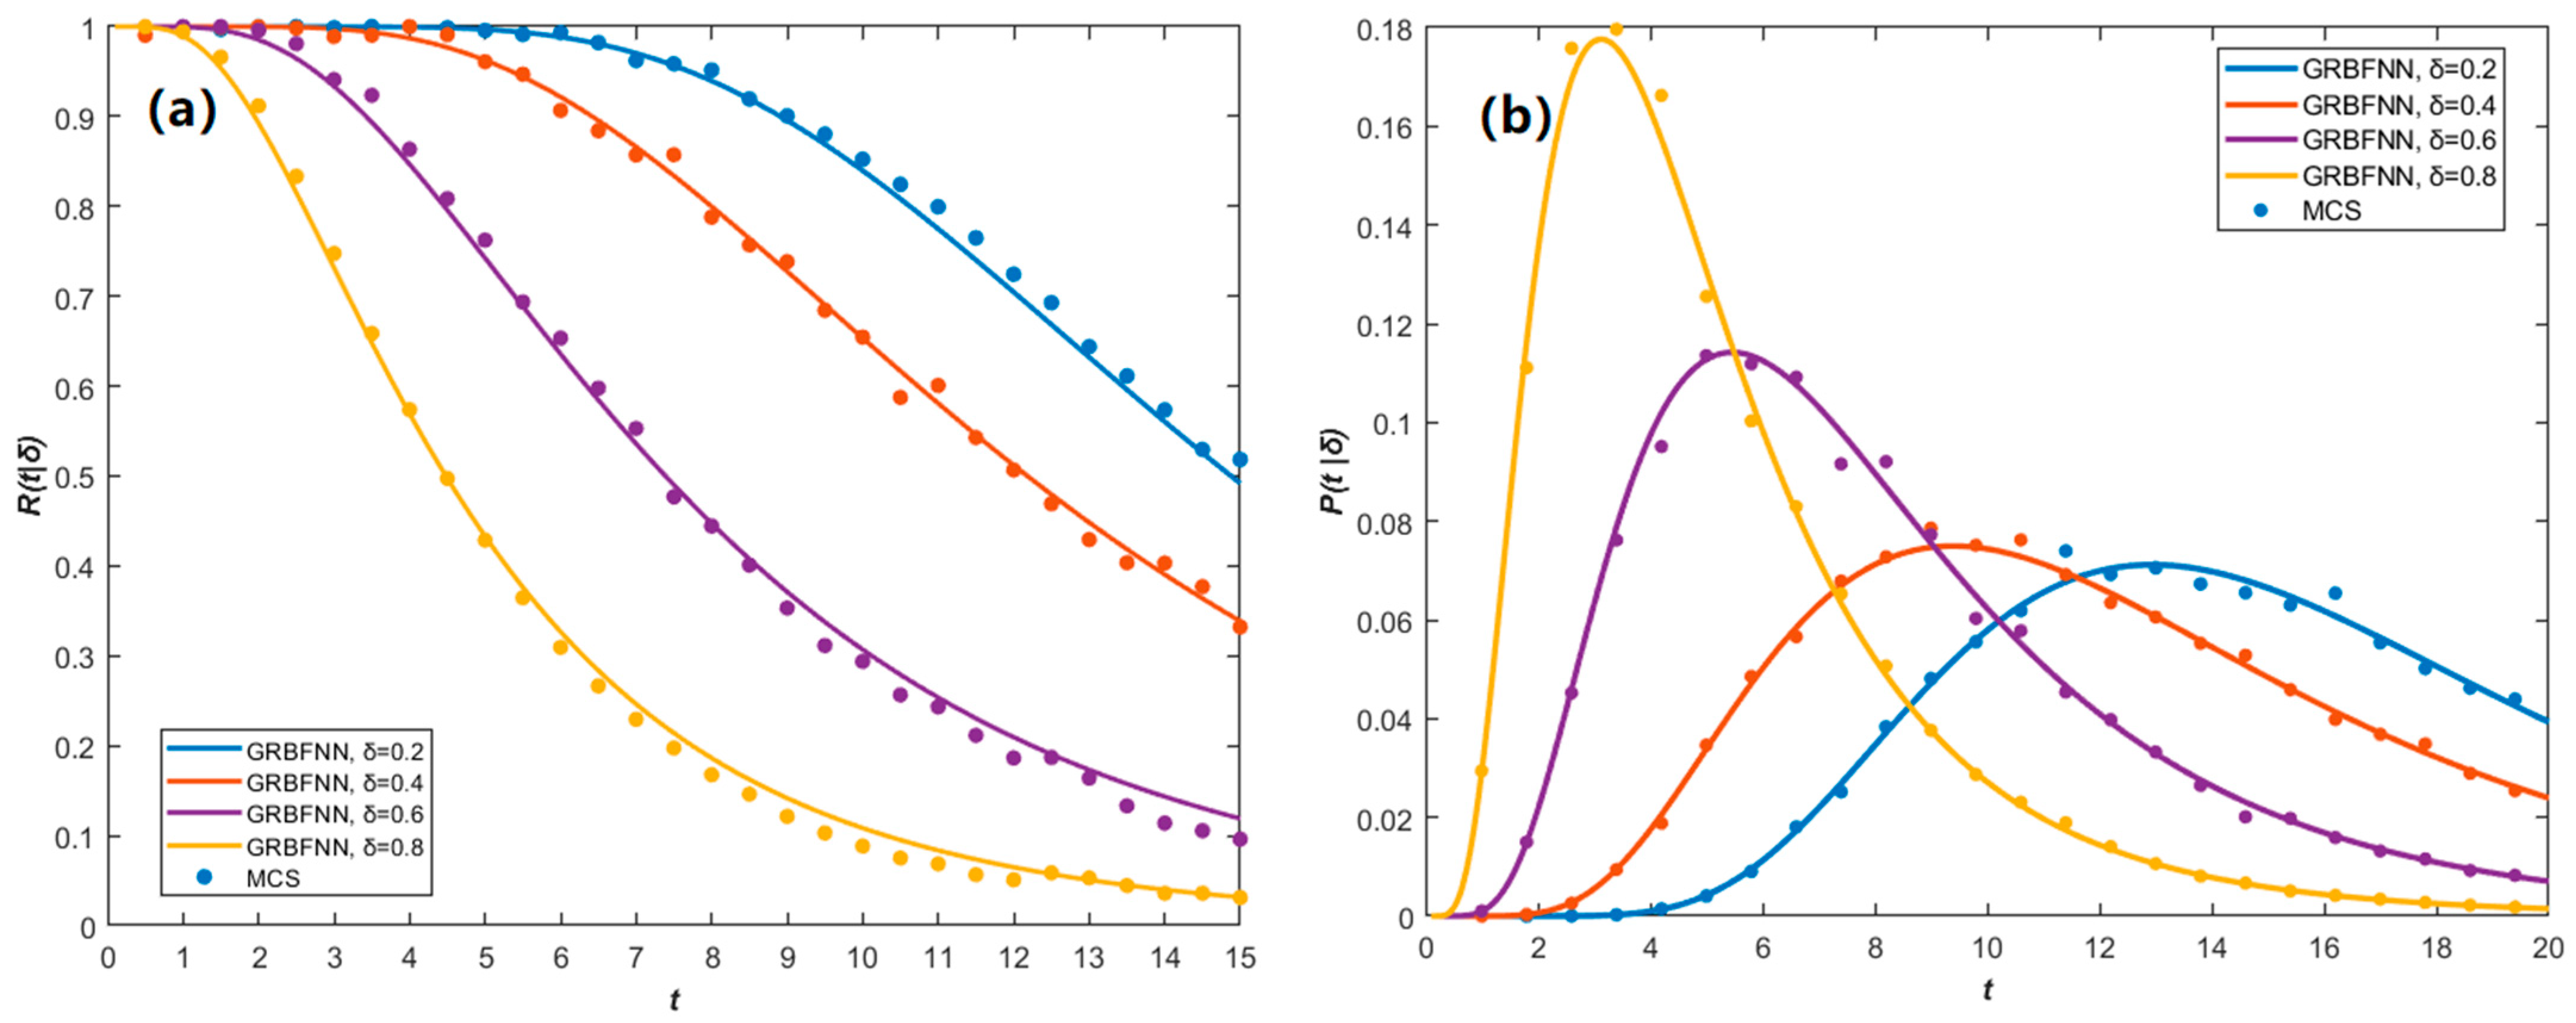
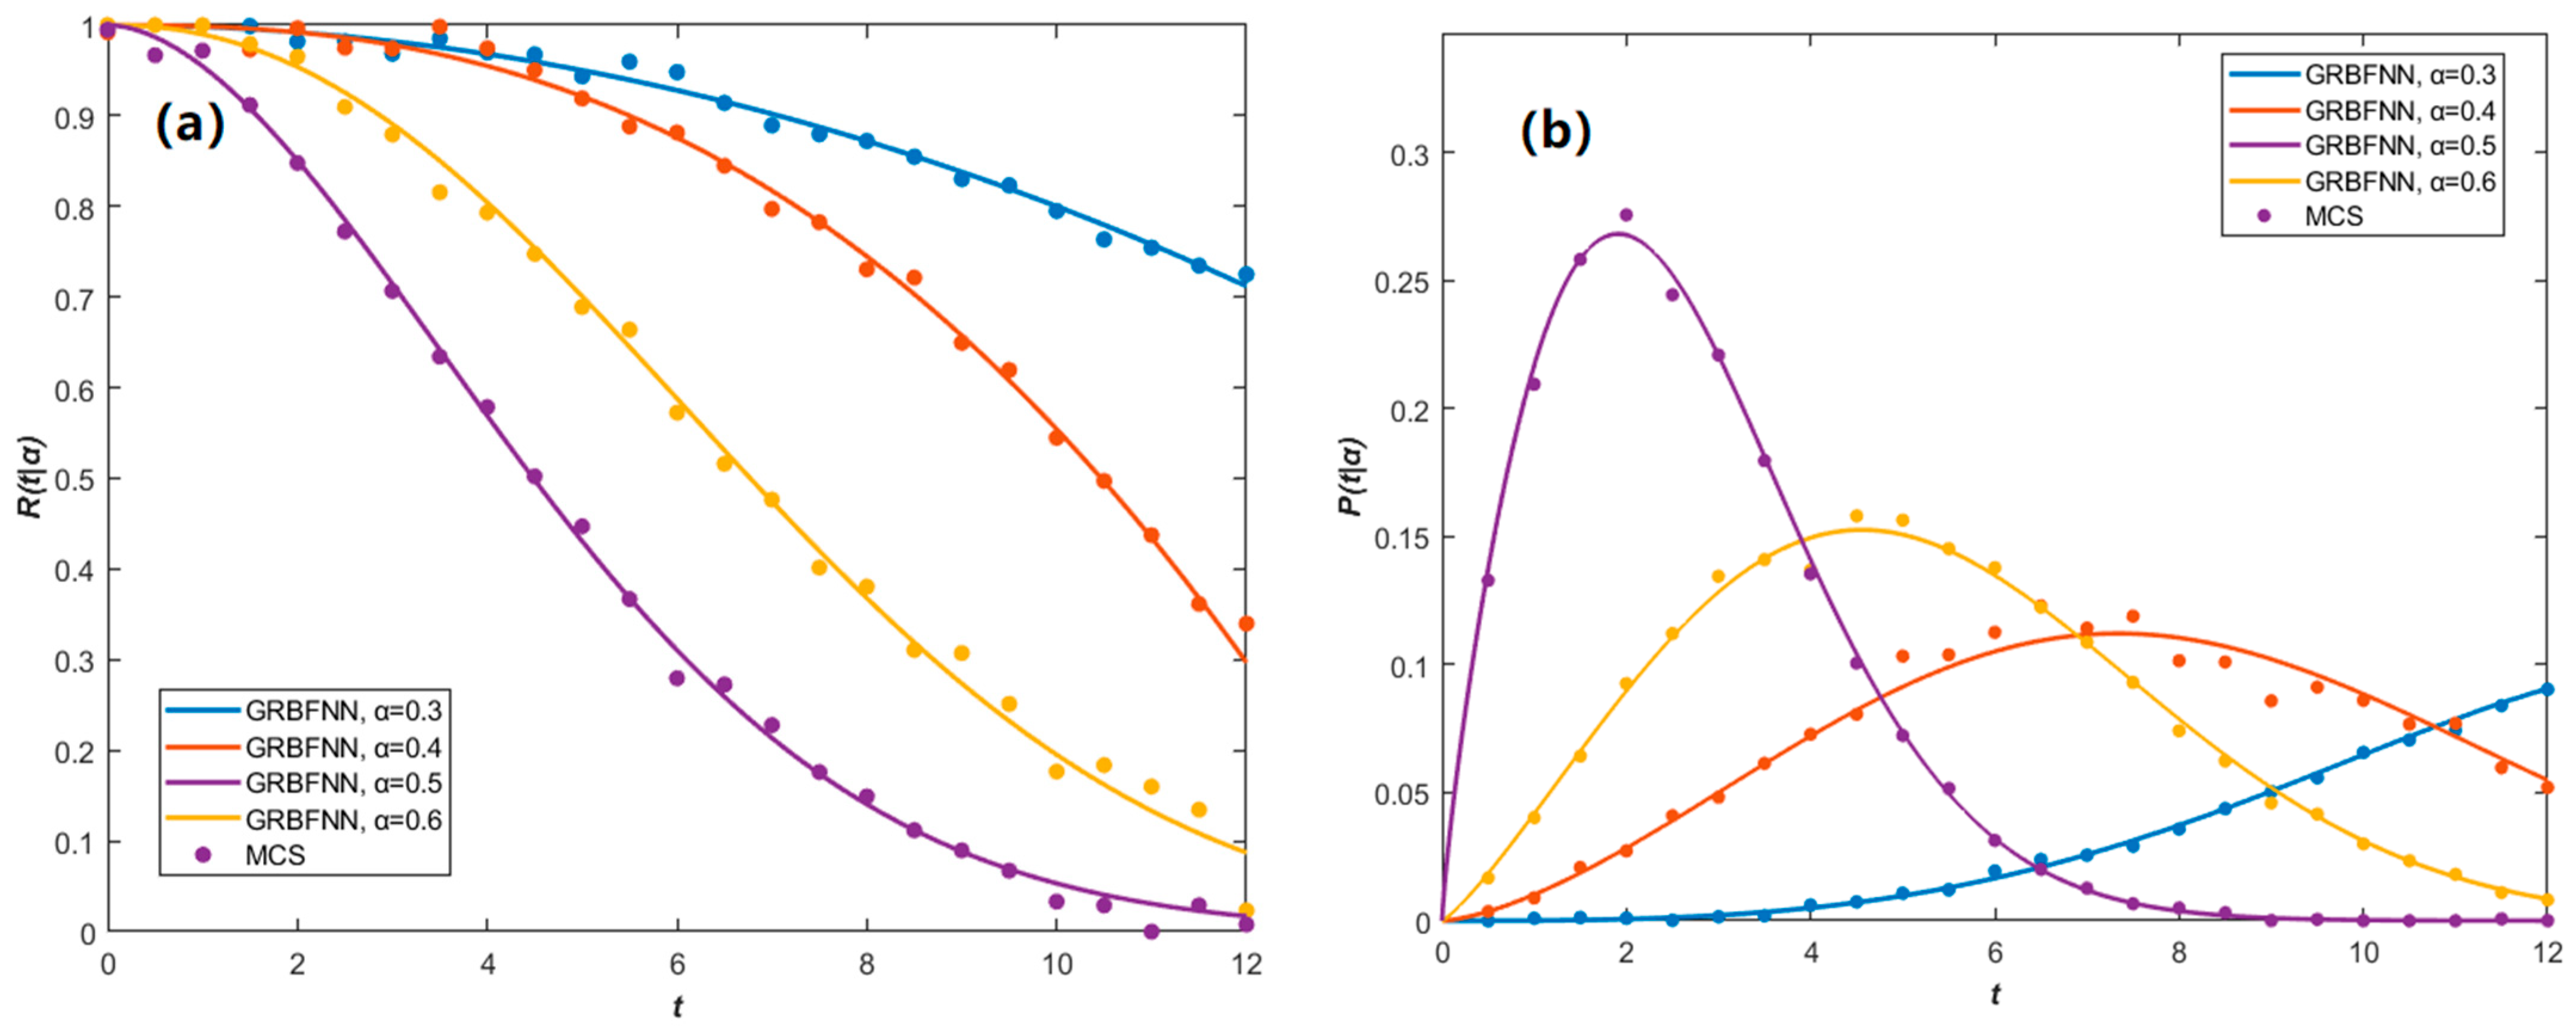
Therefore, in order to systematically investigate the influence of individual damage characteristics on the structural reliability of suspended cables, a series of time-dependent reliability functions and the corresponding first-passage probability were constructed by varying one damage parameter at a time while keeping the others fixed. In
Figure 8,
Figure 9 and
Figure 10, GRBFNN predictions are compared with those from MCS outcomes. The consistency observed between them highlights the capability of GRBFNN to accurately model the problem under consideration.
As shown in
Figure 8, an increase in
η leads to a faster decay of reliability and a significant rise in the probability of the structure exceeding the safety threshold within a shorter period. Furthermore, a comprehensive comparison among
Figure 8 and
Figure 10 indicates that
η is the most sensitive parameter driving structural failure.
As illustrated in
Figure 9, with an increase in
δ, the reliability lifetime of the suspended cable is shortened, and the early failure probability increases, suggesting that large-scale damage accelerates structural degradation. This implies that even with
η held constant, expanding
δ can still markedly reduce structural reliability [
35].
According to
Figure 10a, reliability is lowest when the damage is located near the mid-span, likely due to this region being a high-stress zone where damage causes the most critical effects.
Figure 10b shows that failure risk decreases as the damage location shifts away from the center, consistent with the observation in
Figure 7.
These reliability analysis results indicate that the higher η or larger δ directly undermine the load-bearing capacity of the structure, while α amplifies the effect of damage through its positional influence. In structural health monitoring systems, it is therefore essential to prioritize the detection of regions with high η and deploy sensors at sensitive locations such as the central segment of the suspended cable.
In addition to the above reliability analysis, failure probability calculation is essential in engineering but often intractable due to complex, high-dimensional integrals. Direct integration is computationally prohibitive, and while Monte Carlo methods are versatile, they require extensive sampling for rare events, leading to low efficiency.
The First-Order Reliability Method (FORM) and Second-Order Reliability Method (SORM) provide efficient approximate analysis approaches to address these challenges. FORM transforms the failure probability calculation into a geometric problem in standard normal space by linearizing the limit state function at the most probable failure point, while SORM enhances accuracy through second-order corrections that account for the curvature of the limit state surface. Both methods maintain high computational efficiency while delivering sufficient accuracy for reliability assessment in engineering problems [
36].
The foundation of structural reliability analysis is the establishment of appropriate limit state functions (LSFs) that can accurately describe the transition boundary from safe states to failure states. Considering the dynamic response characteristics of cable suspension structures under random loading, this study establishes the limit state function as
where the physical meanings of the parameters are defined as follows:
represents the maximum allowable displacement limit for structural design, typically determined by relevant codes or engineering experience, while
denotes the actual displacement response of the structure under the action of random variable vector
. The system state variable vector
. When
, the structure is considered to have failed.
The structural failure probability is defined as the probability that the random variable vector
falls within the failure domain, with its mathematical expression given by
As we know from above,
was obtained by GRBFNN, whose mathematical expression can be represented as
Therefore, the complete expression for failure probability becomes
The core principle of FORM involves performing first-order Taylor expansion of the limit state function at the most probable failure point (design point), transforming the complex reliability integral problem into a geometric problem in standard normal space through linearization treatment [
36]. To perform reliability calculations in standard normal space, it is necessary to map random variables
in physical space to variables
in standard normal space. This transformation must preserve probability measures, ensuring that
where
represents the transformation operator, and
denotes any region in physical space. For non-normal distributions with known joint distributions, the Rosenblatt transformation is adopted:
where
represents the conditional cumulative distribution function of the
-th state variable, and
denotes the inverse cumulative distribution function of the standard normal distribution. The Rosenblatt transformation can handle arbitrary forms of joint distributions but requires complete conditional distribution information.
In standard normal space, the failure probability calculation problem transforms to
where
represents the limit state function in standard normal space, and
denotes the n-dimensional standard normal distribution density function. The design point
is defined as the closest point to the origin on the limit state surface
, determined by solving the following constrained optimization problem:
which can be solved by the Lagrange Multiplier Method; finally, we obtain
. This indicates that the design point lies along the direction of the line connecting the origin to the tangent point of the limit state surface. Therefore, the reliability index
is defined as the Euclidean distance from the design point to the origin, and the structural failure probability can be expressed as Equation (72),
where
represents the cumulative distribution function of the standard normal distribution.
The Second-Order Reliability Method (SORM) represents a high-precision reliability analysis method developed based on FORM. By considering curvature information of the limit state surface, SORM performs second-order correction to the linearization approximation of FORM, thereby significantly improving the accuracy of failure probability estimation [
36]. At the design point
, the limit state function
is expanded using second-order Taylor series:
where gradient vector can be expressed as Equation (74), and Hessian Matrix
at the design point of
is defined as Equation (75) in order to solve our fourth-order differential equation:
Afterwards, we are supposed to calculate the principal curvature, as these quantities directly characterize the local geometric properties of the limit state surface in the vicinity of the design point. The initial step in the principal curvature calculation is Hessian matrix normalization:
To extract principal curvatures, the coordinate system is rotated so that one axis aligns with the normal direction of the limit state surface at the design point. This is achieved by constructing an orthogonal rotation matrix that aligns the gradient direction with a principal axis. The unit normal vector at the design point is defined as
The negative sign ensures that the normal vector points toward the safe domain, consistent with the conventional definition of the reliability index. The rotation matrix
is then constructed to satisfy the constraint:
The rotated Hessian matrix is subsequently obtained through the similarity transformation:
Following the coordinate transformation, the principal curvatures are extracted from the upper-left submatrix of the rotated Hessian, which contains the curvature information in the tangential directions to the limit state surface [
36]. This submatrix is denoted as
where
B represents the reduced Hessian matrix in the tangential space. The principal curvatures
for
are determined as the eigenvalues of this matrix through the characteristic equation
Consequently, the corrected failure probability is calculated by using the Breitung formula as Equation (82),
where
is the FORM reliability index.
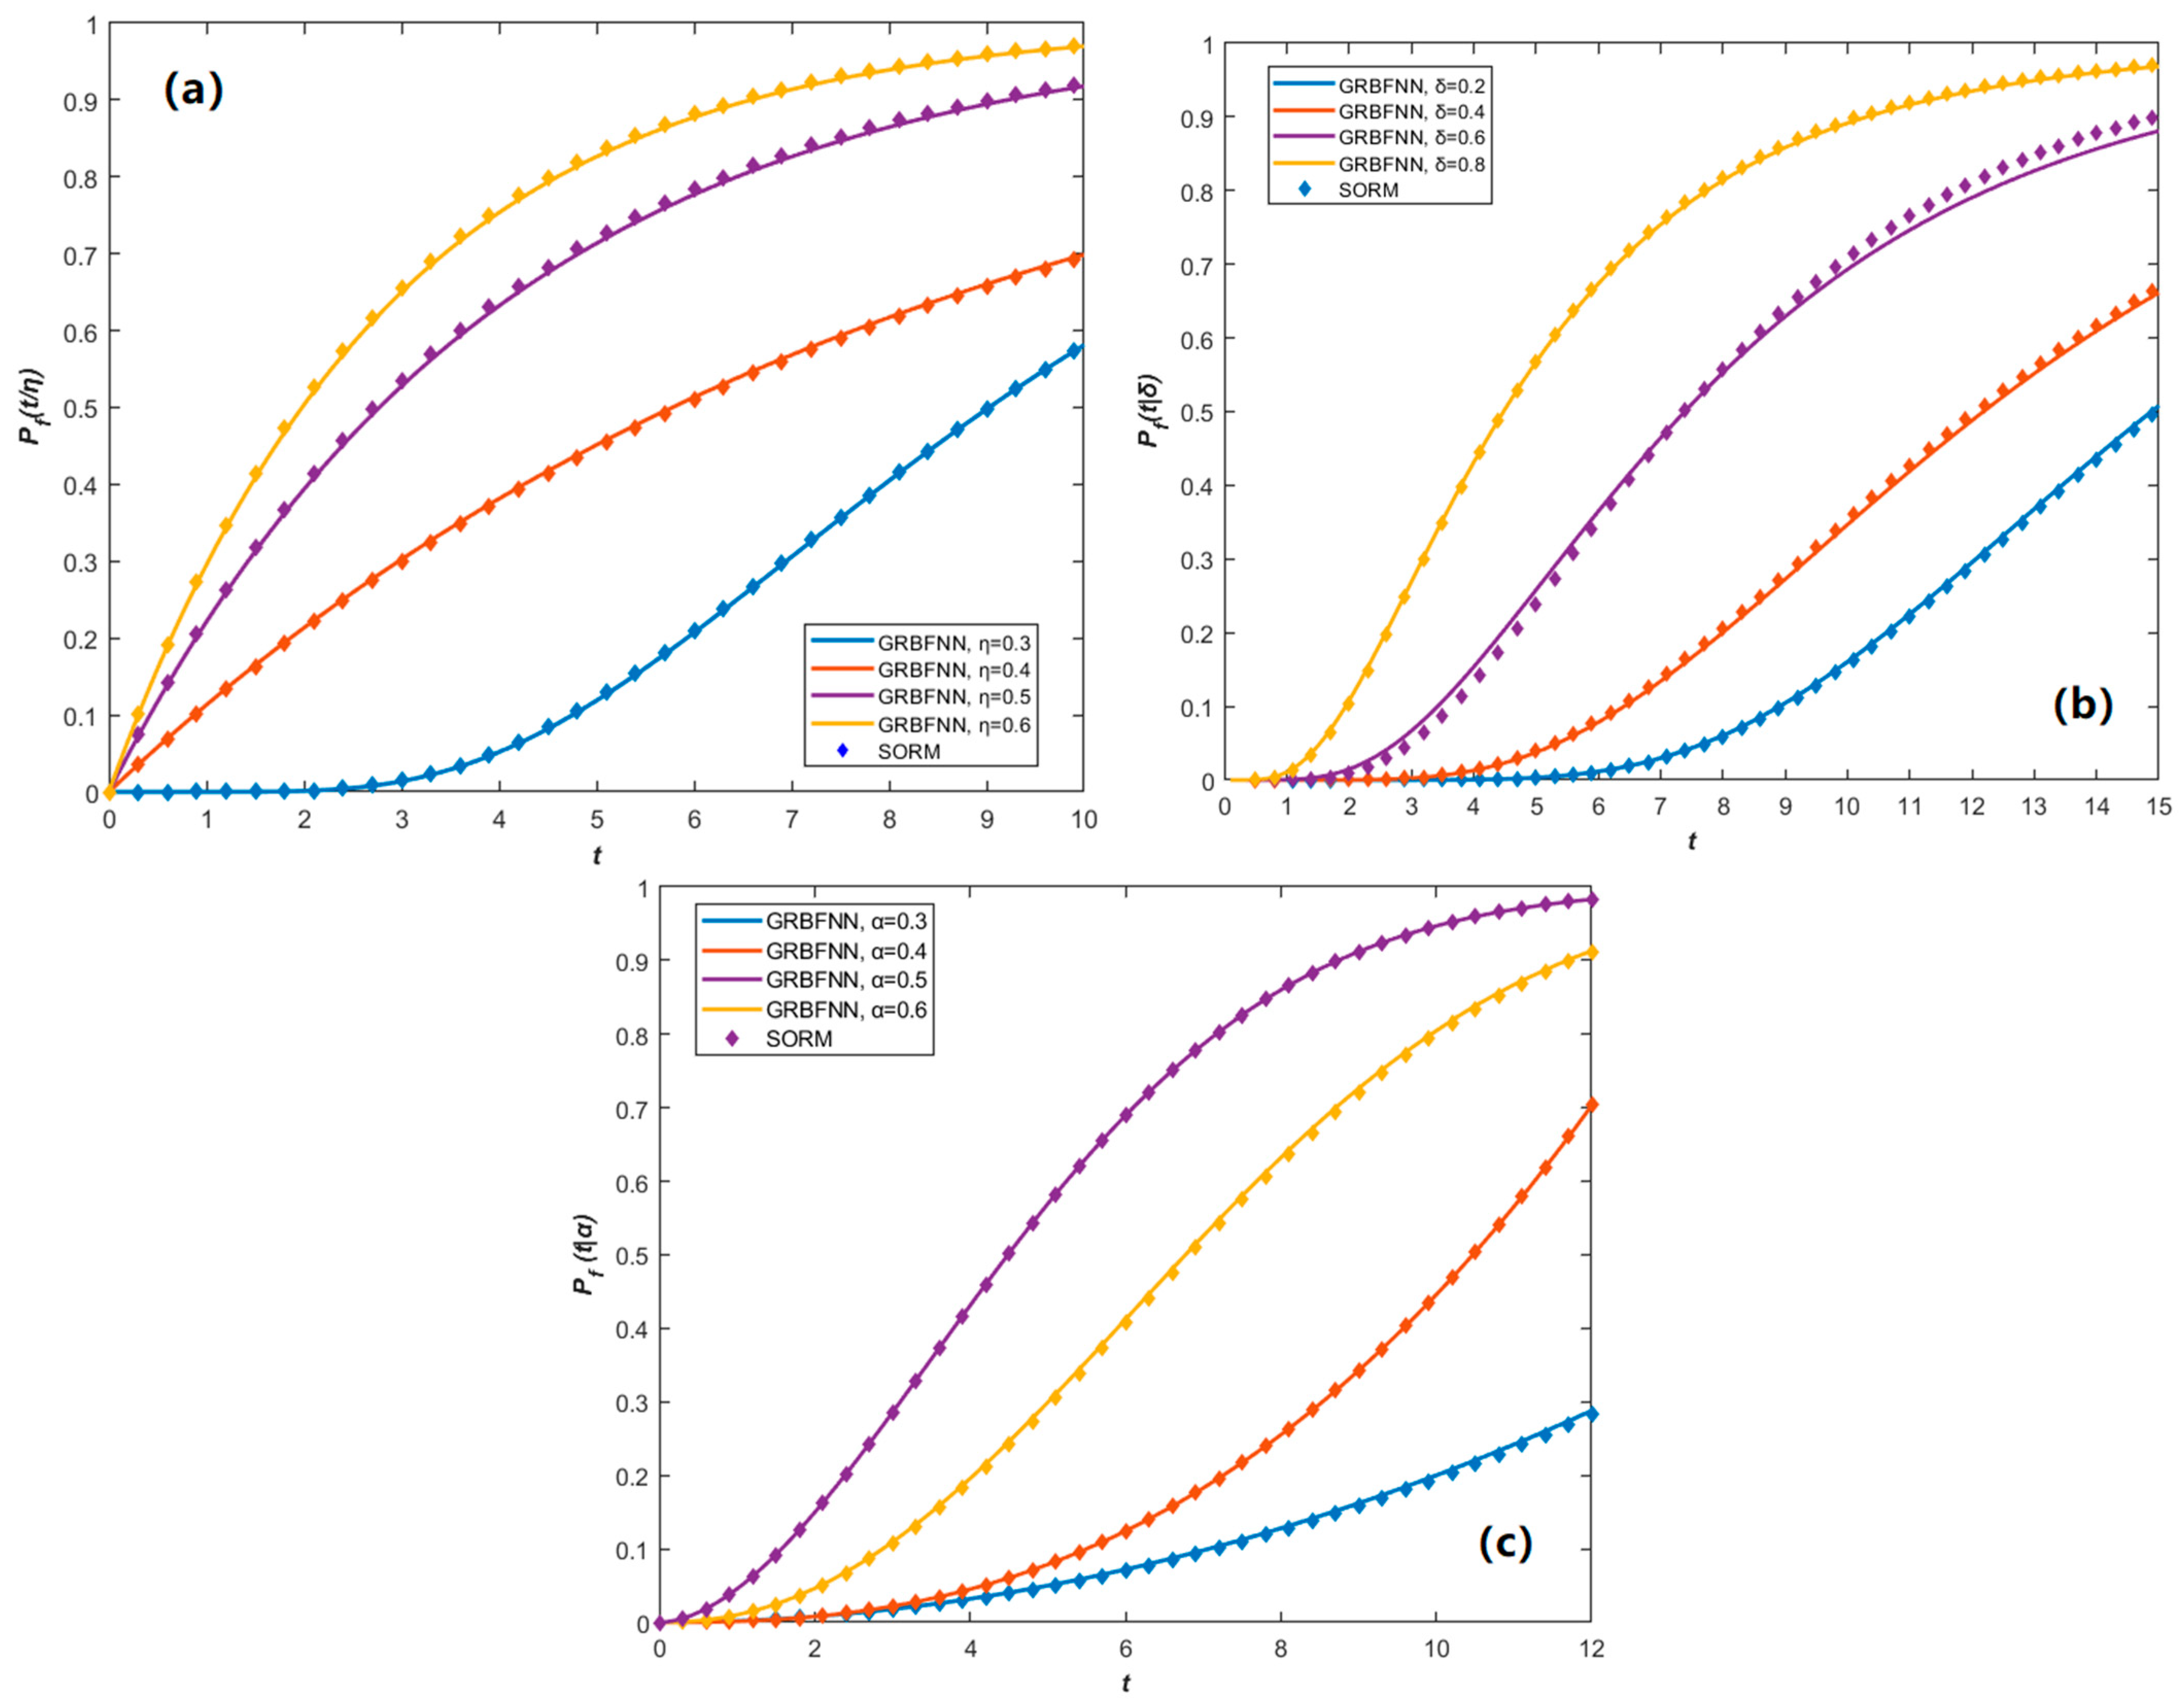
A comparative analysis between GRBFNN and SORM in
Figure 11 reveals the time-dependent behavior of failure probability under different parameter settings. Parameters η and δ mainly influence its growth magnitude, while α affects the critical transition point due to its positional sensitivity. GRBFNN closely matches SORM results in most cases and demonstrates higher accuracy in strongly nonlinear regimes, offering valuable theoretical support for damage-tolerant design. However, it is important to note that the current modeling framework assumes time-invariant system parameters and stationary Gaussian excitation. While this assumption is suitable for steady-state reliability analysis, it does not capture time-dependent behaviors such as evolving damage, stiffness degradation, or non-stationary inputs.
