1. Introduction
Exposure to physical or visual motion may result in the unpleasant experience of motion sickness. Symptoms include dizziness, headache, sweating, nausea, and vomiting, often accompanied by a general feeling of malaise [
1]. One of the most acknowledged theories on motion sickness, the sensory conflict theory, proposes that motion sickness results from conflicting sensory signals on self-motion [
2,
3,
4]. These signals may involve anticipation of self-motion. Car passengers, for example, suffer much more from motion sickness compared to car drivers [
5], presumably because drivers can better anticipate the car’s motions. The increased susceptibility of passengers constitutes a problem as highly advanced automated driving functions will transform car drivers into passengers. This will consequently increase motion sickness prevalence [
6,
7].
In this study, we want to gain more insight into the effectiveness of a possible method to mitigate motion sickness: anticipatory cueing. In this method, passengers receive warning signals that alert them of changes in the vehicle’s trajectory. Helping passengers anticipate such potentially sickening motions could reduce a sensory conflict on self-motion. Previous studies demonstrated the effectiveness of anticipatory cues using the auditory [
8,
9,
10] as well as visual modality [
11,
12,
13]. However, both auditory and visual cues have some clear disadvantages. For instance, visual displays sometimes aggravate, rather than mitigate, motion sickness [
14,
15]. Furthermore, passengers may perform tasks that often involve the auditory and visual modality, such as talking, reading, or using electronic devices [
5,
16]. Passengers could accordingly miss a cue [
17] or feel disturbed by it [
8].
An alternative to the use of auditory or visual cues in anticipatory cueing is to present cues via the tactile modality, for instance by applying local vibrations via the seat pan. As the seat is in constant contact with the passenger, cues can be conveyed passively without requiring special action from the passenger. Moreover, the tactile modality is not involved in the various non-driving tasks passengers may want to perform. Vibrotactile alerts have been demonstrated effective in lowering reaction times in response to collision warnings in human car driving, indicating their salience [
18,
19,
20]. Because of these advantages, we investigated the effectiveness of anticipatory vibrotactile cues in a prior laboratory study [
21]. There we found no clear evidence that the vibrotactile cues mitigated motion sickness, irrespective of the time interval between the cue and the onset of motion.
Whereas the vibrotactile cues did not mitigate motion sickness significantly in the study of Reuten et al. [
21], auditory cues were effective in a study using the same motion apparatus, an equally provocative motion stimulus, and a similar experimental protocol [
9]. Moreover, we found a significant reduction in motion sickness from vibrotactile cues in a test track study [
22]. How can we explain this discrepancy? A first explanation concerns a difference in the unpredictability of the used motion stimulus. In Reuten et al. [
21], only the onset of motion was unknown to the participants, whilst in Kuiper et al. [
9] and Reuten et al. [
22], the direction of motion was also unknown. Because unpredictability about the onset and direction of motion individually add to motion sickness [
23], the more unpredictable motion stimuli used in Kuiper et al. [
9] and Reuten et al. [
22] might explain the effectiveness of the anticipatory cues in these studies. An alternative explanation is that auditory cues are more effective than vibrotactile cues, which makes it easier to demonstrate their effect. However, even though the effectiveness of the auditory cue in Kuiper et al. [
9] was significant and that of the vibrotactile cue in Reuten et al. [
21] was not, this does not by definition mean that the auditory cue was more effective. To draw such a conclusion, a direct comparison of their effectiveness is needed [
24]. When making this comparison, we observed that the auditory cue in Kuiper et al. [
9] was not significantly more effective than the vibrotactile cue in Reuten et al. [
21]. To conclude, a direct comparison between anticipatory auditory and vibrotactile cues using the same motion stimulus is needed to elucidate their effect.
To that end, here we will compare the effectiveness of directional anticipatory auditory and vibrotactile cues in mitigating motion sickness while replicating the experimental conditions in Kuiper et al. [
9]. Our primary aim is to determine if both cues mitigate motion sickness. Our second aim is to find out whether their effectiveness differs. Our third aim is to investigate how participants experience anticipatory cues and if this differs between auditory and vibrotactile cues.
2. Materials and Methods
We investigated the effectiveness of anticipatory auditory and vibrotactile cues to mitigate motion sickness evoked by a linearly accelerating sled. We did so by examining self-reported motion sickness within participants in four sessions. In two anticipatory sessions (performed on different days), an auditory or vibrotactile cue was predictive and alerted participants of the direction of upcoming motion. On each day, participants also took part in a control session, in which the same type of cue had no predictive value as it was presented during the motion. By comparing the development of motion sickness in the two sessions performed on the same day, we determined if the anticipatory cues mitigated motion sickness. We preregistered our study, with a focus on the statistical analysis, on the Open Science Framework (
https://doi.org/10.17605/OSF.IO/8FZU7, accessed on 1 July 2022).
2.1. Participants
Considering that Kuiper et al. [
9] reported a significant effect with a sample of 20 participants, we expected that a sample of 24 participants (allowing for counterbalancing the order of conditions) would provide sufficient statistical power. All of our participants (13 males) indicated to be in good overall health, free from self-known vestibular disturbances, and have experienced symptoms of car sickness in the last five years. Participants’ ages ranged from 21 to 60 years old, with a mean of 33 years. Two participants needed to be replaced due to mechanical failure of the used motion apparatus. The average motion sickness susceptibility of our sample fell within the 78th percentile of a normal population as predicted by the Motion Sickness Susceptibility Questionnaire MSSQ-Short [
25]. The experimental protocol was approved by TNO’s Institutional Review Board (approval number: 2022-037), and all participants provided written informed consent. They were paid for their contribution.
2.2. Motion Apparatus and Stimuli
In each session, we exposed participants to a preprogrammed series of 54 fore-aft motions on a linear sled (see
Figure 1a). The sled offered an enclosed cabin in which participants were seated on a rally seat with a head- and footrest (
Figure 1b). We used very similar raised cosine motions as used by Kuiper et al. [
9]. Each displacement had a 9 m peak-to-peak amplitude, peak acceleration of 2.6 m/s
2, and a duration of 9 s (
Supplementary Figure S1). We pseudorandomly varied the onset of consecutive motions with an interval between 12 and 20 s according to a uniform distribution. The initial direction (50% forward, 50% backward) of the motions was pseudorandomly chosen. We varied these aspects to make it improbable for participants to predict the onset and direction of motion reliably without anticipatory cues. To minimize the recognizability of the order of motion directions, we mirrored the motion stimulus in direction and exposed participants to both variants on the same day (counterbalanced across the anticipatory and control sessions). The exposure duration was 15 min, which duration was also used by Kuiper et al. [
9] and Reuten et al. [
21].
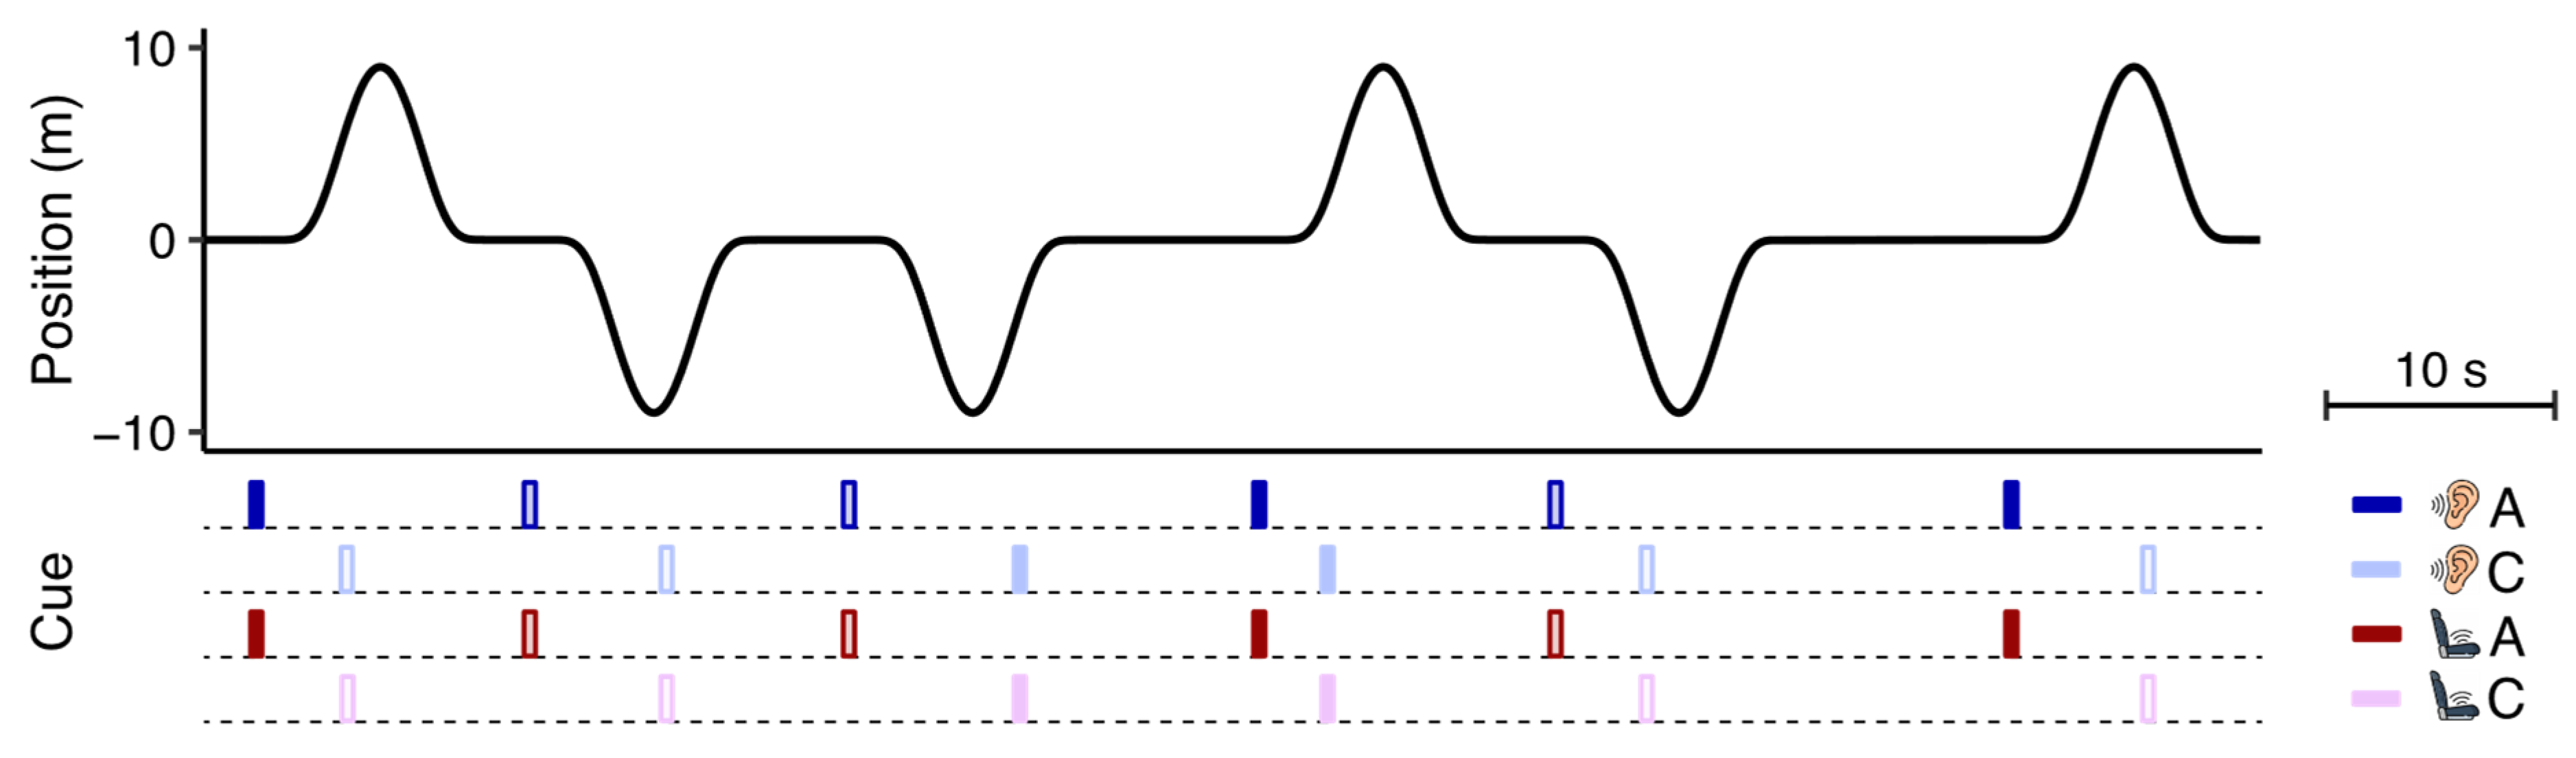
2.3. Auditory and Vibrotactile Cues
In the anticipatory sessions, the cues specified the initial motion direction of the linear sled. The onset of the cues always started 1 s
prior to motion onset, equal to the interval used by Kuiper et al. [
9]. The auditory cues consisted of prerecorded voice clips (250 ms) saying “forward” or “backward” in Dutch (respectively “voor” or “achter”) that were presented via headphones. We presented the vibrotactile cues by means of a flat piece of foam placed on the seat in which six small eccentric rotatory mass vibration motors were embedded in two fore-aft rows of three motors each, one beneath each leg (see
Figure 1b). After conducting a pilot test using various vibration patterns, we decided to indicate forward motions by a sequential cueing pattern from hip to knee and backward motions by the same pattern in the opposite direction. To generate this pattern, the two motors in each row vibrated for 50 ms with an inter-row interval of 50 ms (250 ms). Replicating the design of Kuiper et al. [
9] and Reuten et al. [
21], we also presented cues in the control sessions to make sure that any effect of the anticipatory cues was not caused by the effect of the cue in itself. The onset of these non-anticipatory cues was pseudorandomly chosen at 2, 3.5, 5 or 6.5 s
after motion onset according to a uniform distribution, implying these cues had no predictive value. To further minimize their usefulness, the direction they specified was independent of the sled’s initial motion direction. The presentation of the cues in relation to the motion stimulus can be seen in
Figure 2.
2.4. Procedure
Participants performed the four sessions divided over two days, with a minimum of 24 h in between. We grouped the auditory sessions on one day (and consequently the vibrotactile sessions on the other day) to resemble the study design of Kuiper et al. [
9]. We counterbalanced the order of these two days, as well as the order of the anticipatory and control sessions within each day. Each of the eight resulting session orders was randomly assigned to three participants.
Before starting the first session, we explained to participants how to use the Motion Illness Symptoms Classification scale (MISC,
Table 1 [
26,
27]), which we used throughout the experiment. We instructed that if they rated MISC ≥ 6 (i.e., any level of nausea and/or vomiting) or expressed the wish to stop, we would abort the session. They subsequently filled out the MSSQ-Short [
25]. We then asked participants to perform a familiarization trial of two motions on the linear sled: one starting in the forward direction and one starting in the backward direction. We explicitly instructed that these motions would be used throughout the whole experiment. After this familiarization, we asked participants to take a 10-min break whilst they stayed seated inside the cabin.
The remaining part of the procedure was also used on the second day. While seated in the stationary cabin, participants performed a short training on the motion direction the anticipatory cues would indicate. In this short training, we presented the forward and backward cue of the modality tested that day twice, in alternating order. The experimenter announced the motion direction for the first two cues; the participant was asked to do so for the latter two cues. All participants performed this task without errors. The first session started directly after the training. We instructed participants to keep their heads upright and eyes open. After completing the first session, participants were given a break lasting at least one hour until reaching a MISC < 2 before starting the second session. At multiple times throughout the experiment, we asked participants to fill out a user experience questionnaire (see Data collection).
2.5. Data Collection
To capture the progression of motion sickness, we asked participants to classify their motion sickness symptoms using the MISC every 1 min during the sessions. The MISC is the main measure of our study. We additionally collected information on the user experience of the cues via multiple questionnaires. After each session, we asked participants if, when and how many times the cues were presented (multiple-choice) and how they evaluated the cues along a range of user experience dimensions (Likert scale). After completing the auditory or vibrotactile sessions (i.e., at the end of one day), we asked participants if the cues in any session helped to mitigate motion sickness (multiple-choice). After the last session, we asked participants if they realized that the cues had always been presented either before or during the motions (multiple-choice), which cue they preferred to announce upcoming motions (multiple-choice), to rank the cues from most to least favorite in announcing upcoming motions (rank), to indicate if they would want to use their favorite cue in their (automated) car (multiple-choice), how much money they would be willing to spend extra on a car preventing motion sickness (open-ended), and if they wanted to alter the cue in some aspect (open-ended).
2.6. Data Analysis
In our first laboratory study [
21], we developed a way to express the effectiveness of the anticipatory cues during the whole session in one value. Here, we will use the same data analysis approach. We assume that the cues would mitigate motion sickness by a certain fraction (e.g., 25%) rather than by a fixed value (e.g., 4 MISC classes). The latter would yield nonsense results for low MISC scores, as a reduction of 4 would imply negative MISC values when starting at MISC values below 4. We named our measure
, denoting the relative reduction in motion sickness symptoms in the anticipatory session relative to the control session.
For each cueing modality, we determine
by comparing the MISC scores between the anticipatory (
) and control (
) session. We first calculate the reduction
of MISC scores per time point (
) and individual participant (
) by
This relative reduction value facilitates the interpretation of the effectiveness of the cues as the distribution of
is symmetrical around zero (indicating no effect), with a maximum value of 1 (
) and minimum value of
1 (
). We do not calculate
at
t = 0 (i.e., pre-test measurement) and cannot determine
for those time points with missing MISC scores as the result of the stop-criterion at MISC 6. When
,
becomes undefined. This is not problematic for our analysis as we will weigh the data as explained below; undefined
values will receive a weight of zero. Because participants generally rate MISC 0 or 1 at the beginning of a session, the resolution of
is low for the first time points:
will either be 0, 1, or −1. Therefore, when determining the average reduction of the anticipatory cue across all time points, we weigh (
) each of the 15 obtained
values (i.e., one for each time point in the session) by the sum of the two underlying MISC scores. Consequently,
values that are calculated on higher MISC scores will receive a larger weight
We can then calculate the average reduction per participant
by
and for each time point
by
Equation (3) indicates that
is proportional to the sum of the differences in MISC scores between the anticipatory and control session of a participant. To express the effectiveness of the anticipatory cue in one value across all time points and participants within a session, we again consider the resolution of
by
We perform this analysis twice: once for the auditory sessions and once for the vibrotactile sessions. In general,
is expected to be a small value. To provide the reader some intuition for our measure, we provide a conversion of
to a percentual change in MISC scores (i.e.,
) in
Supplementary Figure S2. Note that for
, exchanging
and
only results in a change of sign, whereas
has an asymmetrical distribution.
2.7. Statistical Analysis
The first part of the analysis focuses on determining if our anticipatory auditory and vibrotactile cues mitigated motion sickness. We hence performed two weighted one-sided t-tests (α = 0.05) on the auditory and vibrotactile values (each weighted by ) to establish whether the generated reduction was larger than zero. The second part of the analysis focuses on investigating whether the effectiveness of our anticipatory cues differed. We therefore performed a weighted paired-samples t-test (α = 0.05) on the auditory and vibrotactile values (each weighted by ). To express the confidence of our estimates of , we report two-sided 95% confidence intervals. When interested in determining whether there was a reduction (), we instead report one-sided 95% confidence intervals using the format: [lower bound, ∞). The two parts of the analysis described in this section were preregistered.
The third part of the analysis presents the user experience of the cues via visualizations of descriptive statistics. As this third part was not preregistered, it should be considered as exploratory. The same holds for the additional analyses that we will present in the discussion section.
3. Results
Our primary aim was to determine if our anticipatory auditory and vibrotactile cues mitigated motion sickness. We present the temporal development of MISC scores in
Figure 3a (see
Supplementary Figure S3 for the individual data). On visual inspection, participants rated lower MISC scores in both anticipatory sessions compared to the control sessions. We quantified the reduction in the development of motion sickness per participant using our pre-registered measure
(
Figure 3b). The amount of benefit received from each anticipatory cue varied between participants: some benefitted from both cues, one cue, or neither cue. For both cues,
did not vary systematically across time points (
Supplementary Figure S4). As the cues generated a constant effect across a session, it becomes meaningful to express the effectiveness of each cue in one value. Different from what the visual inspection suggested, neither of the anticipatory cues generated a significant reduction in motion sickness as expressed by the overall reduction
across all time points and participants in a session (
Figure 3c). For the anticipatory auditory session (
= 0.08), the weighted one-sample
t-test indicated
t = 1.1 and
p = 0.133 ([
0.03, ∞)). For the anticipatory vibrotactile session (
= 0.09), the test indicated
t = 1.6 and
p = 0.059 ([0.00, ∞)). Our second aim was to investigate whether the effectiveness of the anticipatory auditory and vibrotactile cues differed. The weighted paired-samples
t-test indicated there was no significant difference, with a weighted mean
difference of
0.04,
t =
0.4, and
p = 0.697 ([−0.24, 0.16)).
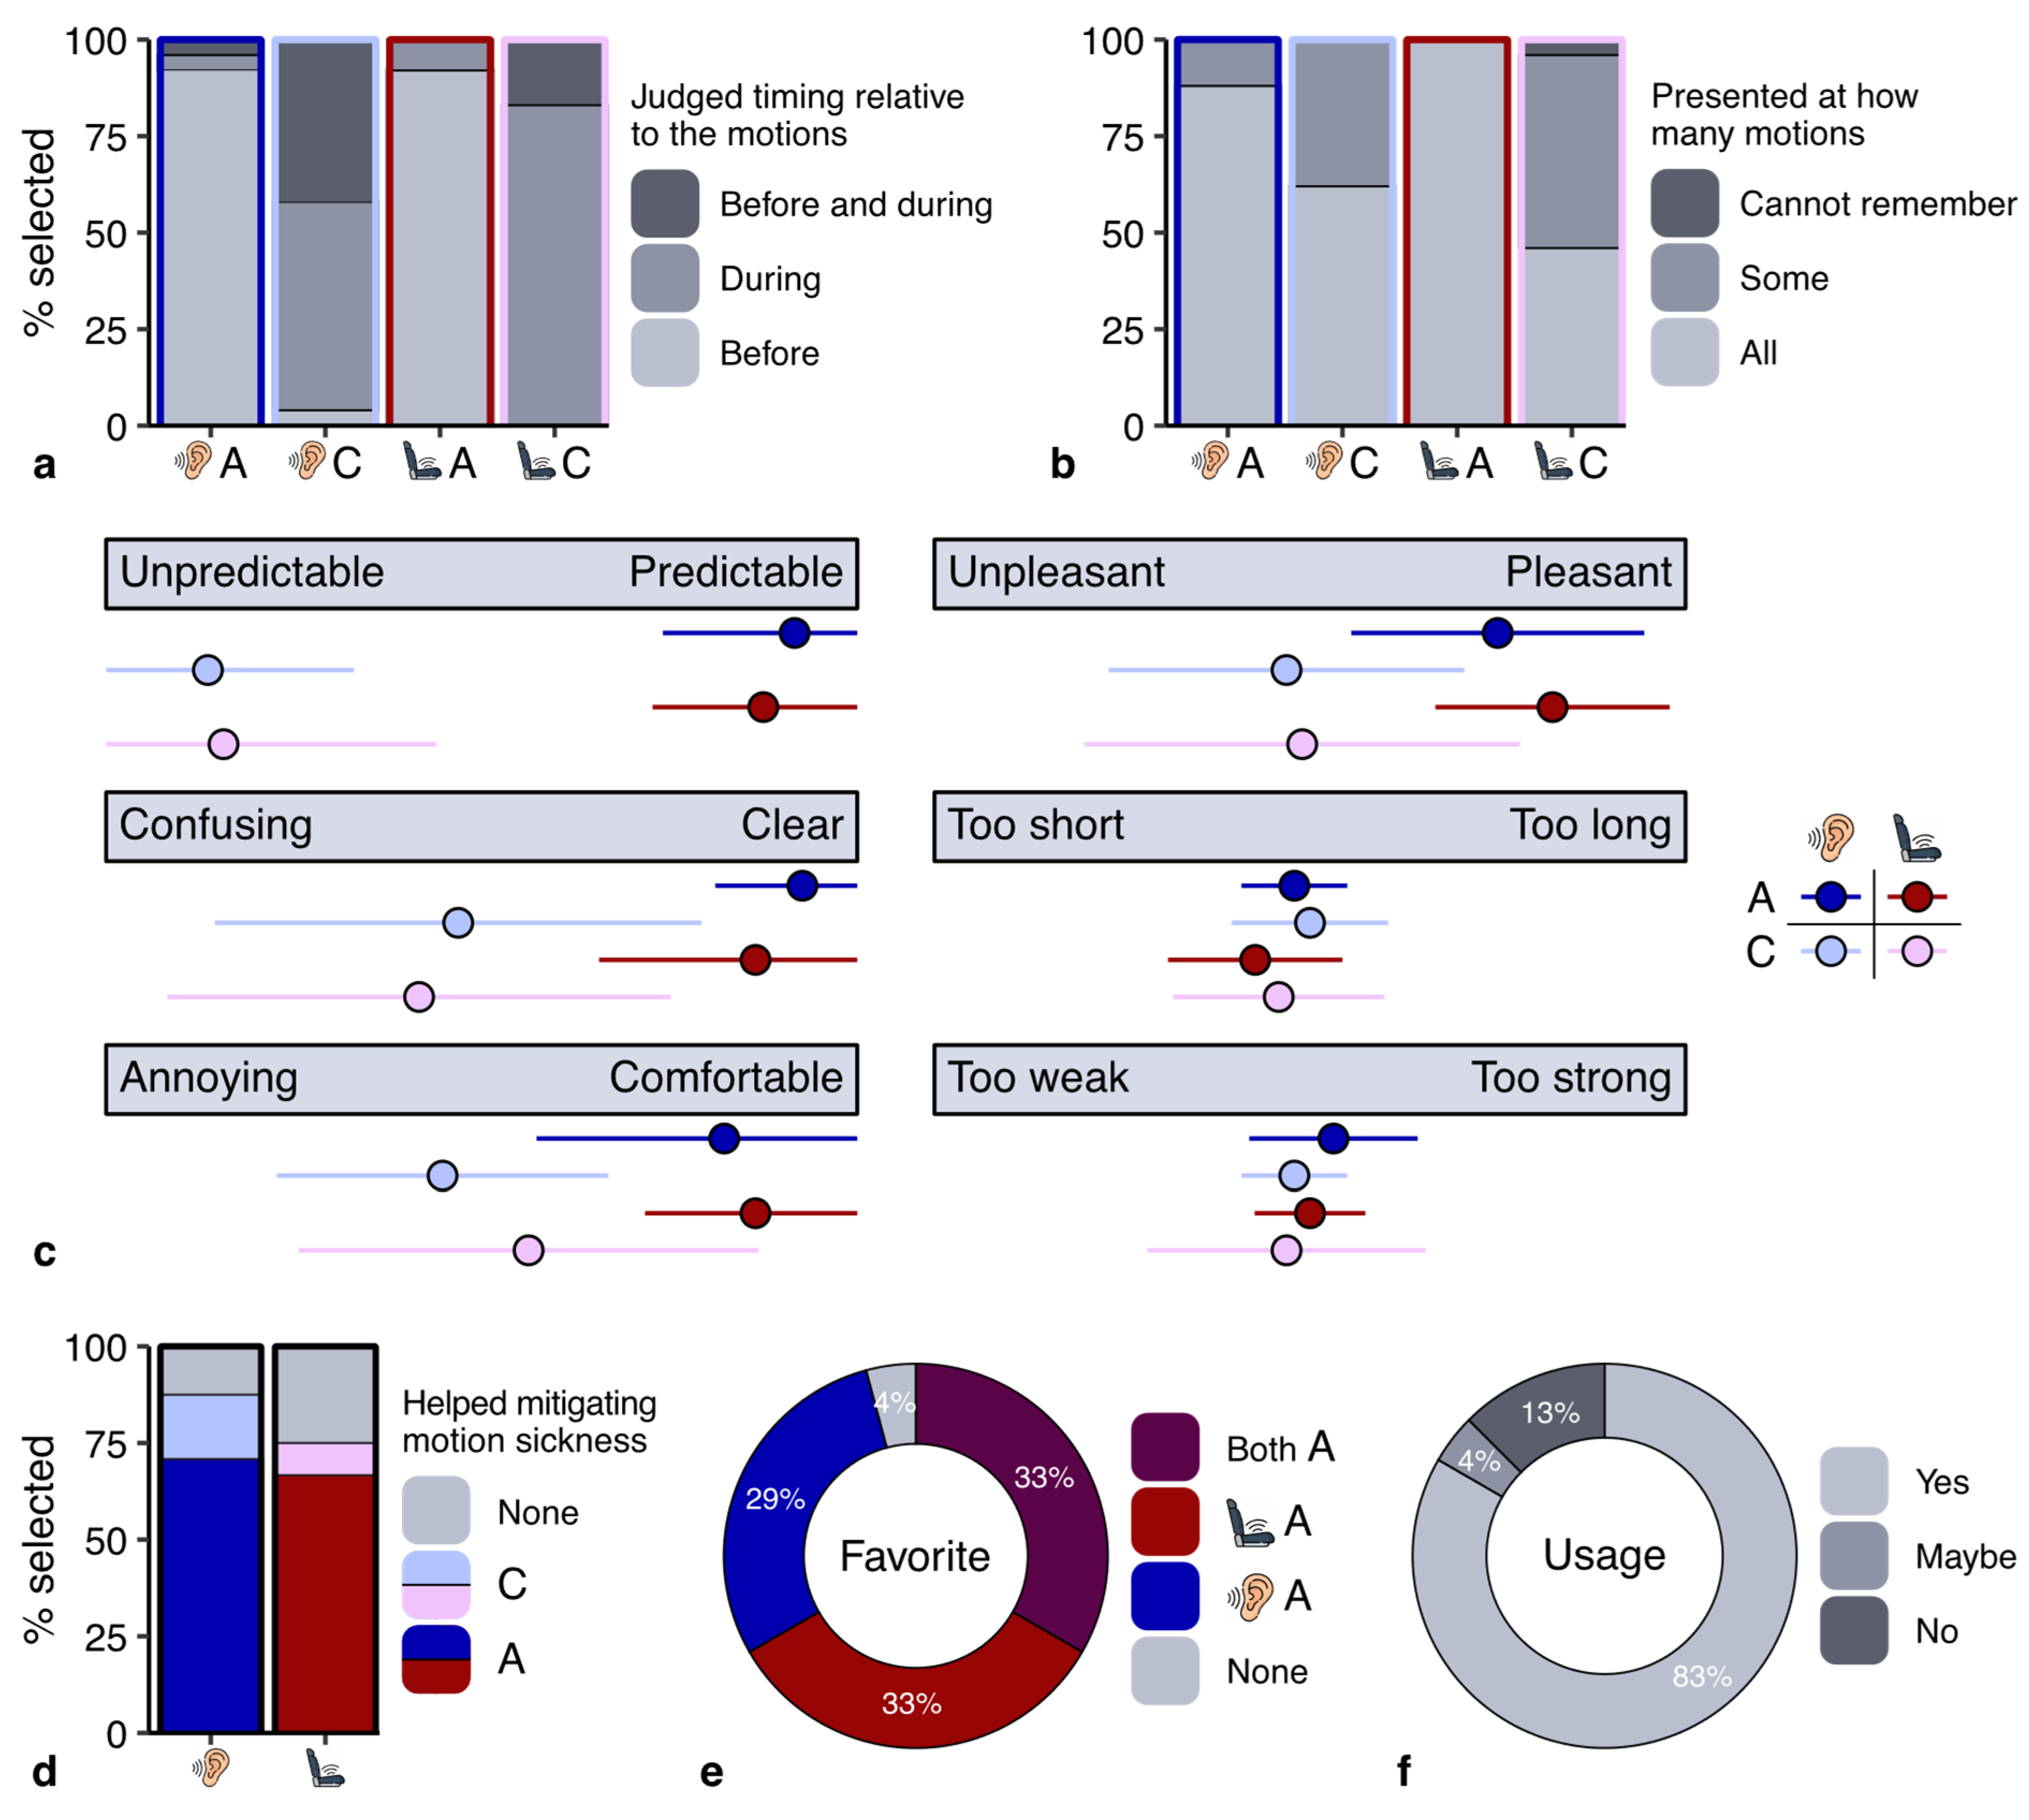
Our third aim was to investigate how participants evaluated the cues in terms of user experience. The results of our questionnaire indicated that most participants correctly remembered when the cues were presented (
Figure 4a). However, some participants incorrectly indicated that the cues had also been presented before motion onset in the control sessions. We asked participants to indicate how often they noticed the cues (
Figure 4b). Whereas most participants indicated that the cues in the anticipatory sessions were presented at all motions, this percentage was much lower in the control sessions. This might be related to the misjudgment of the timing of the cues in the control session: if participants paid less attention to the cues in the control sessions, they might not accurately remember when they were presented.
We asked participants to rate the cues along several user dimensions (
Figure 4c). There was a clear difference in user experience between the cues in the anticipatory and control sessions, but only small differences between the auditory and vibrotactile cues. The anticipatory cues made the motions more predictable (
Figure 4c), and about 70% of the participants indicated that they helped to mitigate motion sickness (
Figure 4d). All except for one participant also indicated that they preferred the sessions with anticipatory cues (
Figure 4e). Moreover, about 80% of the participants indicated they would want to use the cue they preferred in their (automated) car (
Figure 4f). Additional information on the user experience questionnaire is provided in the
Supplementary Information.
4. Discussion
The primary aim of our study was to investigate if we could replicate the effectiveness of anticipatory auditory cues previously reported in Kuiper et al. [
9], and if we could demonstrate the effectiveness of vibrotactile cues using their experimental conditions. We additionally wanted to find out whether the effectiveness of auditory and vibrotactile cues differed and how participants experienced using them. Even though the results of a user experience questionnaire indicated that the anticipatory cues were useful, our pre-registered analysis measure
provided no evidence that the cues significantly mitigated motion sickness. There was no difference in the effectiveness of the anticipatory auditory and vibrotactile cues.
Based on our measure
, there is no statistical evidence that our anticipatory cues mitigated motion sickness under the chosen experimental conditions. The lack of a significant reduction in motion sickness is in line with the results we found in our previous laboratory study [
21]. Our anticipatory cues thus did not generate large reductions in motion sickness. Does this repeated lack of a significant reduction imply that anticipatory cues do not mitigate motion sickness, and that the difference in statistical evidence that Kuiper et al. [
9] and Reuten et al. [
22] reported was based on sheer chance? Several aspects of our data suggest that the anticipatory cues in our laboratory studies did mitigate motion sickness, but that statistical power was too low. First, the average of MISC scores across the sample is consistently lower in the anticipatory sessions compared to the control session(s) for each time point in both studies (
Figure 3a here and Figure 5a in Reuten et al. [
21]). Second, in Reuten et al. [
21], we quantified the mitigating effect of the auditory cues of Kuiper et al. [
9] using
and concluded it did not differ significantly from the effectiveness of the cues in that study. Also in our current study is the effectiveness of the anticipatory auditory (
= 0.08) and vibrotactile (
= 0.09) cues similar to the overall reduction (
= 0.10) in Kuiper et al. [
9]. Lastly, the answers given in response to the user experience questionnaires in our studies indicated a clear preference for using anticipatory cues. For these two reasons, we explored the results from several additional analyses in the following sections.
4.1. Repeated Measures ANOVA
Our first attempt to investigate why—despite using the same experimental conditions as Kuiper et al. [
9]—we did not find a significant effect of our anticipatory cues was to apply their analysis approach to our data. We accordingly replaced missing data due to the stop-criterion with the last rated MISC score (
Supplementary Figure S5). We then analyzed the resulting new dataset using the factors time (16 levels) and session (4 levels) in a repeated measures ANOVA. The results of this ANOVA with Greenhouse-Geisser correction indicated there was a significant main effect of time with
F(15, 345) = 75.8,
p < 0.001, partial h
2 = 0.77, but—in contrast with Kuiper et al. [
9]—no significant effect of the session (
p = 0.089) and also no interaction (
p = 0.730). These results imply that the MISC scores increased over time within the sessions but not differently between the sessions, hence indicating no significant effect of the anticipatory cues. The conclusion drawn from our analysis based on
thus aligns with those of a repeated measures ANOVA, indicating that our analysis using the reduction
is not underestimating the effect of the anticipatory cues.
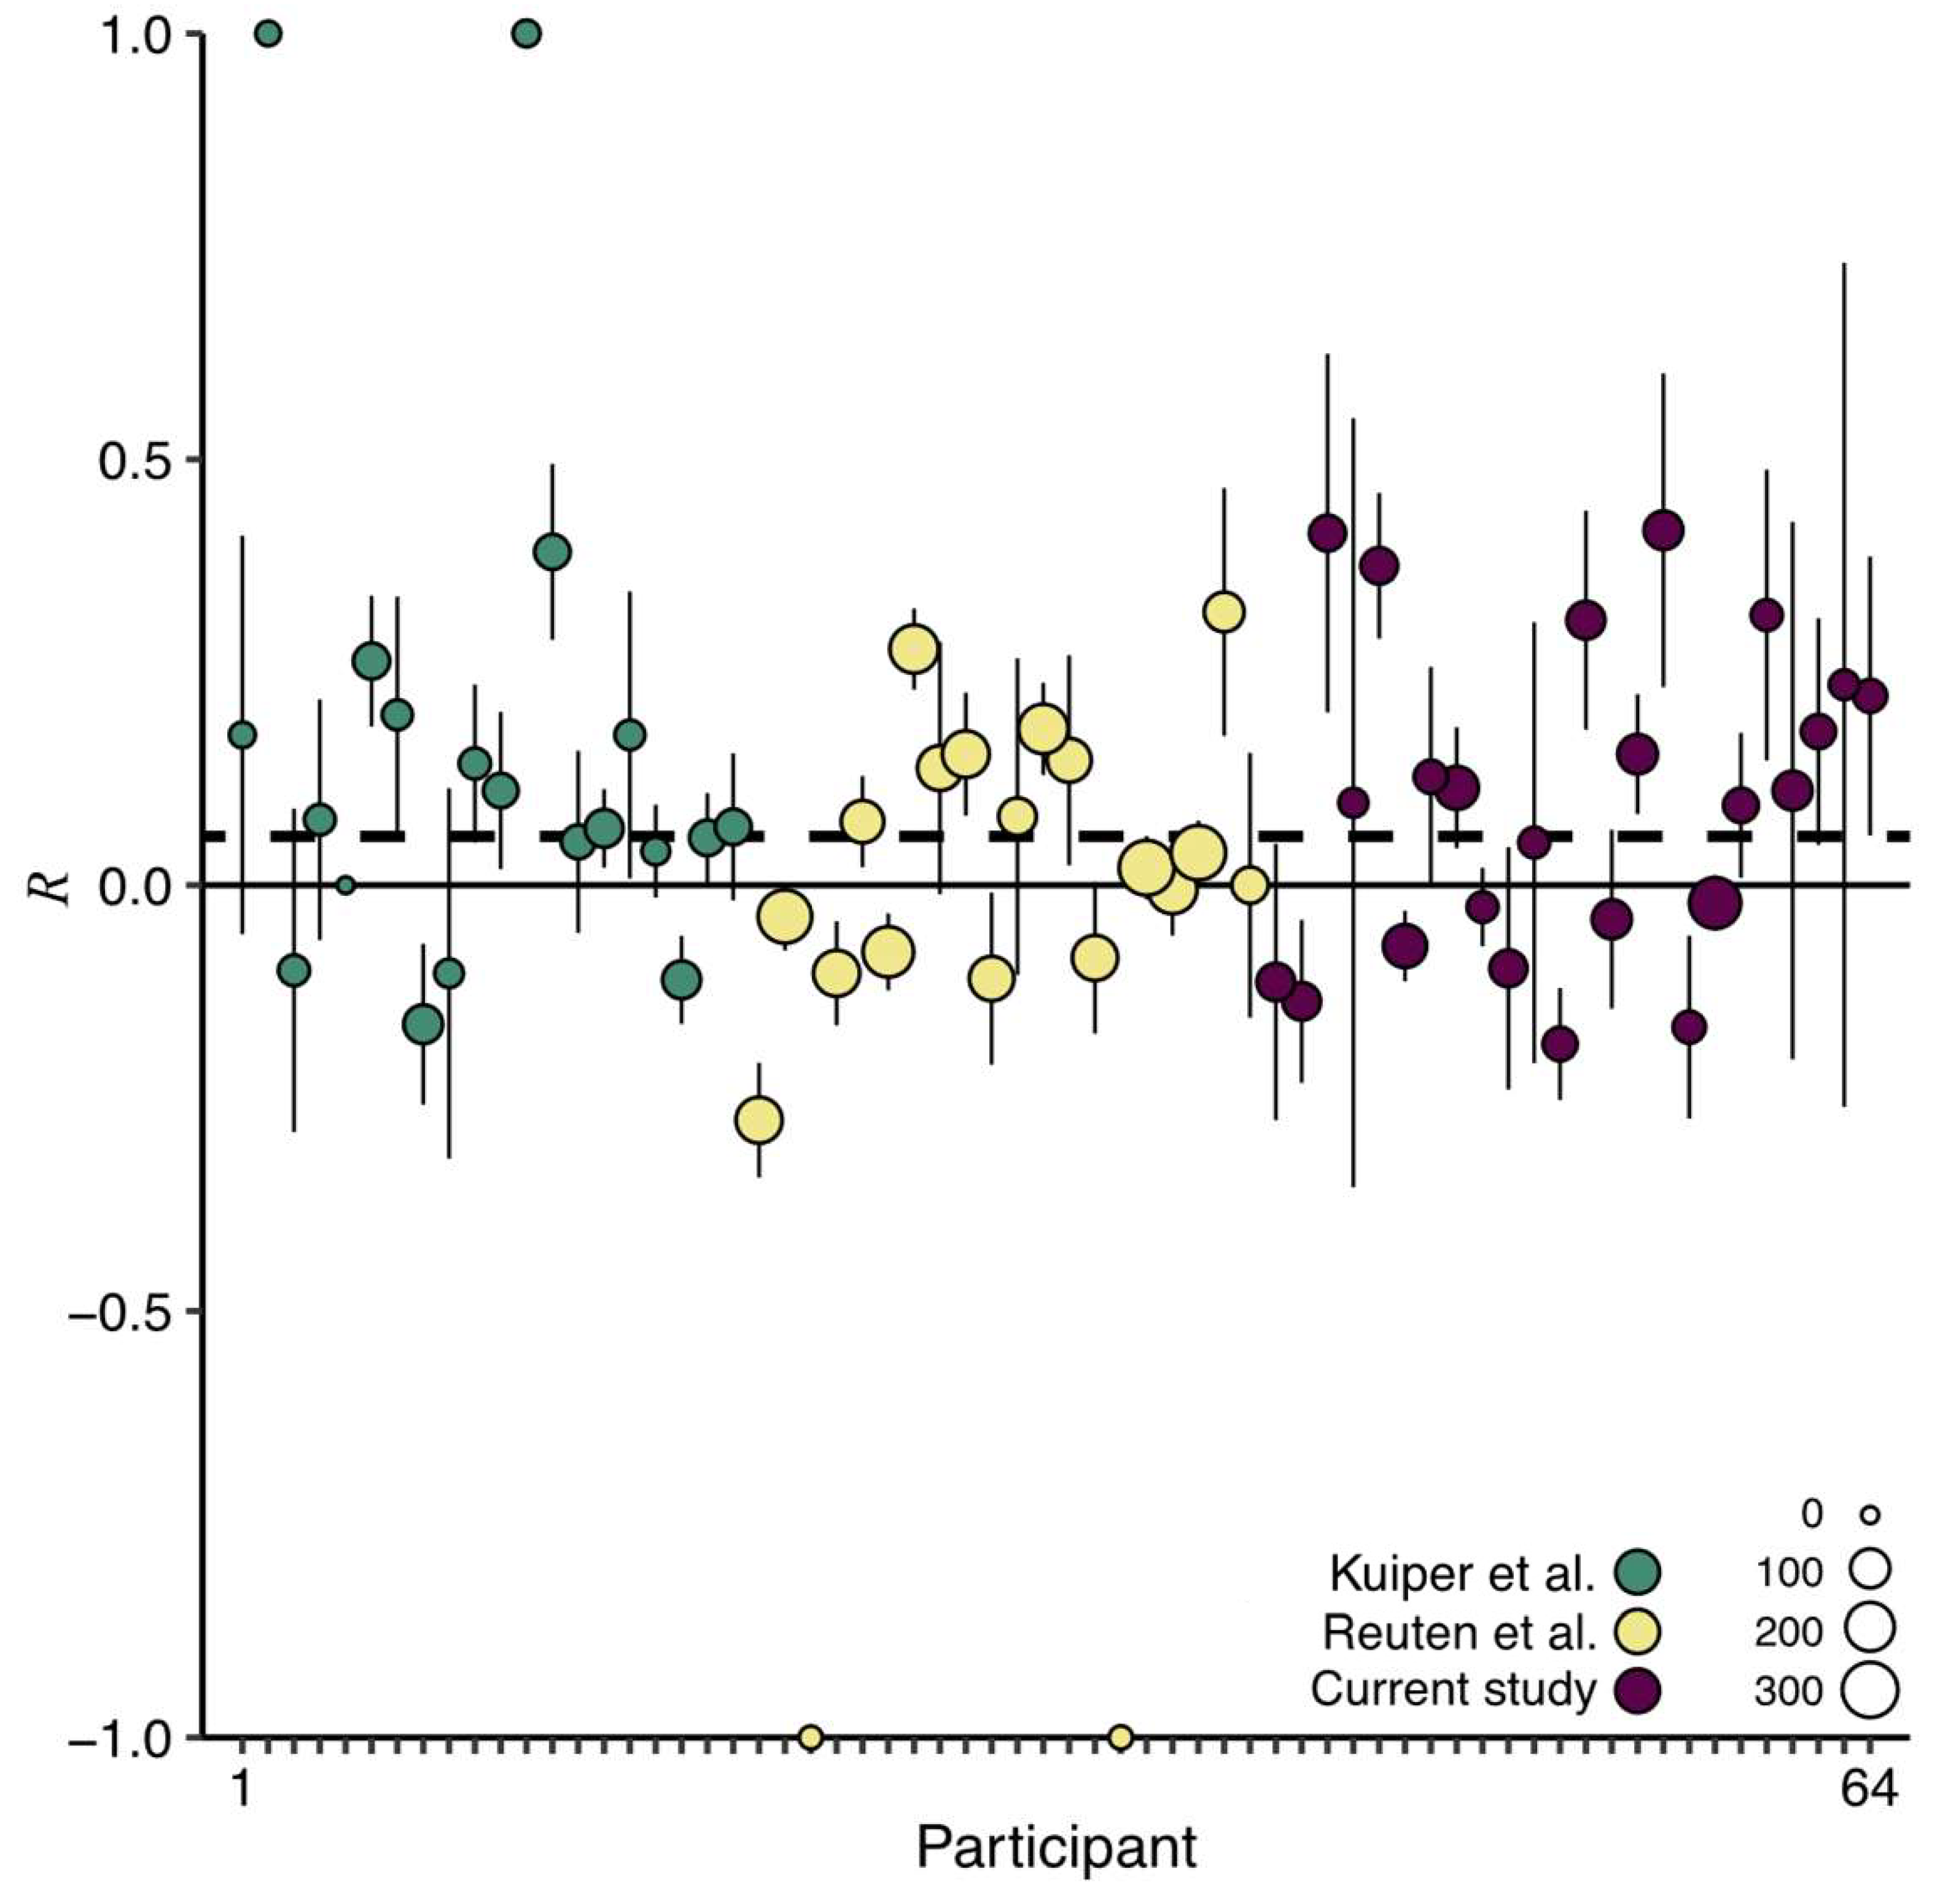
4.2. Internal Meta-Analysis
The studies by Kuiper et al. [
9] and Reuten et al. [
21] were conducted under similar experimental conditions as the current study. All studies used the same linear sled, a comparable motion stimulus, an approximately equal sample size, similar auditory and/or vibrotactile anticipatory cues, and the same outcome measure (MISC). The comparability of the three studies provides the possibility to combine their datasets, which results in more statistical power to detect small but meaningful effects. Hence, we performed an internal meta-analysis on this combined dataset, again using our measure
. Because we included multiple anticipatory sessions in our current and previous laboratory study [
21], for these studies we first determined a weighted reduction across the anticipatory sessions per participant. We subsequently determined the overall reduction across the three studies using a weighted average of the
values (
Figure 5). The resulting
= 0.06, with the lower bound of the 95% one-sided confidence interval at 0.02, indicates that anticipatory cues are overall effective in mitigating motion sickness.
Some readers might be concerned that the outcome of this analysis is driven by the results of Kuiper et al. [
9]. However, the effectiveness of the cues in Kuiper et al. [
9] did not differ from that in our current and previous laboratory study [
21]. Another reason negating this concern is that the experiment in Kuiper et al. [
9] consisted of two sessions while the two other studies consisted of four. Consequently, the
values in Kuiper et al. [
9] have smaller weights (Equation (2)) and thus determine the outcome less than those from the other studies (i.e., the green data points are smaller than the yellow and purple data points in
Figure 5). For these two reasons, we interpret the observed overall effect of anticipatory cueing as the result of more statistical power. Studies investigating the effectiveness of anticipatory cues thus require high statistical power.
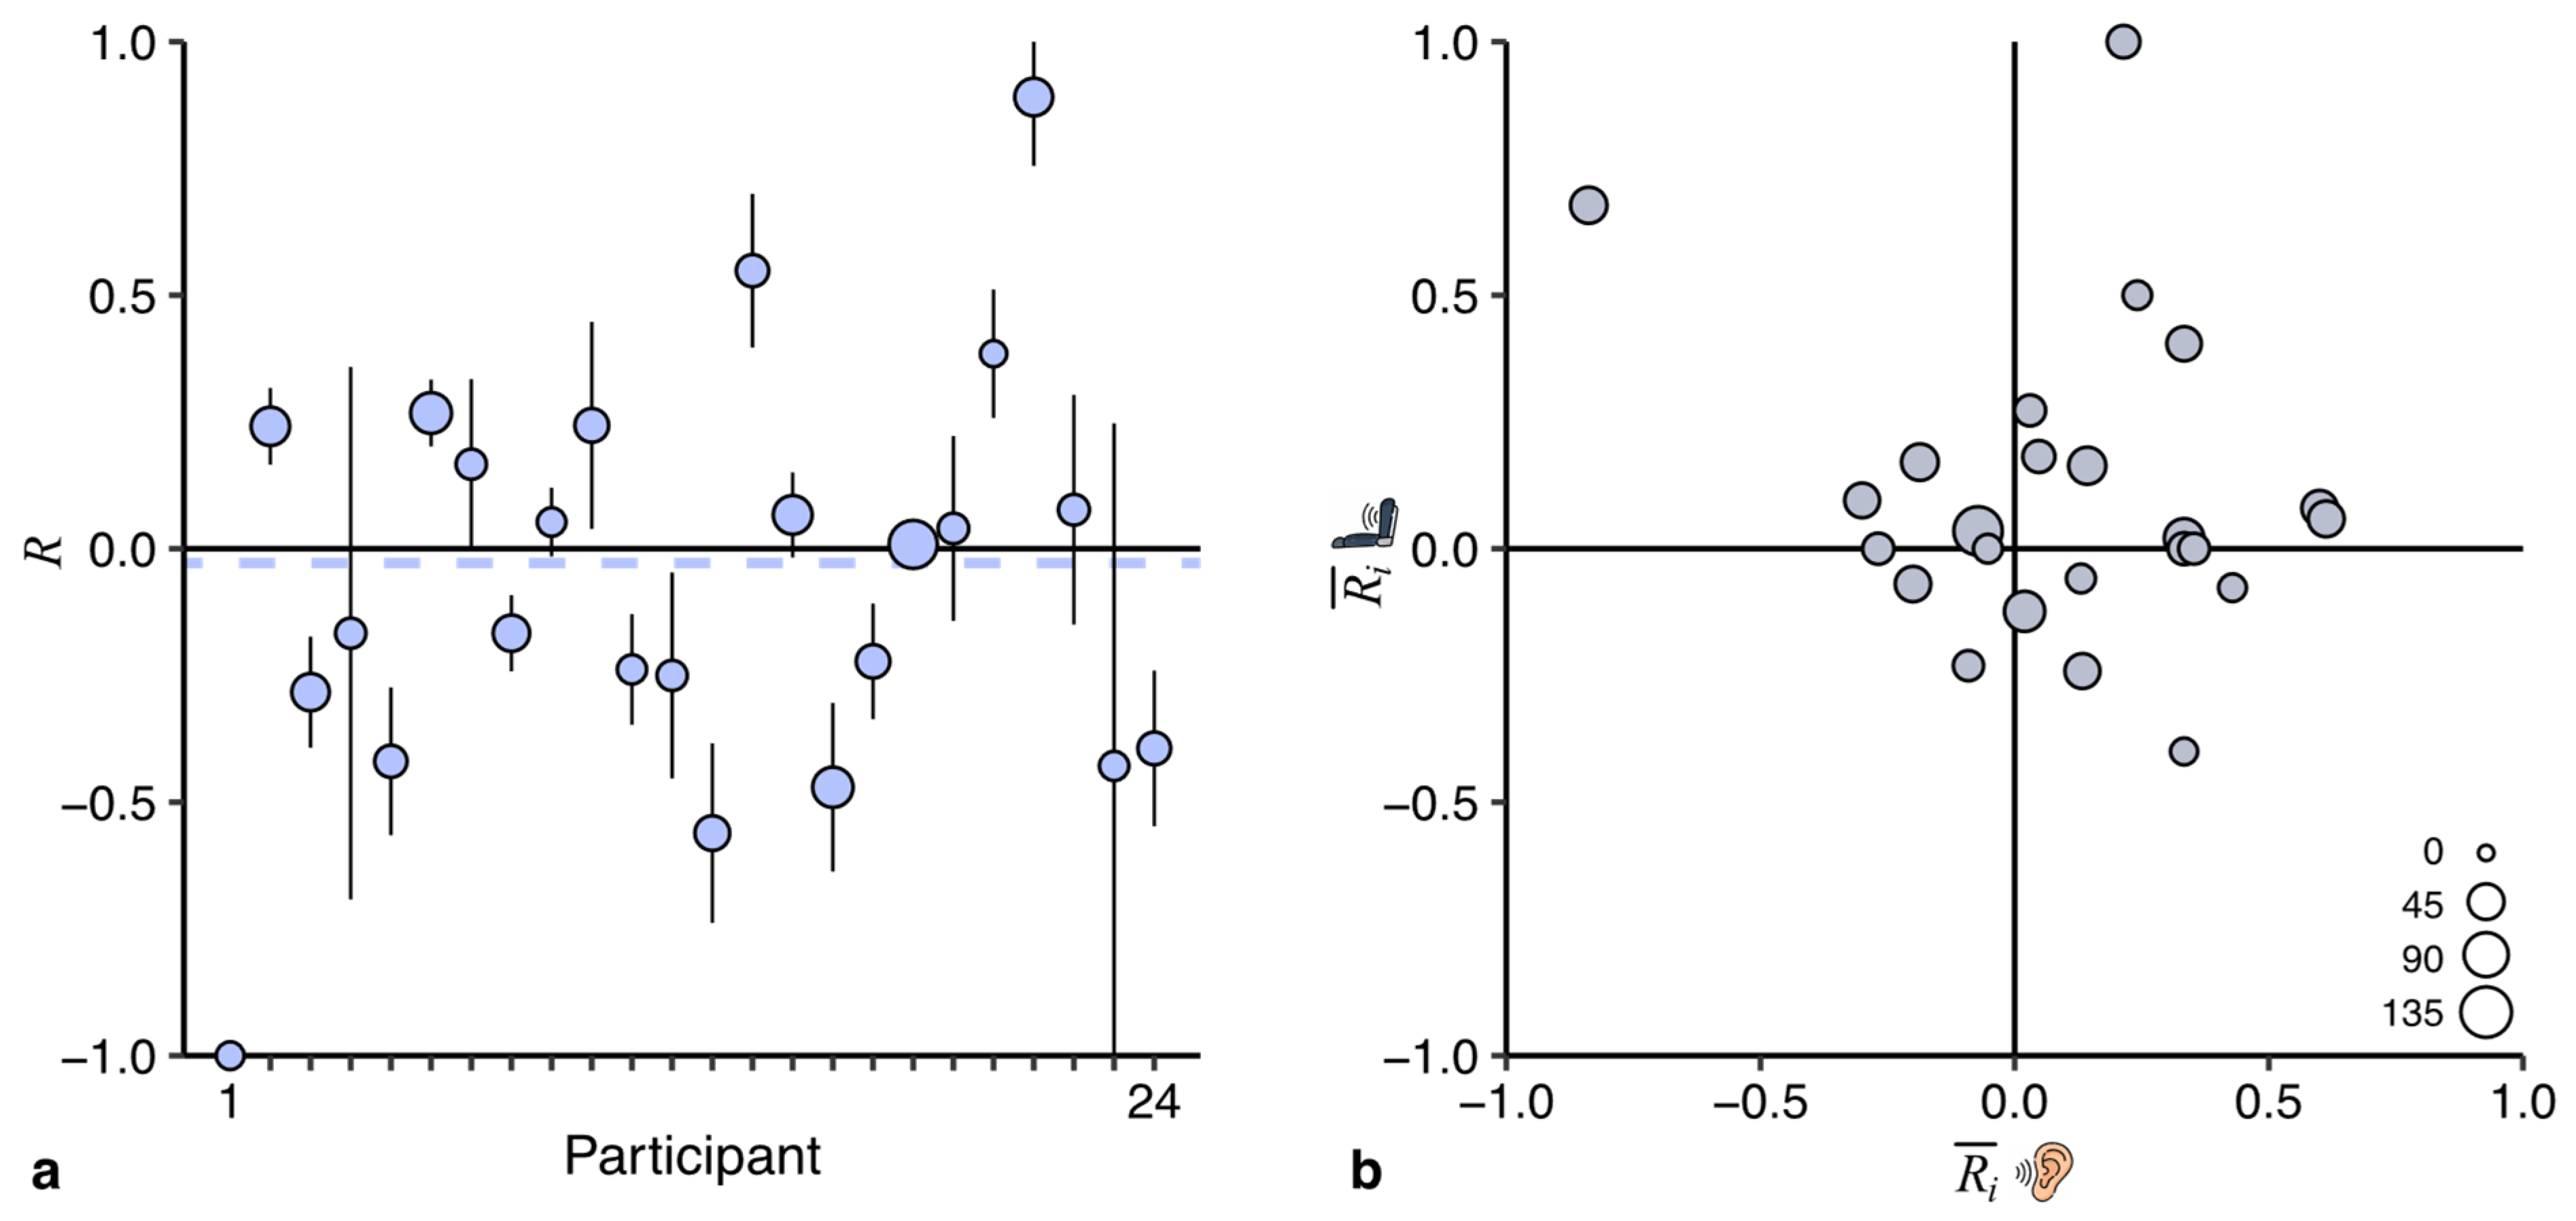
4.3. Between-Participant Variability
We observed large between-participant differences in the reduction generated by the anticipatory cues: the
values in
Figure 3b and
Figure 5 range from −1 to +1. We wanted to investigate whether these differences are characteristic of idiosyncratic differences in the benefits participants obtained from the cue, or result from uncontrollable variability (e.g., rating noise). To answer this question, we performed two additional exploratory analyses of the data of the current study.
First, we investigated the between-participant variability in a sham comparison: between the development of motion sickness in the two control sessions. In this analysis, neither cue is of benefit, so the largest component is uncontrollable variability. If the between-participant variability in this analysis is just as large as in
Figure 3b, this would suggest that the differences between participants are due to uncontrollable variability. Not surprisingly, the comparison of the control sessions (
Figure 6a) generates an overall reduction of about zero. More interesting is the between-participant variability: it is equally large as in
Figure 3b, suggesting that uncontrollable variability can explain the differences between participants observed in
Figure 3b and
Figure 5.
Second, we reasoned that if the participants would differ in the amount of benefit obtained from the anticipatory cues, one would expect that the benefit in the two anticipatory sessions correlates. We therefore calculated a weighted correlation between the
values of the anticipatory sessions (
Figure 6b). The results do not provide evidence for a significant positive correlation (
r =
0.23, [
0.77, 0.31]), again suggesting that the observed between-participant differences are more likely the result of uncontrollable variability.
The conclusions of both exploratory analyses are thus in agreement with each other: the effect of anticipatory cues does not seem to be idiosyncratic. This implies that we should interpret our data as showing that all individuals can benefit slightly from anticipatory cues rather than that some benefit considerably and others not.
4.4. Summary
Here, we investigated and compared the effectiveness of anticipatory auditory and vibrotactile cues in mitigating motion sickness. The results of our pre-registered analysis of the reduction measure
could not demonstrate that our anticipatory cues significantly mitigated motion sickness. Nevertheless, we had several reasons to assume that the cues did mitigate motion sickness to some extent. An internal meta-analysis performed on three comparable studies confirmed this assumption: the anticipatory cues mitigated motion sickness with a grand
of 0.06 (95% one-sided confidence interval [0.02, ∞); see
Figure 5). When converting this reduction to a measure of percentage change, the anticipatory cues reduced motion sickness by 11%. This percentage is much smaller compared to a reduction from vibrotactile cues of 40% we observed in a test track study in which we used the same data analysis approach [
22]. Taken as a whole, the pattern of findings across our studies suggests that anticipatory cues are of greatest benefit to participants when motions consist of more degrees of freedom. Participants are prone to making larger prediction errors for more unpredictable motion stimuli, which could explain why anticipatory cues generate a larger effect. This suggests that anticipatory cues may be even more advantageous during real-life automated car driving when assuming there will be greater variability in driving maneuvers. Determining which and how those maneuvers should be announced requires further investigation. For example, motions that are not provocative should not be announced, as providing unnecessary cues may result in passengers disengaging from the cueing system [
28]. Unforeseen maneuvers that the automated vehicle did not anticipate may not allow sufficient time to provide a directional anticipatory cue. However, such events should be incidental as automated vehicles are generally able to predict their motion well.


 ,
, 


