Abstract
New applications introduced capsule designs with features that have not been fully analysed in the literature. In this study, thin shells of revolution are used to model drug delivery capsules both with closed and open designs including perforations. The effects of internal boundary layers and sensitivity on frequency response are discussed in the special case with symmetric concentrated load. The simulations are carried out using high-order finite element method and the frequency response is computed with a very accurate low-rank approximation. Due to the propagation of the singularities induced by the concentrated loads, the most energetic responses do not necessarily include a pinch-through at the point of action. In sensitive configurations, the presence of regions with elliptic curvature leads to strong oscillations at lower frequencies. The amplitudes of these oscillations decay as the frequencies increase. For efficient and reliable analysis of such structures, it is necessary to understand the intricate interplay of loading types and geometry, including the effects of the chosen shell models.
1. Introduction
Recent advances in pharmacology have led to the introduction of long-term drug delivery devices, typically implants intended for insertion into human bodies (see, for instance, the overview by Auvinen et al. [1]). Ultimately, these devices will have characteristics that maximise the payload volume. Hence, modeling such devices as thin shells of revolution is reasonable. In Figure 1, three proposed designs for prototypes of monolithic, reservoir-type implants are illustrated. It should be noted that the current manufacturing techniques constrain the payload volume maximisation under external constraints.

Figure 1.
Three realistic capsule designs with the limit payload regions indicated. The first design (a) is a cylinder, whereas the other two (b,c) have non-uniform curvature inner shells. Images courtesy of V. Auvinen/University of Helsinki.
When inside bodies, the implants are subject to external pressure loading, for instance. within the upper arm muscles. In some circumstances, the effect can be local; however, the frequencies are low. The capsules are filled with injectable drug-releasing hydrogel formulations, which are shear thinning, and therefore any fluid–structure interactions can be omitted from the model. The open end or perforations (if included) are the channel through which the drugs are released once the bonds within the gel are broken. For the monolithic open-end designs, the expected drug release rate is based on the ideal shape of the open end of the capsule [1]. For perforated ones, the release rate is a function of the internal pressure and the hole coverage percentage. There are many solutions for activation of drug release including electromagnetically controlled vibrations.
Ultimately, the goal of computational mechanics in this class of applications would be to apply topology optimisation to optimise for structural properties and drug release rates, for instance, material or fluid flow [2]. There have been significant interest and advances addressing these concerns in the literature covering different geometric configurations, time domains, and characteristic length scales in materials.
Thin structures and shells in particular have been studied by many authors; the standard reference is Chapelle and Bathe [3]. The so-called sensitive shells (see book by Sanchez-Palencia [4]) are a special class of structures with unusual characteristics. For instance, the elliptic shells may lose coercivity as the dimensionless thickness tends to zero. The resulting large displacements are not physical and one interpretation of the sensitivity is that at the limit the Shapiro–Lopatinsky conditions of linear elasticity are not satisfied any more. These shell-specific features emerge whenever only one end of the capsule is sealed completely while the other one is either open or otherwise only lightly kinematically constrained. Analysis is strictly restricted by the type of the Gaussian curvature of the shell. If the shell profile is not uniform in some well-defined way, a priori analysis is not available and numerical simulation is necessary. In Figure 1a, the shell profile is uniform, but in Figure 1b,c this is not the case.
Concentrated loads or point loads are common and widely used in modeling. For shells, they have an interesting role to play since they excite singularities that propagate along the characteristics of the surface. There is a strong connection between the characteristics and internal boundary layers. Formally, characteristics act as boundary layer generators for the internal layers. Depending on the shell geometry, it may happen that due to superposition of boundary layers, even in the case of concentrated loads, the maximal displacements can occur far away from the point of action of the load. In other words, where one would expect a simple local pinch through, something quite global, i.e., practical resonance, can result as a response. Free vibration of perforated shells and its relation to standard cases has been covered in [5,6].
Elliptic surfaces cannot have internal layers; however, if the elliptic shell is sensitive, the deformations need not be local, that is, occurring only close to the point of action. In a very recent paper, it has been observed that in idealised configurations, concentrated loads can create secondary pinch-through effects via boundary layer superposition [7].
Frequency response analysis of perforated shells has been studied by this author previously; see [8,9]. There, the focus was on material uncertainty and stochastic finite element method when the dimensionless thickness tended to zero. Somewhat surprisingly, the local effects have boundary-layer induced amplification of deformation amplitudes and hence become dominant features in the asymptotic process.
1.1. Novelty of This Work
The goal of this study is to systematically examine the combined effects of the many features present in thin structures on their frequency response under concentrated loading. In particular, the shell models and geometries, with special emphasis on local curvature, and kinematical constraints are in focus. Material properties are included indirectly in the form of perforated structures.
Two associated questions are related to relevant quantities of interest and efficient simulation techniques, respectively. In numerical simulations. measuring energy is natural since the related convergence analysis of the finite element method is well understood. Similar results for displacements are not available, and for the high-order methods it is known that related convergence is oscillatory and not monotonic. Here, the interest lies in whether the most energetic responses and maximal displacements are strongly correlated or not. Even for dimensionally reduced shell models, computational costs can be very high, especially if the domain is complicated, which is certainly the case for perforated structures. Low-rank approximations are one candidate to alleviate this issue, and the numerical evidence presented here supports this.
The results obtained here show that local concentrated loads can lead to global effect or practical resonance via boundary layer superposition in frequency response. Indeed, the most energetic responses correlate strongly with maximal displacements if the kinematical constraints are strong; in other words, the shell is fully clamped. This correlation is weakened somewhat if some of the constraints are weakened. The effect of the shell models also plays an important role. In problems addressing thin structures, it is necessary for engineers to have sufficient understanding of the assumptions underlying the designs of different models. Different levels of geometry approximation may lead to qualitatively different solutions as is shown in the numerical experiments.
Finally, the sensitivity of shells, as defined above, also has an effect in frequency response. In sensitive configurations, the presence of regions with elliptic curvature leads to strong oscillations at lower frequencies. The amplitudes of these oscillations decay as the frequencies increase. This is in agreement with theoretical predictions [4,10].
1.2. Brief Review of Literature
The first two papers considering pressure loading were by Pitkäranta and Sanchez-Palencia [10], and the fist papers including symmetric point loads were by Bathe et al. [11]. In eigenproblems, sensitivity was first discussed in [12] and later comprehensively in [13].
Imperfections, either material or geometric, are important in the context of shell structures [14]. One of the numerical sources of imperfections is the description of shell geometry. Isogeometric methods rely on exact description of the shell surface [15]. Here, the exact geometry description is achieved via a special variant of the Naghdi model [16] for shells of revolution due to Malinen [17]. The Koiter model used by Sanchez-Palencia in his analysis requires finite elements [4].
For parameter-dependent problems, purely numerical sources of error such as numerical locking have to be taken into account. The pragmatic definition of numerical locking is to take it as the loss of the optimal convergence rate [18,19]. There are, broadly speaking, two standard approaches to alleviate the possible locking—either one modifies the variational formulation [20] or relies on high-order finite elements, i.e., the -version of the FEM [21,22] and adaptivity. Here, the latter approach is adopted. Adaptivity was also used by Sanchez-Palencia [4]. One further option is to use well-tuned low-order elements [23,24].
One way to alleviate the problems related to complicated perforated computational domains is to homogenise the materials. For recent work on simple strategy in eigenproblems, see [6].
For applications of frequency response analysis in topology optimisation, see, for instance, works with focus on sensitivity analysis [25], materials [26], time domain [27], maximal response minimisation [28], and damping material design [29].
1.3. Structure of Discussion
The rest of the paper is structured as follows: In Section 2, the thin shell problem setting is set including the perforation patterns. Frequency response and especially the low-rank variant used here is outlined in Section 3. The boundary layer structure of the standard geometry types as well as the propagation of singularities are discussed in Section 4 before the extensive set of numerical simulations examined in Section 5. Finally, conclusions are drawn in Section 6.
2. Preliminaries on Shells
In this section, the properties of thin shell structures are reviewed. In addition to shell geometry and the variational formulation necessary for the finite element method, the shell specific concept of sensitivity is briefly introduced.
2.1. Shell Geometries
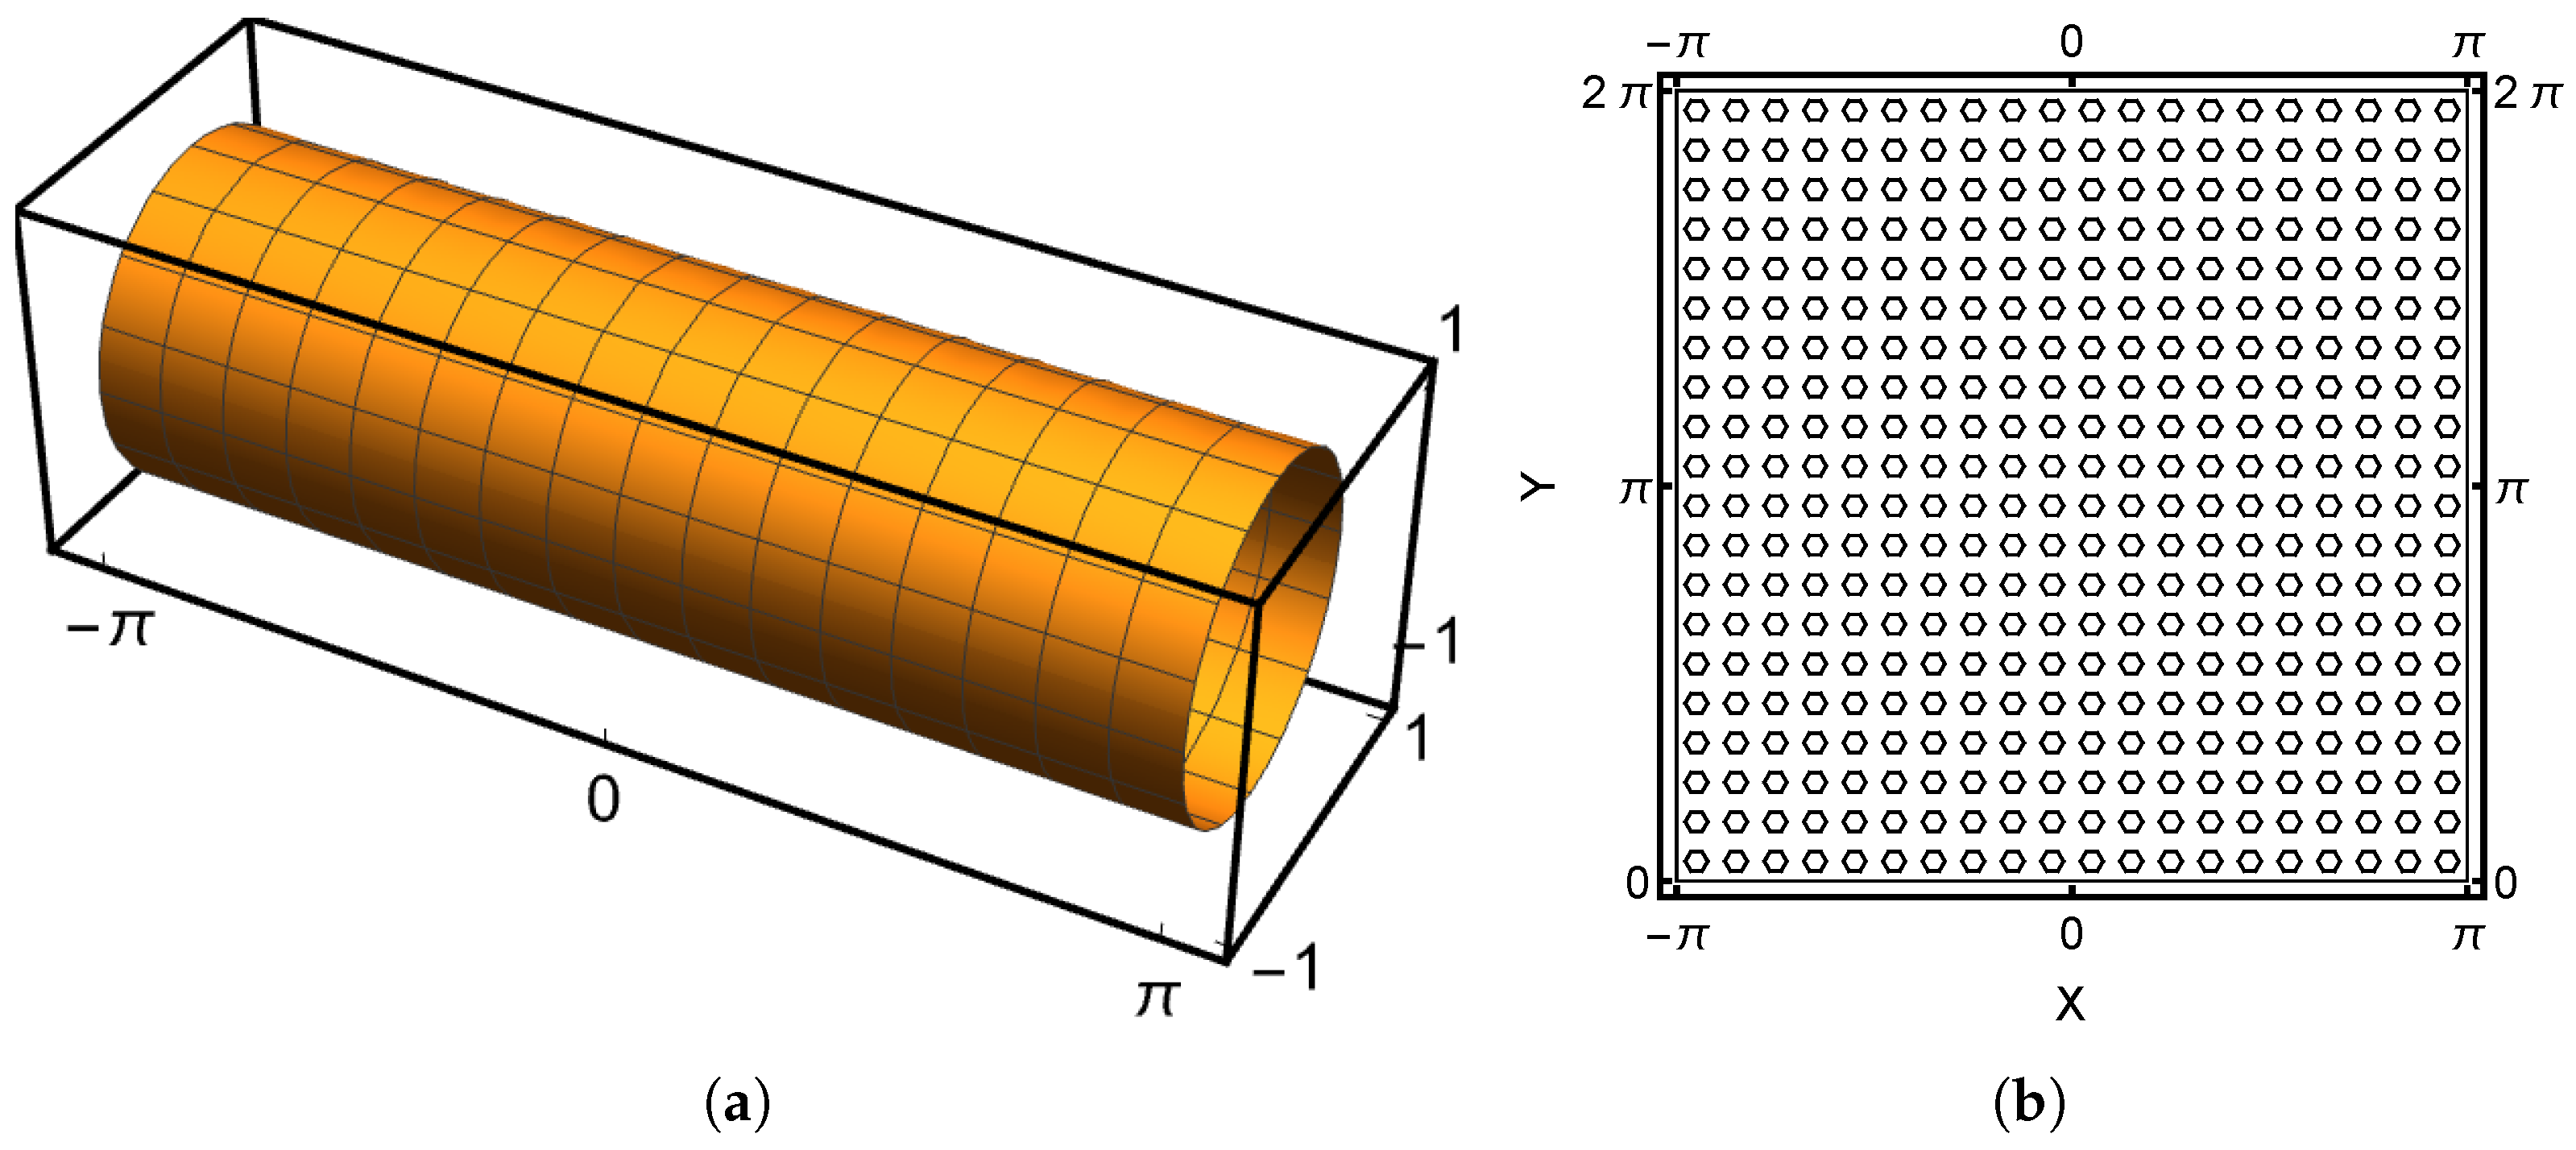
There are many ways to define a shell of revolution. Consider an axis of revolution, the x-axis in the sequel, and some profile function defined over an interval . The profile function induces the type of Gaussian curvature (see, for instance, [30]) of the shell surface. This classification follows directly from the second derivatives of the profile function. The analysis of shell problems is based on the assumption that the type of shell curvature is uniform. If this condition does not hold universally, the classification remains meaningful locally. An example of a parabolic shell with the associated 2D computational domain is given in Figure 2.
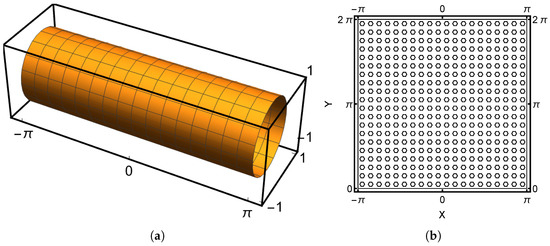
Figure 2.
Reference configurations. (a) Parabolic shell of revolution. (b) Perforated computational domain. Boundaries at and are periodic. Clamped case: All displacements are inhibited at . Sensitive case: All displacements are inhibited at only. Regular grid with all holes free where the hole coverage percentage is 25%.
For all the following characterisation is widely applied: If , , or , then the shell is said to be parabolic, elliptic, or hyperbolic, respectively.
2.2. Perforations
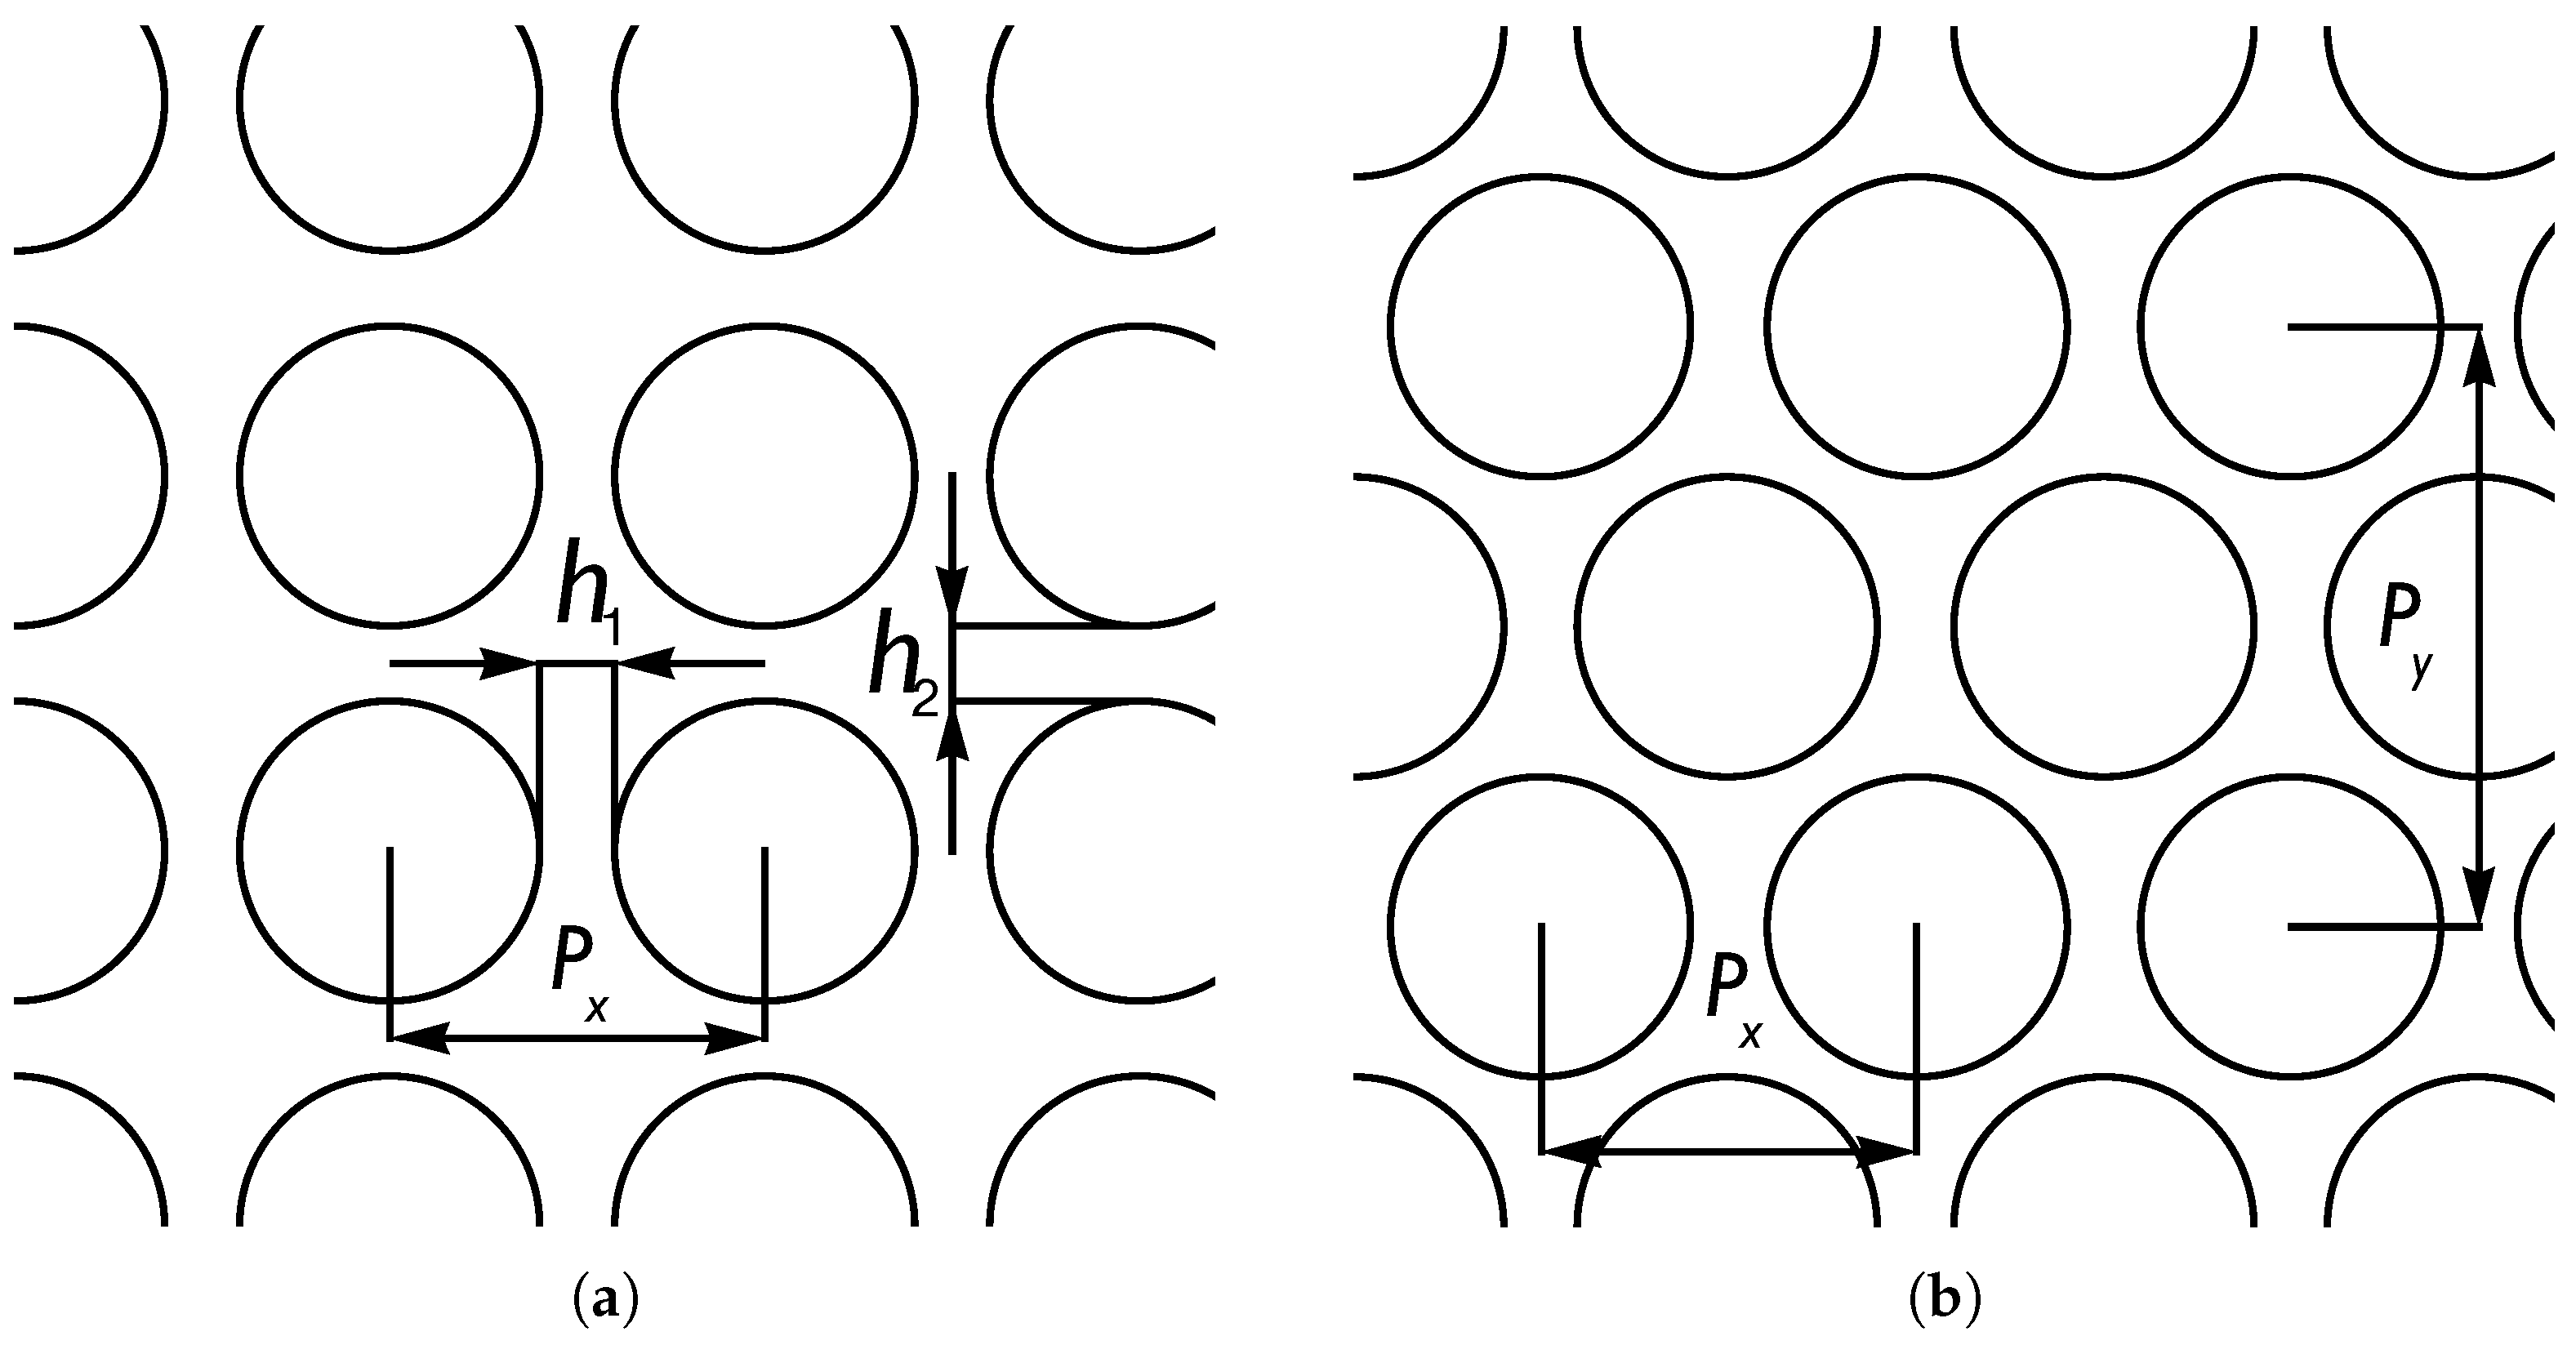
Perforated domains are characterised by the penetration patterns which in turn depend on the underlying manufacturing processes and the related hole coverage, typically given as a percentage; see Figure 2.
The ligament efficiency is the quantity used to characterise perforated sheets of metal. Assuming that the holes are ellipses with a, b as the horizontal and perpendicular semiaxis, and the separation of the centres is and , respectively, one can define horizontal and perpendicular ligament efficiency, denoting them , , respectively; see [31,32,33] for the original definitions. For regular arrays of holes,
and for triangular arrays, allowing for alternating layers,
For circular holes, radius , of course, and further, if the pattern is regular, . Both pattern types are illustrated in Figure 3. Notice that the triangular pattern in the figure has a tighter packing than that implied by Equation (2).
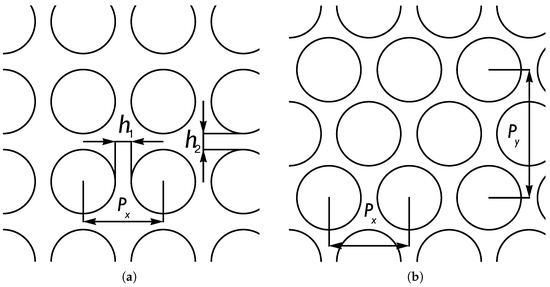
Figure 3.
Penetration patterns: (a) Regular pattern. (b) Triangular pattern.
2.3. Shell Models
Every shell is considered to be a three-dimensional body for which the 3D theory of linear elasticity could be considered exact for small deformations. The approach taken here is that the shell problem is defined on the mid-surface of the 3D body under the assumption that the thickness d is constant. Such models are often reasonably accurate for thin shells [34]. The model considered here is named after Naghdi. The displacement field has five components: the tangential displacements u, v, the transverse deflection w, and the dimensionless rotations , . The shell is further assumed to consist of homogeneous isotropic material with Young modulus E and Poisson ratio . The total energy of the shell is expressed as
where is a scaling factor (see, for instance, [35]), q is the external load potential, and and represent membrane and transverse shear and bending deformations, respectively. For source problems, the resulting linear system is , where is the stiffness matrix and b in the fully integrated load potential.
and are quadratic forms independent of d and defined as
where , , and stand for the membrane, transverse shear, and bending strains, respectively. The strain–displacement relations involve at most first derivatives of the displacement components, and are linear, of course. The principal curvature coordinates, where there are only four parameters, the radii of principal curvature , , and the so-called Lamé parameters, , , which relate coordinate changes to arc lengths, are needed to specify the curvature and the metric on . Here,
and
Using the identities above, the bending, membrane, and shear strains [17], and , respectively, have the following expressions: First, bending with strong dependence on rotations:
second, membrane with no dependence on rotations:
third, shear with a very different structure:
Remark 1.
When the shell parametrisations defined above are used, all terms of the form are identically zero.
The energy norm is defined in a natural way in terms of deformation energy:
Similarly for bending, membrane, and shear energies,
The load potential has the form It is assumed that the load acts in the transverse direction of the shell surface, i.e., . For load the variational problem has a unique weak solution and the corresponding result holds for all finite dimensional cases, in particular if the finite element method is applied.
When , the asymptotic displacement exists only if the load amplitude is correctly scaled; see Malinen and Pitkäranta for details [36].
The mass matrix is defined as , with (displacements) and (rotations) independent of d, where is the material density.
2.4. Shallow Shell Model
If the shell is shallow, that is, the midsurface differs only slightly from a plane, one can arrive at a much simpler shell model. The fundamental assumption is that the curvature tensor of the midsurface is constant. One can set , and . The classification of shell surfaces then reduces to the following: The shell is called elliptic when , parabolic when , and hyperbolic when . Then, and the relation between the strain and the displacement fields is written as
This simplified shell model is advantageous from the point of view of design of numerical experiments. The fact that the model admits shell geometries that are non-realizable—after all, the local curvature cannot be constant over the whole surface—makes it possible to isolate layer-induced features in a way that is not possible in more realistic settings. Shallow shell model is sometimes referred to as the mathematical shell model.
The Naghdi and shallow shell models differ only in and , when for the parabolic case of . The implementation of the shallow shell model is greatly simplified by the fact that every resulting system has constant coefficients.
2.5. Sensitive Shells
If the shell structure is only partially kinematically constrained, the shell becomes sensitive. In the setting here, the typical configuration is where a shell of revolution is clamped at one end but free at the other. Strictly speaking, any perforated shell with free holes is locally sensitive. Sensitivity means that small changes in the configuration can lead to large changes in response. In particular, for elliptic shells, this can be dramatic in that the fundamental assumptions of elasticity are no longer valid, and the correct interpretation of the results is meaningful only in a strictly mathematical sense.
In typical static loading problems, it has been observed that in mixed geometry configurations, the shell becomes strongly sensitive if any part of the profile function is elliptic. Interestingly, in frequency response, the elliptic part does not necessarily dominate the most energetic response.
3. Frequency Response
In this section, the linear algebra formulation of the frequency response analysis used in the simulation below is outlined. We recall the definitions of the stiffness and mass matrices in Section 2.4. The equation of motion for the system has the following form [37]:
where is the mass matrix, the viscous damping matrix, the stiffness matrix, the force vector and the displacement vector. The viscous damping matrix is not unique. Here, it is a linear combination of and . This choice is often called proportional Rayleigh damping, and its special structure is exploited in the low-rank approximation formulation used in simulations.
A steady-state solution is sought in the case of harmonic excitation. The angular frequency is , where f is the ordinary frequency. The units are and , respectively.
The force and the corresponding response have harmonic function representations as
Taking the first and second derivatives of Equation (13) and substituting using Equation (14) leads to
finally reducing to a linear system of equations:
There are many quantities of interest that can be derived from solution . The natural energy norm (here, it is mechanical energy) is a mathematically reasonable choice, even though in practice it may be difficult to measure since it depends on all components in the vector field. Maximal deflections are convenient but often lack mathematical rigour in that the presence of boundary layers makes it difficult to guarantee rates of convergence or even convergence. In the simulations below, it is observed that the maximal transverse deflection and the most energetic response are strongly correlated.
3.1. Damping Model
The Rayleigh damping model defines the viscous damping matrix as , where the parameters , , and . The choice of parameters and is typically based on experimental results and previous experience and need not stay constant for a given structural model depending on external conditions. This choice of damping (proportional damping) has a useful property: it preserves the eigenspace of the original undamped problem. Another option would be to use simple diagonal damping.
3.2. Low-Rank Approximation
The fact that the Rayleigh damping preserves the eigenspace can be exploited in searching for a suitable subspace of (small) rank r such that, for instance, (the subscript r denotes reduced matrix), and hence the solution of the reduced system,
is sufficiently close to that of the full problem.
The reduced system in Equation (17) can be set to match the first n moments of the original full-order system [38]. This is achieved by selecting a suitable Krylov subspace [39]. Using standard notation from numerical linear algebra, a Krylov basis of dimension n is denoted as
The proportional damping guarantees that the construction is valid for any choice of and . This dimension reduction has proven to be remarkably efficient. In shell problems, the practical .
4. Layers
Each shell geometry type possesses a distinctive set of layer deformations. It is useful to define the concept of boundary layer generators first.
Definition 1
(Layer Generator). The subset of the domain from which the boundary layer decays exponentially is called the layer generator. Formally, the layer generator is of measure zero.
Pitkäranta, Matache, and Schwab [34] is the basic reference for layers with non-curved generators. The layer generators are geometric entities and thus independent of the length scale of the problem under consideration. In perforated structures, the layer structure is rich due to every hole being a natural layer generator. Even if the domain is perforated, the characteristics of the shell surface can still act as layer generators.
Classically, the layer structure is derived from the exponential solution to the homogeneous Euler equations of the shell problem. Using the Ansatz, one can show that solutions with such that the characteristic lengths are of the form where . Here, k is the wave number of the Fourier mode, and are locally rotated coordinates such that s is the coordinate orthogonal to the layer generator and r the one along the generator. The layers with and are present only in hyperbolic and parabolic geometries, respectively. The layer with is present in all geometries. The case , i.e., the shortest one, arises from a shear deformation and can be captured by the Naghdi type shell models such as the shallow shell formulation, if necessary.
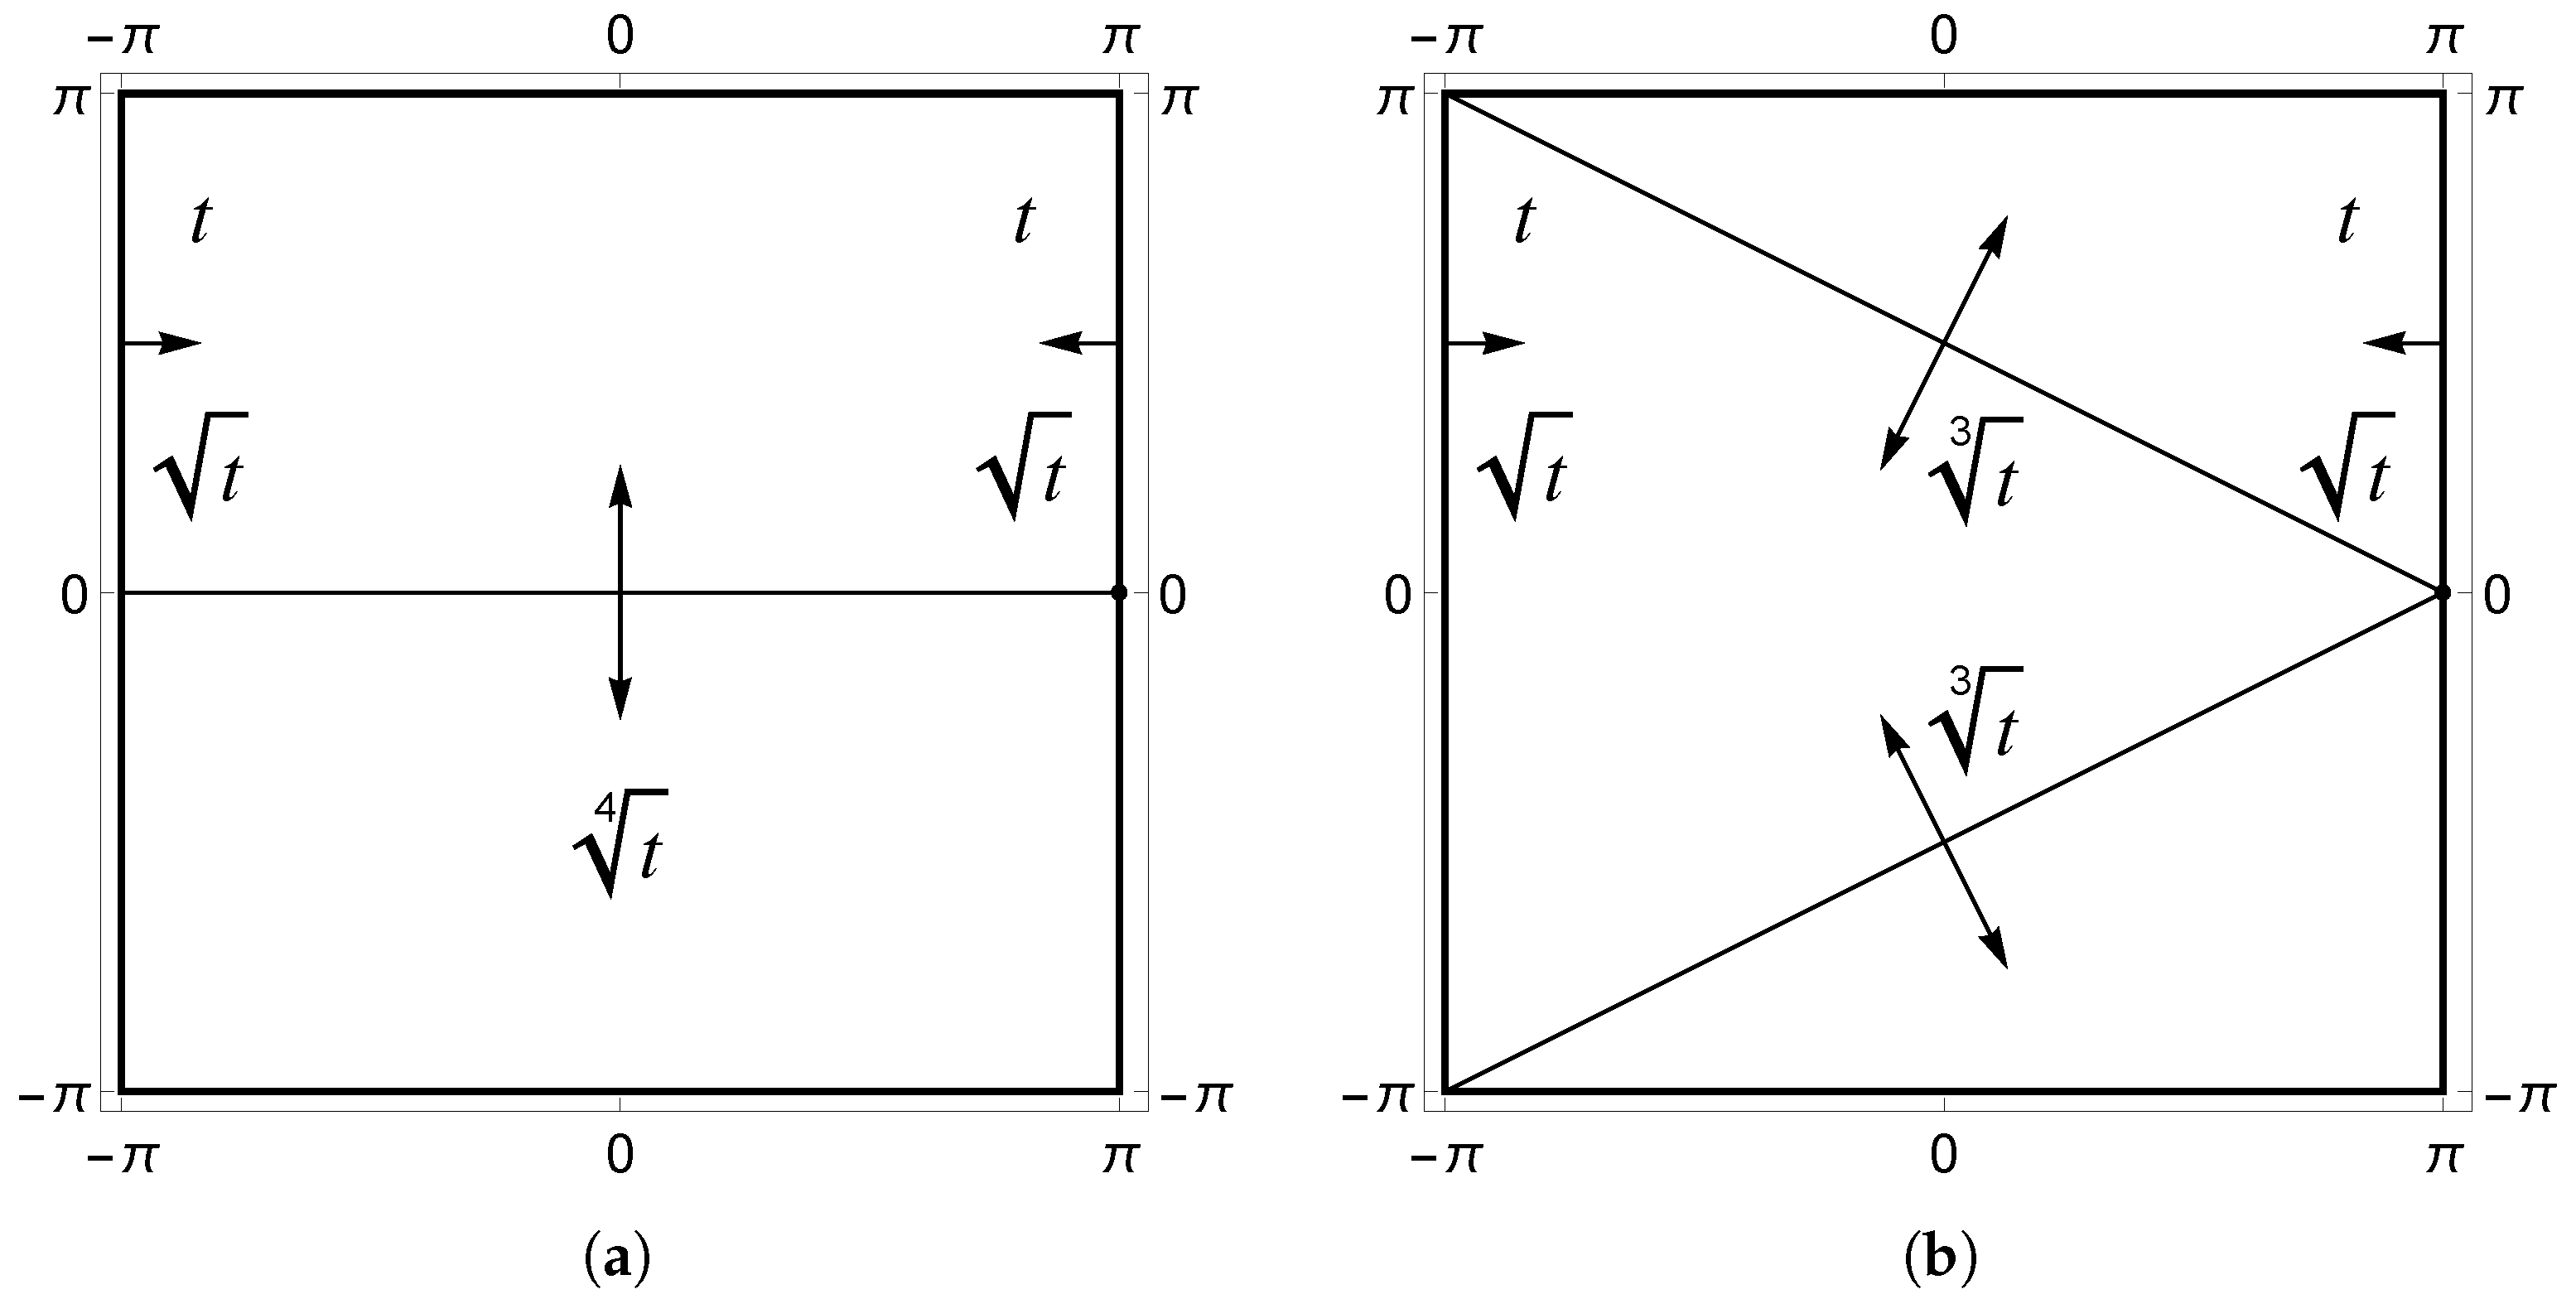
In simulations, thickness d is replaced by dimensionless thickness , where R is, for instance, the radius of the shell. The exact predicted scales are given in Table 1 and visualised in Figure 4. For shells with non-uniform curvature type, different layers are possible depending on the local curvature type.

Table 1.
Characteristic length scales as functions of the dimensionless thickness.
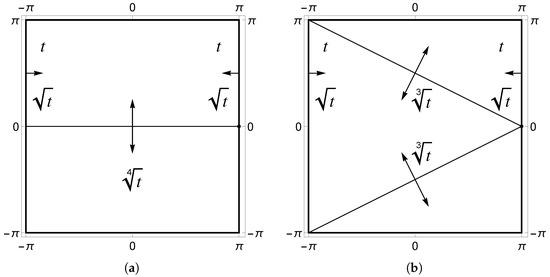
Figure 4.
Layer charts for different geometries. (a) Parabolic. (b) Hyperbolic. The arrows indicate the direction in which the width of the layer varies.
Propagation of Singularities
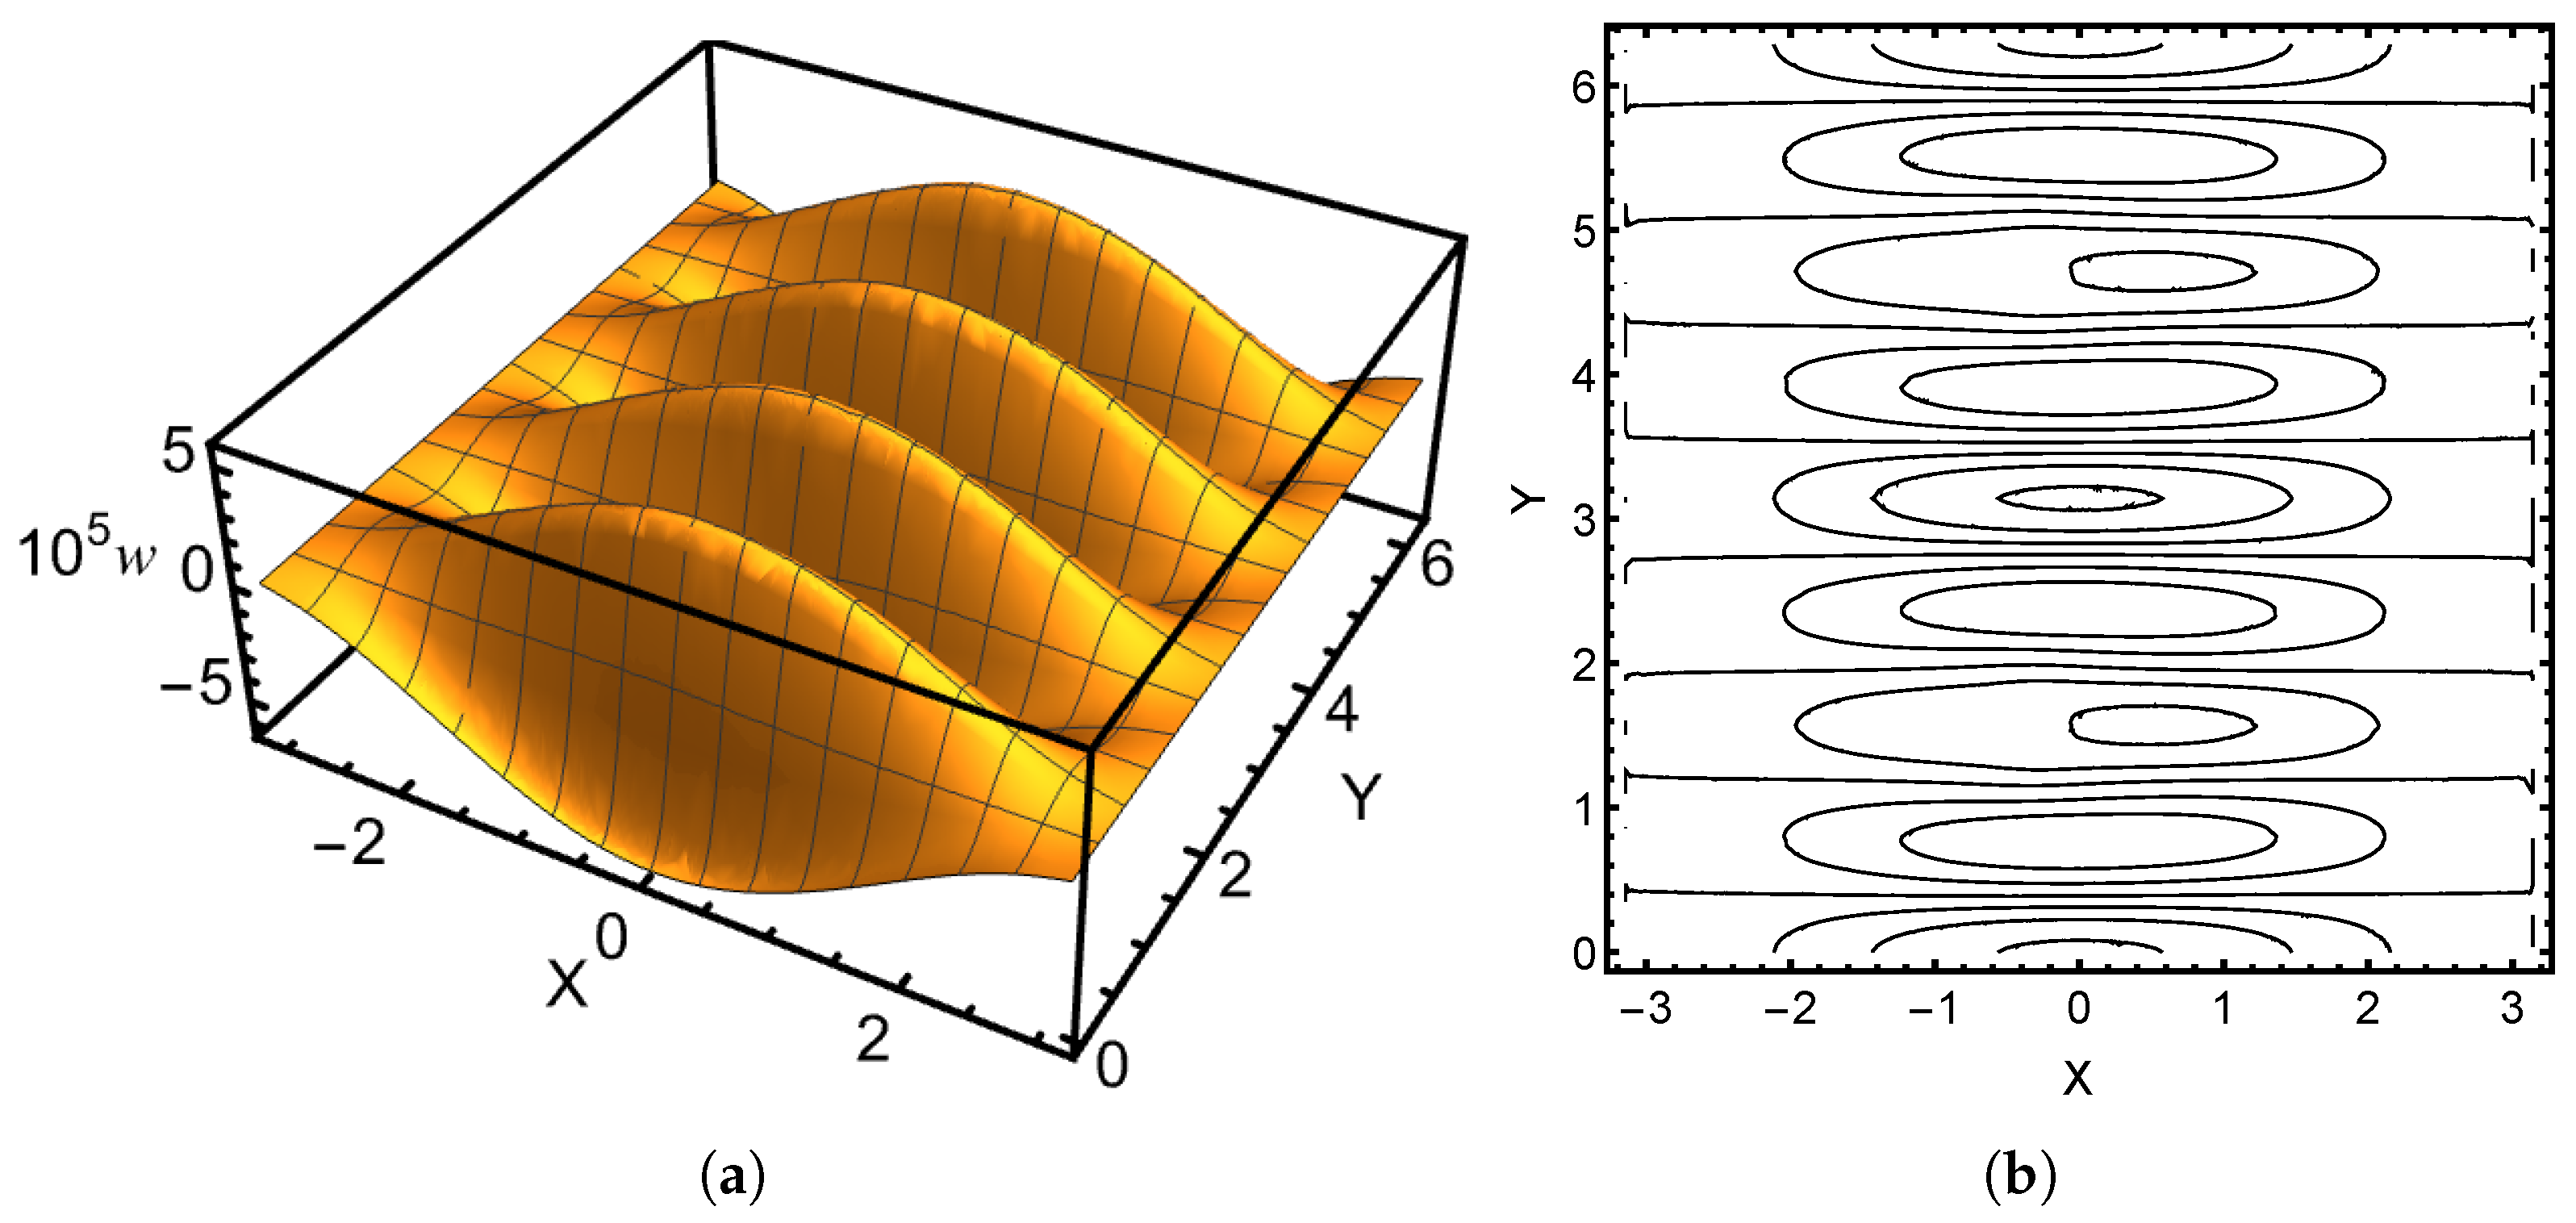
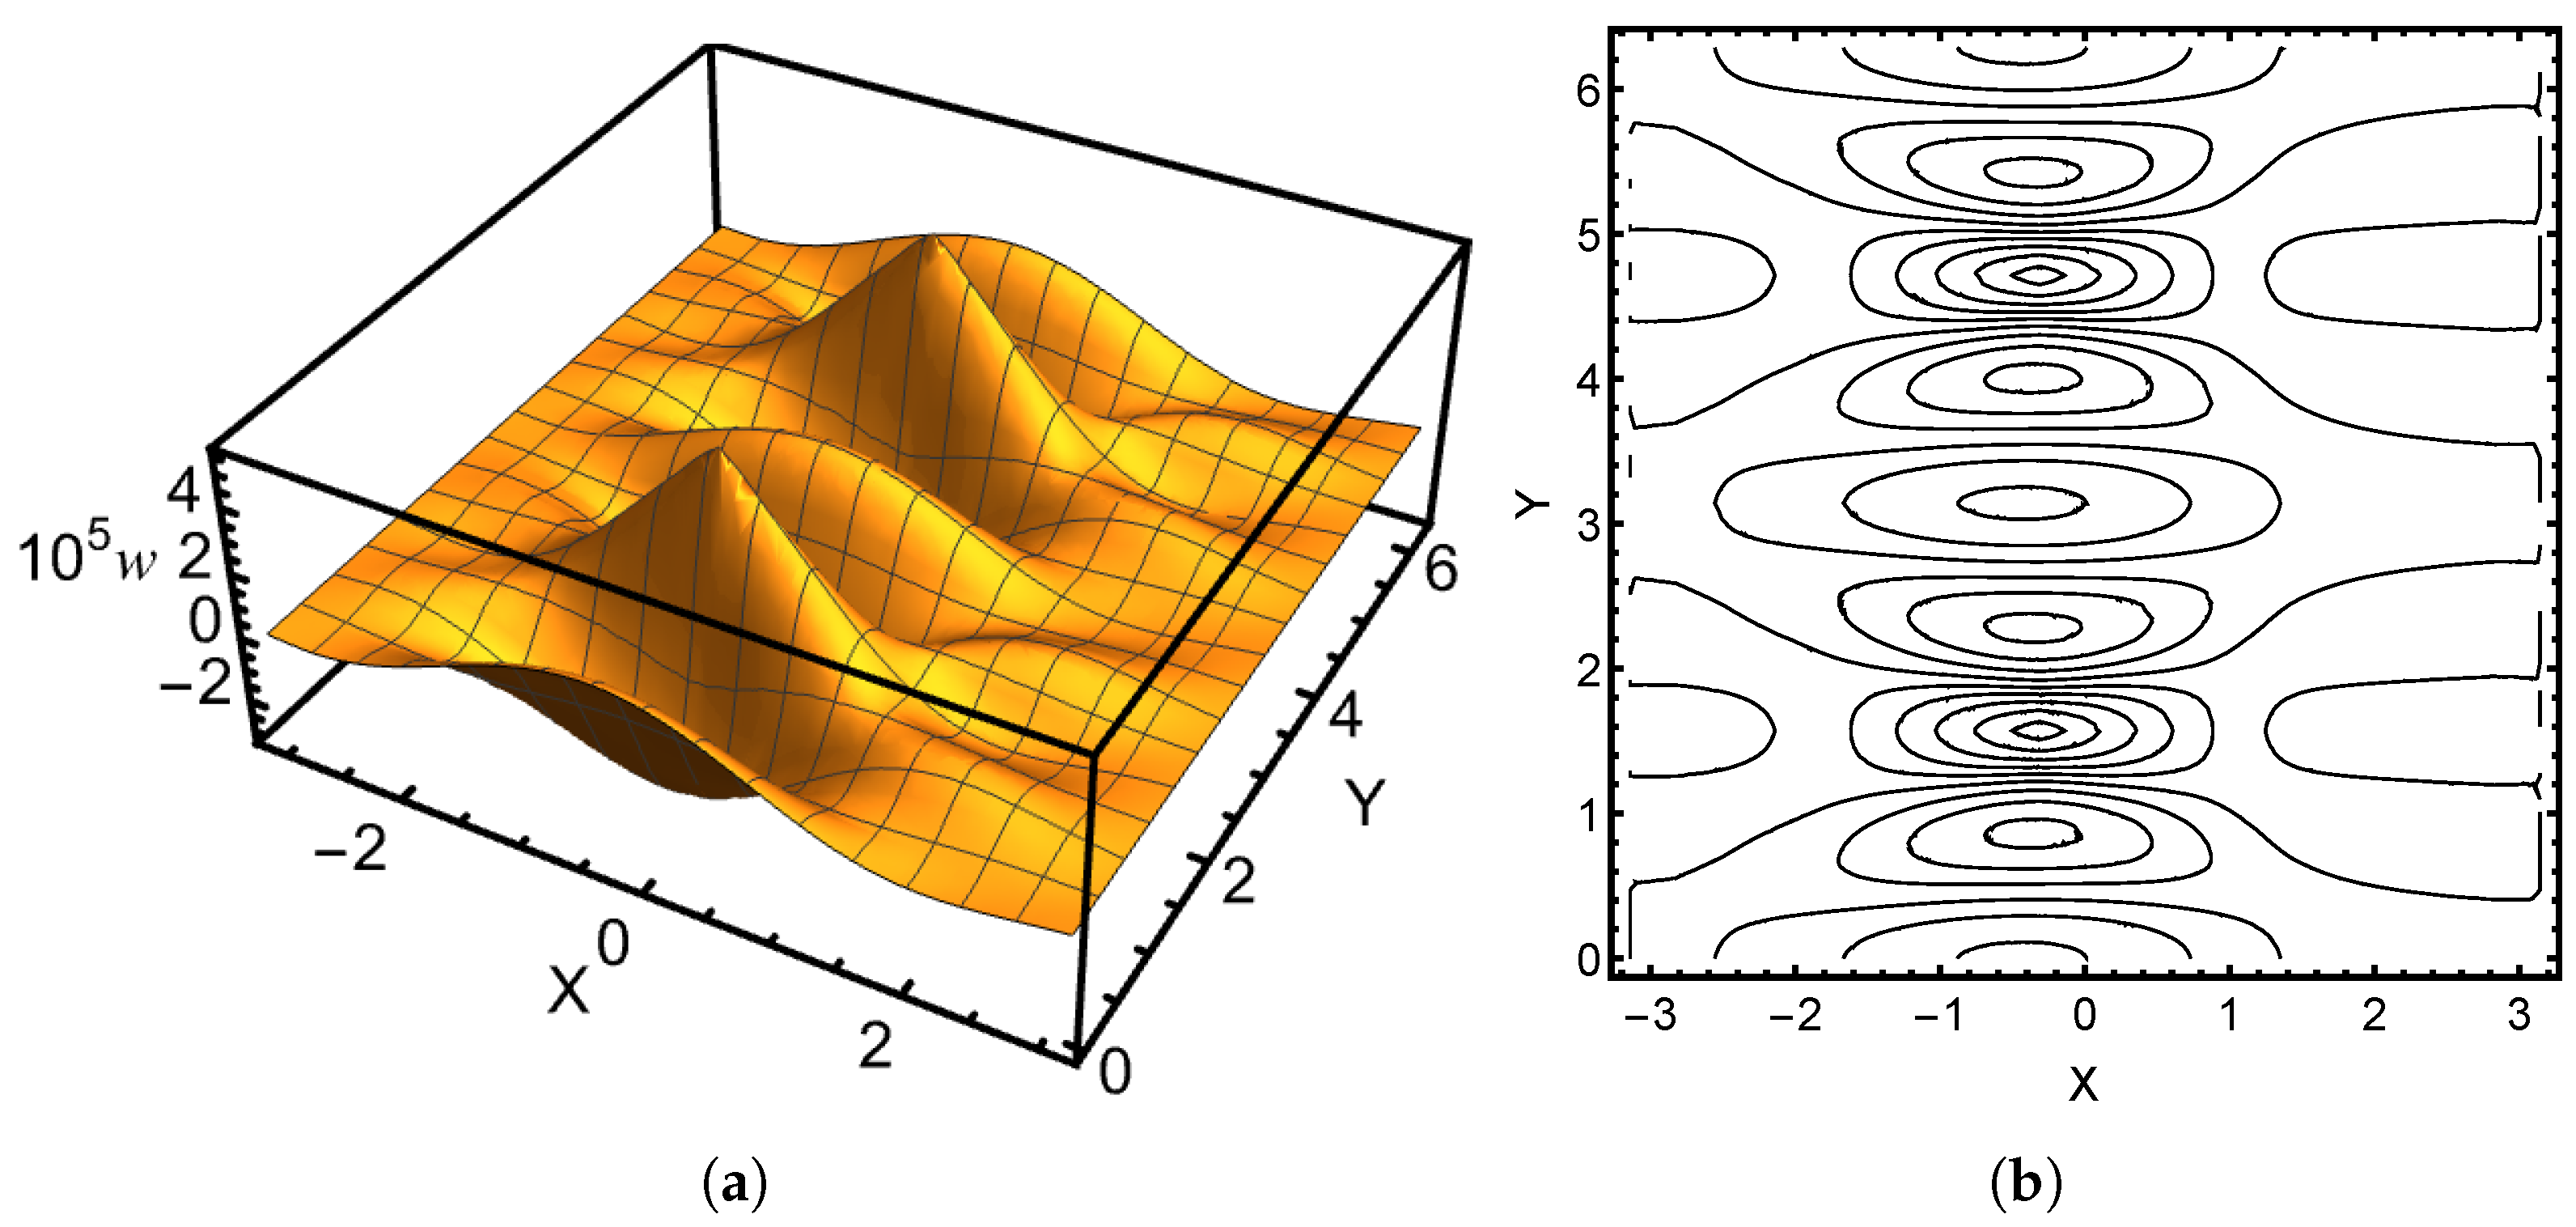
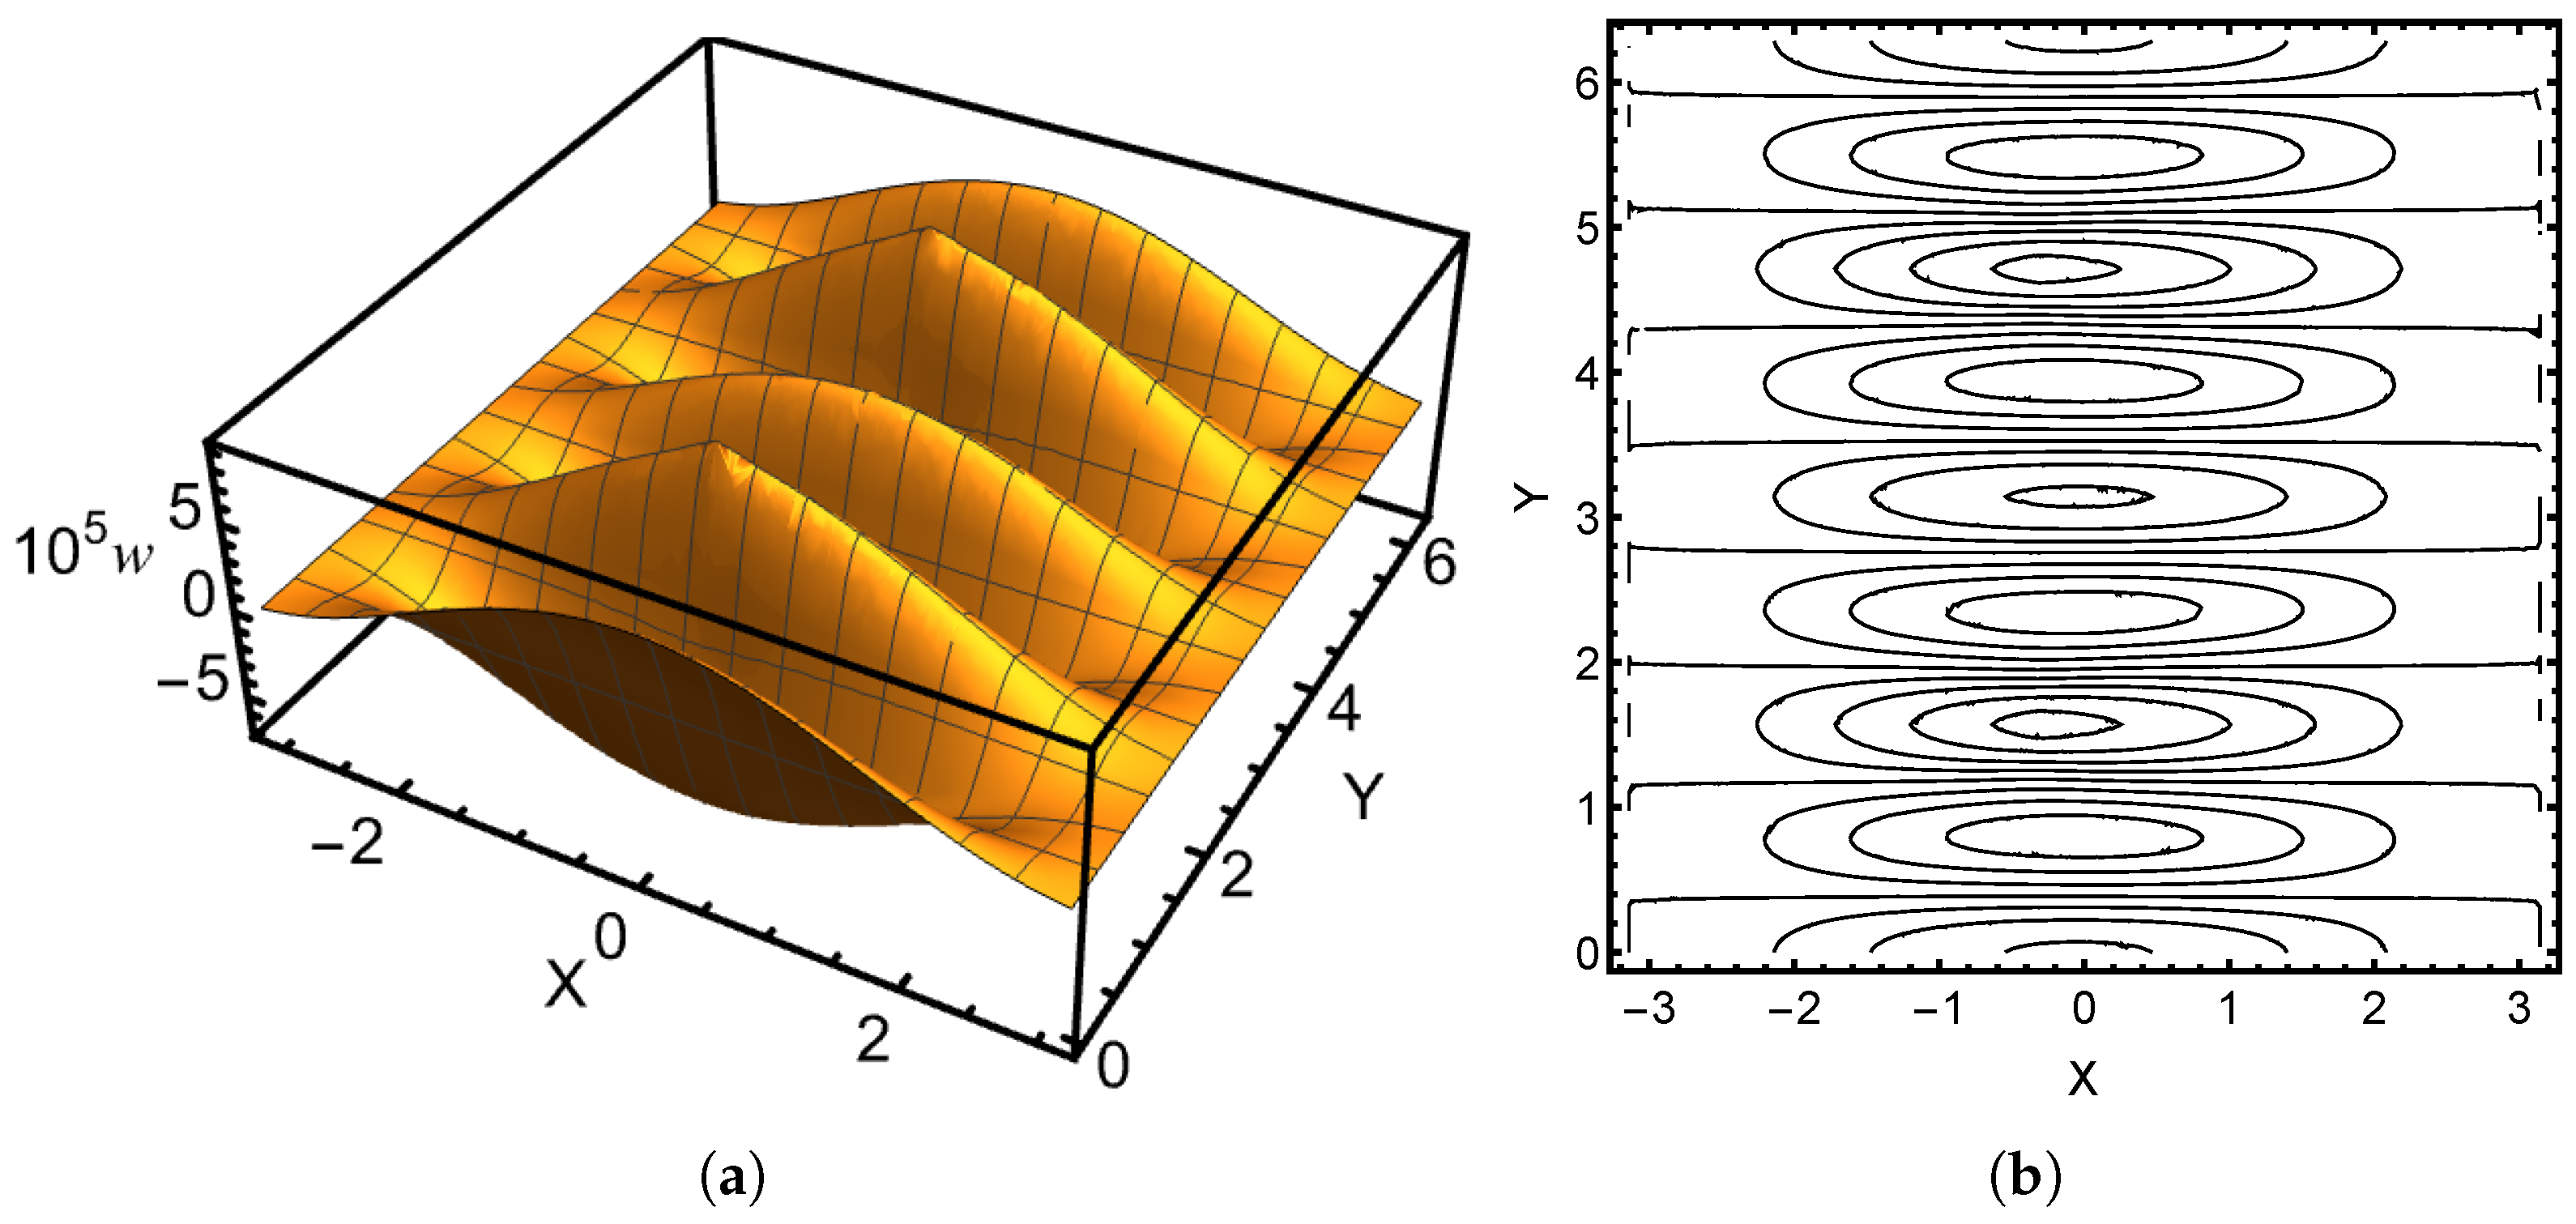
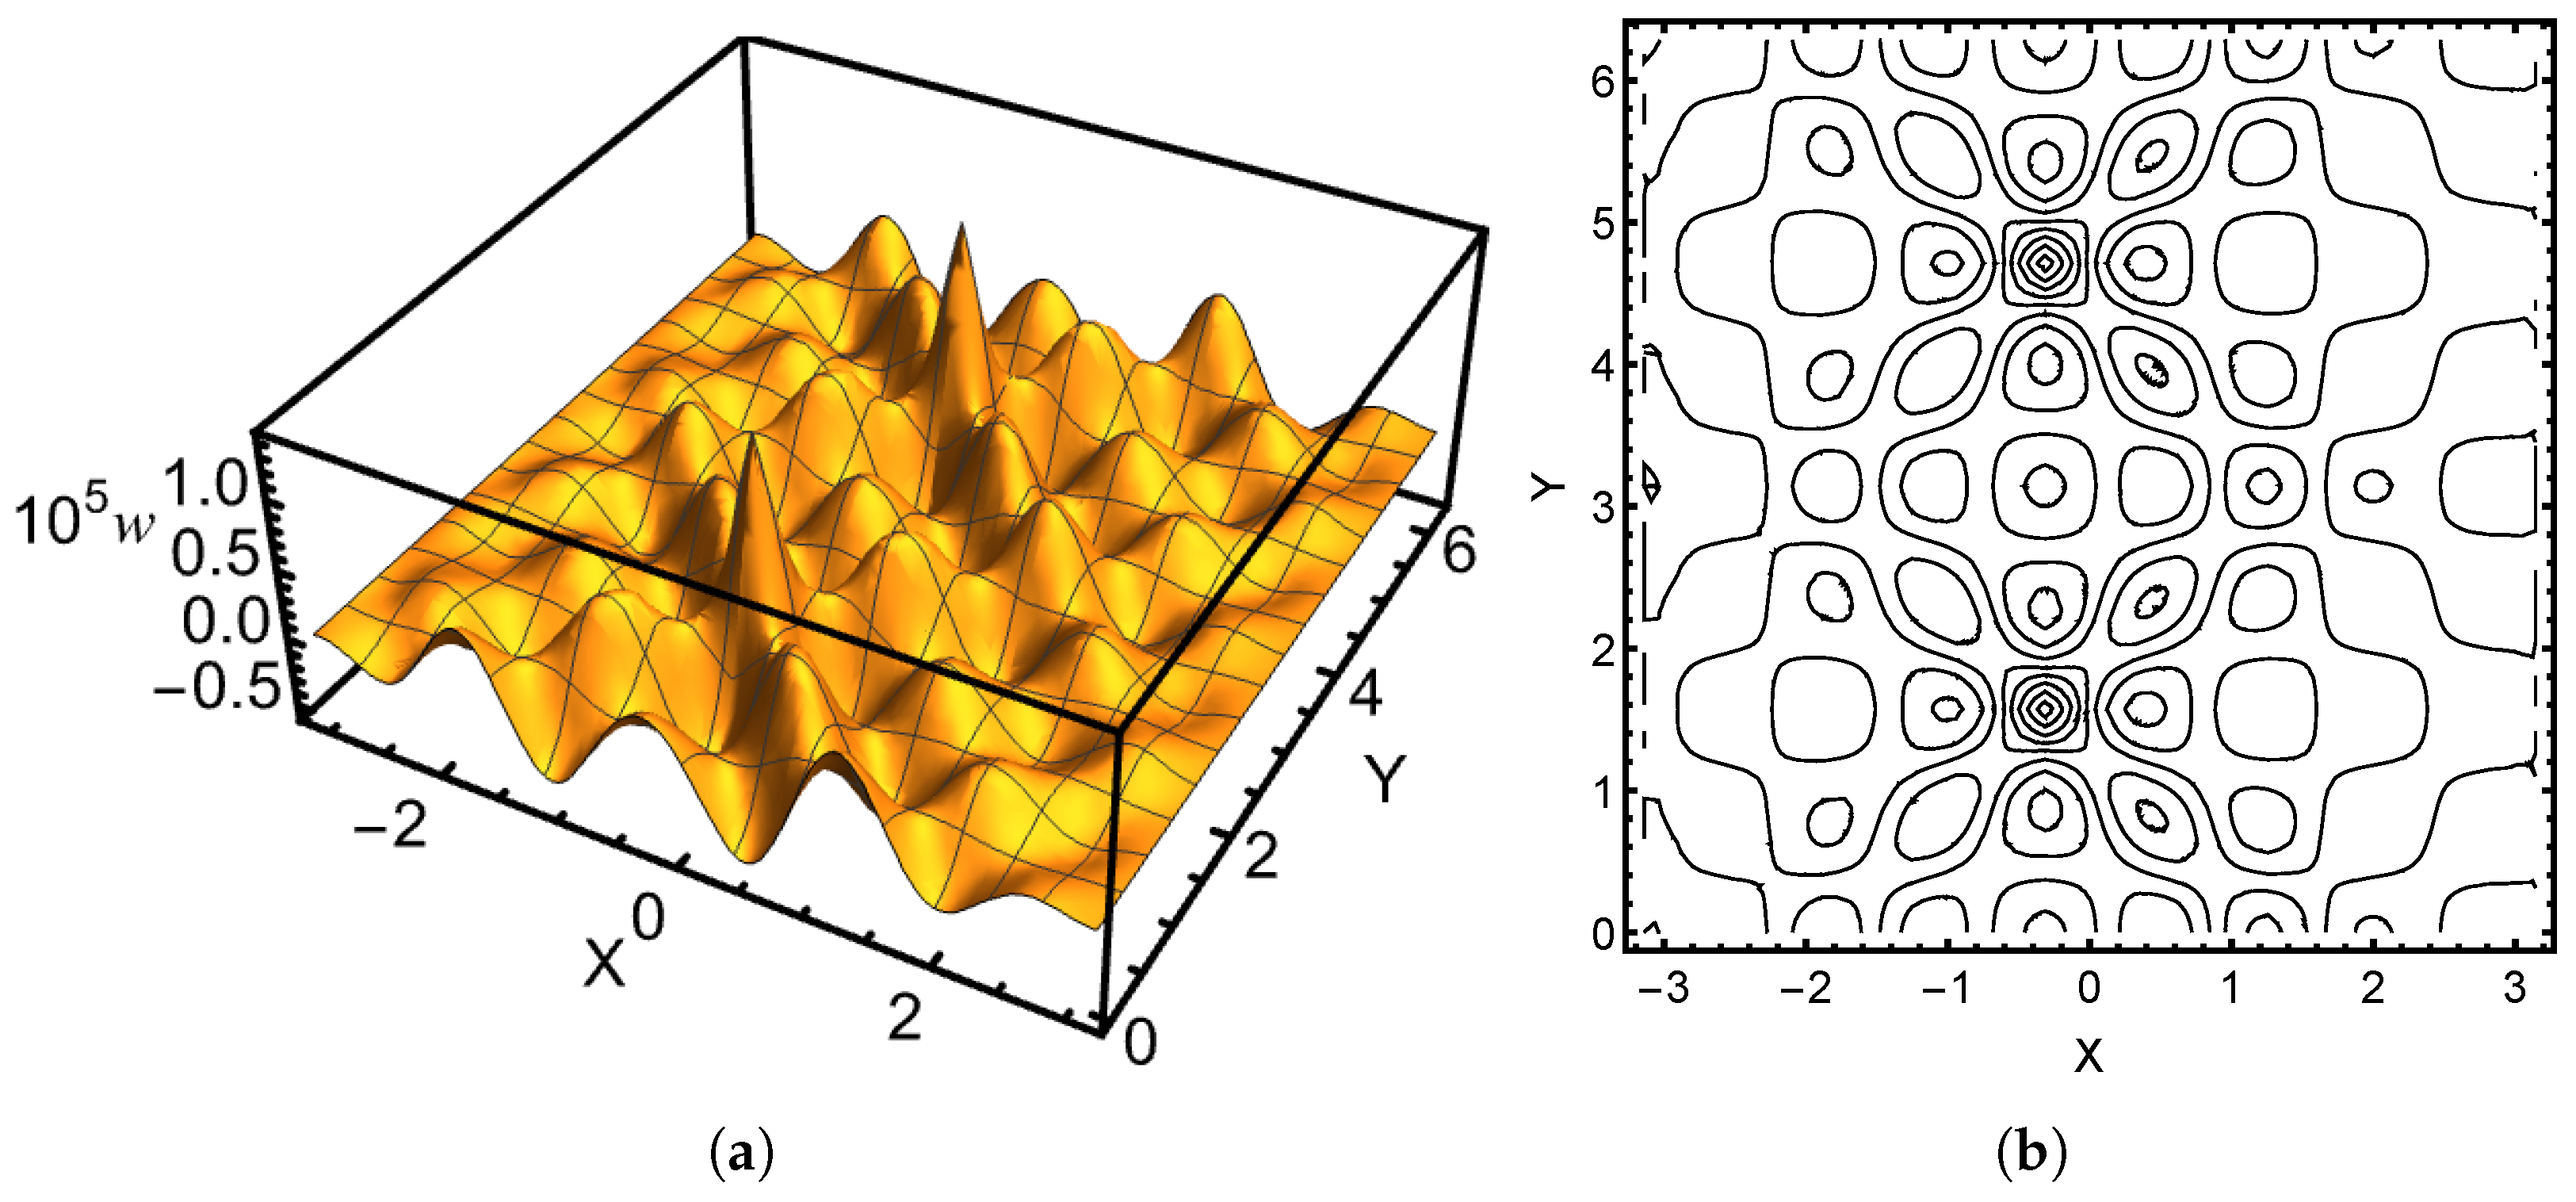
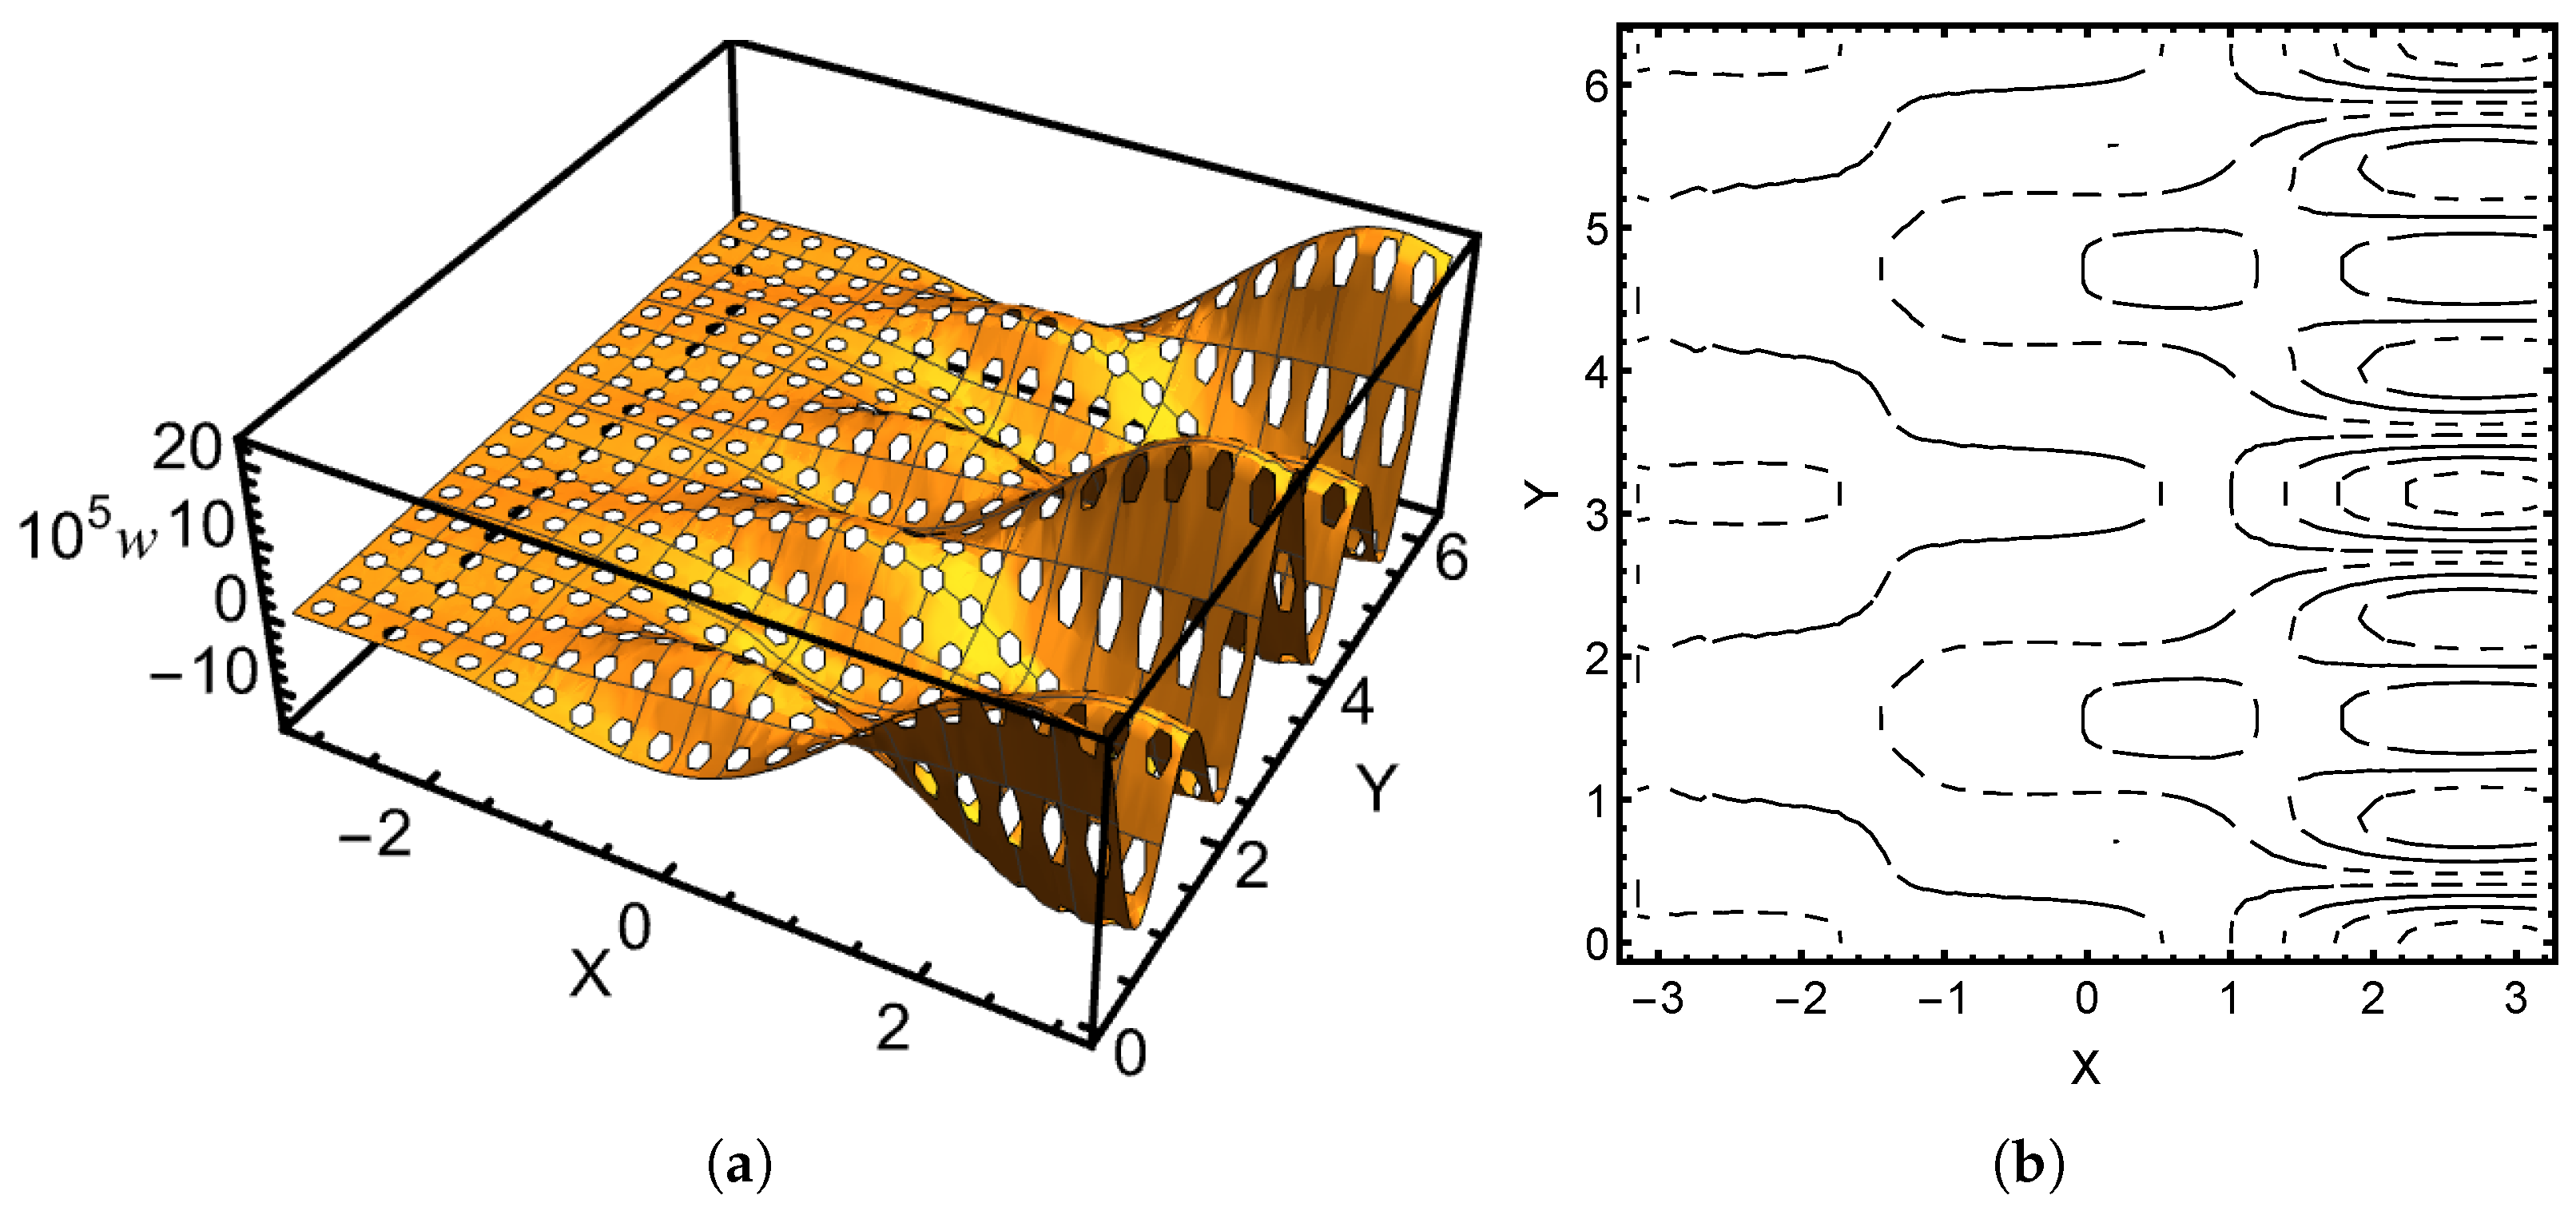
It is one of the unique properties of thin shells that singularities such as those induced by concentrated loads are propagated along the characteristics of the surfaces. This is also present in frequency response problems. In Figure 5 and Figure 6, two responses are shown with surface and contour plots. In the hyperbolic case, the characteristic line curves will be normal to the boundary (in the limit sense).
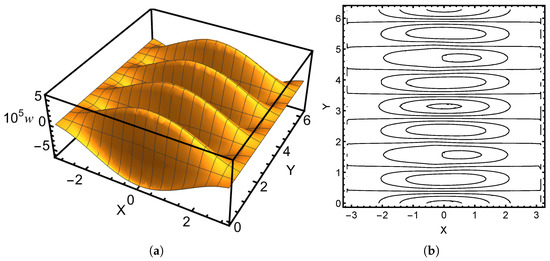
Figure 5.
Most energetic response: Parabolic (Naghdi). (a) Surface. (b) Contours. Clamped case, symmetric point load at .
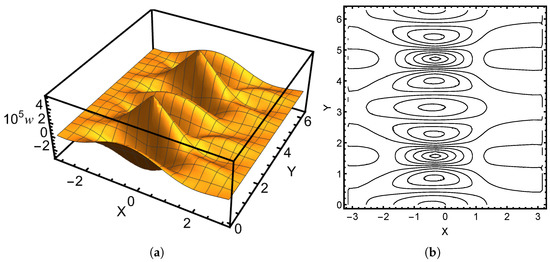
Figure 6.
Most energetic response: Hyperbolic (Naghdi). (a) Surface. (b) Contours. Clamped case, symmetric point load at .
5. Numerical Simulations
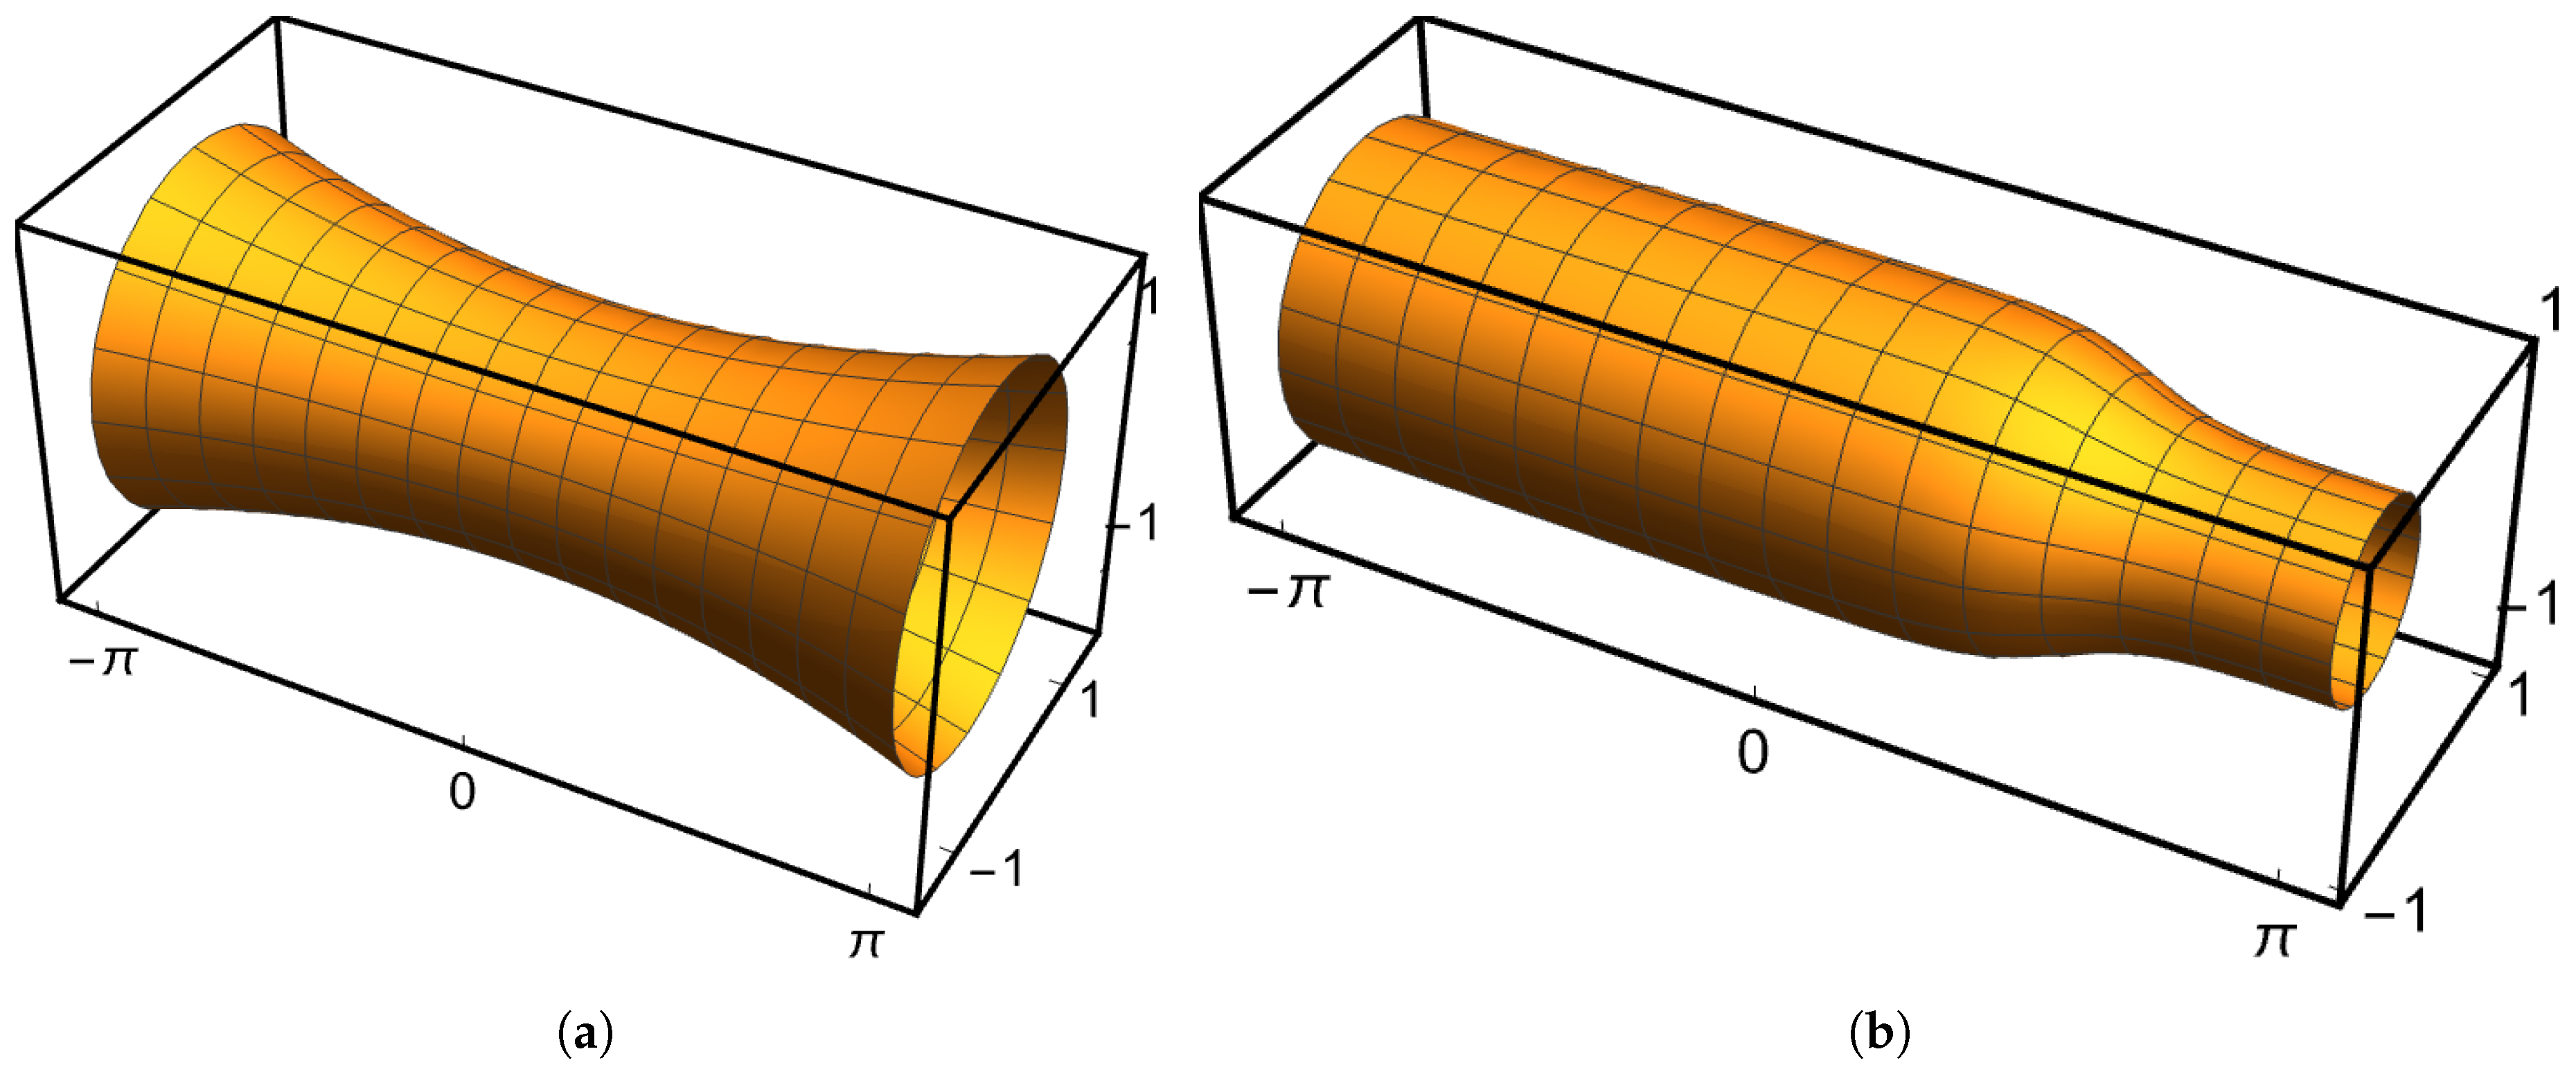
Numerical simulations cover different geometry types and shell models where applicable while keeping the dimensionless thickness constant, (see Figure 2 and Figure 7, and Table 2). In all cases, the material parameters are the same: , , and , unless otherwise specified. For damping, the selected weights are simply , and (see also [8,9]). The loading is a symmetric concentrated load (in ),
where point is where the load acts, i.e., is concentrated, and C is a scaling parameter. In the following, , , and . All cases were computed using the low-rank approximation with rank . This choice is based on calibration with full analysis. In [9], where only constant coefficient cases were considered, was sufficient.
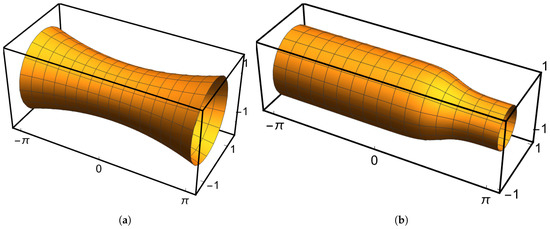
Figure 7.
Reference configurations. (a) Hyperbolic shell of revolution. (b) Shell of revolution with nonuniform curvature type.

Table 2.
Simulation configuration data. Computational domain .
In all cases, so that the 2D computational domain is . For the perforated domain, the perforation pattern is with a high hole coverage 25%. The p-version of the finite element method is used with uniform which is sufficient to prevent numerical locking effects dominating the solution. Every case includes four parts: perforated and non-perforated configurations, each with clamped and sensitive boundary conditions. Parabolic and hyperbolic cases include additional shallow shell configurations. The selected frequency range is at 5 intervals. The observed angular frequencies of the most energetic response and the correlation between energies and transverse displacements are given in Table 3.

Table 3.
Simulation results. Observed angular frequency of the most energetic response and the correlation between energies and transverse displacements.
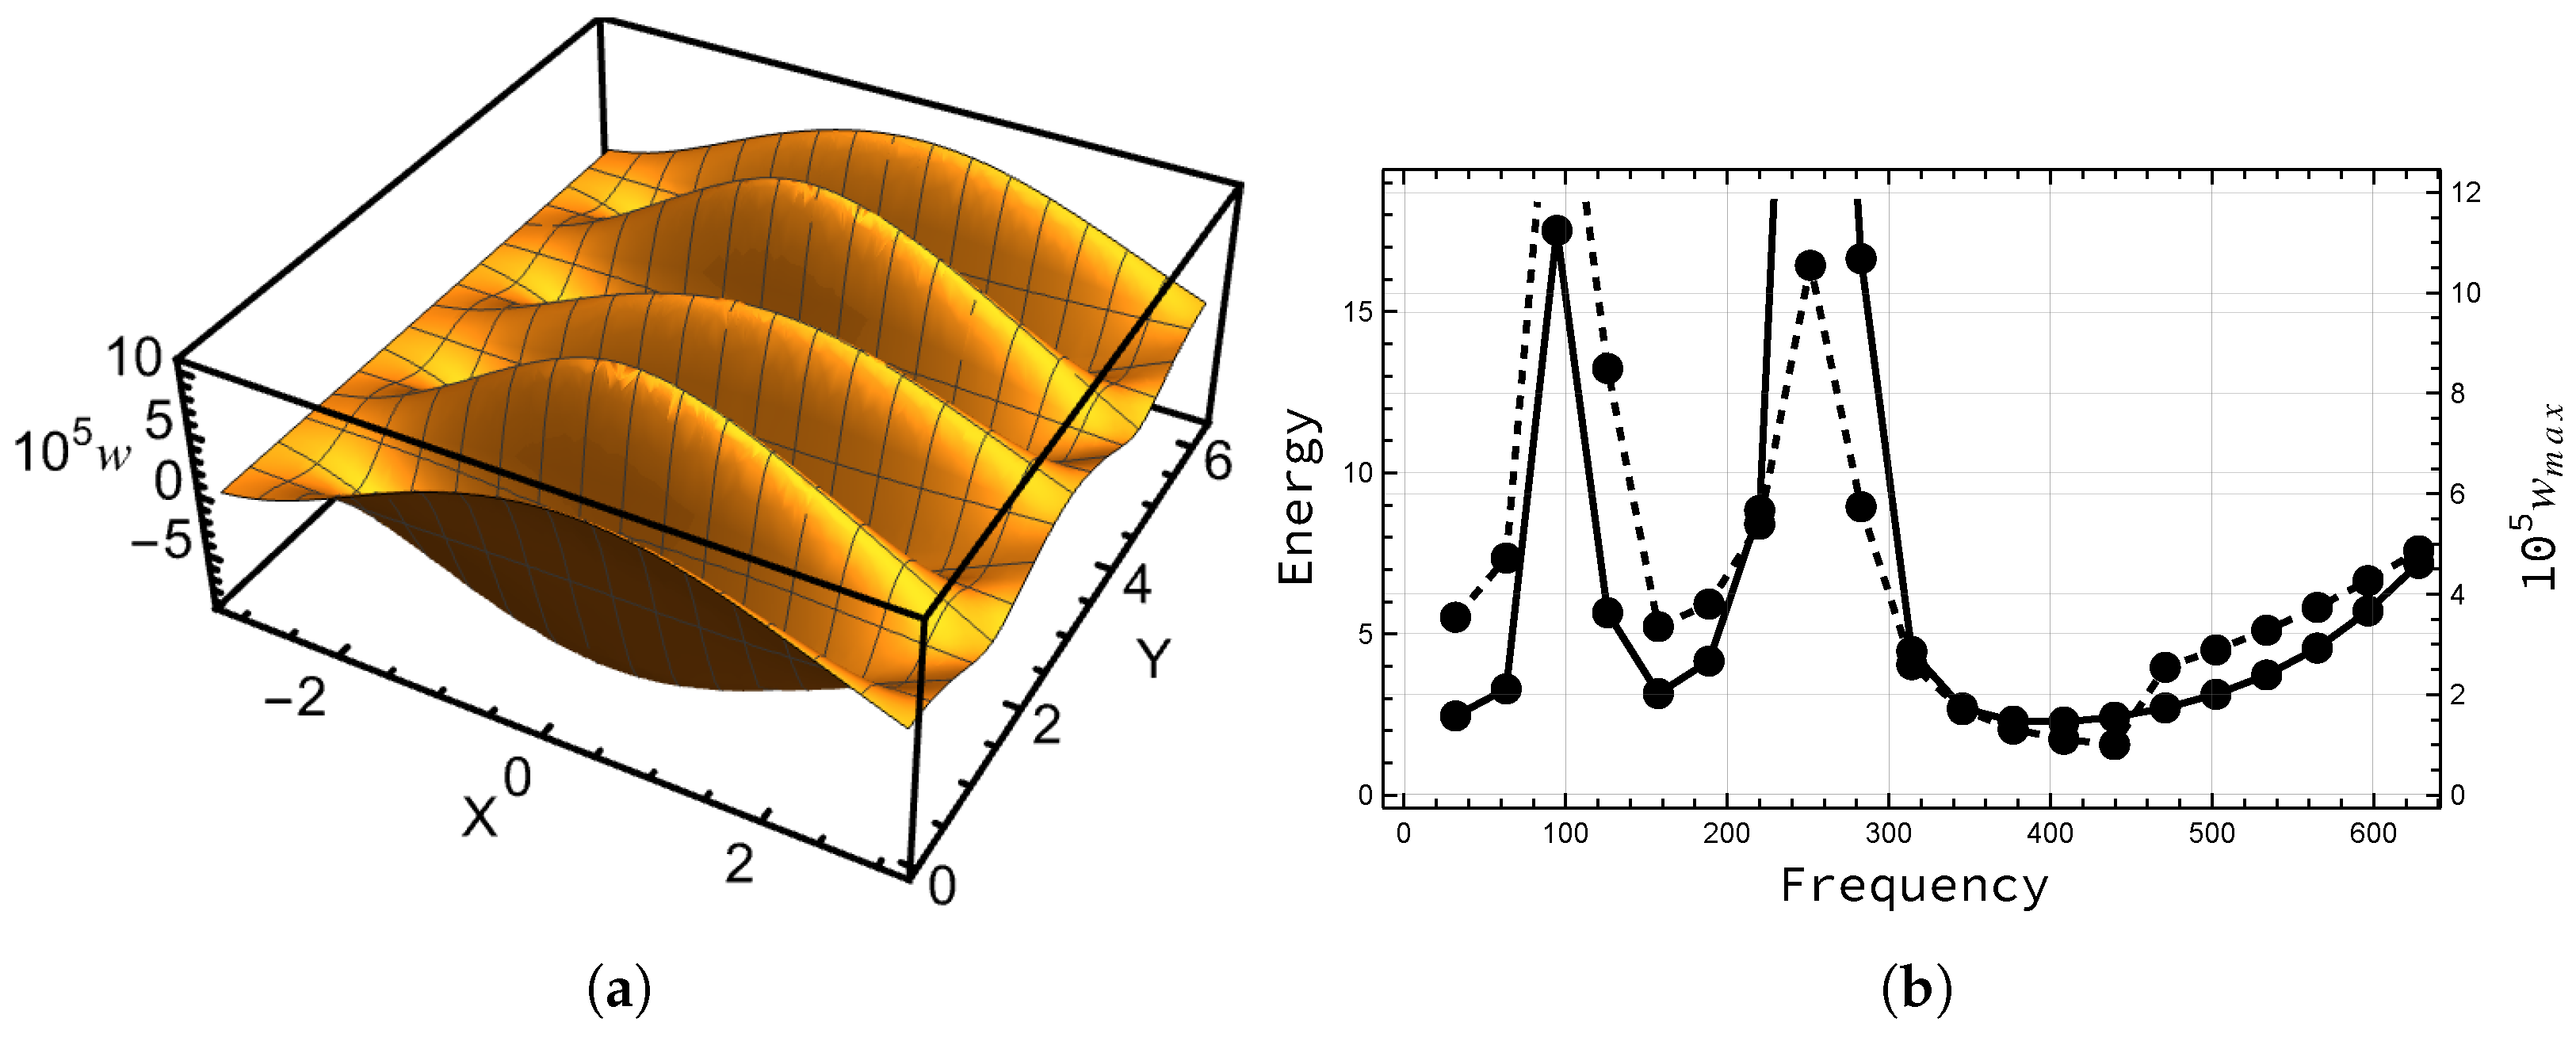
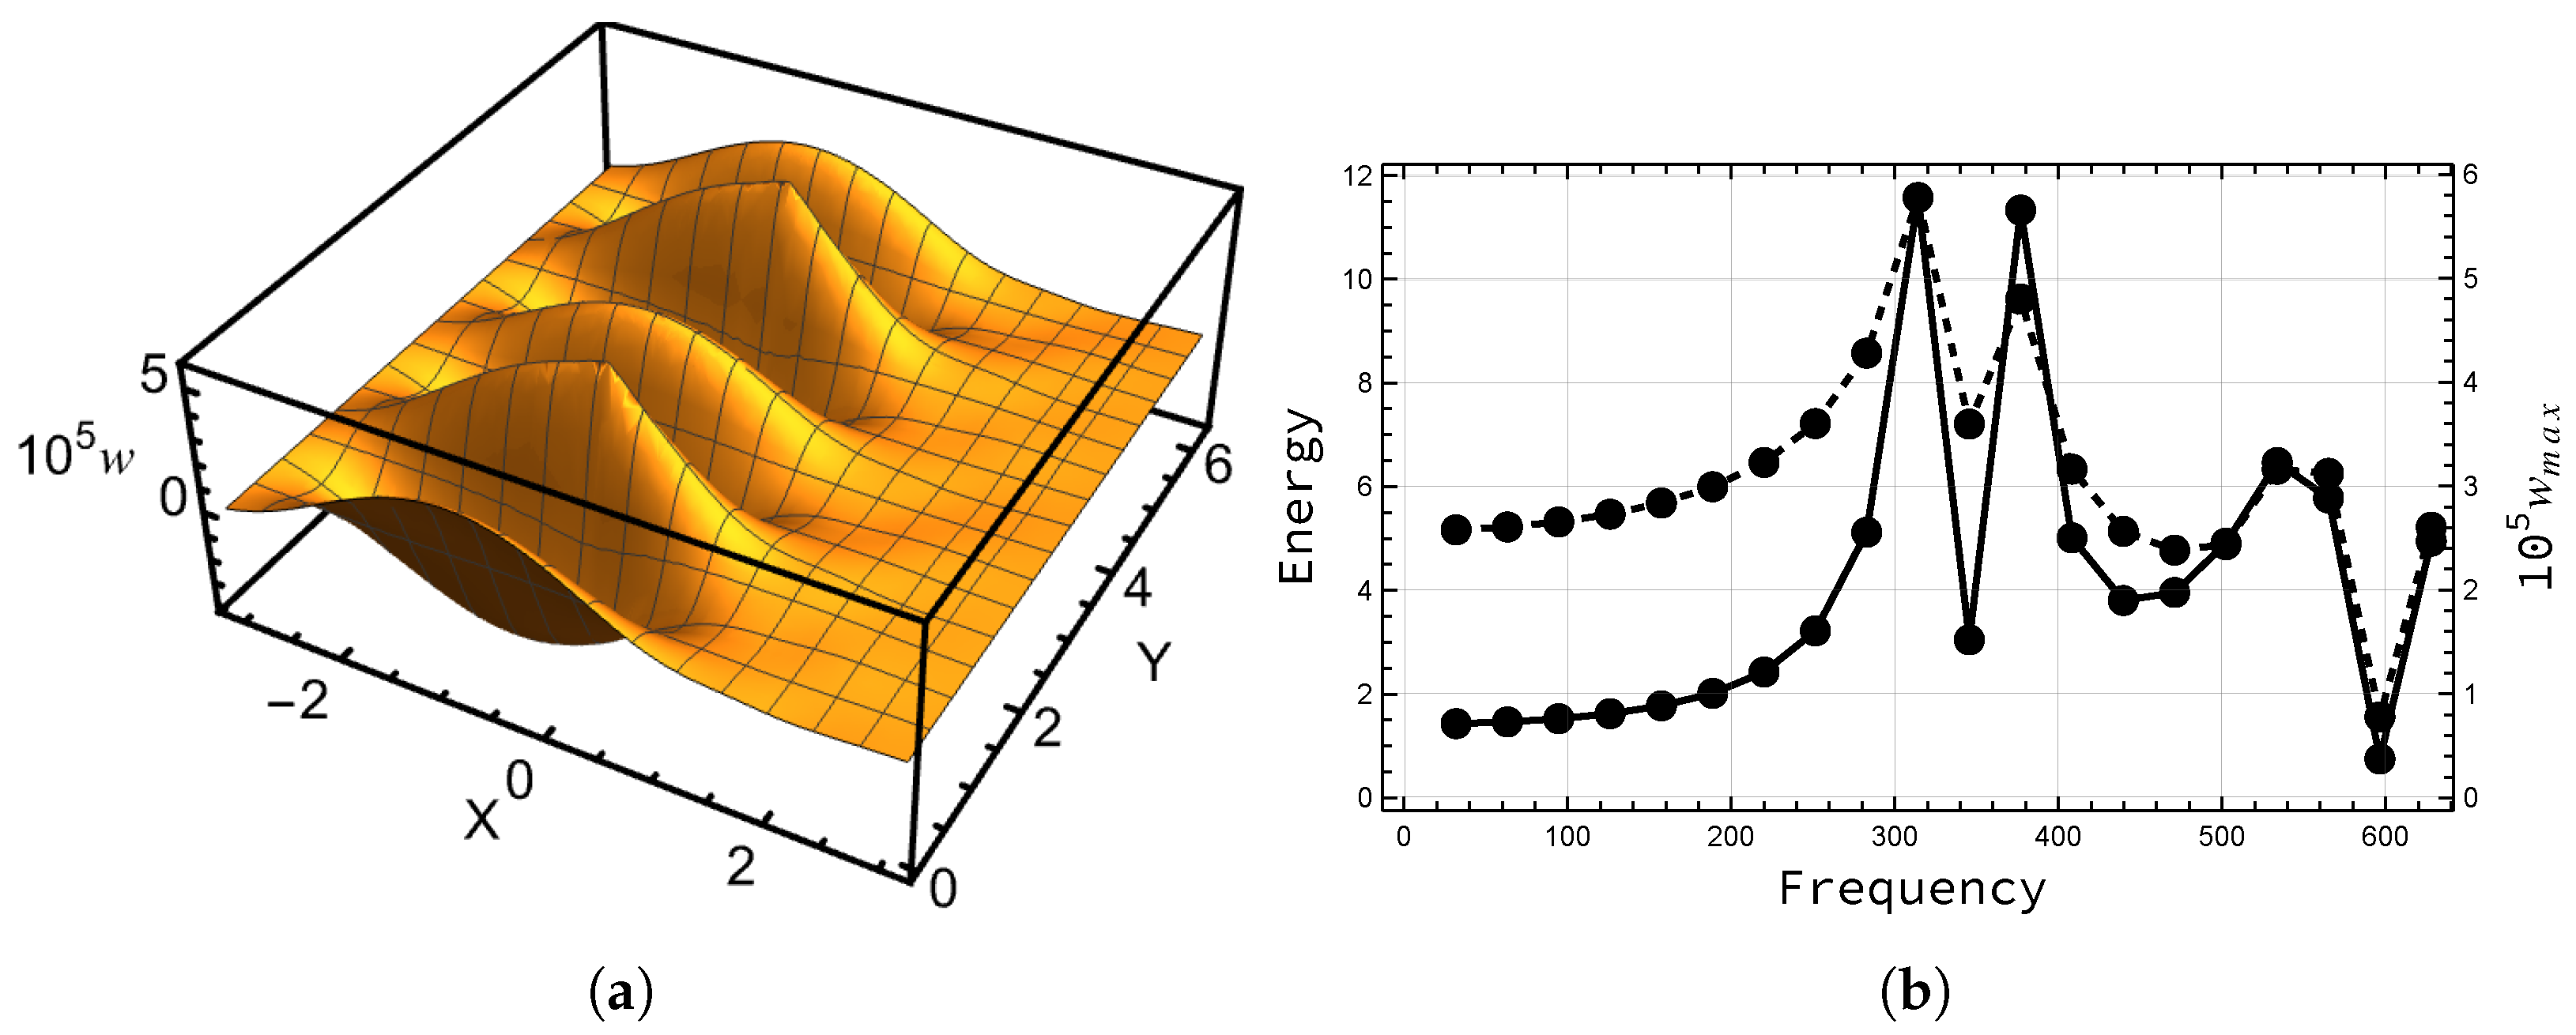
Only selected examples are visualised. In some cases, the most energetic responses are shown as surfaces and contour plots, in others the correlation between the energies and maximal transverse displacements is illustrated with multi-axis-plots where two graphs with different scales are plotted together.
The discretised system with standard or regular mesh at has 51,000 d.o.f, and the perforated one has 362,380. One solution set over the whole range of frequencies takes on the average 20 for the standard and 180–260 for the perforated one, where the difference is due to numerical integration in cases where the geometry parameters are not constant.
5.1. What to Expect
In free vibration, the eigenmodes of the shells of revolution are periodic in the angular direction with trigonometric oscillations. In this set of experiments, the loading is also symmetric, so the responses should be periodic as well. Therefore, the most energetic responses need not include any traces of the pinch-through.
In sensitive cases, the eigendynamics have not been reported in the literature.
5.2. Analysis
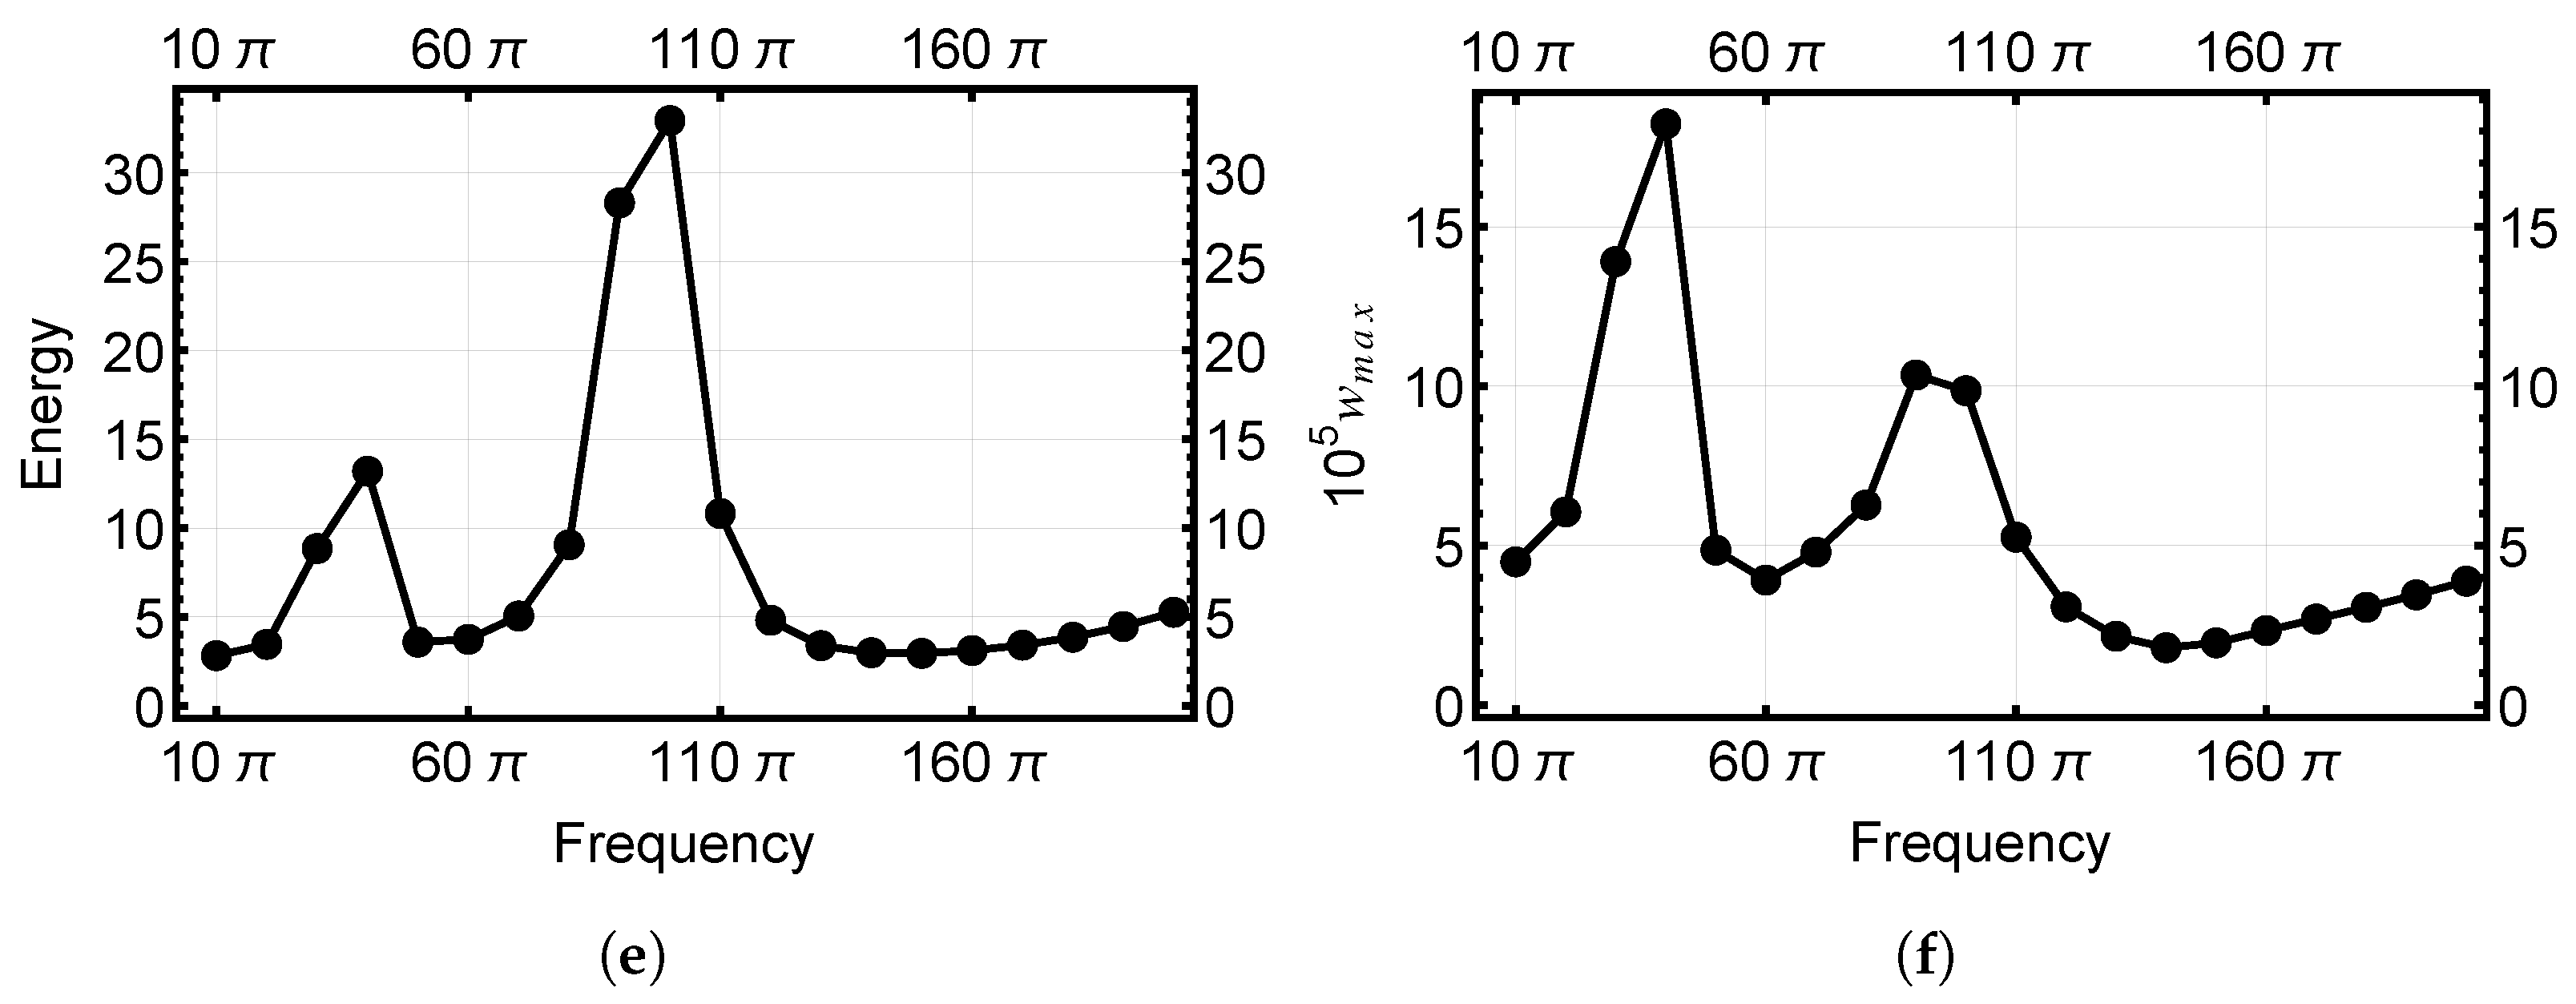
The results displayed in Table 3 indicate that the correlation between the most energetic responses and the maximal transverse deflection is moderately positive, even in the most challenging case with perforated general geometry. All cases with standard correlation less than 0.8 are indicated with bold font. They are mostly but not exclusively sensitive ones. Interestingly, in the sensitive variant of the perforated general geometry case, the observed angular frequency of the most energetic response is higher than that in the clamped variant (also indicated with bold font). This underlines the peculiar interactions of elliptic regions and free boundaries in thin shells.
As expected, in the parabolic case, the shallow shell approximation is remarkably accurate. Figure 5, Figure 8 and Figure 9 display similar oscillations in the angular direction. The last one is the sensitive case, where the oscillations at the free boundary are not the dominant feature. In Figure 8a, the pinch-through is visible.
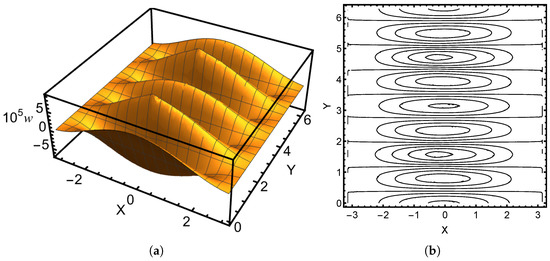
Figure 8.
Most energetic response: Parabolic (Shallow Shell Model). (a) Surface. (b) Contours. Clamped case, symmetric point load at .
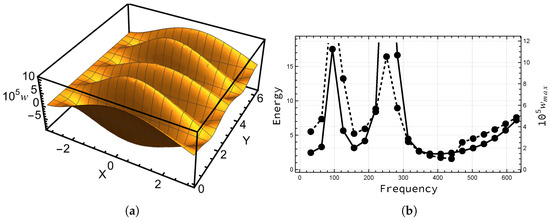
Figure 9.
Most energetic response: Parabolic (Naghdi). (a) Surface. (b) Comparison of energy and displacement. Clamped case.
For the hyperbolic case, the shallow shell model with the chosen parameters is not realistic. Comparison between Figure 6 and Figure 10 reveals very different responses. The contour plots show that the singularities are propagated along different characteristics. In particular, the characteristics in the idealised geometry are reflected at the boundary leading to a strong interference pattern. In both cases, the pinch-through is present, though much stronger in the shallow shell formulation. In Figure 11, in the sensitive case, the superposition of the layers results in strong oscillations as suspected based on the observations in [7].
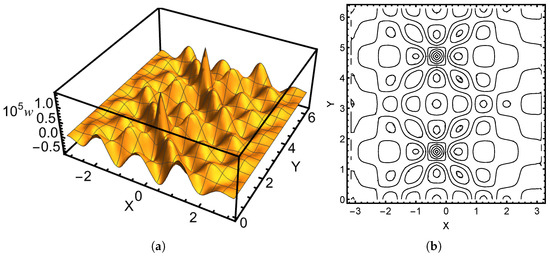
Figure 10.
Most energetic response: Hyperbolic (Shallow Shell Model). (a) Surface. (b) Contours. Clamped case, symmetric point load at .
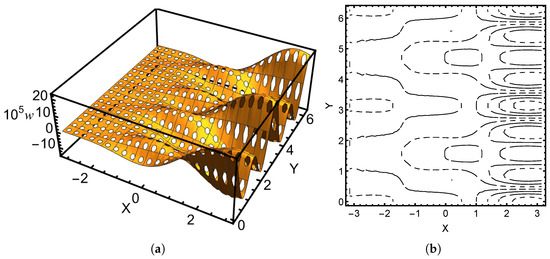
Figure 11.
Most energetic response: Hyperbolic (Naghdi). (a) Surface. (b) Contours. Sensitive case, symmetric point load at .
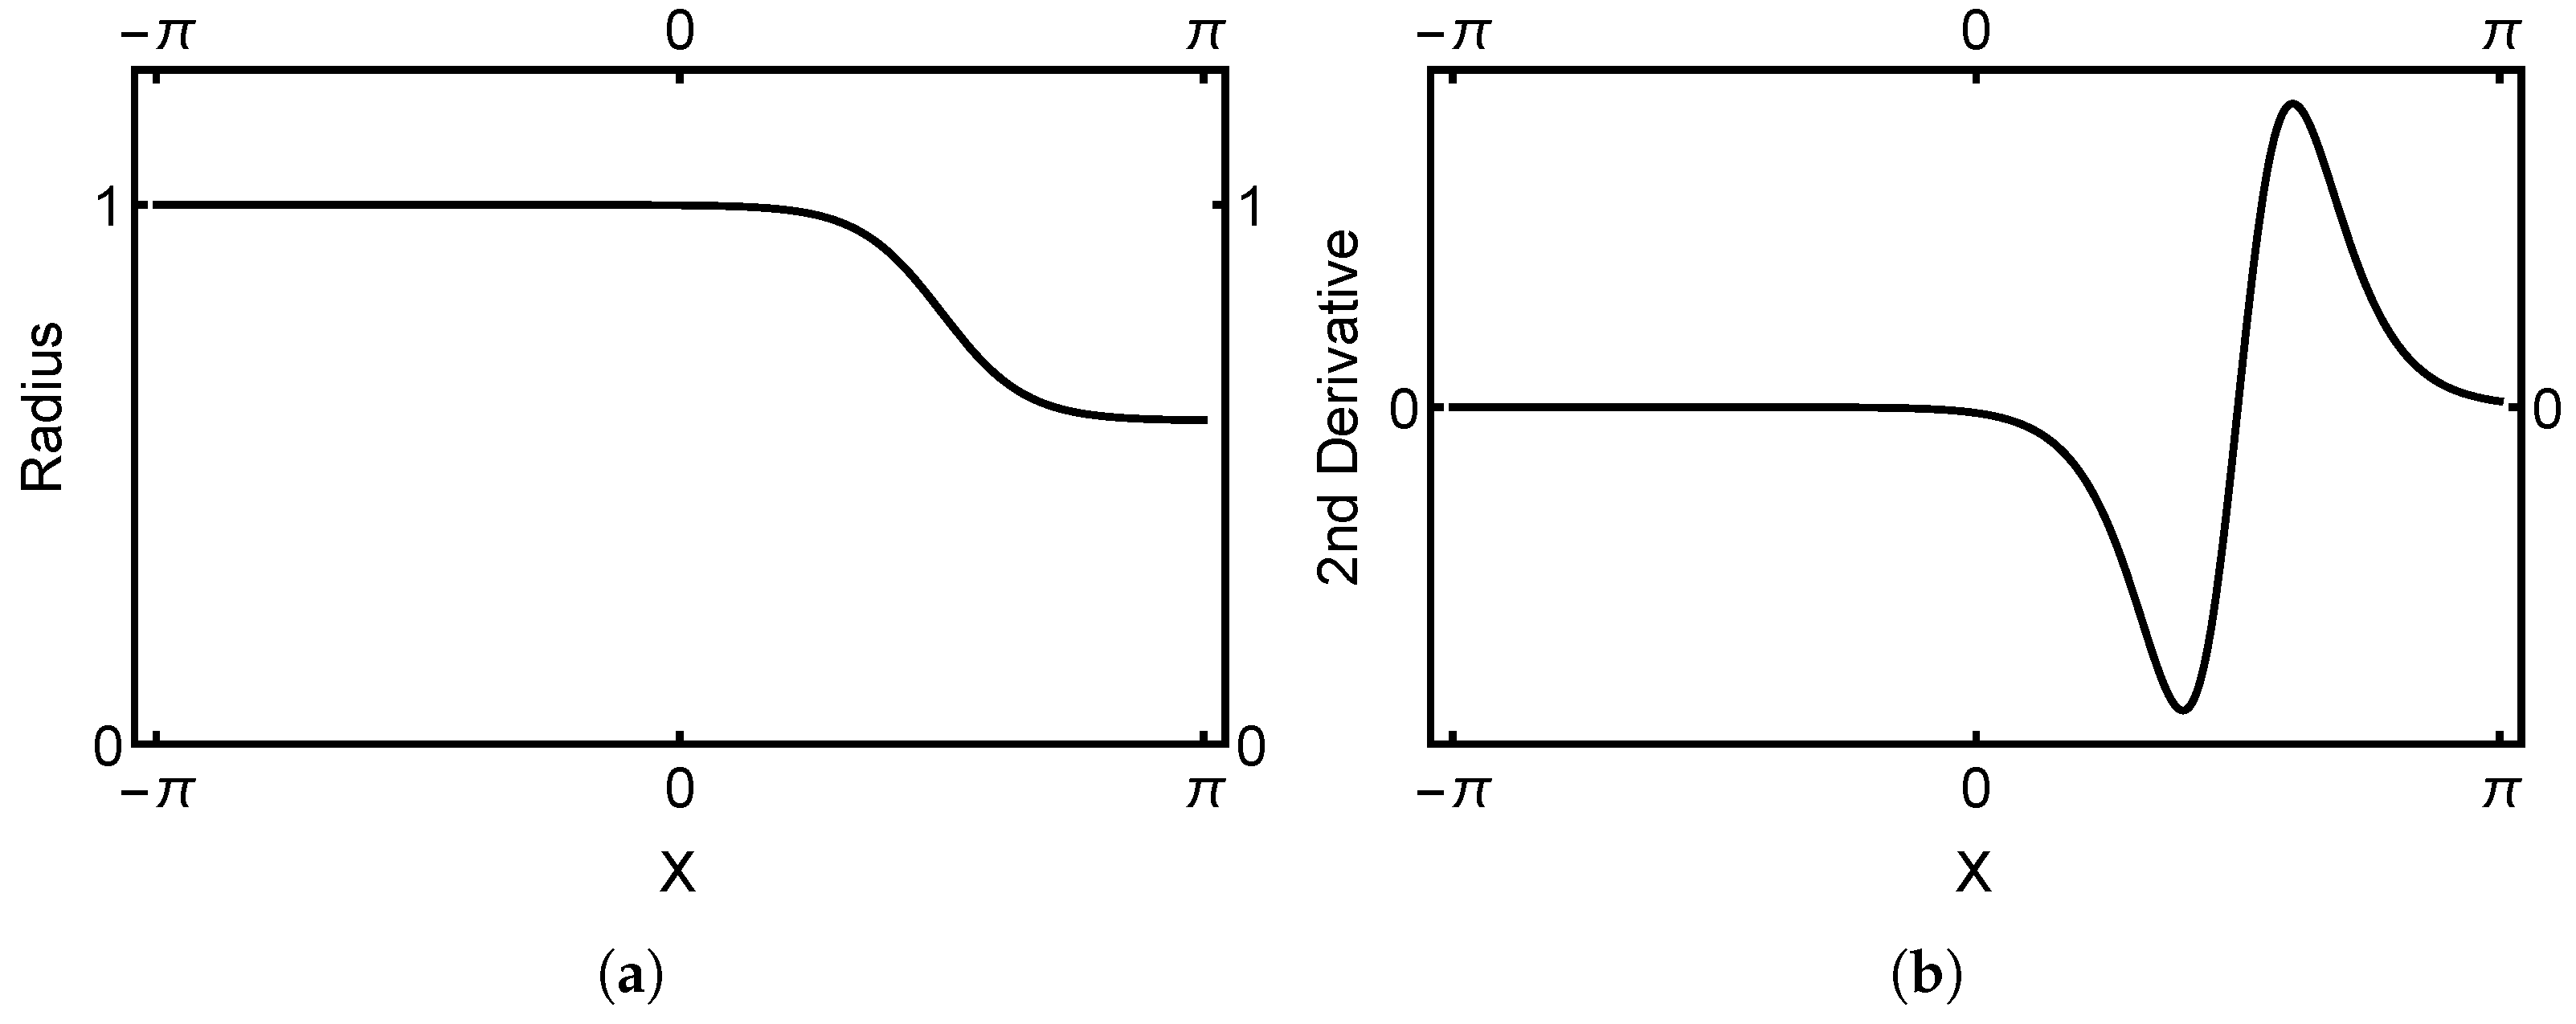
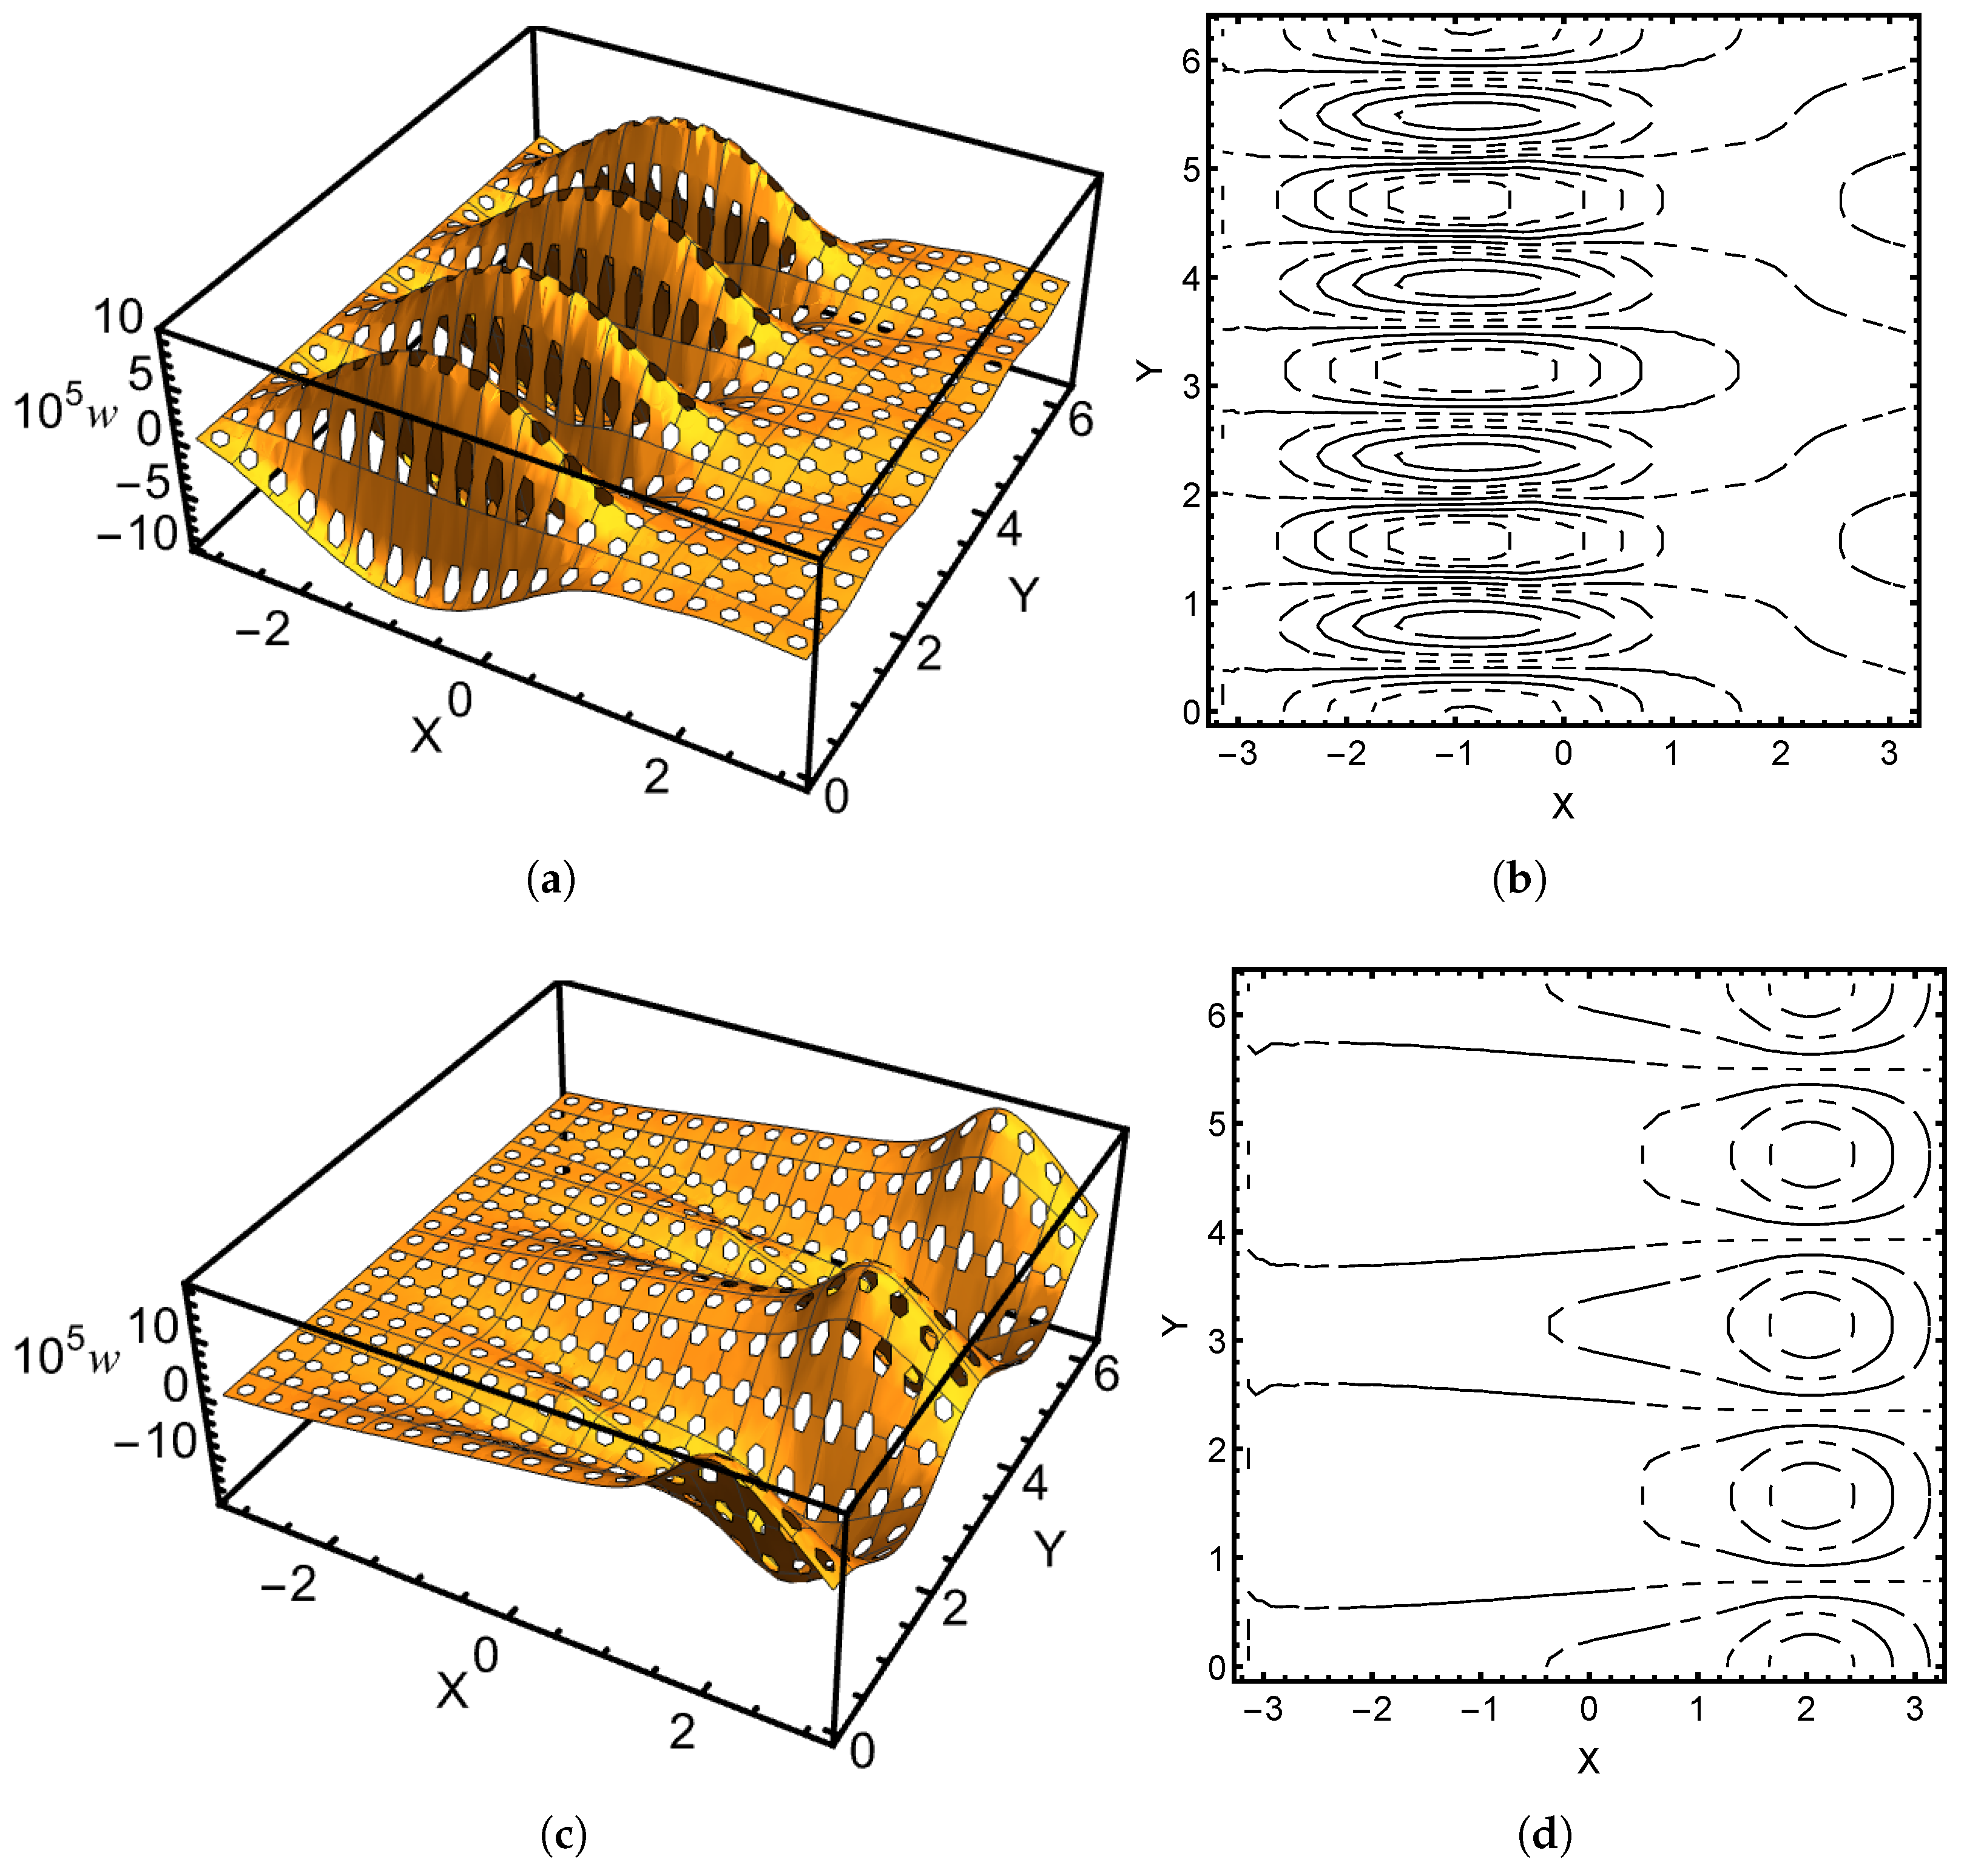
The profile function of the general geometry case and its local curvature types (second derivative) are shown in Figure 12. The load is acting on the parabolic part. As the boundary layer propagates from the point of action along the axial characteristic, it has to reach the elliptic part before reaching the boundary. In the elliptic part, there are no characteristic lines, so the only mechanism that can excite the oscillations at the boundary is sensitivity. In the clamped case, there are no boundary oscillations; indeed, the parabolic part dominates (see Figure 13). The resemblance with the pure parabolic cases is clear. However, in the perforated sensitive configuration of Figure 14, the elliptic part induces strong oscillations along the free boundary at lower frequencies, but with higher frequencies the parabolic part emerges as the dominant one. It is known from the theory that the displacements exhibit the so-called saturation at higher frequencies, that is, the amplitudes of the oscillations decay rapidly.
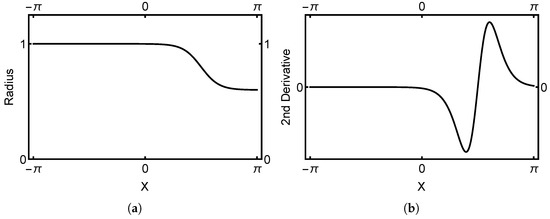
Figure 12.
General geometry: . (a) Profile function. (b) Second derivative. All geometry types are present. The load acts in the parabolic region at .
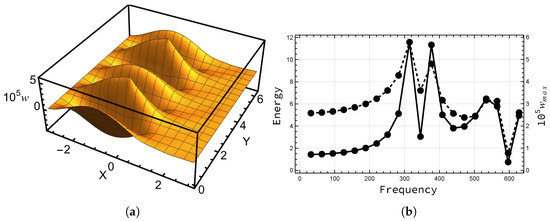
Figure 13.
Most energetic response: General geometry (Naghdi). (a) Surface. (b) Comparison of energy and displacement. Clamped case.
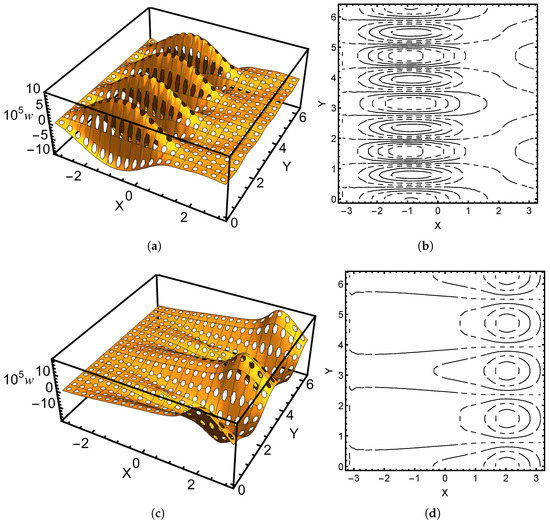
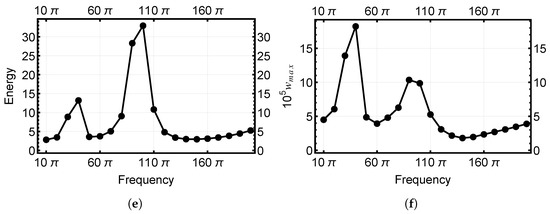
Figure 14.
Most energetic responses: General geometry (Naghdi). (a) Surface at . (b) Contours at . (c) Surface at . (d) Contours at . (e) Energy vs. frequency. (f) Maximal transverse deflection vs frequency. Sensitive case.
6. Conclusions
Thin shells are common structures in engineering with many applications. Interestingly, new application areas are emerging within fields where engineering knowledge is not always present in the design teams. The internal boundary layers and the shell specific feature of sensitivity are likely to pose challenges as the new devices are pushed toward manufacturing limits, which is inevitable as the volume of the payload is maximised.
In problems addressing thin structures, it is necessary for engineers to have sufficient understanding of the assumptions underlying the properties of different models. The rich variety of local features of the responses is the result of the intricate dependencies of the geometry, loading, and boundary conditions.
In this study, the frequency responses of a set of three shells with different profiles under symmetric concentrated loading were studied. For all shells, perforated specimens were also considered with clamped and sensitive boundary conditions. Proportional Rayleigh damping was used with low-rank approximations.
The most energetic responses correlated strongly with maximal displacements on clamped cases with correlation coefficients over 0.8, which means that this simple quantity of interest is applicable in this context. One of the surprising features of the effects of the concentrated loads on shells is the propagation of singularities along the characteristics of the surface. For sensitive shells where one end is clamped and another free, it is possible that the maximal displacements occur far from the point of action of load. This was indicated by the correlation coefficients between the most energetic responses and maximal displacements, which were of the order of 0.7 and below. In the example with general shell geometry with regions of different curvature type, the most energetic response had maximal displacement far away from the load. The presence of regions with elliptic curvature leads to strong oscillations at lower frequencies. The amplitudes of these oscillations decay as the frequencies increase.
As one would expect, the geometry simplifications have an effect. For parabolic shells, this is not severe, but, for instance, for hyperbolic ones, the response profiles (surface and frequency) can be noticeably different. Here, the two shell models represent the two extremes, exact vs non-realizable, but in many industrial problems local geometry approximations are unavoidable and one should be aware of this effect. For the Naghdi model, the observed frequency of interest was the same for both the parabolic and hyperbolic ones (), yet slightly lower in the general case. For the shallow shell model, the hyperbolic frequency was much larger (), indicating that the local curvature approximation was indeed different.
The effect of perforations was the lowering of the most energetic frequency within the boundary condition type with the exception of the general geometry case. There, the frequency of the perforated sensitive case () was the same as that of the clamped one. This is due to the elliptic region affecting the performance strongly.
Low-rank approximation techniques make it possible to simulate realistic problems with shell geometries. Solid a priori understanding of possible response scenarios is necessary for design of representative simulation sets, however. As always, sensitivity in shell structures is a complicating factor. Utmost care has to be taken in analysis of such problems also in relation to frequency response analysis.
Funding
This research received no external funding.
Data Availability Statement
Not applicable.
Conflicts of Interest
The author declares no conflict of interest.
References
- Auvinen, V.V.; Virtanen, J.; Merivaara, A.; Virtanen, V.; Laurén, P.; Tuukkanen, S.; Laaksonen, T. Modulating sustained drug release from nanocellulose hydrogel by adjusting the inner geometry of implantable capsules. J. Drug Deliv. Sci. Technol. 2020, 57, 101625. [Google Scholar] [CrossRef]
- Vicente, W.; Picelli, R.; Pavanello, R.; Xie, Y. Topology optimization of frequency responses of fluid–structure interaction systems. Finite Elem. Anal. Des. 2015, 98, 1–13. [Google Scholar] [CrossRef]
- Chapelle, D.; Bathe, K.J. The Finite Element Analysis of Shells; Springer: Berlin/Heidelberg, Germany, 2003. [Google Scholar]
- Sanchez-Palencia, E.; Millet, O.; Béchet, F. Singular Problems in Shell Theory; Springer: Berlin/Heidelberg, Germany, 2010. [Google Scholar]
- Giani, S.; Hakula, H. On effects of perforated domains on parameter-dependent free vibration. J. Comput. Appl. Math. 2021, 394, 113526. [Google Scholar] [CrossRef]
- Giani, S.; Hakula, H. Free Vibration of Perforated Cylindrical Shells of Revolution: Asymptotics and Effective Material Parameters. Comput. Methods Appl. Mech. Eng. 2023, 403, 115700. [Google Scholar] [CrossRef]
- Giani, S.; Hakula, H. On effects of concentrated loads on perforated sensitive shells of revolution. J. Comput. Appl. Math. 2023, 408, 115165. [Google Scholar] [CrossRef]
- Hakula, H.; Laaksonen, M. Frequency Response Analysis of Perforated Shells with Uncertain Materials and Damage. Appl. Sci. 2019, 9, 5299. [Google Scholar] [CrossRef]
- Hakula, H.; Laaksonen, M. Low-Rank Approximation of Frequency Response Analysis of Perforated Cylinders under Uncertainty. Appl. Sci. 2022, 12, 3559. [Google Scholar] [CrossRef]
- Pitkäranta, J.; Sanchez-Palencia, E. On the asymptotic behaviour of sensitive shells with small thickness. C. R. L’AcadÉmie Des Sci. Ser. Iib Mech.-Phys.-Chem.-Astron. 1997, 325, 127–134. [Google Scholar] [CrossRef]
- Bathe, K.J.; Chapelle, D.; Lee, P.S. A shell problem ‘highly sensitive’ to thickness changes. Int. J. Numer. Methods Eng. 2003, 57, 1039–1052. [Google Scholar] [CrossRef]
- Artioli, E.; da Veiga, L.B.; Hakula, H.; Lovadina, C. On the asymptotic behaviour of shells of revolution in free vibration. Comput. Mech. 2009, 44, 45–60. [Google Scholar] [CrossRef]
- Chaussade-Beaudouin, M.; Dauge, M.; Faou, E.; Yosibash, Z. High Frequency Oscillations of First Eigenmodes in Axisymmetric Shells as the Thickness Tends to Zero. In Recent Trends in Operator Theory and Partial Differential Equations; Springer International Publishing: Berlin/Heidelberg, Germany, 2017; pp. 89–110. [Google Scholar] [CrossRef]
- Schenk, C.A.; Schuëller, G.I. Uncertainty Assessment of Large Finite Element Systems. In Lecture Notes in Applied and Computational Mathematics; Springer: Berlin/Heidelberg, Germany, 2005; Volume 24. [Google Scholar]
- Benson, D.; Bazilevs, Y.; Hsu, M.; Hughes, T. Isogeometric shell analysis: The Reissner–Mindlin shell. Comput. Methods Appl. Mech. Eng. 2010, 199, 276–289. [Google Scholar] [CrossRef]
- Naghdi, P. Foundations of elastic shell theory. In Progress in Solid Mechanics; North-Holland Publishing Company: Amsterdam, The Netherlands, 1963; Volume 4, pp. 1–90. [Google Scholar]
- Malinen, M. On the classical shell model underlying bilinear degenerated shell finite elements: General shell geometry. Int. J. Numer. Methods Eng. 2002, 55, 629–652. [Google Scholar] [CrossRef]
- Pitkäranta, J. The problem of membrane locking in finite element analysis of cylindrical shells. Numer. Math. 1992, 61, 523–542. [Google Scholar] [CrossRef]
- Hakula, H.; Leino, Y.; Pitkäranta, J. Scale resolution, locking, and high-order finite element modelling of shells. Comput. Methods Appl. Mech. Eng. 1996, 133, 157–182. [Google Scholar] [CrossRef]
- Bieber, S.; Oesterle, B.; Ramm, E.; Bischoff, M. A variational method to avoid locking—Independent of the discretization scheme. Numer. Methods Eng. 2018, 114, 801–827. [Google Scholar] [CrossRef]
- Szabo, B.; Babuska, I. Finite Element Analysis; Wiley: Hoboken, NJ, USA, 1991. [Google Scholar]
- Schwab, C. p- and hp-Finite Element Methods; Oxford University Press: Oxford, UK, 1998. [Google Scholar]
- Ko, Y.; Lee, P.S.; Bathe, K.J. A new MITC4+ shell element. Comput. Struct. 2017, 182, 404–418. [Google Scholar] [CrossRef]
- Ho-Nguyen-Tan, T.; Kim, H.G. Polygonal shell elements with assumed transverse shear and membrane strains. Comput. Methods Appl. Mech. Eng. 2019, 349, 595–627. [Google Scholar] [CrossRef]
- Jung, J.; Hyun, J.; Goo, S.; Wang, S. An efficient design sensitivity analysis using element energies for topology optimization of a frequency response problem. Comput. Methods Appl. Mech. Eng. 2015, 296, 196–210. [Google Scholar] [CrossRef]
- Liu, Q.; Chan, R.; Huang, X. Concurrent topology optimization of macrostructures and material microstructures for natural frequency. Mater. Des. 2016, 106, 380–390. [Google Scholar] [CrossRef]
- Venini, P. Dynamic compliance optimization: Time vs. frequency domain strategies. Comput. Struct. 2016, 177, 12–22. [Google Scholar] [CrossRef]
- Zhao, J.; Wang, C. Topology optimization for minimizing the maximum dynamic response in the time domain using aggregation functional method. Comput. Struct. 2017, 190, 41–60. [Google Scholar] [CrossRef]
- Takezawa, A.; Daifuku, M.; Nakano, Y.; Nakagawa, K.; Yamamoto, T.; Kitamura, M. Topology optimization of damping material for reducing resonance response based on complex dynamic compliance. J. Sound Vib. 2016, 365, 230–243. [Google Scholar] [CrossRef]
- Do Carmo, M. Differential Geometry of Curves and Surfaces; Prentice Hall: Hoboken, NJ, USA, 1976. [Google Scholar]
- Forskitt, M.; Moon, J.R.; Brook, P.A. Elastic properties of plates perforated by elliptical holes. Appl. Math. Model. 1991, 15, 182–190. [Google Scholar] [CrossRef]
- Burgemeister, K.; Hansen, C. Calculating Resonance Frequencies of Perforated Panels. J. Sound Vib. 1996, 196, 387–399. [Google Scholar] [CrossRef]
- Jhung, M.J.; Yu, S.O. Study on modal characteristics of perforated shell using effective Young’s modulus. Nucl. Eng. Des. 2011, 241, 2026–2033. [Google Scholar] [CrossRef]
- Pitkäranta, J.; Matache, A.M.; Schwab, C. Fourier mode analysis of layers in shallow shell deformations. Comput. Methods Appl. Mech. Eng. 2001, 190, 2943–2975. [Google Scholar] [CrossRef]
- Niemi, A.H.; Pitkäranta, J. Bilinear finite elements for shells: Isoparametric quadrilaterals. Int. J. Numer. Methods Eng. 2008, 75, 212–240. [Google Scholar] [CrossRef]
- Malinen, M.; Pitkäranta, J. A benchmark study of reduced-strain shell finite elements: Quadratic schemes. Int. J. Numer. Methods Eng. 2000, 48, 1637–1671. [Google Scholar] [CrossRef]
- Inman, D.J. Engineering Vibration; Pearson: New York, NY, USA, 2008. [Google Scholar]
- Eid, R.; Salimbahrami, B.; Lohmann, B.; Rudnyi, E.B.; Korvink, J.G. Parametric Order Reduction of Proportionally Damped Second-Order Systems. Sens. Mater. 2007, 19, 149–164. [Google Scholar]
- Freund, R.W. Krylov-subspace methods for reduced-order modeling in circuit simulation. J. Comput. Appl. Math. 2000, 123, 395–421. [Google Scholar] [CrossRef]
Disclaimer/Publisher’s Note: The statements, opinions and data contained in all publications are solely those of the individual author(s) and contributor(s) and not of MDPI and/or the editor(s). MDPI and/or the editor(s) disclaim responsibility for any injury to people or property resulting from any ideas, methods, instructions or products referred to in the content. |
© 2023 by the author. Licensee MDPI, Basel, Switzerland. This article is an open access article distributed under the terms and conditions of the Creative Commons Attribution (CC BY) license (https://creativecommons.org/licenses/by/4.0/).


