Article

Influence of Coupling Forces and Body Posture on the Rotational Hand–Arm Impedance in yh Direction

Karlsruhe Institute of Technology, 76131 Karlsruhe, Germany
*
Author to whom correspondence should be addressed.
Vibration 2023, 6(2), 375-398; https://doi.org/10.3390/vibration6020023
Submission received: 21 February 2023 / Revised: 31 March 2023 / Accepted: 2 April 2023 / Published: 12 April 2023

Abstract

:
This manuscript investigates the rotational mechanical impedance of the human hand–arm system with respect to vibration excitation around the gripping axis of the hand under the influence of body posture, gripping force, and push force. Knowledge of rotational mechanical impedance is required for deriving models of hand–arm biodynamics. These models are used in the validation of power tools to predict further vibrational human–machine interactions. In the current state of research, such models exist for translational but not rotational vibration excitation. Consequently, this study investigates the properties of a hand–arm system with respect to rotational vibration excitation. In the study, the rotational impedance of the hand–arm systems of 13 adults was measured at various gripping and push forces applied in different body postures. The setup of the test used in this study consisted of a shaker that applied rotational vibrations at certain frequencies to the subjects’ hand–arm systems via a cylindrical handle. The results of the study indicate a spring–damper dynamic of the hand–arm system. The gripping force strongly influences the magnitude of rotational impedance across the frequency spectrum. Regarding push force and posture, no corresponding influence could be determined. The results suggest that the frictional contact between the hand and handle might confer a damping effect.

1. Introduction

Vibration exposure from power tools can cause long-term health problems in the vascular and neural areas of the user’s hand–arm system (HAS) [1,2,3,4,5,6,7]. Therefore, it is necessary to consider and validate the vibrational interaction between the user and the employed power tool during the development of power tools. These interactions include the emitted vibrations of the power tool and the resulting reaction forces caused by the biodynamics of the user’s HAS. One option for validating these interactions is manual testing using sensor-equipped prototypes. However, manual tests are time consuming and offer only limited significance since the subject’s mood and individual physical condition and behavior strongly influence the results [8]. Furthermore, the user’s fatigue limits the number of possible test repetitions and the tests’ reproducibility. Therefore, replacing manual testing with simulative or physical vibration equivalent hand–arm models (HAMs) leads to a lower degree of variance in the results and a higher number of possible test repetitions. Regarding translational vibration exposure, several simulative and physical HAMs exist [9,10,11,12,13,14,15,16,17,18,19]. Although rotational vibration exposure caused by power tools is also harmful to the HAS, only a few corresponding rotational HAMs can be found in the literature [2,5,6,20]. To model the hand–arm system during torque impulses caused by a pistol-grip air pneumatic torque driver, Lin et al., (2003) developed a model with lumped parameters and one rotational degree of freedom. The model was parameterized by measurements of a subject study with 25 subjects, whose HASs were rotationally excited at 3.6 Hz, 4 Hz, and 4.6 Hz [16]. Another HAM was developed by Mangold (2019) for the modeling of the HAS when working with a pistol-grip impulse wrench. For this purpose, Mangold (2019) designed a physical/mechanical equivalent HAM with two rotational degrees of freedom for the frequency spectrum between 1 Hz and 35 Hz [21]. The stiffness damping and inertia of the model were derived from a subject study with two subjects. Although both models represent a sophisticated approach, they only cover a small frequency spectrum since they were developed for a specific power tool application. A greater level of knowledge of the rotational biodynamics of HASs is needed for the development of a HAM that covers a wider frequency range of rotational vibration excitation and represents a more universal simulation of the HAS. Therefore, the rotational biodynamics of the HAS in terms of stiffness, damping, and inertia must be investigated. An established quantity from which these biodynamic properties can be derived is the mechanical impedance (MI) of the HAS [22,23]. Analogous to translational MI, the rotational MI of the HAS (RMI) can be determined as a complex frequency-dependent quotient of the vibration’s torque and the angular velocity at the initiation point of the hand [22]. Formula (1) shows the mathematical description of the RMI, where RMI is equal to the quotient of the applied torque T and the resulting angular velocity Ω, both of which depend on the complex circular frequency ω, where j denotes the imaginary unit [22]. Formula (2) shows the equation of the apparent mass AM derived from the RMI as the quotient of the torque T and the angular acceleration Ω ˙ .
R M I j ω = T ( j ω ) Ω ( j ω )
R A M j ω = T ( j ω ) Ω ˙ ( j ω )
According to the base-centric coordinate system defined in ISO 10068, the RMI can be measured for rotational vibration excitation around the x h , y h , and z h -axis [23]. Figure 1 shows the base-centric coordinate system of ISO 10068 [23]. The enclosing hand position shown in Figure 1 is referred to as the “hand-grip” position in DIN EN ISO 5349-1, and this term is also used below for this hand position [24].
In the following, the coordinate system defined in ISO 10068 will be used as a reference since it is specified for the measurement of the biodynamic response of the HAS.
As is known from translational MI, the gripping and push force applied to a vibrating handle as well as the user’s body posture influence the MI of the HAS [25,26,27,28,29,30,31,32]. Therefore, a similar influence of these factors can be assumed for RMI. Lindenmann et al., (2019) conducted a study on the RMI of the HAS for vibration excitation around the z h -axis when gripping a cylindrical handle in the “hand-grip” position. The influences of the coupling forces on the RMI were not investigated in that study [33]. In another study, Schröder et al., (2022) investigated the RMI for vibration excitation around the x h -axis provided via a knob-shaped handle to which the hand was positioned in a resting, enclosing hand position [34]. This hand position used by Schröder et al., (2022) corresponds approximately to the “palm” position from DIN EN ISO 5349-1 [24]. The results revealed by Schröder et al., (2022) showed a positive effect between the gripping force and the RMI, but no effect between the push force and the RMI [34]. Consequently, the RMI of the HAS for rotational vibration excitation around the y h -axis should also be investigated. An investigation of the RMI in the y h direction is also relevant in an industrial context since rotational vibration excitation around the y h direction via a cylindrical handle (shown in Figure 1) from ISO 10068 represents a number of vibration-emitting power tool applications, e.g., pneumatic assembly screwdrivers. According to the studies conducted by Schröder et al., (2022), gripping force has an influence on the RMI, while the push force has no influence. Therefore, it is necessary to investigate whether this also applies to vibration excitation around the y h -axis. An additional influencing factor, whose influence on RMI has not yet been investigated, is body posture. Based on the influence of body posture on the translational MI currently described in the literature, an influence of body posture on RMI might also be possible and should thus be investigated. Thus, the following research questions arise:
What is the course of the RMI of the HAS with respect to rotational vibration excitation around the y h -axis?
How is the RMI in the y h direction influenced by gripping forces?
How is the RMI in the y h direction influenced by push forces?
How is the RMI in the y h direction influenced by body posture?
This study aims to answer these questions.

2. Materials and Methods

2.1. Test Subjects

A total of 15 subjects (4 female and 11 male) participated in this study, corresponding to an age range of 20 to 30 years and a median age of 28 years. The subjects’ height and weight as well as their anthropometric properties were measured according to ISO 7250-1 [35]. Accordingly, it was determined that the height of the subjects ranged from 1.66 m to 1.93 m with a median height of 1.85 m. The subjects’ weights were within the range from 52 kg to 105 kg, with a median weight of 80 kg. Based on this weight and height distribution, the body mass index of the subjects ranged from 18 kg/m² to 29.7 kg/m², with a median of 24.3 kg/m². Table 1 shows the 5th and the 95th percentiles and the median of the subjects’ anthropometric properties.
To determine whether the measured weights, heights, and anthropometric properties were representative of the western population, the measured subject data were compared to the country-specific distributions of DIN CEN ISO/TR 7250-2 [36]. Since the measured anthropometric properties are not available for each country in DIN CEN ISO/TR 7250-2, the measured subject data were selectively compared to the nations from which the specific measurements were reported [36]. In this context, the measured subject data corresponded to the distributions from the Netherlands, Germany, Austria, and the USA, where the measured values were located between the 5th and 95th percentiles or between the 1st and 99th percentiles [36]. Accordingly, the weight, height, and anthropometric properties of the subjects can be regarded as being representative of the western population and thus, most likely, the measured RMI.

2.2. Test Apperatus

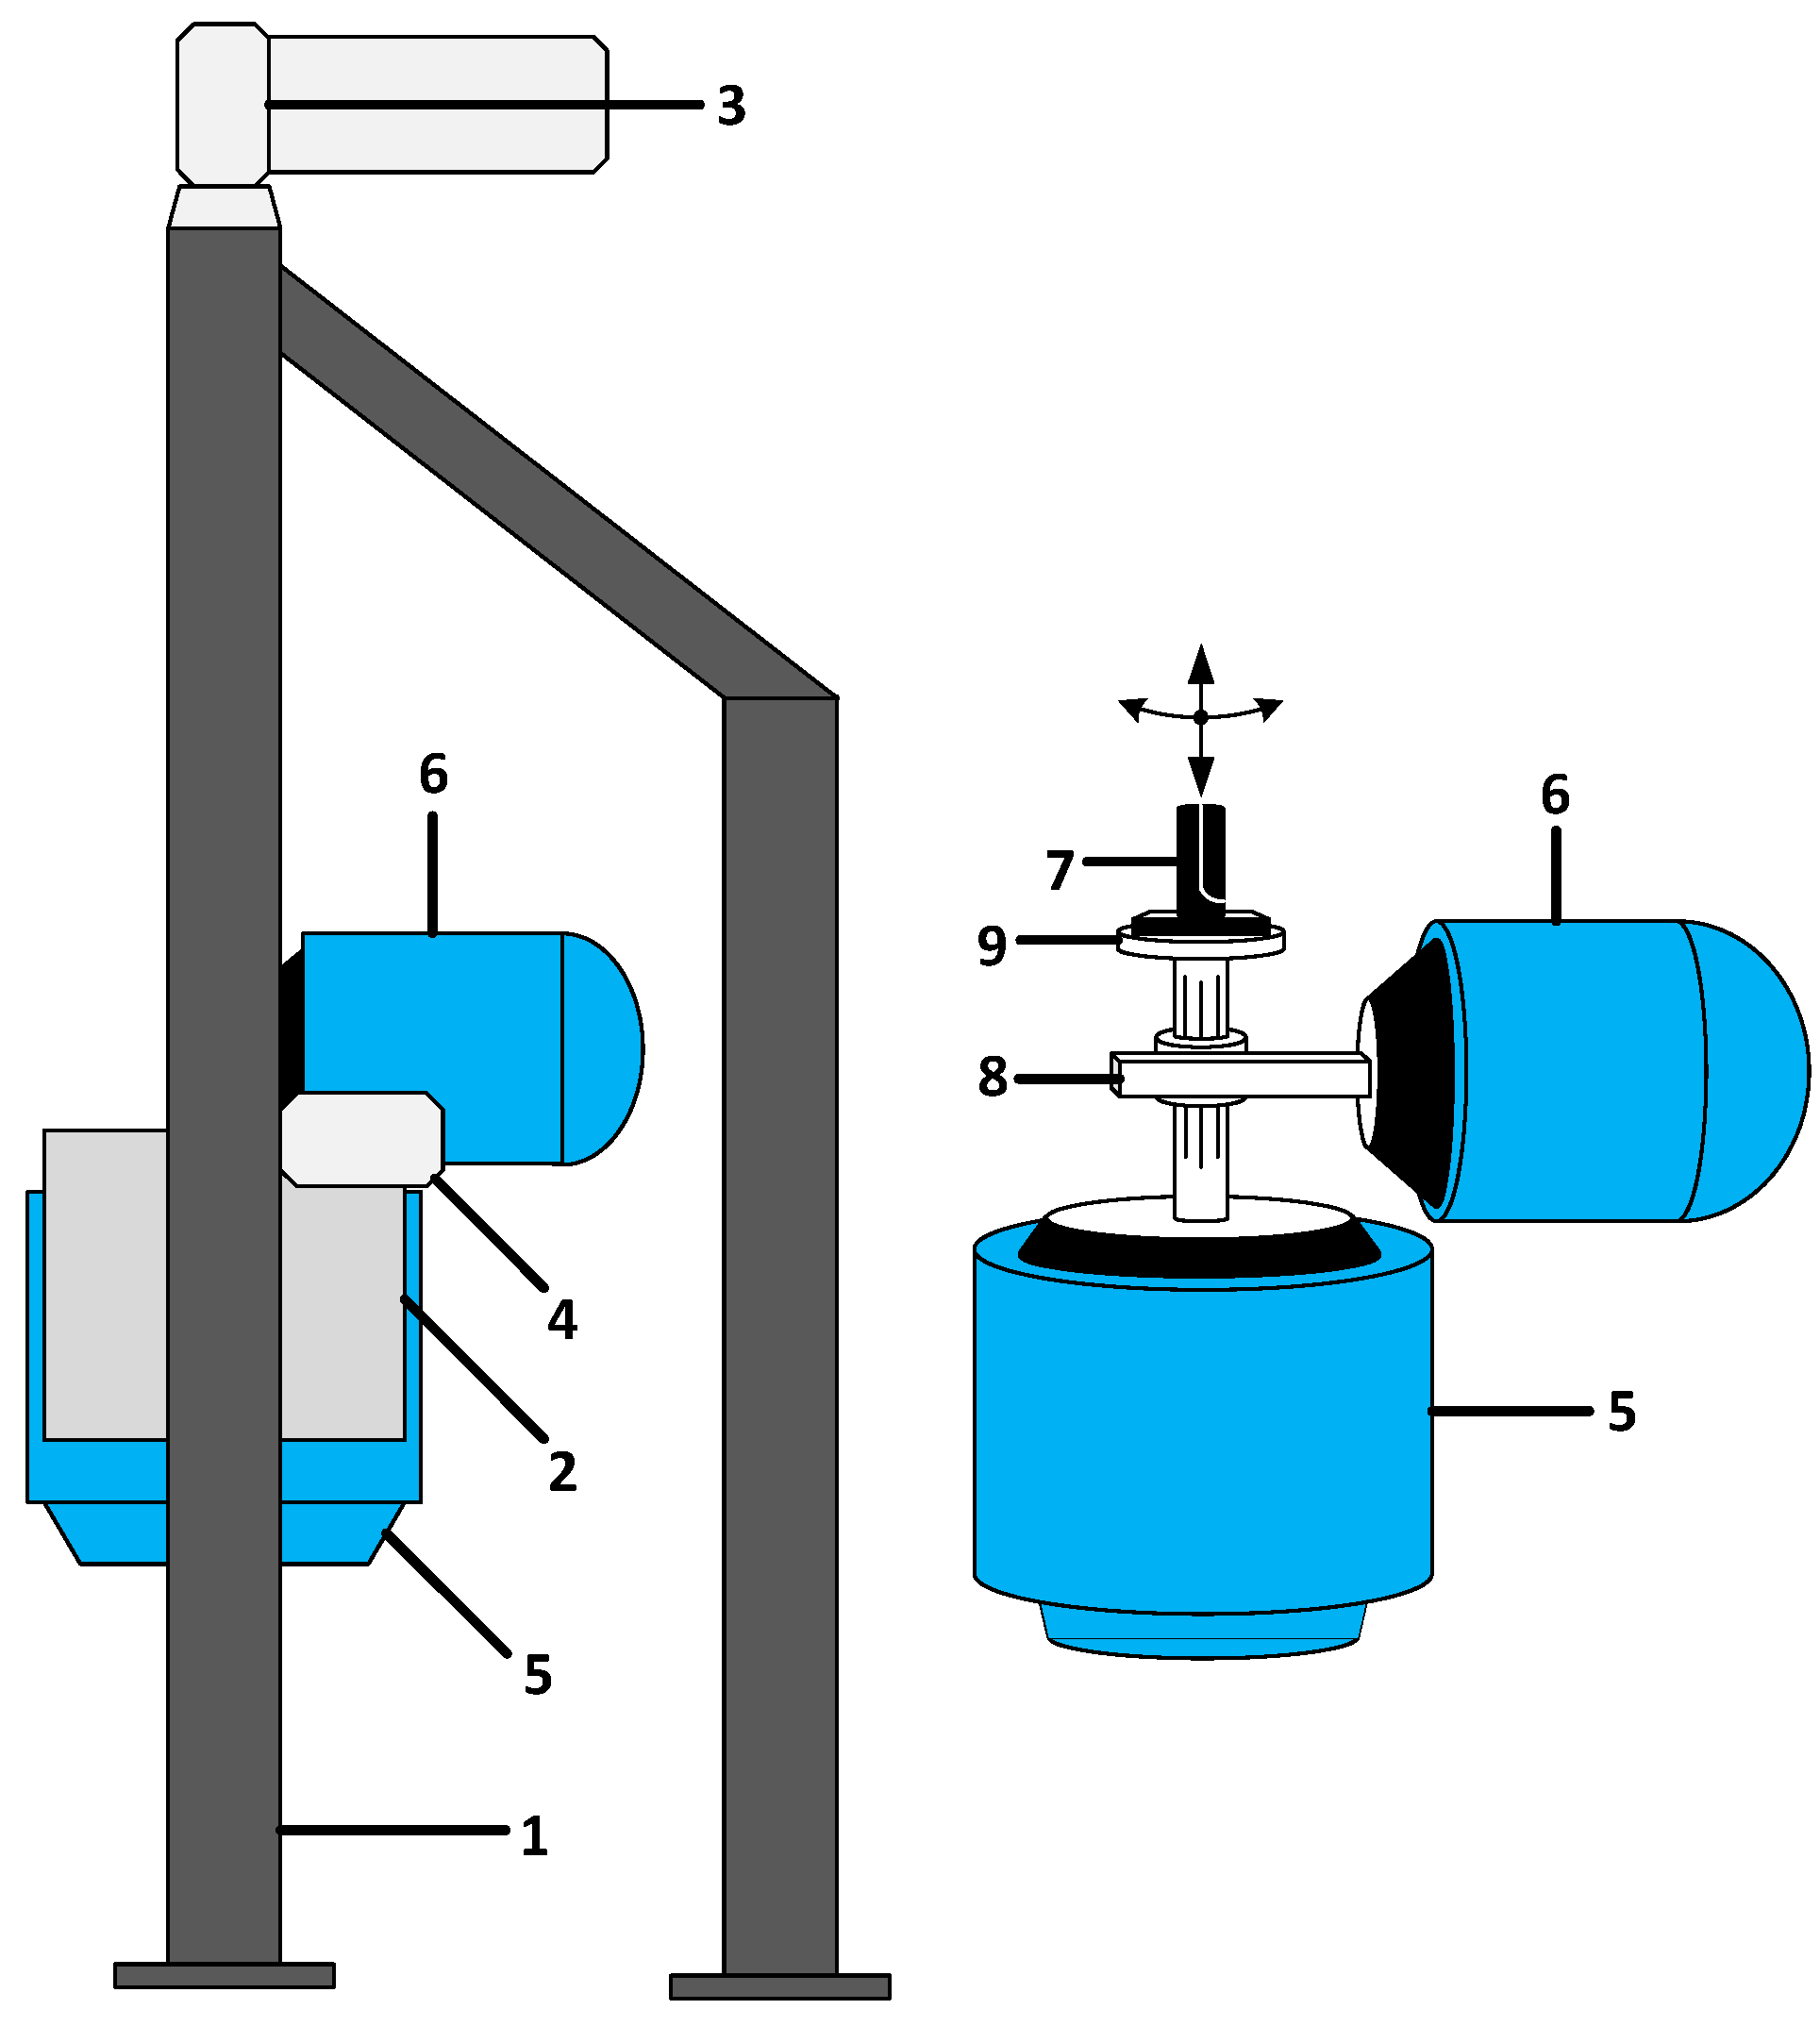
The test bench used in this study is the same as those described in [21,33,34,37,38] and consists of two independent electromagnetic shakers (M124M and L125M; ETS Solutions Europe, Loffenau, Germany) that were adjustable in terms of height and tilt angle via a carrier mechanism. The carrier mechanism consists of two spindles driven by two electric motors, which can adjust the height of the shakers from 0 m up to about 2.8 m. The tilt angle could be adjusted by two electric motors that allow the shakers to be tilted at an angle of 0° to 180°.
Both shakers are attached to a common output shaft, where one shaker (M124M) can vibrate the shaft translationally and the other one can vibrate the shaft rotationally (L125M) via a modally tuned gearbox. The gearbox consists of a rack-and-pinion gear. The rack is mounted on the L125M shaker, while the pinion gear is radially mounted on the output shaft via a splined connection. This arrangement converts the translational vibration of the L125M shaker into a rotational vibration of the output shaft. The splined connection allows for axial movement of the output shaft with simultaneous rotational vibration, allowing the M124M shaker to excite the output shaft translationally parallel to the rotational excitation. This allows the output shaft to be excited with superimposed rotational and translational vibrations. However, in the study conducted, only the L125M shaker was used to apply rotational vibrations to the output shaft. Figure 2 shows an annotated schematic of the carrier mechanism and the gearbox with the shaker arrangement.
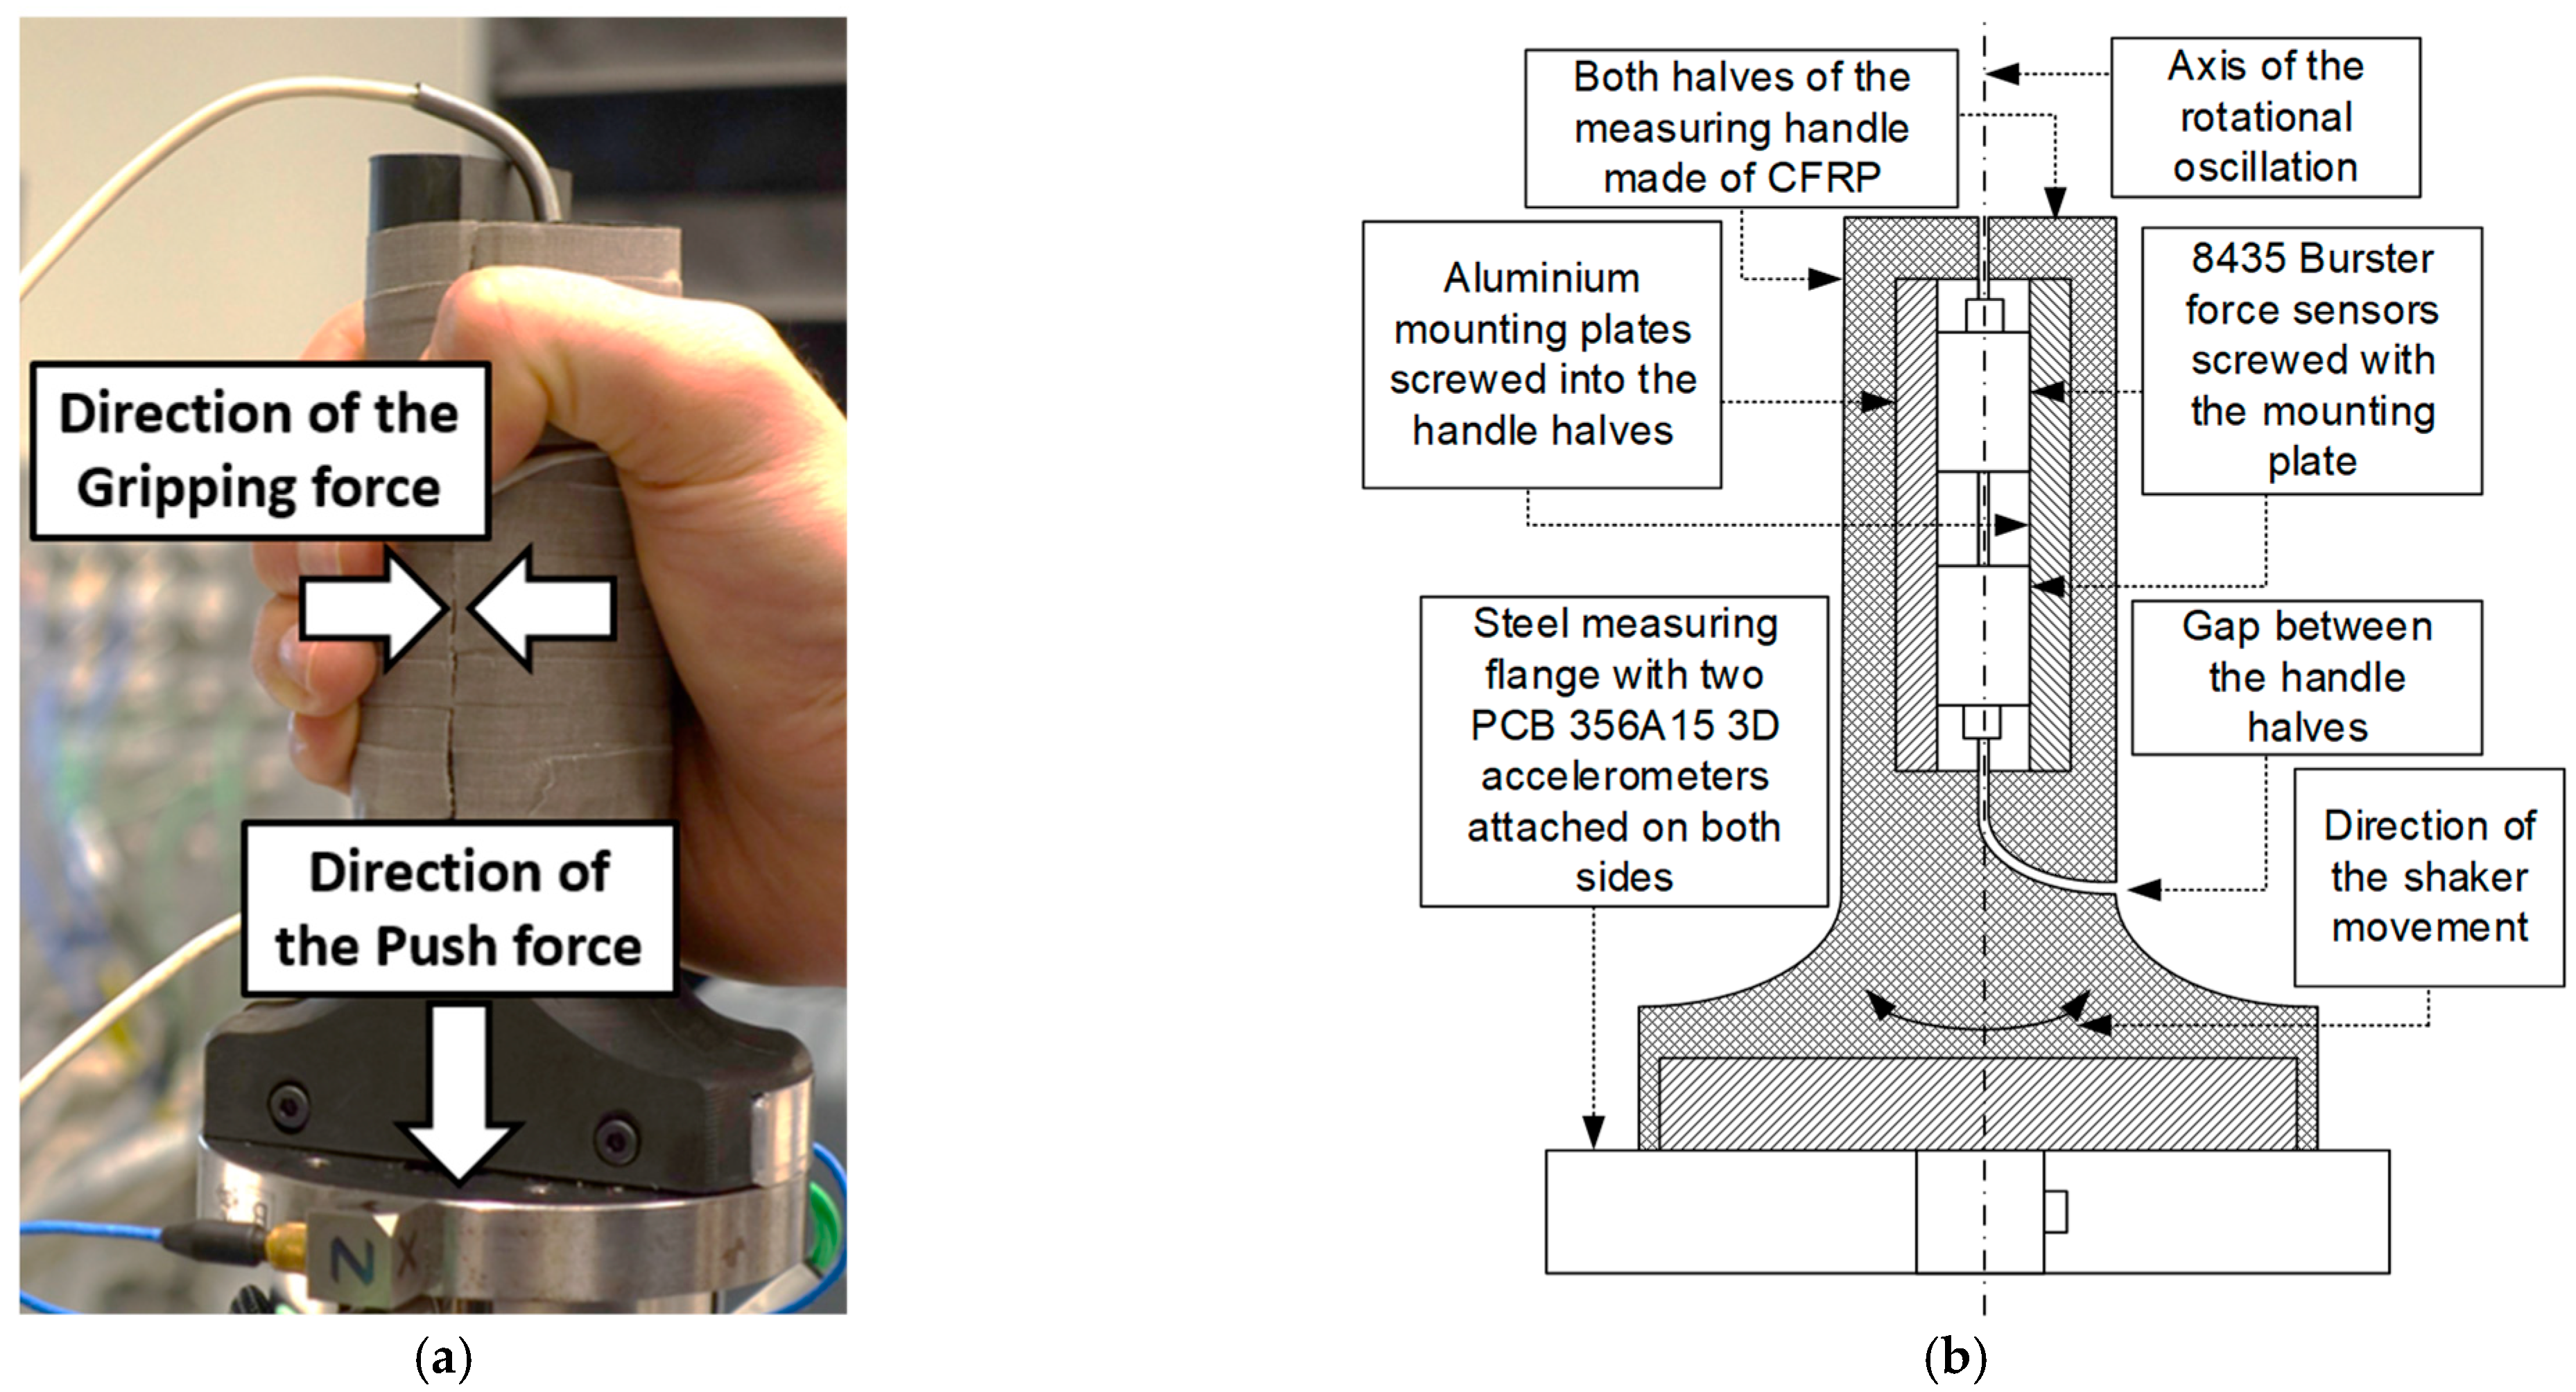
An instrumented measuring flange was attached to the output shaft. The sensors of the measuring flange consist of two 3D force transducers (9027C; Kistler Instrumente AG, Winterthur, Switzerland) and two 3D accelerometers (PCB 356A15; PCB Piezotronics, Depew, NY, USA). The force transducers can measure the torque of the provided vibrations and the push force applied by the subjects. For our study, we equipped the measuring flange with a cylindrical measuring handle, which is depicted in Figure 3. According to the measurement handle design proposed in ISO 10819, we measured the gripping force of the subject by dividing the handle into two half-cylinders and placing two force sensors between them (8435, Burster GmbH & co kg, Gernsbach, Germany) [39]. As proposed in ISO 10819, the division of the cylindrical handle is oriented orthogonally to the axis of the forearm when the handle is gripped. To produce rotational vibration around the yh-axis according to the coordinate system in Figure 1 from ISO 10068, a handle connection position different from that in ISO 10819 was used. ISO 10819 proposes a connection position at the front of the cylindrical handle in the extension of the forearm axis through a bracket-like support. In contrast, we connected the bottom of the cylindrical handle to the flange of the shaker. Hence, the handle oscillated rotationally around its axis when excited. Figure 3 shows a photo and a schematic of the measuring handle used in the study.
As visible in Figure 3, the measuring handle was wrapped with adhesive tape. This was necessary to increase the friction of the handle’s surface. To calibrate the measuring handle, we measured the apparent mass of the unloaded measuring handle with the same frequency spectrum and acceleration magnitudes that we later used in the study. The applied frequency spectrum is based on the spectrum described in ISO 10068 and consists of the third octave band frequencies of up to 100 Hz. The pre-studies showed that exciting the measuring handle with a constant acceleration magnitude across the entire frequency spectrum results in a rapid angular deflection of the measuring handle at low frequencies. Due to this angular deflection, subjects had difficulty applying a constant gripping force to the handle at low frequencies. On the other hand, a low acceleration amplitude at high frequencies was very difficult to detect amongst the measurement noise. As a result, the excitation magnitude was adjusted to the applied frequencies to match the subjects’ abilities. Therefore, the applied acceleration was increased approximately linearly from an RMS value of 3.2 m s 2 (67.6 r a d s 2 ) at 10 Hz to up to an RMS value of 50 m s 2 (1027.5 r a d s 2 ) at 100 Hz. A similar acceleration profile has already been used by Schröder et al., (2022) and Lindenmann et al., (2019), who also adjusted the applied acceleration magnitude to the frequency spectrum due to the rapid angular motion of the handle at low frequencies [33,34]. Furthermore, comparable approaches were also used in translational MI measurements [31,40]. The calibration of the measuring handle was conducted with the same frequency-weighted magnitudes that we applied to the subjects in the study. For calibration, we vibrated the measuring handle in three trials with these frequency-weighted acceleration magnitudes. The deviation between the three trials in terms of the apparent mass and phase angle of the handle was less than 1 % at each applied frequency. Figure 4 shows the magnitude of the measuring handle’s apparent mass over the excited frequencies’ spectra and the corresponding phase angle.
Across the entire applied spectrum, the magnitude of the apparent mass in Figure 4 is constant at 1.07 10 3 N m s r a d , and the phase angle is almost constant at 0. Since both have approximately the same values at every applied frequency, no natural frequencies of the handle are excited by the applied spectrum. Thus, the measuring handle has the dynamic characteristic of a constant mass. This vibrational characteristic is suitable for the measurement of MI because it does not disturb the measurements according to its resonances.
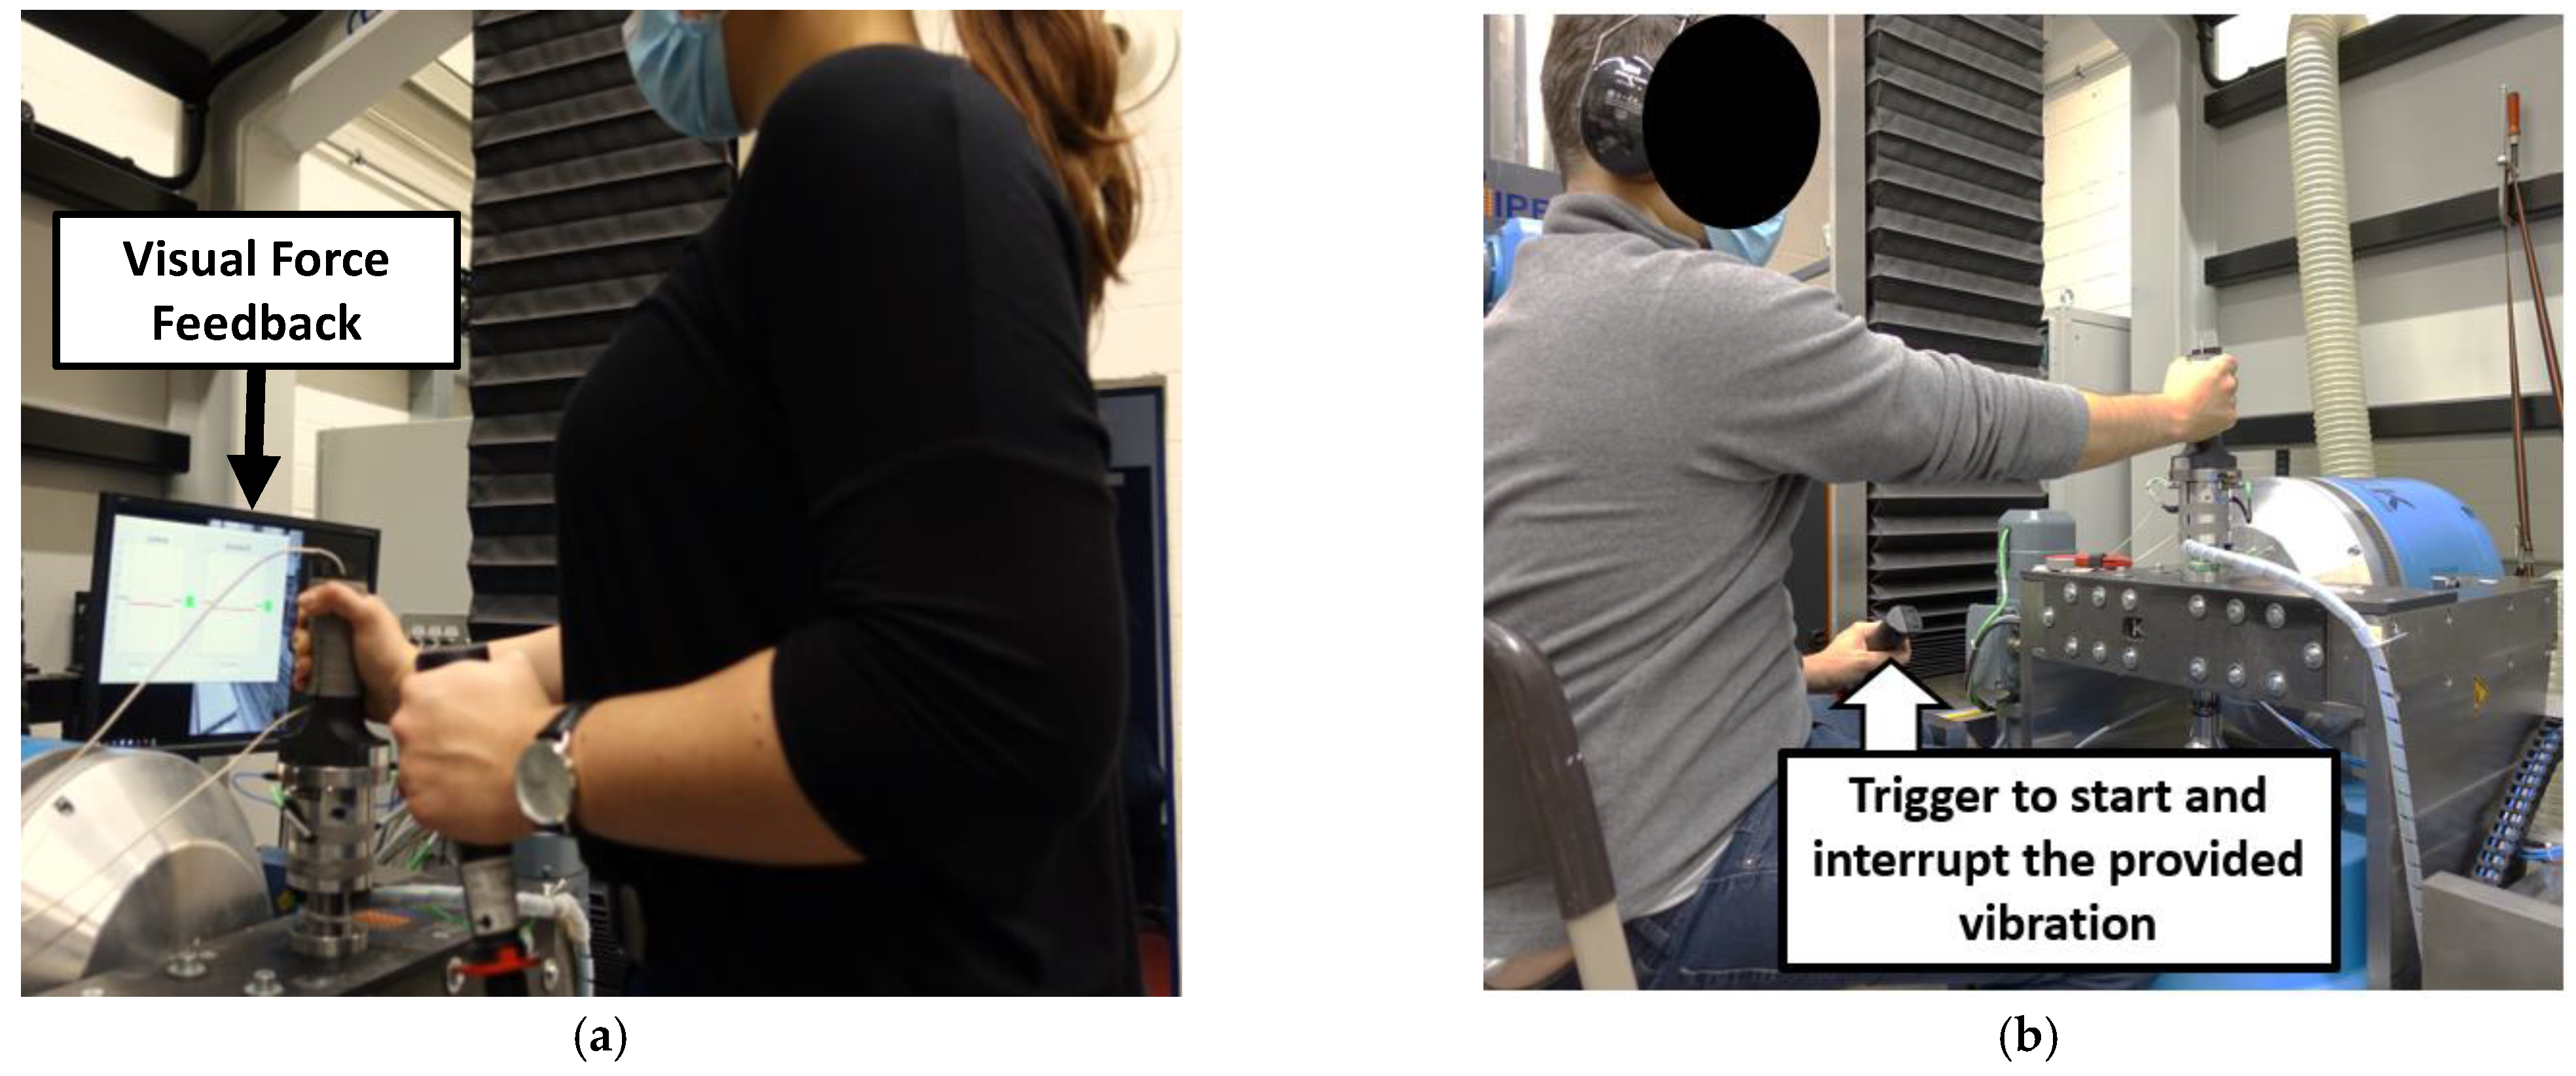
A graphical display provided visual feedback of the push force and gripping force applied to the subjects. The display, which incorporates visual force feedback, is visible in Figure 5.
The measured data were recorded using an ADwin Pro II real time measurement and control system (Jaeger Cumputergesteuerte Messtechnik GmbH, Lorsch, Germany) with a recording frequency of 10 kHz.

2.3. Test Procedure

This research complied with the tenets of the Declaration of Helsinki, and the subjects’ approval was acquired [41]. At the beginning of the test procedure, the subjects were informed about the duration and nature of the procedure. Subsequently, the anatomical and anthropometric characteristics of the subject were noted, as described in Section 2.1. The RMI values of the subject’s HASs were measured for two different body postures. The first posture corresponded to that presented in the work of Dong et al., (2006); here, the subject stood and gripped the handle with an angled arm position of ninety degrees [10]. In the second posture, the subject sat on a chair and gripped the handle with an outstretched arm. The first posture was chosen as a reference to the literature in order to achieve comparability. The second posture was based on the working position at seated workplaces when working with an inline impact wrench. In this context, the design of the test allowed for the gripping of the measuring handle in a sitting position only if the arm of the subject was extended. To keep the boundary conditions constant for each subject, we adjusted the height of the shaker to the subject’s height individually using a carrier mechanism. Both body postures are visible in Figure 5.
Before stimulating the HAS of the subjects with rotational vibrations, the maximum gripping force of each subject in both body postures was measured. Table 2 shows the distribution of the subjects’ maximum gripping forces.
In each body posture, the magnitude and phase angle of the RMI across the applied frequency spectrum was recorded for five factor combinations of gripping and push forces. Thus, the five factor combinations had a partwise full-factorial character, combining low and high gripping forces with low and high push forces and vice versa. In addition, each subject applied a factor combination of 24 N gripping force and 50 N push force to extend the number of push force levels examined and determine its influence for a wider range. No further, lower gripping force level was applied at the 50 N push force level since this push force requires a certain amount of gripping force to prevent slippage on the cylindrical grip. Table 3 provides an overview of the different factor combinations that the subjects had to perform while assuming each position.
In the sitting posture, the value of the gripping force level was increased to F g r = 10   N since most subjects were not capable of applying the factor combination of 5.5 N gripping force at 32.5 N push force to the cylindrical handle while assuming this position. The additional factor combination of 32.5 N push force and 24 N gripping force was chosen to achieve comparability with the study by Schröder et al., (2022) [34]. For each factor combination, the frequencies from Figure 4 were applied to the measuring handle in random order as single sine signals with their respective vibration magnitudes. The order of the factor combinations itself was also randomized. Each frequency had a duration of seven seconds with a subsequent pause of 5 s, resulting in 187 s per subject for 1 factor combination and a test duration of 32 min for all 10 factor combinations. To prevent subjects’ fatigue, a break of at least 10 min was taken after each factor combination. Furthermore, the subject could interrupt the vibration excitation at any time by releasing a hand trigger. When the subject pressed the trigger again, the vibration excitation continued at the point of interruption. In consideration of the users’ fatigue and the experimental time per subject, we performed only one trial per subject and factor combination. Table 4 shows the mean percentage deviation between the applied gripping and push forces and the requested force levels of the factor combinations across all frequencies and subjects. For the applied push force levels and the gripping force level of F g r = 24   N , the mean percentage deviation was calculated as a common value of both body postures.

2.4. Data Evaluation

Out of 15 subjects, we evaluated the data from 13, as two subjects ceased their participation in the experiment due to fatigue. Of the remaining 13 subjects, the RMI of the HAS was measured for 10 different factor combinations of gripping force, push force, and body posture, resulting in 130 evaluable experiments. The recorded data were evaluated using MATLAB (The MathWorks, Inc., Natick, MA, USA) and SPSS (IBM SPSS Statistics 25, IBM, Armonk, NY, USA). The calculation of the magnitude and phase angle of the RMI was conducted according to a method described by Lindenmann et al., (2019) [33]. First, the excited frequencies were determined using a fast Fourier transformation. Then, the torque and acceleration data were iteratively filtered with a Butterworth band pass filter, whose cutoff frequencies were 0.8 and 1.2 of the determined frequency, respectively. For each frequency, the filtered torque and acceleration data were fitted with a curve-fitting algorithm that determines the corresponding amplitudes as complex values. Based on the results of curve fitting, the magnitude and phase angle of the RMI were calculated for the specific frequency using equation 1. To compensate for the influence of the measuring handle on the calculated RMI, the calibrated RMI of the measuring handle from Figure 4 was subtracted from the results [27]. The calculated RMI was grouped according to the applied factor combinations in ten groups. For each group, we determined the arithmetic mean of the RMI’s magnitude and phase angle across the applied frequencies.
The Shapiro–Wilk test did not indicate a normal distribution of the calculated RMI. Therefore, we used the Mann–Whitney U test (MWU) and the Kruskal–Wallis test (KWT) in SPSS to statistically determine the influence of coupling forces and the body posture on the RMI. The significance level of the tests was α = 0.05 . The effect strength r according to Cohen (1992) was calculated, where r 0.30 was considered low, 0.30 < r < 0.50 was considered moderate, and r     0.50 was considered high [42].

3. Results

3.1. Influence of the Gripping Force on the RMI

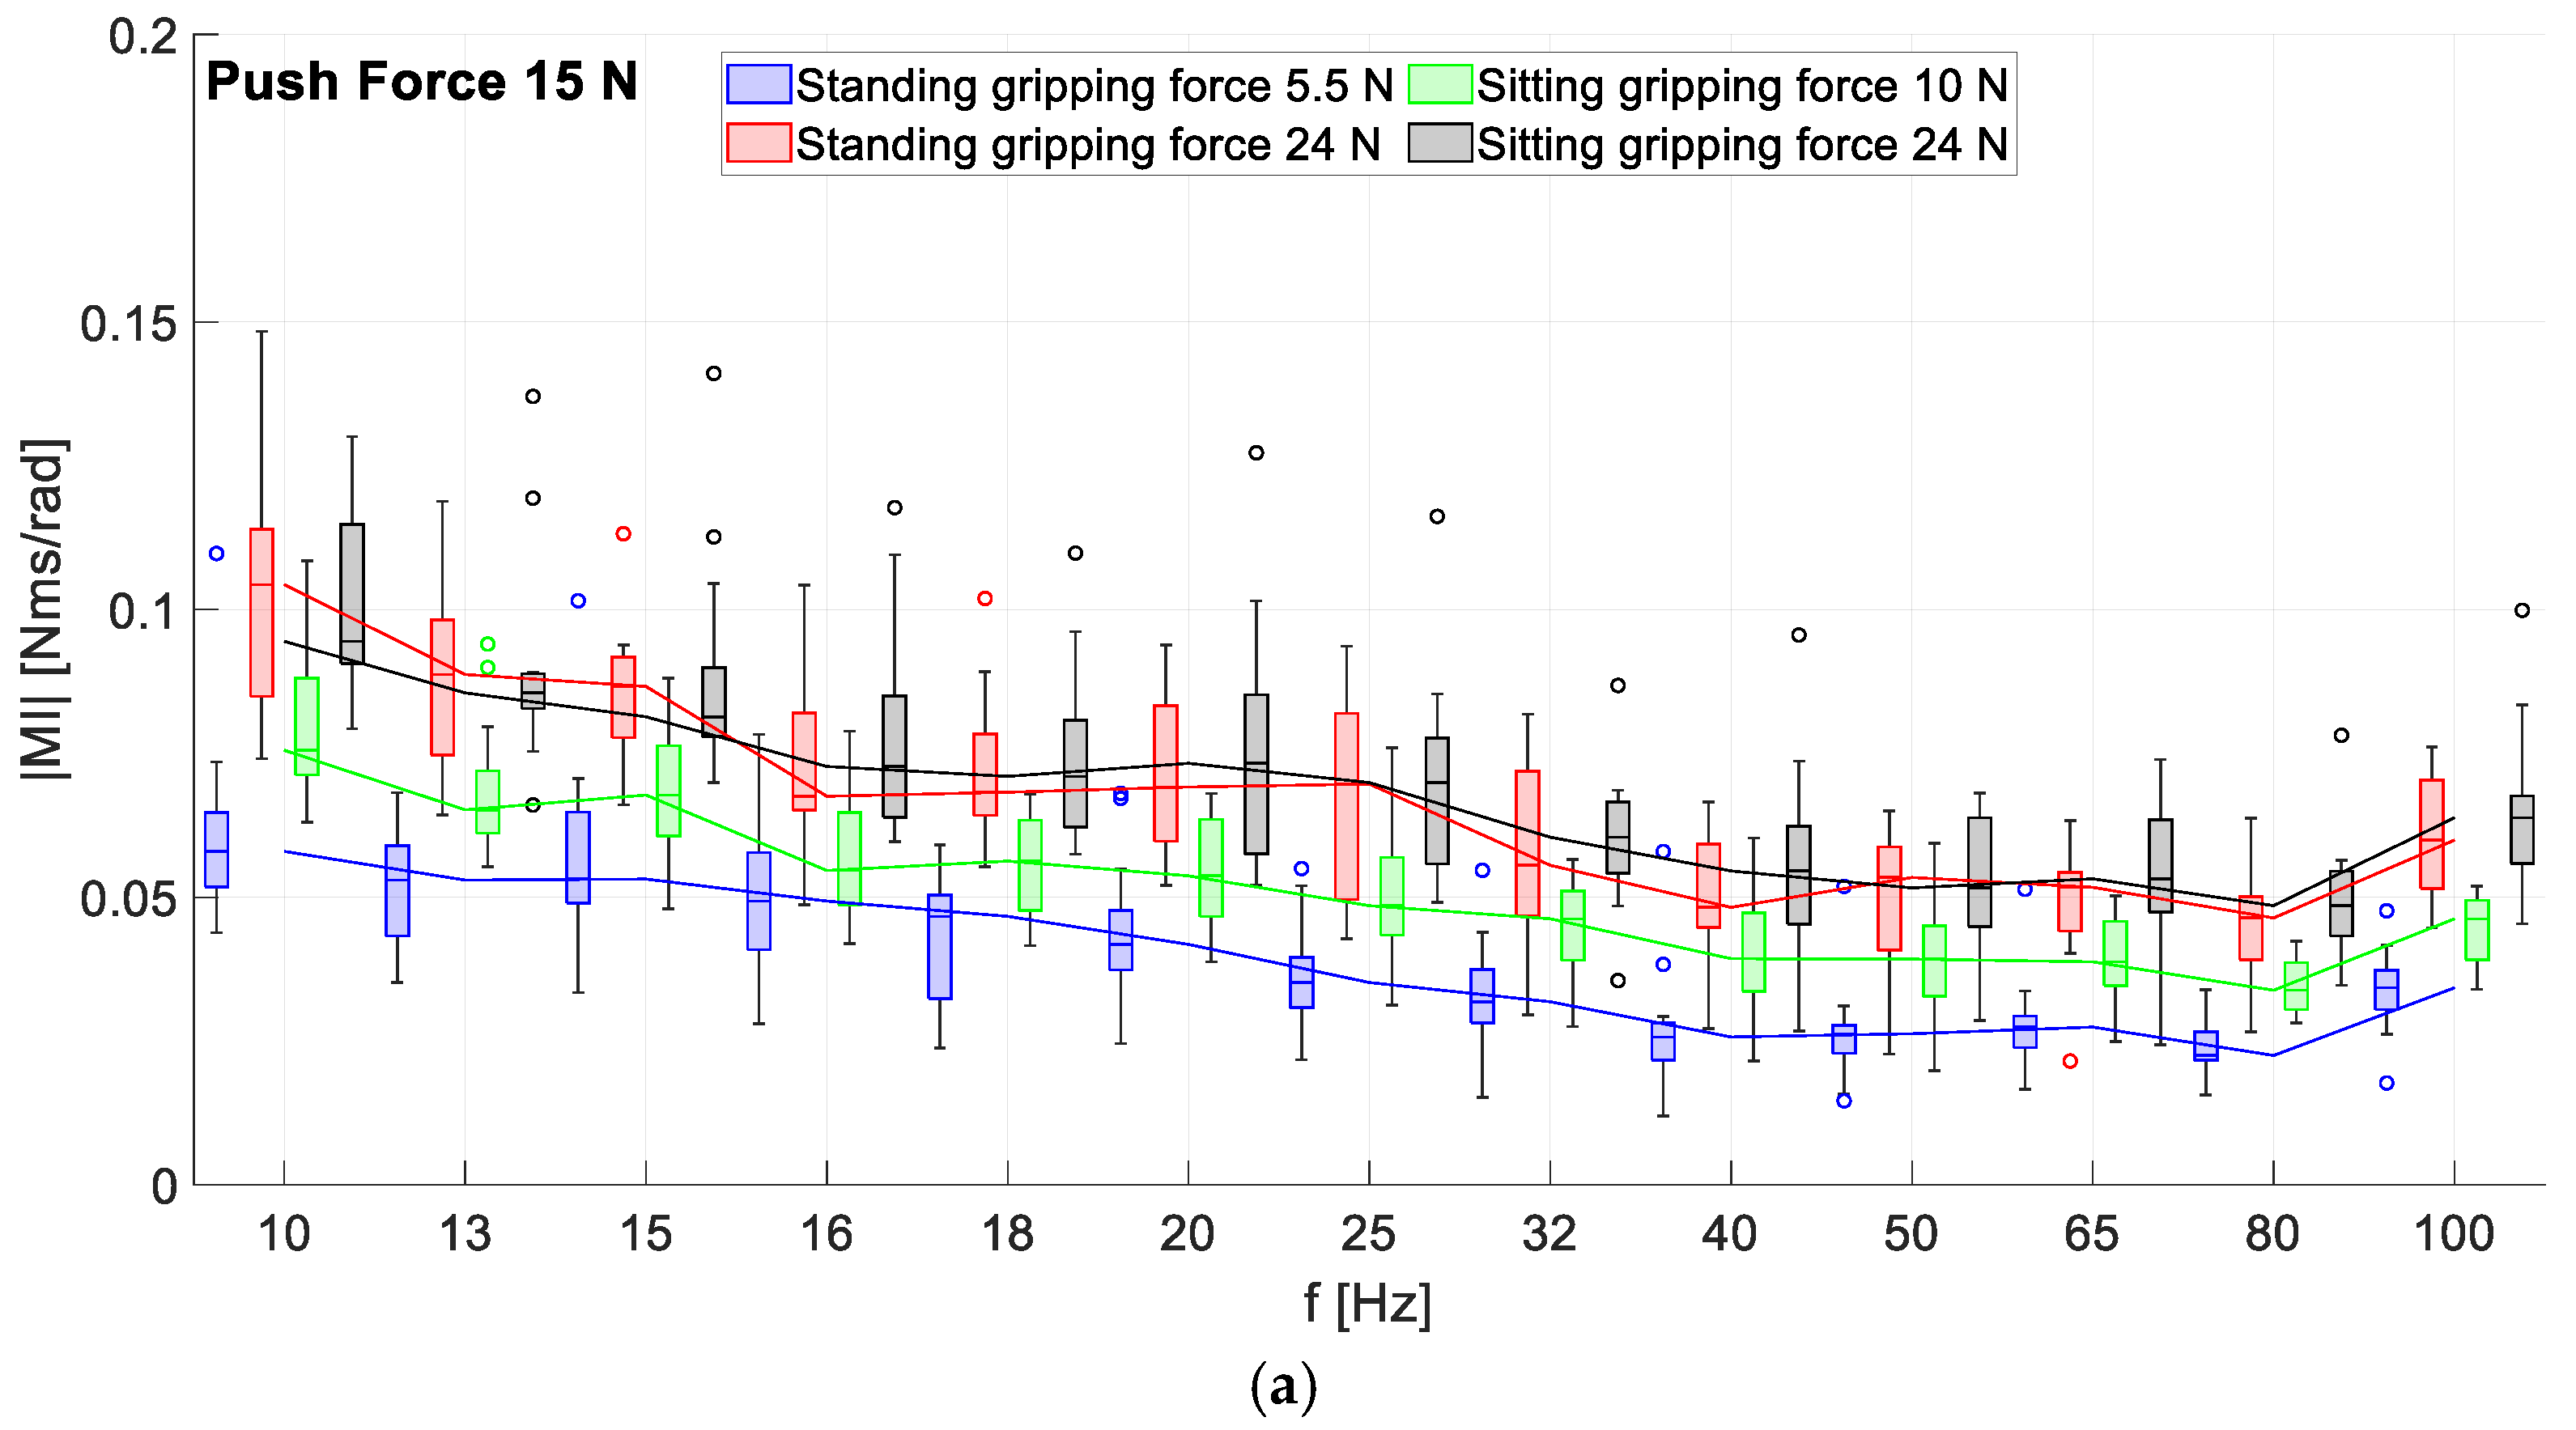
Figure 6 shows the magnitude of the RMI as boxplots at different gripping force levels applied in standing and sitting postures at push force values of F p u = 15   N and F p u = 32.5   N . Figure 7 shows the corresponding boxplots of the phase angle. The factor combination F p u = 50   N and F g r = 24   N is not shown in the figures since only one gripping force level was applied at F p u = 50   N .
For all the applied factor combinations, the magnitude trend line of the RMI in Figure 6 decreases across the frequency spectrum from 10 Hz up to 80 Hz and increases again at 80 Hz. In this case, the magnitudes at a 32.5   N push force are slightly higher overall and have a larger interquartile range than at a 15   N push force. Comparing the boxplots in Figure 6, the magnitude of the RMI increases at higher gripping force levels, being highest at a gripping force of F g r = 24   N in the sitting posture and lowest at a gripping force of F g r = 5.5   N in the standing posture.
In Figure 7, the boxplots and the trend lines of the phase angles of all the factor combinations in both plots increase slightly linearly from approximately π 3 at 10 Hz to up to π 4 at 16 Hz. Subsequently, the plots proceed to increase almost constantly to up to 80 Hz at a value of approximately π 4 . At 100 Hz, the phase angle plots of all factor combinations drop to a value of approximately π 3 . The interquartile range and height of the whiskers are roughly similar for all factor combinations and frequencies. Following the boxplots from Figure 6, Table 5 shows the results of the MWU regarding the influence of the gripping force on the RMI magnitude at the different push force levels and body postures.
For nearly all the factor combinations of push force and body posture, Table 5 shows a significant degree of causality between the gripping force and the RMI up to 100 Hz with a high effect strength. The only factor combination for which significance was not shown at the 13 Hz and 16 Hz frequencies was at a push force of F p u = 32.5   N , applied in a sitting position. The (*) at the bold p-values denotes that the influencing factor has a significant effect on the RMI.

3.2. Influence of Push Force on the RMI

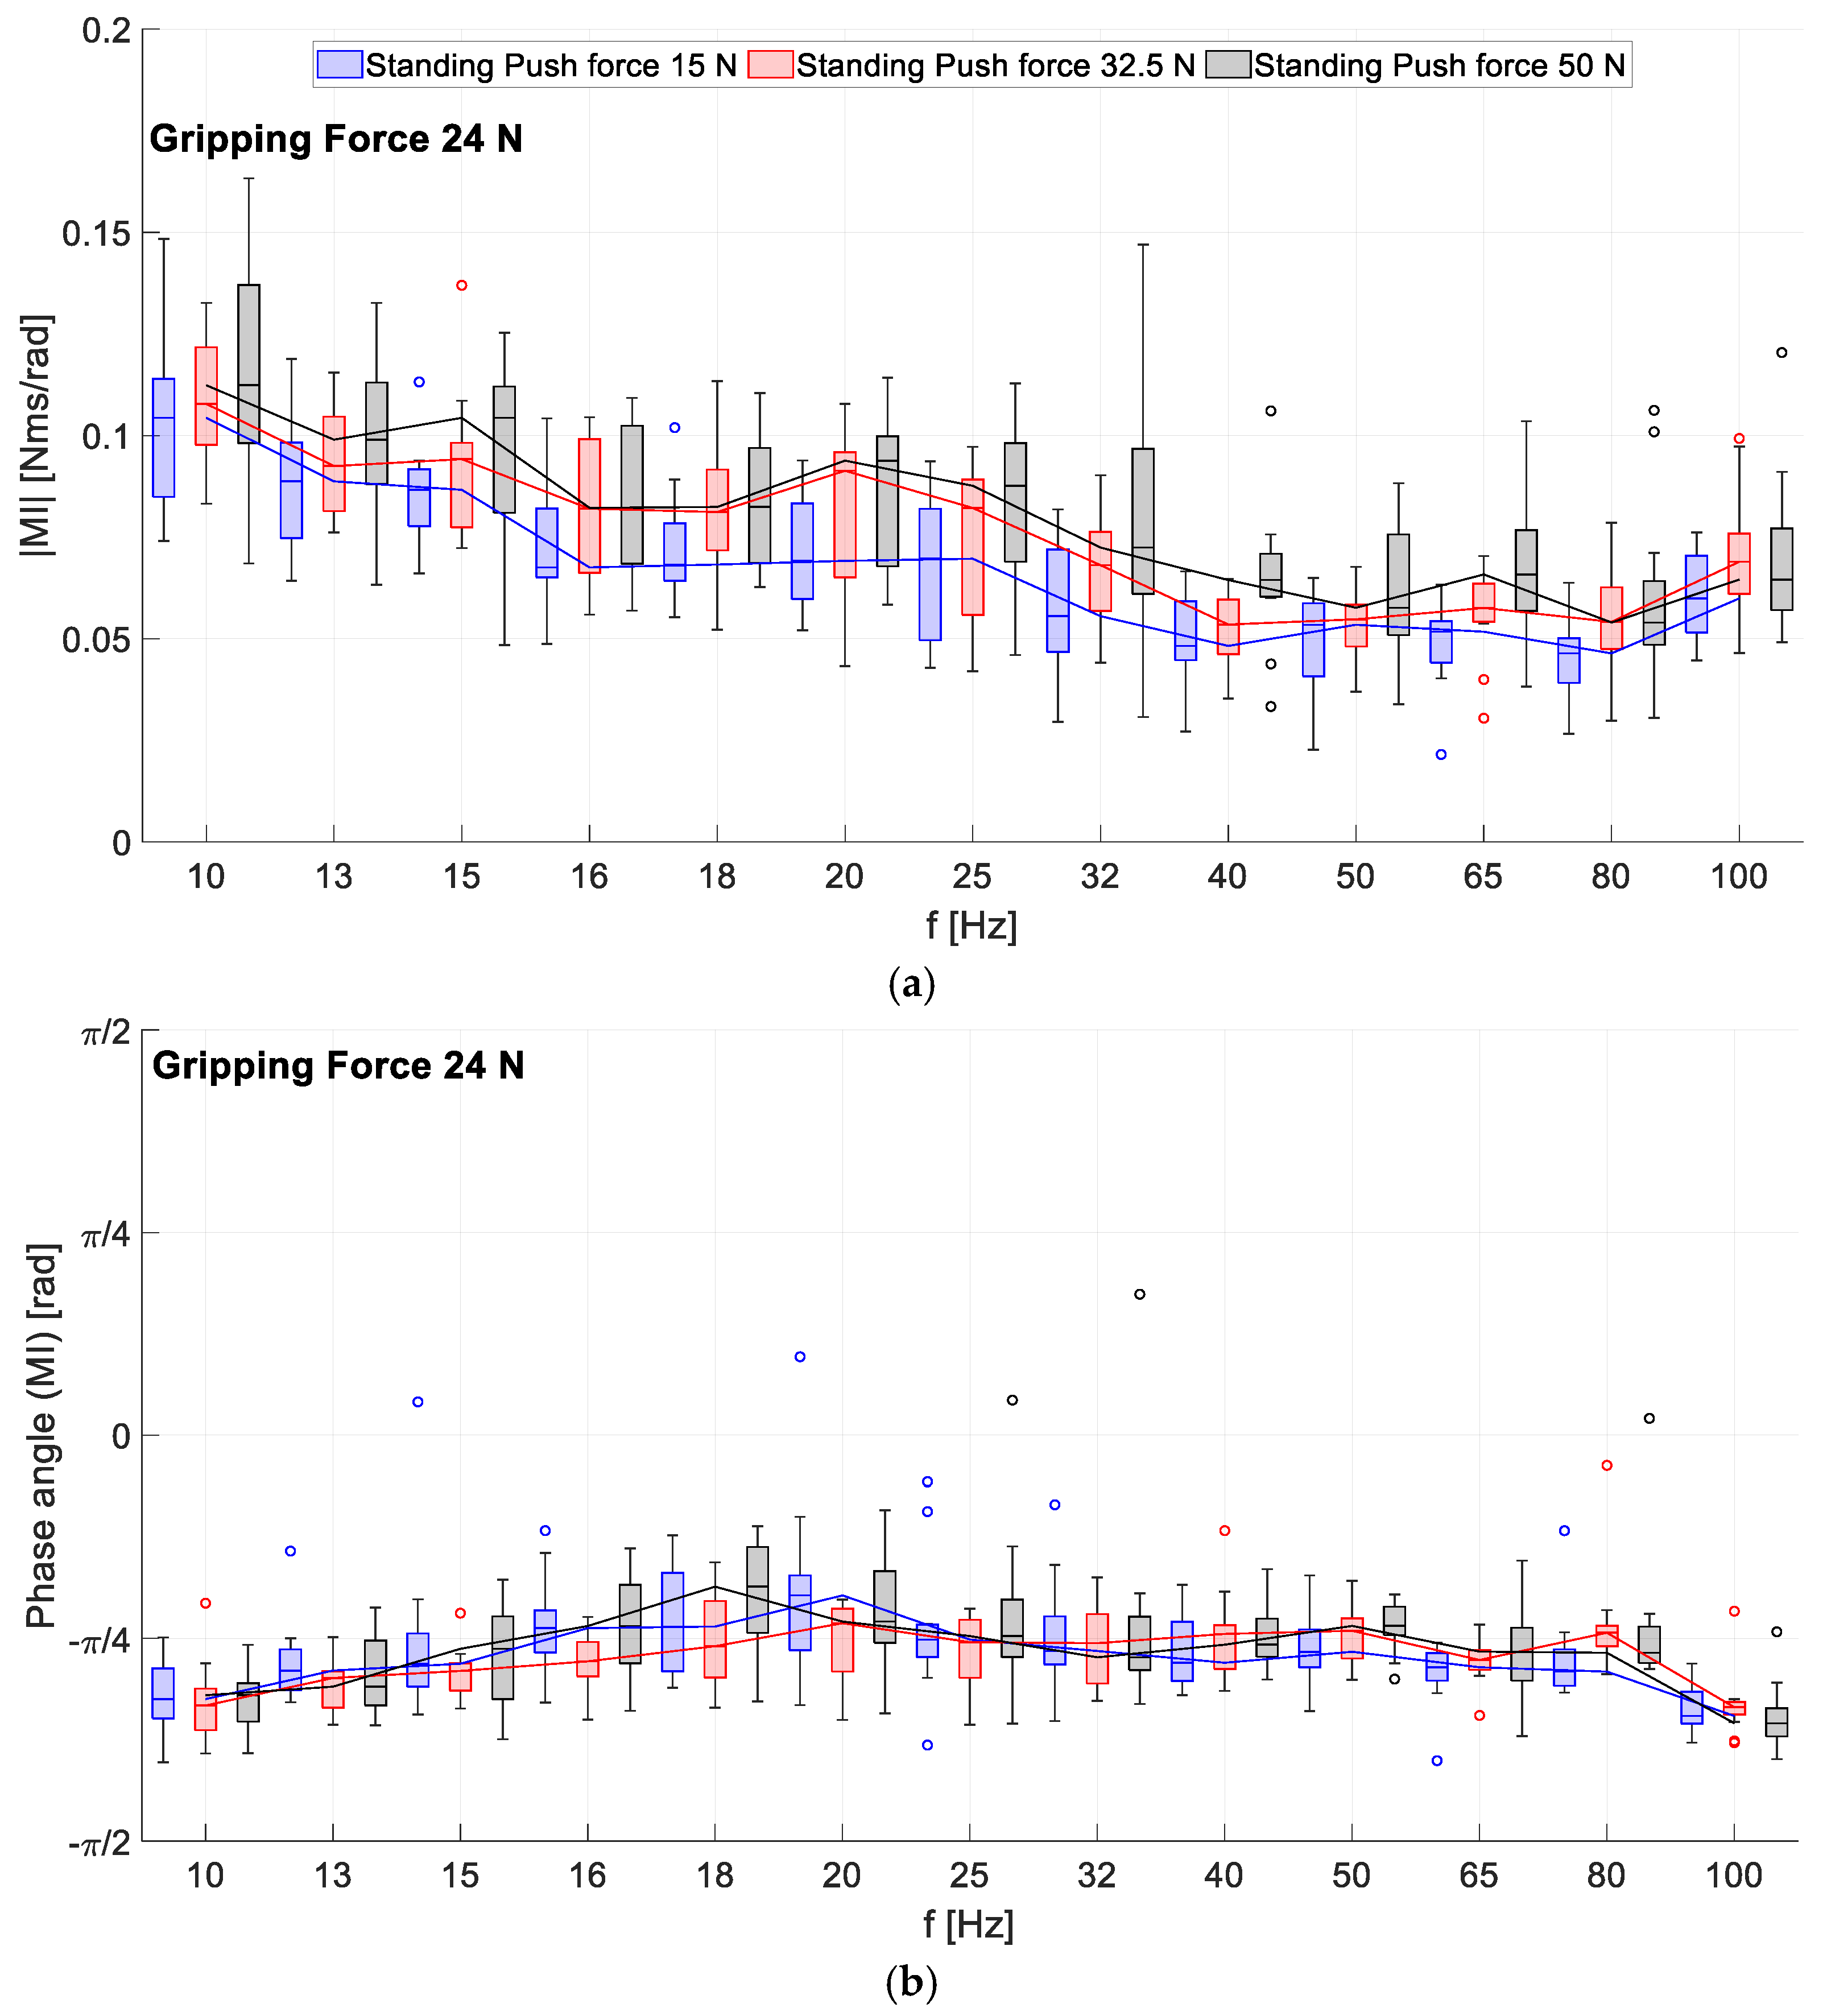
Figure 8 shows the RMI’s magnitude and phase angle for the push force levels of F p u = 15   N , F p u = 32.5   N , and F p u = 50   N at a gripping force of F g r = 24   N exerted in the standing posture as boxplots with the median plotted as a trend line. Besides the plots in Figure 8 regarding the standing body posture, the influence of the push force was also evaluated for the sitting position and a gripping force of F g r = 24   N .
In Figure 8, a slight offset between the trend lines and the boxplots of the RMI’s magnitude at a 50   N push force and at a 15   N push force is detectable across the entire spectrum. Between the push forces of F p u = 50   N and F p u = 32.5   N , no clear offset is detectable since the boxplots of both factor combinations overlap. Overall, the boxplots of the magnitude and the phase angle show larger interquartile ranges and whisker heights at higher push forces, with the boxplots at 50   N of push force showing the largest interquartile range at almost every frequency. In particular, the boxplot of the F p u = 50   N push force at 32 Hz has a relatively large whisker. Regarding the phase angle of the RMI in Figure 8, all three boxplots and the corresponding trend lines increase slightly linearly up to π 4 at 16 Hz. From 16 Hz up to 80 Hz, the phase angle plots remain nearly constant at π 4 . At 100 Hz, all three phase angle plots drop to π 3 . Regarding the applied factor combinations, the interquartile ranges and the whisker heights of the boxplots of the three phase angles do not show any general differences with respect to one another, neither in their sizes nor in their positions. To check for possible causalities between the push force and the magnitude of the RMI, a KWT was performed with the data plotted in Figure 8. The results of the KWT were only significant at the frequencies of 40 Hz, 65 Hz, and 80 Hz. A subsequent Bonferoni-corrected pairwise comparison was significant at the frequencies of 40 Hz and 65 Hz for the change of the push force from F p u = 15   N to F p u = 50   N . For the sitting posture, no influence of the push force could be detected by the KWT either, even at individual frequencies. However, the plots of the magnitude and phase angle of the RMI across the applied frequency spectrum were similar to those in Figure 8.

3.3. Influence of the Body Posture on the RMI

The boxplots in Figure 9 visualize the influence of standing and sitting postures on the magnitude and phase angle of the RMI for the factor combination of 24   N of gripping force and 50   N of push force. For the plots represented in Figure 9, the highest coupling forces were chosen to show that even with these strong couplings between the HAS and the vibration source, no influence of the body posture is visible. Nevertheless, the influence of body posture on RMI was also evaluated for lower coupling forces.
The boxplots and trend lines in Figure 9 show no distinct differences in magnitude or phase angle between the plots of the standing and sitting positions. The position, interquartile range, and whisker height of the boxplots are quite similar for both groups across the frequency spectrum. The red boxplots of the magnitude and phase angle corresponding to the standing posture shown in Figure 9 are the same as the gray boxplot shown in Figure 8 since the factor combination is the same and, consequently, the magnitude and phase angle of the RMI data are too. The whiskers of the boxplots for the sitting posture at 80 Hz and 100 Hz are also relatively large and shifted towards higher values. The courses of the phase angles’ boxplots and trend lines are quite similar for both postures: from 10 Hz to up to 16 Hz, both phase angles increase slightly to up to approximately π 4 and remain almost constant up to 80 Hz, while at 100 Hz both phase angles drop to a value of around π 3 . The results of the MWU regarding the effect of body posture on the magnitude of the RMI correspond to the plots in Figure 9, as no significances were found across the frequency spectrum. The influence of body posture on the RMI was also evaluated for the other factor combinations of the coupling forces of 32.5   N of push force and 24   N of gripping force and 15   N of push force and 24   N of gripping force. The MWU was not significant at any frequency for any of these factor combinations. In this context, the course and the distribution of the magnitude and phase angle of the RMI were also plotted for these factor combinations. Regarding the plots of the magnitude and phase angle of the RMI for these factor combinations along the applied frequency spectrum, they were similar to the ones presented in Figure 9, with lower whiskers heights at frequencies of 32 Hz, 80 Hz, and 100 Hz than in Figure 9.

4. Discussion

4.1. What Is the Course of the RMI of the HAS for Rotational Vibration Excitation around the y h -axis?

This subchapter provides a general discussion of both the RMI magnitude and phase results. First, the RMI magnitude is discussed with respect to the frequency. Then, the RMI phase angle results are discussed separately.
The interquartile range of the boxplots and the height of the whiskers of the RMI magnitude in Figure 6, Figure 7, Figure 8 and Figure 9 show a rather broad distribution of the RMI at each frequency, especially when higher coupling forces are applied. In this context, coupling forces include the gripping and push forces. This distribution may be due to the wide range of anthropometric and physical characteristics of the subjects, as suggested by the range of weights, BMI values, and anthropometric properties in Table 1. Consequently, a difference in the muscle mass and strength of the subjects can be assumed. The distribution of the maximum gripping forces of the subjects in Table 2 also supports this assumption. The interquartile range of the maximum applied gripping force in the sitting posture is about 102.5 N and about 220.5 N in the standing body posture, for which the minimum and maximum values are even more distant from each other. These differences indicate differences in the muscle mass and strength of the subjects.
Therefore, the constant application of higher coupling forces was likely more difficult for some subjects, resulting in a larger interquartile range and whisker height for the specific factor combinations. In this context, the magnitude plots of all the figures show that for factor combinations with a low gripping force level and a high push force level, the interquartile ranges and the whiskers are usually larger. These coupling-force-related differences in the distribution of the RMI magnitude can be seen in Figure 6. Here, the interquartile ranges of the RMI boxplots at the gripping forces of F g r = 5.5   N and F g r = 10   N are overall larger at a push force of F p u = 32.5   N than at the same gripping forces at a push force of F p u = 15   N . This observation could be due to the difficulty the subjects experienced in terms of applying these coupling forces, as the hand tends to slide down the surface of the cylindrical handle when it is pushed down and thus only a small gripping force is applied. Consequently, the subjects may have had more difficulty maintaining a constant push and gripping force while keeping their hands in the same position on the vibrating handle when the values of both forces were too far apart. This assumption is supported by the percentage deviations between the requested and applied coupling forces in Table 4, in which the highest mean percentage deviations of the gripping and the push force occur at the factor combination of F p u = 32.5   N and F g r = 5.5   N followed by the factor combination of F p u = 32.5   N and F g r = 10   N . As a result, it was probably more difficult for the subjects to keep the muscle tension of the HAS constant while performing these factor combinations because the muscles of the hand had to be mostly relaxed, while the upper arm muscles had to be tense. Due to this unequal distribution of muscle tension, the muscle tension had to be corrected more often by the subject, as suggested by the deviations shown in Table 4. The conscious or unconscious correction of muscle tension resulted in a changing stiffness and damping of the HAS, leading to the observed dispersion of the RMI. In the same context, high coupling forces generally seem to result in a larger interquartile range and whisker height of the RMI magnitude, as can be seen for the coupling forces of F p u = 50   N and F g r = 24   N applied while standing and sitting at the frequencies of 32 Hz, 80 Hz, and 100 Hz (Figure 9). The shift of the whiskers at 80 Hz and 100 Hz in the sitting position (Figure 9) towards higher values could indicate that the degree of coupling between the HAS and the handle is stronger. A possible explanation for this could be that in the sitting position, the requested high coupling forces were more difficult to apply at higher frequencies since the rapid handle movement made it difficult to perceive the applied forces. This difficulty in perception might have led to some subjects using excessive force and thus exceeding the requested force levels, resulting in a stronger coupling of the HAS to the handle. Additionally, the application of the coupling forces in the sitting position could be more difficult in general since each subject’s arm was stretched out. The need to adjust the gripping force level from F g r = 5.5   N to F g r = 10   N for the sitting position supports this assumption. Further evidence for this assumption is provided by the distribution of maximum gripping force values in Table 2, in which the force values are higher overall in the sitting posture.
Regarding the phase angle plots of the RMI of all factor combinations in Figure 7, Figure 8 and Figure 9, all phase angles of the RMI increase slightly linearly up to approximately π 4 at 16 Hz and, subsequently, remain constant up to 100 Hz. In Figure 7 and Figure 9, the phase angles of both factor combinations drop to approximately π 3 at 100 Hz. Overall, the courses of the phase angles indicate a spring–damper dynamic of the HAS with a slightly predominant spring component at low frequencies, which decreases to as low as 16 Hz and changes to a uniformly distributed spring–damper dynamic at a phase angle of π 4 at up to 80 Hz. At 100 Hz, the spring component increases again. The tissue of the wrist and the muscles of the forearm, which are stretched and squeezed by the vibration, possibly generate the spring component of the phase angle plots. In this context, the damper component would result from the specific combination of the rotational vibration direction and the hand orientation. The centerline of the cylindrical measuring handle is coaxial with respect to the excitation axis. Therefore, the torque of vibration acts tangentially to the surface of the palm and the fingers via the frictional contact between the hand and measuring handle. This frictional hand–handle contact may confer a damping effect. In this context, the shear of the skin and the tissue between the hand bones and the handle possibly results in the damper-dominant characteristic of the phase angle plots, as shown by the increasing phase angle between 10 Hz and 16 Hz. At higher frequencies, the frictional contact between the hand and the handle may be temporarily interrupted in some areas due to the rapidly oscillating handle movement. These temporary interruptions of hand–handle contact would also confer a damping effect as the handle slips slightly in the hand. This hypothesis could explain the damper-dominated dynamic of the phase angle beyond 16 Hz, as suggested by the increased phase angle of π 4 . Accordingly, the angular deflection of the handle at 100 Hz is possibly too small to interrupt the hand–handle contact in certain places. As a result, the damping effect of the frictional contact is reduced, and a greater degree of vibration exposure is transmitted to the wrist again. The exposure of wrist tissue would increase the spring component of the spring–damper dynamic, resulting in a decrease in the phase angle.
The obtained results largely correspond to those by presented Schröder et al., (2022), who excited the HAS with rotational vibrations up to a frequency of 250 Hz via a knob-shaped measuring handle. Therein, the same shaker test bench was used (and in the same orientation). The human hand gripped the knob-shaped handle from above. The results obtained by Schröder et al., (2022) can be compared to the results of this study since in both studies the HAS was rotationally vibrated via predominantly or exclusively frictional contact between the hand and the measuring handle. The phase angle plots presented by Schröder et al., (2022) also show a spring–damper dynamic of the HAS with a decreasing spring component at higher frequencies [34]. Specifically, the phase angle plots by Schröder et al., (2022) show a spring-dominated spring–damper dynamic of the HAS, which changes to a damping-dominated dynamic between 40 Hz and 160 Hz. Beyond 160 Hz, the degree of damping increases further and reaches full damping at 250 Hz [34]. In comparison to the results of the present study, the spring component is predominant in Schröder et al.’s (2022) phase angle plots up to 40 Hz. This difference in the results obtained could be due to the slightly different types of contact between the hand and the measuring handle in the case of a cylindrical and a knob-shaped handle. The knob-shaped measuring handle used by Schröder et al., (2022) was gripped from above in a reclining hand position, with the palm resting on the top of the handle and the fingers enclosing the elliptical geometry of the knob. In this “palm” position, the vibration is transmitted to the HAS via a combination of frictional contact and form-fitting contact between the hand and the handle. The form-fitting contact results from the elliptical geometry of the knob enclosed by the fingers, which prevents the handle from slipping to a certain extent during the propagation of rotational vibrations. Therefore, this additional form-fitting contact may enable vibration transmission to the forearm of the HAS at higher frequencies. As a result, the tissues of the wrist and the muscles of the forearm would also be exposed to higher frequency vibrations, which would increase the spring component of the phase angle at these frequencies. Consequently, the damping effect of the frictional hand–handle contact assumed from the results of the present study would only occur at a higher frequency in the case of the knob-shaped handle.
Schröder et al., (2022) adjusted the acceleration magnitude of the applied vibration in the same way as in the presented study. Therefore, the magnitude plots of the RMI of both studies are comparable. In this context, the magnitude plots of the RMI of the presented study are similar to the magnitude plots presented by Schröder et al., (2022). Since the magnitude plots of the present study correspond to the course of the phase angles and to the results presented by Schröder et al., (2022), it seems that the spring–damper dynamics of the HAS with a predominant spring component changing to a predominant damping component at high frequencies are valid. Thus, the assumed frictional damping of the vibration propagated via contact between hand and handle could also be considered plausible. When comparing the obtained plots of the phase angle of the RMI with the plots obtained by Lindenmann et al., it is evident that the phase angles differ from each other [33]. Lindenmann et al., (2019) vibrated the HAS via the measuring handle of the ISO 10819 along the z h -axis, whereas the handle geometry of the present study also corresponds to the ISO 10819 handle but was excited around the y h -axis [33,40]. The phase angle plot in the studies conducted by Lindenmann et al., (2019) also indicates a spring–damper dynamic of the HAS but with an increasing spring component in the frequency range from 10 Hz to up to 201 Hz. In the study conducted by Lindenmann et al., the vibration excitation around the z h -axis causes an exclusive form-fitting connection between the hand and the cylindrical handle since the applied torque acts normally with respect to the palm and the fingers [33]. This positive locking between the hand and the cylindrical handle results in a stronger degree of coupling between the HAS and the vibration source, as the handle cannot slip in the hand at high frequencies. Accordingly, no frictional damping of vibration can occur at high frequencies, as reported in the present study. Instead, the handle pushes with high frequency against the palm of the hand and compresses the tissue of the hand. The compression and rebound of the palm’s tissue may result in the increasing spring component that is observable at high frequencies in the phase angle plot by Lindenmann et al., (2019).
In addition, rotational excitation around the z h -axis rotates the hand around the axis of the forearm, which further involves the forearm more in this movement. This vibrational excitation of the forearm and the stronger coupling between hand and handle could be due to the spring-dominated dynamic of the HAS depicted in the phase angle plot presented by Lindenmann et al., (2019).
By comparing the obtained results with the results of Schröder et al., (2022) and Lindenmann et al., (2019), it can be concluded that the type of contact between the handle and the HAS has an influence on the vibration transmission to the HAS when it is exposed to rotational vibrations. In this context, frictional hand–handle contact appears to have a damping effect, which reduces the transmission of vibrations to the HAS.
The obtained plots of the magnitude and the phase angle of the RMI differ from those for translational excitation along the y h -axis presented in ISO 10068 [23]. For comparison, Figure 10 shows the magnitude and the phase angle plot of the MI for translational excitation along the y h -axis from ISO 10068 [23]. The phase angle plot of ISO 10068 shows that the phase angle of the MI for translational excitation along the y h -axis starts at about π 4 , at which point it decreases to slightly below 0 at 100 Hz. This course differs from the phase angle plot of the RMI and indicates mass-damper dynamics of the HAS with an increasing damping component. A possible explanation for these differences can be found by considering the excitation directions. In this study, the rotational excitation around the y h -axis rotates the measuring handle within the grip of the hand, resulting in the already-mentioned degree of frictional damping. Alternatively, the translational excitation along the y h -axis in ISO 10068 makes the hand bounce up and down. Consequently, the applied vibrational motion acts against the inertia of the HAS, thus explaining the mass component in the phase angle. Rotational vibration excitation results in the lateral flexion of the wrist, which decouples the rest of the HAS from this vibration to some extent such that the inertia of the HAS does not affect the phase angle. The phase angle plots of rotational and translational excitation both indicate a damping component. This component may result from the already-mentioned frictional damping of the hand–handle contact, which can also occur during the propagation of translational vibrations of the cylindrical handle along the y h -axis. The magnitude plots of ISO 10068 and the current study match in terms of their respective phase angle plots. In Figure 10, the increasing magnitude plot from ISO 10068 indicates mass-dominated dynamics of the HAS, thus confirming the mass component in the phase angle plot. As mentioned earlier, the magnitude plots of Figure 6 through Figure 9 indicate spring–damper dynamics of the HAS, which also match the phase angle plots of the RMI.

4.2. How Is the RMI in y h Direction Influenced by Gripping Forces?

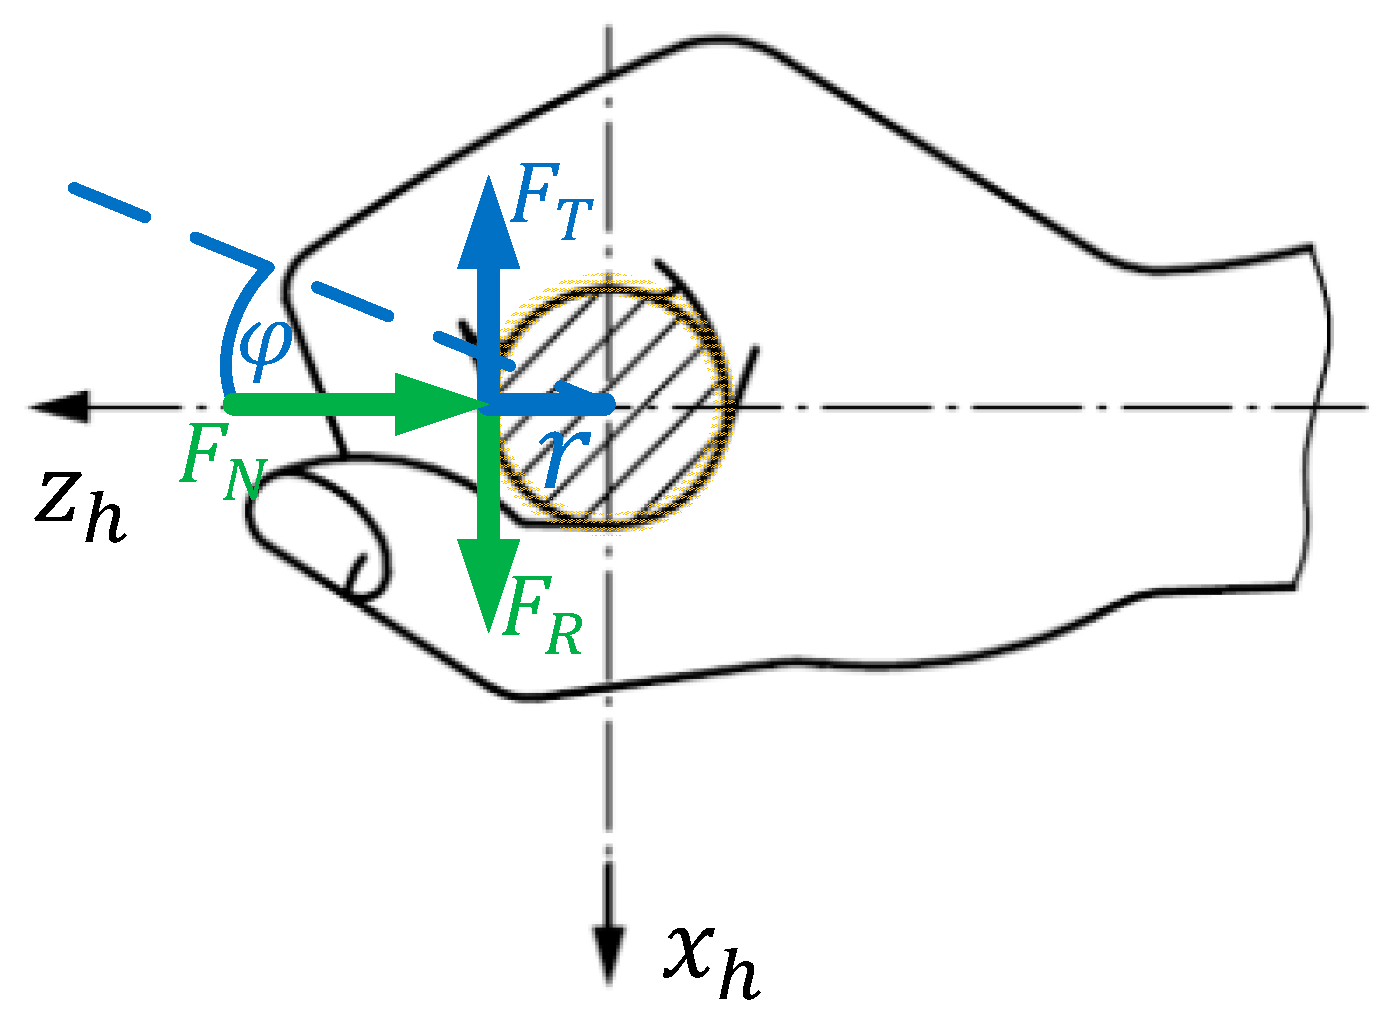
In Figure 6, the offset between the boxplots and the median trend lines of the different gripping force levels indicates that applying a higher gripping force results in a higher magnitude of the RMI. These results are supported by the results of the MWU in Table 5. According to the MWU, gripping force has a significant effect on the magnitude of the RMI, with a high positive effect strength at almost every frequency regardless of the applied push force and body posture. An explanation for these results can possibly be found in the alignment between the axis of vibration excitation and the gripping of the cylindrical measuring handle. As mentioned above, the axis of excitation of rotational vibration is coaxial with respect to the centerline of the cylindrical handle. Therefore, vibration is transmitted to the HAS via frictional contact between the handle’s surface and the hand. Consequently, a higher gripping force increases this frictional contact, resulting in better vibration transmission, which increases the magnitude of the RMI. Figure 11 graphically illustrates the described relationship between the gripping force and the rotational vibration excitation.
Following the force vectors in Figure 11, it can be seen that the tangential force F T of the rotational vibration excitation acting on the hand counteracts the frictional force F R between the hand and the handle. Since frictional force F R is a product of the friction coefficient μ h and normal force F N , which depends on gripping force F g r , the following relationship can be derived from Figure 11.
F g r = F N = F R μ h = F T μ h
As illustrated by the force arrangement shown in Figure 11 and the relationship described in equation 3, a higher gripping force results in a higher frictional force, allowing for a greater proportion of the tangential force of the vibration to be transmitted to the HAS. Consequently, the vibration exposure as well as the magnitude and HAS generate stronger vibration exposure of the HAS and a higher RMI magnitude.
Overall, the observed influence of the gripping force on the RMI corresponds to the influence of the gripping force on the translational MI [23,25,27,28,29,30,43,44]. However, the mechanisms of action leading to stronger vibration transmission of rotational vibration excitation in this study may be different from those for translational vibrations [23,25,27,28,29,30,43,44]. In the case of rotational vibration excitation, Schröder et al., (2022) also described a similar influence [34]. Hence, the observed effect of the applied gripping force on the RMI corresponds to the current literature [8,23,25,27,28,30,34,43,44].

4.3. How Is the RMI in y h Direction Influenced by Push Forces?

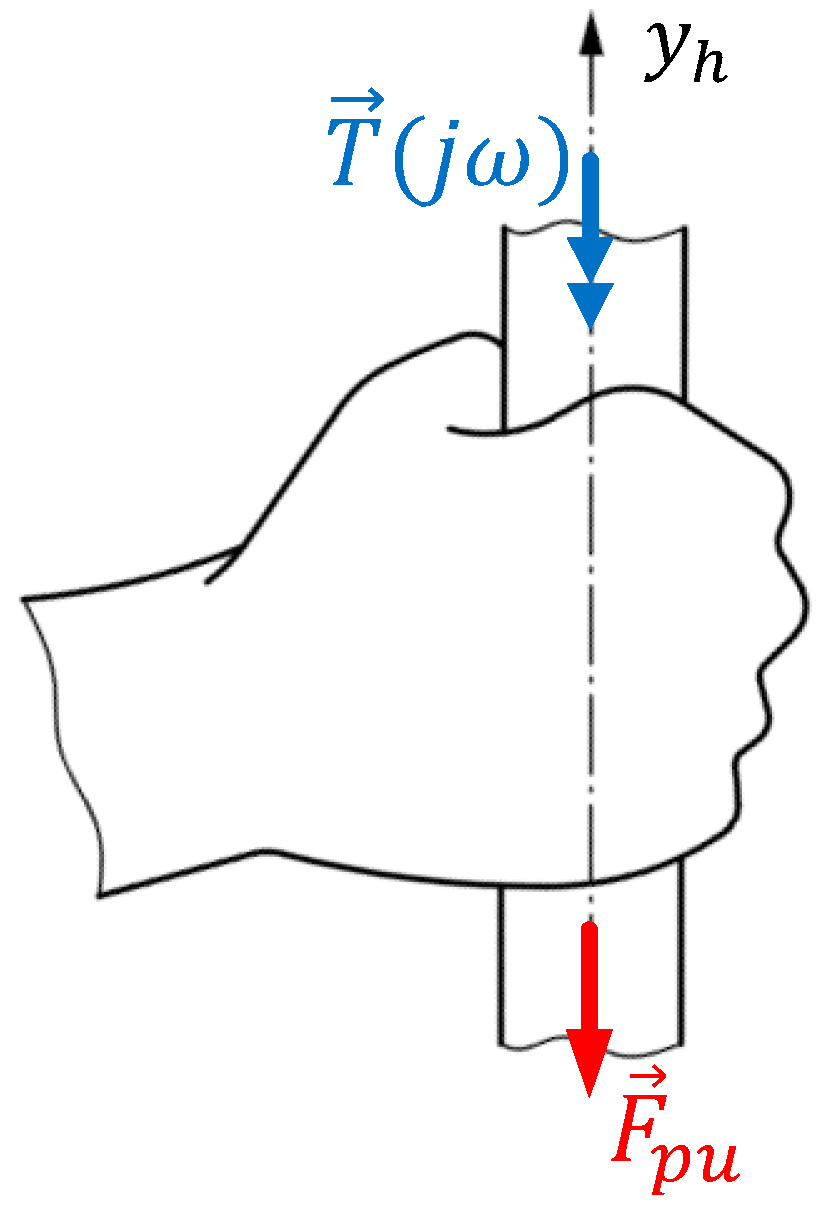
The applied push force does not appear to have any influence on the RMI, as the interquartile ranges of the boxplots for the different push force levels in Figure 8 largely overlap. The KWT results confirm this conclusion, as they showed no significant effect of the applied push force on the RMI except at frequencies of 40 Hz, 65 Hz, and 80 Hz. However, the significance of these frequencies can be neglected because they were confirmed by pairwise comparison in only two cases. Furthermore, the KWT regarding the influence of the applied push force on the RMI was also insignificant at every analyzed frequency. Therefore, a random correlation corresponding to these frequencies can be assumed. The absent influence of the push force on the RMI of the HAS can be explained by the coaxial alignment between the vector of the push force and the rotational axis of the handle’s angular oscillation. This alignment between the push force and the rotational axis for the torque applied through vibration is shown in Figure 12.
As Figure 12 shows, the push force vector is aligned coaxially with the vector of the torque of the rotational vibration acting on the hand. Thus, the push force does not counteract the tangential force resulting from the torque. Consequently, a higher push force would not lead to a stronger degree of coupling between the hand and the handle, as both force vectors are skewed with respect to one another regardless of the direction the handle moves. As a result, more pushing has little or no effect on the coupling of the HAS with the vibration source. Hence, the push force has no verifiable influence on the RMI for rotational vibration excitation around the y h -axis propagated by a cylindrical handle. These results correspond to those reported by Schröder et al., (2022) concerning the influence of the push force on the RMI in the case of vibration excitation propagated via a knob-shaped handle [34]. Nevertheless, Figure 8 shows a slight offset between the RMI’s magnitudes at the push forces of F p u = 15   N and F p u = 50   N as well as F p u = 32.5   N and F p u = 50   N in the frequency range between 25 Hz and 80 Hz, respectively. This offset could be due to the positioning of the hand, as the hand may slip down the cylindrical handle a little, especially with high push forces. This sliding can cause parts of the edge of the hand to lightly touch the flange to which the handle is attached when high push force is applied. This would slightly change the contact area between the hand and the handle, resulting in the observed selective offset of the RMI’s magnitude for higher push forces.

4.4. How Is the RMI in y h Direction Influenced by Body Posture?

The overlapping interquartile ranges of the boxplots and the median trend lines of the magnitude of the RMI in Figure 9 indicate that body posture does not influence RMI. This conclusion is supported by the results of the KWT, which do not indicate any significant effect of body posture on the RMI regardless of the applied coupling forces. These results do not correspond with the influence of posture on translational MI described in the literature [13,23,25,29,33]. A possible explanation for the absence of an effect conferred by body posture in the case of rotational vibration excitation can be found by considering the rotational excitation direction and the positioning of the hand. As mentioned above, the overall phase angle and magnitude plots led to the hypothesis that the HAS had a spring–damper dynamic. According to this hypothesis, the tissue of the wrist and the forearm could generate a spring component, while damping can occur partly because of the frictional contact between the hand and the measuring handle. Assuming this hypothesis is correct, the wrist would compensate for vibrations via lateral flexion as the hand follows the motion of the vibrating handle. This flexion would involve the tissue of the wrist and the forearm, as indicated by the described spring component of the phase angle plots. The described frictional hand–handle contact would additionally dampen the transmission of vibrations to the HAS. Since the mobility of the wrist allows the hand to follow the movement of the measuring handle up to a certain frequency and the frictional “hand-grip” position additionally dampens vibration excitation, it is possible that the generated vibrations are not transmitted to the rest of the hand–arm system and the body. Consequently, the RMI of the HAS would not be affected by the stiffness or mass of the upper arm or the body. Therefore, body posture would not influence the RMI.

4.5. Relevance of the Results to Industrial Applications

The results of this study extend the body of knowledge regarding the MI of the HAS by providing an approach to the biodynamics of the HAS for rotational vibration excitation, which could be extended by further studies to increase the database concerning the RMI of the HAS. In this context, a larger database would enable the more extensive parametrization of rotational HAMs. These HAMs could be added to the translational models of ISO 10068 to represent the excitation of the HAS by rotational vibrations. For industrial purposes, such models can be used for the validation and simulation of vibrational human–machine interactions, such as in the development of power tools that transmit rotational vibrations. Furthermore, the results are also relevant in the field of vibration-related occupational health and safety as well as the design of handles for power tools. In this context, the results suggest that a mainly frictional type of contact between hand and handle may reduce the vibrational exposure of the HAS, as the friction between the hand and the handle imparts an additional degree of damping. Regarding the vibration-related occupational health and safety of industrial assembly tasks, power tools with a primarily rotational excitation direction and a cylindrical handle, such as the inline air impact wrench, could confer vibration-damping properties due to friction related to hand positioning. However, these assumed damping properties would depend on the applied gripping force, for which a lower gripping force would result in less coupling between the hand and the vibration source. The push force, on the other hand, does not seem to have any influence on the RMI of the HAS as long as it is applied coaxially with respect to the excitation axis of the rotational vibration. In this context, the use of an inline impact wrench with a cylindrical handle aligned coaxially with the axis of rotation would possibly be preferable to an impact wrench with a pistol-grip in terms of occupational protection. The results of this study may also form the basis for the design of power tool handles that transmit rotational vibrations. A handle design based mainly on frictional contact between the user’s hand and the handle could potentially expose the HAS to less vibration due to frictional damping. Although such a handle design could reduce the vibrational exposure of the HAS, the positioning of the power tool and the force transmission between the user and the power tool must also be considered, for which positive locking might be a better solution.

5. Limitations

The results concerning the progression of the RMI and the influences of coupling forces and body posture are limited in terms of their validity for the applied frequency spectrum of up to 100 Hz. Therefore, frequencies beyond 100 Hz need to be investigated in further studies. Accordingly, a preliminary investigation of the natural frequencies for the combination of a handle and the HAS under rotational vibration excitation is required. Other limiting factors that must be considered include the number of subjects and the fact that each subject could only perform one trial per factor combination due to the test’s duration and the subjects’ fatigue. These limiting factors can be compensated to a certain extent by the fact that the observations and conclusions drawn from the results can be found for different factor combinations, resulting in a larger volume of data on which to base these findings. The plots of the magnitude and phase angle of the RMI are qualitatively similar for all the factor combinations. Consequently, the conclusions drawn from the course of magnitude and phase angle are based on the plots of each factor combination, resulting in ten plots per subject. The influence of the gripping force on the magnitude of the RMI could also be determined for different push forces and body postures. Since no influence of the push force and body posture on the RMI could be determined, the influence of the gripping force on the RMI can thus be derived from four data sets per subject. In the same manner, the influence of push force and body posture also could not be determined for the sitting position or different coupling forces. Consequently, the observation that the push force or the body posture do not influence RMI is based on two and five data sets per subject, respectively. Nevertheless, in further studies, the number of subjects as well as the number of trials per subject should be increased to confirm the results of this study by using a broader database. In this context, the present study provides an initial exploratory approach covering a broad range of potential factors influencing the RMI. Based on the results of this study, the number of factor combinations can be reduced in future studies on the same excitation direction because factors that do not appear to influence the RMI do not need to be varied. Reducing the variable factors would result in a shorter test duration, thereby enabling more trials per subject and a larger number of subjects.

6. Conclusions

The results of this study contribute to the investigation of the biodynamics of the HAS, as the measured RMI of the HAS indicates a spring–damper characteristic for rotational vibration excitation around the y h -axis. Furthermore, the magnitudes and the phase angles of the RMI indicate that when a rotational vibration is transmitted to the HAS via frictional contact between the hand and a cylindrical measuring handle, this frictional contact is likely to have a damping effect on the transmitted vibration. In this context, the applied gripping force has a significant influence on the magnitude of the RMI of the HAS, as a stronger gripping force increases the friction between the hand and the handle. This influence could be shown qualitatively and statistically for up to 100 Hz with a strong positive effect strength regardless of the applied push force and the posture of the subject. Regarding the push force and body posture, no similar influence on the RMI could be shown. This absent influence could be due to the alignment between the positioning of the hand and the vibration excitation axis. Both the influence of the gripping force on the RMI and the lack of influence of the push force confirm the results obtained by Schröder et al., (2022). In this context, the hypothesis concerning the effect of frictionally engaged gripping positions on vibration transmission reported by Schröder et al., (2022) could also be confirmed through the results obtained.
Nevertheless, the observed influences of the coupling force and the body posture on the RMI of the HAS need to be further investigated for other excitation directions and hand positions as well as for the frequency spectrum beyond 100 Hz. In this context, this study constitutes an initial approach to investigating the RMI of the HAS and its influencing factors under rotational vibration excitation along the y h -axis. Figure 13 summarizes the findings regarding the influence of gripping and pressing force, which result from the positioning of the hand and the vibration excitation axis, based on Figure 11 and Figure 12.

Author Contributions

Conceptualization, T.S. and A.L.; methodology, T.S.; software, T.S. and A.L.; validation, T.S. and A.L.; formal analysis, T.S.; investigation, T.S.; resources, S.M.; data curation, T.S.; writing—original draft preparation, T.S.; writing—review and editing, A.L.; visualization, T.S.; supervision, S.M.; project administration, S.M.; funding acquisition, S.M. All authors have read and agreed to the published version of the manuscript.

Funding

This work was funded by the Deutsche Forschungsgemeinschaft (German Research Foundation—DFG) through funding of the test equipment under proposals 275571425 and 408254169, as well as the development of the measurement method under proposal 408254169. The research results are the sole responsibility of the authors and do not represent the official opinion of the DFG.

Data Availability Statement

The data presented in this study are available on request from the corresponding author. The data are not publicly available due to the amount of data, which is approximately 80.2 GB.

Acknowledgments

This work was supported by the German research foundation Deutsche Forschungsgemeinschaft (DFG) under the funding numbers 408254169 and 275571425. The authors of this publication are responsible for its content. We want to thank the DFG for funding and supporting our research, thereby enabling this publication. We would like to emphasize that the presented results and conclusions do not necessarily reflect the opinion of the DFG.

Conflicts of Interest

The authors declare no conflict of interest. The funders had no role in the design of the study; in the collection, analyses, or interpretation of data; in the writing of the manuscript; or in the decision to publish the results.

References

  1. Krajnak, K. Health effects associated with occupational exposure to hand-arm or whole body vibration. J. Toxicol. Environ. Health 2018, 21, 320–334. [Google Scholar] [CrossRef] [PubMed]
  2. Bovenzi, M. Hand-arm vibration syndrome and dose-response relation for vibration induced white finger among quarry drillers and stonecarvers. Italian Study Group on Physical Hazards in the Stone Industry. Occup. Environ. Med. 1994, 51, 603–611. [Google Scholar] [CrossRef] [PubMed] [Green Version]
  3. Edwards, D.J.; Rillie, I.; Chileshe, N.; Lai, J.; Hosseini, M.R.; Thwala, W.D.D. A field survey of hand–arm vibration exposure in the UK utilities sector. Eng. Constr. Arch. Manag. 2020, 27, 2179–2198. [Google Scholar] [CrossRef]
  4. Rashid, Z.; Shafiq, M.; Cocca, P.; Marciano, F.; Tayyab, A. Hand Arm Vibration, Grip Strength Assessment and the Prevalence of Health Disorders Among Stone Crushing Workers. Adv. Intell. Syst. Comput. 2017. [Google Scholar] [CrossRef]
  5. Vihlborg, P.; Bryngelsson, I.-L.; Lindgren, B.; Gunnarsson, L.G.; Graff, P. Association between vibration exposure and hand-arm vibration symptoms in a Swedish mechanical industry. Int. J. Ind. Ergon. 2017, 62, 77–81. [Google Scholar] [CrossRef]
  6. Rademacher, A.; Küffer, G.; Spengel, F. Vibration white finger-Syndrom bei acht Schleifern eines großen metallverarbeitenden Betriebes. Med. Klinik 1993, 10, 568–570. [Google Scholar] [CrossRef]
  7. Verberk, M.M.; Sallé, H.J.; Kempers, O. Vibratory and tactile sense of the fingers after working with sanders. Int. Arch. Occup. Environ. Health 1985, 56, 217–223. [Google Scholar] [CrossRef]
  8. Lindenmann, A.; Uhl, M.; Gwosch, T.; Matthiesen, S. The influence of human interaction on the vibration of hand-held human-machine systems—The effect of body posture, feed force, and gripping forces on the vibration of hammer drills. Appl. Ergon. 2021, 95, 103430. [Google Scholar] [CrossRef]
  9. Dong, R.G.; Welcome, D.E.; McDowell, T.W.; Wu, J.Z. Modeling of the biodynamic responses distributed at the fingers and palm of the hand in three orthogonal directions. J. Sound Vib. 2013, 332, 1125–1140. [Google Scholar] [CrossRef] [Green Version]
  10. Dong, R.G.; Welcome, D.E.; McCormick, R.E. 3-D laboratory simulation of hand-transmitted vibration. In Proceedings of the 13th Japan Group Meeting on Human Responses to Vibration, Osaka, Japan, 3–5 August 2006. [Google Scholar]
  11. Rakheja, S.; Wu, J.; Dong, R.; Schopper, A.; Boileau, P. A Comparison of biodynamic Models of the human Hand–Arm System for Applications to Hand-held Power Tools. J. Sound Vib. 2002, 249, 55–82. [Google Scholar] [CrossRef]
  12. Cronjäger, L.; Jahn, R.; Riederer, H. Entwicklung eines Versuchsstandes zur reproduzierbaren Messung der Vibration schlagender handgeführter Maschinen. In Development of a Test Bench for the Reproducible Measurement of the Vibration of Hand Held Percussive Machines; Springer: Berlin/Heidelberg, Germany, 1984. [Google Scholar]
  13. Adewusi, S.; Rakheja, S.; Marcotte, P. Biomechanical models of the human hand-arm to simulate distributed biodynamic responses for different postures. Int. J. Ind. Ergon. 2012, 42, 249–260. [Google Scholar] [CrossRef]
  14. Dong, R.G.; Welcome, D.E.; Wu, J.Z.; McDowell, T.W. Development of hand-arm system models for vibrating tool analysis and test rig construction. Noise Control Eng. J. 2008, 56, 35–44. [Google Scholar] [CrossRef]
  15. Marcotte, P.; Boutin, J.; Jasinski, J. Development of a hand-arm mechanical analogue for evaluating chipping hammer vibration emission values. J. Sound Vib. 2010, 329, 1968–1980. [Google Scholar] [CrossRef]
  16. Lin, J.H.; Radwin, R.G.; Richard, T.G. A single-degree-of-freedom dynamic model predicts the range of human responses to impulsive forces produced by power hand tools. J. Biomech. 2003, 36, 1845–1852. [Google Scholar] [CrossRef] [PubMed]
  17. Rakheja, S.; Gurram, R.; Gouw, G.J. Development of linear and nonlinear hand-arm vibration models using optimization and linearization techniques. J. Biomech. 1993, 26, 1253–1260. [Google Scholar] [CrossRef]
  18. Rempel, D.; Barr, A.; Antonucci, A. A New Test Bench System for Hammer Drills: Validation for Handle Vibration. Int. J. Ind. Ergon. 2017, 62, 17–20. [Google Scholar] [CrossRef]
  19. Rempel, D.; Barr, A.; Antonucci, A. Evaluation of Handle Vibration for Hammer Drills Using A New Test Bench System. In Proceedings of the 13th International Conference on Hand-Arm Vibration, Beijing, China, 13–16 October 2015. [Google Scholar]
  20. Radwin, R.G.; Armstrong, T.J. Assessment of hand vibration exposure on an assembly line. Am. Ind. Hyg. Assoc. J. 1985, 46, 211–219. [Google Scholar] [CrossRef]
  21. Mangold, S. Erfassung heterogener passiver Anwendereigenschaften und deren Abbildung in einem einstellbaren Hand-Arm Modell am Beispiel eines Impulsschraubers: Acquisition of user’s heterogeneous biodynamic response and possibilities to model those in an adjustable hand-arm model using the example of an impulse wrench. In Forschungsberichte des IPEK—Institut für Produktentwicklung; Albers, A., Matthiesen, S., Eds.; IPEK–Institut für Produktentwicklung am KIT: Karlsruhe, Germany, 2019. [Google Scholar]
  22. Matysek, M.; Kern, T.A. Entwicklung Haptischer Geräte: Ein Einstieg für Ingenieure. In Haptic Device Development: An Introduction for Engineers; Springer: Berlin/Heidelberg, Germany, 2009. [Google Scholar]
  23. ISO 10068:2012(E); Mechanical Vibration and Shock—Mechanical Impedance of the Human Hand-Arm System at the Driving Point. ISO—International Organization for Standardization: Geneva, Switzerland, 2012.
  24. DIN EN ISO 5349-1:2001-12; Mechanische Schwingungen—Messung und Bewertung der Einwirkung von Schwingungen auf das Hand-Arm-System des Menschen Teil 1: Allgemeine Anforderungen: Mechanical vibration—Measurement and evaluation of human exposure—Part 1: General requirements, 5349–1. DIN Deutsches Institut für Normung e. V.: Berlin, Germany, 2001.
  25. Aldien, Y.; Marcotte, P.; Rakheja, S.; Boileau, P.-E. Mechanical Impedance and Absorbed Power of Hand-Arm under xh-Axis Vibration and Role of Hand Forces and Posture. Ind. Health 2005, 43, 495–508. [Google Scholar] [CrossRef] [Green Version]
  26. Dong, R.G.; Welcome, D.E.; Xu, X.S.; Warren, C.; McDowell, T.W.; Wu, J.Z.; Rakheja, S. Mechanical impedances distributed at the fingers and palm of the human hand in three orthogonal directions. J. Sound Vib. 2012, 331, 1191–1206. [Google Scholar] [CrossRef] [Green Version]
  27. Dong, R.G.; Welcome, D.E.; McDowell, T.W.; Wu, J.Z. Measurement of biodynamic response of human hand-arm system. J. Sound Vib. 2006, 294, 807–827. [Google Scholar] [CrossRef]
  28. Dong, R.G.; Welcome, D.E.; Wu, J.Z. Estimation of Biodynamic Forces Distributed on the Fingers and the Palm Exposed to Vibration. Ind. Health 2005, 43, 485–494. [Google Scholar] [CrossRef] [PubMed] [Green Version]
  29. Aldien, Y.; Marcotte, P.; Rakheja, S.; Boileau, P.-E. Influence of hand-arm posture on biodynamic response of the human hand-arm exposed to zh-axis vibration. Int. J. Ind. Ergon. 2006, 36, 45–59. [Google Scholar] [CrossRef]
  30. Xu, X.S.; Welcome, D.E.; McDowell, T.W.; Wu, J.Z.; Wimer, B.; Warren, C.; Dong, R.G. The vibration transmissibility and driving-point biodynamic response of the hand exposed to vibration normal to the palm. Int. J. Ind. Ergon. 2011, 41, 418–427. [Google Scholar] [CrossRef]
  31. Burström, L. The influence of biodynamic factors on the mechanical impedance of the hand and arm. Int. Arch. Occup. Environ. Health 1997, 69, 437–446. [Google Scholar] [CrossRef] [PubMed]
  32. Kalra, M.; Rakheja, S.; Marcotte, P.; Dewangan, K.N.; Adewusi, S. Measurement of coupling forces at the power tool handle-hand interface. Int. J. Ind. Ergon. 2015, 50, 105–120. [Google Scholar] [CrossRef]
  33. Lindenmann, A.; Matthiesen, S. The Rotational Mechanical Impedance of the Hand-Arm System—A Preliminary Study. In Proceedings of the 14th International Conference on Hand-Arm-Vibration, Nancy, France, 6–9 June 2019; pp. 75–76. Available online: https://publikationen.bibliothek.kit.edu/1000095936 (accessed on 24 June 2022).
  34. Schröder, T.; Lindenmann, A.; Resch, A.; Matthiesen, S.; Gwosch, T. Influence of Coupling Forces on the Rotational Hand-Arm Impedance in xh direction. Int. J. Ind. Ergon. 2023. [Google Scholar] [CrossRef]
  35. DIN EN ISO 7250-1:2017; Basic Human Body Measurements for Technological Design—Part 1: Body Measurement Definitions and Landmarks. DIN—Deutsches Institut für Normung: Berlin, Germany, 2017.
  36. DIN CEN ISO 7250-2; Wesentliche Maße des Menschlichen Körpers Für Die technische Gestaltung—Teil 2: Anthropometrische Datenbanken Einzelner Nationaler: Basic Human Body Measurements for Technological Design. DIN Deutsches Institut für Normung e. V.: Berlin, Germany; ISO—International Organization for Standardization: Berlin, Germany, 2013.
  37. Matthiesen, S.; Lindenmann, A.; Bruchmueller, T. Anforderungen an ein Messsystem zur Ermittlung der Rotationsimpedanz von Hand-Arm Systemen. Humanschwingungen 2018, 2018, 91–106. [Google Scholar]
  38. Lindenmann, A.; Schröder, T.; Germann, R.; Gwosch, T.; Matthiesen, S. Effect of high level grip-and push force and elevated arm posture on the zh-axis hand-arm impedance. Int. J. Ind. Ergon. 2022, 92, 103375. [Google Scholar] [CrossRef]
  39. ISO 10819:2012-7; Mechanical Vibration and Shock—Hand-Arm Vibration—Measurement and Evaluation of the Vibration Transmissibility of Gloves at the Palm of the Hand. ISO—International Organization for Standardization: Geneva, Switzerland, 2013.
  40. DIN EN ISO 10819:2019-5; Mechanische Schwingungen und Stöße—Hand-Arm-Schwingungen—Messung und Bewertung der Schwingungsübertragung von Handschuhen in der Handfläche: Mechanical Vibration and Shock—Hand-Arm Vibration—Measurement and Evaluation of Glove Palm Vibration Transmission. DIN Deutsches Institut für Normung e. V.: Berlin, Germany, 2019.
  41. World Medical Association. Declaration of Helsinki. 2013. Available online: https://www.uni-goettingen.de/de/document/download/a91ef4324cf47306d6dbf334687e70dc.pdf/helsinki.pdf (accessed on 17 May 2022).
  42. Cohen, J. Quantitative methods in psychology: A power primer. Psychol. Bull. 1992, 155–159. Available online: http://citeseerx.ist.psu.edu/viewdoc/summary?doi=10.1.1.1043.9095 (accessed on 12 October 2022). [CrossRef]
  43. Dong, R.G.; Rakheja, S.; Schopper, A.W.; Han, B.; Smutz, W.P. Hand-transmitted vibration and biodynamic response of the human hand-arm: A critical review. Crit. Rev. Biomed. Eng. 2001, 29, 393–439. [Google Scholar] [CrossRef]
  44. ISO 15230:2007(E); Mechanical Vibration and ShockCoupling forces at the Man-Machine Interface for Hand-Transmitted Vibration. ISO—International Organization for Standardization: Geneva, Switzerland, 2007.
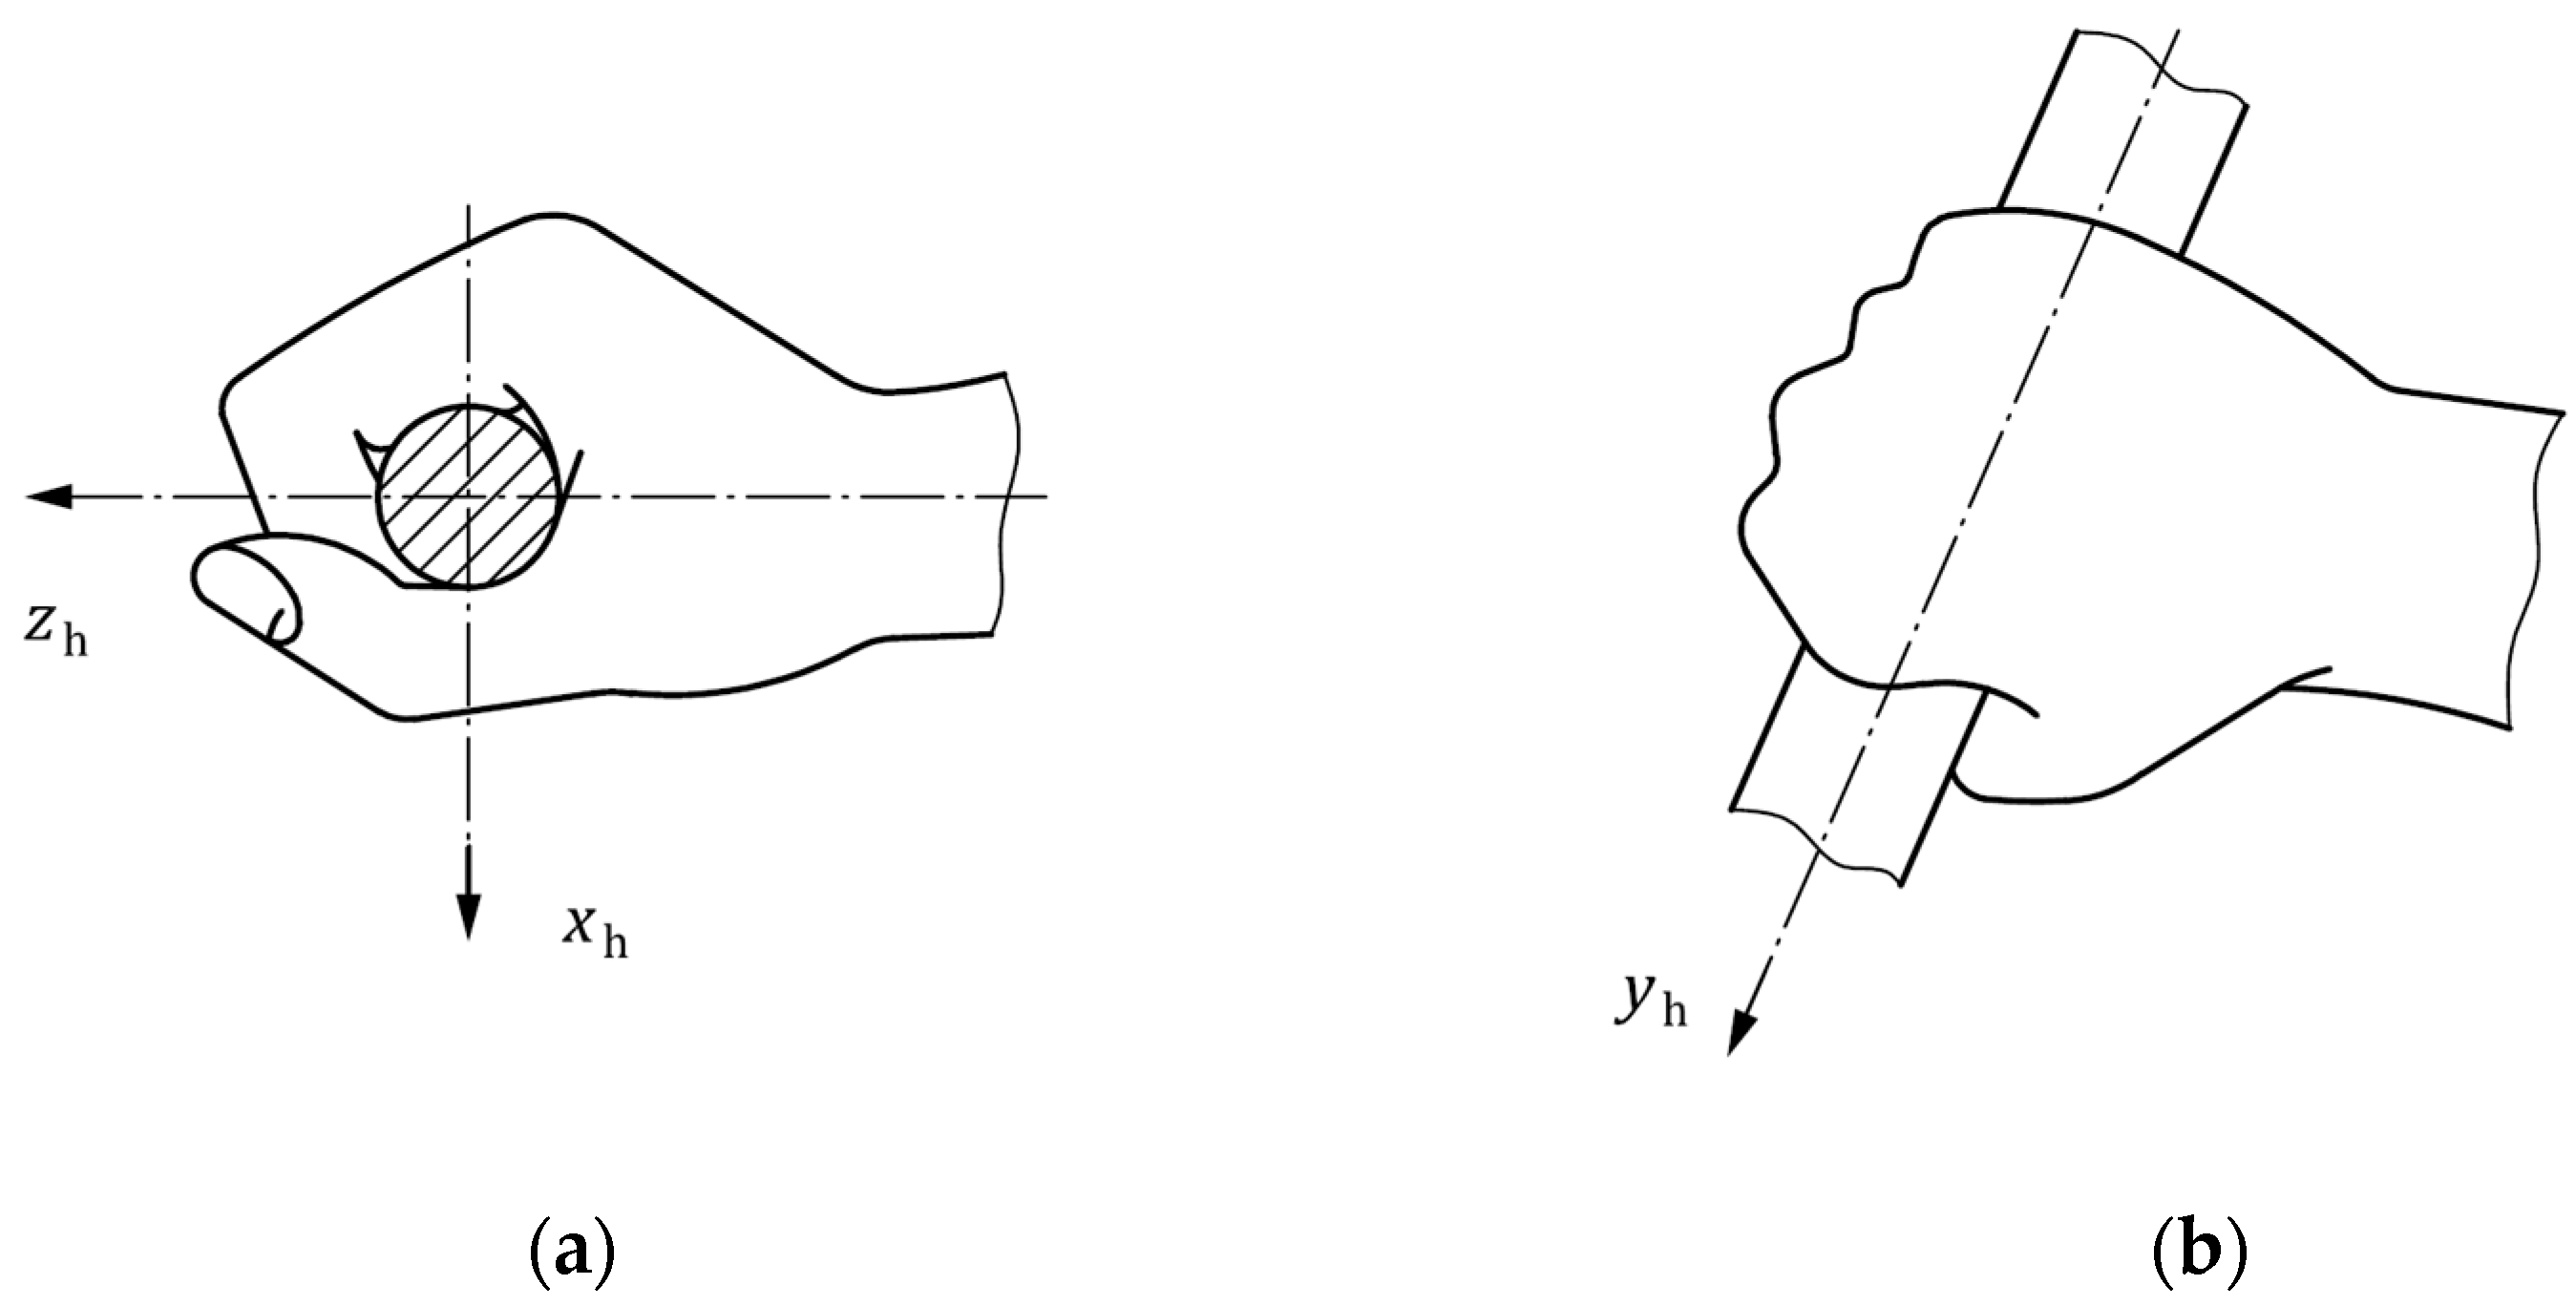
Figure 1. Basic centric coordinate system defined in ISO 10068 for vibrational excitation of the HAS in the enclosing “hand-grip” position [23]. (a) Top view of the “hand-grip” position; (b) Side view of the “hand-grip” position.
Vibration 06 00023 g001
Figure 2. Illustrations of the carrier mechanism and the shaker system. Key: 1. Frame, 2. holder of the shakers, 3. electric motor for height adjustment, 4. electric motor for tilt angle adjustment, 5. translational shaker, 6. rotational shaker, 7. measuring handle, 8. rack and pinion gear, and 9. measuring flange.
Vibration 06 00023 g002
Figure 3. (a): A photo of the handle used in this study. (b): A schematic of the measuring handle.
Vibration 06 00023 g003
Figure 4. Calibration measurement of the measuring handle’s apparent mass determined for the frequencies excited in the study. The magnitude (a) and phase angle (b) of the apparent mass indicated the dynamic characteristic of a constant mass without any natural frequencies, as their values are almost the same for every excited frequency.
Vibration 06 00023 g004
Figure 5. Body postures in which the RMI of the subjects was measured: standing posture with angled arm (a), and sitting with extended arm (b). The left side also shows the display with the visual force feedback.
Vibration 06 00023 g005
Figure 6. Boxplots and median trend lines of the magnitude of the RMI at gripping forces of F g r = 5.5   N and F g r = 24   N (standing posture) and F g r = 10   N (sitting posture) at a push force of F p u = 15   N (a) and F p u = 32.5   N (b).
Vibration 06 00023 g006aVibration 06 00023 g006b
Figure 7. Boxplots and median trend lines of the RMI phase angle for gripping forces of F g r = 5.5   N and F g r = 24   N (standing posture) and F g r = 10   N (sitting posture) at a push force of F p u = 15   N (a) and F p u = 32.5   N (b).
Vibration 06 00023 g007
Figure 8. Boxplots and median trend lines of the RMI’s magnitude (a) and phase angle (b) for push forces of 15 N, 32.5 N, and 50 N at a gripping force of F g r = 24   N exerted in the standing posture.
Vibration 06 00023 g008
Figure 9. Boxplots and median trend line of the RMI’s magnitude (a) and phase angle (b) for the standing and sitting postures at a push force of F p u = 50   N and a gripping force of F p u = 24   N .
Vibration 06 00023 g009
Figure 10. (a): Magnitude plot of the MI for vibration excitation along the y h -axis from ISO 10068. (b): Phase angle plot of the MI for vibration excitation along the y h -axis from ISO 10068. Key: X: frequency (Hz); Y1: modulus (corresponds to the magnitude) N s m ; Y2: phase angel (degree) [23].
Vibration 06 00023 g010
Figure 11. Schematic of the relationship between hand position and rotational axis on the basis of the “hand-grip” position from ISO 10068, where yellow indicates contact surface between hand and handle, blue indicates deflection angle and tangential force of excitation, and green indicates normal and friction force, resulting from the gripping force of the test subject [23]. Key: r = radius of the handle, φ = deflection angle of rotational vibration excitation, F T = tangential force on the handle surface conferred by rotational vibration excitation acting on the HAS, F N = normal force, and F R = frictional force.
Vibration 06 00023 g011
Figure 12. Schematic drawing of the relationship between the rotational axis and the direction of the push force on the basis of the “hand-grip” position from ISO 10068, where blue indicates torque of the rotational vibration excitation and red indicates the push force applied by the subject [23]. Key: F p u = push force; T(jω) = torque of the rotational vibration excitation acting on the hand.
Vibration 06 00023 g012
Figure 13. (a) Top view from Figure 11, where yellow indicates contact surface between hand and handle, blue indicates deflection angle and tangential force of excitation, and green indicates normal and frictional force resulting from the gripping force of the test subject. (b) Side view from Figure 12, where blue indicates torque of the rotational vibration excitation and red indicates push force applied by the subject. Key: r = radius of the handle, φ = deflection angle of the rotational vibration excitation, F T = tangential force on the handle’s surface conferred by rotational vibration excitation acting on the HAS, F N = normal force, F R = frictional force, F p u = push force, and T(jω) = torque of the rotational vibration excitation acting on the hand.
Vibration 06 00023 g013
Table 1. Median, upper, and lower quartiles of the subjects’ anthropometric properties.
Arm
Length (cm)
Vibration 06 00023 i001
Forearm Length (cm)
Vibration 06 00023 i002
Thumb
Length (mm)
Vibration 06 00023 i003
Hand
Length (mm)
Vibration 06 00023 i004
Palm
Length (mm)
Vibration 06 00023 i005
Hand
Width (mm)
Vibration 06 00023 i006
Median76377019510585
5th percentile68.531.4651739376
95th percentile81.4417920511595
Table 2. Distribution of the maximum gripping forces of the subjects in each body posture.
Body PostureMinimumLower QuartileMedianUpper QuartileMaximum
Sitting 153.0 N316.4 N411.7 N418.9 N556.6 N
Standing148.1 N189.0 N351.6 N409.2 N611.3 N
Table 3. Overview of the different factor combinations assessed in this study.
LevelBody Posture Gripping   Force   ( F g r ) Push   Force   ( F p u )
Full factorial
1Standing F g r = 5.5   N F p u = 15   N
2 F g r = 24   N F p u = 32.5   N
3 F g r = 24   N F p u = 50   N
Full factorial
1Sitting F g r = 10   N F p u = 15   N
2 F g r = 24   N F p u = 32.5   N
3 F g r = 24   N F p u = 50   N
Table 4. Mean percentage deviation between the applied gripping and push forces and the predefined force levels across all frequencies and subjects. Gripping force: F g r ; push force: F p u .
Specified Coupling Forces F p u = 15   N F p u = 32.5   N F p u = 50   N
F g r = 5.5   N F g r = 2.1 % F p u = 1.1 % F g r = 7.3 % F p u = 4.7 % -
F g r = 10   N F g r = 1.1 % F p u = 1.8 % F g r = 2.9 % F p u = 3.0 % -
F g r = 24   N F g r = 1.3 % F p u = 0.9 % F g r = 1.1 % F p u = 2.0 % F g r = 1.6 % F p u = 2.6 %
Table 5. Overview of the different factor combinations used in the study.
Push Force: F p u   =   15   N F p u   =   32.5   N
Body Posture:StandingSittingStandingSitting
Gripping Force F g r   =   5.5   N   /   F g r   =   24   N F g r   =   10   N   /   F g r   =   24   N F g r   =   5.5   N   /   F g r   =   24   N F g r   =   10   N   /   F g r   =   24   N
f (Hz)pRpRpRpR
10<0.001 * 0.769 0.002 * 0.578 <0.001 * 0.704 0.081*-
13<0.001 * 0.840 0.002 * 0.578 <0.001 * 0.715 0.057* 0.377
15<0.001 * 0.699 0.002 * 0.598 <0.001 * 0.704 0.014* 0.478
160.001 * 0.629 0.001 * 0.629 0.002 * 0.597 0.113 * -
18<0.001 * 0.840 0.001 * 0.629 <0.001 * 0.672 0.002 * 0.578
20<0.001 * 0.709 0.004 * 0.548 0.001 * 0.640 0.014* 0.478
25<0.001 * 0.769 0.002 * 0.588 0.001 * 0.619 <0.001 * 0.709
32<0.001 * 0.689 0.001 * 0.619 <0.001 * 0.651 0.005 * 0.538
40<0.001 * 0.719 0.005 * 0.538 <0.001 * 0.661 0.006 * 0.528
50<0.001 * 0.699 0.006 * 0.528 <0.001 * 0.725 0.005 * 0.538
65<0.001 * 0.689 0.002 * 0.588 <0.001 * 0.715 <0.001 * 0.689
80<0.001 * 0.800 <0.001 * 0.749 <0.001 * 0.736 0.005 * 0.538
100<0.001 * 0.830 <0.001 * 0.811 <0.001 * 0.779 <0.001 * 0.749
Disclaimer/Publisher’s Note: The statements, opinions and data contained in all publications are solely those of the individual author(s) and contributor(s) and not of MDPI and/or the editor(s). MDPI and/or the editor(s) disclaim responsibility for any injury to people or property resulting from any ideas, methods, instructions or products referred to in the content.