Article

Measurement and Analysis of Crowdsourced Vehicle Vibration Levels during Last Mile Delivery Segments for Parcel Shipments

Department of Packaging Science, Rochester Institute of Technology, 78 Lomb Memorial Drive, Rochester, NY 14623, USA
*
Author to whom correspondence should be addressed.
Vibration 2022, 5(4), 792-802; https://doi.org/10.3390/vibration5040046
Submission received: 19 August 2022 / Revised: 10 October 2022 / Accepted: 2 November 2022 / Published: 8 November 2022
(This article belongs to the Special Issue Feature Papers in Vibration)

Abstract

:
Crowdsourced logistics has emerged as a delivery channel for many single-parcel packages. As a result, this logistics network has introduced personal passenger vehicles as a means to transport parcels during last mile delivery segments. To understand this network’s vibration levels and cargo capacity restraints, four vehicle types (a sedan, sports sedan, compact SUV and full-size SUV) commonly used in crowdsourced logistics deliveries were selected for measurement and analysis. This study shows that the vibration levels were significantly higher in the vertical axis and that the overall vibration energy increased as vehicle speed increased, except in the sedan. The sedan and SUV vehicles showed power spectral density peak frequencies in the low-frequency range, occurring at approximately 2 Hz, matching previous studies using similar vehicles. The vibration levels were greatest in the sports sedan and lowest in the sedan. The recorded vibration events showed a right-skewed heavy-tailed distribution and were non-Gaussian.

1. Introduction

The demand for crowdsourced logistics for last mile package delivery has increased in recent years as parcel delivery companies seek to provide consumers with rapid delivery of their purchases [1,2]. This increased demand has led parcel companies, such as UPS and Amazon, to utilize personal passenger vehicles to meet consumer demands [3]. Crowdsourced logistics for parcel delivery works on a network of users registering as operators for this application. The operators use their personal vehicles for deliveries and submit all required documentation for approval. Although each parcel provider has its vehicle condition and type restrictions, one common characteristic among all providers is that the vehicle must provide covered housing (trunk space) for the respective package during transport. Once approved, the operator requests parcel packages for pre-determined delivery time blocks, picks up the parcels from the respective distribution location, and transports them to the final destination. As this type of last mile delivery service continues to increase, it is essential to evaluate this delivery channel to understand the requirements needed to ensure the safe and adequate transport of packaged goods.
Globally, there have been numerous studies that have evaluated the vibration levels of vehicles transporting packages. However, many of these studies have focused on large trailers or parcel delivery trucks and vans [4,5,6,7,8,9,10,11,12,13,14]. A select number of studies using passenger vehicles have been reported, but these have occurred at other global regions, not specific to the United States. Zhou and Wang [15] investigated the vibration levels in South China as reported from a sedan car, minivan, heavy truck, medium truck and electric bicycle. Their study concluded that the lowest vibration intensity levels were found in the sedan car, and the highest vibration levels were observed in the heavy truck. Chonhenchob et al. [16] examined a mid-sized sedan car and pick-up truck traveling on highways and inner-city roads in Thailand. The findings from their study showed that the pick-up truck reported higher vibration intensity than the mid-sized sedan. In addition to the vehicle type, vibration levels are also influenced by a variety of other factors, such as road conditions [17,18], vehicle speed [18,19,20] and delivery driver behavior [21,22].
The objective of this project is to characterize the vibration levels experienced inside the cargo area of passenger vehicles during the last mile delivery of parcel packages. This is an essential step in evaluating the entire supply chain and a missing component in current package testing standards. Crowdsourced logistics for this last mile presents a unique challenge for packaging designers due to the large array of vehicle types and road conditions existing in the United States. As a result, this study aims to record and analyze this transport hazard using passenger vehicles operating within this delivery network. Additionally, the data collected are compared to previous studies from other countries and current package testing standards for small parcel delivery.

2. Materials and Methods

2.1. Instrumentation and Recording Parameters

The vibration events were collected using a SAVER 9XGPS field data recorder (Lansmont Corporation, Monterey, CA, USA). This particular field data recorder has a built-in triaxial accelerometer to collect vibration data and is coupled with GPS capability, allowing for the acquisition of position and speed data embedded in the capture events. The instrument was held securely by 3M double-faced adhesive tape (3M Corporation, Saint Paul, MN, USA) at each vehicle’s center position of the cargo hold area. This area was selected to record the vibration data necessary to drive vibration testing equipment during the evaluation of packaged products. Figure 1 illustrates an example of the placement of the sensor in the vehicle trunk. This approach was replicated for all vehicles in this study.
The data recorder was configured referencing the International Safe Transit Association’s (ISTA) data collection standard for measuring vibrations generated by transport vehicles during distribution. The following were the recording parameters used in the collection of the signal triggered data:
  • Sample rate: 1000 Hz;
  • Anti-aliasing filter frequency: 500 Hz;
  • Record time: 2.048 s;
  • Sample size: 2048;
  • Frequency resolution for PSD: 0.48 Hz;
  • Signal pre-trigger: 10%;
  • Signal trigger level: 0.1 g.

2.2. Vehicle Types and Travel Conditions

The vehicle types selected for this study conform to the general restrictions of crowdsourced delivery for last mile segments. To collect over-the-road vibration events, the following vehicles were observed: a sedan (Toyota Camry), an electric compact sport-utility vehicle (SUV) (Hyundai Kona), a full-size SUV (Toyota Pilot) and a sport sedan (Toyota GR86). In this study, the vehicles were unloaded, meaning they contained no additional payload in the trunk compartment of the vehicle during the time of the data collection. The vehicles were chosen to be unloaded for this study to prevent any parcels or packages from impacting the sensor, which could alter the results. All of the selected vehicles were manufactured in the US, except the Hyundai Kona, which was imported from South Korea. Their specifications are shown in Table 1.
The road function classifications used for this study were highways and local roadways. These roads were selected because they most closely represented the typical driving conditions for last mile deliveries from the distribution center to the final destination in the United States. For most e-commerce deliveries, the final destination is the consumer residence. The data were collected in the greater Rochester area, NY, USA, during Spring and Summer of 2022. Field observations were collected using a minimum duration of 5 h per vehicle.

2.3. Analysis Method for Collected Data

Traditionally, the most commonly used approach for the vibration testing of packaged products has been to use PSD profiles to drive vibration test equipment. A PSD represents the amount of vibration intensity (energy) as a function of frequency. This study shows the PD levels of 1–200 Hz, which are commonly used by vibration test standards for packaged-product integrity testing. Lansmont SaverXware processed the recorded vibration events to develop average PSD profiles for the different trip segments. The PSD levels of the recorded vertical vibration events were determined as a function of frequency, as calculated in Equation (1).
PD = i n RMS g i 2 n BW  
where PD is the power spectrum density in g2/Hz, RMS(g) is the root mean square value of the acceleration in G’s given bandwidth of frequency, BW is the frequency bandwidth and n is the number (n) of samples analyzed in that frequency window.
The PSD profile represents the average intensity of the vibration occurring at the point of measurement. The PSD profile can be described by its spectral shape and overall GRMS level. GRMS is used to define the overall energy or acceleration level of random vibrations. Common laboratory simulation techniques designed for random vibration testing use these PSD profiles to drive mechanical vibration test equipment. As with previous research analyses of vibration measurements, events below the noise floor (0.02 grms) of the SAVER 9XGPS were filtered out [15,23,24,25,26].
Minitab (v. 18 Minitab, LLC, State College, PA, USA) was used to develop the root mean square (RMS) distribution of the vibration events and the empirical cumulative density functions (CDF) of the RMS(g) levels to detail the kurtosis (K) and the skewness (S) for each vehicle observed. The CDF was fitted with a distribution based on the Anderson–Darling (AD) goodness-of-fit statistic. The AD measures the deviations between the fitted line (based on the selected distribution) and the nonparametric step function (based on the data points). These values, K and S, indicate the relationship of the observed data compared to a Gaussian normal distribution to better understand the distribution of the vibration levels associated with this environment.

3. Results and Discussion

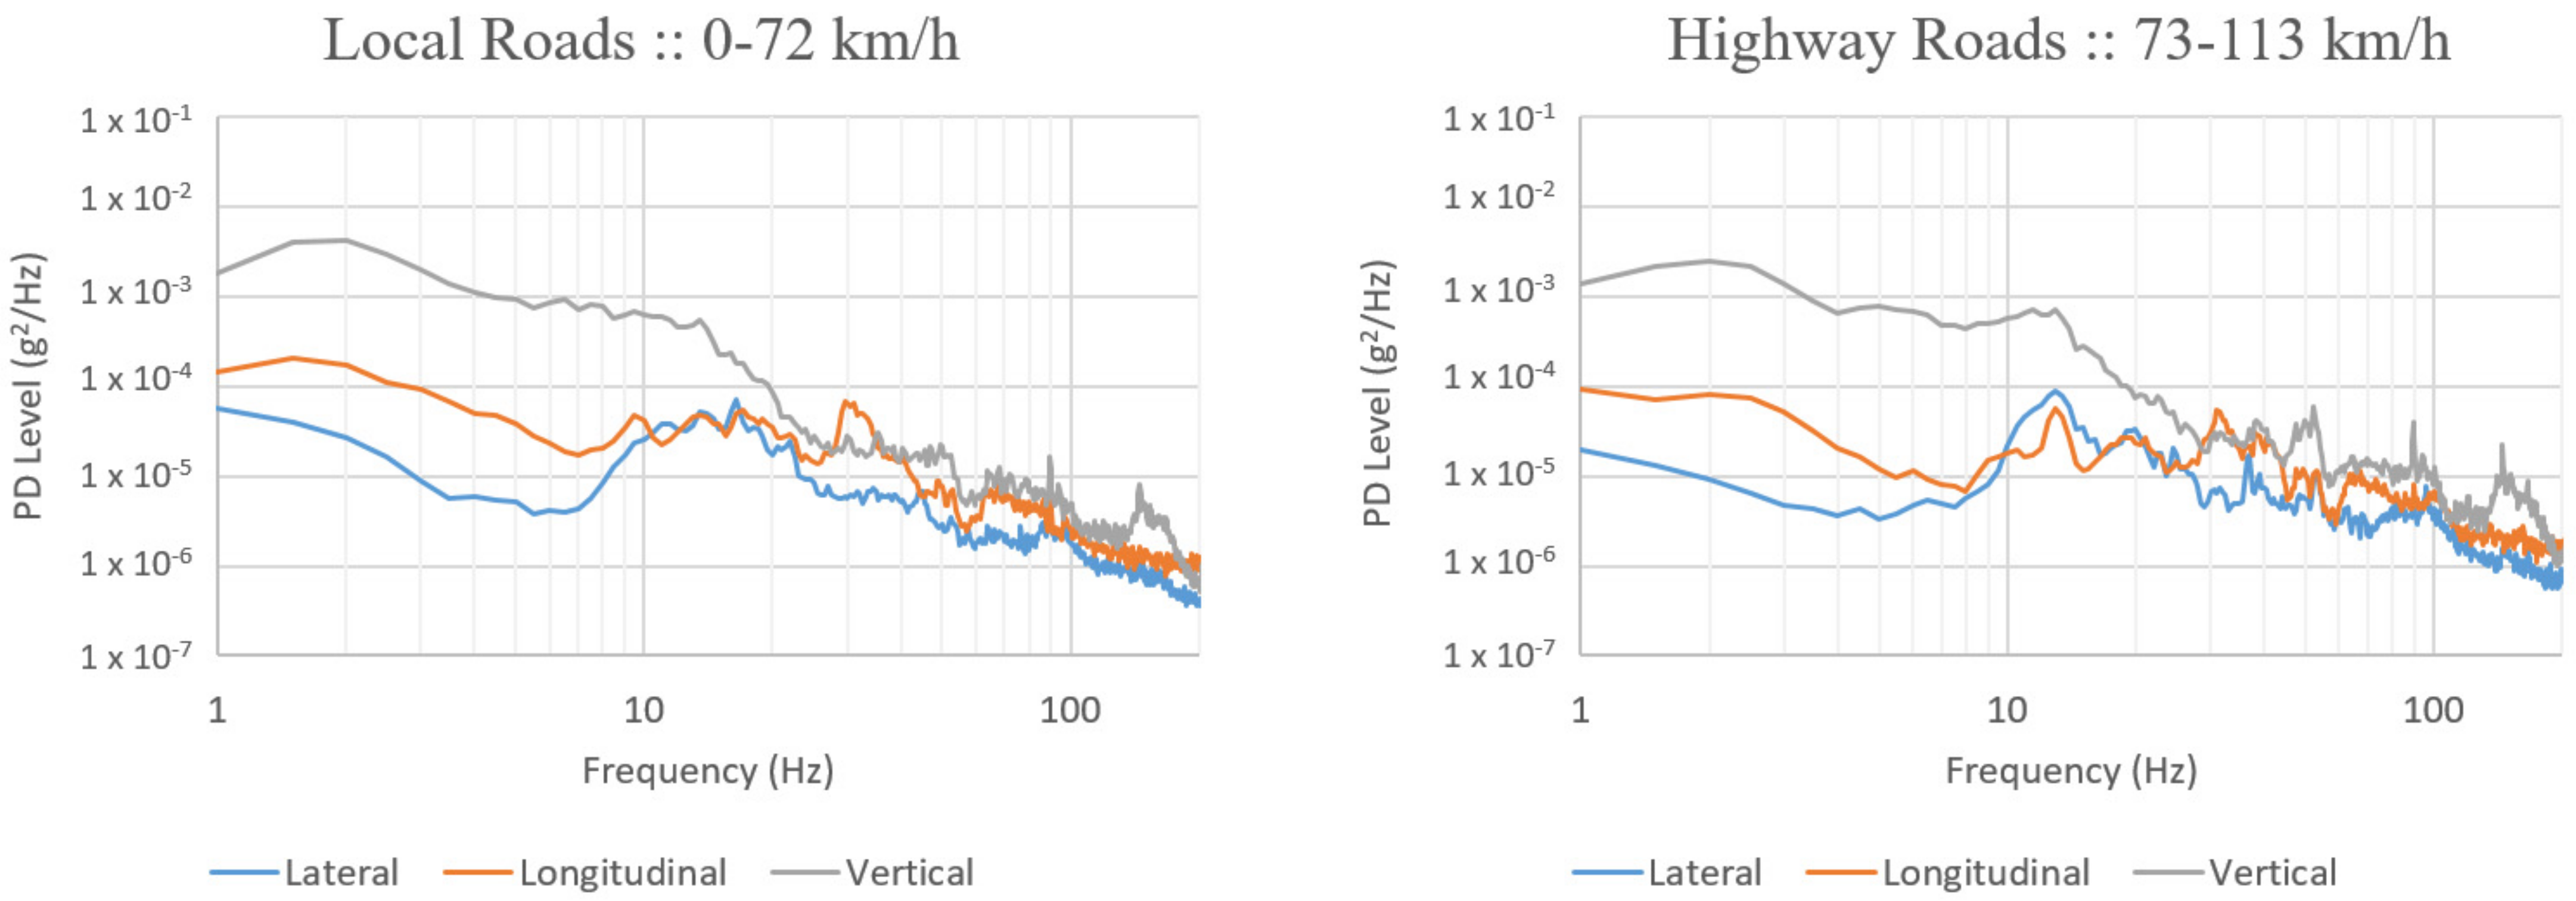
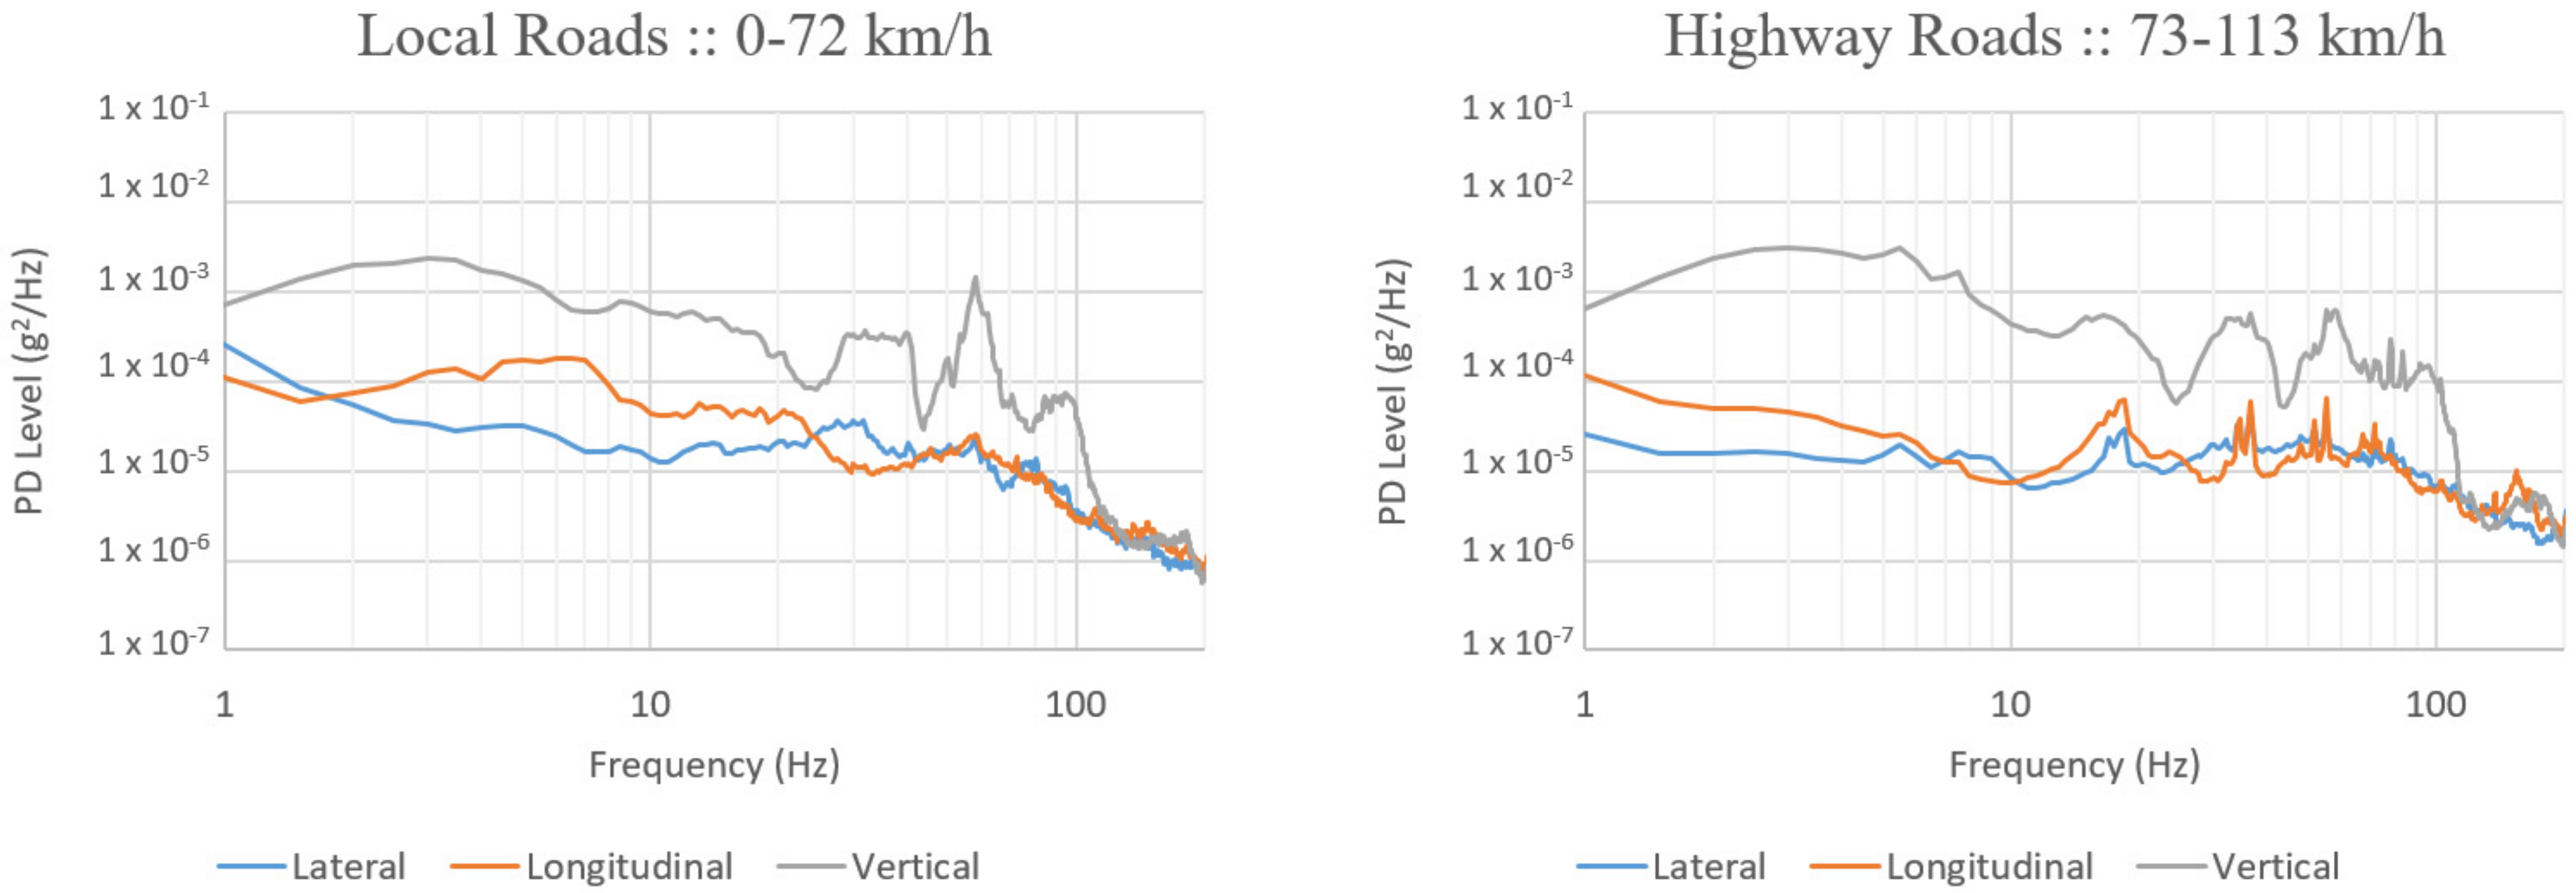
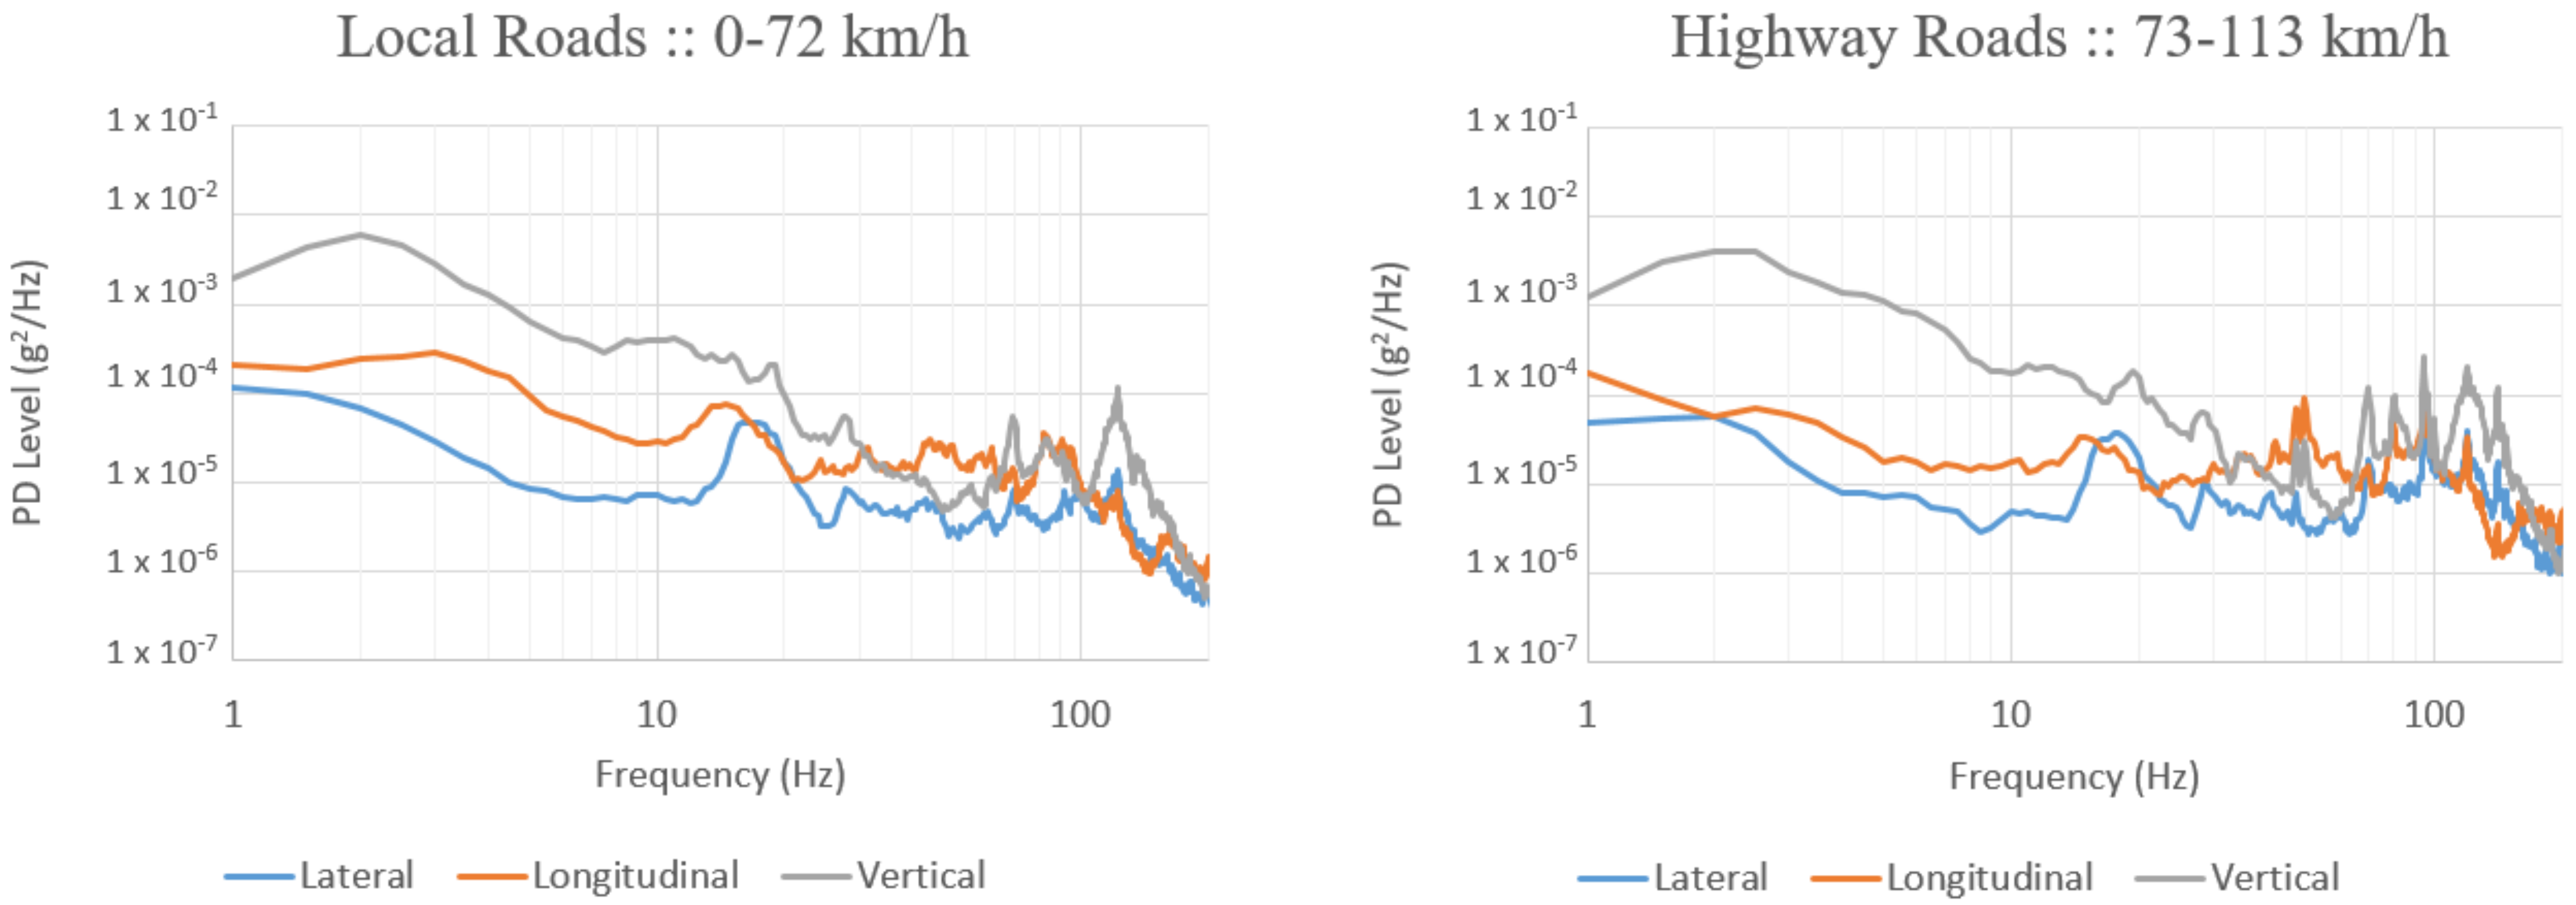
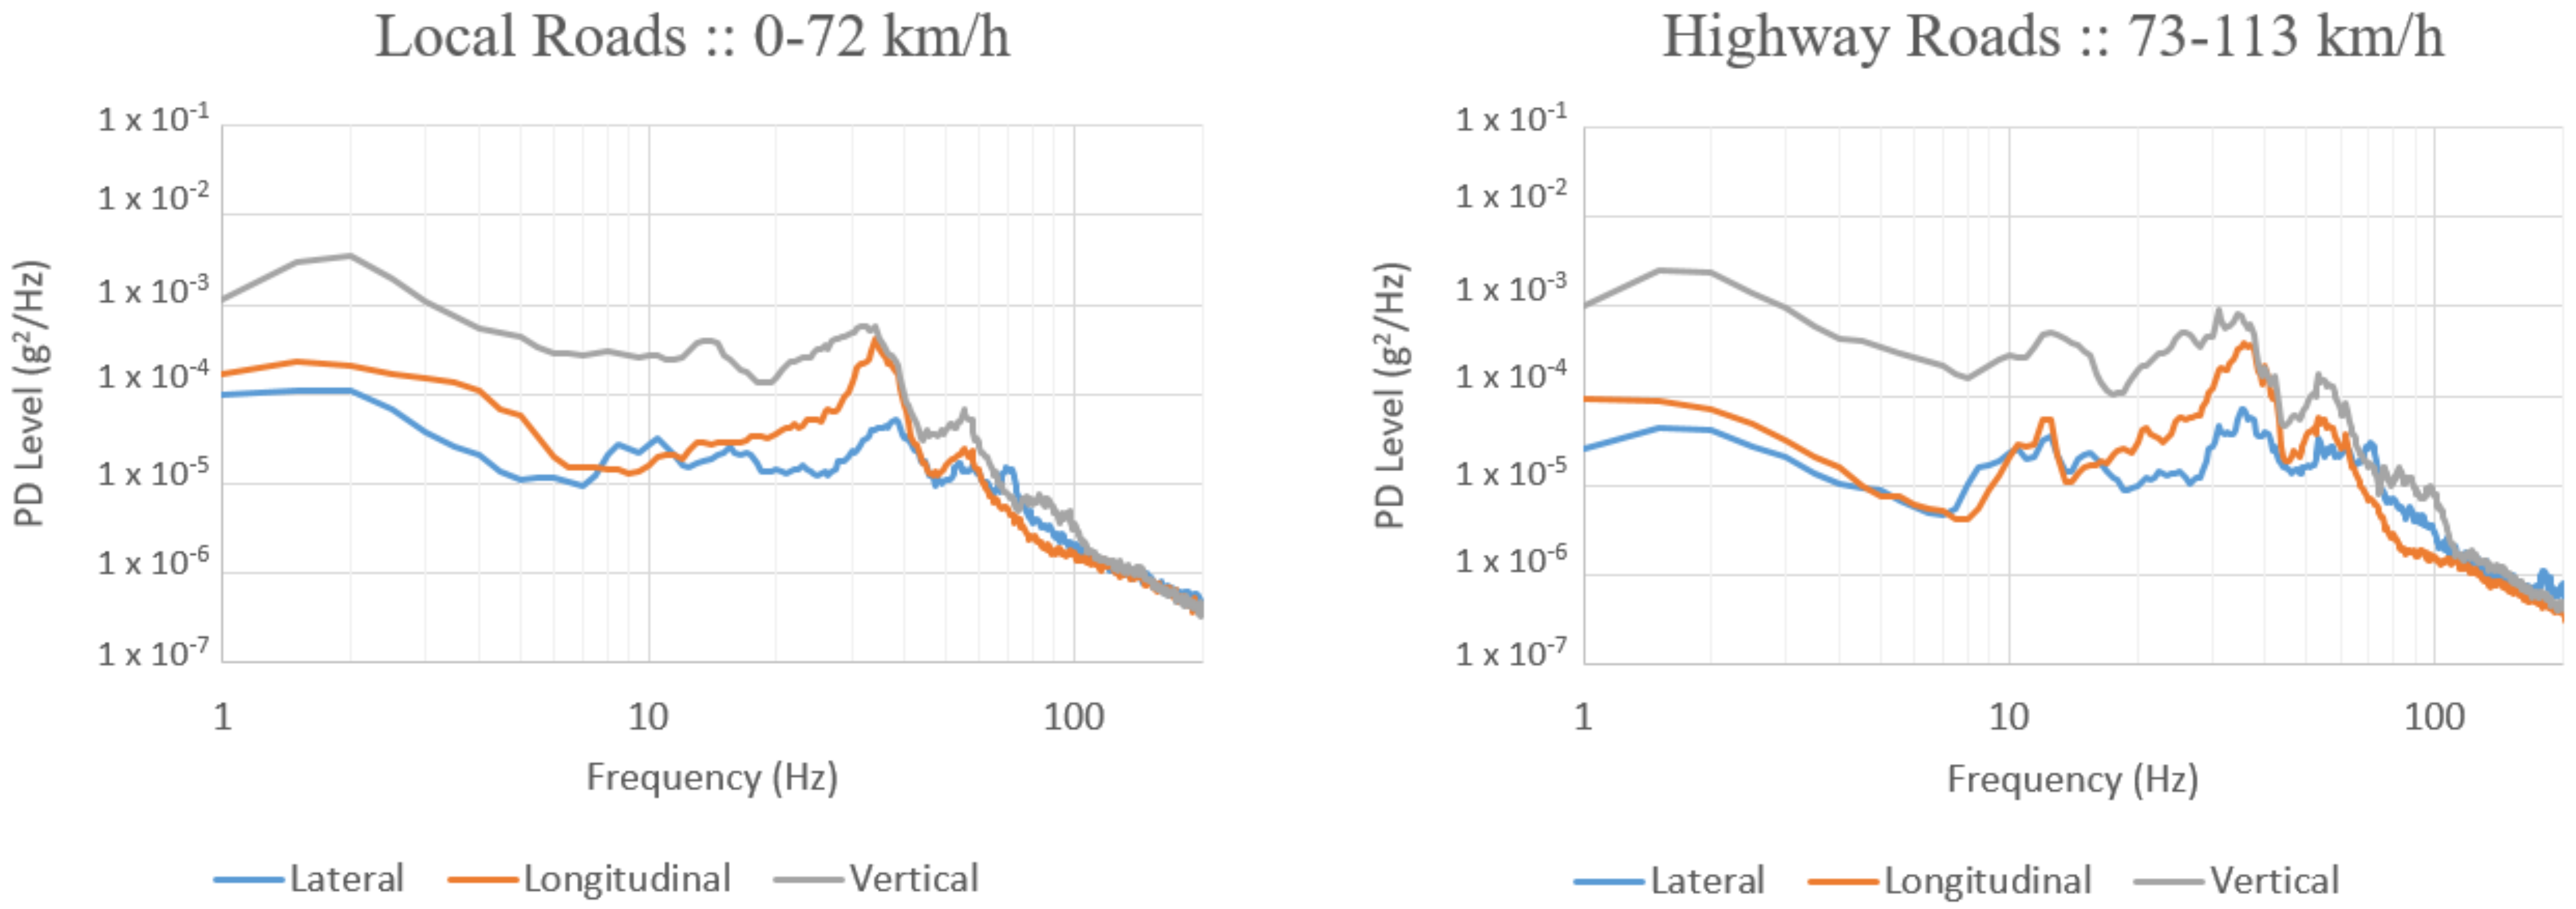
Figure 2, Figure 3, Figure 4 and Figure 5 display the individual PSD plots, separated by road classification, for each vehicle observed during this study. Table 2 displays the overall GRMS values and statistics measurements from each vehicle. As anticipated, the vibration levels in the vertical axis (gray line) were significantly higher as compared with the lateral (blue line) and longitudinal (orange line) axes for all vehicles. As shown in previous studies, the overall GRMS in the vertical axes was typically greatest on highways compared to local roads, where the vehicle’s speed is increased [15]. The overall condition of the road surfaces for this study were not graded, so the overall GRMS could only be compared to the vehicle’s velocity. The range of the overall GRMS was 0.135–0.176 and 0.124–0.197 for local and highway road types, respectively.
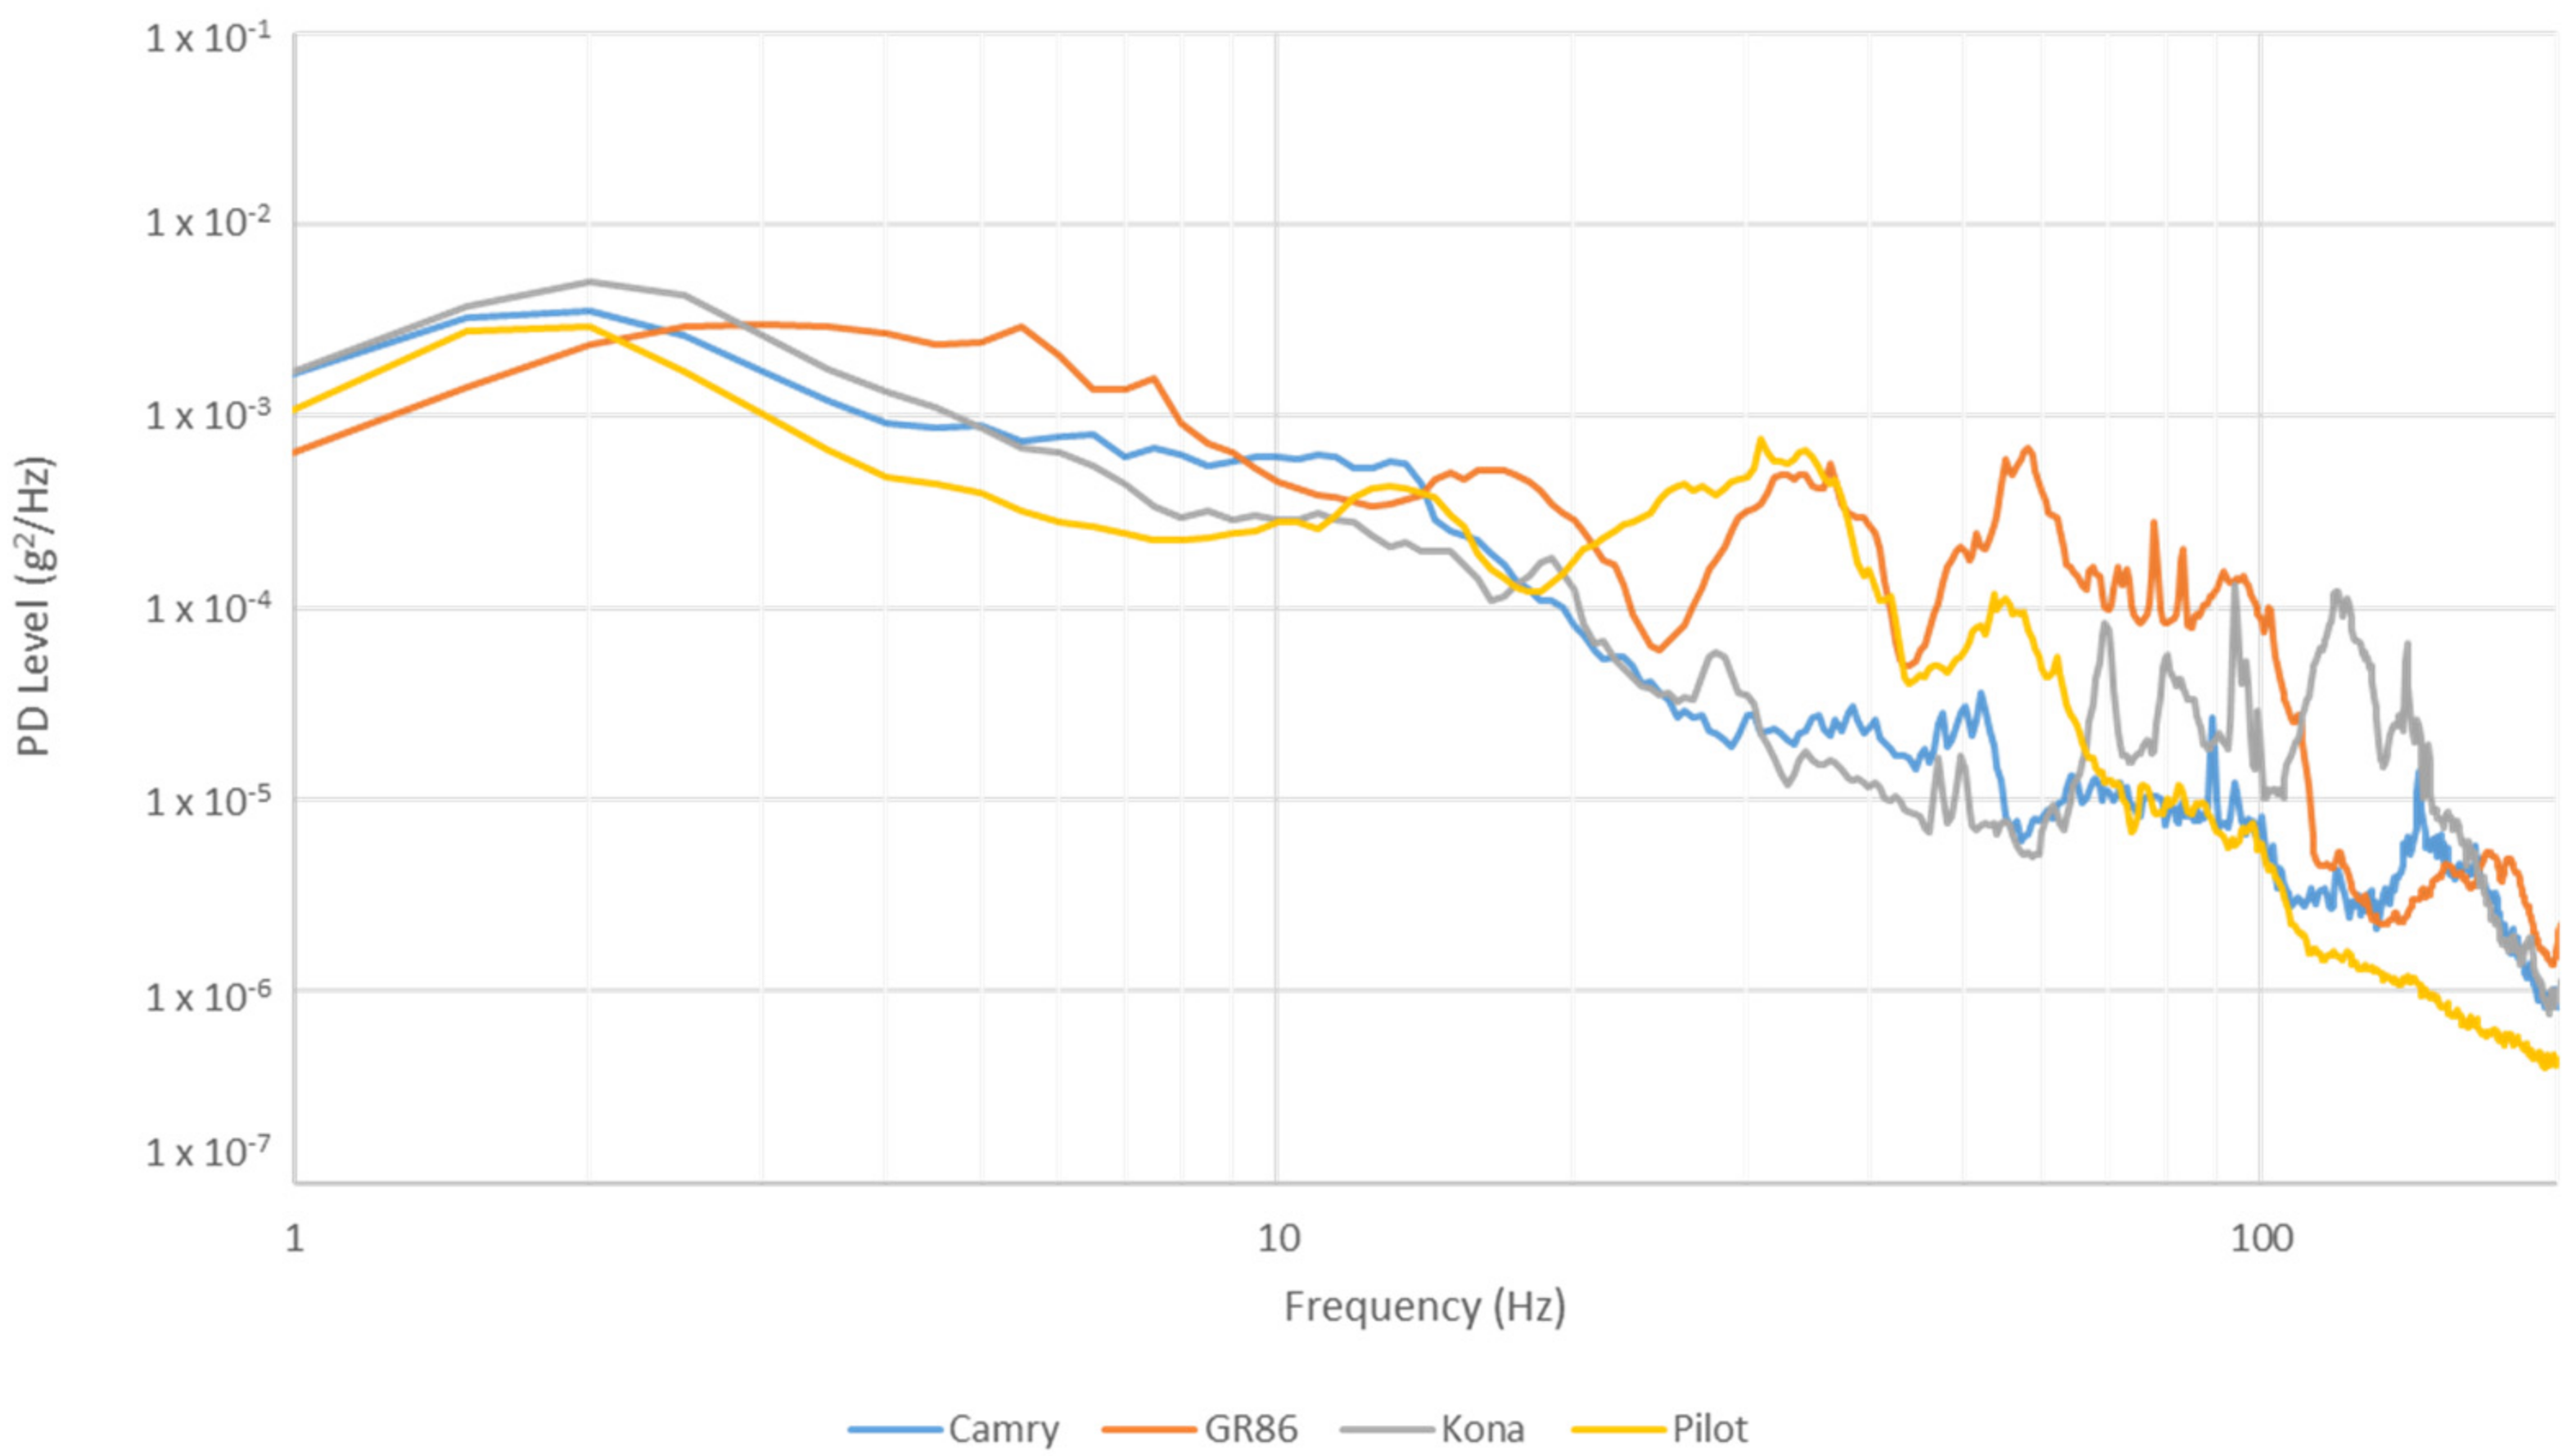
For further comparison of the study results to other published research and industry test standards, PSD plots, representing the average overall GRMS, were produced for each vehicle using the vertical orientation (Figure 6). As shown in the figure, there are similarities and distinct contrasts in the profile shapes and intensities among the vehicles. The Camry and the Kona were lower in the 20 to 70 Hz range. The Pilot and the GR86 had a similar response in the 20 to 40 Hz range. However, the GR86 had higher intensities of vertical vibration from 40 to 100 Hz.
The selected PSD profile from ISTA 3A [27] is designated to replicate vibration levels experienced by pick-up and delivery vehicles. It is unknown what percentile was used to generate the pick-up and delivery PSD referenced by ISTA, and nor is the origin of the vehicle type of the recorded parameters. The authors chose to compare this existing PSD package test profile with those of the SUVs from this study. This comparison is likely more representative than that of a sedan car, which was not likely a vehicle that was measured during the development of those standards. In recent years, sedans have been used for parcel delivery here in the US. Figure 7 displays the PSD profiles from the two SUVs and the test standard profile. It should be noted that the PSD profiles shown in this study are not accelerated or time compressed, as is typical for many package-testing PSD profiles. The highest PSD level occurred in the vertical axis, with approximately 2 Hz, whereas the ISTA profile was between 3 and 4 Hz. The Pilot had peaks of 11 to 14 Hz and 18 to 43 Hz, which are not captured in the ISTA test spectrum. The ISTA test spectrum has a second peak between 15 to 24 Hz. The peaks in the higher frequency of the standard between 70 and 100 Hz match closely with those of the Kona.
Currently, no test standards exist for package testing using PSD profiles referencing passenger vehicles. However, there has been an increase in the availability of these vehicle types due to the emergence of crowdsourced delivery. Therefore, the authors are interested in understanding and comparing their vibration levels and spectral shapes. Although all road conditions and test parameters are not the same, the authors compared the findings from this study to other published research articles collected from other global regions. The authors selected vehicles of similar styles and payloads for comparison. Figure 8 displays the PSD profiles from the sedans in this study, overlaid with those from previous research for comparison.
Both sedan cars referenced by Zhou [15] and Chonhenchob [16] and the Camry sedan had similar first peaks in the low frequency (1–10 Hz) range, which corresponded to the suspension frequency of the vehicle. The highest PD level occurred at approximately 2 Hz for the Camry sedan, which showed agreement with the Skoda and Honda sedans from previously published research. However, the GR86 sport sedan’s first peak was not as narrow as the other sedans, with a first peak response from approximately 2.5 to 6.5 Hz. This shift in the first peak response was likely due to the sports sedan having a stiffer suspension compared to the other sedan types. The secondary peaks, related to the vehicles’ structural components, such as tires and chassis, were much different for the Camry sedan compared to the Skoda and Honda. The GR86 showed similar secondary peaks as, was previously reported in the range of 10 to 70 Hz for sedan cars. However, the GR86 response exceeded 100 Hz, whereas the Skoda indicated very little vibration response above 70 Hz.
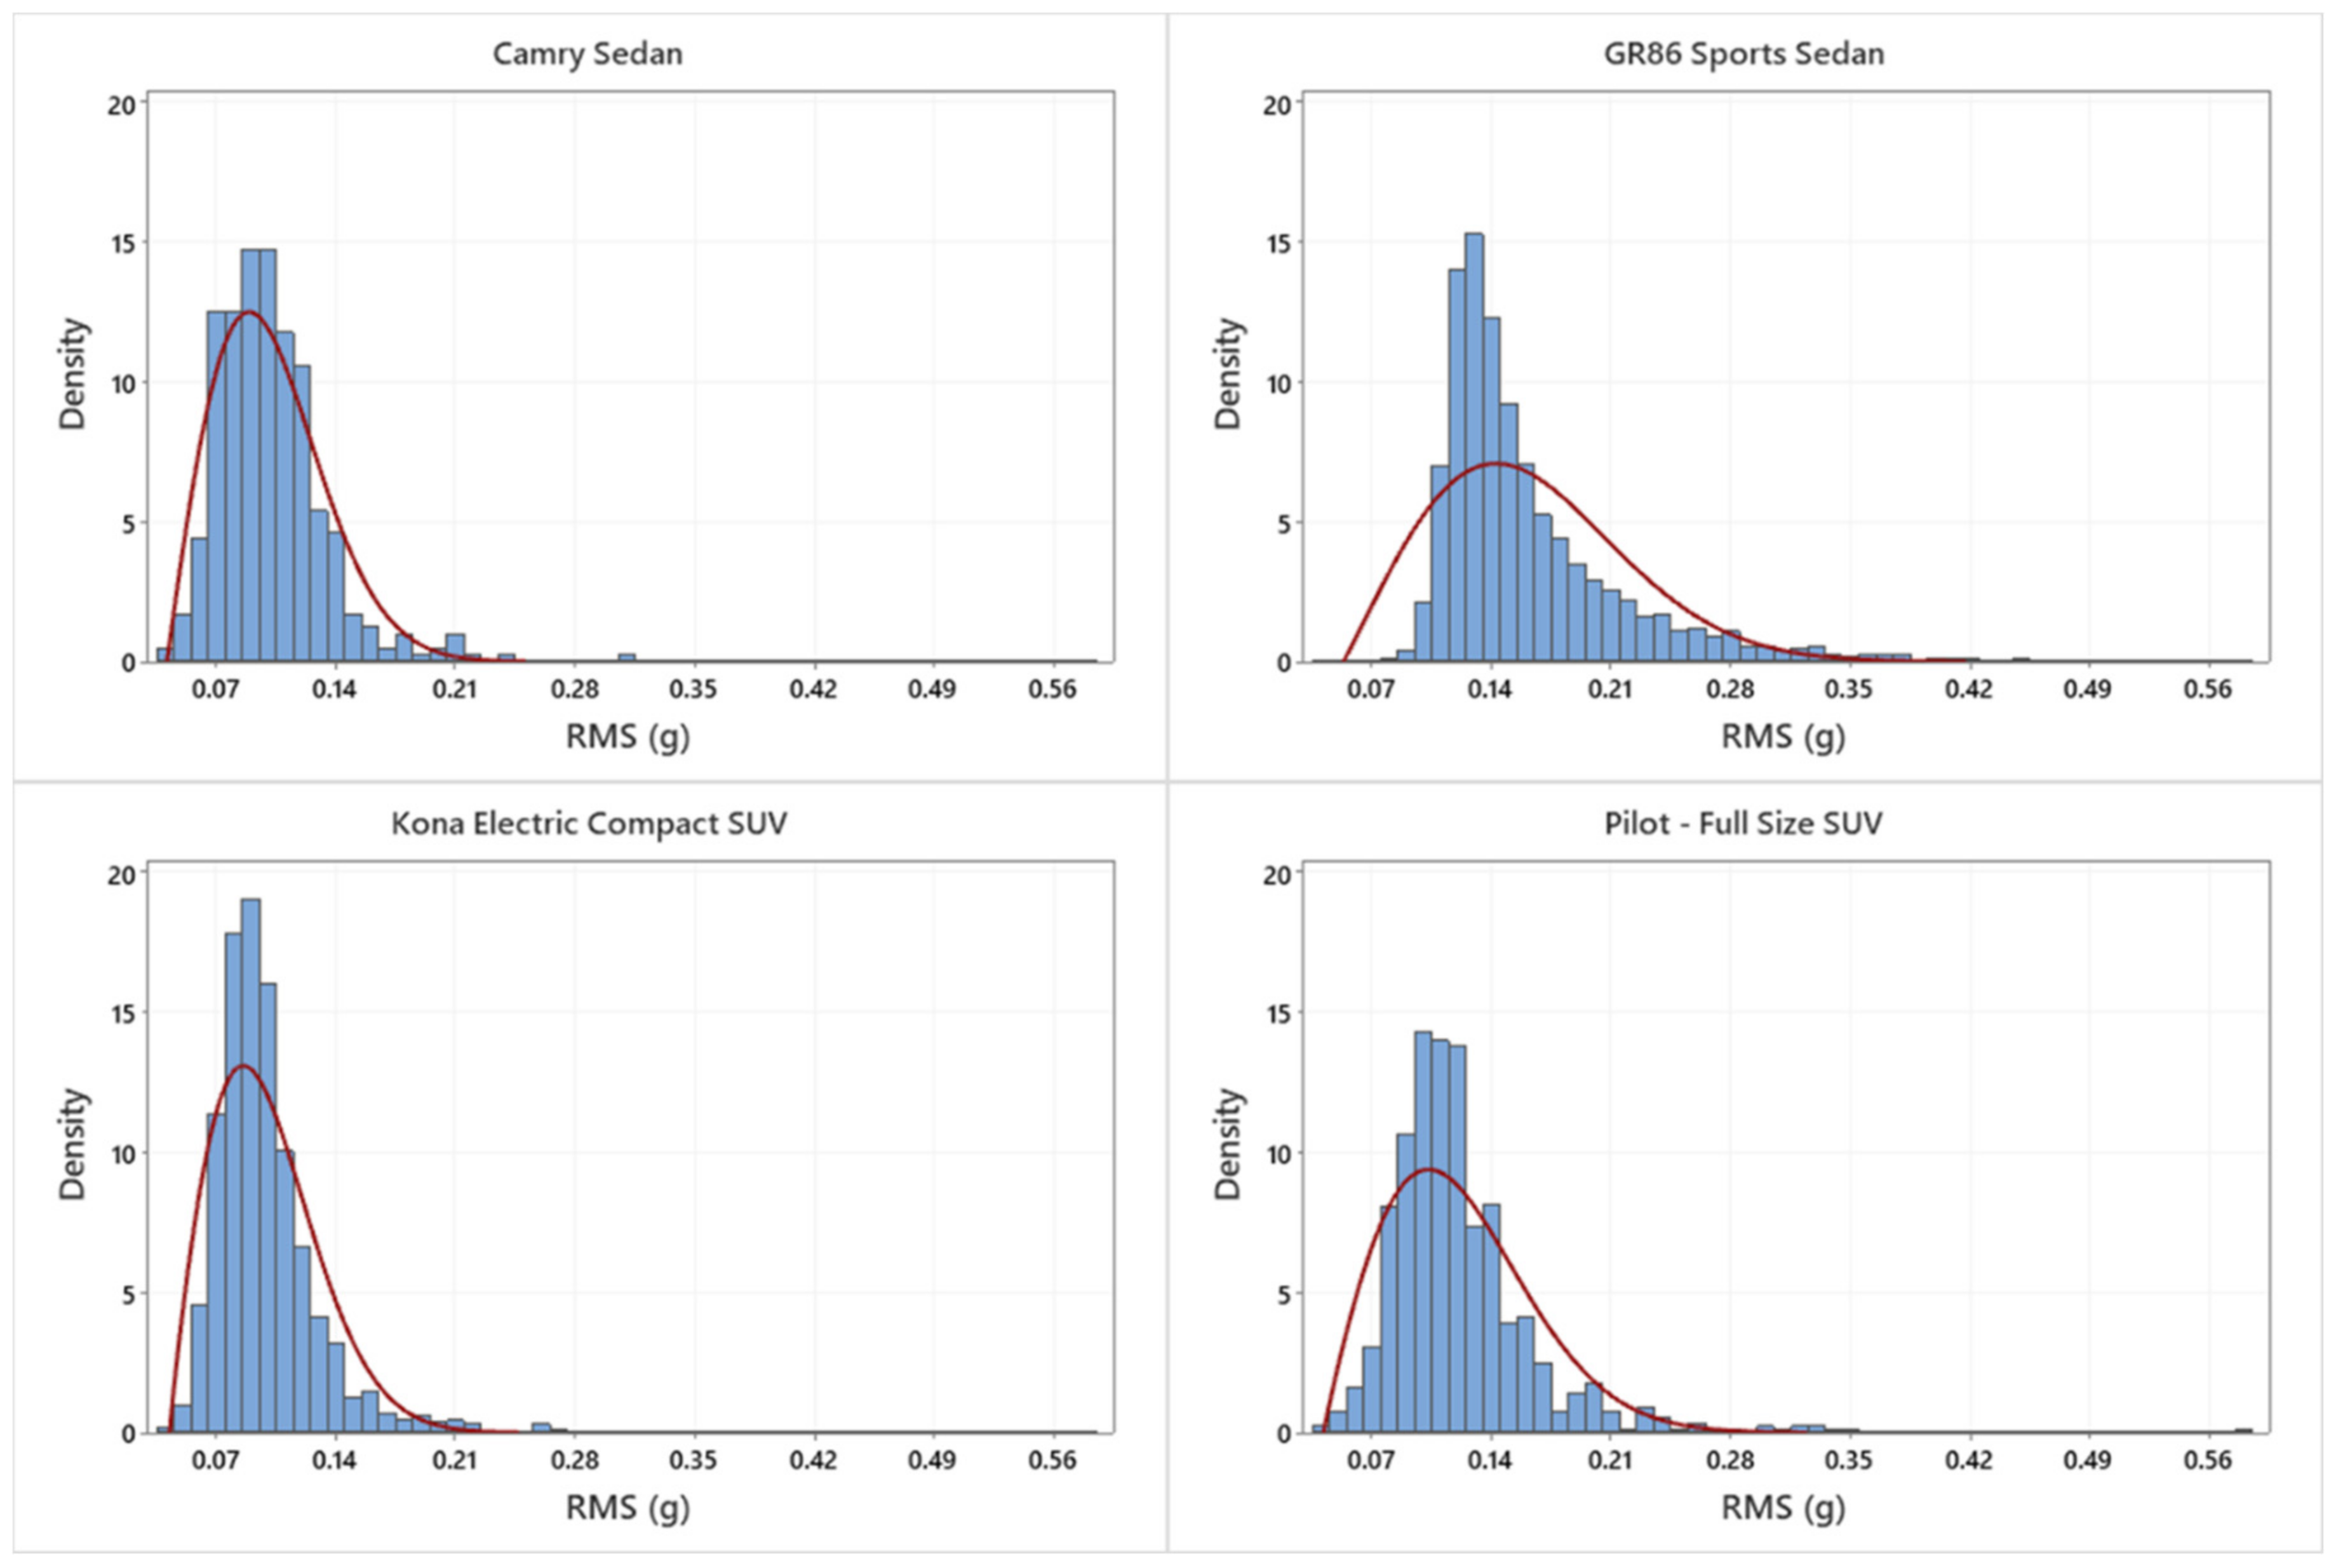
Table 2 shows the kurtosis and skewness values of the RMS(g) vibration events from each vehicle observed during this study. The kurtosis of all measured events was greater than three, indicating a heavy-tailed distribution, meaning that the measured vibration events followed a non-Gaussian distribution [24,28]. Positive skewness values indicate a right-skewed asymmetric distribution. Based on the K and S values reported from this study, it can be concluded that the vibrations experienced by crowdsourced delivery vehicles in the last mile were non-Gaussian, as is the case with other transport vehicle types [24,29,30]. This is important to understand, as the most common approach for the vibration testing of packaged products and unit load systems follows a Gaussian distribution, which was not observed in the field measurements collected in this study. The plots of the CDF show the probability of an event to occur based on the measured RMS(g) value, indicating that the majority of all events have an RMS(g) level below 0.2 (Figure 9). Figure 10 shows the distribution of the events fitted with a three-parameter Weibull distribution [31], which was the best-fit result based on the AD statistic.
One observational note the authors recorded during this study involves the loading capacity and cargo space limitations for crowdsourced passenger delivery vehicles. Current pick-up and delivery vehicles that are used commonly in the parcel industry have a noticeably larger volume of space to accommodate packages of all shapes and sizes. Available cargo space is extremely limited for certain crowdsourced passenger vehicles, which can result in the packages being placed in non-traditional shipping orientations during the last mile segment. The developed vibration profiles, coupled with the known limitations of cargo space and package arrangements within crowdsourced passenger vehicles, should enable packaging engineers to design solutions limiting product damage for the consumer.

Limitations of this Study

  • This study did not evaluate the observed roadway conditions or the changes in the payload inside the cargo area and their impact on the vibration levels. Further studies can measure the road roughness and can include various payload capacities to determine the impact on the experienced vibration levels.
  • The ISTA vibration test standards are accelerated (time compressed), which artificially amplifies the vibration magnitude. Therefore, the field measured levels for the overall GRMS values of this study should be evaluated carefully against standard test levels.
  • The observations for this study were made in good driving conditions. However, many parts of the US and the globe have adverse weather, which can alter driving conditions. This can be another area of further exploration.

4. Conclusions

Crowdsourced logistics for the last mile has become an increasingly used service for single parcel deliveries, especially for home deliveries of online orders. This logistics network brings new challenges to the single parcel channel, requiring further observation and measurement to ensure that packaged products arrive safely to the consumer. The distribution of the vibration events for representative crowdsourced passenger delivery vehicles, which can be used to transport packages during last mile logistics, are non-Gaussian. For the vehicles observed in this study, vibration levels were significantly more intense in the vertical axis than the lateral or longitudinal axes. Additionally, the vibration energy was typically higher when the vehicle speed increased, except for the Camry sedan.
Compact and full-size SUV spectrums were compared to the ISTA 3A (pick-up and delivery vehicle). For the SUV PSD profiles, the highest PSD level occurred in the vertical axis at 2 Hz, differing from the ISTA profile, which has its first peak between 3 and 4 Hz. The full-size SUV (Pilot) had a second peak between 18 and 43 Hz, which is not captured in the current ISTA profile. Peaks in the higher frequency range of the ISTA profile match closely with those of the compact SUV (Kona).
The sedan car (Camry) reported a similar PSD peak frequency at approximately 2 Hz, as previous studies have shown. However, the sport sedan’s (GR86) first peak was broader than that of other sedan cars, which showed a first peak response from approximately 2.5 to 6.5 Hz. The GR86 showed similar secondary peaks, as previously reported for sedan cars, but the GR86’s response encompassed a wider frequency range. The secondary peaks related to the vehicle’s structural components were much lower for the Camry sedan compared with the Skoda and Honda.

Author Contributions

Conceptualization, K.D.; methodology, K.D. and P.C.; validation, K.D. and P.C.; formal analysis, K.D. and P.C.; investigation, K.D. and P.C.; writing—original draft preparation, P.C.; writing—review and editing, K.D. and P.C.; visualization, K.D. and P.C.; supervision, K.D.; project administration, K.D. All authors have read and agreed to the published version of the manuscript.

Funding

This research received no external funding.

Institutional Review Board Statement

Not applicable.

Informed Consent Statement

Not applicable.

Data Availability Statement

The data presented in this study are available on request from the corresponding author.

Conflicts of Interest

The authors declare no conflict of interest.

References

  1. Sampaio, A.; Savelsbergh, M.; Veelenturf, L.P.; Van Woensel, T. Delivery Systems with Crowd-sourced Drivers: A Pickup and Delivery Problem with Transfers. Networks 2020, 76, 232–255. [Google Scholar] [CrossRef]
  2. Le, T.V.; Ukkusuri, S.V. Crowd-Shipping Services for Last Mile Delivery: Analysis from American Survey Data. Transp. Res. Interdiscip. Perspect. 2019, 1, 100008. [Google Scholar] [CrossRef]
  3. Boysen, N.; Fedtke, S.; Schwerdfeger, S. Last-Mile Delivery Concepts: A Survey from an Operational Research Perspective. OR Spectr. 2021, 43, 1–58. [Google Scholar] [CrossRef]
  4. Singh, J.; Singh, S.P.; Joneson, E. Measurement and Analysis of US Truck Vibration for Leaf Spring and Air Ride Suspensions, and Development of Tests to Simulate These Conditions. Packag. Technol. Sci. 2006, 19, 309–323. [Google Scholar] [CrossRef]
  5. Singh, S.P.; Sandhu, A.P.S.; Singh, J.; Joneson, E. Measurement and Analysis of Truck and Rail Shipping Environment in India. Packag. Technol. Sci. 2007, 20, 381–392. [Google Scholar] [CrossRef] [Green Version]
  6. Rissi, G.O.; Singh, S.P.; Burgess, G.; Singh, J. Measurement and Analysis of Truck Transport Environment in Brazil. Packag. Technol. Sci. 2008, 21, 231–246. [Google Scholar] [CrossRef] [Green Version]
  7. Böröcz, P.; Singh, S.P. Measurement and Analysis of Delivery van Vibration Levels to Simulate Package Testing for Parcel Delivery in Hungary. Packag. Technol. Sci. 2018, 31, 342–352. [Google Scholar] [CrossRef]
  8. Böröcz, P. Vibration Levels in Vans as a Function of Payload and Leaf Spring Sheet Number. J. Test. Eval. 2017, 46, 20160538. [Google Scholar] [CrossRef]
  9. Dunno, K. Measurement and Analysis of Vehicle Vibration for Bottled Water Delivery Trucks. Int. J. Adv. Packag. Technol. 2014, 2, 75–83. [Google Scholar] [CrossRef]
  10. Dunno, K. Experimental Evaluation of Techniques Designed to Reduce Vibration Simulation Test Time. J. Appl. Packag. Res. 2014, 6, 1. [Google Scholar] [CrossRef]
  11. Cano-Moreno, J.D.; Cabanellas Becerra, J.M.; Arenas Reina, J.M.; Islán Marcos, M.E. Analysis of E-Scooter Vibrations Risks for Riding Comfort Based on Real Measurements. Machines 2022, 10, 688. [Google Scholar] [CrossRef]
  12. Boglietti, S.; Ghirardi, A.; Zanoni, C.T.; Ventura, R.; Barabino, B.; Maternini, G.; Vetturi, D. First Experimental Comparison between E-Kick Scooters and e-Bike’s Vibrational Dynamics. Transp. Res. Procedia 2022, 62, 743–751. [Google Scholar] [CrossRef]
  13. Govers, M.E.; Nolan, A.J.; Hassan, M.; Oliver, M.L. Relationships between Height, Mass, Body Mass Index, and Trunk Muscle Activation during Seated Whole-Body Vibration Exposure. Vibration 2021, 4, 822–835. [Google Scholar] [CrossRef]
  14. Maravich, M.M.; Altinsoy, E. Influence of Seat Vibration Frequency on Total Annoyance and Interaction Effects Caused by Simultaneous Noise and Seat Vibrations in Commercial Vehicles. Vibration 2022, 5, 183–199. [Google Scholar] [CrossRef]
  15. Zhou, H.; Wang, Z.-W. Measurement and Analysis of Vibration Levels for Express Logistics Transportation in South China. Packag. Technol. Sci. 2018, 31, 665–678. [Google Scholar] [CrossRef]
  16. Chonhenchob, V.; Singh, S.P.; Singh, J.J.; Stallings, J.; Grewal, G. Measurement and Analysis of Vehicle Vibration for Delivering Packages in Small-Sized and Medium-Sized Trucks and Automobiles: Small and medium truck and automobile vibration levels. Packag. Technol. Sci. 2012, 25, 31–38. [Google Scholar] [CrossRef] [Green Version]
  17. Rouillard, V.; Sek, M. Creating Transport Vibration Simulation Profiles from Vehicle and Road Characteristics: Vibration simulation schedules from vehicle and road characteristics. Packag. Technol. Sci. 2013, 26, 82–95. [Google Scholar] [CrossRef]
  18. Zhou, R.; Yan, L.; Li, B.; Xie, J. Measurement of Truck Transport Vibration Levels in China as a Function of Road Conditions, Truck Speed and Load Level: Vibration as a Function of Road Conditions, Truck Speed and Load Mass. Packag. Technol. Sci. 2015, 28, 949–957. [Google Scholar] [CrossRef]
  19. Garcia-Romeu-Martinez, M.-A.; Singh, S.P.; Cloquell-Ballester, V.-A. Measurement and Analysis of Vibration Levels for Truck Transport in Spain as a Function of Payload, Suspension and Speed. Packag. Technol. Sci. 2008, 21, 439–451. [Google Scholar] [CrossRef]
  20. Lu, F.; Ishikawa, Y.; Kitazawa, H.; Satake, T. Effect of Vehicle Speed on Shock and Vibration Levels in Truck Transport. Packag. Technol. Sci. 2010, 23, 101–109. [Google Scholar] [CrossRef]
  21. Młyńczak, J.; Celiński, I.; Burdzik, R. Effect of Vibrations on the Behaviour of a Vehicle Driver. Vibroeng. Procedia 2015, 6, 243–247. [Google Scholar]
  22. Xiang, H.; Zhu, J.; Liang, G.; Shen, Y. Prediction of Dangerous Driving Behavior Based on Vehicle Motion State and Passenger Feeling Using Cloud Model and Elman Neural Network. Front. Neurorobot. 2021, 15, 641007. [Google Scholar] [CrossRef] [PubMed]
  23. Wallin, B. Developing a Random Vibration Profile Standard. In Proceedings of the 2007 IAPRI Symposium, Windsor, UK, 3–5 September 2007. [Google Scholar]
  24. Böröcz, P. Vibration and Acceleration Levels of Multimodal Container Shipping Physical Environment. Packag. Technol. Sci. 2019, 32, 269–277. [Google Scholar] [CrossRef]
  25. Böröcz, P.; Singh, S.P. Measurement and Analysis of Vibration Levels in Rail Transport in Central Europe. Packag. Technol. Sci. 2017, 30, 361–371. [Google Scholar] [CrossRef]
  26. Rouillard, V. Quantifying the Non-Stationarity of Vehicle Vibrations with the Run Test. Packag. Technol. Sci. 2014, 27, 203–219. [Google Scholar] [CrossRef]
  27. ISTA. Standard 3A: Packaged-Products for Parcel Delivery System Shipment 70 Kg (150 Lb) or Less; ISTA: East Lansing, MI, USA, 2018. [Google Scholar]
  28. Park, J.; Choi, S.; Jung, H.M. Measurement and Analysis of Vibration Levels for Truck Transport Environment in Korea. Appl. Sci. 2020, 10, 6754. [Google Scholar] [CrossRef]
  29. Rouillard, V.; Sek, M.A. Synthesizing Nonstationary, Non-Gaussian Random Vibrations. Packag. Technol. Sci. 2010, 23, 423–439. [Google Scholar] [CrossRef]
  30. Otari, S.; Odof, S.; Nolot, J.B.; Vasseur, P.; Pellot, J.; Krajka, N.; Erre, D. Statistical Characterization of Acceleration Levels of Random Vibrations during Transport: Random vibration characterization. Packag. Technol. Sci. 2011, 24, 177–188. [Google Scholar] [CrossRef]
  31. Rouillard, V.; Lamb, M.J. Using the Weibull Distribution to Characterise Road Transport Vibration Levels. Packag. Technol. Sci. 2020, 33, 255–266. [Google Scholar] [CrossRef]
Figure 1. Placement of field data recorder into vehicle cargo area.
Vibration 05 00046 g001
Figure 2. PSD plots for triaxial vibration of the Camry sedan.
Vibration 05 00046 g002
Figure 3. PSD plots for triaxial vibration of the GR86 sport sedan.
Vibration 05 00046 g003
Figure 4. PSD plots for triaxial vibration of the electric Kona compact SUV.
Vibration 05 00046 g004
Figure 5. PSD plots for triaxial vibration of the Pilot full-size SUV.
Vibration 05 00046 g005
Figure 6. Overall PSD plots of four vehicles in vertical direction.
Vibration 05 00046 g006
Figure 7. PSD plot comparison with current package testing standards.
Vibration 05 00046 g007
Figure 8. PSD plot comparison of sedan cars.
Vibration 05 00046 g008
Figure 9. Cumulative distribution function on RMS acceleration in the vertical direction.
Vibration 05 00046 g009
Figure 10. RMS distribution of vehicles in the vertical direction.
Vibration 05 00046 g010
Table 1. Vehicle specifications.
ParameterToyota CamryHonda PilotHyundai KonaToyota GR86
Model Year2011201520212022
Engine2.5 L Gas3.5 L GasElectric2.4 L Gas
Drive TrainFront WheelFront WheelFront WheelRear Wheel
Gross Vehicle Weight1501 kg1896 kg1315 kg1275 kg
Suspension/TypeIndependent/Coil SpringIndependent/Coil SpringIndependent/Coil SpringIndependent/Coil Spring
Table 2. Vehicle measurements and statistics.
Overall GRMS Values
VehicleRoad TypeSpeed (km/h)VerticalLongitudinalLateralKurtosisSkewness
Camry—SedanLocal0–720.1350.0460.0326.221.86
Highway73–1130.1240.0430.0343.201.56
GR86—Sport
Sedan
Local0–720.1760.0540.0472.811.29
Highway73–1130.1970.0480.0446.712.26
Kona—Electric Compact SUVLocal0–720.1400.0590.03610.192.29
Highway73–1130.1420.0570.4209.212.11
Pilot—Gas Full-sized SUVLocal0–720.1370.0680.04215.682.78
Highway73–1130.1460.0700.0446.462.05
Publisher’s Note: MDPI stays neutral with regard to jurisdictional claims in published maps and institutional affiliations.