Article

Experimental Evaluation of the Driving Parameters in Human–Structure Interaction

1
Department of Mechanical Engineering, Politecnico di Milano, Via La Masa, 34, 20156 Milan, Italy
2
Department of Mechanical, Energy, Management and Transportation Engineering, Università degli Studi di Genova, Via all’Opera Pia, 15A, 16145 Genoa, Italy
3
Department of Engineering and Architecture, Università degli Studi di Parma, Parco Area delle Scienze, 181/A, 43124 Parma, Italy
*
Author to whom correspondence should be addressed.
Vibration 2022, 5(1), 121-140; https://doi.org/10.3390/vibration5010008
Submission received: 18 December 2021 / Revised: 5 January 2022 / Accepted: 8 February 2022 / Published: 18 February 2022

Abstract

:
Many studies in the literature have already evidenced that pedestrians are able to change the dynamic properties of slender structures (e.g., footbridges and staircases). The aim of this paper is to analyse which pedestrians’ features mostly affect the structure behaviour, in order to properly account for them in a human–structure interaction problem, while disregarding the less relevant ones. This is accomplished by measuring the apparent mass (i.e., the frequency response function between the vibration of the structure at the contact point and the consequent force exerted by the pedestrian to the structure itself) curves of human bodies and coupling them to the dynamics of a slender structure. In more detail, this paper aims at analysing which factors must be accounted for among intra-subject variability (i.e., the dynamic behaviour of the same subject can change because it is characterised by a natural dispersion), inter-subject variability (i.e., different subjects have different dynamic behaviours) and the posture (i.e., the same subject changes posture during motion and this causes a change of his/her dynamic features). The influence of the apparent mass properties on the modal parameters of the hosting structure is addressed by means of a modal approach.

1. Introduction

Nowadays, the evaluation of the dynamic behaviour of civil structures is an important aspect, especially at the design stage. Such an issue is even more complex if structures characterised by light and slender profiles are considered. Indeed, this type of structure can be affected by the presence of occupants, leading to a dynamic interaction between the occupants and structure itself, the so-called human–structure interaction (HSI). In the literature, the most studied HSI cases are those related to the interaction of people/crowd with civil structures, such as footbridges [1,2,3,4,5], pedestrian structures [6,7,8,9], staircases [10,11,12,13] and grandstands [14,15,16].
Since a serviceability assessment accounting for the HSI is not an easy task to be performed at the design stage of a new structure, guidelines have been disposed to help designers [17,18,19,20,21,22]. However, despite the use of such regulations, the HSI problem is still under discussion in the scientific community. Indeed, different studies reported disagreements between the guidelines-based serviceability checks performed at the design stage and the experimental evidence [23].
Pushed by the need of a proper model to foresee the structural response under HSI, many research studies have been published on this topic (see [15,24,25,26,27,28]). Furthermore, some reviews are also present in the literature [29,30,31].
Among the possible ways in which the HSI can be treated, one is related to the idea of splitting the human effect in two parts, an active one and a passive one: active ground reaction force (AGRF) and passive ground reaction force (PGRF), respectively [11,13,32,33,34,35]. The AGRF is defined as the ground reaction force (GRF) exerted by a person while he/she walks along a structure with infinite stiffness, while the PGRF is defined as the GRF exerted by a pedestrian as a response to the vibration of the structure. The definition of PGRF can be seen as coincident with that of the dynamic stiffness of the human body [36], which is the frequency response function (FRF) [37] between the structural displacement at the contact point and the consequent force exerted by the pedestrian on the structure itself.
Such an approach relies on two assumptions: (a) the vibration of the host structure does not affect the AGRFs exerted by the pedestrians that are present on the structure, and (b) non-linear phenomena are negligible. Fulfilment of points (a) and (b) allows for the application of the superimposition principle.
As for point (b), it is well known that, in the case of low lateral stiffness of the structure, a crowd-structure synchronisation may occur. Particularly, the phenomenon is triggered when a perceptible level of lateral vibration is reached, leading to a complex non-linear interaction (lock-in effect [38]). Conversely, for the vertical direction, the vibration levels usually observed in practical cases do not reach values able to either trigger non-linear interactions (fulfilment of point (b)) or alter the AGRF (fulfilment of point (a)).
To summarise, in order to apply the superimposition principle (AGRF + PGRF), it is necessary to have negligible lateral vibrations, i.e., high lateral stiffness or low lateral excitation. Such a case is often met in practice, and different works in the literature report successful comparisons with experimental results in terms of vibration prediction for structures occupied by moving people (e.g., [11,13,32]). The applicability conditions for the superimposition principle are assumed to be here satisfied. The discussion now focuses on the treatment of the active and passive components.
As for the AGRF, its implementation in the HSI models is well established. It is usually approximated by the first harmonics of its Fourier series, both in the literature [1,8,39] and by regulations [17,18,20,22]; alternatively, its force time history, acquired through a force platform [11], is directly applied in the HSI model. Sometimes, a statistical approach is adopted for the selection of the Fourier series parameters [28,32,33], or the acquired force time histories are further elaborated to develop statistical generators of vertical active forces [34,40].
Regarding the passive contribution, the PGRF represents the response given by the human body when exposed to the vibration of the structure, i.e., the human body dynamic stiffness, as aforementioned. Therefore, it can be experimentally identified. Once the dynamic stiffness curve is obtained, it can be directly applied in the HSI model [10,11] or used to tune a chosen passive model (e.g., a lumped mechanical system [41]) to be then applied to the model of the empty structure. In practical cases, the apparent mass (AM), which is the FRF [37] between the structural acceleration at the contact point and the consequent force exerted by the pedestrian on the structure itself, is usually measured in place of the dynamic stiffness [36,41]. The dynamic stiffness H and the AM M a for a generic subject are defined as
H j ω = F PGR j ω x j ω
M a j ω = F PGR j ω x ¨ j ω
where j is the imaginary unit, ω is the angular frequency, x is the structure displacement, x ¨ is the structure acceleration, and F PGR is the force exerted by the pedestrian on the structure (i.e., PGRF) in response to structure vibration (see also Section 4.1 for further details).
A question arises about which AM curves must be considered in an HSI model. Indeed, different factors must be taken into consideration:
  • Intra-subject variability: the AM curve of the same person in a given posture is affected by a natural dispersion;
  • Inter-subject variability: the AM curves of different people in the same posture are different;
  • Posture: the AM curve of the same person changes when the posture changes (e.g., during the motion). Indeed, the AM has been found to depend on the body characteristics and, consequently, the posture [11,36].
Actually, there is no study that fully analyses the effects of the previous points and indicates which of them should be considered more than the others, but this aspect is important to develop a reliable and accurate HSI model. For this reason, the present work aims at verifying which aspects have more influence on the passive pedestrian interaction.
For example, in the case of a relevant contribution of all the previous three points (see the previous numbered list), a long experimental campaign will be required to properly reproduce the passive behaviour of a crowd. Conversely, if one of them results in being predominant over the others, that will simplify the crowd characterisation. For instance, if a predominant effect of the body posture is found, a low number of tested subjects will be required, but more care should be paid in the analysis of the single-step motion. On the other hand, if a dominant contribution of either the intra- or inter-subject variability is discovered, either a large number of tests per subject or a large number of involved subjects in the tests will be required, respectively.
It is recalled that the aim of the HSI study is the assessment of the effect that people have on the characteristics of the host structure, and hence, on its dynamic properties. For this reason, the evaluation of the effects of the above-mentioned factors on the PGRF (see the numbered list discussed previously) is performed here by looking at the variations of the modal parameters (i.e., eigenfrequencies and non-dimensional damping ratios) of the structure. Thus, all the measured AM curves are herein applied to a reference structure, and then the modal parameters of the occupied structure are assessed. In more detail, a staircase is taken as a reference structure because, with this type of structure, the variability of the human body posture, and hence of the AM, is greater than the one that occurs while walking over a flat surface [11]. Thus, a staircase allows for considering a more general case.
The structure of the paper is as follows. At first, the characterisation of the passive pedestrian contribution is reported in Section 2. Then, the structure used as a reference is presented in Section 3, followed by the description of the mathematical treatment used to reproduce the HSI coupling and the statistical treatment of the results in Section 4. Finally, all the results and their discussion are presented in Section 5.

2. Passive Pedestrian Contribution

The passive contribution exerted by a pedestrian on the structure is represented by the dynamic response of the body to the vibration of the ground, that is, the AM of her/his body. Hence, to analyse the passive pedestrian contribution, the AM curves must be measured. For this purpose, an experimental campaign was executed to identify the AM curves of five subjects (Section 2.2 and Section 2.3). However, since the AM strongly depends on the posture of the body, a motion analysis is performed before in order to identify the most significant positions assumed by the body during walking along a staircase (Section 2.1).

2.1. Motion Analysis

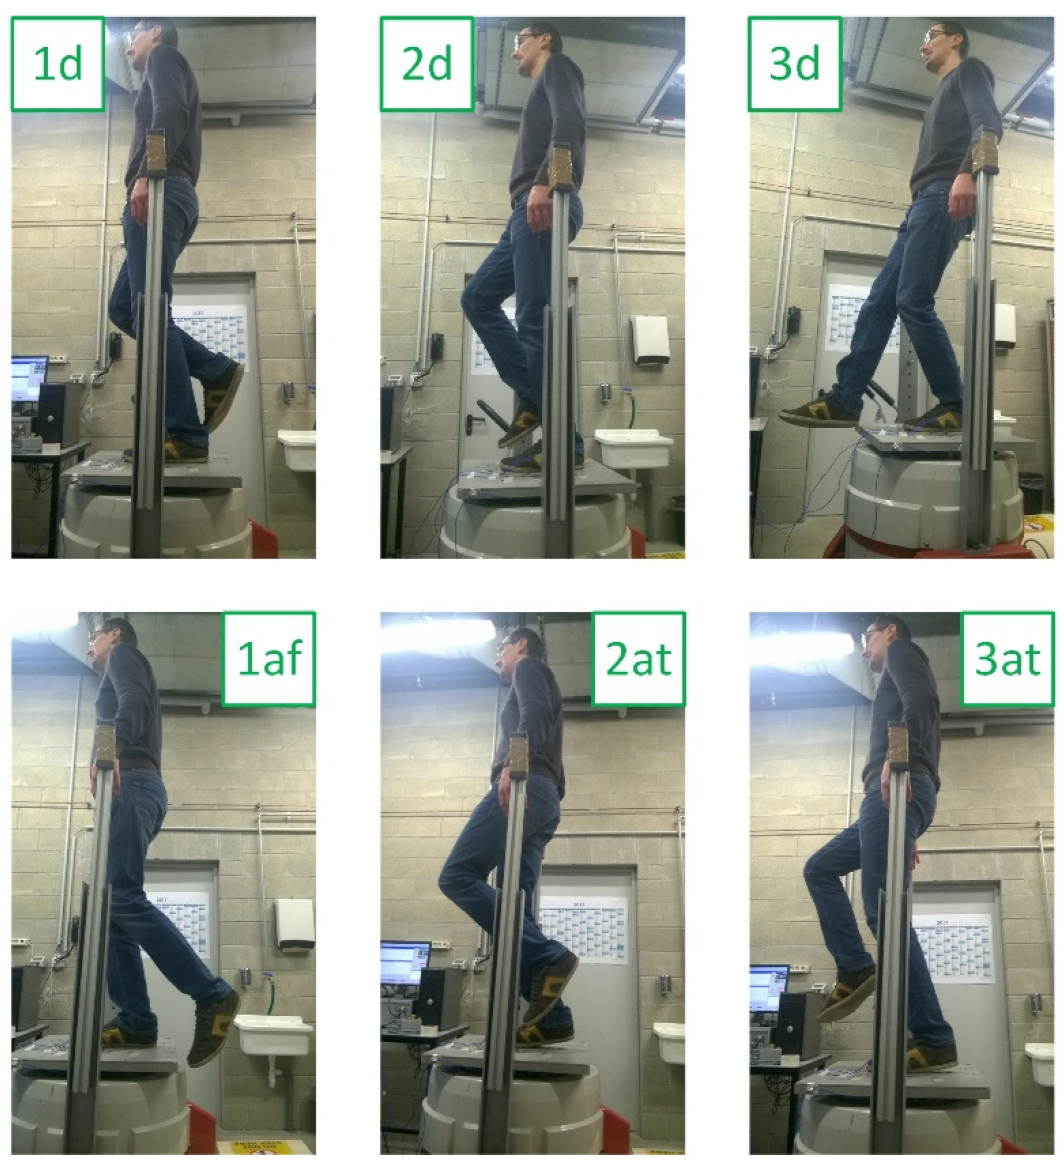
With the goal of identifying the main positions assumed during walking, a motion analysis was executed. It is worth mentioning that the change of posture within a single step is more evident in the case of people who cross staircases rather than flat surfaces. In more detail, both the ascent and the descent were analysed since the postures assumed within the single step are different for the two crossing directions. Figure 1 shows an example of motion analysis for one of the subjects involved in the tests (subject 3 of Table 1). For each crossing direction, the motion of the single step was split in three phases, and a position per phase was taken: positions 1a, 2a and 3a for the ascent; and positions 1d, 2d and 3d for the descent. The positions denoted by 1 represent the first part of the step, those denoted by 2 the central part of the step, and those denoted by 3 the last part.
It is pointed out that, from the motion analysis, it was observed that during the ascent, two types of foot-stair step contacts may occur: full contact of the foot with the step or partial contact of the foot with the step (only the tip part). Consequently, both types of contacts were considered in the investigation of the AM curves for the positions of the ascent. They were named f-type and t-type, which stand for full contact and tip contact, respectively. No significant differences were observed for the descent, where full contact only occurred. Summarizing, three positions were considered for the descent and six for the ascent of the staircase (see Table 2).

2.2. Number and Types of Tests

In order to consider the intra- and the inter-subject variability, the AM curves were measured a different number of times for the same position, for both the feet (intra-variability) and for different subjects (inter-variability).
The whole experimental campaign involved five subjects, whose characteristics are provided in Table 1. The limited number of involved subjects was due to the amount of time required to perform the experimental tests. Indeed, a large number of AM curve measurements were performed for each subject. The subjects were chosen in order to show different combinations of height and mass. It will be shown in Section 5.1.1 and Section 5.1.2 that some conclusions can be reached, even with this low number of tested subjects.

2.3. Measurement of AM Curves

In this section, the acquisition system designed to measure the AM curve is shown, along with a description of the performed tests and the post processing of the data.

2.3.1. Set-Up Description

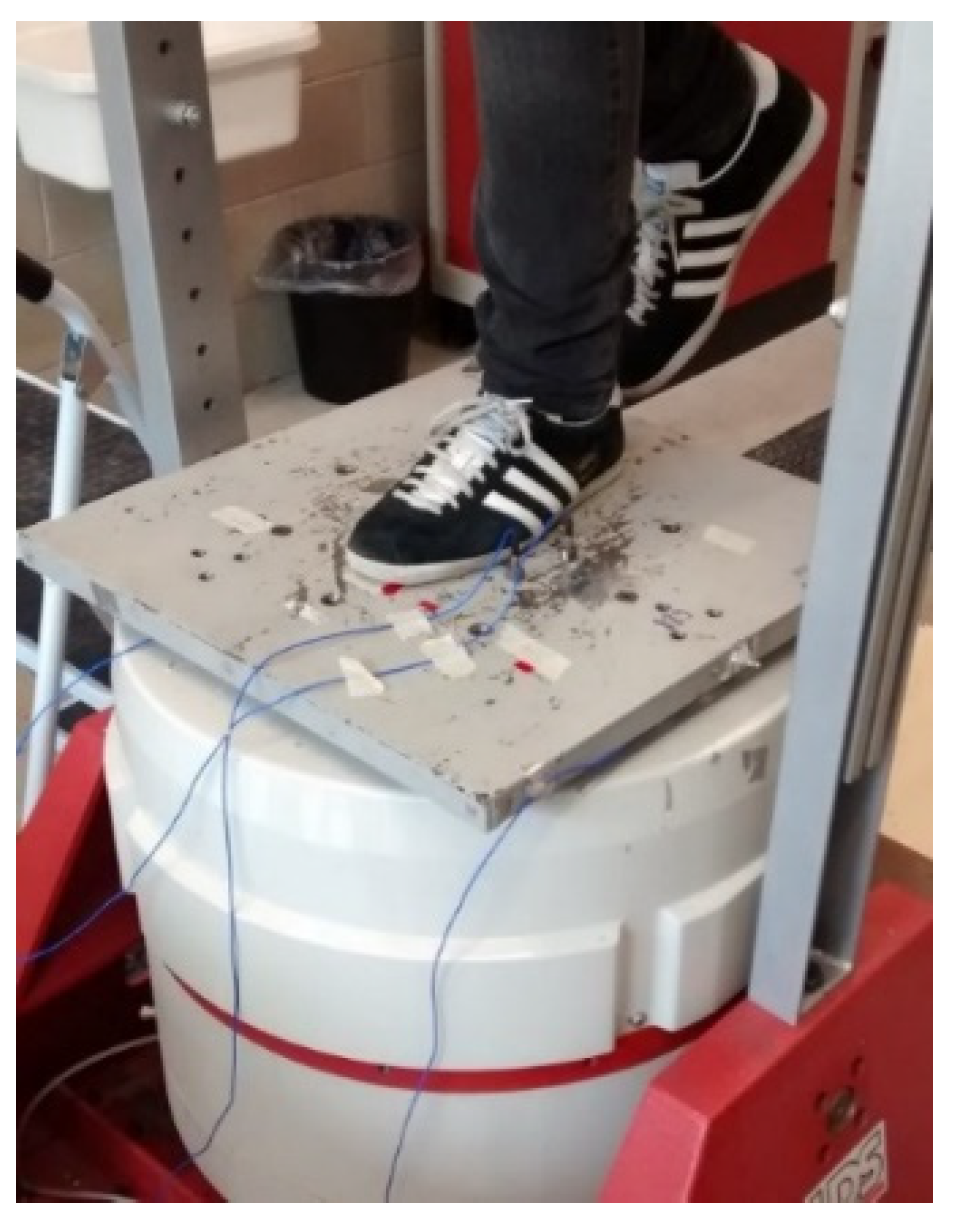
To measure the AM curves of the involved subjects, the ad hoc set-up shown in Figure 2 was developed. The input vibration of the ground to the body was reproduced by means of an electro-dynamic shaker (LDS, model V875), while the exerted PGRF was measured through a force plate located over the shaker. For more details on the set-up, refer to [42]. Each subject was placed over the dynamometric plate for the measurements. Note that the dynamic contribution of the force plate was filtered out from the acquired measurements during data post-processing. The acceleration profile supplied by the electrodynamic shaker was set to be a white noise profile with a root mean square (RMS) value of 0.25 ms 2 , in a frequency range between 3.5 and 20 Hz. This RMS value was set in agreement with the ones adopted in the literature, and it is close to those observed in practical cases. As for the frequency range, it was chosen to include the modes of the studied structure that are influenced by the PGRF (i.e., the ones within the range 0–20 Hz [10,36]; see Section 3). Indeed, the influence of the PGRF is mainly evident at resonance [10].
Figure 3 shows the tests for the measurement of the AM curves for subject 5 in different postures.

2.3.2. Description of the Test

With the equipment just described above (Section 2.3.1), the AM curves of the nine positions (see Table 2) were measured for each of the five subjects. For all the selected positions, the corresponding AM curves were acquired for both the feet, leading to a total of 18 AM curves per subject. All these 18 curves per subject were acquired different times in order to assess the intra-subject variability. The time length of the collected signals was 20 s for each test.

2.3.3. Post-Processing of Data

The estimator H 1 [43] was used to estimate the AM curves. The frequency resolution of the resulting AM curves was 0.5 Hz because sub-records of 2 s were extracted from the whole time-history and used for the averaging process [43]. The length of 2 s was selected to have enough sub-time-histories for the averaging process.
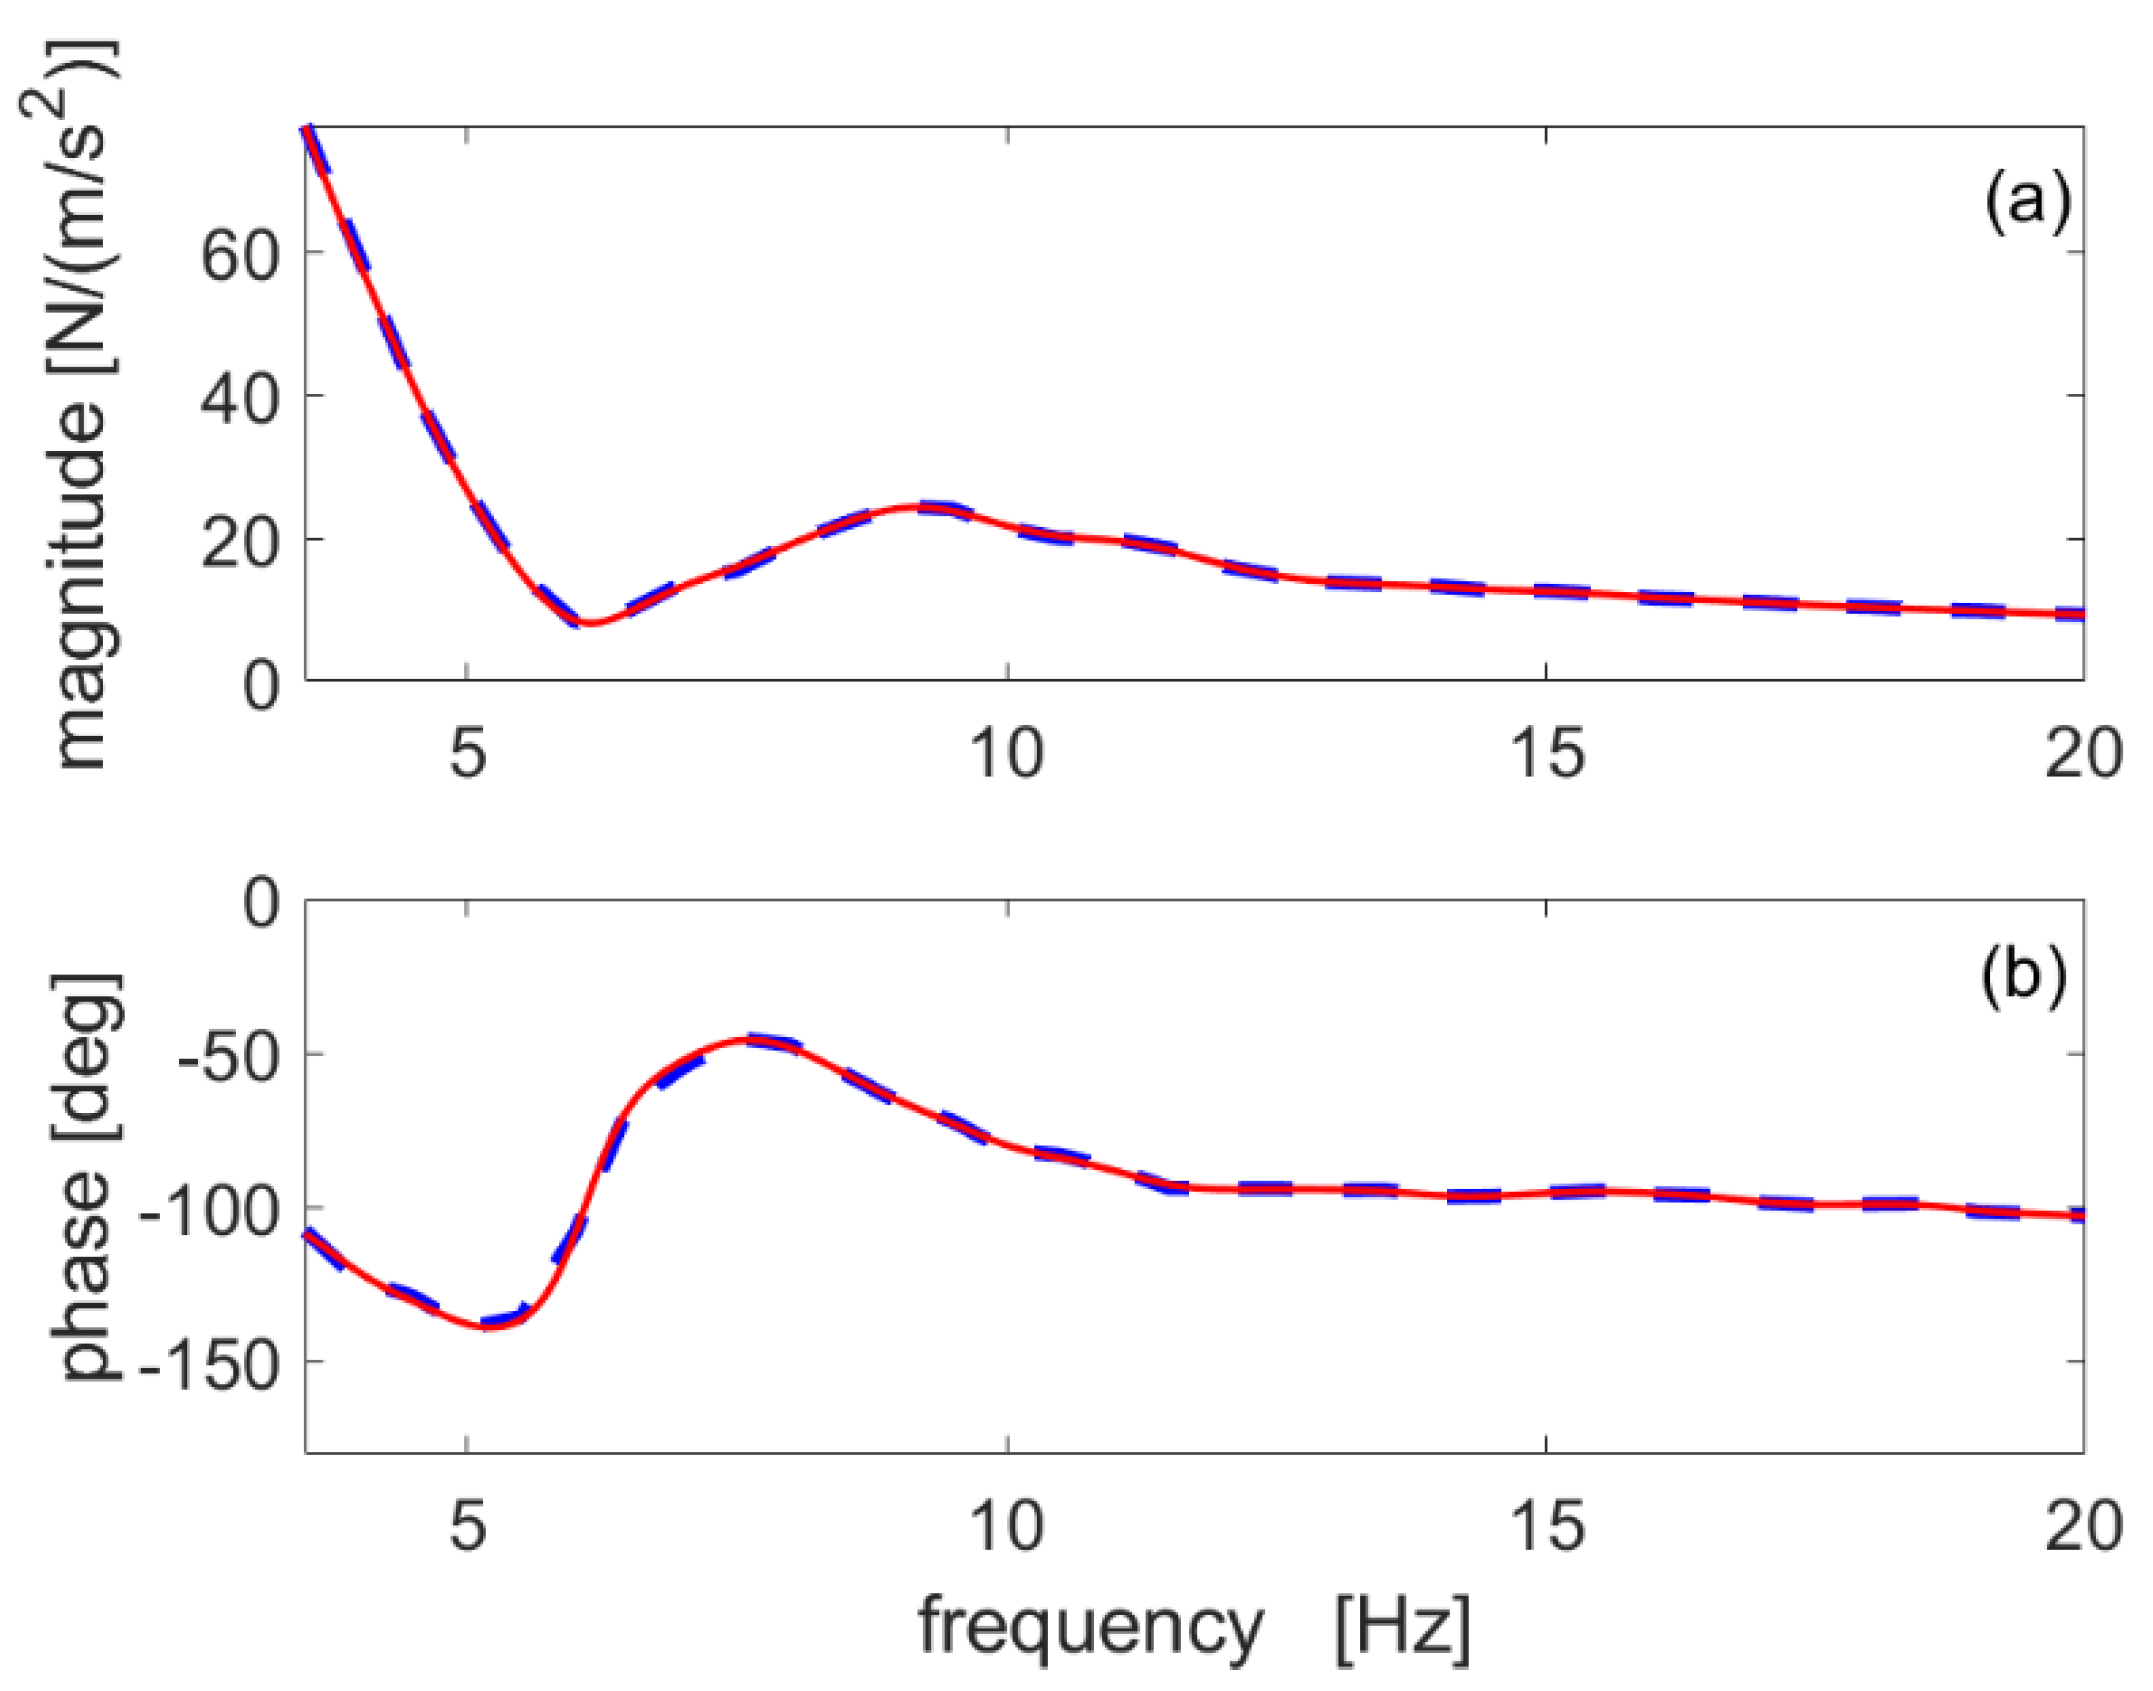
Figure 4 reports an example of H 1 estimation (dashed line) of the AM curve of subject 5 in position 3af on the left foot. The whole set of measured AM curves of the five subjects, for the different positions, are reported in “Appendix A”. For the sake of clearness of the plots, the AM curves reported in the Appendix A are the average AM curves per position of each subject.
The frequency resolution of the AM curves was then increased in order to allow for the applicability of the procedure for the numerical simulation of the passive HSI, as will be later explained in Section 4. Hence, the AM curves were resampled with a frequency resolution of 0.01 Hz by means of a cubic smoothing spline interpolation in the frequency domain. Such a procedure was allowed by the regularity of the AM curves with 0.5 Hz of resolution. Thus, no change of information was experienced by resampling, as proved by the superposition of the solid (resolution of 0.01 Hz) and dashed (resolution of 0.5 Hz) curves in Figure 4.
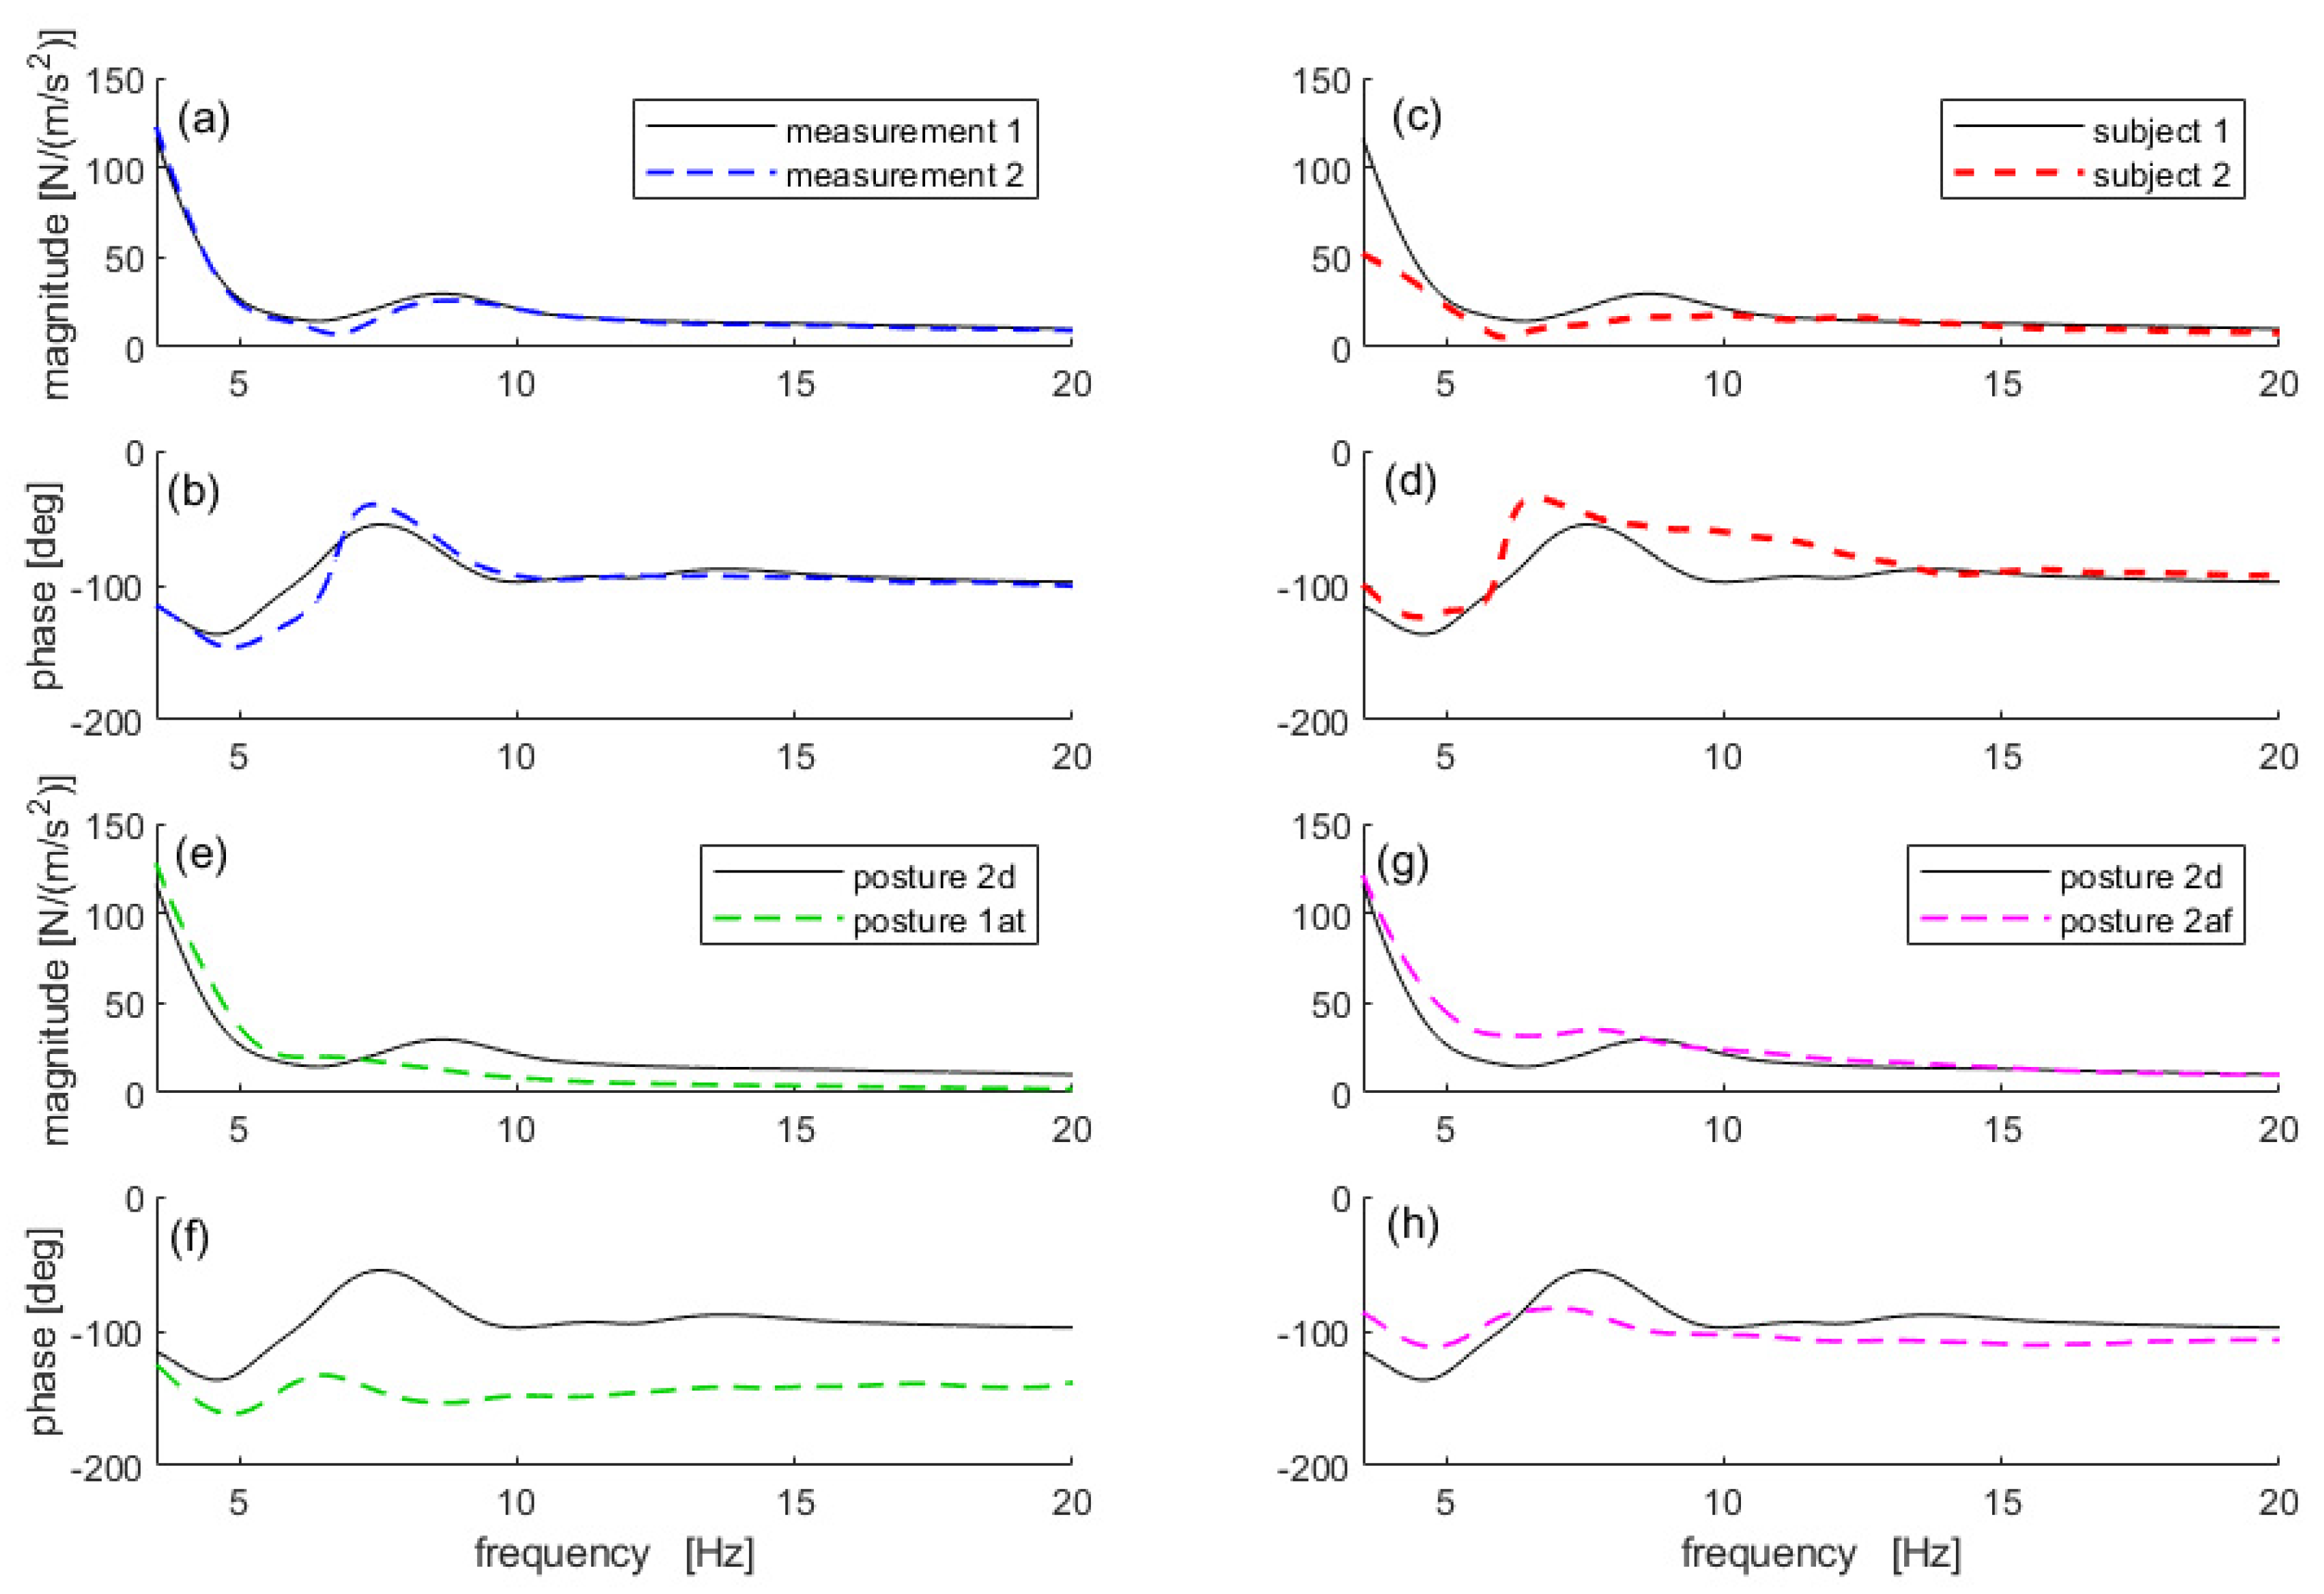
As examples, some of the measured AM curves are reported in the following. Figure 5a,b shows two measurements of the AM curve of subject 1 in position 2d. The differences between the two AM curves are due to the intra-subject variability. Then, the AM curves of subject 1 and 3, always for position 2d, are reported in Figure 5c,d. Now the differences are due to the inter-subject variability. Finally, comparisons among the measured AM curves of subject 1 for different postures are reported in Figure 5e,f (position 2d and position 1at) and Figure 5g,h (position 2d and position 2af).

3. Reference Structure

The structure taken into consideration was a staircase already studied in [44,45]. This staircase was suitable for the HSI analysis since it is characterised by the lively dynamics of its first modes, given by its geometry and material composition (steel core and marble steps).
Since the HSI was numerically simulated by coupling the measured AM curves with the model of the empty structure, a modal description of the latter was required. Thus, an experimental campaign for the evaluation of the eigenfrequencies, non-dimensional damping ratios and scaled mode shapes was performed. The considered frequency range was chosen to include the modes of the structure influenced by the presence of the pedestrians. The structure was instrumented with accelerometers and excited through an electro-dynamic shaker (LDS, model V406). The acquired data were processed by means of experimental modal analysis (EMA) (least square complex frequency domain estimation [46]), and the modal parameters were extracted. Table 3 shows the eigenfrequencies f i and the non-dimensional damping ratios ξ i of the first two modes of the structure. The eigenfrequencies are indicated as f i (expressed in Hertz) or ω i (where f i = ω i / 2 π ) in the following. Just the first two modes were considered since they are the ones in the frequency range significantly affected by the PGRFs. Even if the third one was found to be around 16 Hz, it was discarded since its eigenvector components were found to be significantly lower than those of the first two modes. Moreover, the AM magnitude strongly decreases at that frequency. These two points together imply a negligible variation of the modal parameters due to HSI [10].

4. Pedestrian–Structure Coupling

To evaluate the effect of the different AM curves on the HSI problem, changes in the modal parameters due to the presence of pedestrians were considered. Therefore, the empty structure was numerically simulated by means of its modal parameters, and the AM curves of each subject in the different postures were applied in turn to it.
At first, a point of the structure was selected for coupling the AM curves. For this purpose, node 12 of the discretised structure (Figure 6) was selected. Such a point, which belongs to the second staircase landing, is characterised by high mode shape components of the two considered modes. This increases the HSI effect.

4.1. Analytical Model and Its Implementation

From the modal parameters of the empty structure (Section 3), the FRFs of the empty staircase between the generic external force F applied to the structure and the structural displacement x , for the nodes in which the structure was discretised (Figure 6), are available and stored in the following G matrix [37]:
G j ω = x j ω F j ω = i = 1 N ϕ i ϕ i T ω 2 + j 2 ξ i ω i ω + ω i 2
where x j ω and F j ω are the column vectors that contain the x and F spectra, respectively, for each node of the structure, ϕ i is the i-th mode shape vector normalised to the unit modal mass, N is the number of modes taken into consideration (i.e., N = 2 in this case), and the superscript T indicates the transposed matrix. The generic element of G will be referred to as G .
Adopting the approach introduced in [10], it is possible to account for the passive contribution of a generic number of pedestrians placed at any points of the discretised structure. The expression of the new FRFs of the occupied structure (i.e., structure under HSI), which are stored in the G H j ω matrix, is
G H = G 1 + W H W T 1 = G G W H 1 + W T G W 1 W T G
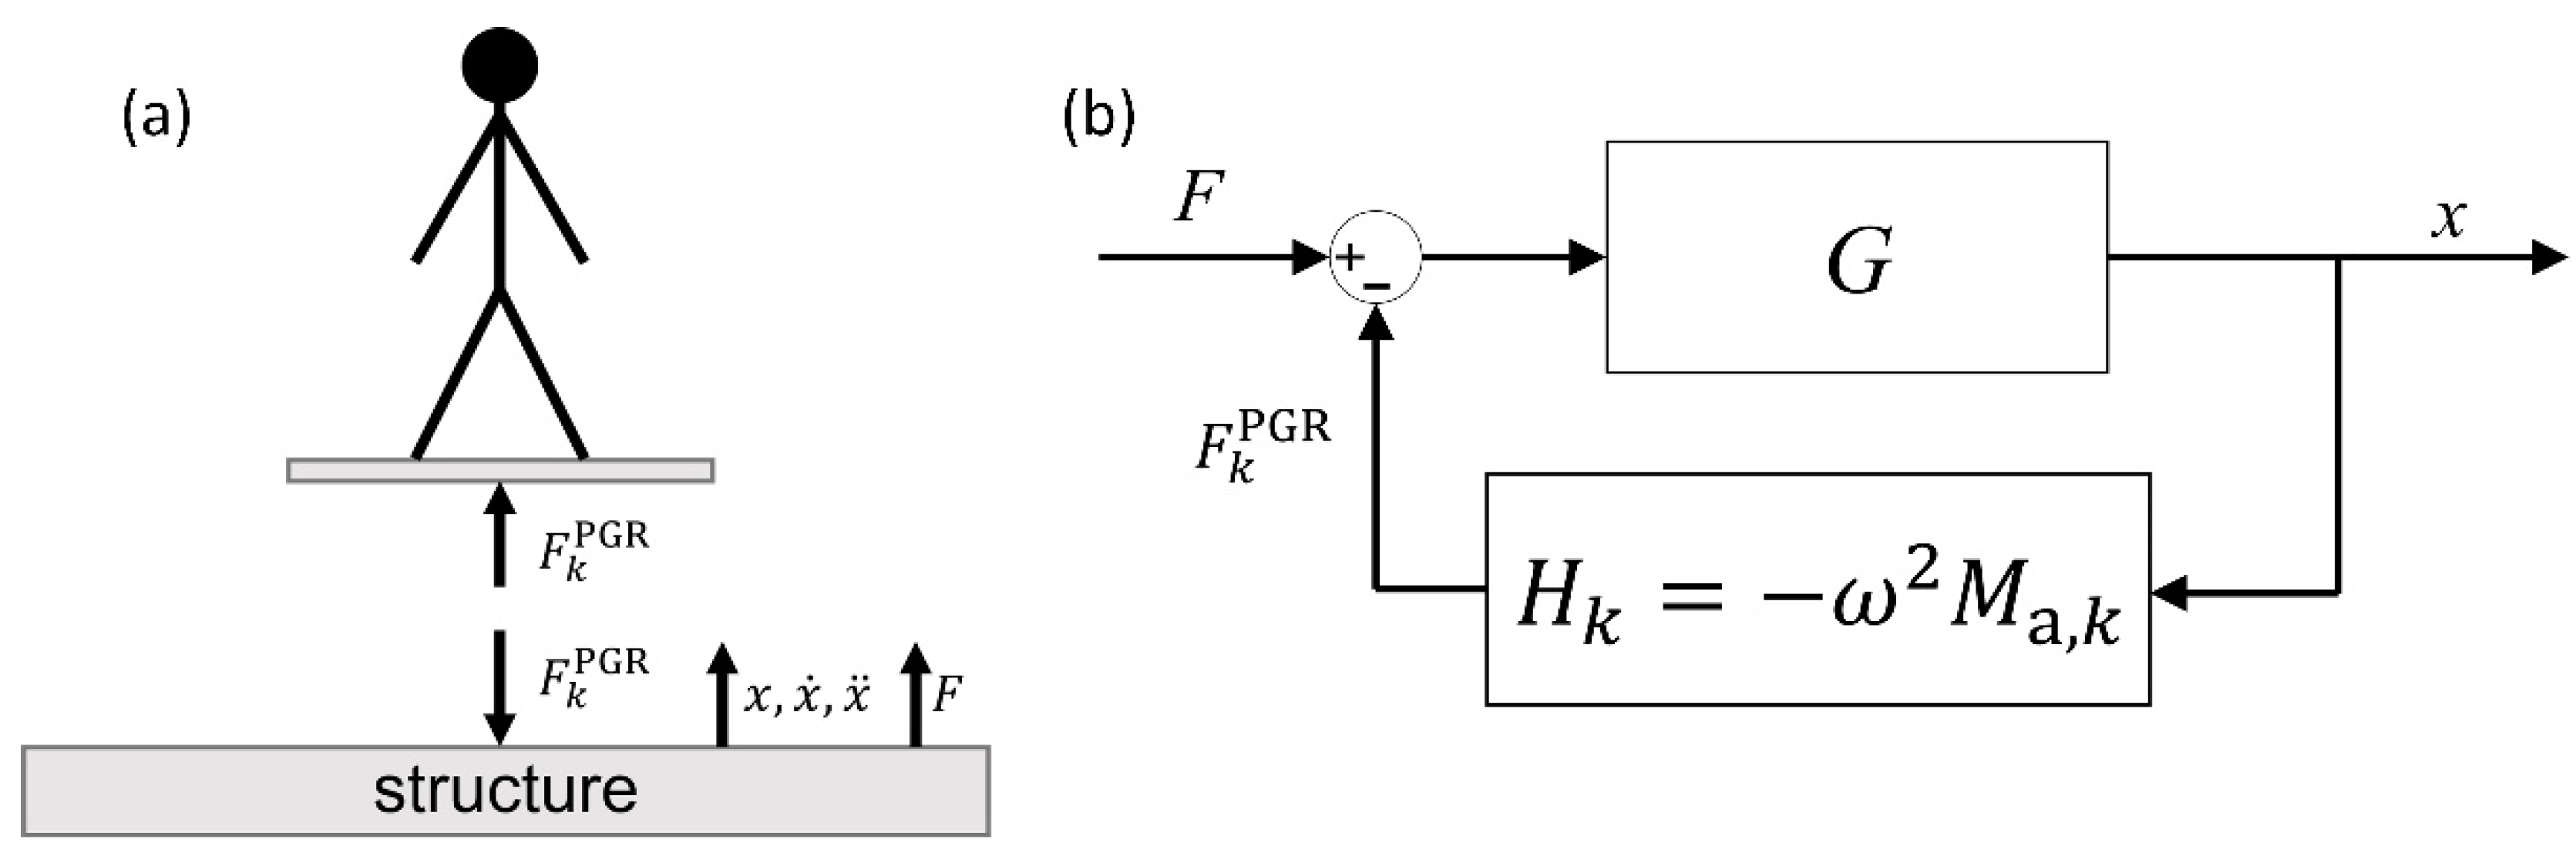
The convention of sign adopted is shown in Figure 7a. The generic element of G H will be referred to as G H .
The right-hand term of Equation (4) is derived by means of the Woodbury identity [47]. In Equation (4), W is an auxiliary matrix used to couple each pedestrian with a given node of the structure, while H is a diagonal matrix containing the dynamic stiffness curves of the pedestrians. The dynamic stiffnesses can be replaced by the AMs in the matrix H , noticing that for the k-th pedestrian,
H k j ω = ω 2 M a , k j ω
It is noticed that such an approach applies to time-invariant AM curves of the involved subjects and, therefore, for fixed body postures, like a frame of the whole motion.
Since the final aim is to assess the effect of each AM on the modal parameters of the structure, one AM at a time was coupled with node 12 of the structure (i.e., supposing a single subject on the structure). The same node was taken to evaluate the FRFs between F and x of the occupied structure (i.e., co-located FRFs were considered). However, since the eigenfrequencies and non-dimensional damping ratios do not change with the considered FRF, any other FRF could be used. Therefore, for the studied case (i.e., single input-single output FRF at node 12 and one pedestrian at a time), Equation (3) reduces to
G j ω = i = 1 N Φ r , i 2   ω 2 + j 2 ξ i ω i ω + ω i 2
where Φ r , i is the eigenvector component at node r = 12 for the i-th mode (scaled to the unit modal mass). Furthermore, Equation (4) reduces to
G H j ω = G 1 + H k 1 = G 1 + G H k = G 1 ω 2 G M a , k
The third term of Equation (7) clearly highlights the nature of the passive HSI, which is a negative feedback loop through H k on the displacement of the structure (see Figure 7b).
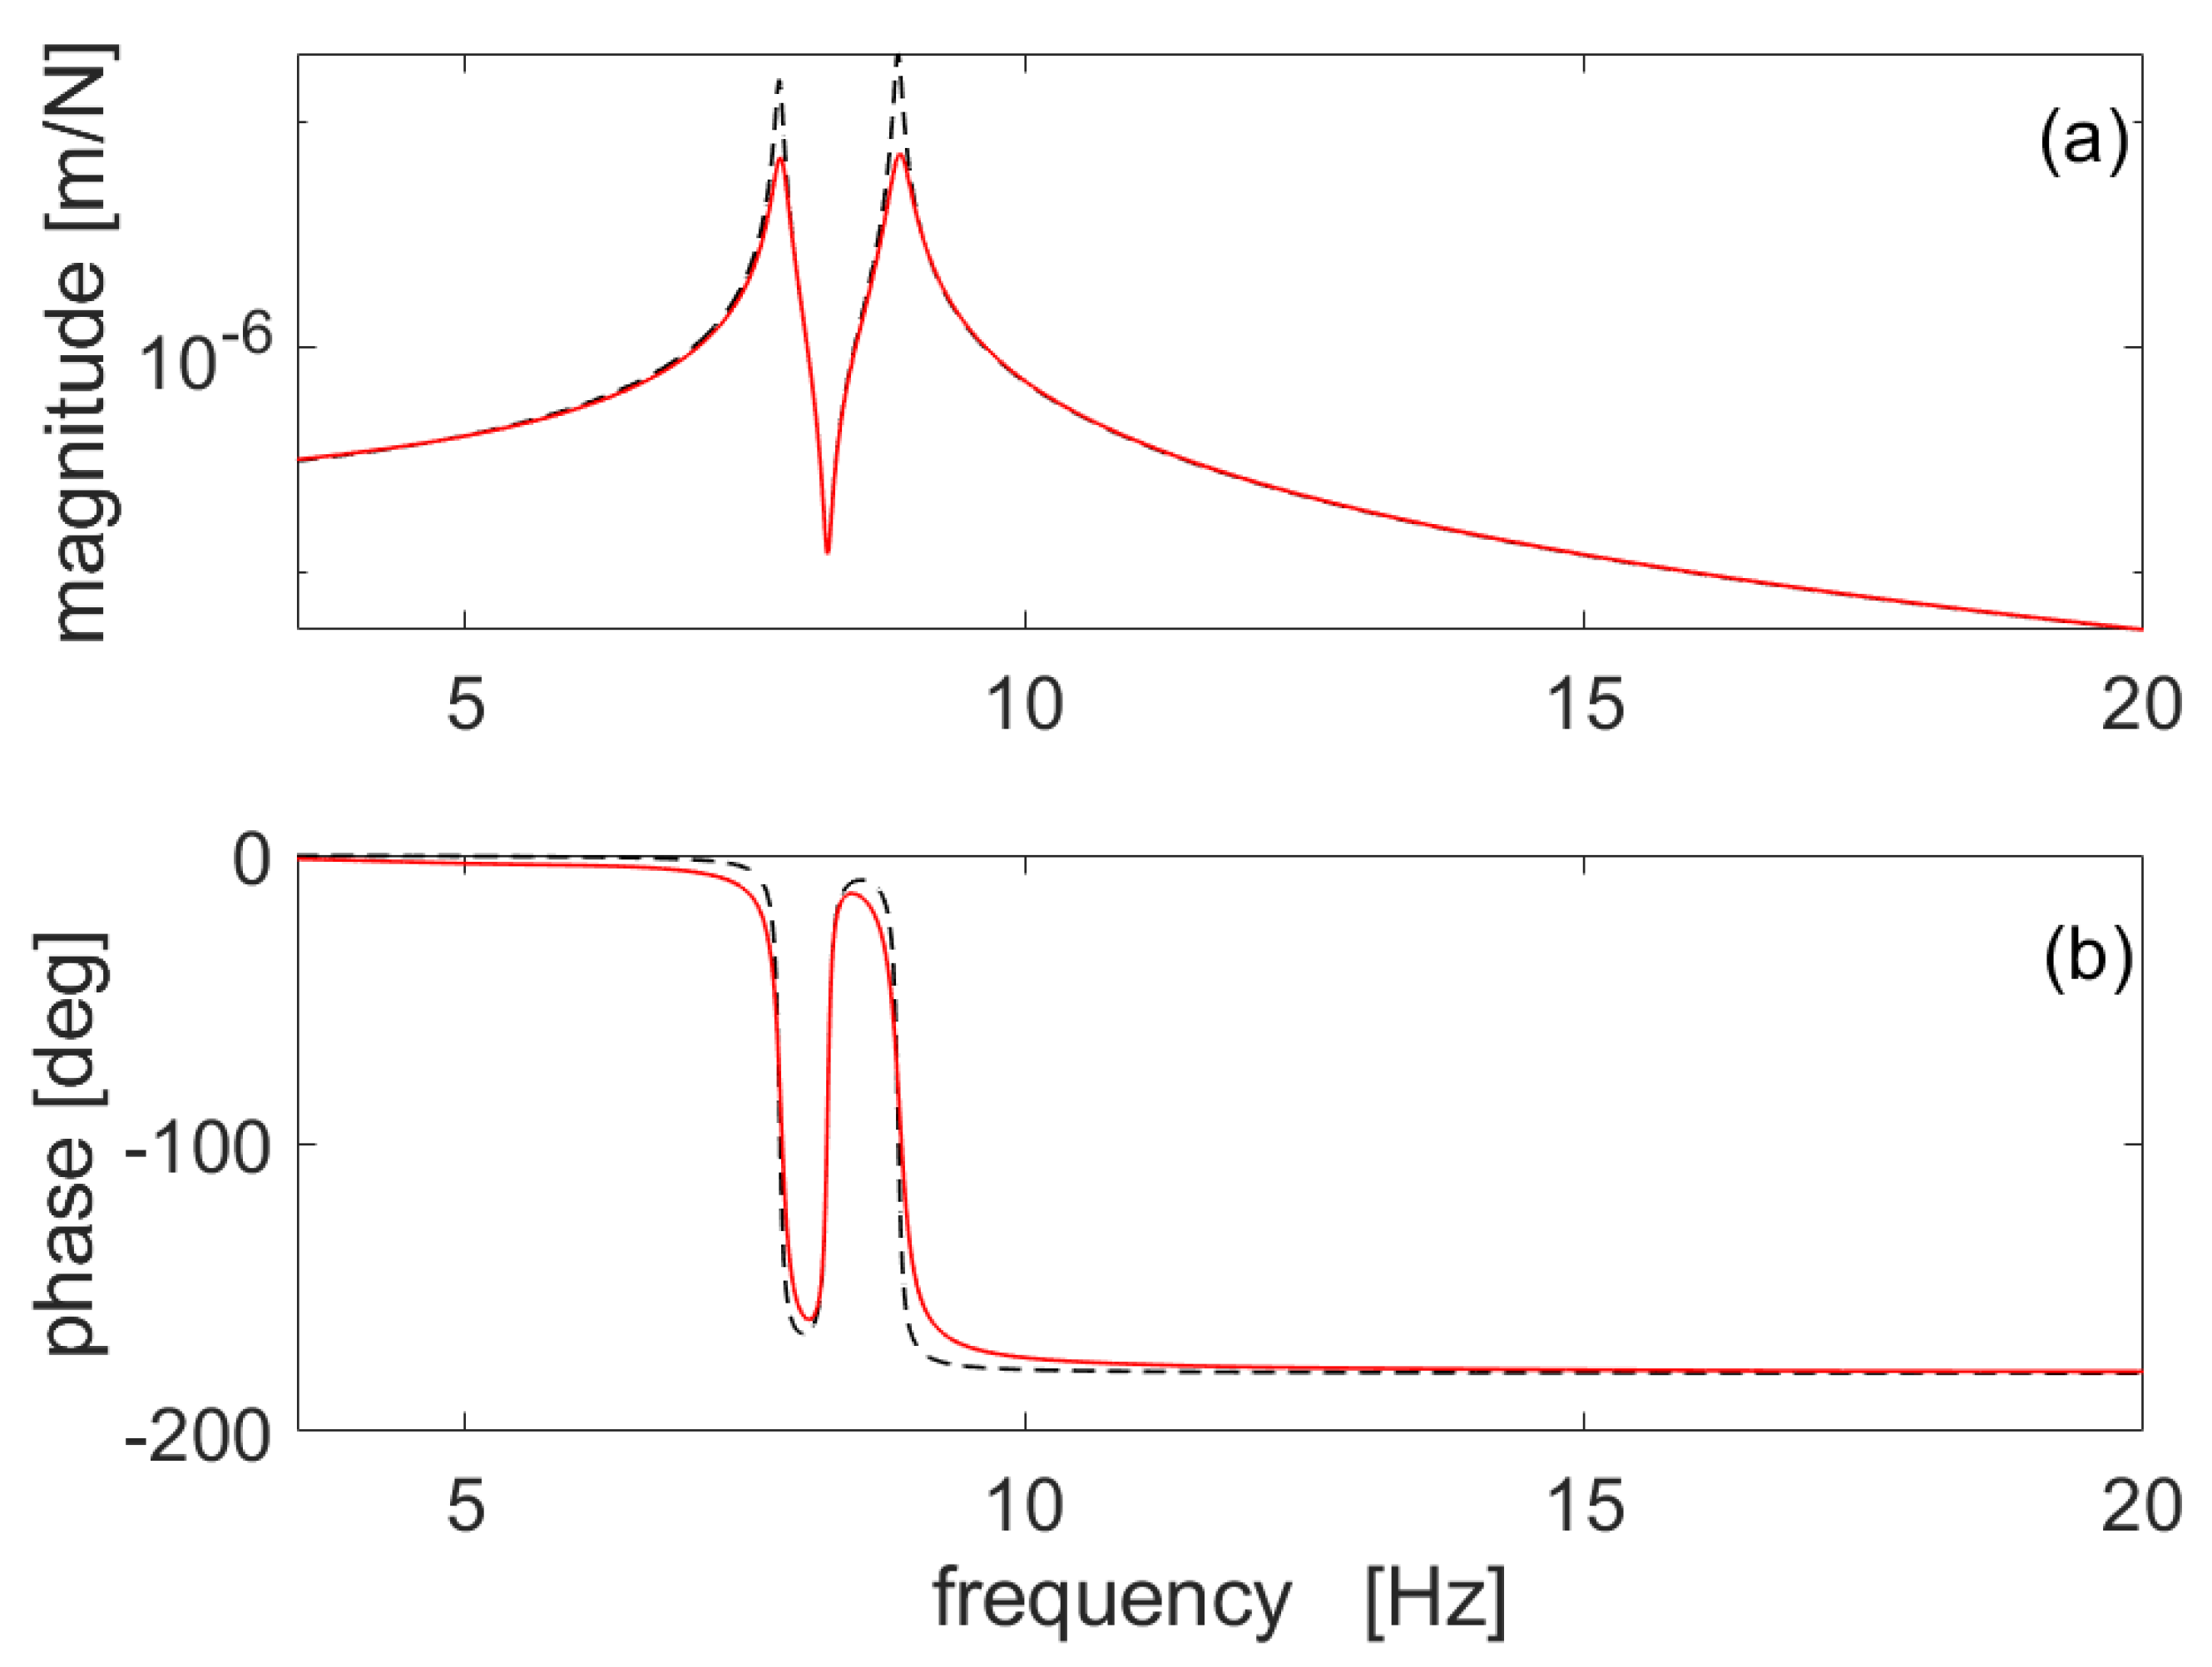
This analytical procedure was implemented and applied to all the measured AM curves to numerically reproduce the reference structure occupied by a pedestrian in a still position, obtaining in this way a series of G H j ω . Figure 8 shows an example of the co-located FRF of the occupied structure G H j ω computed with Equation (7) (solid line), compared with the equivalent FRF of the empty structure G j ω (dashed line). It is possible to prove that the contribution of a single subject is able to significantly increase the non-dimensional damping ratios of the structure.
Once all the FRFs G H j ω were available, the EMA [46] was performed on them to evaluate the new modal parameters of the occupied structure (i.e., eigenfrequencies and non-dimensional damping ratios).
In this section, the analytical procedure to reproduce the passive HSI coupling is shown. Regarding its experimental validation, it was already performed in [10]. Therefore, no further validation was carried out, and the analytical procedure was considered correct.

4.2. Statistical Treatment

The analytical procedure described in Section 4.1 was performed for all the measured AM curves. Then, the estimation of the new modal parameters was performed for each of them. Since for a specific subject (five in total; see Table 1), and for a specific position (nine positions in total; see Table 2), the corresponding AM curve was identified a different number of times (ten on average, see Section 2.3.2 and Section 2.3.3), an equivalent number of modal parameters (i.e., eigenfrequencies f ^ 1 and f ^ 2 and non-dimensional damping ratios ξ ^ 1 and ξ ^ 2 ) of the occupied structure were identified. It is noted that to distinguish between modal parameters of the empty and occupied structure, a hat was added to the latter ones.
In order to represent the statistical distribution of a new modal parameter, the distribution of the sample mean was described through its mean (i.e., mean of the sample mean: μ ¯ ) and dispersion (i.e., dispersion of the sample mean). Such a distribution results in being normal because of the central limit theorem [48]. However, if the normal distribution of a parameter is obtained starting from a sample of small size (as it is in the present study), the guide [48] suggests to use a Student’s t-distribution. Therefore, the boundaries of the dispersion interval of the sample mean value were obtained as follows:
μ ¯ ± t α , ν s n
where s is the sample standard deviation, n is the number of tests for a subject in a posture, t α , ν is the coverage factor of the Student’s t-distribution with ν degrees of freedom (equal to n − 1) and a probability equal to α . In the present study, α was set in order to have a 95% confidence interval.

5. Tests and Results

5.1. Passive HSI Effect

In the following subsections, the obtained eigenfrequencies (Section 5.1.1) and non-dimensional damping ratios (Section 5.1.2) are reported for the reference structure coupled with the pedestrians adopting the procedure shown in Section 4.1. For each modal parameter, the results are displayed for each subject (see Table 1 for the list of the subjects) and for each position (see Table 2 for the list of the positions).

5.1.1. Change in Eigenfrequencies

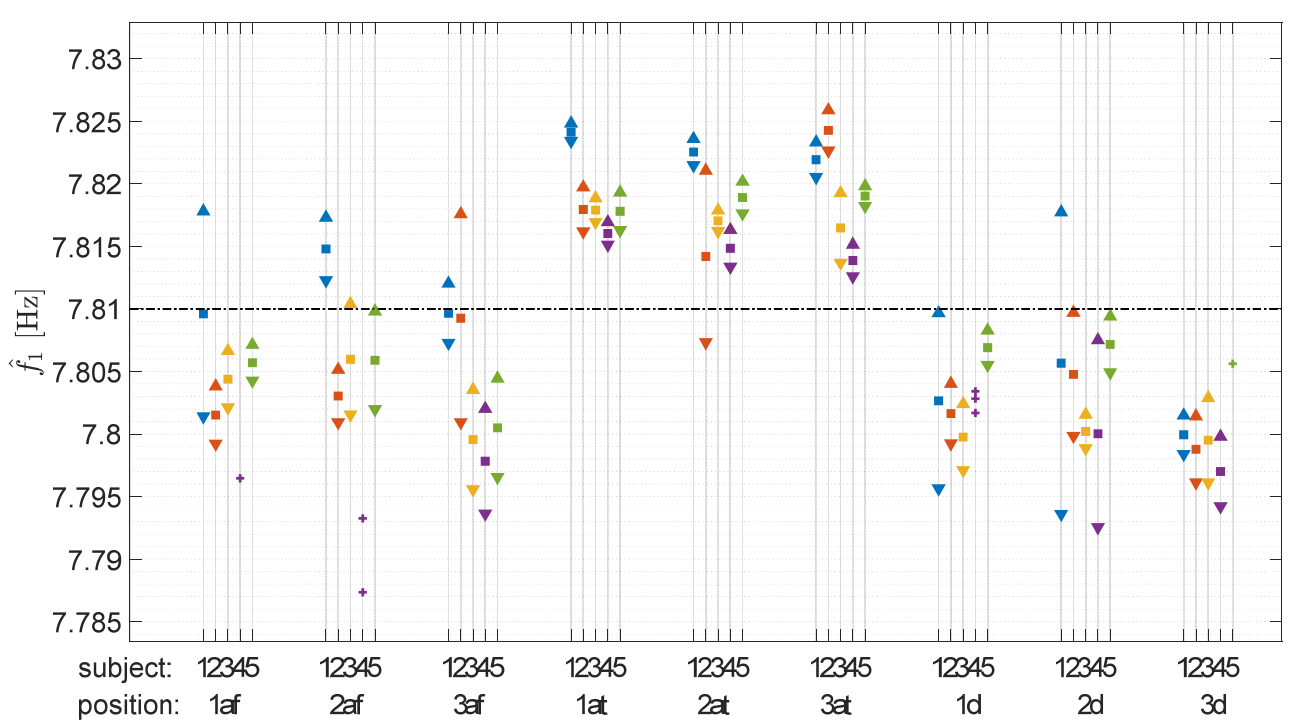
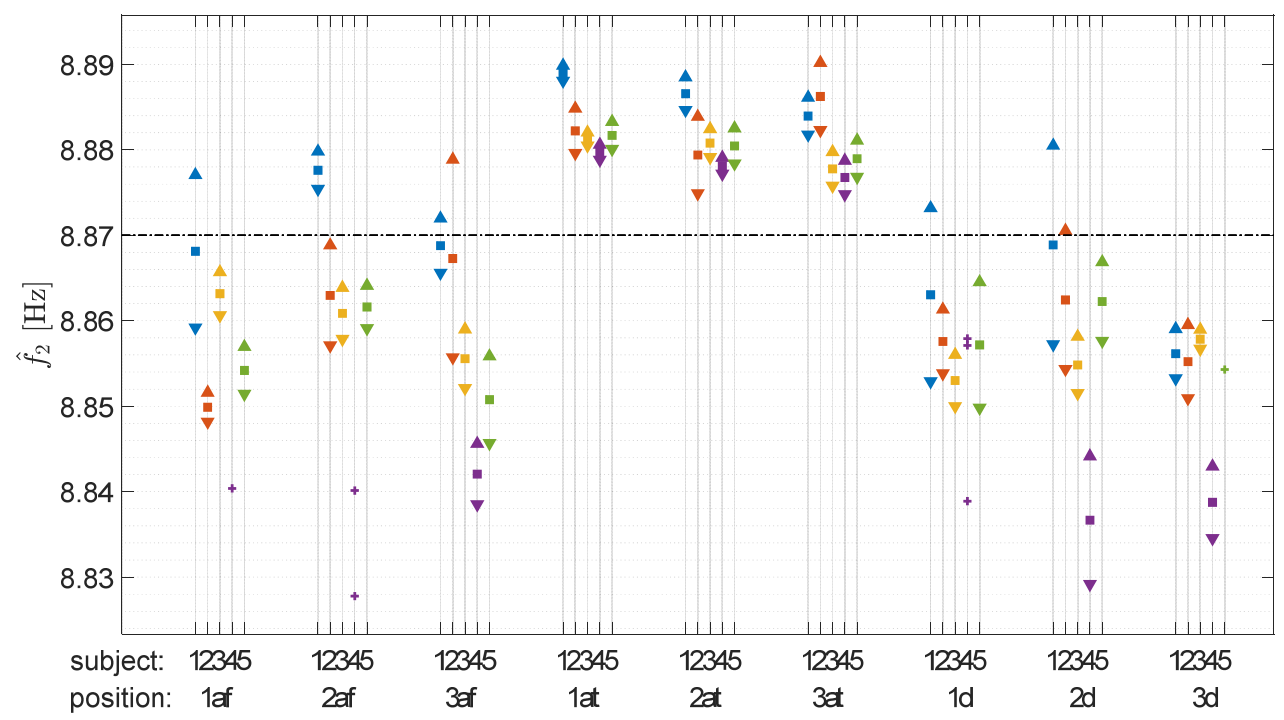
Figure 9 and Figure 10 report the intervals of f ^ 1 and f ^ 2 , respectively. Along with the results of the simulations, the values of the empty structure (see Table 3) are shown with dash-dotted lines. The values of the single tests are reported with plus signs (+), without indications about μ ¯ and μ ¯ ± t α , ν s n , in case fewer than four tests were available for a position of a subject. This sometimes occurred because of the difficulty in keeping an uncomfortable still posture during the measurements.
The figures show that a single pedestrian is able to change the first eigenfrequencies of the considered structure.
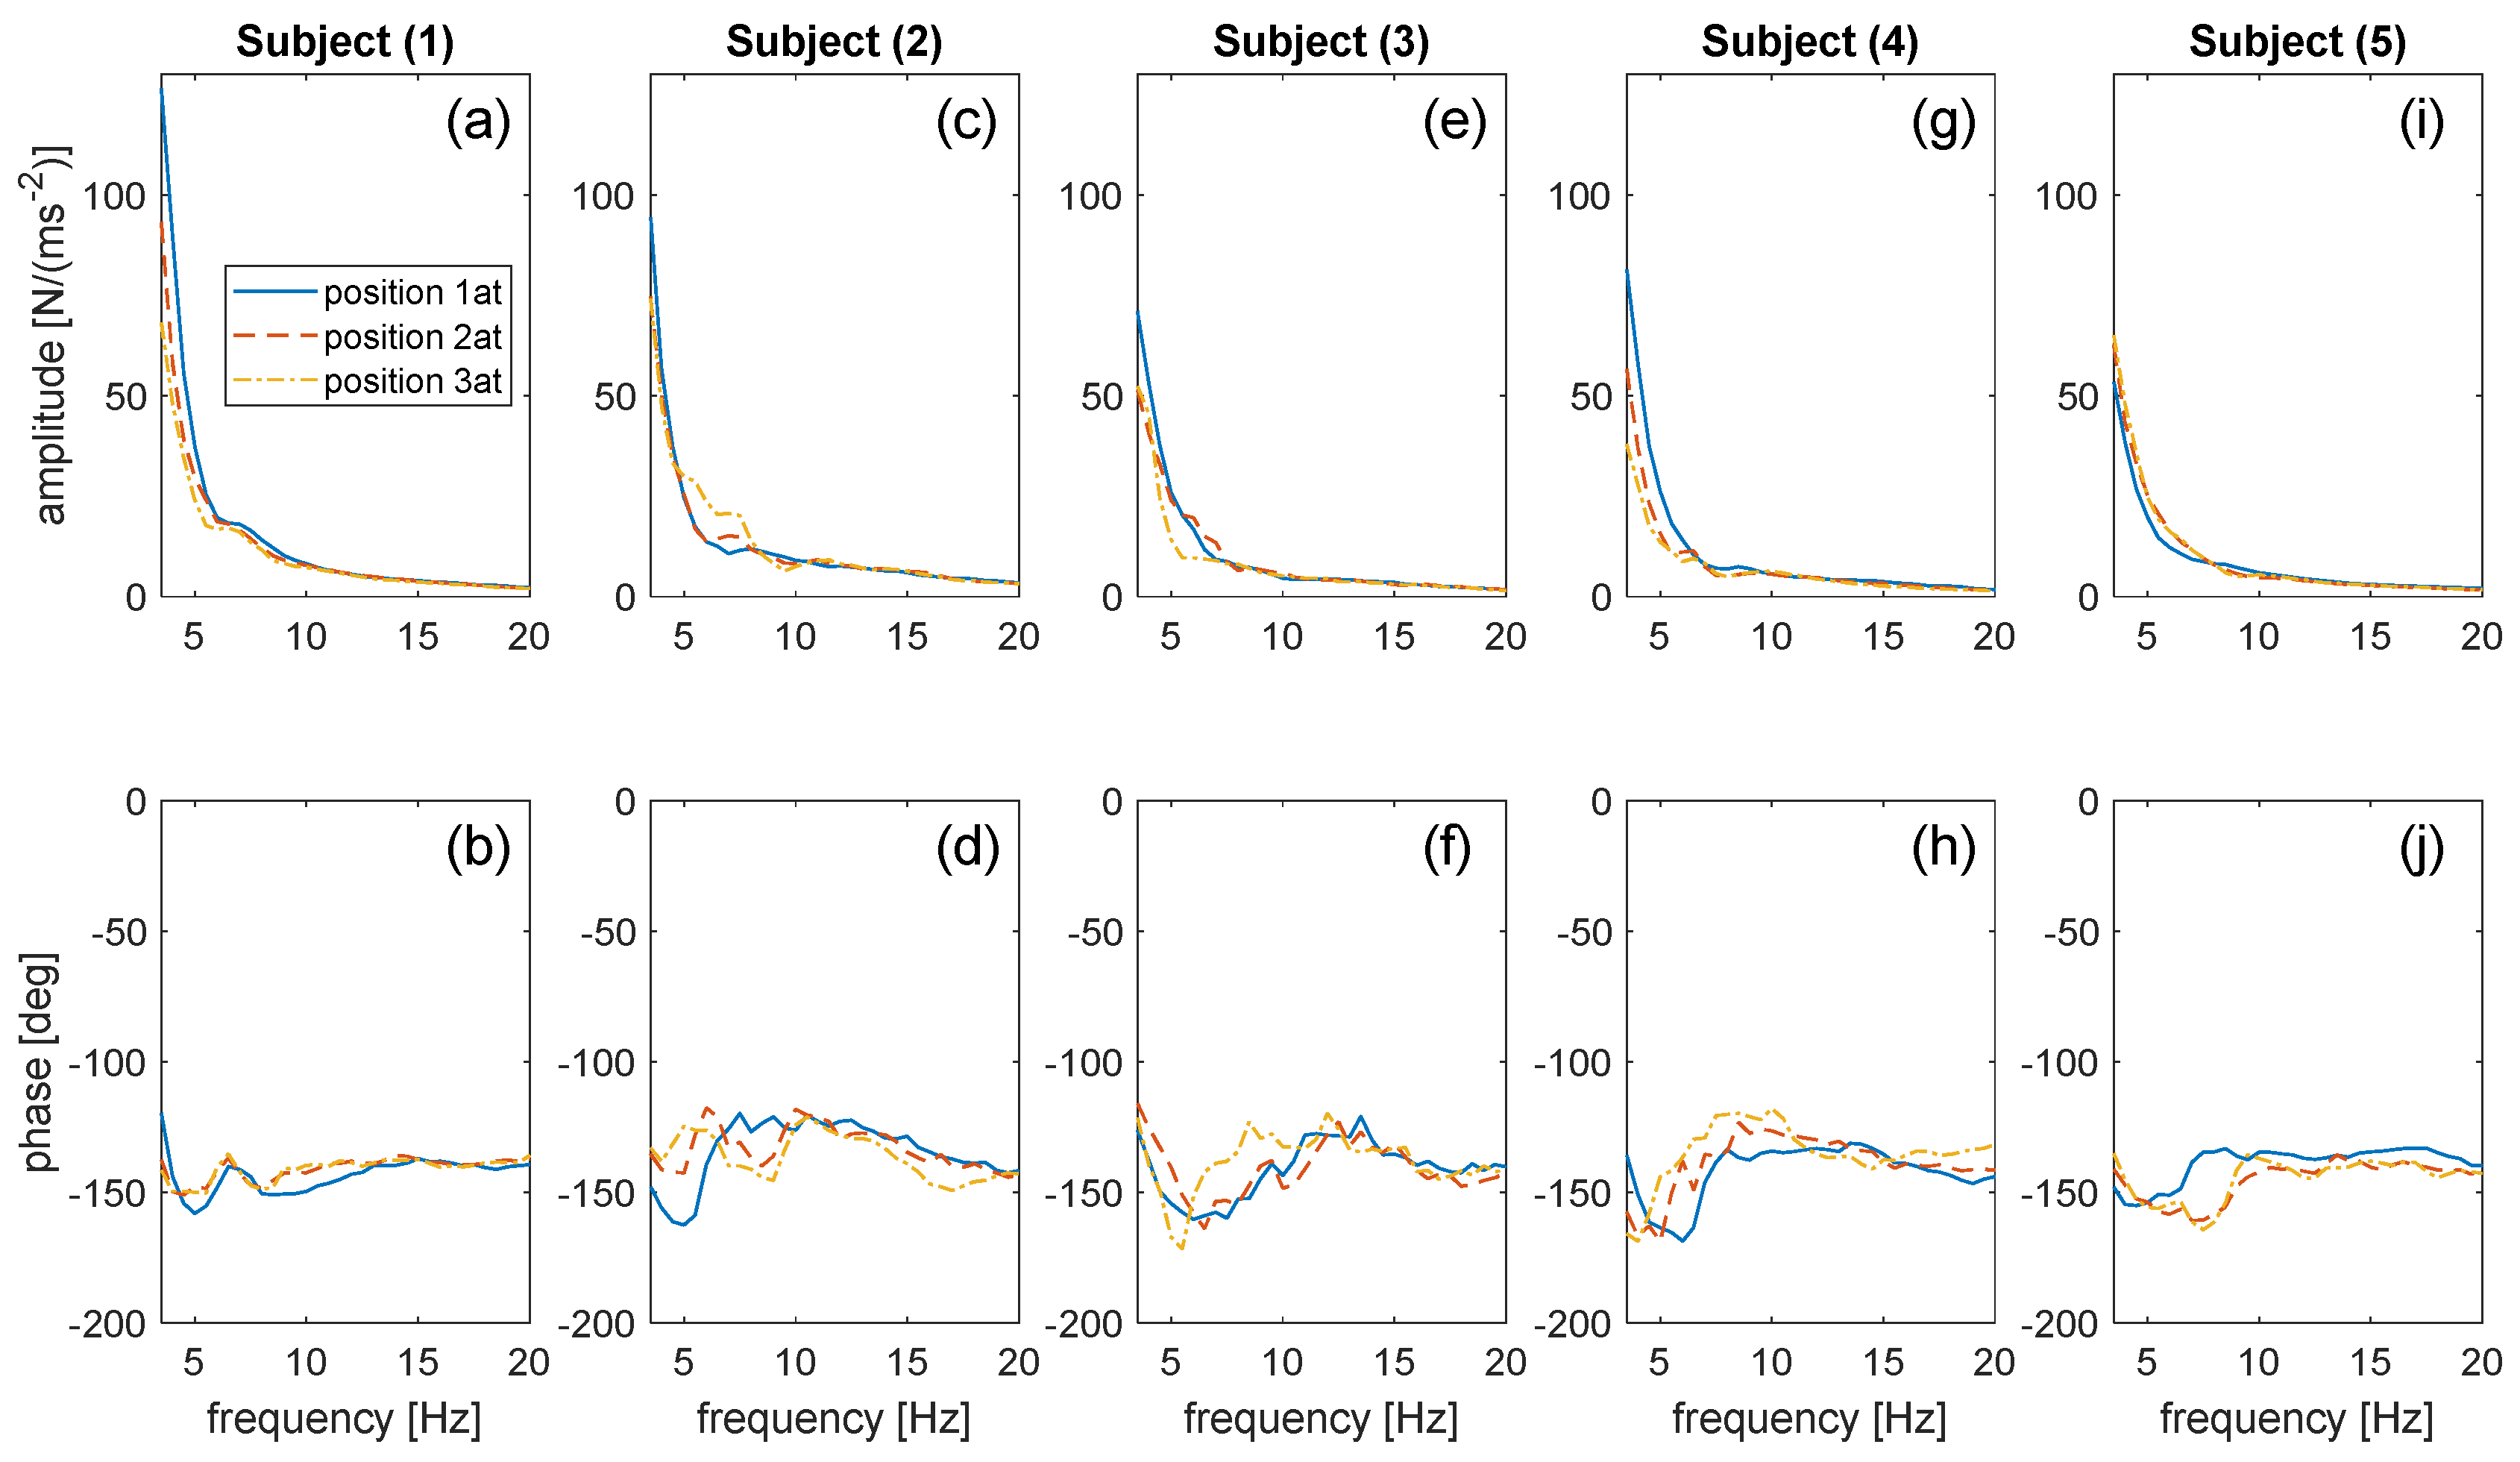
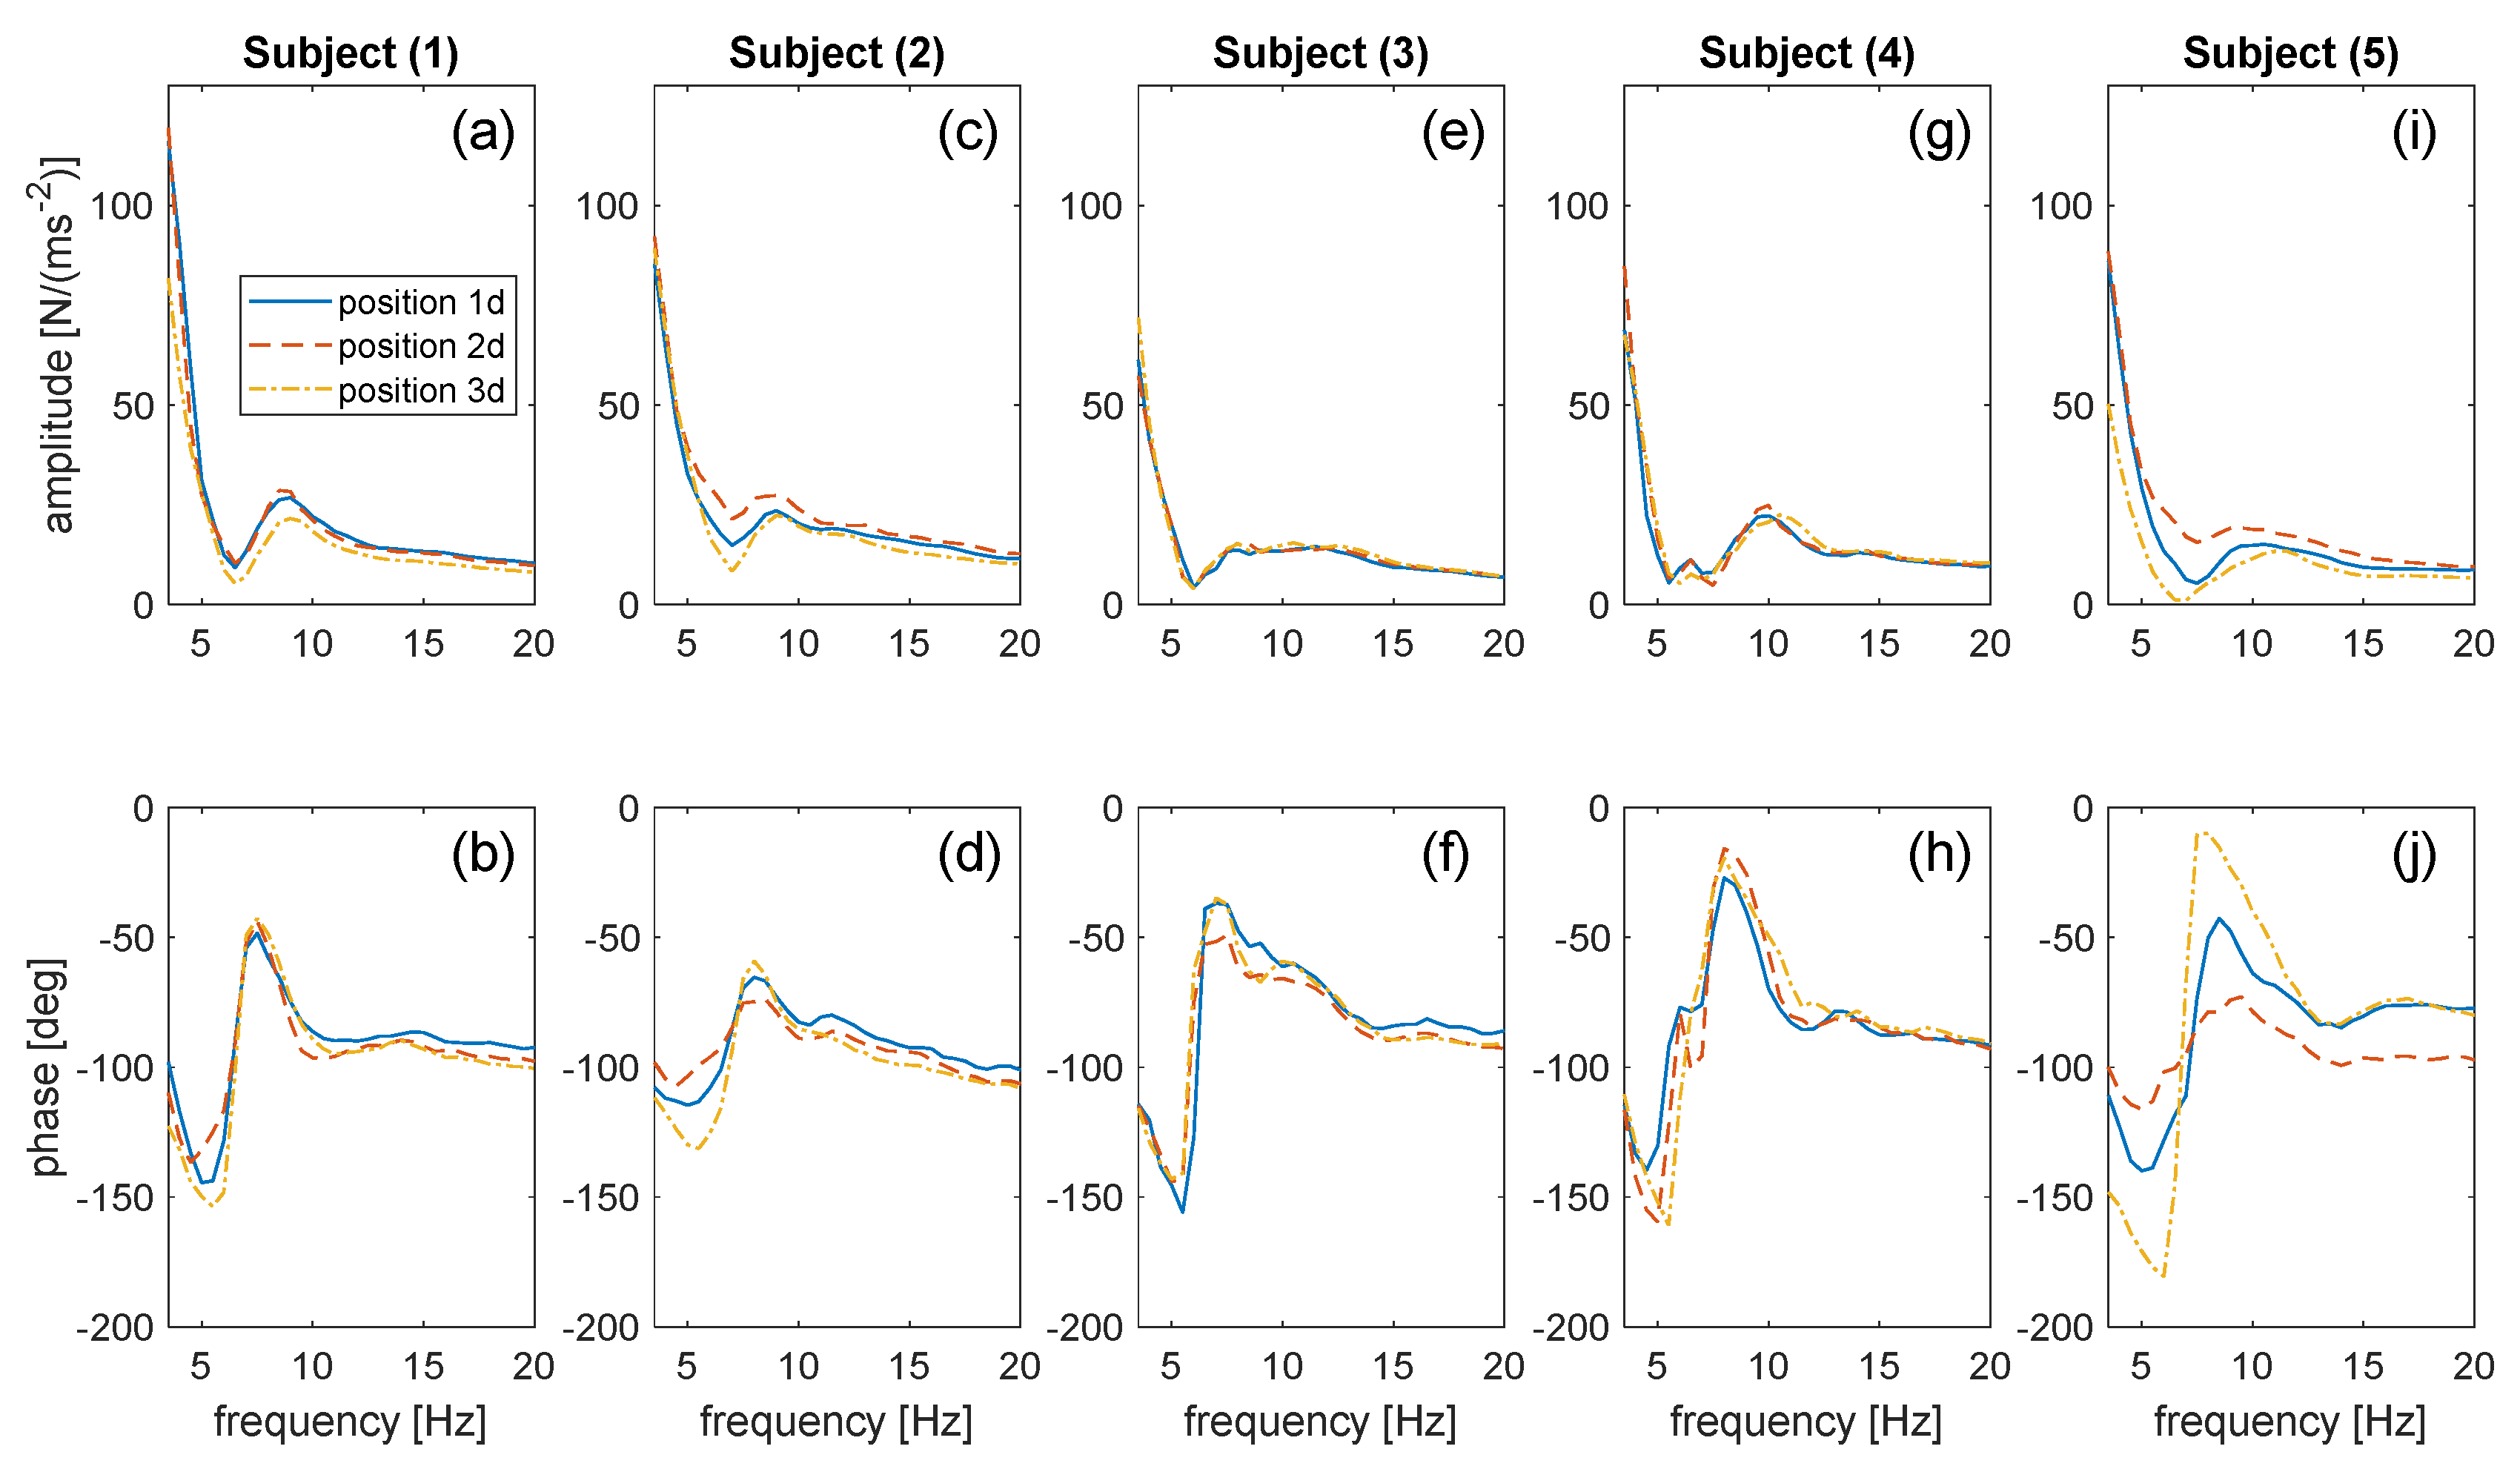
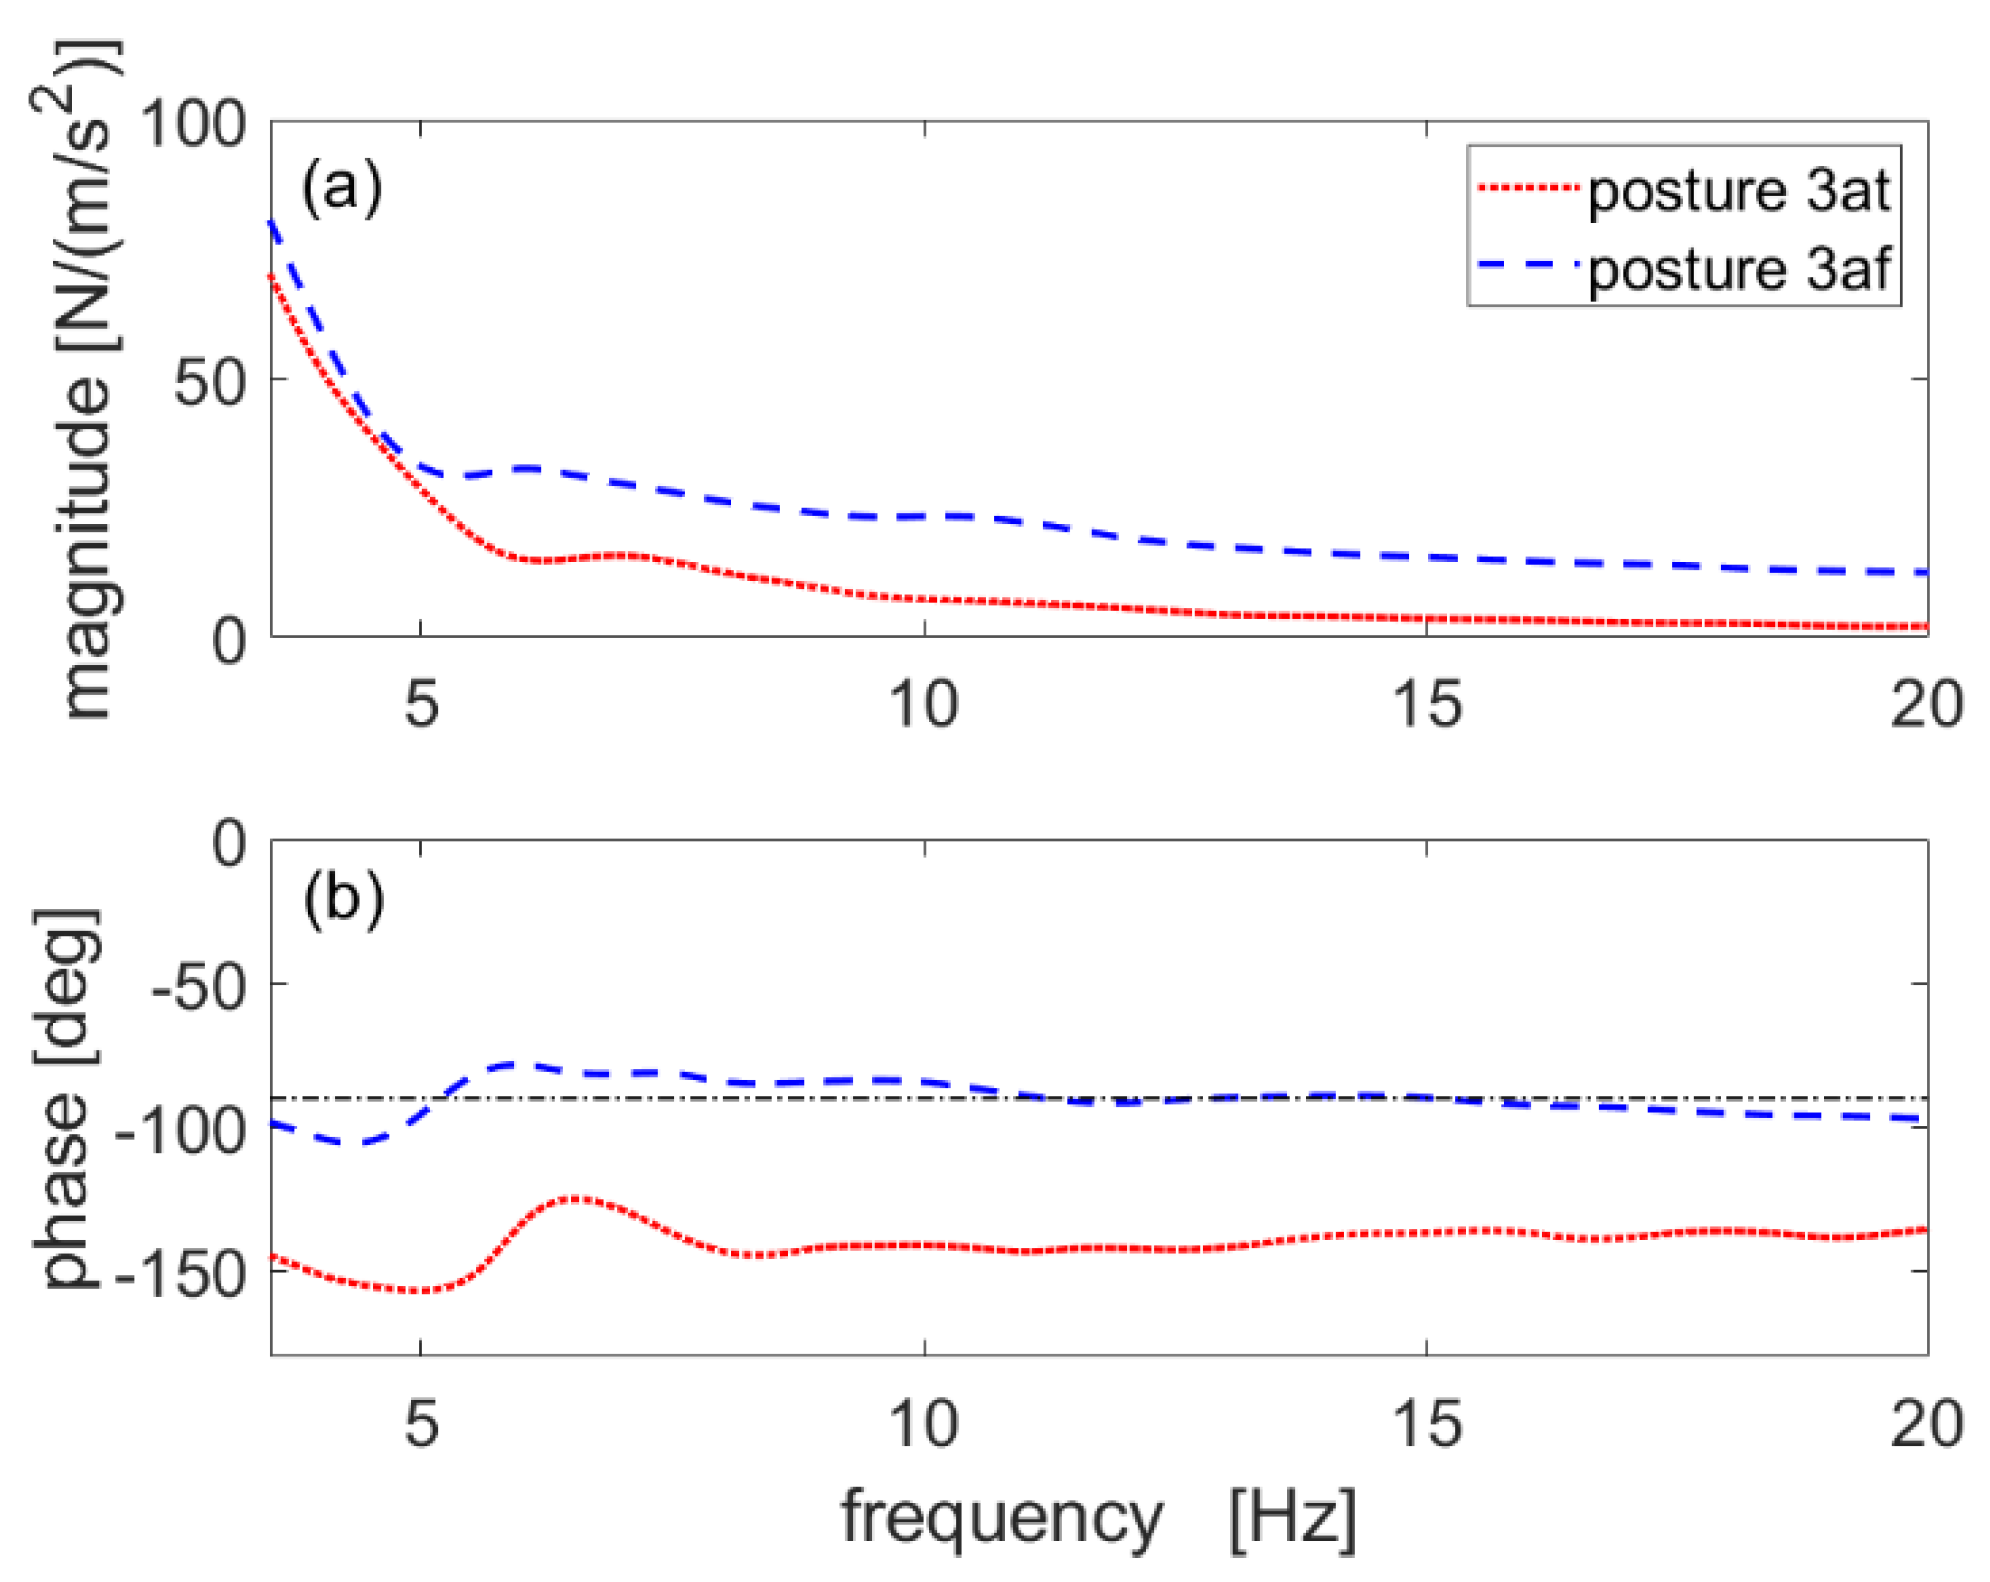
If the same subject is considered, significant shifts of the intervals are evident when changing the posture. Sometimes, also the widths of the intervals change. This is due to the different dynamic behaviours of each pedestrian in different positions and to the different intra-subject variability of each subject in different postures. If the same posture is taken into consideration, the subjects are characterised by different intervals, and this is related to the inter-subject variability. Considering positions 1af, 2af, 3af, 1d, 2d and 3d, no evident differences exist among the frequency ranges covered by their intervals. The only systematic effect related to the posture is evident when comparing the postures on the tip (“at” postures) and those with the full contact of the foot (“af” and “d” postures). Therefore, if full contact is considered, it is not worth developing specific average AM models for each posture. It is enough to carry out few tests per subject with many subjects in either two or three postures with full contact of the foot. The corresponding mean AM curve, together with its dispersion curves, would be enough to obtain a general average model for describing the effect of HSI due to a full contact of the foot. The importance of the posture seems to be mostly related to the type of contact between the foot and the structure. Indeed, Figure 9 and Figure 10 show an evident shift of the intervals related to the postures on the tip, compared to the postures with full contact. When the foot is just on the tip, the eigenfrequencies increase, while they tend to decrease with full contact. The reason for such a difference is explained in the following; however, looking at the AM plots in Appendix A, it can be deduced that the main difference between the postures on the tip and those with full contact is in the trend of the phase: with full contact, it is not far from −90° in the frequency range of the two resonances of Table 3, while it is about −150° (thus, not far from −180°) for the postures on the tip. Before entering into details for this point, it is underlined that, in order to have a general statistical model for PGRFs, it is important to characterise the AM of different subjects with the two different types of contact.
For the sake of clarity of the following dissertation, the approximation to a single degree-of-freedom (SDOF) system is used for the structure. This simplification is considered a reliable approximation of the response of a structure in the case of low modal density [37]. As a consequence, the FRF of the empty structure G j ω (see Equation (6)), in the frequency range around one of its eigenfrequencies, can be reduced to
G j ω = Φ r , i 2 ω 2 + j 2 ξ i ω i ω + ω i 2
Substituting Equations (9) and (5) in Equation (7), G H j ω can be rewritten as
G H j ω = Φ r , i 2 ω 2 + j 2 ξ i ω i ω + ω i 2 ω 2 M a , k j ω Φ r , i 2
Being that the AM is an FRF, it is possible to look at it as the sum of a real and an imaginary part:
M a , k j ω = Re M a , k j ω + jIm M a , k j ω
By replacing Equation (11) into Equation (10), it is possible to highlight the effect of the passive pedestrian contribution on the FRF of the occupied structure:
G H j ω = Φ r , i 2 1 + Φ r , i 2 Re M a , k j ω ω 2 + ω i 2 1 + Φ r , i 2 Re M a , k j ω + j 2 ω ω i ξ i Φ r , i 2 ω 2 Im M a , k j ω 1 + Φ r , i 2 Re M a , k j ω
Since the eigenfrequency is the frequency for which the denominator of the FRF becomes purely imaginary, the new eigenfrequency of the occupied SDOF structure is obtained:
ω ^ i ω i 1 + Φ r , i 2 Re M a , k j ω i
The latter is an approximation since the value of M a , k changes in frequency. Therefore, to assess ω ^ i , the value of M a , k is assumed constant in the frequency range around ω i and equivalent to the value assumed in ω i : M a , k j ω     M a , k j ω i . From Equation (13), it results that the value of ω ^ i depends upon the real part of the AM of subject k. Therefore, looking at the value of Re M a , k at ω i , it is possible to determine if there would be either an increase or a decrease in the i-th eigenfrequency of the occupied structure ω ^ i :
R e M a , k j ω i < 0                 ω ^ i > ω i R e M a , k j ω i > 0                 ω ^ i < ω i
Therefore, the trends of the eigenfrequencies depicted in Figure 9 and Figure 10 for full and partial contact of the foot can be explained. Figure 11 reports an example of AM curves for the two types of contact of the foot for subject 1. It shows that, around the first two eigenfrequencies of the staircase (7.81 and 8.87 Hz), the AM curve for full contact of the foot is characterised by a phase value above − 90 ° (i.e., Re M a , k > 0 ), while the AM curve for partial contact of the foot (tip of the foot) by a phase value below −90° (i.e., Re M a , k < 0 ). This explains why an increase in the eigenfrequencies occurs for positions with partial contact of the foot (positions 1at, 2at and 3at), and why instead they decrease for positions with full contact of the foot (positions 1af, 2af and 3af for the ascent and positions 1d, 2d and 3d for the descent).

5.1.2. Change in Non-Dimensional Damping Ratio

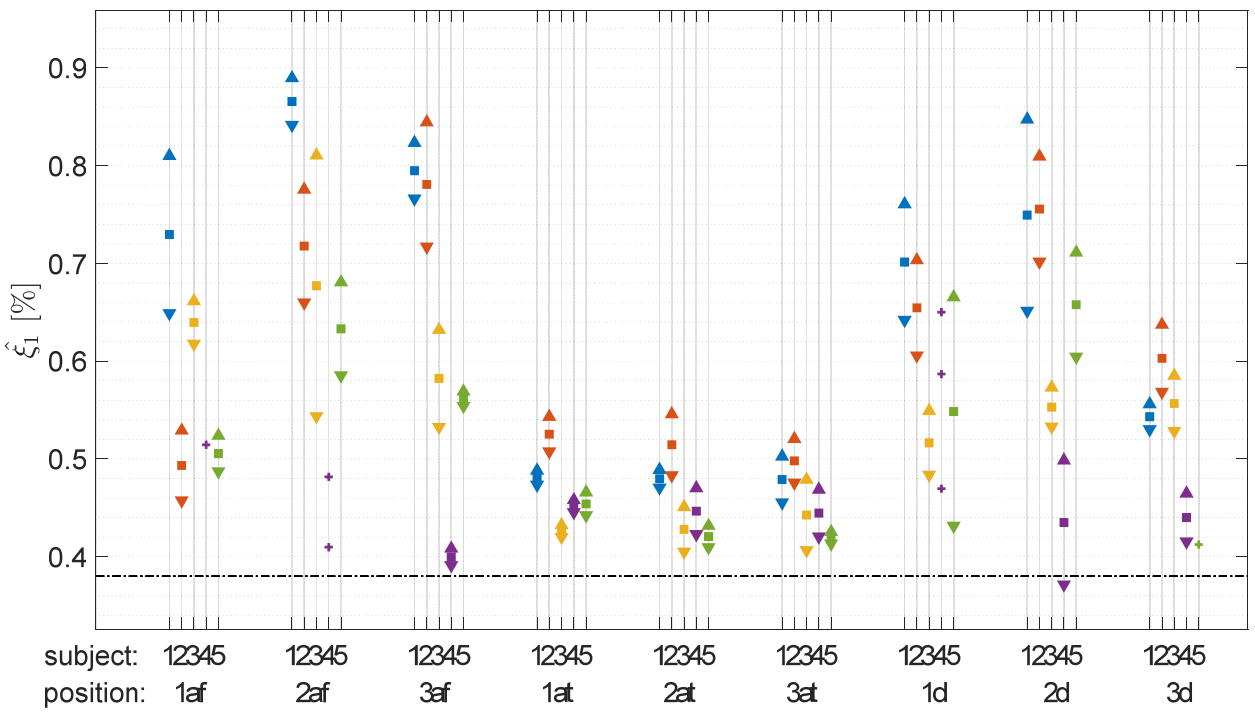
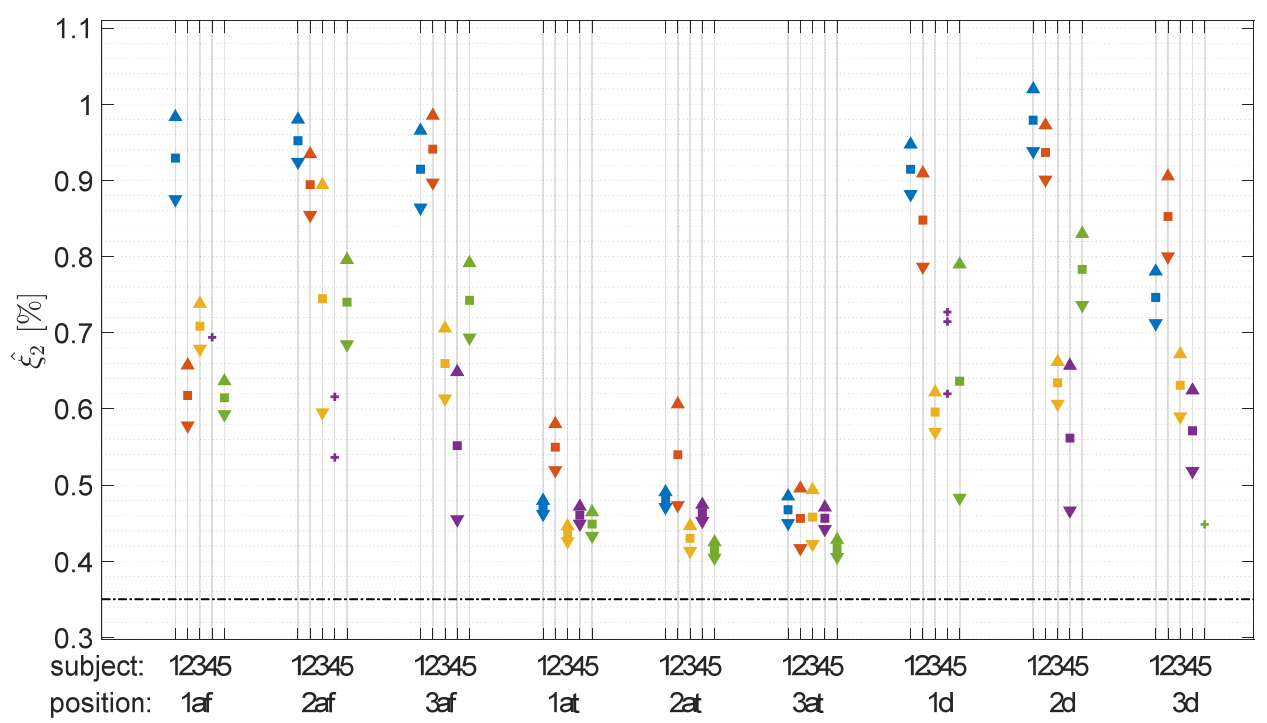
The results of the simulations for the non-dimensional damping ratios are reported in Figure 12 and Figure 13 for ξ ^ 1 and ξ ^ 2 , respectively. The damping changes (which can be higher than 100%) evidenced by these figures are obtained with the presence of just a single pedestrian over the structure. This is a desirable result in terms of structural dynamics because an increase in the non-dimensional damping ratio implies a lower magnitude of the structural response, as well as a faster decay of the free response of the structure. It is worth noticing that an increase occurs for the non-dimensional damping ratios in almost all the cases.
Additionally, in the case of the non-dimensional damping ratios, a low relevance of the intra-subject variability is observed, compared to the influence of the posture and the inter-subject variability. Furthermore, even if a single subject is characterised by different damping intervals when changing the posture, the only systematic effect of the posture is related to the type of contact (i.e., full contact or contact on the foot tip). Therefore, it is confirmed that it is enough to perform few tests per subject with many subjects in either two or three postures for the full contact of the foot. The corresponding mean AM curve, together with its dispersion curves, would be enough to achieve a general average model for describing the effect of HSI due to a full contact of the foot, while the importance of the posture is mostly related to the type of contact between the foot and the structure.
The different effects of the postures related to full and tip contacts are now addressed by using the SDOF approximation already used in Section 5.1.1. Evaluating Equation (12) for ω = ω ^ i , the following expression is derived:
G H j ω ^ i = Φ r , i 2 1 + Φ r , i 2 Re M a , k j ω ^ i j 2 ω ^ i ω i ξ i Φ r , i 2 ω ^ i 2 Im M a , k j ω ^ i 1 + Φ r , i 2 Re M a , k j ω ^ i
Equation (15) can be rearranged using Equation (13), obtaining
G H j ω ^ i = Φ r , i 2 1 + Φ r , i 2 Re M a , k j ω ^ i 2 j ω ^ i 2 ξ i 1 + Φ r , i 2 Re M a , k j ω ^ i 0.5 Φ r , i 2 Im M a , k j ω ^ i 1 + Φ r , i 2 Re M a , k j ω ^ i
and therefore,
ξ ^ i ξ i 1 + Φ r , i 2 Re M a , k j ω ^ i Φ r , i 2 Im M a , k j ω ^ i 2 1 + Φ r , i 2 Re M a , k j ω ^ i
According to Appendix A, the phases of the AM curves for full contact at frequency values close to the eigenfrequencies of Table 3 are close to −90°. This implies that the values of M a , k j ω ^ i are almost imaginary (with negative sign). According to Equation (17), this implies that ξ ^ i is increased compared to ξ i . Considering the contact with the tip, the phases are close to −150°, which in turn implies a decrease in the weight of the imaginary part compared to that of the real part. This leads to a less relevant increase in ξ ^ i . Similarly, being that the phase value of the FRF G j ω is −90° at resonance, if H k j ω assumes at resonance a phase of +90° (which corresponds to an AM phase equal to −90°, see Equation (5)), f k PGR results in being a pure damping force, leading to an increase in the damping of the structure.
Before concluding this section, it is important to notice that two further studies were conducted. The first one relates to the influence of the body mass. The previous simulations (this section and Section 5.1.1) were repeated with scaled AM curves, which are the AM curves normalised over the mass [41] of the subject and rescaled to a common body mass of 75 kg. Such a procedure was performed to further study the inter-subject variability. Indeed, one of the results of Section 5.1 is the significance of the inter-subject variability in the HSI problem (i.e., different modal parameters of the occupied structure as a function of the considered subject for the same position). These further tests were carried out to assess whether the mass of the subject is the main driving parameter in the inter-subject variability of the PGRFs, being that the body mass is one of the main features among the physical characteristics of a subject. Since the results of these further simulations still showed results similar to those discussed in Section 5.1.1 and Section 5.1.2, they are not shown here for the sake of conciseness; their main outcome is that the subject mass provides a marginal contribution in the inter-subject variability of the PGRF.
The second further study is related to the effect of muscle fatigue. Indeed, some of the subjects were tested for a different number of times in sequence in order to increase the level of fatigue and see its effects of the AM curves. Since these tests did not show any significant trend, they are not further discussed here.

6. Conclusions

In this paper, the passive pedestrian contribution in an HSI problem was addressed. This was done since a lack of knowledge was found in the literature about the main factors that drive the passive pedestrian contribution in the HSI problem. To study the passive contribution, the attention was focused on the following factors: the intra-subject variability, the inter-subject variability and the posture of the body.
The passive pedestrian contribution was analysed through the AM curves of five subjects. The evaluation of the driving parameters in the passive HSI was done by numerically coupling the measured AM curves with a reference structure and by evaluating the variations of its modal parameters (i.e., eigenfrequencies and non-dimensional damping ratios).
From the results, both positive and negative variations of the eigenfrequencies are observed, whereas significant increments of the non-dimensional damping ratios are reported for all the tested postures.
In summary, the intra-subject variability was found to have a lower effect on the PGRF than the other considered factors. Instead, different results were observed for different subjects in the same postures, leading to consider the inter-subject variability as a factor that must be carefully considered in the passive contribution modelling. The same follows for the discretisation of the single footstep in many positions: different modal parameters are reported as a function of the consider posture. However, greater variations are observed comparing postures with full contact of the foot and with contact on the tip. The different effects caused by the two posture types were explained by an SDOF mathematical approach based on the analysis of the measured AM curves.
All tests were carried out in accordance with The Code of Ethics of the World Medical Association (Declaration of Helsinki) for experiments involving humans.

Author Contributions

Conceptualization, F.L., M.B. and S.M.; methodology, F.L., M.B., S.M. and M.V.; software, F.L., M.V. and L.D.; validation, F.L., M.B., D.S. and L.D.; formal analysis, F.L., M.B. and S.M.; investigation, F.L., M.B. and S.M.; resources, S.M. and D.S.; data curation, F.L. and L.D.; writing—original draft preparation, F.L.; writing—review and editing, F.L., M.B., S.M. and M.V.; visualization, F.L. and L.D.; supervision, M.B. and S.M. All authors have read and agreed to the published version of the manuscript.

Funding

This research received no external funding.

Data Availability Statement

The data presented in this study are available on request from the corresponding author.

Conflicts of Interest

The authors declare no conflict of interest.

Appendix A

This appendix reports the measured AM curves of the five subjects of Table 1 in the different postures of Table 2. Even if different measurements for the same posture were carried out for each subject, their average is here reported for the sake of clarity of the plots. Figure A1 and Figure A2 show the measured AM curves for the ascent postures with full contact of the foot with the step (postures 1af, 2af and 3af) and partial contact (tip of the foot) with the step (postures 1at, 2at and 3at), respectively. The measured AM curves of the descent postures (postures 1d, 2d and 3d) are instead reported in Figure A3.
Figure A1. Measured AM curves for the five test subjects for postures 1af, 2af and 3af (list of the postures in Table 2). Top plots, amplitude; bottom plots, phase. (a,b): Subject 1; (c,d): Subject 2; (e,f): Subject 3; (g,h): Subject 4; (i,j): Subject 5.
Vibration 05 00008 g0a1
Figure A2. Measured AM curves for the five test subjects for postures 1at, 2at and 3at (list of the postures in Table 2). Top plots, amplitude; bottom plots, phase. (a,b): Subject 1; (c,d): Subject 2; (e,f): Subject 3; (g,h): Subject 4; (i,j): Subject 5.
Vibration 05 00008 g0a2
Figure A3. Measured AM curves for the five test subjects for postures 1d, 2d and 3d (list of the postures in Table 2). Top plots, amplitude; bottom plots, phase. (a,b): Subject 1; (c,d): Subject 2; (e,f): Subject 3; (g,h): Subject 4; (i,j): Subject 5.
Vibration 05 00008 g0a3

References

  1. Figueiredo, F.P.; da Silva, J.G.S.; de Lima, L.R.O.; da S. Vellasco, P.C.G.; de Andrade, S.A.L. A parametric study of composite footbridges under pedestrian walking loads. Eng. Struct. 2008, 30, 605–615. [Google Scholar] [CrossRef]
  2. Ingólfsson, E.T.; Georgakis, C.T. A stochastic load model for pedestrian-induced lateral forces on footbridges. Eng. Struct. 2011, 33, 3454–3470. [Google Scholar] [CrossRef]
  3. Piccardo, G.; Tubino, F. Equivalent spectral model and maximum dynamic response for the serviceability analysis of footbridges. Eng. Struct. 2012, 40, 445–456. [Google Scholar] [CrossRef]
  4. Venuti, F.; Bruno, L.; Bellomo, N. Crowd dynamics on a moving platform: Mathematical modelling and application to lively footbridges. Math. Comput. Model. 2007, 45, 252–269. [Google Scholar] [CrossRef]
  5. Tubino, F.; Carassale, L.; Piccardo, G. Human-Induced Vibrations on Two Lively Footbridges in Milan. J. Bridge Eng. 2015, 21, C4015002. [Google Scholar] [CrossRef]
  6. Toso, M.A.; Gomes, H.M.; Da Silva, F.T.; Pimentel, R.L. Experimentally fitted biodynamic models for pedestrian-structure interaction in walking situations. Mech. Syst. Signal Process. 2016, 72–73, 590–606. [Google Scholar] [CrossRef]
  7. Caprani, C.C.; Ahmadi, E. Formulation of human-structure interaction system models for vertical vibration. J. Sound Vib. 2016, 377, 346–367. [Google Scholar] [CrossRef]
  8. Setareh, M.; Ph, D.; Asce, M. Vibrations due to Walking in a Long-Cantilevered Office Building Structure. J. Perform. Constr. Facil. 2012, 26, 255–270. [Google Scholar] [CrossRef]
  9. Bedon, C.; Fasan, M. Reliability of Field Experiments, Analytical Methods and Pedestrian’s Perception Scales for the Vibration Serviceability Assessment of an In-Service Glass Walkway. Appl. Sci. 2019, 9, 1936. [Google Scholar] [CrossRef] [Green Version]
  10. Busca, G.; Cappellini, A.; Manzoni, S.; Tarabini, M.; Vanali, M. Quantification of changes in modal parameters due to the presence of passive people on a slender structure. J. Sound Vib. 2014, 333, 5641–5652. [Google Scholar] [CrossRef]
  11. Cappellini, A.; Manzoni, S.; Vanali, M.; Cigada, A. Evaluation of the dynamic behaviour of steel staircases damped by the presence of people. Eng. Struct. 2016, 115, 165–178. [Google Scholar] [CrossRef]
  12. Vanali, M.; Berardengo, M.; Manzoni, S. Numerical Model for Human Induced Vibrations. In Proceedings of the International Modal Analysis Conference, IMAC XXXV, Garden Grove, CA, USA, 30 January–2 February 2017; pp. 179–186. [Google Scholar]
  13. Berardengo, M.; Drago, L.; Manzoni, S.; Vanali, M. An approach to predict human–structure interaction in the case of staircases. Arch. Appl. Mech. 2019, 89, 2167–2191. [Google Scholar] [CrossRef]
  14. Reynolds, P.; Pavic, A. Changes of modal properties of a stadium structure occupied by a crowd. In Proceedings of the 22nd IMAC Conference and Exposition 2004 (IMAC XXII), Dearborn, MI, USA, 26–29 January 2004. [Google Scholar]
  15. Sachse, R.; Pavic, A.; Reynolds, P. Parametric study of modal properties of damped two-degree-of-freedom crowd-structure dynamic systems. J. Sound Vib. 2004, 274, 461–480. [Google Scholar] [CrossRef]
  16. Cappellini, A.; Cattaneo, A.; Manzoni, S.; Matteo Scaccabarozzi, M.V. Effects of People Occupancy on the Modal Properties of a Stadium Grandstand. In Proceedings of the XXXIII IMAC, Orlando, FL, USA, 1–4 February 2015. [Google Scholar]
  17. SÉTRA Technical Guide Footbridges Assessment of Vibrational Behaviour of Footbridges under Pedestrian Loading; The Technical Department for Transport, Roads and Bridges Engineering and Road Safety: Bagneux, France, 2006.
  18. International Organization for Standardization. ISO 10137; Bases for Design of Structures-Serviceability of Buildings and Walk ways against Vibrations. International Organization for Standardization: Geneva, Switzerland, 2007.
  19. EN1990; Eurocode Basis of Structural Design. European Committee for Standardization: Brussels, Belgium, 2002.
  20. Murray, T.M.; Allen, D.E.; Ungar, E.E. Floor Vibrations due to Human Activity. In Steel Design Guide Series; American Institute of Steel Construction (AISC): Chicago, IL, USA, 1997. [Google Scholar]
  21. ISO 2631-2; Evaluation of Human Exposure to Whole-Body Vibration. Part 2: Continuous and Shock-Induced Vibration in Buildings (1–80 Hz). International Standards Organisation: Geneva, Switzerland, 1989.
  22. Research Fund for Coal and Steel. HiVoSS: Design of Footbridges; Rheinisch-Westfaelische Technische Hochschule Aachen: Aachen, Germany, 2008. [Google Scholar]
  23. Van Nimmen, K.; Lombaert, G.; De Roeck, G.; Van den Broeck, P. Vibration serviceability of footbridges: Evaluation of the current codes of practice. Eng. Struct. 2014, 59, 448–461. [Google Scholar] [CrossRef]
  24. Tubino, F. Probabilistic assessment of the dynamic interaction between multiple pedestrians and vertical vibrations of footbridges. J. Sound Vib. 2018, 417, 80–96. [Google Scholar] [CrossRef]
  25. Ortiz-Lasprilla, A.R.; Caicedo, J.M. Comparing Closed Loop Control Models andMass-Spring-Damper Models for Human Structure Interaction Problems. In Dynamics of Civil Structures, Volume 2; Springer: Cham, Switzerland, 2015. [Google Scholar] [CrossRef]
  26. Alexander, N.A. Theoretical treatment of crowd–structure interaction dynamics. Proc. Inst. Civ. Eng. Struct. Build. 2006, 159, 329–338. [Google Scholar] [CrossRef]
  27. Sim, J.; Blakeborough, A.; Williams, M. Modelling of joint crowd-structure system using equivalent reduced-DOF system. Shock Vib. 2007, 14, 261–270. [Google Scholar] [CrossRef]
  28. Živanovic, S.; Pavic, A.; Reynolds, P. Probability-based prediction of multi-mode vibration response to walking excitation. Eng. Struct. 2007, 29, 942–954. [Google Scholar] [CrossRef]
  29. Sachse, R.; Pavic, A.; Reynolds, P. Human-structure dynamic interaction in civil engineering dynamics: A literature review. Shock Vib. Dig. 2003, 35, 3–18. [Google Scholar] [CrossRef]
  30. Živanović, S.; Pavic, A.; Reynolds, P. Vibration serviceability of footbridges under human-induced excitation: A literature review. J. Sound Vib. 2005, 279, 1–74. [Google Scholar] [CrossRef] [Green Version]
  31. Racic, V.; Pavic, A.; Brownjohn, J.M.W. Experimental identification and analytical modelling of human walking forces: Literature review. J. Sound Vib. 2009, 326, 1–49. [Google Scholar] [CrossRef]
  32. Van Nimmen, K.; Lombaert, G.; De Roeck, G.; Van den Broeck, P. The impact of vertical human-structure interaction on the response of footbridges to pedestrian excitation. J. Sound Vib. 2017, 402, 104–121. [Google Scholar] [CrossRef] [Green Version]
  33. Shahabpoor, E.; Pavic, A.; Racic, V. Structural vibration serviceability: New design framework featuring human-structure interaction. Eng. Struct. 2017, 136, 295–311. [Google Scholar] [CrossRef]
  34. Venuti, F.; Racic, V.; Corbetta, A. Modelling framework for dynamic interaction between multiple pedestrians and vertical vibrations of footbridges. J. Sound Vib. 2016, 379, 245–263. [Google Scholar] [CrossRef] [Green Version]
  35. Lucà, F.; Berardengo, M.; Manzoni, S.; Vanali, M.; Drago, L. Human-structure interaction: Convolution-based estimation of human-induced vibrations using experimental data. Mech. Syst. Signal Process. 2022, 167, 108511. [Google Scholar] [CrossRef]
  36. Matsumoto, Y.; Griffin, M.J. Dynamic Response of the Standing Human Body Exposed To Vertical Vibration: Influence of Posture and Vibration Magnitude. J. Sound Vib. 1998, 212, 85–107. [Google Scholar] [CrossRef]
  37. Ewins, D.J. Modal Testing: Theory, Practice and Application, 2nd ed.; Wiley: Hoboken, NJ, USA, 2000; ISBN 978-0-863-80218-8. [Google Scholar]
  38. Dallard, P.; Flint, A.; Le Bourva, S.; Low, A.; Smith, R.M.R.; Willford, M. The London Millennium Footbridge. Struct. Eng. 2001, 79, 17–35. [Google Scholar]
  39. Mashaly, E.S.; Ebrahim, T.M.; Abou-Elfath, H.; Ebrahim, O.A. Evaluating the vertical vibration response of footbridges using a response spectrum approach. Alex. Eng. J. 2013, 52, 419–424. [Google Scholar] [CrossRef] [Green Version]
  40. Racic, V.; Brownjohn, J.M.W. Stochastic model of near-periodic vertical loads due to humans walking. Adv. Eng. Inform. 2011, 25, 259–275. [Google Scholar] [CrossRef]
  41. Matsumoto, Y.; Griffin, M.J. Mathematical models for the apparent masses of standing subjects exposed to vertical whole-body vibration. J. Sound Vib. 2003, 260, 431–451. [Google Scholar] [CrossRef]
  42. Tarabini, M.; Solbiati, S.; Saggin, B.; Scaccabarozzi, D. Setup for the Measurement of Apparent Mass Matrix of Standing Subjects. IEEE Trans. Instrum. Meas. 2016, 65, 1856–1864. [Google Scholar] [CrossRef]
  43. Brandt, A. Noise and Vibration Analysis: Signal Analysis and Experimental Procedures; Wiley: New York, NY, USA, 2011; ISBN 9780470746448. [Google Scholar]
  44. Brandt, A.; Berardengo, M.; Manzoni, S.; Cigada, A. Scaling of mode shapes from operational modal analysis using harmonic forces. J. Sound Vib. 2017, 407, 128–143. [Google Scholar] [CrossRef]
  45. Brandt, A.; Berardengo, M.; Manzoni, S.; Vanali, M.; Cigada, A. Global scaling of operational modal analysis modes with the OMAH method. Mech. Syst. Signal Process. 2019, 117, 52–64. [Google Scholar] [CrossRef] [Green Version]
  46. Peeters, B.; Van Der Auweraer, H.; Guillaume, P.; Leuridan, J. The PolyMAX frequency-domain method: A new standard for modal parameter estimation? Shock Vib. 2004, 11, 395–409. [Google Scholar] [CrossRef]
  47. Woodbury, M.A. Inverting Modified Matrices; Statistical Research Group, Princeton University: Princeton, NJ, USA, 1950. [Google Scholar]
  48. JCGM 100:2008; Evaluation of Measurement Data—Guide to the Expression of Uncertainty in Measurement. Bureau International des Poids et Mesures: Sevres, France, 2008.
Figure 1. Motion analysis of subject 3 ascending and descending a staircase. The numbered green squares are in correspondence of the selected positions for the ascent (1a, 2a, 3a) and for the descent (1d, 2d, 3d).
Vibration 05 00008 g001
Figure 2. Set-up for the measurement of the AM curve. It includes an electro-dynamic shaker, a force plate and accelerometers.
Vibration 05 00008 g002
Figure 3. Subject 5 during the tests for the measurement of the AM curves in different postures. Letter “d” indicates the postures related to the descent, while “af” and “at” are related to the ascent.
Vibration 05 00008 g003
Figure 4. AM curve of subject 5 (position 3af, left foot). Dashed line, frequency resolution of 0.5 Hz; solid line, frequency resolution of 0.01 Hz; (a) AM magnitudes; (b) AM phases.
Vibration 05 00008 g004
Figure 5. AM curves: two measurements of the same AM curve of subject 1 in position 2d in terms of magnitude (a) and phase (b), comparison with subject 3 (c,d), comparison between posture 2d with posture 1at (e,f) and posture 2af (g,h). The solid curves are always related to the same test.
Vibration 05 00008 g005
Figure 6. Staircase with the nodes for its discretisation.
Vibration 05 00008 g006
Figure 7. Convention of sign adopted for the PGRF F k PGR applied to the structure for the k-th subject, the structural displacement x and the generic external force F (a) and passive HSI block diagram (b).
Vibration 05 00008 g007
Figure 8. Co-located numerical FRF at node 12 of the empty structure (dashed line) and co-located numerical FRF of the structure occupied by subject 3 in position 2af (solid line): magnitude (a) and phase (b).
Vibration 05 00008 g008
Figure 9. First eigenfrequency of the occupied structure. (■): μ ¯ ; (▲): μ ¯ + t α , ν s n ; (▼): μ ¯ t α , ν s n ; + : single values; dash-dotted line: first eigenfrequency of the empty structure.
Vibration 05 00008 g009
Figure 10. Second eigenfrequency of the occupied structure. (■): μ ¯ ; (▲): μ ¯ + t α , ν s n ; (▼): μ ¯ t α , ν s n ; + : single values; dash-dotted line: second eigenfrequency of the empty structure.
Vibration 05 00008 g010
Figure 11. AM curves of subject 1 in postures 3af and 3at. (a) Magnitudes of the AM curves; (b) phases of the AM curves. The dash-dotted line in plot (b) indicates −90°.
Vibration 05 00008 g011
Figure 12. First non-dimensional damping ratio of the occupied structure. (■) :   μ ¯ ; (▲) :   μ ¯ + t α , ν s n ; (▼) :   μ ¯ t α , ν s n ; + : single values; dash-dotted line: first non-dimensional damping ratio of the empty structure.
Vibration 05 00008 g012
Figure 13. Second non-dimensional damping ratio of the occupied structure. (■) :   μ ¯ ; (▲) :   μ ¯ + t α , ν s n ; (▼) :   μ ¯ t α , ν s n ; + : single values; dash-dotted line: second non-dimensional damping ratio of the empty structure.
Vibration 05 00008 g013
Table 1. Subjects involved in the tests.
SubjectGenderHeight (cm)Mass (kg)
1male17585
2male18590
3female16555
4male18580
5male18070
Table 2. List of the postures.
DirectionFoot-Step ContactPosition Labels
ascentfull1af2af3af
ascenttip1at2at3at
descentfull1d2d3d
Table 3. First two eigenfrequencies and non-dimensional damping ratios of the reference structure.
Mode ξ i   ( % ) f i   ( Hz )
1st0.387.81
2nd0.358.87
Publisher’s Note: MDPI stays neutral with regard to jurisdictional claims in published maps and institutional affiliations.