Article

Acute Vascular Response of Hand to Force and Vibration

Human Factors Research Unit, Institute of Sound and Vibration Research, University of Southampton, Southampton SO17 1BJ, UK
*
Author to whom correspondence should be addressed.
Vibration 2022, 5(1), 153-164; https://doi.org/10.3390/vibration5010010
Submission received: 4 February 2022 / Revised: 25 February 2022 / Accepted: 28 February 2022 / Published: 2 March 2022

Abstract

:
This study aimed to investigate the acute effect of grip and feed exertions on the vascular system at the fingers during exposure to hand-arm vibration (HAV), and to identify which active hand force situation would have the most effect on finger vascular function. A total of 12 individuals attended the test, and each of them were subjected to eight sets of force-and-vibration situations: four with combinations of forces and vibration, and four control ones with only hand forces applied. The vibration stimulus was applied on the right hand at 2.75 m/s2 with a frequency of 125 Hz for three minutes, during which the application of grip and feed forces were set at either 10 N or 50 N. The weakening of the finger vascular function was reflected by a reduction in the finger blood flow (FBF) and finger skin temperature (FST). They were tested on both hands at fixed intervals before, during and after the exposure for in-time measurement. Hand forces resulted in clear reductions in FBF and FST in exposed right fingers whether the force was exerted solely or combined with vibration. The greater the hand force (especially grip force), the stronger the vascular response, while the additional reductions in FBF and FST from vibration were not significant. In the non-exposed left fingers, no significant changes in finger circulation occurred in response to force or vibration. Generally, vibration-induced acute finger vasoconstriction was affected by the hand forces, in which hand force seemed to play a more important part than vibration. A larger grip force would lead to a greater loss in the digital circulation than feed force. Thus, the level of hand force exerted on the tool handle should be limited to reduce the risk of harm from HAV.

1. Introduction

Engaging in an occupation requiring regular exposure to HAV is assumed to have many chronic adverse effects, which are manifested as hand-arm vibration syndrome (HAVS) [1,2]. One of the most evident symptoms is known as the white finger, with finger blanching and vasospasms occurring after a cold attack [3]. People at risk of developing HAVS have taken on many interventions, such as wearing gloves where possible and working in shifts, but the cases of white finger remain high. In Great Britain alone, nearly 2 million people are at risk and there have been 4490 new severe cases in the last decade [4,5]. In order to explore the mechanisms responsible for the abnormality, many epidemiological studies of follow-up chronic cases have been carried out for years [6,7]. Since short-term vibration can cause relevant symptoms, laboratory research can also help to unravel the involved pathology by identifying acute vascular dysfunction, e.g., alterations in finger circulation.
Recent experimental studies have made progress in monitoring the circulatory response to HAV [8,9]. Detailed characteristics of vibration such as the magnitude, frequency, duration, and direction are noted to have an acute effect on finger vascular function with controlled contact conditions. In addition, the force acting on the vibrator is another important factor in acute exposure, as vibration cannot be transmitted independently of force. Great forces are also associated with more vibration energy transmitted from the contact area.
Many studies have encompassed the influence of contact force on the circulatory effects, for the most part with hands pressing down on the flat contactor. Some results have been obtained regarding whether the blood flow would be affected by the applied force alone or the combination of force and vibration. Bovenzi et al. pointed out that even modest levels of force (2 N or 5 N) without HAV could lead to a reduction in FBF on the exposed fingers but no change in other fingers. When applying the HAV, the effects of contact force interacted with the vibration to provoke additional vasoconstriction in the FBF that were not limited to the exposed fingers [10]. Another study conducted by Griffin et al. found that a force of 20 N on the palm of the right hand was capable of altering the finger circulation in both the ipsilateral fingers and contralateral fingers [11]. Other research came to a different conclusion that exposure to force alone would not induce any change in the FBF, though the forces applied were relatively small (around 2 N) [12,13].
However, these conclusions are not applicable in relation to blood flow response with the actual contact force. Most hand-held vibration tools are equipped with a handle structure, and the distribution of interface stress over the handle is complex. For the sake of simplicity, the force exerted can be seen as the combination of grip force and feed force (also known as push force if in the forward direction). Considering grasping a power hand tool, the amount of force exertion should be large enough in order to avoid sliding [14]; thus, the role of these active forces is likely to have been overlooked. Considerably little research has been previously conducted on the vascular response of fingers on the handle.
This study aimed to investigate whether and how the circulatory effect of vibration would be influenced by the presence of applied force on the vibrating handle. It was hypothesised that active force applied would have a great impact on altering the circulatory effects of vibration, and grip force and feed force would not exhibit an equal effect on the finger circulation.

2. Methods

2.1. Participants

A total of 12 healthy male subjects participated in the experiment. All of them were students from the University of Southampton and were aged between 22 and 29 years (mean 25.3, SD 2.2). The subjects read written instructions and gave informed consent before commencing the experiment, which was approved by the Human Experimentation Safety and Ethics Committee at the University of Southampton (ERGO/FEPS/55633). They were screened using a health questionnaire to exclude those with vibration exposure history or other medical problems known to affect finger circulation. Prior to the test, they avoided alcohol for 12 h and caffeine assumption for 2 h to minimise the influence of alcohol and caffeine on their blood circulation.
The mean stature and mean mass of the subjects were 174.2 (SD 5.3; range 165–183) cm and 71.5 (SD 9.2; range 55–83) kg. Hand sizes were measured according to BS EN ISO 21420:2020 [15]. Their mean hand circumference was 19.3 (SD 1.1; range 17–21.5) cm, and their mean hand length (distance between the wrist and the tip of the middle finger) was 18.4 (SD 0.8; range 17.0–20.0) cm.

2.2. Measurements of Finger Circulation

Testing of finger blood flow was conducted on the subjects by strain-gauge plethysmography. Pressure cuffs (Hokanson) for air inflation were attached around the subject′s middle phalanx and a strain-gauge was applied at the nail base to monitor rises in fingertip volumes during venous occlusion, so that the change in FBF could be derived. Both the pressure cuff and strain gauge were connected to an HVLab Multi-channel plethysmograph (CE marked medical device, University of Southampton, Southampton, UK). This method is a non-invasive method to monitor the digit circulation, and was described in previous literature [16,17].
Testing of the finger skin temperature involved the use of a digital thermometer fastened by micropore tape to the middle phalanx of fingers on the backside. A mercury thermometer displayed the room temperature on its screen with an accuracy of ±0.5 °C.

2.3. Motion Stimuli and Force Range

The experiment was conducted using an electrodynamic vibrator (Derritron VP30, Derritron, Hastings, UK). The produced vibrations were sinusoidal acceleration stimuli with a single frequency of 125 Hz since the Pansini channel found to be associated with vibration disorders was sensitive to vibration stimulation around this frequency. The vibration magnitude was set as 2.75 m/s2 r.m.s. (weighted) (unweighted: 22 m/s2 r.m.s.) according to ISO 5349 [18] and the total amount was 0.6522 m/s2 r.m.s. in terms of the A(8) value.
The vibrator produced vibration along the z-axis and was positioned horizontally as shown in Figure 1. An instrumented cylindrical vibrating handle of 40 mm diameter was fixed to the vibrator. As subjects grasped and pushed the handle using their right hands with the bending-arm position, the vibration was applied to the right upper arms in the zh-axis direction. A tri-axial accelerometer (Brüel and Kjær piezoelectric type, Brüel & Kjær, Nærum, Danmark) was placed on the base of the handle to measure the magnitude of the vibrational excitation. The other two tri-axial accelerometers (Kionix KXD94, Kionix, Ithaca, NY, USA; sensitivity: 200 mV/g; measuring range: ±10 g) were attached at the subject’s right wrist and right elbow, separately measuring the transmitted vibration. The signals from the three accelerometers were amplified by charge amplifiers (Fylde and 128CA) and low-pass filtered and sampled at 512 samples per second by a computer-based analysis system comprising a National Instrument NI USB-6211 16-bit data acquisition board.
The handle comprised four Kistler force sensors (gauge resistance: 120 Ω), two for measurement of the grip force and two for the feed and total dynamic force. The measured grip and feed forces were displayed on a screen in front of the participants to help them keep the hand forces within the desired ranges (deviation of less than 4 N).
The grip and feed forces attached to the handle were designed to differ significantly between conditions but within a reasonable range. Therefore, the magnitudes of both the grip and feed forces were adjusted to 10 N and 50 N (less than 50% of the maximal grip strength) to produce sufficient range effects as well as limiting the overall discomfort.
To compare the effects of hand forces alone and the combined effects of hand force and vibration, two groups were created: the vibration group and the control group. HAV and force stimulation were combined in the vibration group, while only the force was applied in the control group. Based on the cross-combination of grip and feed forces, there were four situations in each group, as shown in Table 1.

2.4. Experimental Procedure

Subjects were habituated at room temperature for five minutes before the session began.
During the session, participants were asked to take a relaxed upright seating position with their left arms and hands supported at the heart level. Their right hands held the instrumented handle with bending-arm posture at a similar height (slightly lower), under eight force-and-vibration conditions, as described previously. In each condition, subjects experienced a period of seven minutes, as shown in Figure 2:
  • Period 1: no force and no vibration (2 min): measurement of FBF and FST;
  • Period 2: force (and vibration) (3 min): measurement of FBF, FST, and acceleration;
  • Period 3: no force and no vibration (2 min): measurement of FBF and FST.
For the vibration group, a 3-min sinusoidal 125-Hz vibration at 22 m/s2 r.m.s. (unweighted) was applied during period 2 followed by a 2-min recovery period. After that, subjects were allowed to have an extra break and adjust the amount of the next attached force, while remaining seated comfortably at all times. Different conditions were carried out at random.
Measurement of FBF was taken every 30 s in the right index and fourth fingers, and also in the index and fourth fingers of contralateral (left) hands. FST was recorded every 30 s in the middle fingers of both hands. Accelerations at the right wrist and right elbow were measured during period 2 (Figure 2) to calculate the transmissibility related to the vibration energy dissipation or absorption.

2.5. Statistical Analysis

Percentage changes of FBF (%FBF) were introduced to avoid unintentional changes in flow velocity during different test periods, while the absolute value of FST was directly used as the room temperature was controlled. The vibration transmissibility was determined by the amplitude ratio of the input acceleration at the handle to the transmitted acceleration measured by the accelerometers on the forearms.
The data were analysed using a non-parametric method in SPSS. To quantify the significance of the differences in the FST and %FBF, the Friedman test was performed and the Wilcoxon matched-pairs signed ranks were determined between conditions with different hand forces and vibration levels. Additionally, the Spearman correlation analysis of finger vascular response and transmissibility was carried out to determine the dependence of vasoconstriction in the fingers on the absorbed energy in the forearm. Statistical significance was indicated when the p-value fell below 0.05.

3. Results

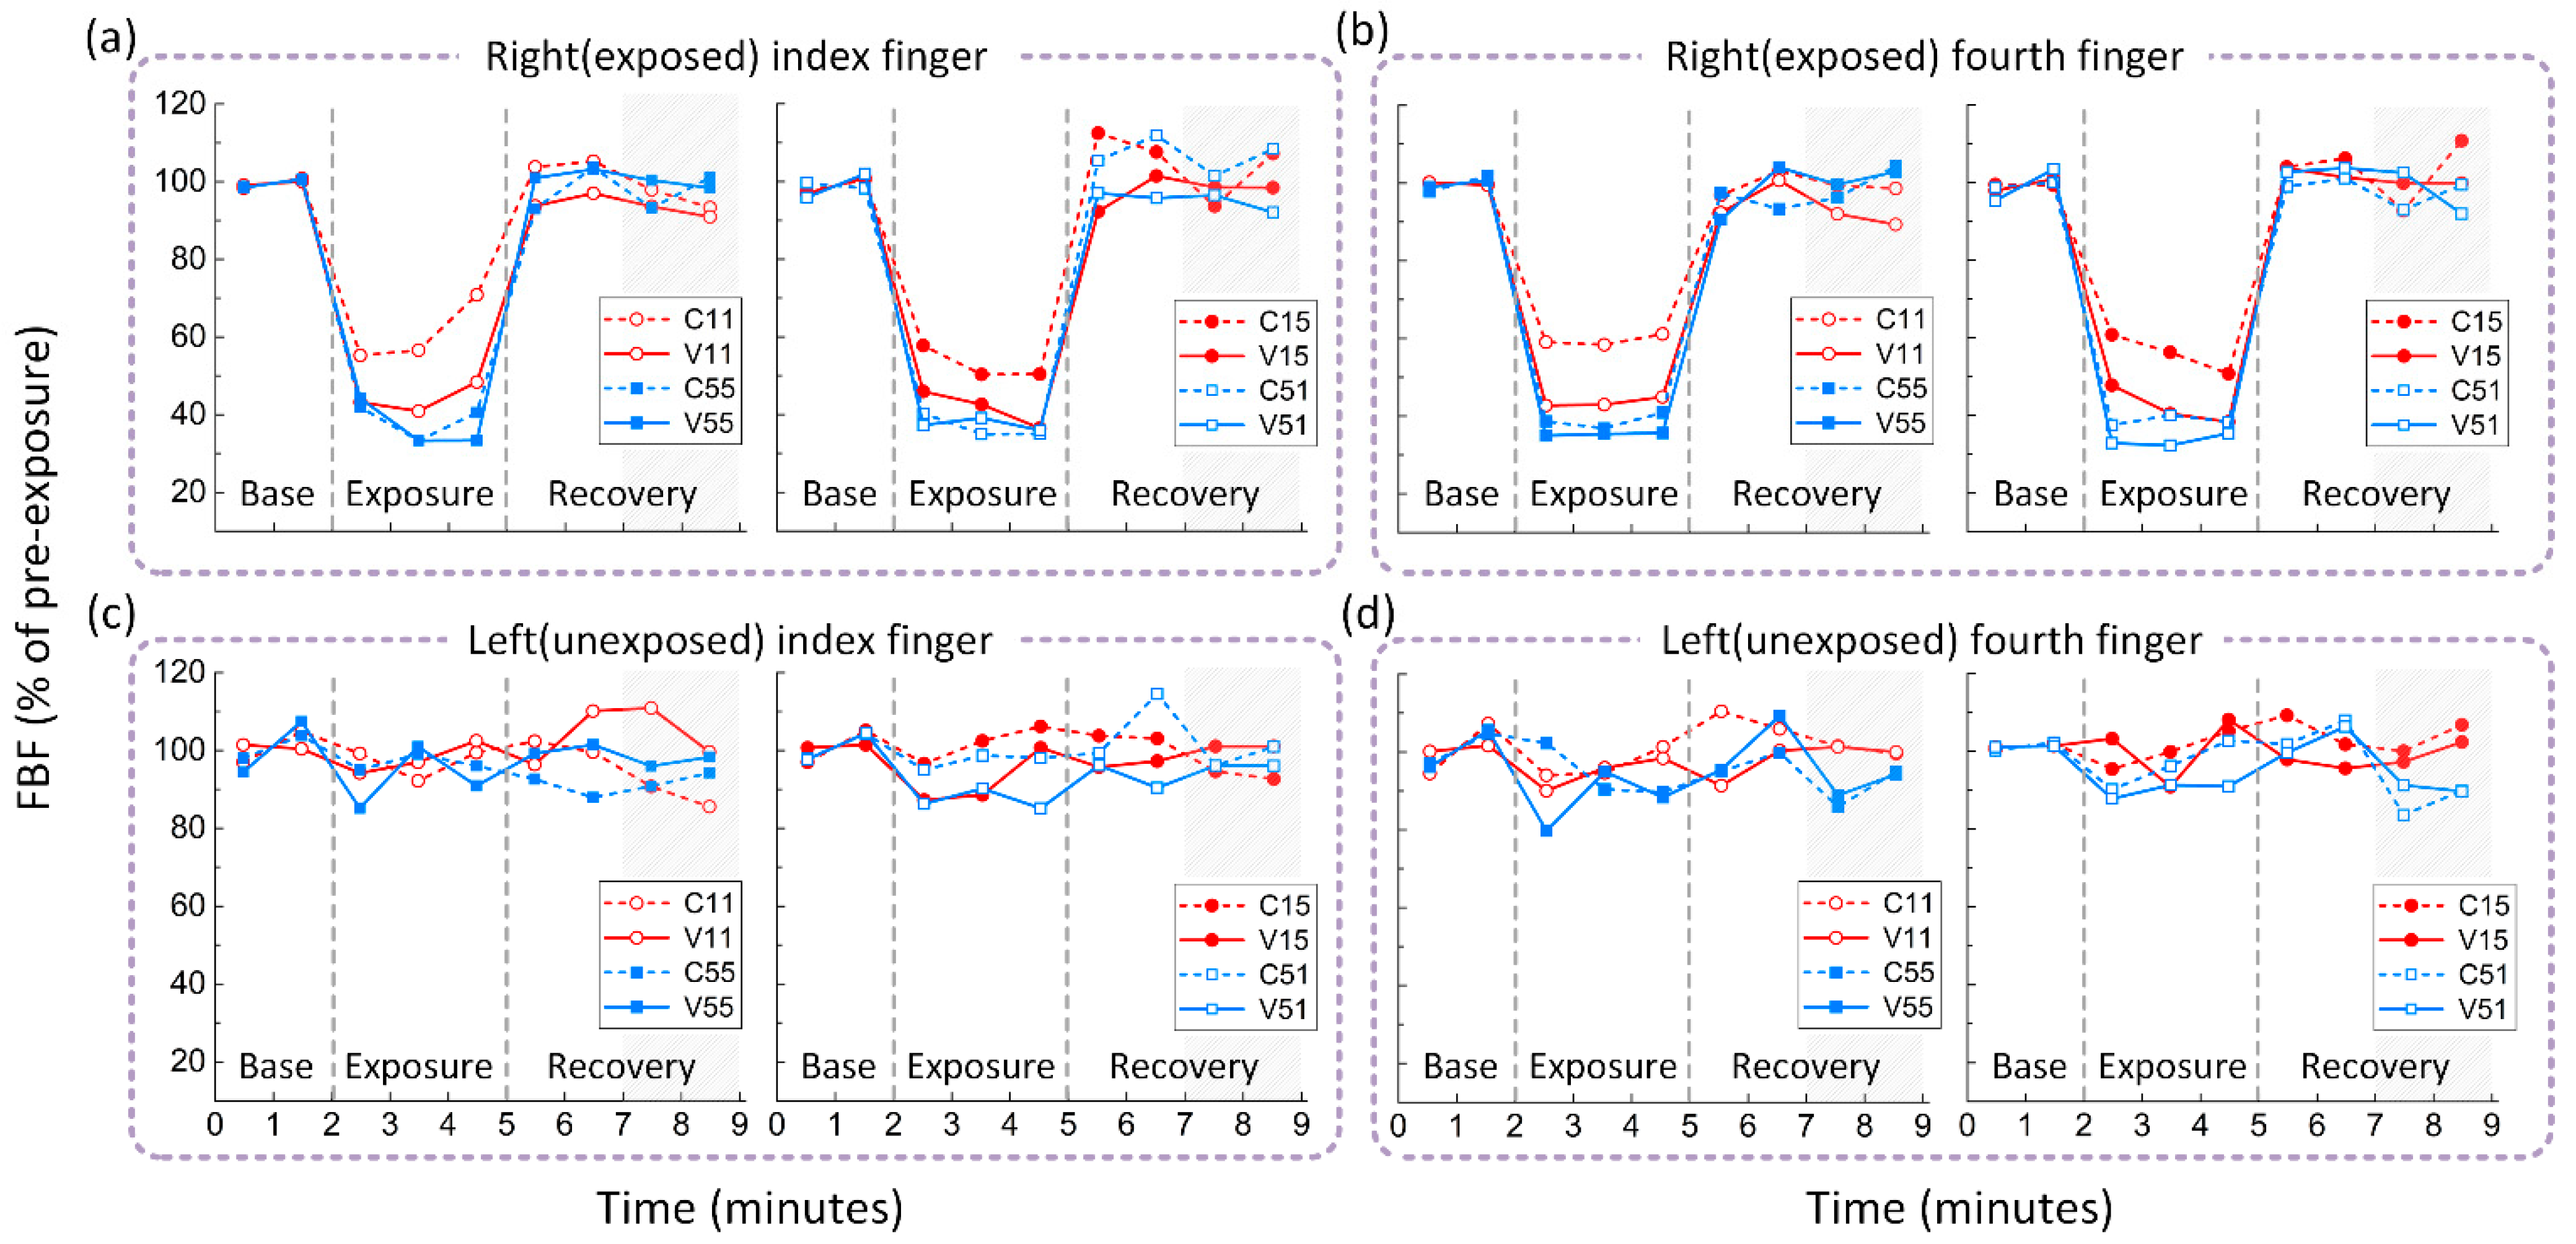
Figure 3 below presents the overall pattern of the median values of the percentage changes of FBF (% of pre-exposure) in the index and fourth right (exposed, ipsilateral) fingers, and the index and fourth left (unexposed, contralateral) fingers across the 7-min period and the eight exposure conditions. The experiment was conducted at a controlled room temperature of 24 ± 2 °C (mean 25.05, SD 1.20).

3.1. Finger Circulation during Pre-Exposure Period

Before exposure to either hand force alone or in combination with vibration, no significant changes in FBF were found for both hands across the eight experimental conditions (p = 0.052–0.369, Friedman). During period 1, FBF averaged 3.81 mL/100 mL/s for the index right finger, 3.99 mL/100 mL/s for the fourth right finger, 3.67 mL/100 mL/s for the index left finger, and 3.40 mL/100 mL/s for the fourth left finger. The rest levels of exposed fingers were slightly higher than those of unexposed fingers, which might be the result of the right arm bending close to the heart and the left arm straightening naturally.
The baseline measure of FST varied between subjects and was in the range 30.5–34.8 °C for both hands. As can be seen in Figure 4 below, the FST was not exactly the same at the beginning of different conditions, but the sets of measures of FST in each condition did not differ during the pre-exposure period (right hand, p = 0.716; left hand, p = 0.088; Friedman). There were no significant differences in the pre-exposure measures of FST between the exposed and unexposed fingers (p = 0.715–1.000, Wilcoxon).
The initial values of the FBF and FST varied among different subjects, but neither the FBF nor the FST was found to be correlated to the subjects’ BMI (p = 0.193–0.871, Spearman).

3.2. Effects of Hand Force on Finger Circulation

As shown in Figure 3a,b, exposure to hand force alone during period 2 (see Figure 2) induced a clear fall in FBF in two exposed right fingers compared to the pre-exposure (period 1) and the recovery (period 3) (p < 0.05, Wilcoxon).
For any case in the control group, the blood flow in the right fingers decreased significantly at the time of force exposure and persisted for the rest of the exposure period (p < 0.05, Wilcoxon). When compared with the resting level, a grip force of 10 N and a feed force of 10 N (condition C11) provoked a certain degree of reduction in FBF in the right fingers (a drop of 40.28%), while condition C55 (50 N grip force + 50 N feed force) was associated with a greater decrease in FBF (a drop of 56.28%, Table 2) (p = 0.001, Wilcoxon). Moreover, exposure to condition C51 (grip force of 50 N combined with 10 N feed force) during period 2 affected FBF to a larger extent than condition C15 (grip force of 10 N, feed force of 50 N) (p = 0.006, Wilcoxon). A similar reduction in FBF can be observed between condition C11 and C15 (both with 10 N grip force), as well as between C55 and C51 (both with 50 N grip force) (p = 0.864–0.909, Wilcoxon). After the cessation of force exertion, FBF in the right fingers recovered fast and fluctuated within the normal range (p = 0.012, Wilcoxon).
The change in FBF in the left (unexposed) fingers during period 2 (Figure 2) was marginally not significant when compared to that in the right fingers. As shown in Figure 3, there was no significant difference in the percentage change of FBF between two fingers of the right hand or two fingers of the left hand (right hand, p = 0.424; left hand, p = 0.414; Wilcoxon).
Slightly different results were found regarding the change of the FST, as can be seen in Figure 4. Relative to FST without force during period 1, exposure of the right fingers to hand force resulted in a significant reduction in the FST of the exposed fingers under condition C55 and C51 (both with 50 N grip force) (p = 0.005–0.019, Wilcoxon), whereas there were no significant changes in right fingers′ FST when exposed to condition C11 and C15 (both with 10 N grip force) (p = 0.114–0.182, Wilcoxon). For the unexposed contralateral fingers, none of the conditions induced a pronounced fall in FST (p = 0.060–0.722, Wilcoxon; Figure 4 and Table 2). It should be noted that the change in FST was slower. A gradual reduction in FST was observed in the right fingers from the beginning of period 2 (Figure 2) and the downward trend continued even after the exposure. In this experiment, the minimum temperature was reached at approximately the first minute during period 3 of each case. According to the Wilcoxon test, exposure to condition C55 during period 2 provoked a greater reduction in FST at the first minute during recovery compared to condition C11 (p = 0.003), while the differences were not significant between any other pairs with only one of the forces changed (p = 0.125–0.969, Wilcoxon).

3.3. Combined Effects of Hand Force and Vibration on Finger Circulation

Consistent with the findings obtained for the sole force exposure, hand force combined with 125 Hz vibration resulted in reduced FBF and FST in all exposed fingers, compared to the resting period with no force and no vibration (p = 0.001–0.012, Wilcoxon).
A fall-off response in FBF in the right (exposed) fingers was observed in all the cases exposed to vibration. However, the changes of %FBF relative to baseline measures in exposed fingers were similar to each other within the vibration group, as shown in Figure 3 (p = 0.072–0.530, Wilcoxon). Instead, on the basis of the existing force, the overlay influence of vibration on FBF in exposed fingers was not highly significant (p = 0.052–0.689, Wilcoxon). The median blood flow change of the vibration group could even be slightly smaller than that of the control group when increasing the grip force to 50 N (Figure 3a).
For left (unexposed) fingers, the vascular results showed that the FBF remained consistent over time with the exception of a slight decrease in condition V51 during exposure (p = 0.016, Wilcoxon). In addition, the vibration group did not induce more %FBF reduction compared to the control group in the left hand during period 2 (Figure 2; p = 0.424–0.587, Wilcoxon).
Although less pronounced than the %FBF reductions in the right fingers, some significant circulatory effects of HAV were observed in the FST during period 2. It was noted that the FST in fingers exposed to vibration was significantly less than FST baseline measure across all the force conditions (p = 0.002–0.003, Wilcoxon). The decrease in %FST relative to force exertion alone was significant in condition V11 and V51 in exposed fingers during HAV exposure (p = 0.008–0.031, Wilcoxon). Within the vibration group, the Wilcoxon test revealed that exposure to condition V55 caused a greater decrease in %FST in exposed fingers than either condition V11 or V15 (both with 10 N grip force) (p = 0.012–0.050, Wilcoxon).
Compared to solely hand force exposure, unexposed fingers did not show greater reductions in median FST as a result of vibration exposure.
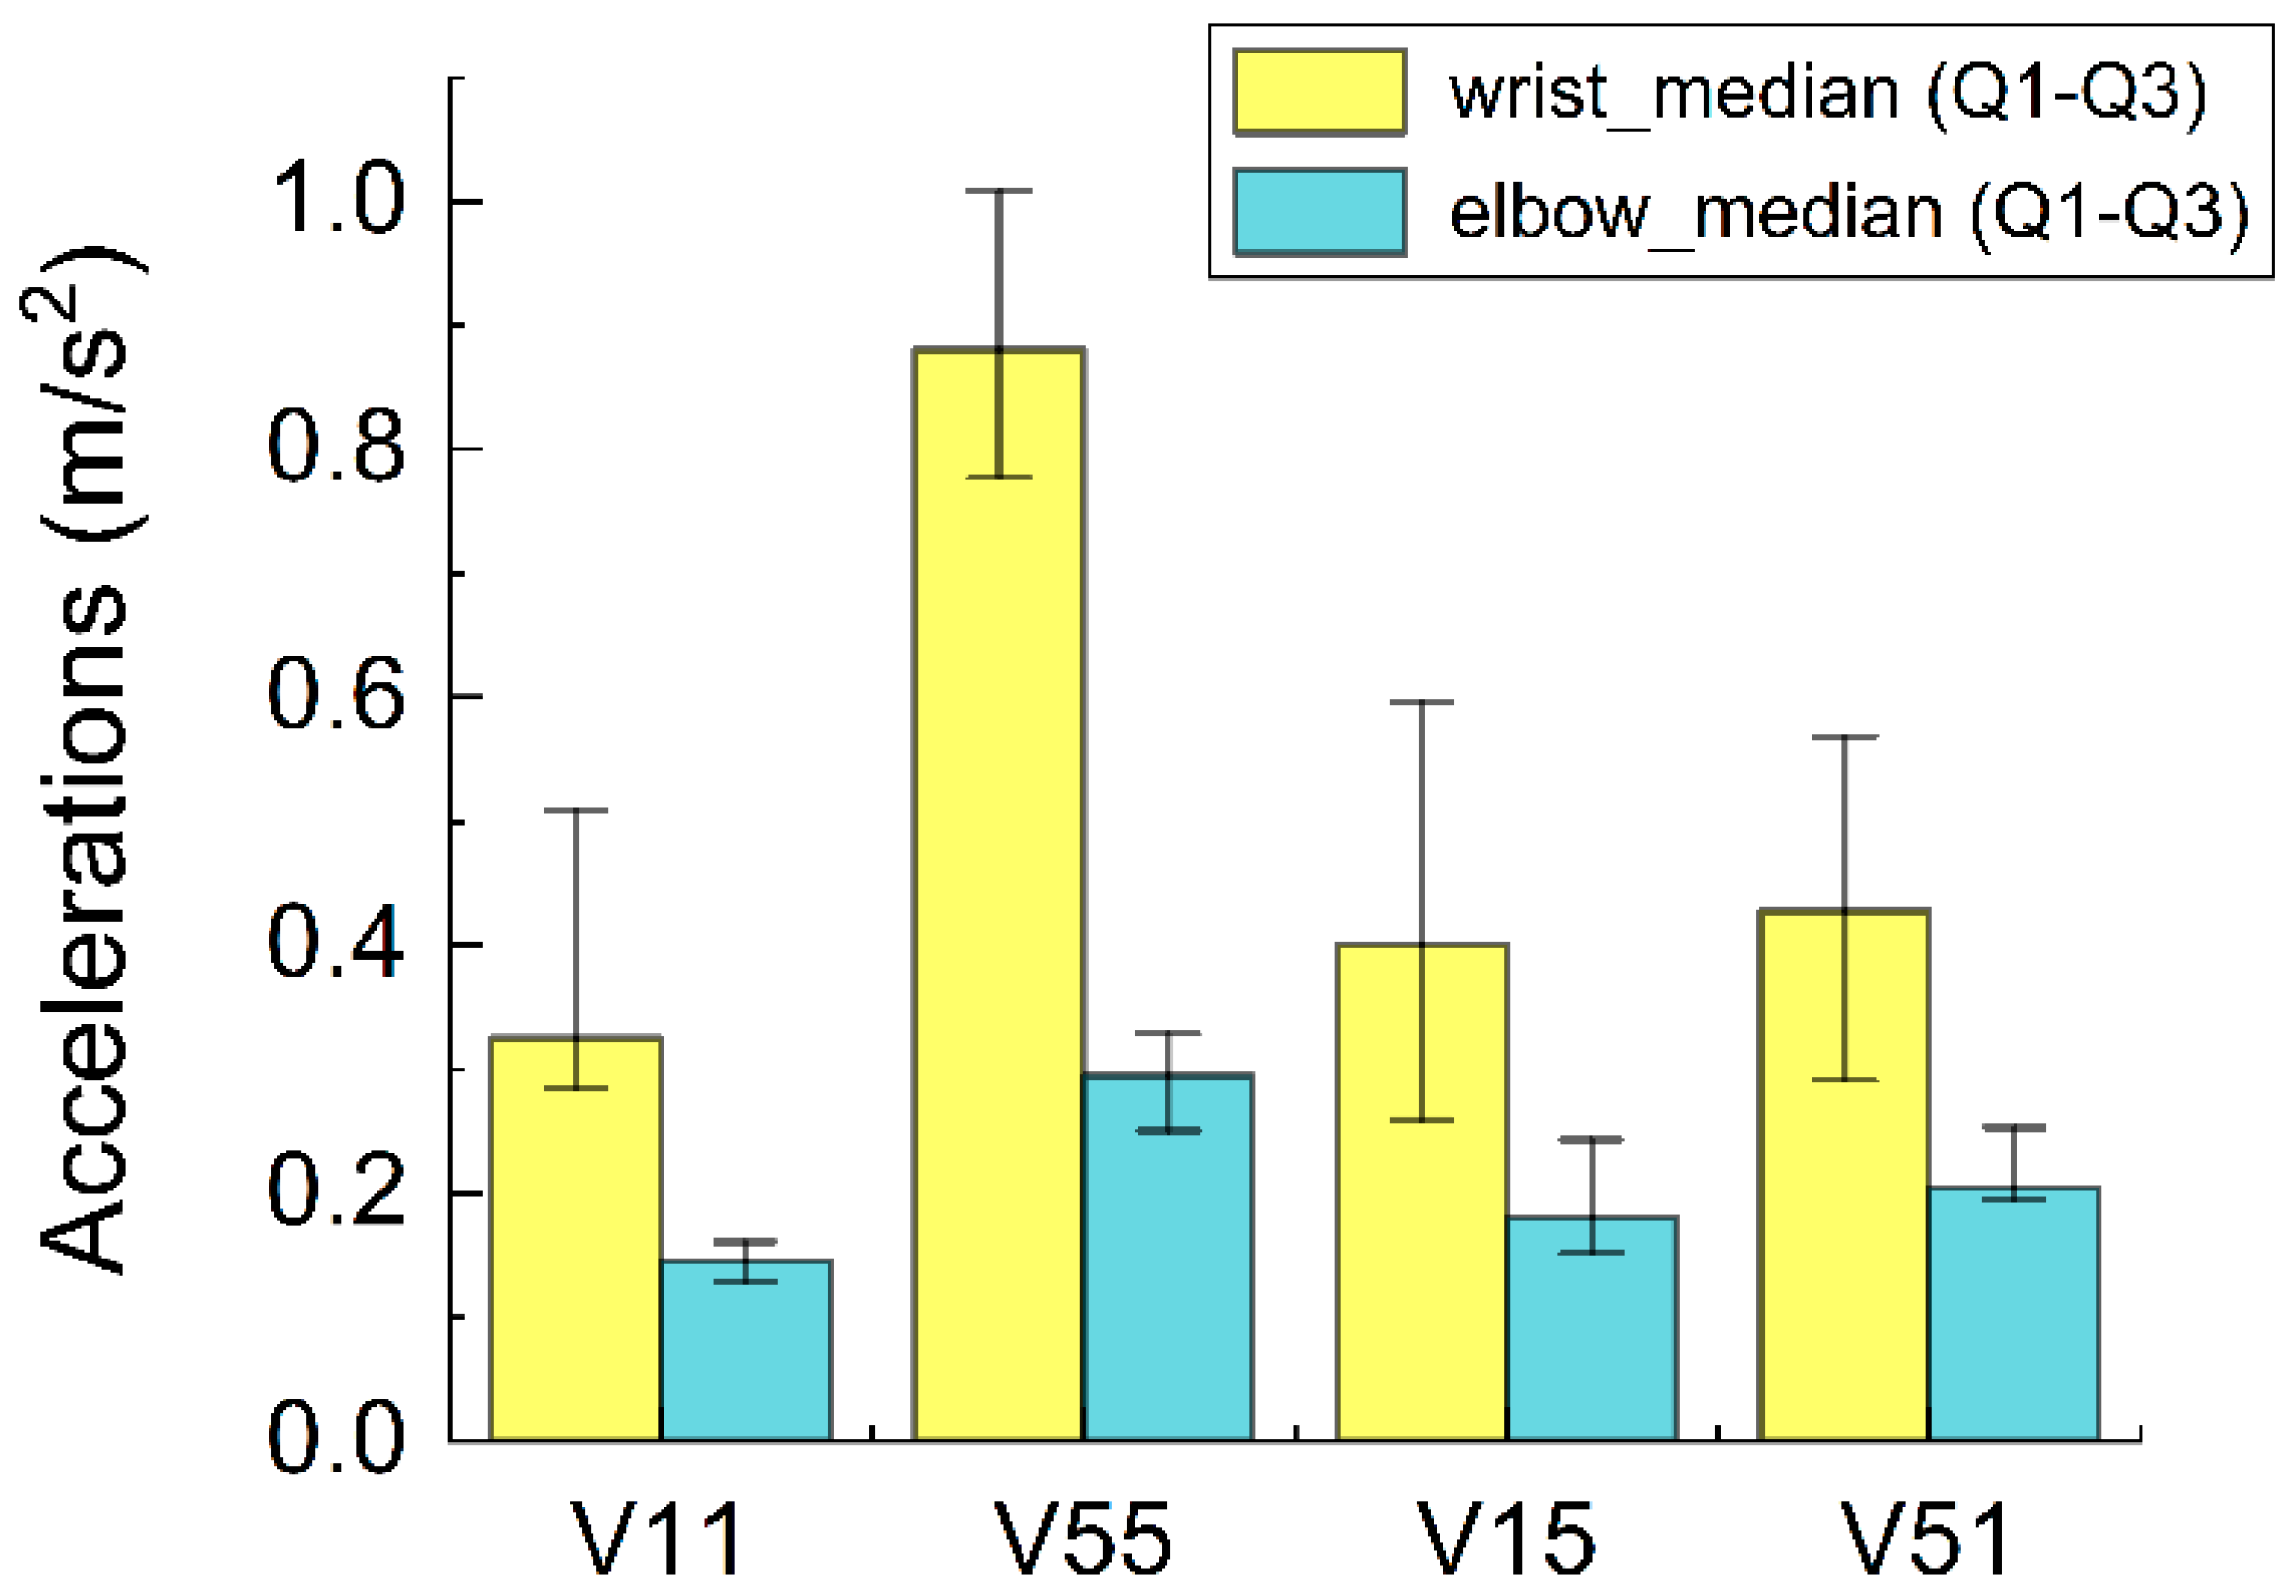
Figure 5 shows the transmitted accelerations to the forearm during HAV exposure with bent-arm posture. Compared to the excited vibration, which was 22 m/s2 r.m.s. measured at the handle, most of the energy was dissipated or absorbed in the process of transmission. The median magnitudes of the remaining vibration ranged between 0.33 and 0.88 m/s2 r.m.s. at the wrist, and between 0.14 and 0.30 m/s2 r.m.s. at the elbow. It can still be observed that accelerations at the wrist were substantially greater than (about double) those at the elbow, with more evident variations. The total hand-handle forces showed a good linear fit to the transmitted vibration (p < 0.001, Spearman). However, no significant correspondence was obtained between either the decrease in %FBF or %FST and the vibration accelerations measured in both locations (p = 0.063–0.101, Spearman).

4. Discussion

The relationships between the FST and force-and-vibration exposure were slightly different from those found for the FBF. Both measurement values were manifestations of circulatory effects and could serve as complements and references.

4.1. Vascular Response to Hand Force

Hand forces resulted in a loss of finger circulation in the exposed hand; either the force was exerted alone or combined with vibration.
As can be seen within the control group, levels of finger vasoconstriction in exposed fingers were highly dependent on the hand force, which is in contradiction with previous studies in which the hand force showed little effect on blood circulation [12,13]. However, the forces applied before were not identical to those used here and the amount of magnitude was negligible. The finding is consistent with earlier studies in which a gripping position was adopted, suggesting that the actual forces acting on the tool handle have an independent impact on the vasculature [19,20,21,22]. Given the insignificant response of unexposed fingers, such a unilateral reduction likely resulted from the constriction of local digital vessels by the operating force.
In previous research, the definition of the total hand-handle force could be considered in different ways. The coupling force, defined in ISO/WD-15230, was expressed as the sum of the grip and feed forces:
F c o u p l i n g = F g r i p + F f e e d
where the coefficients before the grip and feed forces both amounted to 1, suggesting there was no difference between the acute effects of grip force and feed force [23]. In contrast, the average contact force was characterized as a function of grip force, feed force, and handle size, in which the contribution of grip force was greater than that of the feed force [24]. The contact force can be written as
F c o n t a c t = α + β F g r i p + γ F f e e d
where α refers to the contact force offset due to the handle sensor, and β and γ were constant coefficients, depending on the diameter of the handle [25]. Moreover, the relevant biodynamics research found that the grip force mainly affected the dynamic response of the forearm and the feed force acted on the entire hand-arm system [26].
In this work, the effect was more emphasized on the vascular system. The result of the control group showed that when the grip force was the same as the feed force, a larger coupling force would lead to a greater influence on the finger circulation, while the equal importance of grip and feed force could be denied when it came to conditions where grip and feed force were different. More reduction in FBF was found with greater grip force though the coupling forces were the same, indicating a stronger dependence of vasoconstriction on the grip force. The reason for the stronger influence by the grip force could be the greater contact region between the handle and the fingers. Better skin–handle interaction with increased pressure would thus compress the digital vessels adequately to cause impairment in circulation. Another possible explanation is that the grip force mainly depends on the muscles of the fingers and palm, but the muscle group involved in feed force may come from the upper arm, which might yield different effects on finger circulation.
With the HAV applied, it was noted that the effect of hand force on the response to vibration was mainly reflected by the dynamic transmission. The vibration energy transmitted from finger to wrist and elbow in the forearm was linearly related to the coupling force, partly due to the change in tissue stiffness. Many of the previous HAV models considered energy transmission as a useful and integral part of defining actual harm to the human body [27], while no correspondence between vascular response and transmitted vibration accelerations was found in this study. More laboratory investigations are needed to see whether the energy absorbed can predict the difference in the vascular result and predict the actual effect of hand-arm vibration.

4.2. Vascular Response to Vibration

As mentioned before, the vibration-induced reduction in FBF was restricted to the fingers receiving the HAV, which was not in agreement with the findings in other studies that the vasoconstriction was observed in both exposed and unexposed fingers [10,28,29], probably because the force effects had some local limits and the intensity of the excited vibration here was relatively low.
After removing the contribution of force, the additional vascular effect of vibration on FBF was not significant. One possible underlying mechanism connected to this phenomenon is that the soft tissue in the human finger had already been compressed and deformed with the application of force loading, and this could have been related to a loss of blood permeability [30]. Extra vibration may cause little further volume change, especially in the case of high gripping forces. At the same time, other systems that contribute to the digital circulation could also be affected during high tissue compression. For example, the sympathetic traffic to and from the fingers can be limited, leading to a reduction in vasoconstriction. The drop in FBF in the right fingers during period 2 (Figure 2) with HAV was similar across all the conditions. It cannot be ruled out that vibration may have a certain masking effect on the hand force. In addition, the measure of FBF might be partly influenced by artefacts such as air cuff and strain gauge, which were not in good contact with the test fingers when fingers were constricted and exposed to the vibration.
Although the measure of FST was not as susceptible as FBF to the change of force, it can provide extra evidence of the vibration effect present on exposed fingers, as well as the different influences of grip and feed force. Across control conditions with smaller grip force, no difference was found between the %FST measured during period 2 (Figure 2) and period 1, but the exposure resulted in clear reductions in FST when the vibration was applied. Furthermore, in the absence of HAV, significant differences in %FST reduction caused by forces only occurred between conditions with both forces being large and both forces being small. However, in the case of vibration, this difference extended to two large-feed-force conditions with different grip forces, indicating that the vibration may amplify the effect of the change of grip force.
In this study, there was only one single-frequency HAV with one magnitude that was not able to give a broad conclusion on the HAV effects on exposed fingers. Although previous studies came to the conclusion that higher frequency and greater magnitude of the excited HAV were associated with greater reductions in FBF [28,31], the impact of hand force should always be involved with respect to the effects of HAV. On the one hand, the international standards for the assessment of the exposure amount shall consider not only the vibration intensity characteristics of the vibrator, but also the possible weight factor of the amount of force applied by the worker. On the other hand, in the design of vibration workpieces, the requirement for high gripping forces during their use should be reduced as much as possible.

5. Conclusions

The combination of grip and feed force had a negative correlation with circulatory disturbances. Force applied alone at the exposed hand would significantly alter the FBF with a reduction of up to 60% and FST, and greater force was associated with more loss of finger circulation, while the additional reductions in FBF and FST caused by vibration were not significant. Based on these findings, the circulatory responses seem to be dominantly regulated by the hand force exposure, indicating that the hand force should be taken into account in the assessment of exposure amount. In addition, the vascular responses seem to be more sensitive to the grip exertions than feed exertions. Indentation measures should be taken to minimise the grip force exerted on power tools as much as possible.

Author Contributions

Conceptualization, S.G. and Y.Y.; methodology, investigation, and original draft preparation, S.G.; supervision, review and editing, Y.Y. All authors have read and agreed to the published version of the manuscript.

Funding

This research was funded by the Chinese Scholarship Council (CSC), Grant No. 202008060219, under agreement [2020]71.

Data Availability Statement

The data are not publicly available due to privacy reasons.

Acknowledgments

We thank Gary Parker and Peter Russell for technical and instrumental support.

Conflicts of Interest

The authors declare no conflict of interest.

References

  1. Gemne, G. Diagnostics of hand-arm system disorders in workers who use vibrating tools. Occup. Environ. Med. 1997, 54, 90. [Google Scholar] [CrossRef] [PubMed] [Green Version]
  2. Griffin, M.J.; Erdreich, J. Handbook of Human Vibration; Acoustical Society of America: Melville, NY, USA, 1991. [Google Scholar]
  3. Griffin, M.J.; Bovenzi, M. The diagnosis of disorders caused by hand-transmitted vibration: Southampton Workshop 2000. Int. Arch. Occup. Environ. Health 2002, 75, 1–5. [Google Scholar] [CrossRef] [PubMed]
  4. IIDB02-New Cases of Non-Lung Diseases in England, Wales and Scotland by Disease. Available online: https://www.hse.gov.uk/statistics/tables/iidb02.xlsx (accessed on 25 February 2022).
  5. Health and Safety Executive Hand-Arm Vibration—Key Messages. Available online: https://www.hse.gov.uk/vibration/hav/keymessages.htm (accessed on 25 February 2022).
  6. Bovenzi, M. Exposure-response relationship in the hand-arm vibration syndrome: An overview of current epidemiology research. Int. Arch. Occup. Environ. Health 1998, 71, 509–519. [Google Scholar] [CrossRef]
  7. Bovenzi, M.; Zadini, A.; Franzinelli, A.; Borgogni, F. Occupational musculoskeletal disorders in the neck and upper limbs of forestry workers exposed to hand-arm vibration. Ergonomics 1991, 34, 547–562. [Google Scholar] [CrossRef]
  8. Bovenzi, M.; Lindsell, C.; Griffin, M. Response of finger circulation to energy equivalent combinations of magnitude and duration of vibration. Occup. Environ. Med. 2001, 58, 185–193. [Google Scholar] [CrossRef] [Green Version]
  9. Krajnak, K.; Miller, G.; Waugh, S. Contact area affects frequency-dependent responses to vibration in the peripheral vascular and sensorineural systems. J. Toxicol. Environ. Health 2018, 81, 6–19. [Google Scholar] [CrossRef]
  10. Bovenzi, M.; Welsh, A.J.L.; Della Vedova, A.; Griffin, M.J. Acute effects of force and vibration on finger blood flow. Occup. Environ. Med. 2006, 63, 84–91. [Google Scholar] [CrossRef] [Green Version]
  11. Griffin, M.J.; Welsh, A.J.; Bovenzi, M. Acute response of finger circulation to force and vibration applied to the palm of the hand. Scand. J. Work Environ. Health 2006, 32, 383–391. [Google Scholar] [CrossRef] [Green Version]
  12. Thompson, A.J.; Griffin, M.J. Effect of the magnitude and frequency of hand-transmitted vibration on finger blood flow during and after exposure to vibration. Int. Arch. Occup. Environ. Health 2009, 82, 1151–1162. [Google Scholar] [CrossRef]
  13. Ye, Y.; Griffin, M.J. Changes in finger blood flow induced by low magnitude localised vibration of the thenar eminence of the hand. In Proceedings of the 44th United Kingdom Conference on Human Responses to Vibration, Loughborough, UK, 7–9 September 2009. [Google Scholar]
  14. Radwin, G.R.; Armstrong, T.J.; Chaffin, D.B. Power hand tool vibration effects on grip exertions. Ergonomics 1987, 30, 833–855. [Google Scholar] [CrossRef]
  15. BS EN ISO 21420:2020; Protective Gloves. General Requirements and Test Methods. International Organization for Standardization: London, UK, 2020.
  16. Greenfield, A.; Whitney, R.; Mowbray, J. Methods for the investigation of peripheral blood flow. Br. Med. Bull. 1963, 19, 101–109. [Google Scholar] [CrossRef] [PubMed]
  17. Welsh, A.; Griffin, M. Multi-Channel and Single-Channel Venous Occlusion Plethysmography for Finger Blood Flow Measurement. 2004. Available online: http://resource.isvr.soton.ac.uk/staff/pubs/PubPDFs/Pub10501.pdf (accessed on 25 February 2022).
  18. ISO 5349-1; Mechanical Vibration—Measurement and Evaluation of Human Exposure to Hand-Transmitted Vibration—Part 1: General Requirements. International Organization for Standardization: Geneva, Switzerland, 2001.
  19. Sandover, J.; Louw, J. Acute effects of grip force and vibration on finger temperature. In Proceedings of the 6th International Conference on Hand-Arm Vibration, Bonn, Germany, 19–22 May 1992. [Google Scholar]
  20. Scheffer, M.; Dupuis, H. Effects of combined hand-arm vibration and cold on skin temperature. Int. Arch. Occup. Environ. Health 1989, 61, 375–378. [Google Scholar] [CrossRef] [PubMed]
  21. Hartung, E.; Dupuis, H.; Scheffer, M. Effects of grip and push forces on the acute response of the hand-arm system under vibrating conditions. Int. Arch. Occup. Environ. Health 1993, 64, 463–467. [Google Scholar] [CrossRef] [PubMed]
  22. Miyakita, T.; Miura, H.; Futatsuka, M. Hand-Arm Vibration, Noise, Temperature and Static Load. Kurume Med. J. 1990, 37, S73–S83. [Google Scholar] [CrossRef]
  23. Riedel, S. Consideration of grip and push forces for the assessment of vibration exposure. Cent. Eur. J. Public Health 1995, 3, 139–141. [Google Scholar] [PubMed]
  24. Welcome, D.; Rakheja, S.; Dong, R.; Wu, J.; Schopper, A. An investigation on the relationship between grip, push and contact forces applied to a tool handle. Int. J. Ind. Ergon. 2004, 34, 507–518. [Google Scholar] [CrossRef]
  25. Marcotte, P.; Aldien, Y.; Boileau, P.; Rakheja, S.; Boutin, J. Effect of handle size and hand–handle contact force on the biodynamic response of the hand–arm system under zh-axis vibration. J. Sound Vib. 2005, 283, 1071–1091. [Google Scholar] [CrossRef]
  26. Adewusi, S.A.; Rakheja, S.; Marcotte, P.; Boutin, J. Vibration transmissibility characteristics of the human hand–arm system under different postures, hand forces and excitation levels. J. Sound Vib. 2010, 329, 2953–2971. [Google Scholar] [CrossRef]
  27. Saha, S.; Kalra, P. A review on hand-arm vibration exposure and vibration transmissibility from power hand tools to hand-arm system. Int. J. Hum. Factors Ergon. 2016, 4, 10–46. [Google Scholar] [CrossRef]
  28. Bovenzi, M.; Lindsell, C.J.; Griffin, J.M. Acute vascular responses to the frequency of vibration transmitted to the hand. Occup. Environ. Med. 2000, 57, 422–430. [Google Scholar] [CrossRef] [Green Version]
  29. Ye, Y.; Griffin, M.J. Effects of temperature on reductions in finger blood flow induced by vibration. Int. Arch. Occup. Environ. Health 2011, 84, 315–323. [Google Scholar] [CrossRef] [PubMed]
  30. Bader, D.; Barnhill, R.; Ryan, T. Effect of Externally Applied Skin Surface Forces on Tissue Vasculature. Arch. Phys. Med. Rehabil. 1986, 67, 807–811. [Google Scholar] [PubMed]
  31. Bovenzi, M.; Lindsell, C.J.; Griffin, M.J. Magnitude of acute exposures to vibration and finger circulation. Scand. J. Work Environ. Health 1999, 278–284. [Google Scholar] [CrossRef] [PubMed] [Green Version]
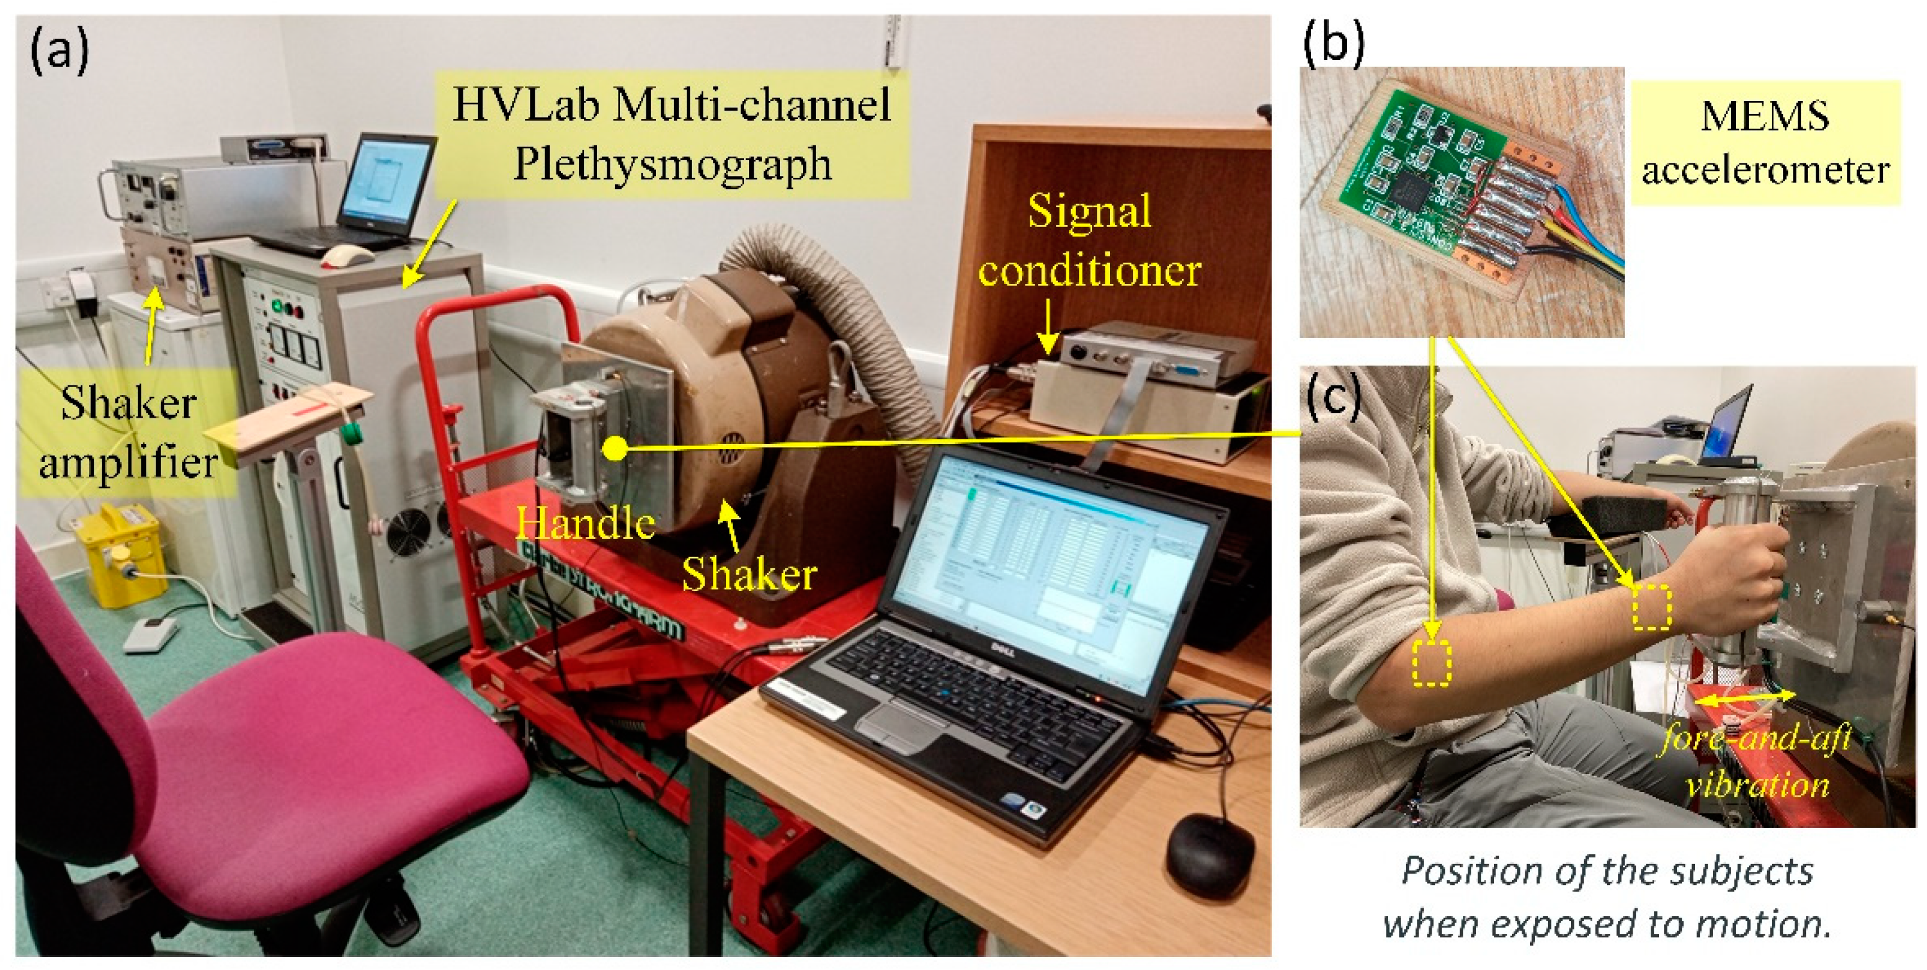
Figure 1. (a) The experimental set-up. (b) The tri-axial accelerometers used to measure the vibration transmitted to the subject. (c) The close-up shows the posture and position of the subject when exposed to the motion by grasping the instrumented handle. Two accelerometers were attached to the subject’s wrist and elbow, respectively, fastened by micropore tape.
Vibration 05 00010 g001
Figure 2. Timeline events during one experimental trial. Subjects experienced various force-and-vibration conditions during period 2 by grasping the handle. Period 1 of the following trial can be regarded as the latter part of the recovery period of the previous round.
Vibration 05 00010 g002
Figure 3. Percentage change of finger blood flow (% of pre-exposure) in the (a) index and (b) fourth right fingers (R2, R4, ipsilateral to hand force and vibration), and the (c) index and (d) fourth left fingers (L2, L4, contralateral) during the eight exposure conditions (see Table 1). The resting period of each following round was considered as the latter part of the recovery period of the previous round. The two dashed lines correspond to the time points at which exposure begun and ended, respectively. Plotted symbols are median values.
Vibration 05 00010 g003
Figure 4. Absolute change of finger skin temperature in the (a,b) right (exposed) fingers and (c,d) left (unexposed) fingers at every minute during the eight exposure conditions (see Table 1). The resting period of each following round was considered as the latter part of the recovery period of the previous round. Plotted symbols are median values of FST.
Vibration 05 00010 g004
Figure 5. The median values of vibration accelerations (m/s2, r.m.s.) measured at subjects’ right wrists and elbows in zh-axis across four conditions with vibration applied. The upper and lower caps refer to the third quartile (Q3) and the first quartile (Q1) in each condition, respectively.
Vibration 05 00010 g005
Table 1. The eight force-and-vibration situations experienced by subjects.
Vibration groupG10 + F10 + HAV
(V11)
G50 + F50 + HAV
(V55)
G10 + F50 + HAV
(V15)
G50 + F10 + HAV
(V51)
Control groupG10 + F10
(C11)
G50 + F50
(C55)
G10 + F50
(C15)
G50 + F10
(C51)
G: grip force (N); F: feed force (N).
Table 2. Alterations in finger blood flow and finger skin temperature. Percentage change in FBF and FST (% of pre-exposure) for left and right fingers over eight exposure conditions. The alterations in FBF were calculated as the differences between the mean value of the median FBF in two fingers of each hand at exposure period 2 and the resting level of FBF during pre-exposure; the alterations in FST were calculated as the differences between the median FST at the first minute during recovery and the resting level of FST during pre-exposure. Values given in parentheses are the range of quartiles (namely, Q1–Q3).
(a) Alterations in finger blood flow (% of pre-exposure).
C11V11C55V55
Left (unexposed) finger99.94%
(88.47–104.91%)
95.93%
(89.61–102.76%)
90.62%
(86.65–99.30%)
88.61%
(74.32–103.90%)
Right (exposed) finger59.72% **
(47.42–72.95%)
47.16% **
(32.06–61.41%)
43.72% **
(26.46–51.83%)
41.11% **
(30.90–46.19%)
C15V15C51V51
Left (unexposed) finger100.93%
(93.09–112.05%)
92.62%
(83.92–109.33%)
97.86%
(77.49–106.45%)
83.26%
(77.70–99.16%)
Right (exposed) finger51.96% **
(43.48–75.24%)
45.16% **
(37.54–55.55%)
39.61% **
(34.87–48.80%)
40.38% **
(25.87–61.40%)
(b) Alterations in finger skin temperature (% of pre-exposure).
C11V11C55V55
Left (unexposed) finger100.64%
(100.22–101.17%)
100.22%
(99.61–101.84%)
99.24%
(97.43–100.74%)
98.36%
(97.92–99.05%)
Right (exposed) finger98.05%
(96.07–99.37%)
96.57%
(93.95–98.03%)
95.95% *
(94.45–96.07%)
96.20% *
(95.15–97.19%)
C15V15C51V51
Left (unexposed) finger100.77%
(100.40–101.69%)
99.74%
(98.01–99.94%)
100.48%
(99.40–101.36%)
99.66%
(98.34–99.95%)
Right (exposed) finger97.56% **
(97.02–98.46%)
96.54% **
(95.89–97.98%)
96.24% **
(95.48–97.49%)
96.00% **
(95.33–96.42%)
* p < 0.05; ** p < 0.005.
Publisher’s Note: MDPI stays neutral with regard to jurisdictional claims in published maps and institutional affiliations.