1. Introduction
The foot–ankle system (FAS) is the primary exposure point for foot-transmitted vibrations (FTV). Exposure to FTV for prolonged periods can increase the risk of the vibration-induced white foot (VIWFt) [
1,
2,
3]. The effects of VIWFt can include neurological, vascular and osteoarticular symptoms. Neurological symptoms include numbness and tingling in the toes or a reduced sense of touch and temperature. Vascular symptoms can include increasing loss of circulation which could lead to toe blanching and necrosis. Osteoarticular symptoms can include bone or joint damage and muscular fatigue [
4,
5]. In order to prevent injury sustained from FTV exposure, effective personal protective equipment (PPE), such as boots and insoles [
6] must be designed to address the biodynamic response (i.e., transmissibility) or the degree to which vibration is transmitted through the foot. However, few studies have explored the impact of FTV exposure as the forces on different portions of the foot varies (i.e., apparent mass and changes in the center of pressure (COP)) [
7].
Models are used to simulate the biodynamic responses of the anatomy of interest [
8], in this case, the FAS [
9,
10], to limit human exposure to vibration while testing possible solutions. Simplified lumped-parameter (i.e., Kelvin–Voigt) models of standing subjects have been developed to reproduce the apparent mass measured at the contact surface (i.e., the floor) [
7,
8]. However, these models are not suitable to reproduce the FAS biodynamic response as they do not include a separate foot component. A biomechanical model made of two rigid bodies connected by a hinge and a horizontal tension stiffness has been used to evaluate the energy storage of the plantar fascia [
11] and to investigate the role of the inclination of the calcaneus. An improved and asymmetric version of this model investigated the role of the plantar fascia in the load-bearing aspect of the foot [
9]. This hinge model was then used as the foundation for developing three lumped-parameter models that more specifically simulate the effects of FTV on the FAS [
10,
12,
13].
The structure of the first FTV lumped-parameter model included masses for the tibia, calcaneus and talus, navicular, three cuneiforms and three metatarsals [
10]. Unfortunately, this model was validated using transmissibility data from measurements at the medial malleolus and tibial tuberosity of seated subjects, with variations in the load on the knees within a frequency range of 10–50 Hz at 5 Hz increments [
14]. Therefore, this model provides a poor estimation of the transmissibility effects of FTV exposure for the FAS. Using a similar structure, with an additional upper body mass to simulate the whole-body resonant frequency more effectively, a two-dimensional model of the FAS [
12] was optimized. This optimized model uses the transmissibility response of the foot at five anatomical locations of 21 participants [
15] and the apparent normalized mass of 10 male participants [
16]. This model demonstrated good similarity with the measured biodynamic responses of the foot but was limited to a barefoot natural standing position.
Reference functions for model calibration can include vibration transmissibility, driving-point response (i.e., apparent mass), or a combination of the two [
8]. Transmissibility measurements from 24 anatomical locations on the foot indicated changes in the center of pressure (COP) (i.e., towards the forefoot and rearfoot) altered the transmissibility response at the different locations [
17]. Changes to the COP, the calcaneal angle [
11] and the height of the calcaneus [
18] have also been shown to lead to variations in the respective models. In a previous experiment where the apparent mass and transmissibility of subjects exposed to whole-body vibration in different postures were measured, the apparent mass at the driving point was found to change due to different knee angles [
19]. However, other experiments have shown that the apparent mass at the driving point did not change significantly in the case of a forward leaning straight leg posture [
16]. Therefore, the effects of varying the COP need to be considered in order to establish an effective FAS model for testing possible PPE materials.
The model structure was reduced to a four degrees-of-freedom (DOF) lumped-parameter model of the FAS and was tested using transmissibility measurements while participants were in three COP positions (natural, forward towards the toes and backward towards the rearfoot) [
13]. Although the model performed well when the COP was natural or forward towards the toes, the optimization was inadequate when the COP was in the heel.
Thus, the purpose of this study was to continue to build on the four-segment lumped-parameter model that was developed, as it includes a segment for the toes and an expanded frequency range (10 to 100 Hz) [
12]. This model was selected as it performed well using natural standing position transmissibility and apparent mass data but has yet to be optimized when altering the COP. The study’s central hypothesis is that variation in the COP will change the equivalent stiffness and damping values of the FAS, with this model more effectively simulating the transmissibility response when the COP is towards the heel [
13]. It is anticipated that the stiffness parameters at the heel will increase when the COP is in the rearfoot and similarly for the toes when the COP is in the forefoot. Once an effective model of the FAS has been established for multiple COP positions, it can be used to reproduce the interaction mechanism between the human body and vibrating surface (i.e., different types of industrial equipment) [
20]. In addition, the model could give new insights into assessing health risk for workers exposed to FTV, taking into account the effect of posture. Further, the model can be used to estimate the vibration reduction of devices (i.e., PPE) [
21], as is the natural progression of hand-transmitted vibration modelling [
22].
2. Materials and Methods
This study incorporated a formerly developed lumped-parameter model of the FAS [
12] and two previously collected experimental data sets as the reference functions for optimization [
15,
16,
17]. Transmissibility is the ratio between the input vibration from the platform to the FAS and the vibration of the FAS at a given anatomical location [
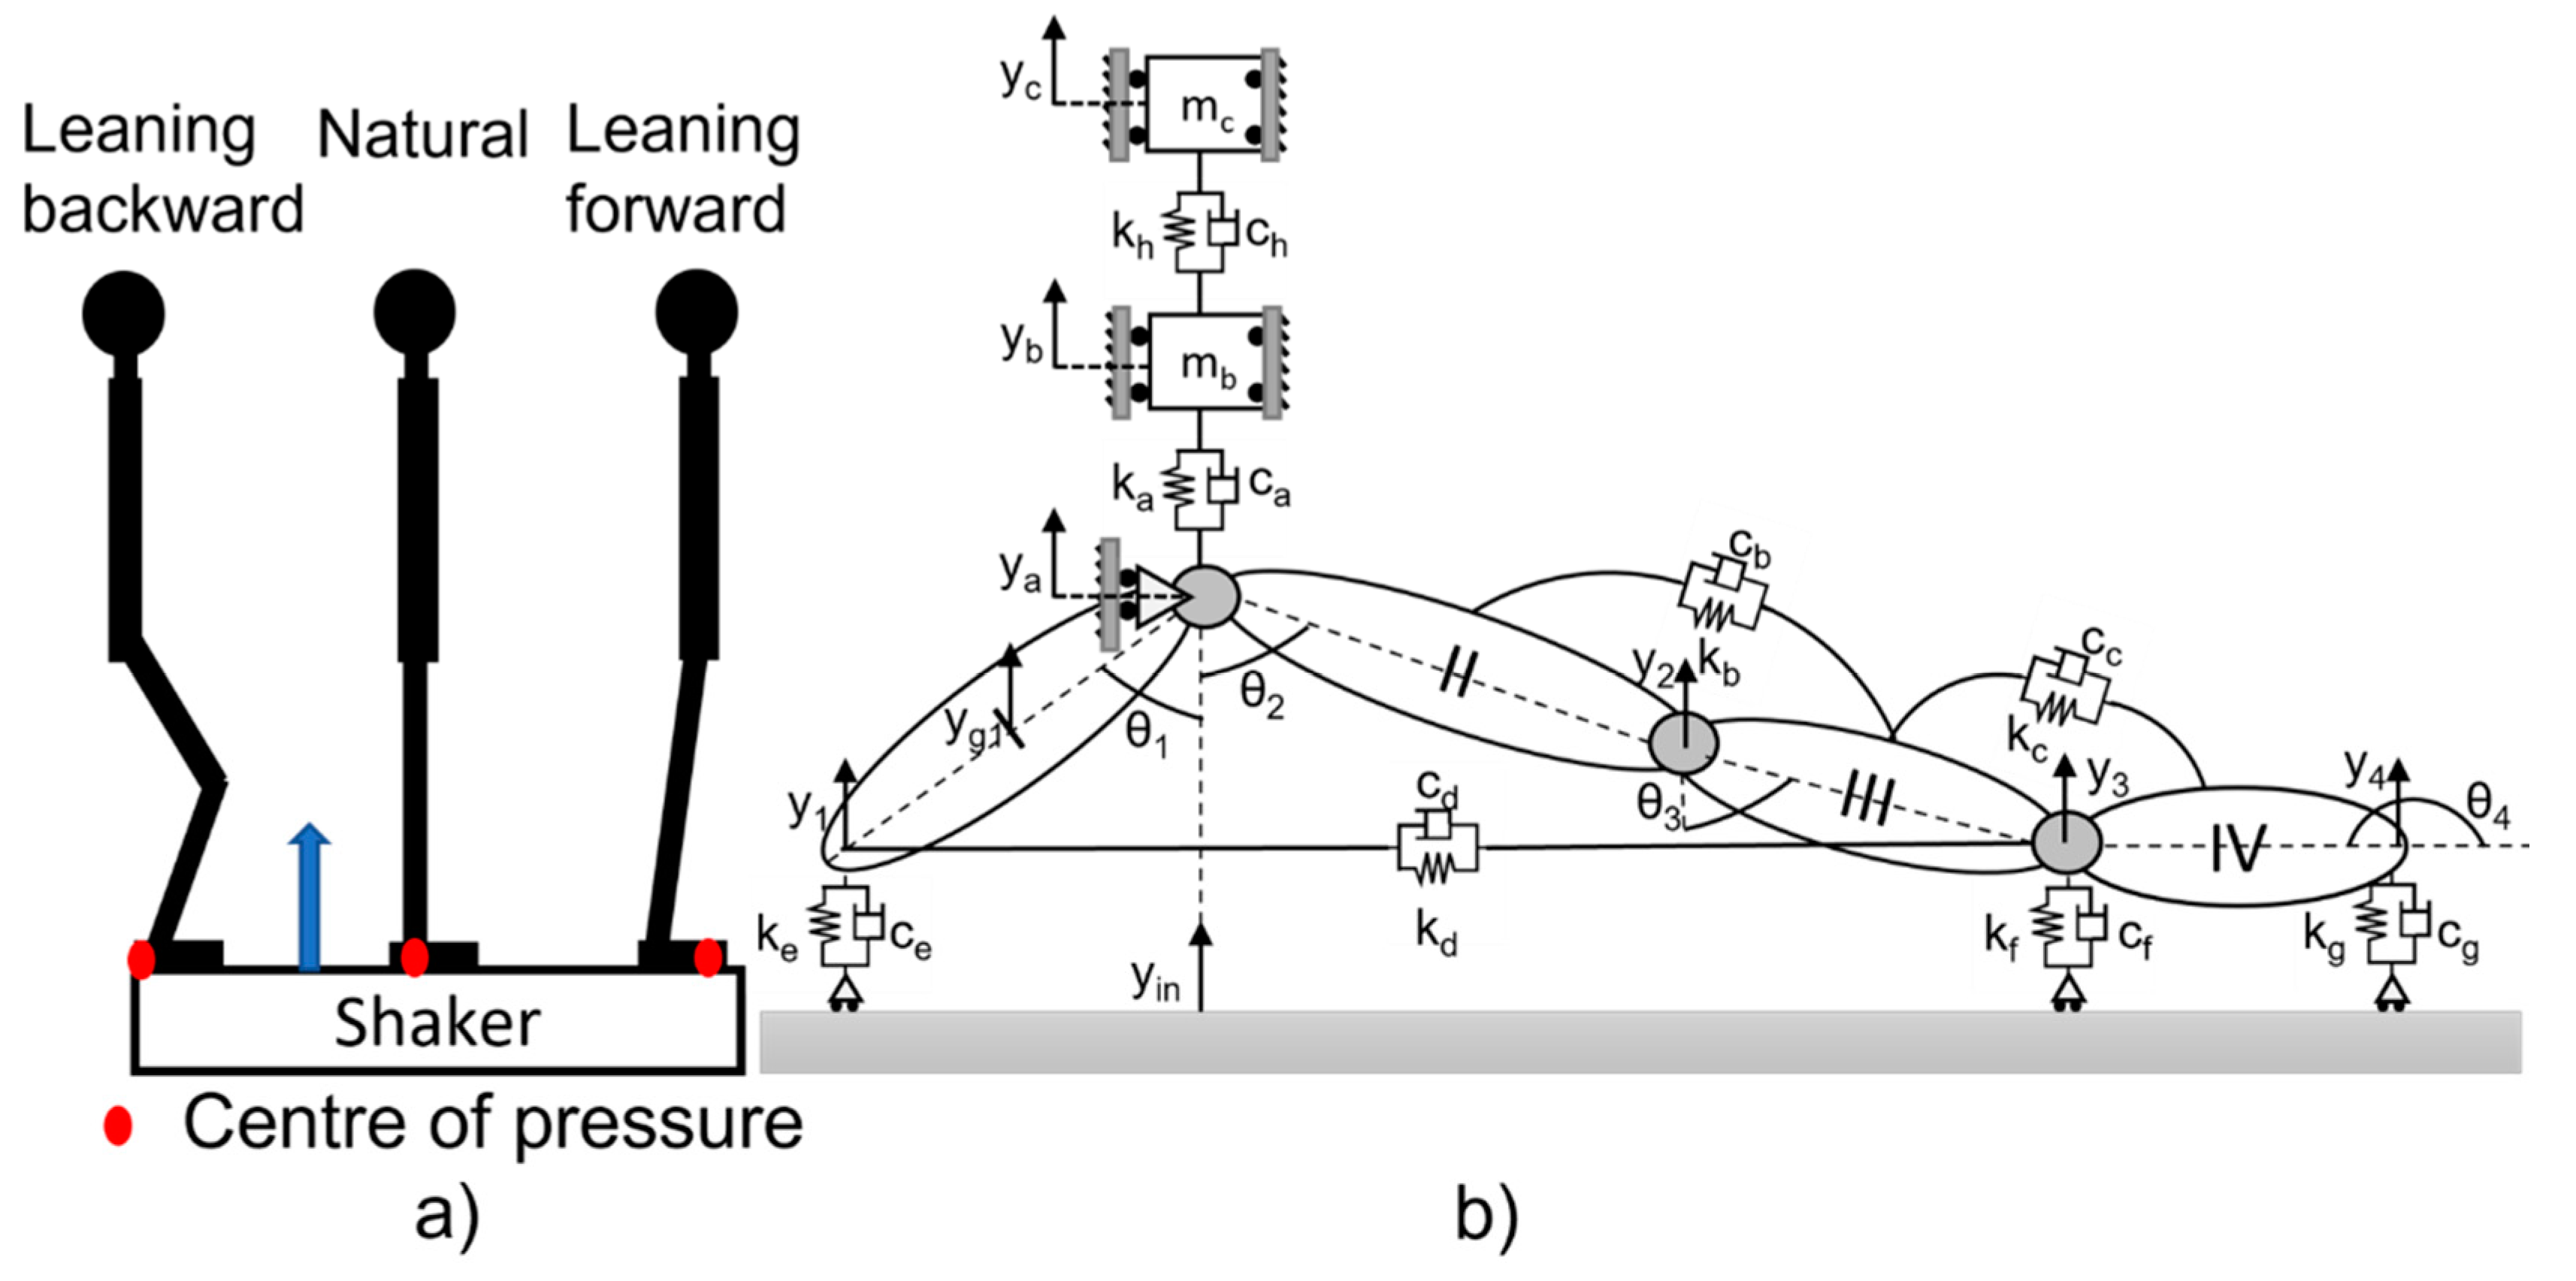
7]. Three sets of transmissibility responses from the foot at five anatomical locations were used, incorporating a variation in COP. The COP was in a natural (i.e., centered) position [
15], pushed forward towards the toes and backwards towards the heel [
17] (
Figure 1a). The apparent mass is the transfer function between the input acceleration and the exchanged force [
7]. As the apparent mass at the driving point has not been found to differ significantly with forward leaning straight leg postures, an experimental data set incorporating the apparent mass of ten participants was used [
16]. The FAS model incorporates four-foot segments and was chosen to correctly represent foot transmissibility at five different locations (rearfoot, ankle, midfoot, forefoot and toes) (
Figure 1b) [
12,
23], as it has previously demonstrated acceptable error for transmissibility data in the natural standing position. The upper part of the body is modelled with a simple two-masses model to reconstruct the apparent mass [
24].
2.1. Experimental Datasets
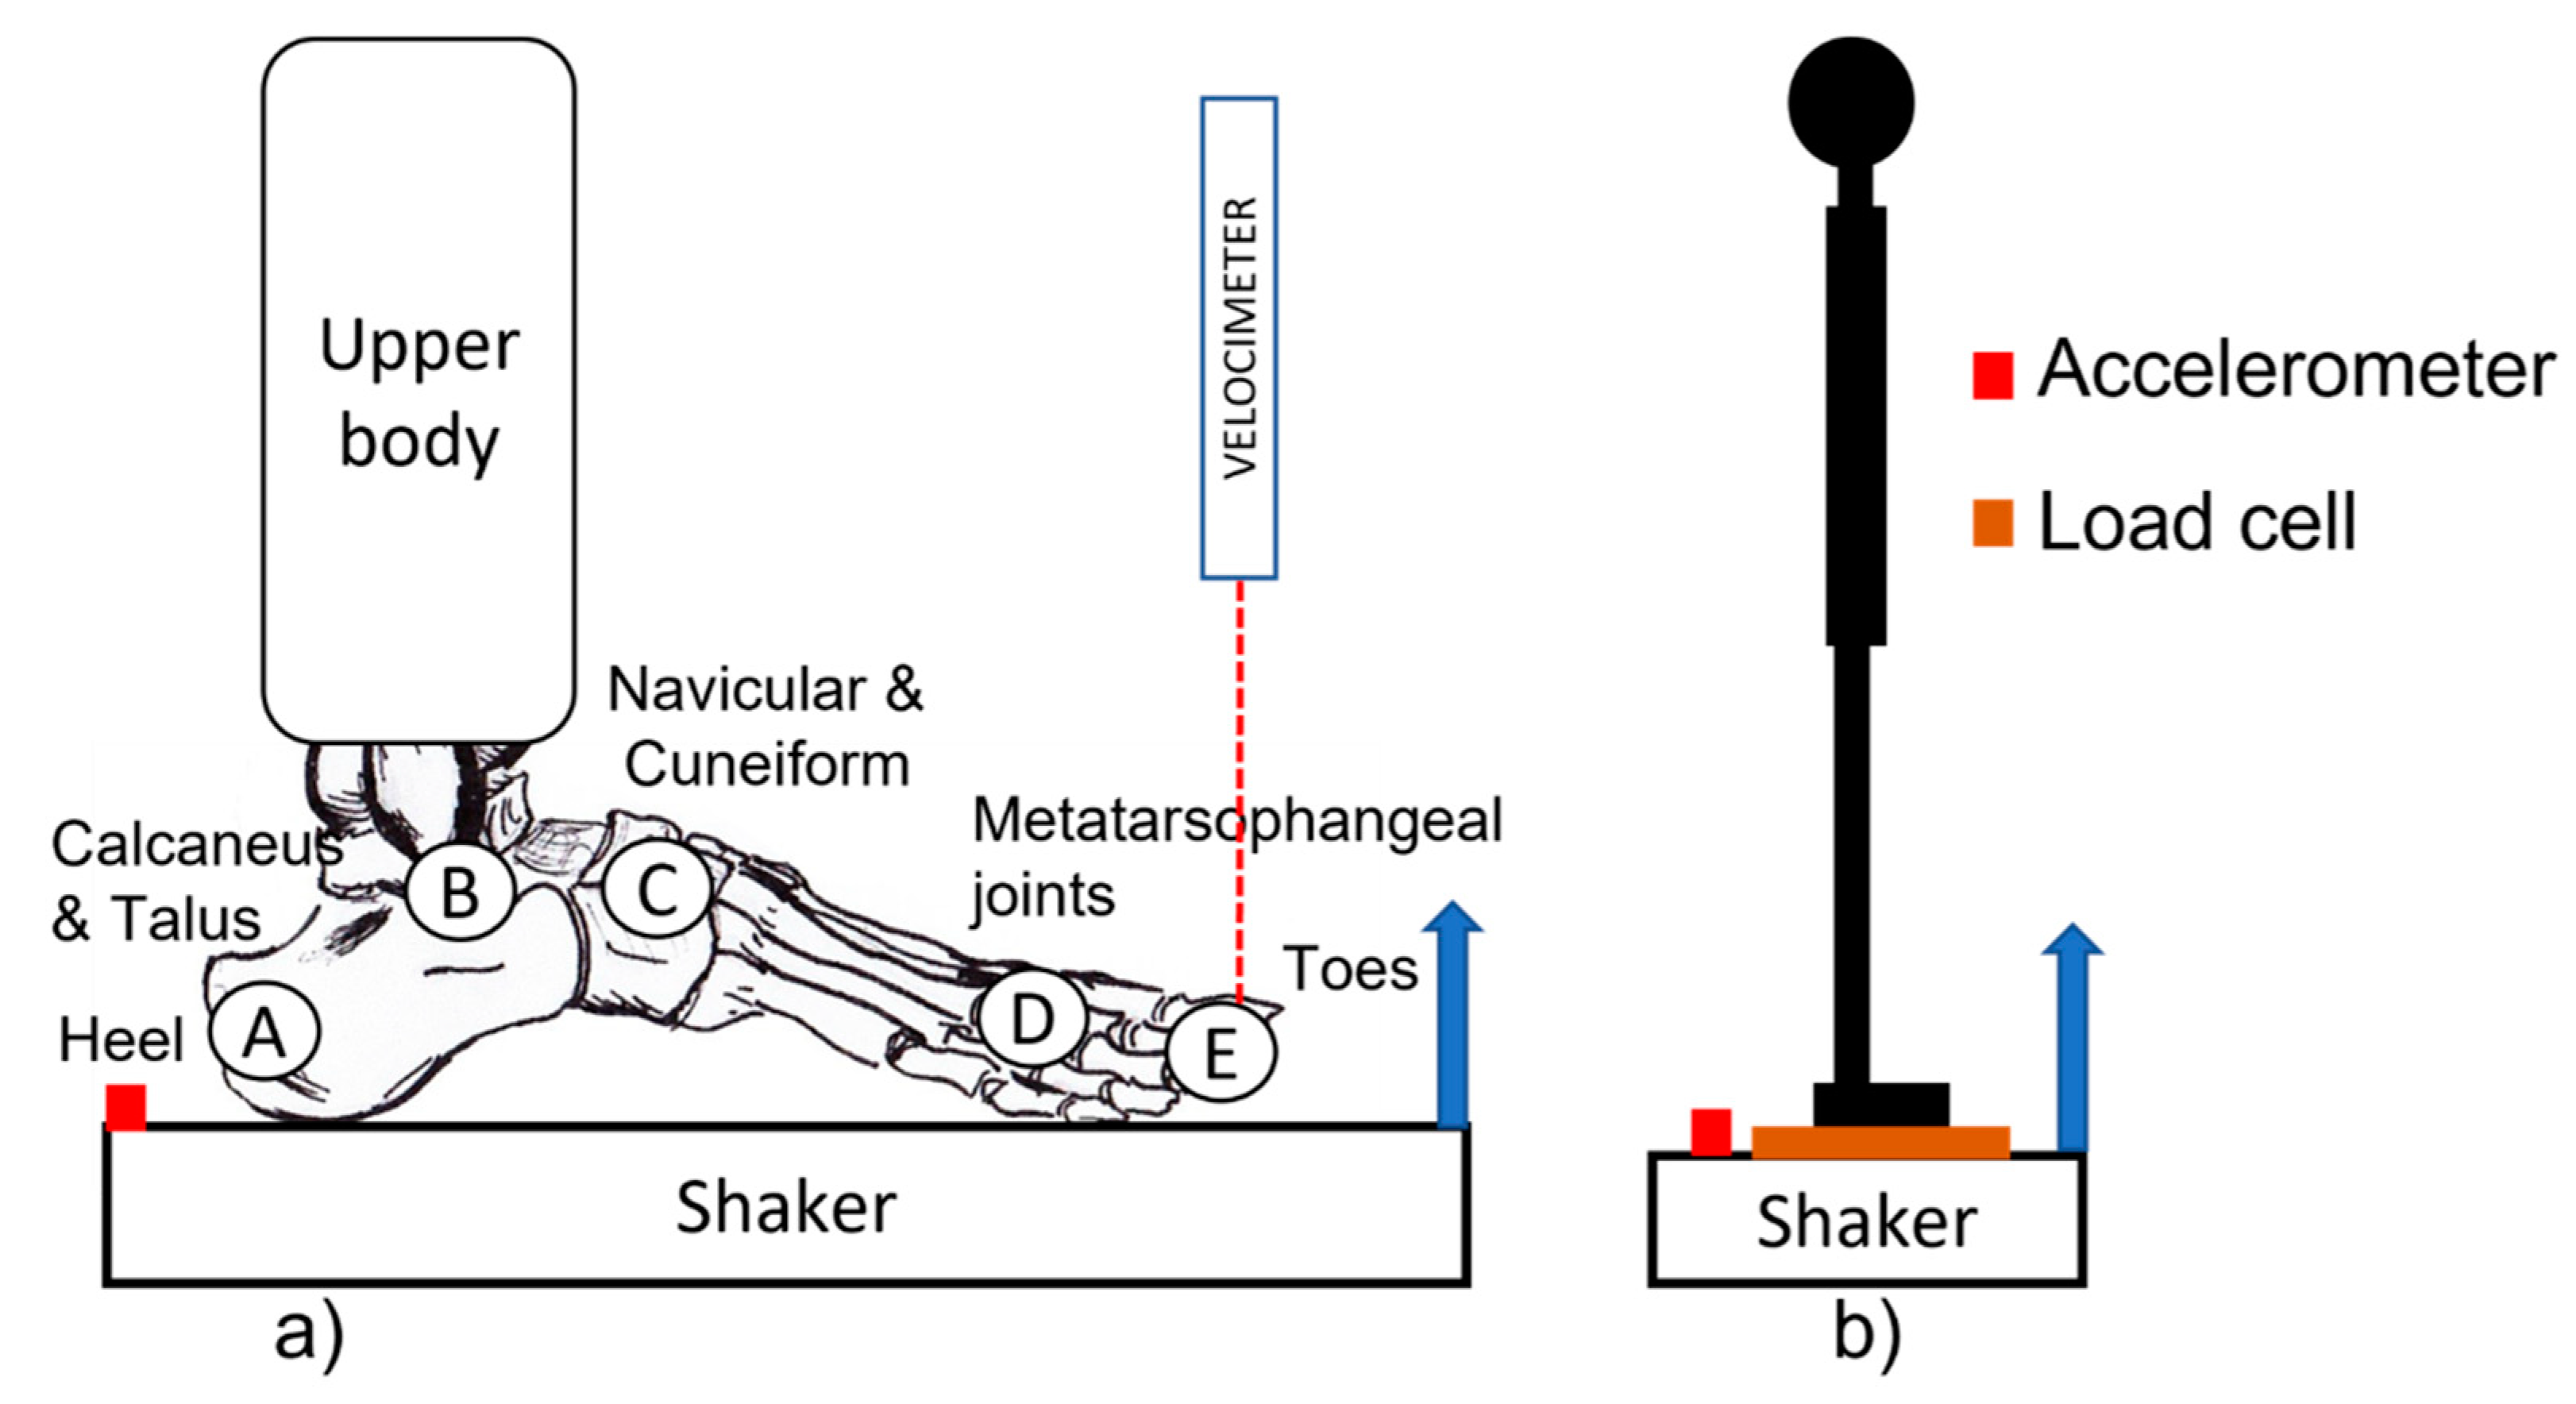
The experimental transmissibility (
and apparent mass (
data were collected during three previous studies [
15,
16,
17]. Twenty-one subjects were exposed to vertical vibration from the 10–100 Hz frequency range. Foot transmissibility was acquired at rearfoot, ankle, midfoot, forefoot and toes (
Figure 2a) while subjects assumed natural [
15], forward leaning and backward leaning standing positions on the platform [
17]. The COP was measured using Pedar-Expert insoles (Version 11.3.12, Munich, Germany) while the subjects were off the vibration platform, and a plumbline was attached to the right hip with a marker on the right foot for each COP position [
17]. While on the vibration platform, the subject would assume the COP position using the plumbline guide before the vibration exposure for each anatomical location.
The apparent mass mean curve was collected while ten subjects stood in their natural posture and were exposed to vertical vibration within the 2–20 Hz frequency range (
Figure 2b) [
16]. Since changing COP has been found to have minimal effects on the apparent mass curve [
16], apparent mass for backward and forward leaning COP positions have been assumed to be equal to the natural COP apparent mass curve.
2.2. Foot Model Description
The FAS model is composed of six rigid elements (
Figure 1b) [
12]: two masses were used to represent the upper body (
kg and
kg) [
24] and four segments (I to IV), with their inertial and geometric properties reported in
Table 1. The segments are connected through Kelvin–Voigt models to reproduce the viscoelastic properties of tissues and ligaments with stiffness parameters (
) and damping (
). The linear DOF of the system is the vertical displacements of the ankle (
), and of the upper body masses (
and
). The rotational DOF includes rotation of the rearfoot (
), midfoot (
), forefoot (
) and toes (
). The constrained DOF is the vertical displacement of the vibrating surface (
), which applies the harmonic displacement to the sole of the foot. The transmissibility response of the foot is evaluated in the middle of the rearfoot (
), the junction between midfoot and forefoot (
), the junction between forefoot and toes (
) and at the distal end of the toes (
). The linearized equations of motion have previously been described (Appendix B of [
12]).
The expression of the transmissibility from the vibrating ground (
) to five-foot locations has been computed considering the linearized equations of the FAS model [
28]. The response of the seven DOF (
) can be written as Equation (1):
where
I is the imaginary unit,
Ω is the angular frequency, and
,
and
are the free-free (
) and free-constrained (
FC) components of the global mass (
), damping (
) and stiffness (
) matrices, respectively. Matrices
,
and
were composed of the geometrical and inertial characteristics provided in
Table 1, and the stiffness (
) and damping (
) parameters. The transmissibility curves (
,
,
,
and
) between the selected vertical velocities (
,
,
,
and
) and the vibrating ground velocity (
) were obtained considering the geometrical relationship with the free DOF of the linearized equation of motion of the system [
12].
The normalized apparent mass of the model was computed according to Equation (2):
where the numerator is the mathematical expression of the force at the driving-point, while the denominator is the imposed acceleration multiplied by the total mass of the model.
2.3. Optimization Procedure
The optimization procedure is based on minimizing the difference between experimental and simulated signals [
8,
29]. The initial guess values for the model elements were selected from previous studies: stiffness (
) and damping (
were from Case β [
12], while stiffness (
) and damping (
) were from model 2a [
24]. The total parameter estimation of stiffness (
) and damping (
) was performed using a least-square algorithm (LSQ) applied to 13 subjects for natural COP position, 15 subjects for leaning forward COP position, and ten subjects for leaning backward COP position. The number of subjects for each COP position differs due to the availability of experimental data. In this study, only subjects with a full transmissibility dataset were included, and when a transmissibility measurement was not available, the respective subject was excluded from the optimization procedure.
The initial conditions of the model DOF were:
= 49°,
= 69°,
= 82°,
= 0°,
m,
m and
m. The parameter limits were from 0.1 to 10 times the initial parameter values. The optimization procedure was repeated for each subject ten times, starting from random initial conditions. To define the LSQ objective function transmissibility and apparent mass errors computed as Equations (3) and (4):
and
where
and
are respectively the simulated and measured [
16] normalized apparent mass at frequency
.
and
are respectively the simulated and measured [
15,
17] foot transmissibility at location
and frequency
.
The LSQ objective function was defined as Equation (5):
where to apply the same weight to both apparent mass (
) and transmissibility (
) in
, were selected as 26 and 1, respectively. These weighting factors were adjusted according to the experimental data collected. The optimized stiffness and damping values were used to compute the simulated transmissibility and apparent mass curves. The modulus reconstruction error for apparent mass was computed to evaluate the goodness of fit for the simulated curves, as Equation (6):
and reconstruction errors of the transmissibility modulus (
) for each position
i were computed as Equation (7):
At the end of the optimization loop, the subjects with reconstruction errors () of the apparent mass modulus higher than 0.1 or the transmissibility modulus higher than 0.5 were excluded from the following analysis. It was observed that errors higher than 0.1 showed an underestimated simulated apparent mass magnitude around 5 Hz. A similar effect was observed for simulated transmissibility when the error was higher than 0.7. Thus, optimized subjects with higher than 0.1 and higher than 0.7 were excluded from further analysis.
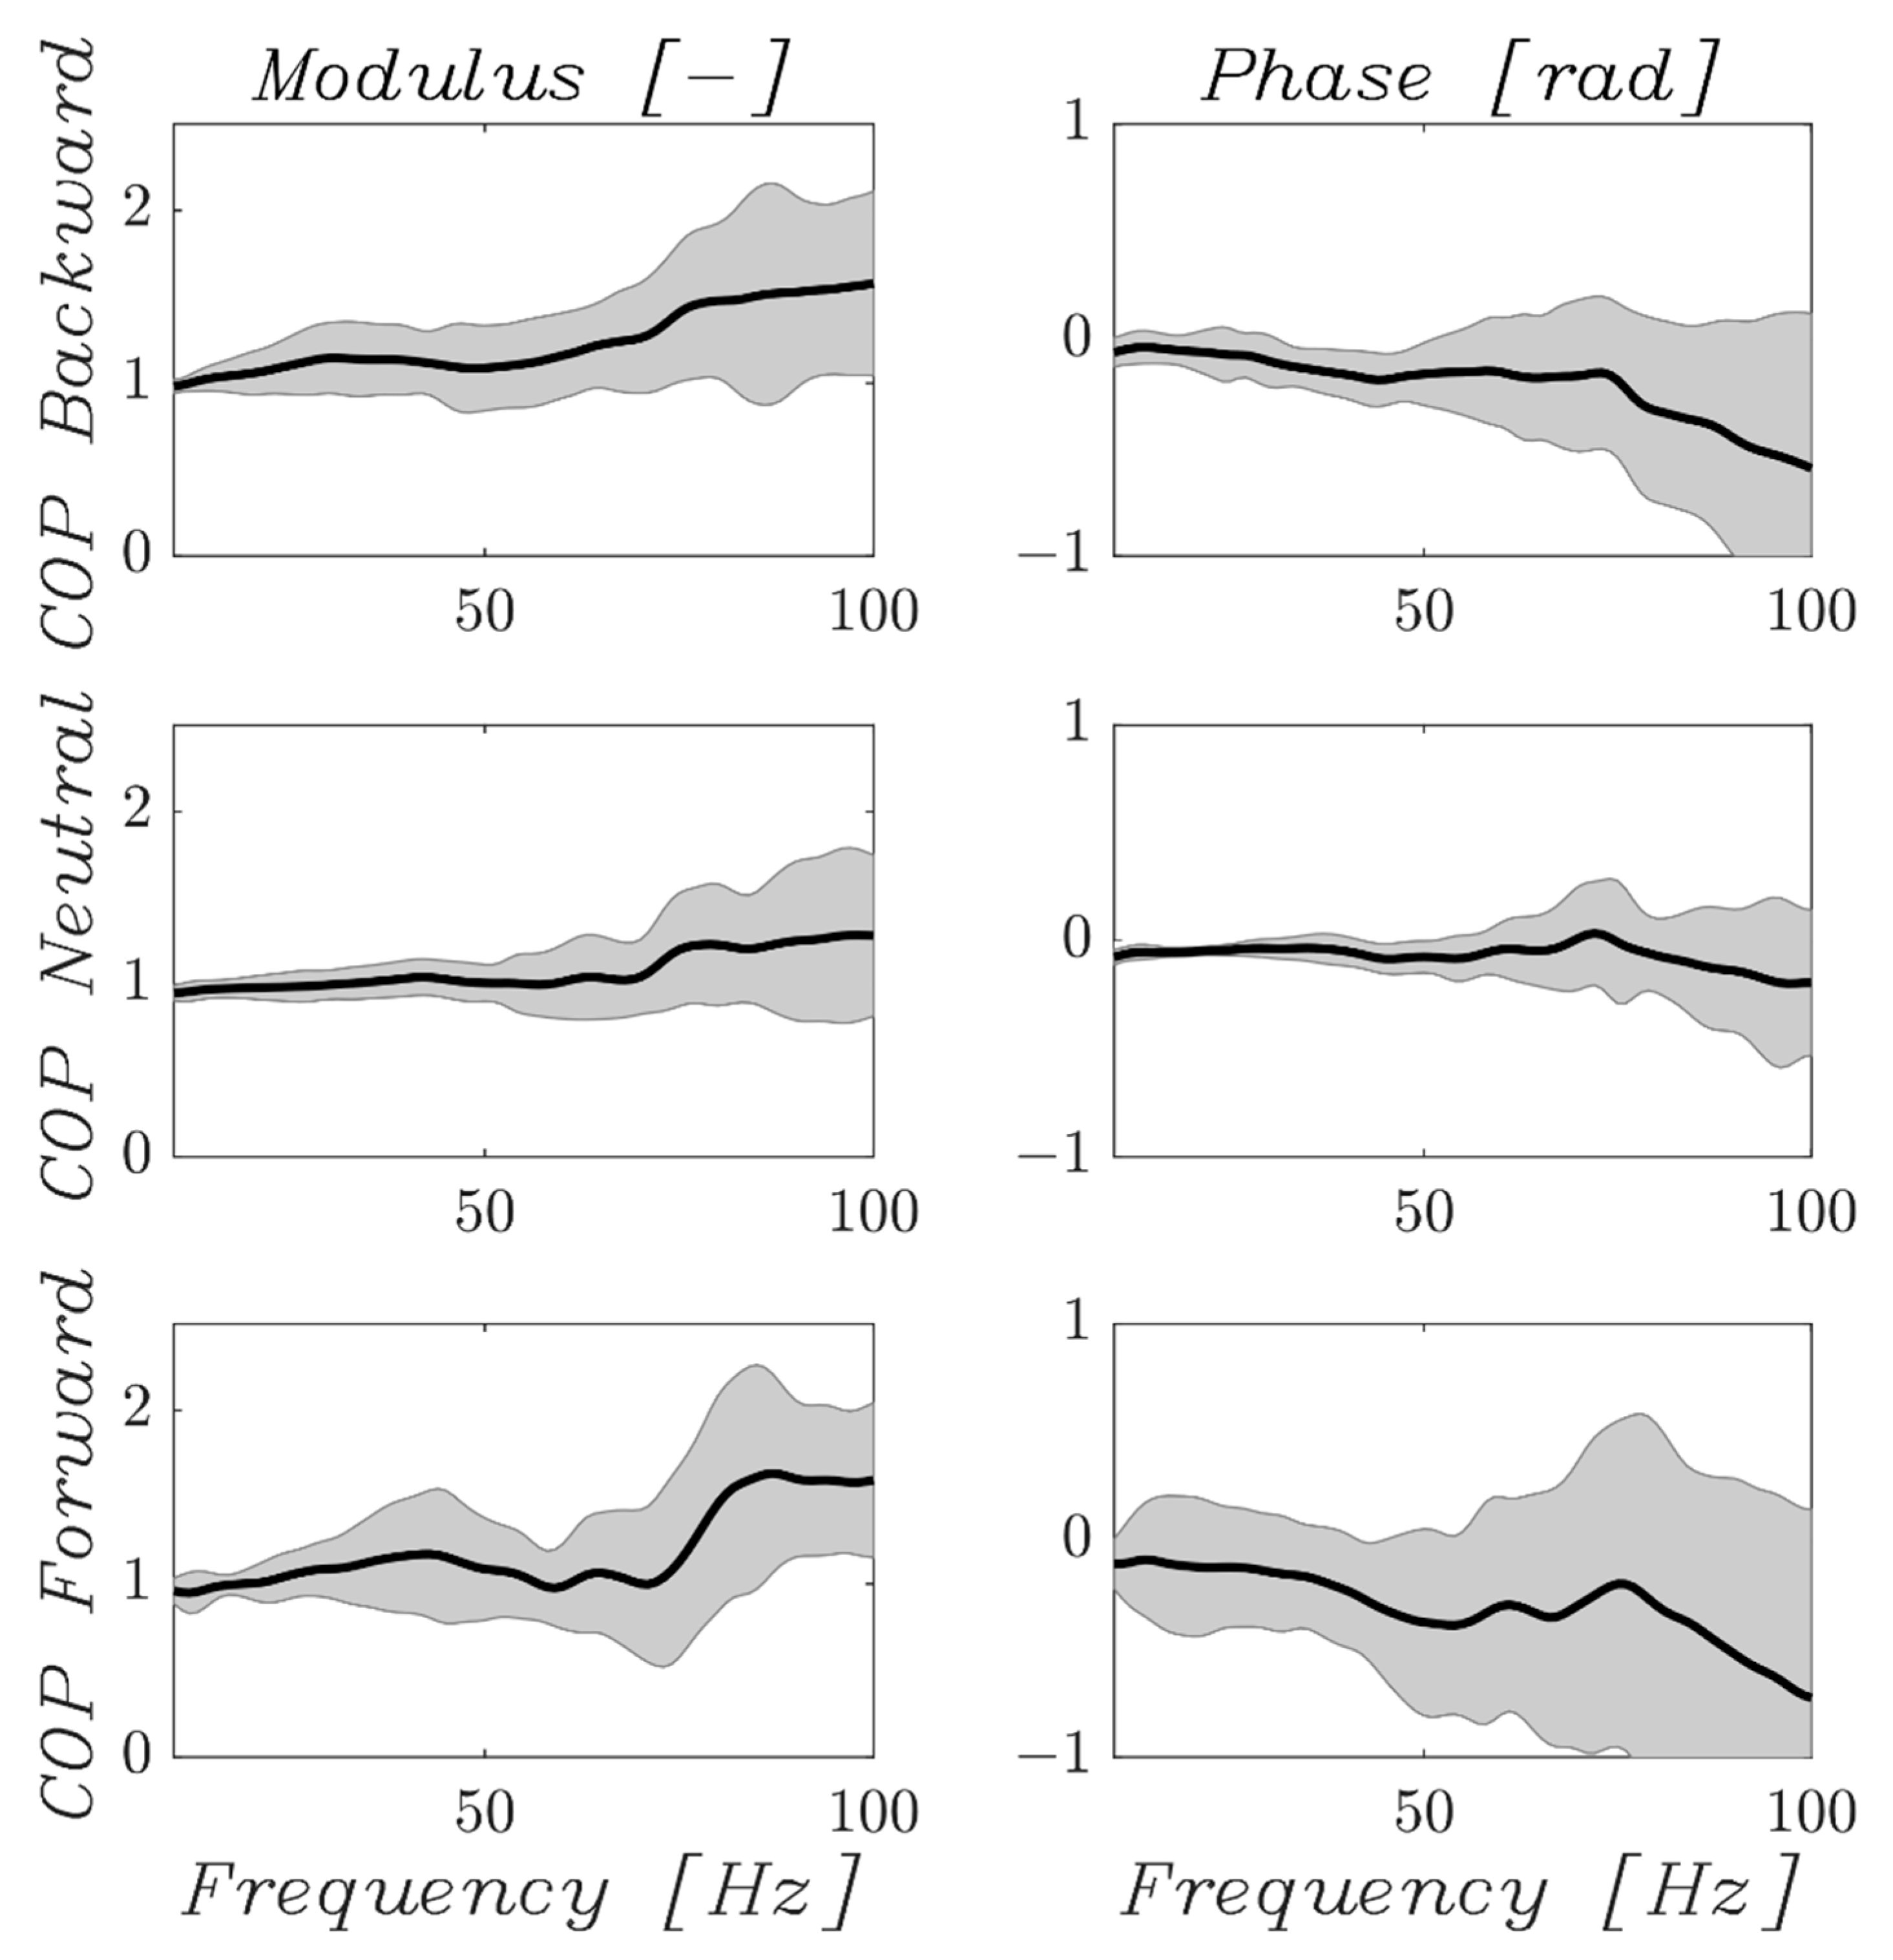
A first optimization of the FAS parameters underlined the variability of
and
, depending on the variability of experimental transmissibility measurements from the toes (
Figure 3). To reduce the variability of the overall parameters, the parameters
and
were fixed to the median value computed in the first optimization as 130 N∙m
−1 and 740 N∙s∙m
−1 for natural, 65 N∙m
−1 and 2800 N∙s∙m
−1 for leaning forward, 40 N∙m
−1 and 43,000 N∙s∙m
−1 for leaning backward. Then, a second optimization found the 14 remaining parameters presented in
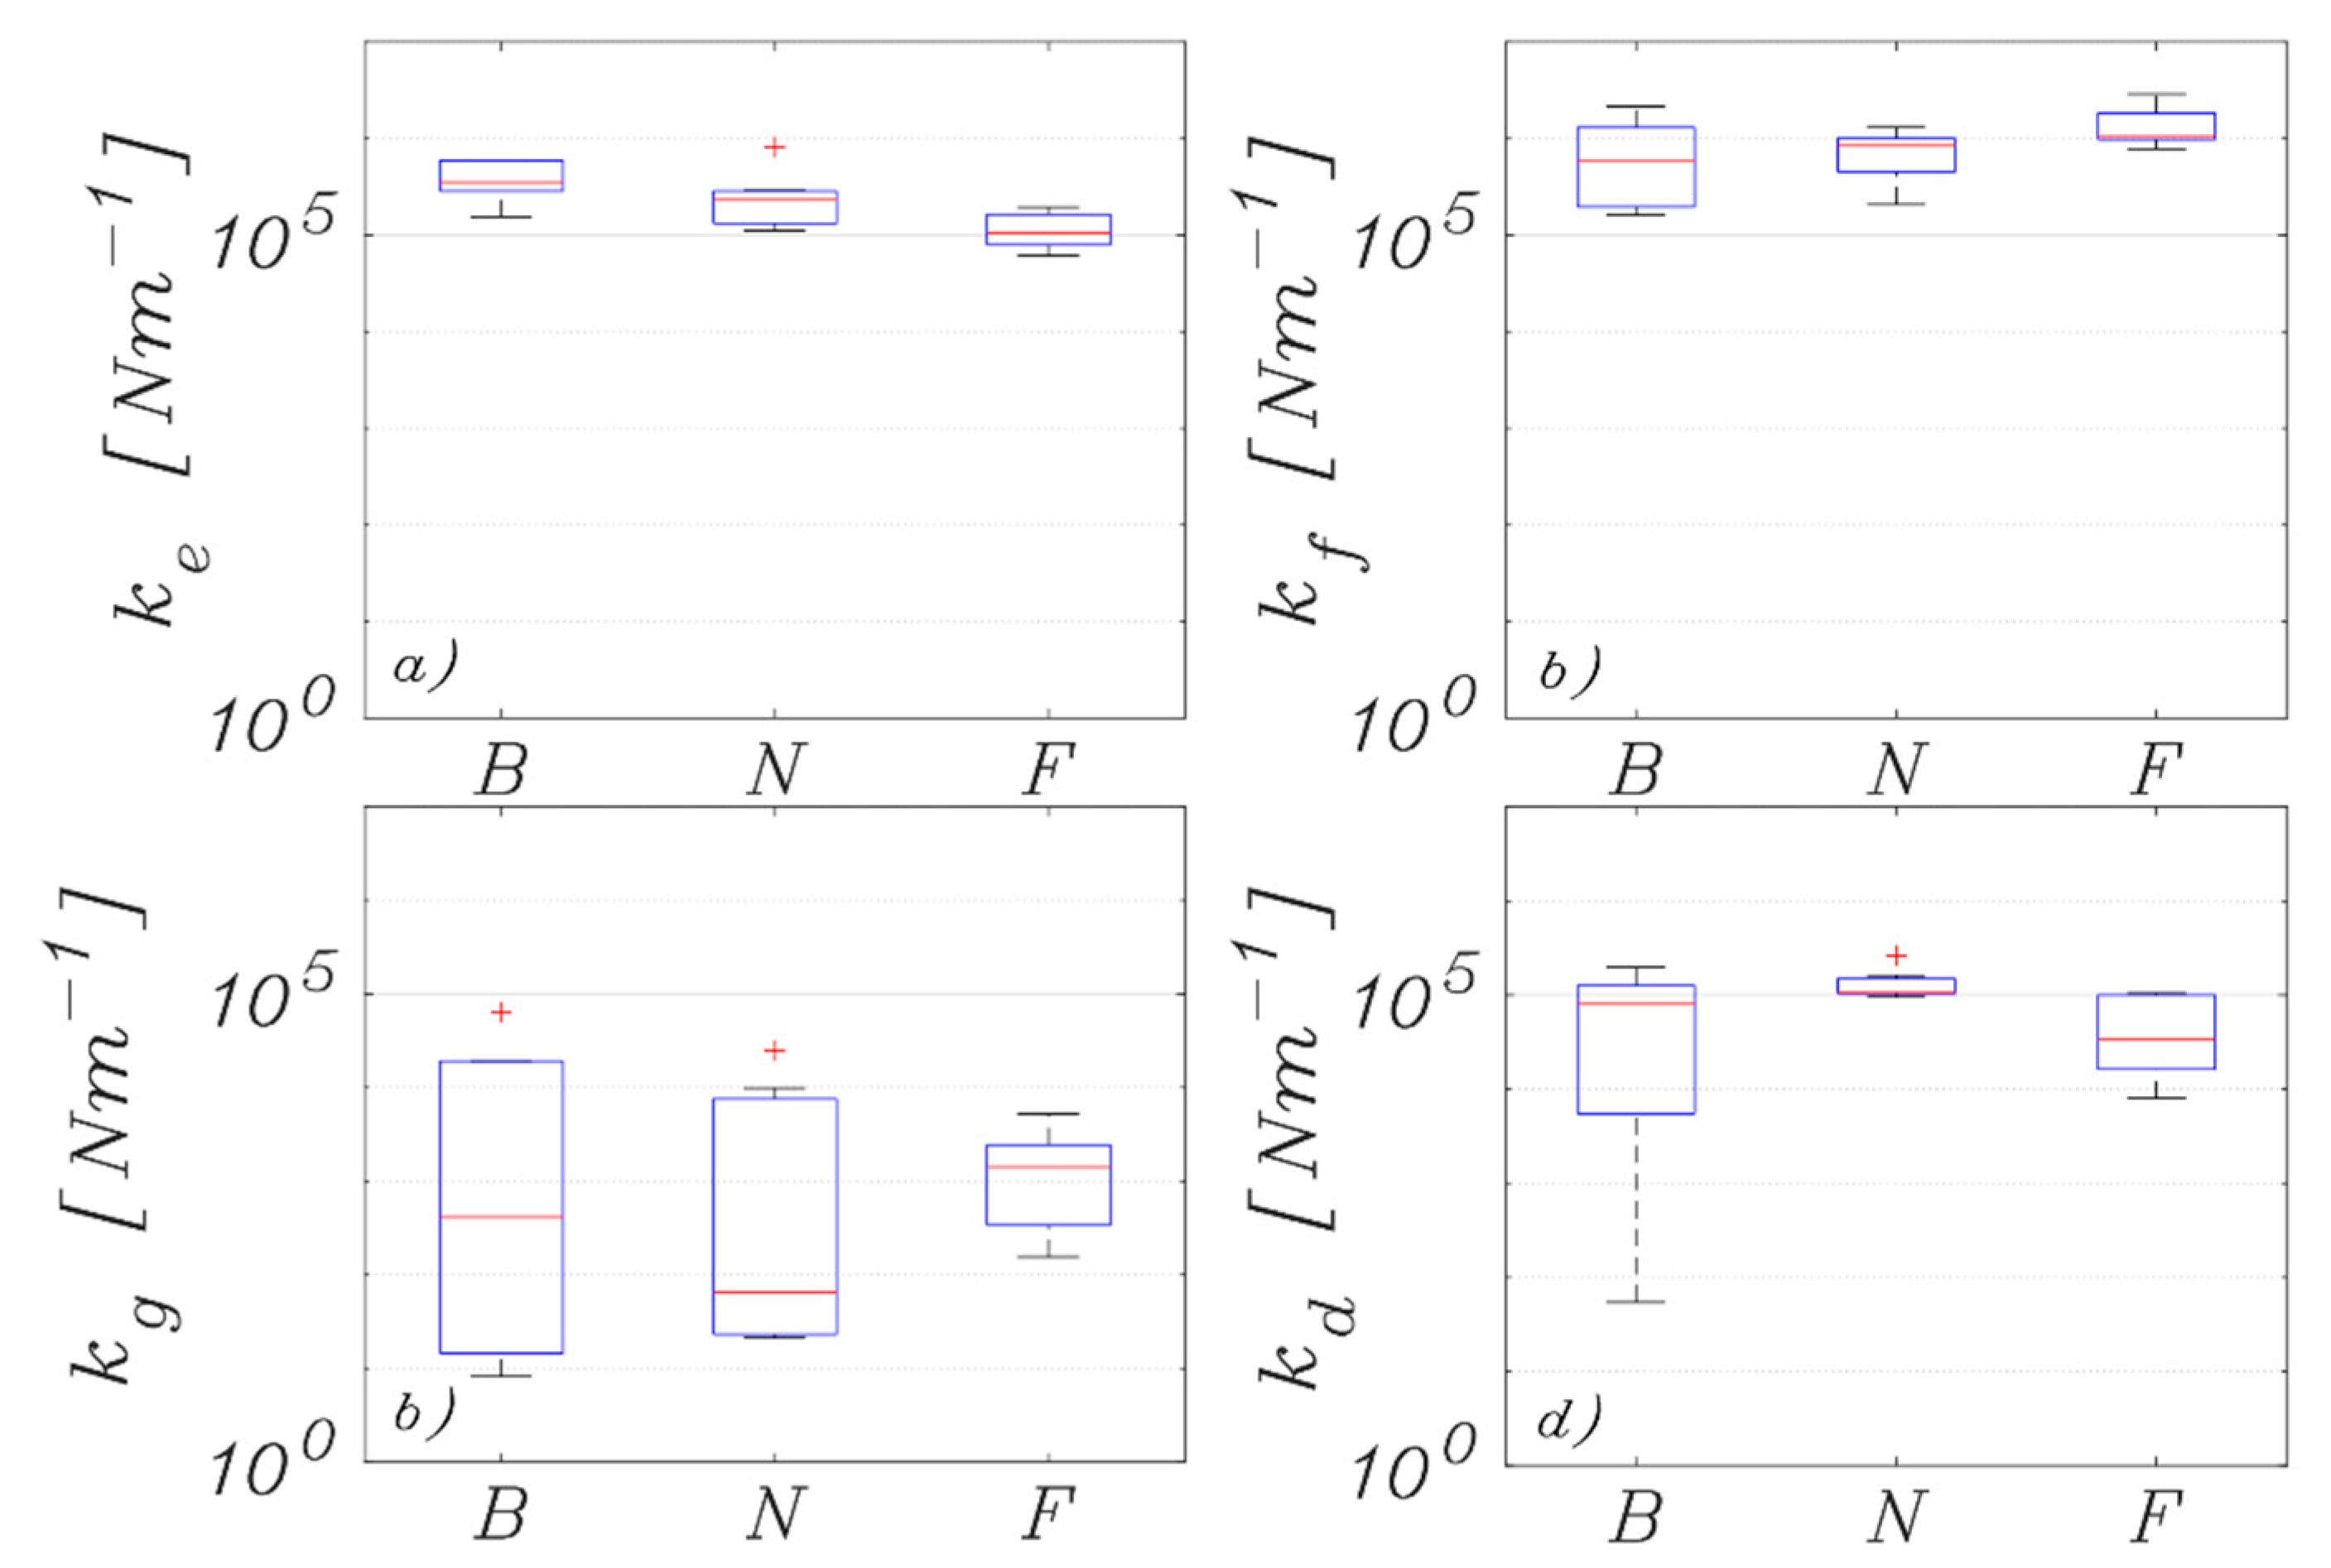
Section 3. Both first and second optimization used the same initial conditions and guess values described above. The only difference between the two optimizations was that the second optimization was limited to 14 parameters. The variability of the optimized parameters between all subjects and COP positions has been visualized using boxplots for stiffness (
,
,
and
) and damping (
,
,
and
).
3. Results
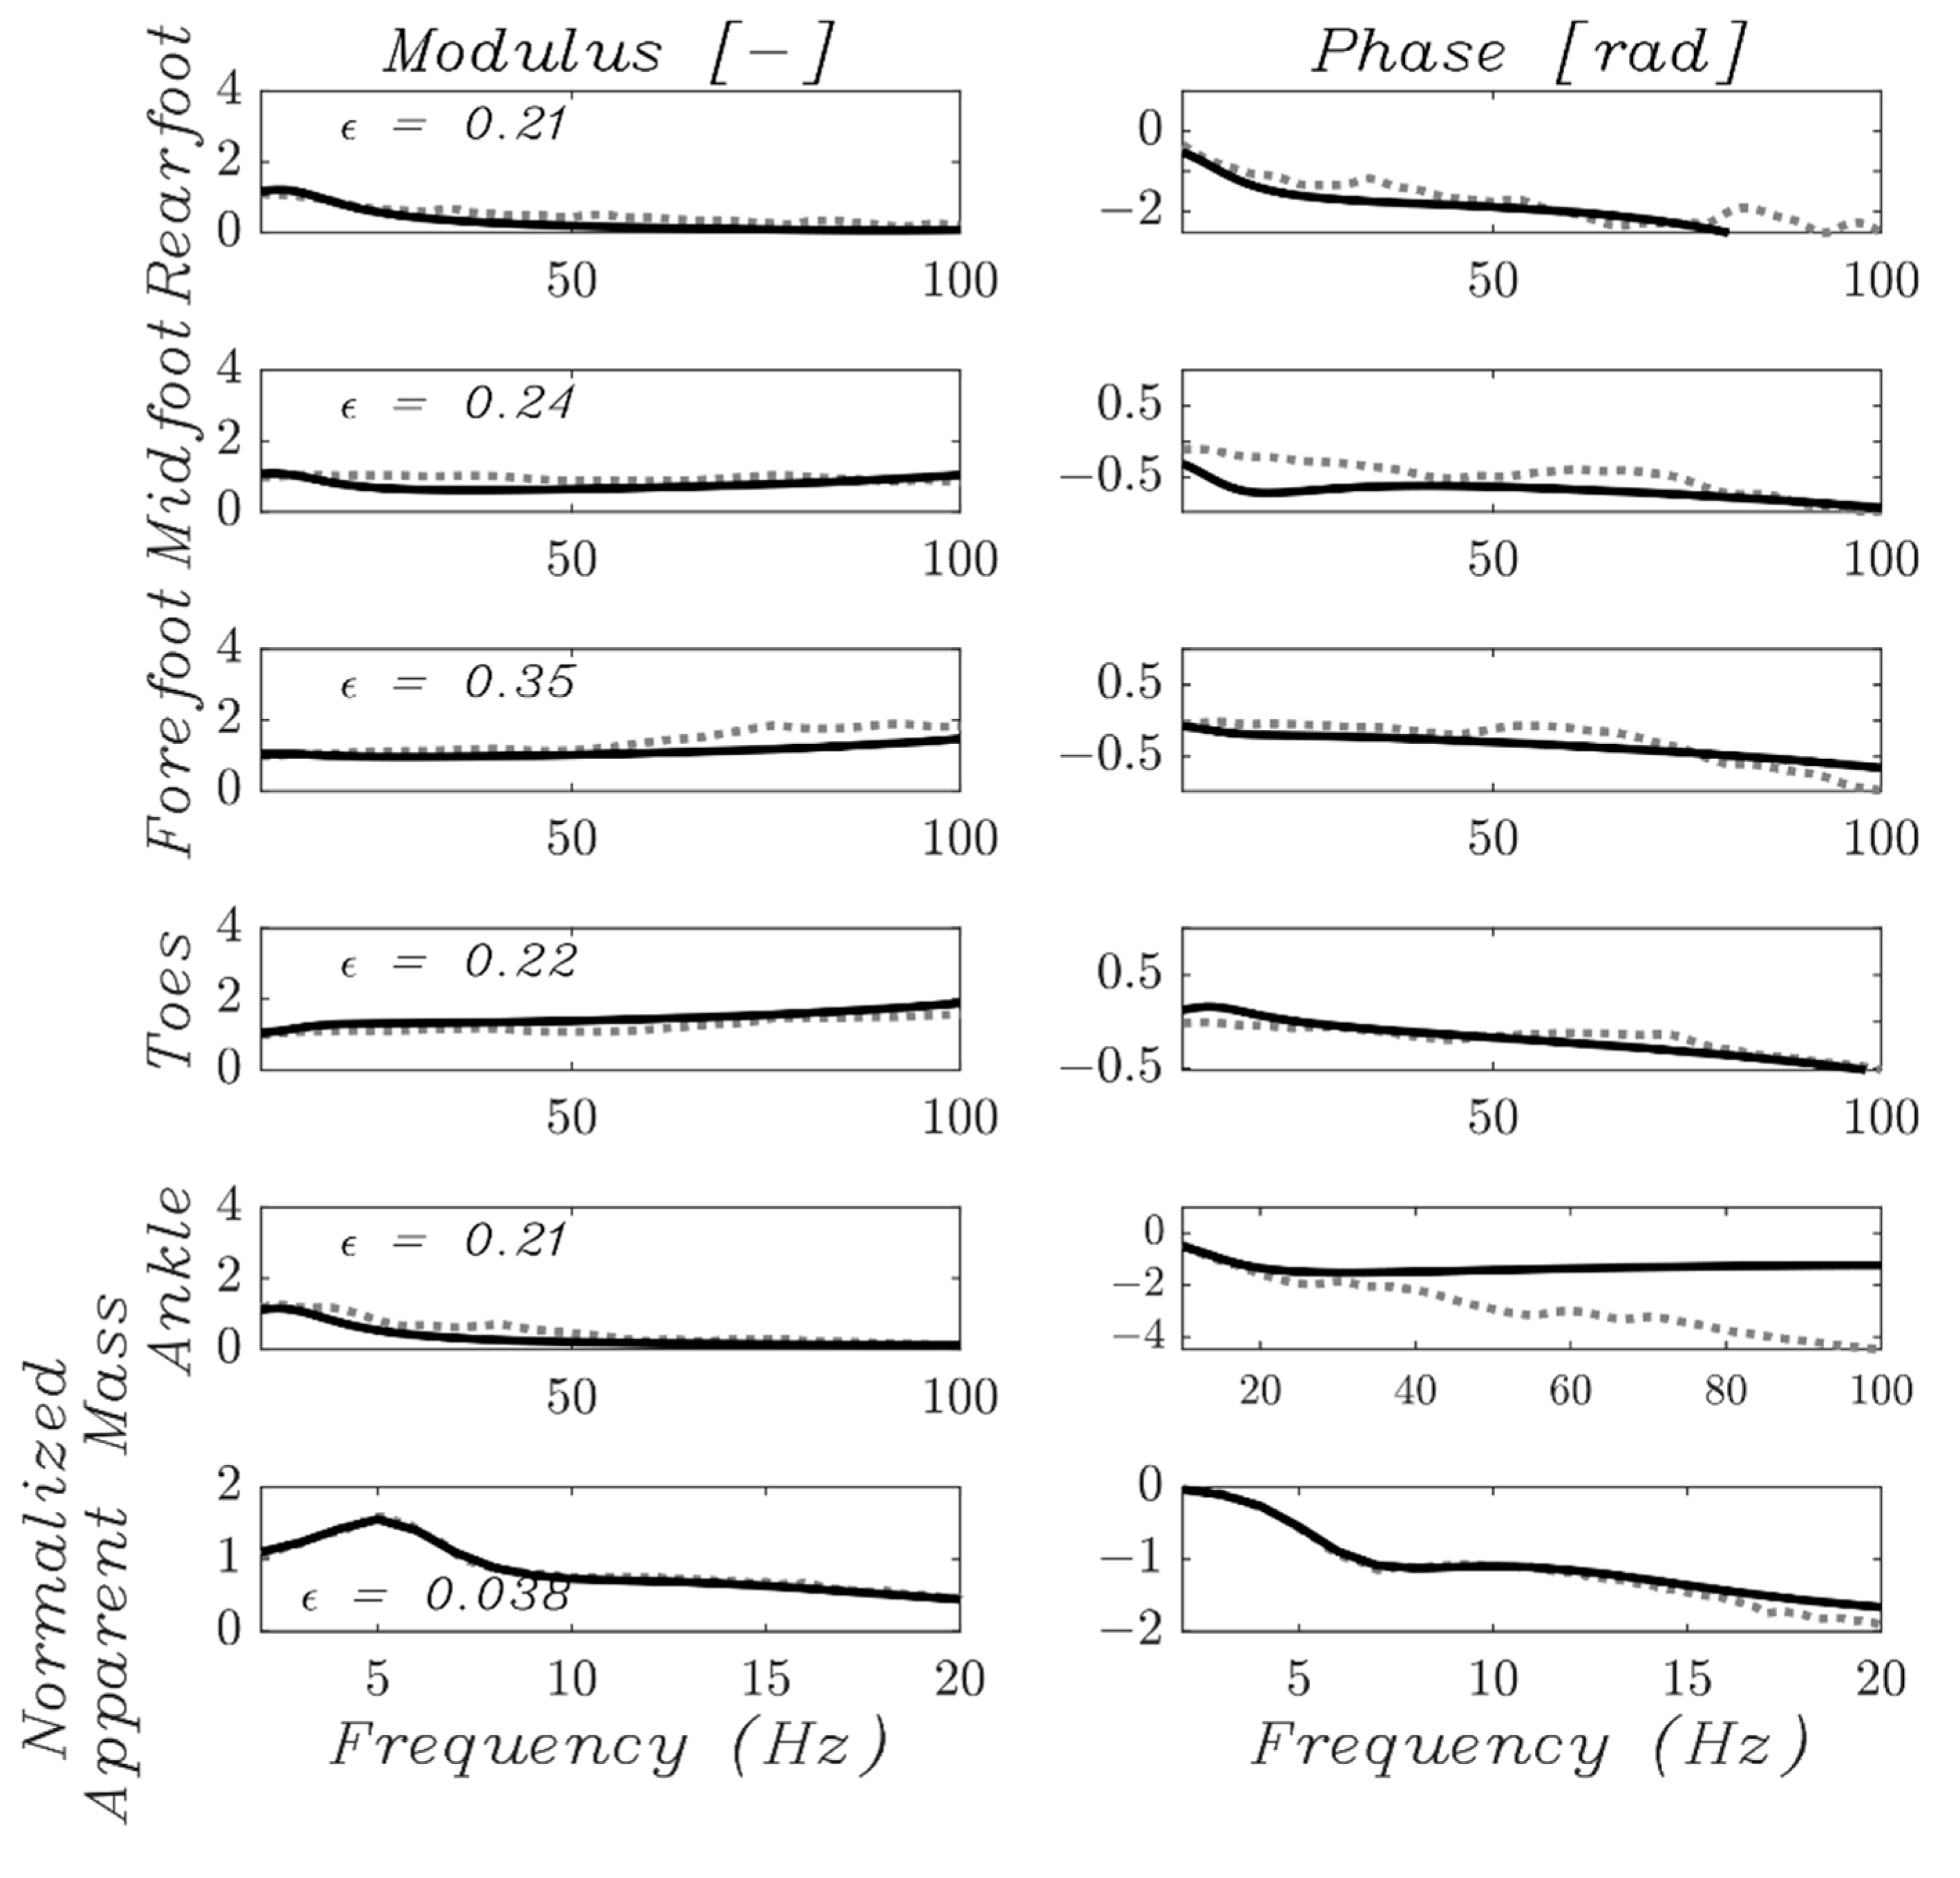
Simulated curves and the respective reconstruction error have been computed for all subjects included in the optimization procedure. Curves for one subject with their COP in the natural standing position are illustrated in
Figure 4. The reconstructed error of the modulus is highest for the forefoot (
= 0.35) and lowest for the normalized apparent mass (
= 0.038) in this example.
Throughout the following description of the results, the superscripts ‘F’, ‘N’ and ‘B’ of the coefficient simulated values refer to leaning forward, natural and leaning backward values, respectively (i.e.,
refers to the stiffness of the heel fat pad in the leaning forward posture). The variability of each parameter is calculated among all included subjects. Rearfoot stiffness (
) variability is comparable for the three postures, and a decreasing trend is found passing from the backward leaning to the forward leaning posture (
Figure 5: median values equal to
= 3.5 × 10
5 N∙m
−1,
= 2.3 × 10
5 N∙m
−1 and
= 1.9 × 10
5 N∙m
−1). An outlier is noticed in a natural posture with
close to 1.0 × 10
6 N∙m
−1. An opposite trend is shown by forefoot stiffness (
) (
Figure 5: median values equal to
= 5.8 × 10
5 N∙m
−1,
= 8.5 × 10
5 N∙m
−1 and
= 1.0 × 10
6 N∙m
−1). In this case, the parameter variability is comparable for natural and forward leaning postures, while backward leaning variability is larger. Toes stiffness (
) has a variability of several orders of magnitude in all postures with no trend (
Figure 5: median values equal to
= 8.1 × 10
4 N∙m
−1,
= 1.1 × 10
5 N∙m
−1 and
= 3.4 × 10
4 N∙m
−1). The plantar aponeurosis stiffness (
) shows similar median values in all postures without any trend.
Rearfoot damping (
) shows reduced variability for the COP in the forward and natural positions, while the backward COP position variability is between 0.02 N∙s∙m
−1 and 290 N∙s∙m
−1 (
Figure 6). Similar behavior is observed for the sole of the midfoot damping (
), but a trend is not clear for either parameter. The toe damping (
) variability was found to vary with several orders of magnitude with median values
= 2.5 × 10
3 N∙s∙m
−1,
= 2.7 × 10
3 N∙s∙m
−1 and
= 3.5 × 10
3 N∙s∙m
−1 (
Figure 6). Plantar aponeurosis damping (
) values and variability are comparable for all the postures, with median values of
= 1.6 × 10
3 N∙s∙m
−1,
= 1.7 × 10
3 N∙s∙m
−1 and
= 1.9 × 10
3 N∙s∙m
−1 (
Figure 6).
The rotational stiffness (
) and damping (
) do not show a median value trend for the three COP positions (
Table 2). Stiffness variability was of several orders of magnitude for all the postures while damping variability was reduced for natural and forward leaning postures. Stiffness between
and the ankle (
) resulted in high median values, which is close to the equivalent stiffness of bone, for all the three COP positions, with less than one order of magnitude variability. Damping between
and the ankle (
) values increased from the backward leaning to forward leaning COP positions. Stiffness between
and
(
) and damping (
) has shown small variability with all quartile values close to median values (
Table 2).
4. Discussion
A two-dimensional lumped-parameter model of a standing person and the FAS, which included four-foot segments [
12], was optimized using reference functions from previously collected apparent mass [
16] and transmissibility [
15,
17] to explore the effects of altering the COP location. The model parameters were optimized to fit apparent mass and five-foot transmissibility measurements of standing upright subjects with the COP in a forward (
n = 15), natural (
n = 13) and backward (
n = 10) position. Optimizing a model of the FAS using altering COP locations will prove useful for further evaluating effective control strategies to isolate the foot from vibration exposure and hopefully avoid vibration-induced injury.
In general, modelling results showed that when the COP is moved forward towards the toes the stiffness values forefoot increased, conversely the stiffness of the rearfoot decreased. The opposite resulted when the COP was concentrated towards the rearfoot: the stiffness at the forefoot decreased, while the stiffness of rearfoot increased. This effect is reasonable, as the mass distribution on the foot regions changes accordingly to COP position [
13]. For instance, in the forward COP position, the mass distribution is closer to the toes, causing a compression state in the musculature and ligaments of the superior portion of the forefoot (
and
). The compression state of the soft tissue can result from: (1) the muscular organization to maintain the standing posture where muscular activation results in muscle shortening and co-contraction of agonist and antagonist muscles; and/or (2) the change in the mass distribution with a more global view of the system conveying that the rest of the body will apply a compression force on the forefoot or the rearfoot. Additionally, the increase of stiffness values associated with higher contact force is in accordance the results given by a biodynamic model of the hand in case of grip only and grip with push conditions [
30].
More specifically, there were three Kelvin–Voigt models associated with the soft tissue on the sole of the foot: at the rearfoot sole (i.e., heel or plantar) (
and
), the metataral/phalange joint (i.e., distal head of the metatarsals) (
and
) and the distal phalanges (i.e., tip of the toes) (
and
). As previously suggested and anticipated, the stiffness of the heel fat pad increased when the COP was backward and decreased as the COP moved forward towards the toes [
13]. Stiffness of the rearfoot fat pad (
= 3.5 × 10
5 N∙m
−1, and
= 1.9 × 10
5 N∙m
−1) are in accordance with natural value
= 2.3 × 10
5 N∙m
−1, comparable with the value reported by [
30]. The damping characteristics of the heel fat pad were more variable in the backward COP position than in the natural and forward COP positions. The heel fat pad is a specific tissue comprised of adipose chambers enclosed by fibrous septa to absorb impacts, as such the damping characteristics can change when pressure is applied to heel [
31].
Stiffness of the soft tissue of the forefoot, at the distal head of the metatarsals (
) remained relatively the same regardless of the COP position, while the damping (
) varied between COP positions, with the greatest variability in the backward COP position. The stiffness at the tip of the toes (
) was lower than that at the distal head of the metatarsals regardless of the COP position. As the distal heads of the metatarsals are the weight bearing portion of the toes, this modelling result is in line with the anatomical differences at these two locations on the toes. The optimization of the contact stiffness of the toes (
) led to a higher parameter variability than at the distal head of the metatarsals (
) which could be due to the experimental variability of toes transmissibility [
17]. In the optimization procedure, a reflection of this high variability effect on the equivalent rotational stiffness (
), that is linked to the toes DOF through
.
Forefoot sole stiffness has a higher value in leaning forward COP position with respect to rearfoot value (
= 1.0 × 10
6 N∙m
−1,
= 1.9 × 10
5 N∙m
−1). Damping values related to the soft tissues (
are lower than the respective stiffness values, as evidenced by [
32,
33]. Whereas the contact damping of toes (
) is higher that the respective stiffness (
) because the toes are not gripping the vibrating surface and have little mass distribution to the tips of the toes. Rearfoot stiffness (
) value in all COP positions was lower that the midfoot stiffness value (
), which is in accordance with the previously developed model [
12].
Stiffness and damping between
and the ankle (
and
) and between
and
(
and
) values were comparable with the one proposed by [
19] (
Table 3). The main differences are linked to dynamical response of the upper body and had an effect in the reconstruction of the apparent mass curve. The maximum accepted reconstruction error equal to 0.1 underestimated the magnitude resonance value even of 15%.
Given the variability of the optimized parameters, the significant values of the Kelvin–Voigt models reported are an indication of real equivalent damping and stiffness of human ligaments and tissues. All model simulations are limited by their reference functions. In this case, the experimental transmissibility and apparent mass functions were from separate experiments with different exposure frequencies [
15,
16,
17], which is mostly due to the limitations of force transducers for measuring apparent mass simultaneously during higher frequency vibration exposure. The transmissibility functions also had high inter-subject variability, which could have been due to the active contribution of muscles needed to stabilize the posture, or the difference in participant anthropometry [
15,
17]. With the advances made in reducing the number of anatomical locations require for capturing FTV exposure [
23], future laboratory experiments could involve more conditions and a variety of populations.
This model sets the foundation of reported model parameters for a lumped-parameter model of the FAS to FTV exposure with varying COP locations. As this model also has the greatest variability in parameter values when the COP is backwards [
13], the soft tissue at the heel (i.e., plantar fat pad) needs to be modelled differently in the future. There is also the potential that these tissues can be modelled more effectively with finite-element modelling like hand-transmitted vibration models [
22]. Once this tissue has been effectively modelled boot, insole and mat material characteristics can be simulated and tested prior to creation and distribution. This proactive approach to designing engineering controls has been determined to be successful in mitigating occupational vibration exposure.


 ,
, 


