
Effect of the Shoe Sole on the Vibration Transmitted from the Supporting Surface to the Feet


Abstract
1. Introduction
1.1. Occupational Exposure to Foot Transmitted Vibration
1.2. Health Effects
1.3. Foot Response to Vibration
1.4. Vibration Control Strategies
2. Materials and Methods
2.1. Occupational Exposure to Foot Transmitted Vibration
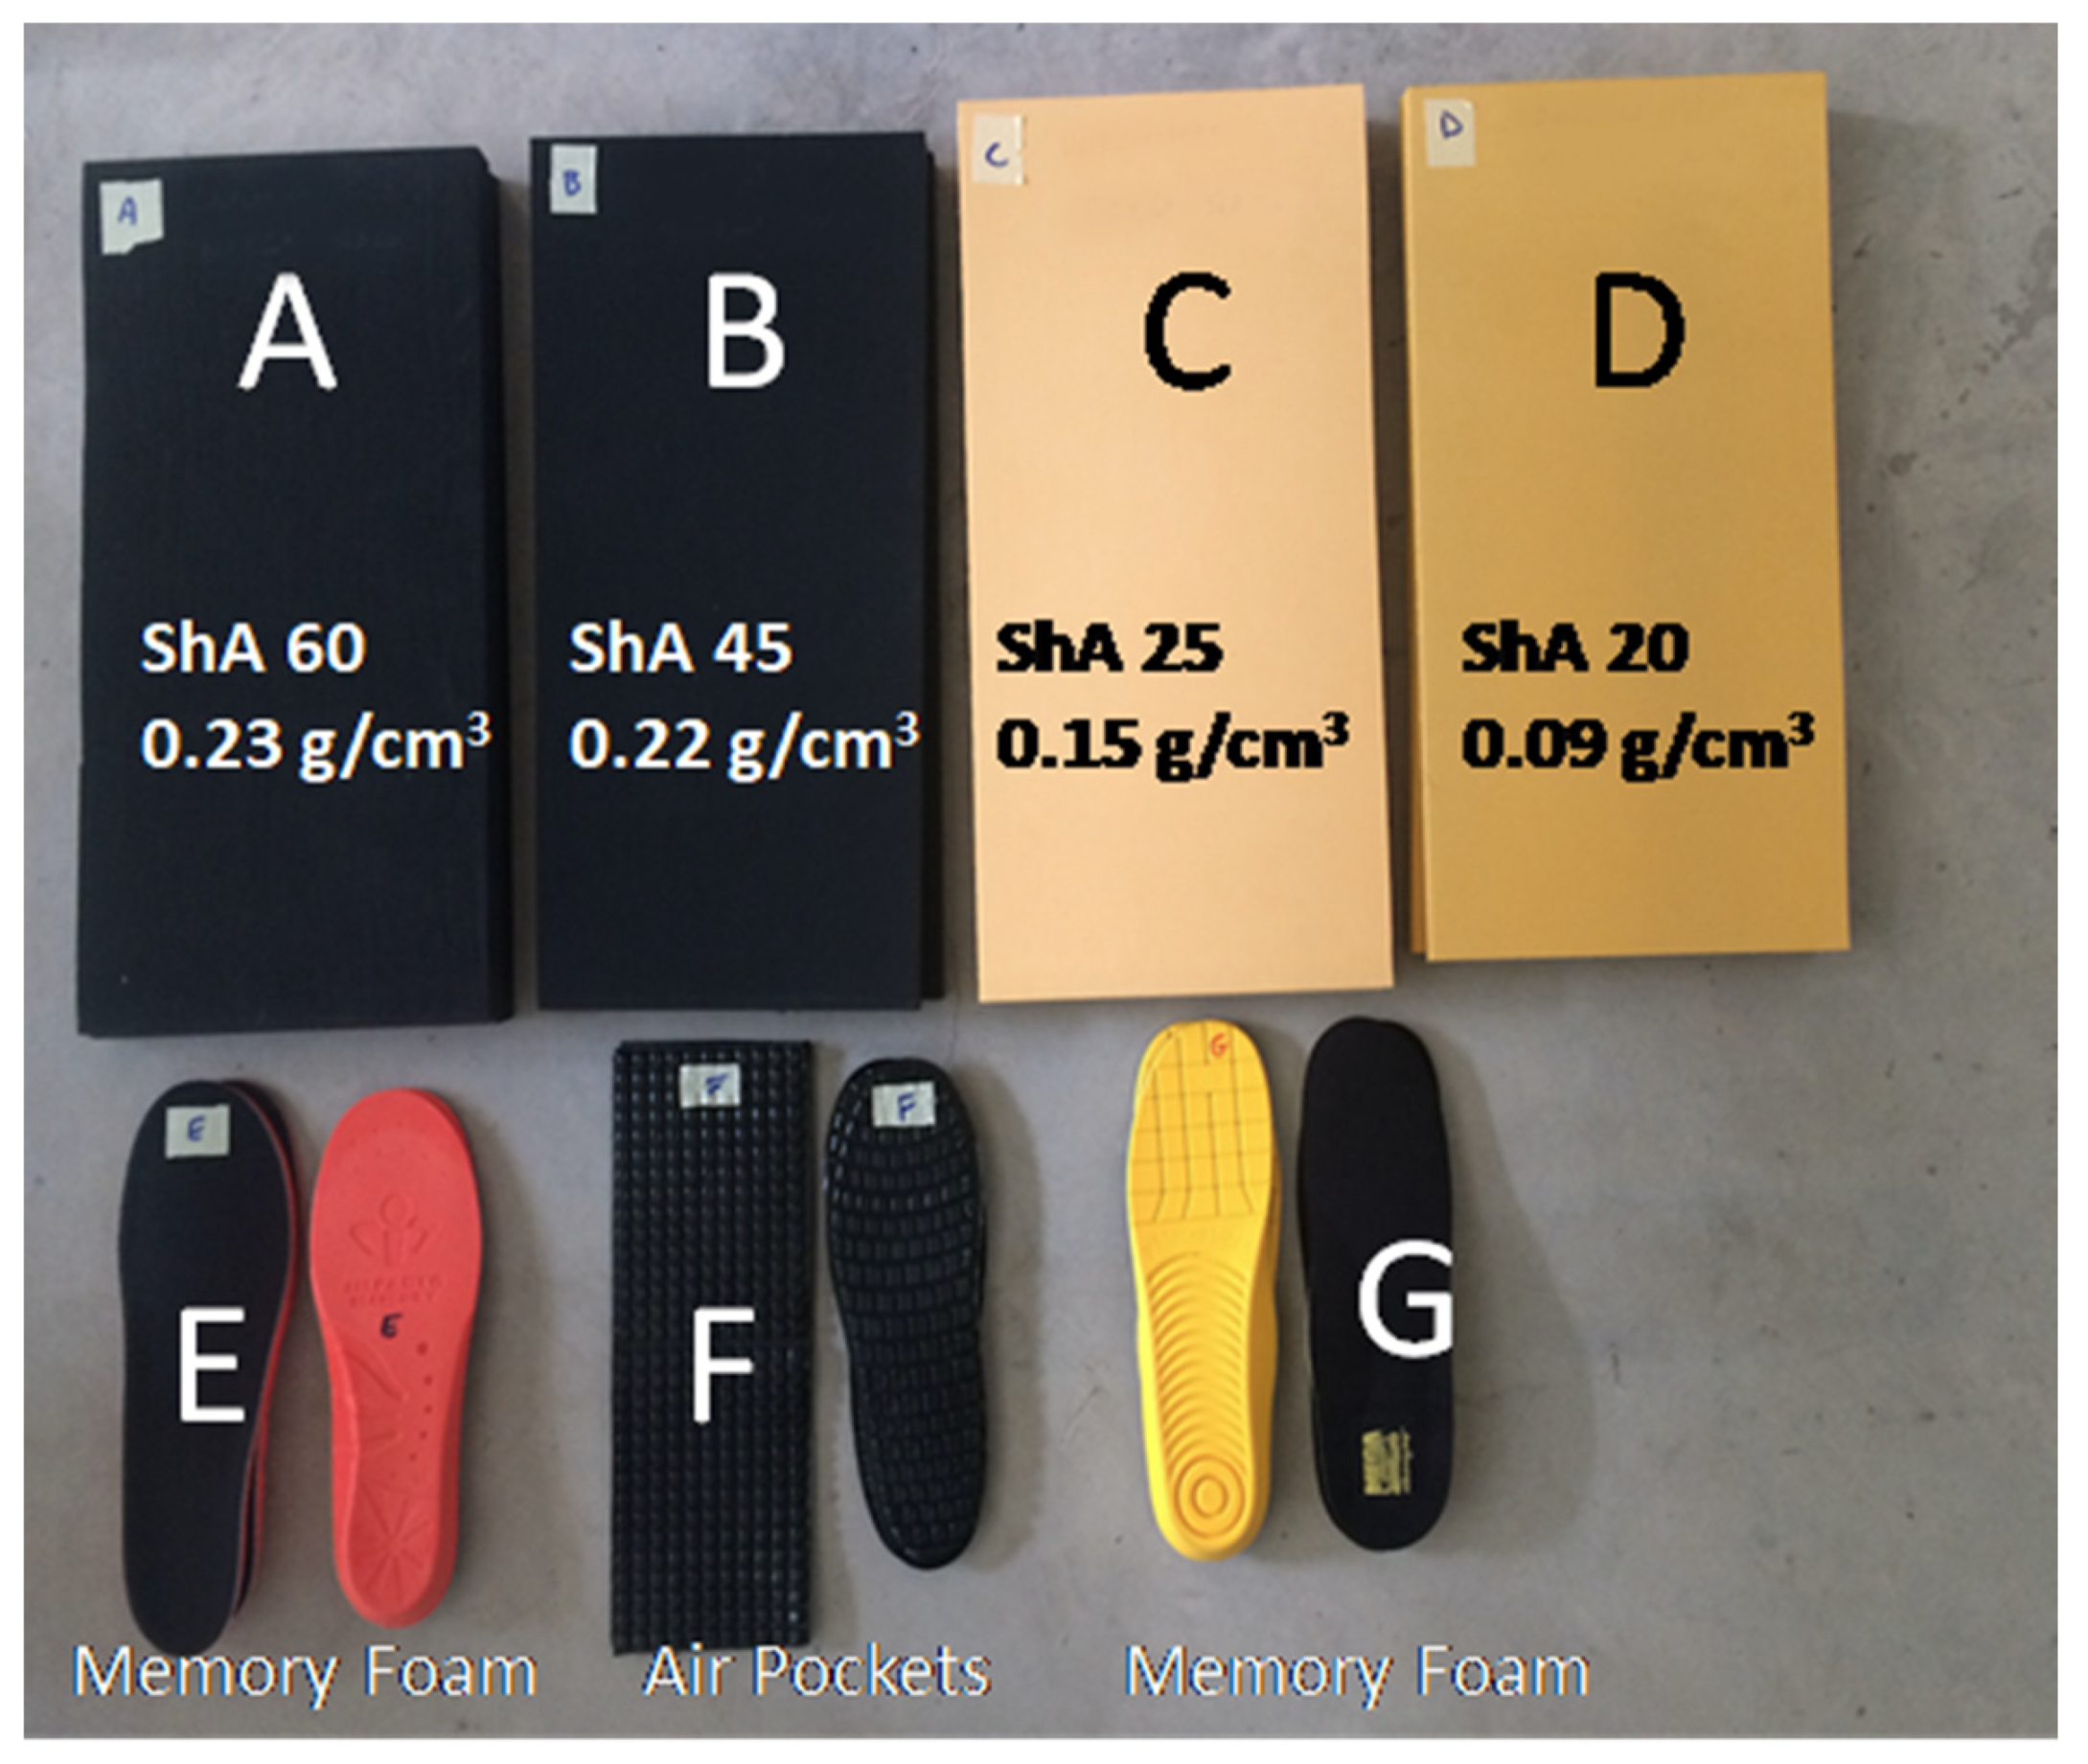
2.2. Materials
2.3. Partecipants
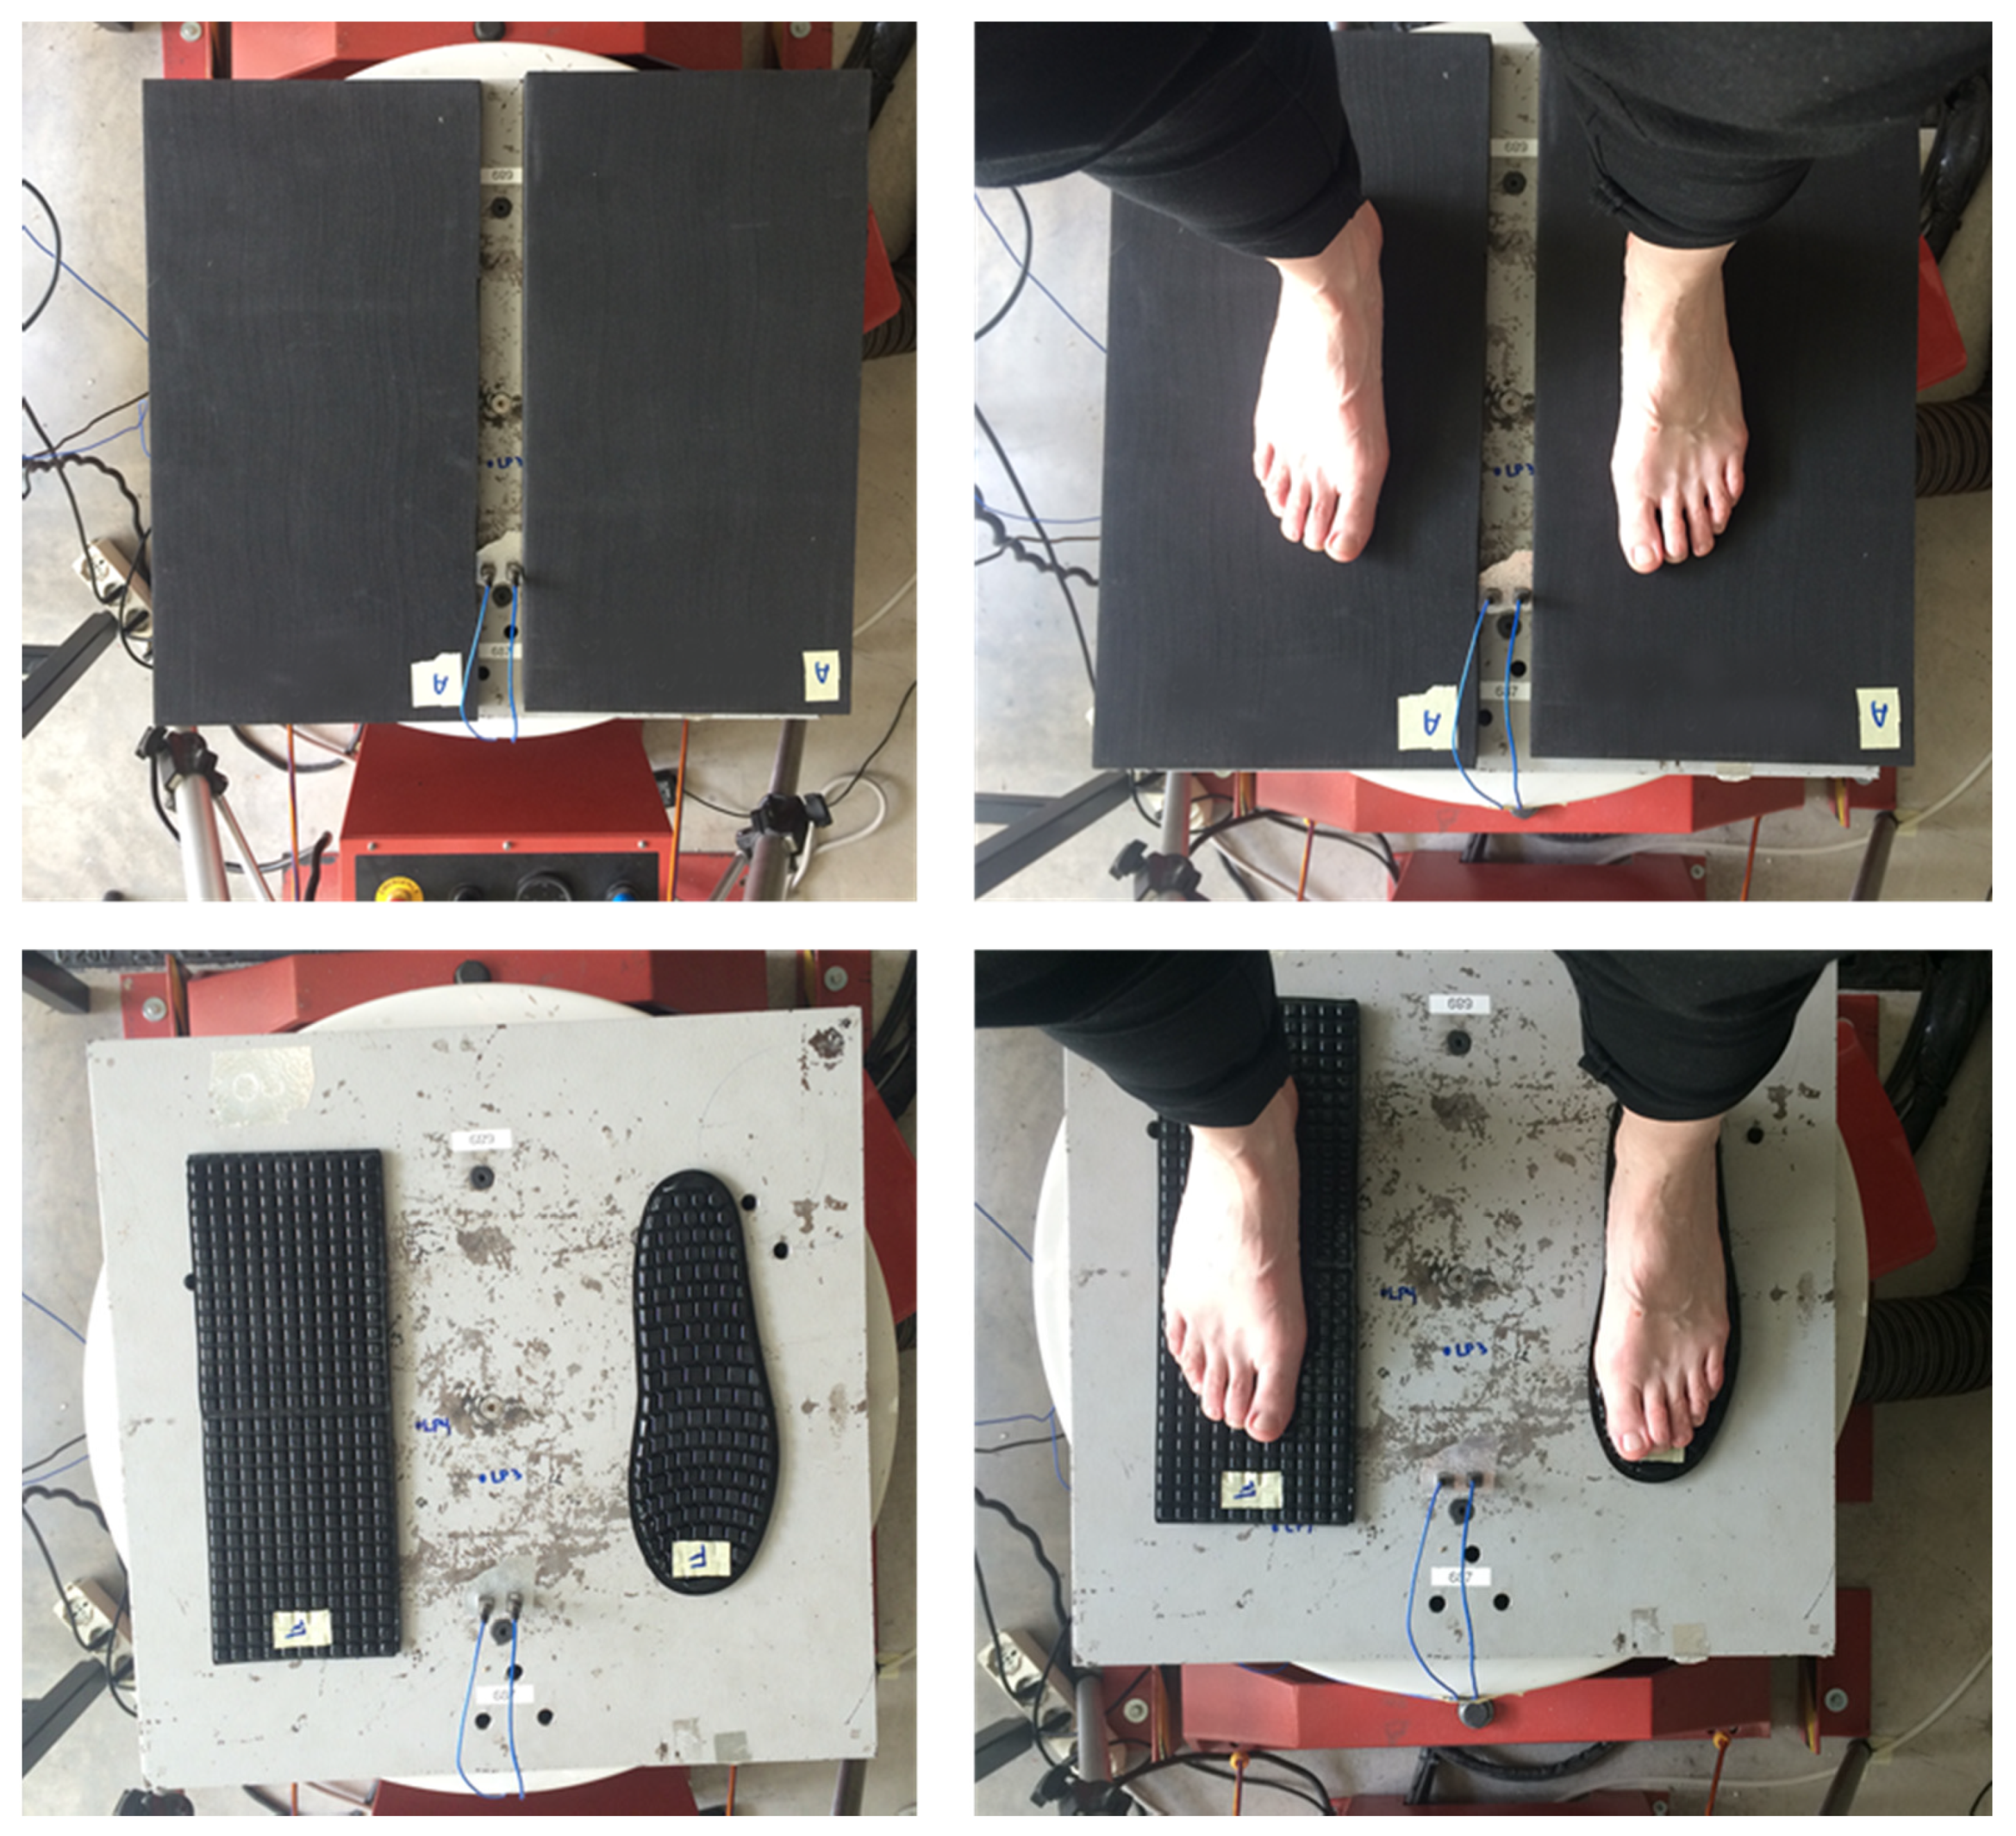
2.4. Test Protocol
2.5. Comfort Questionnaire
2.6. Data Analysis
3. Results
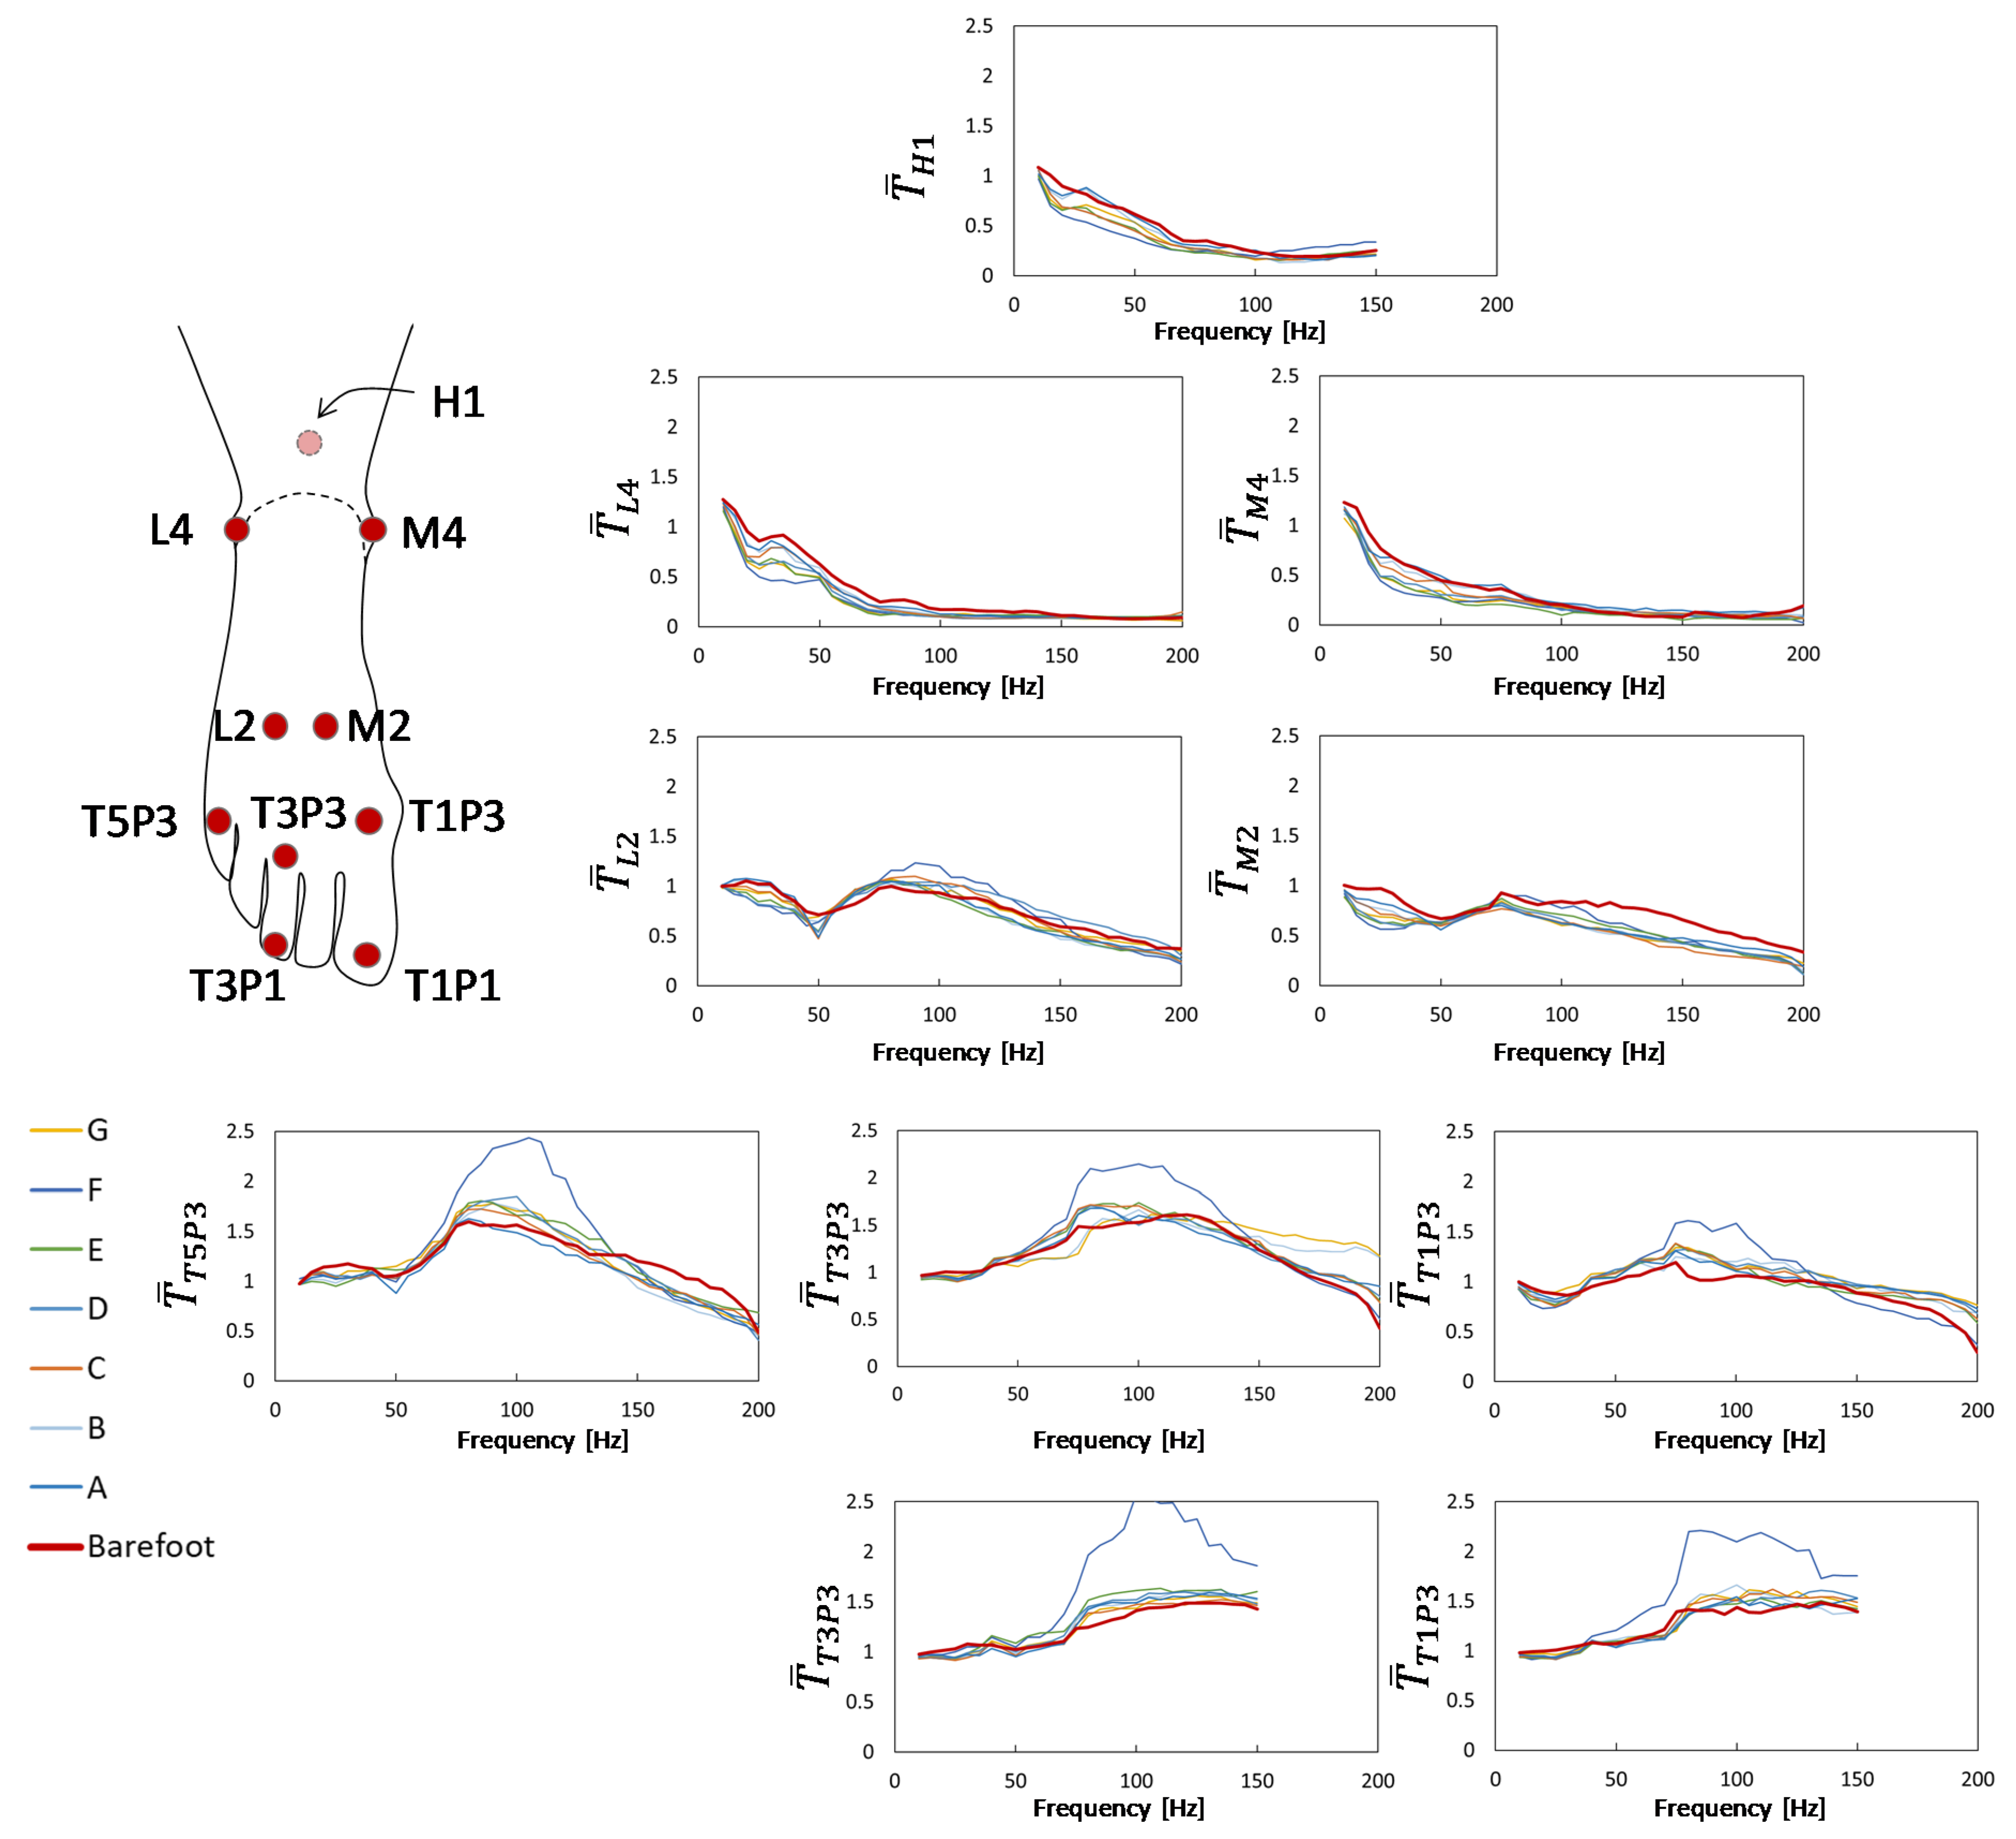
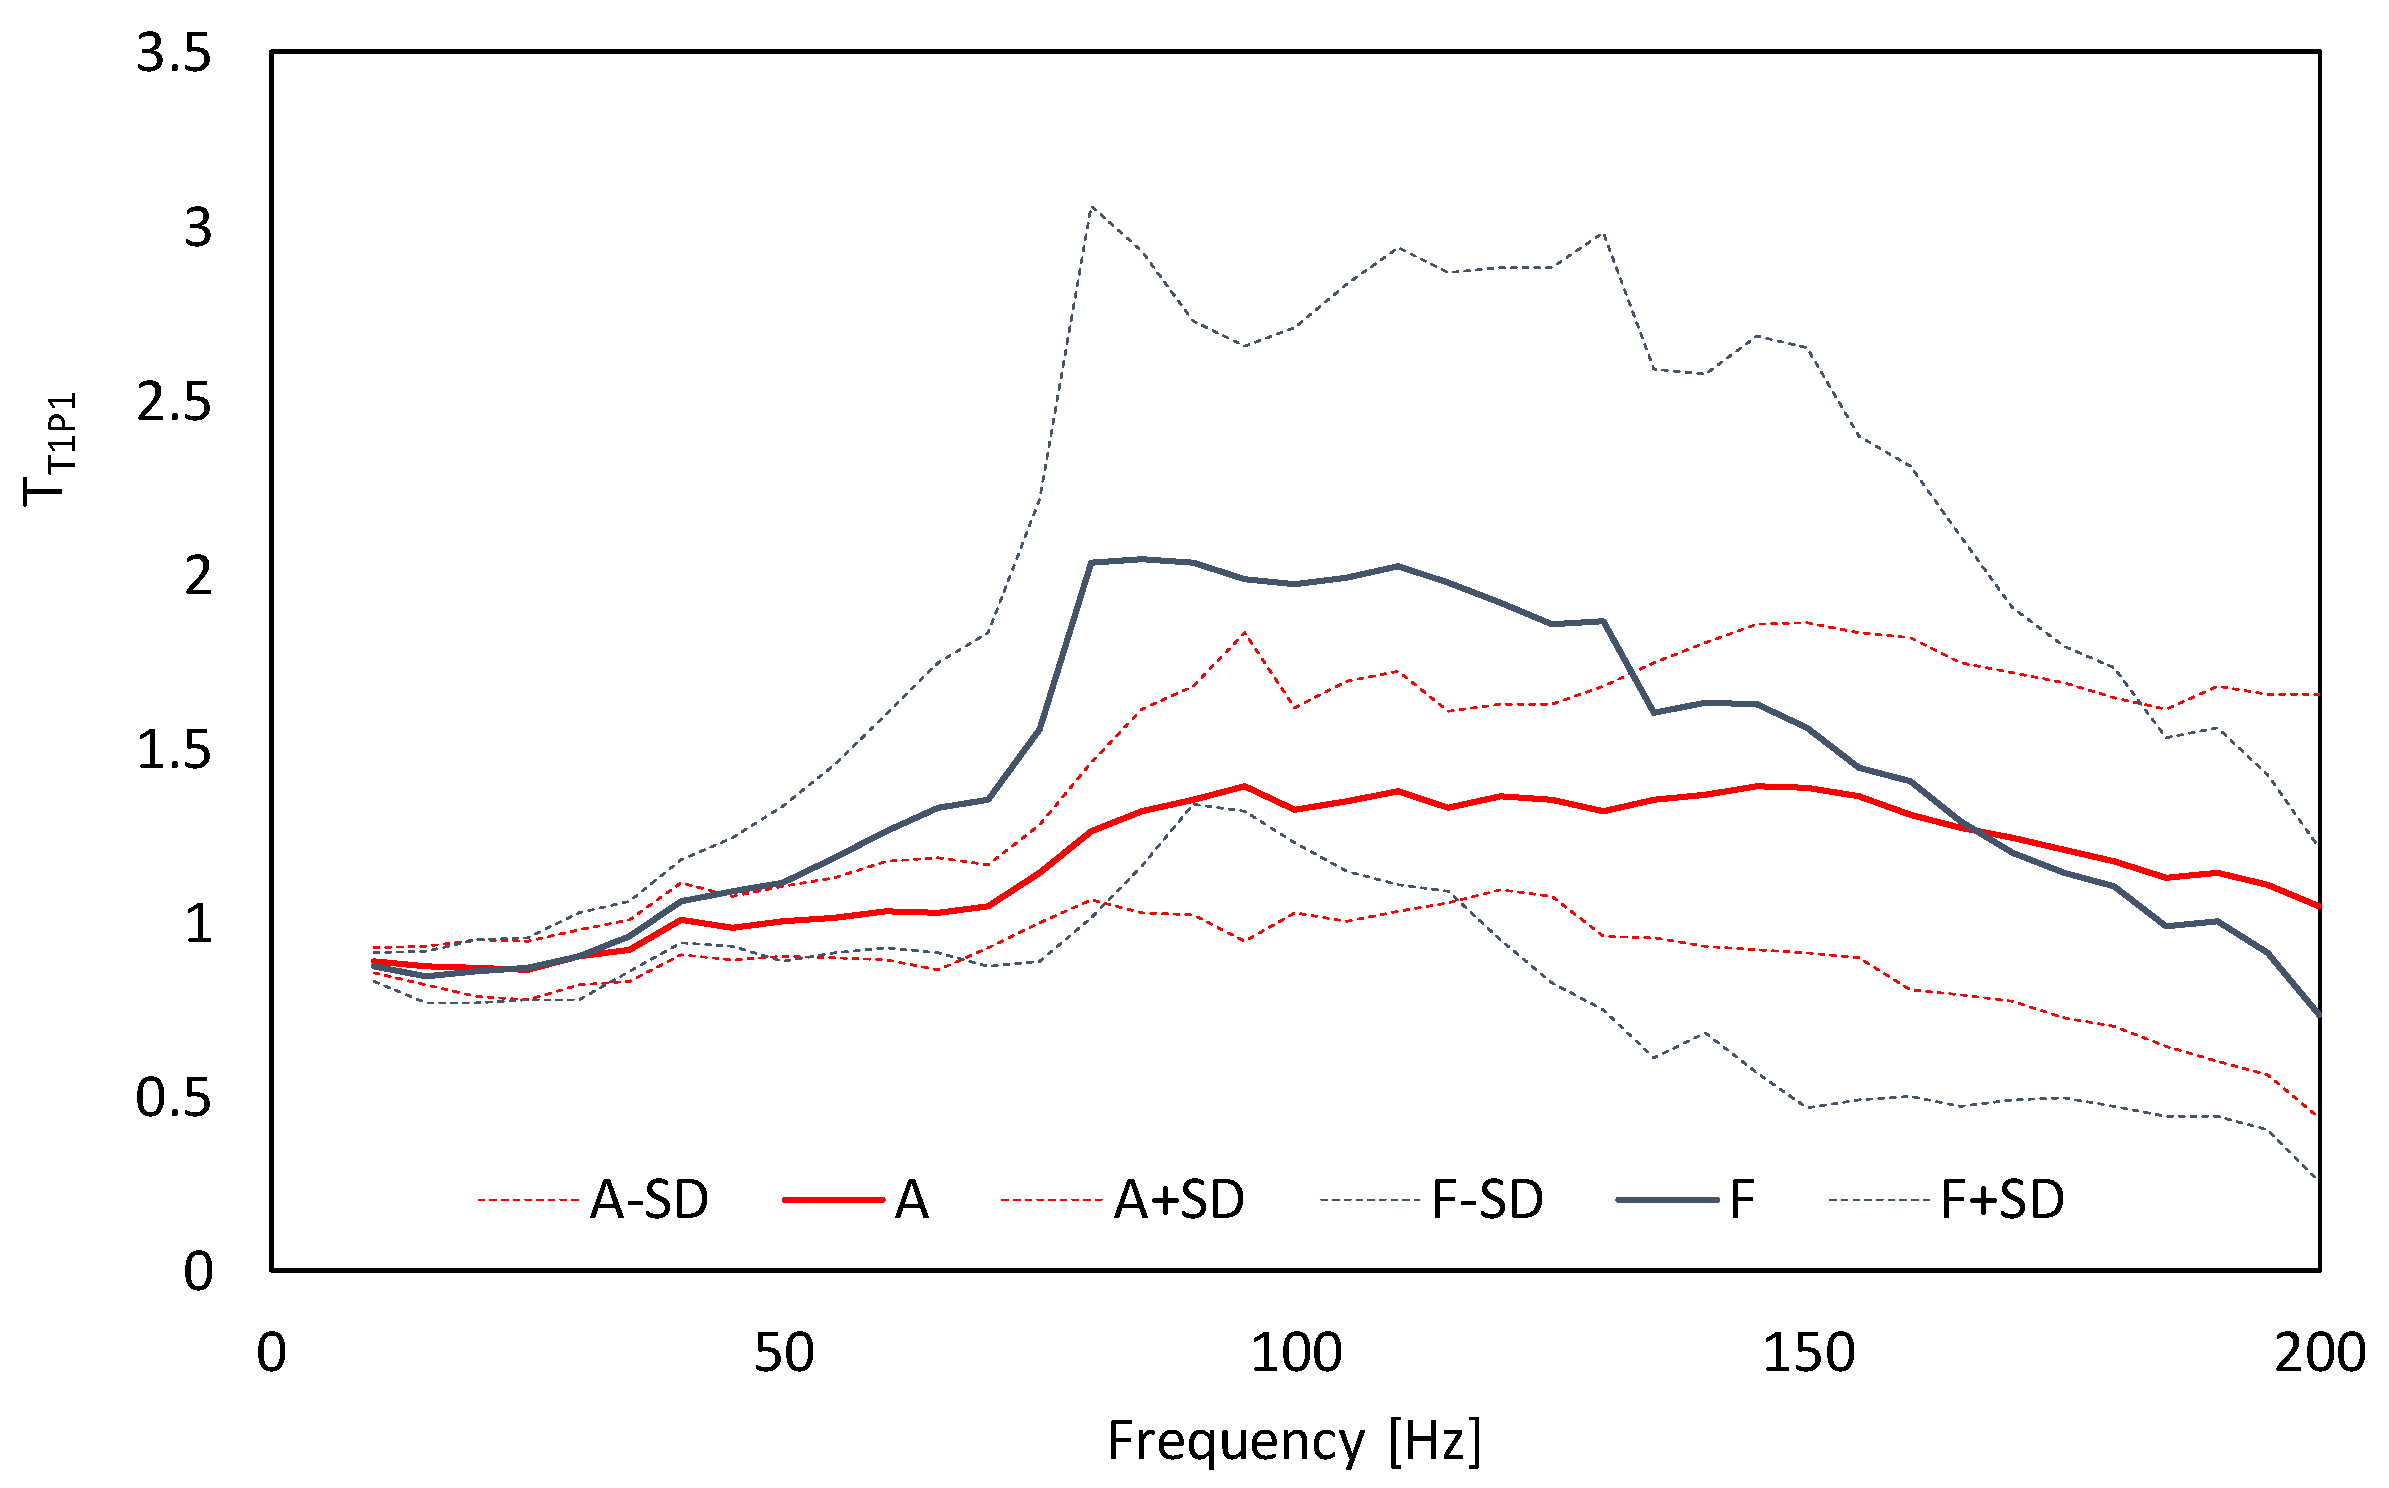
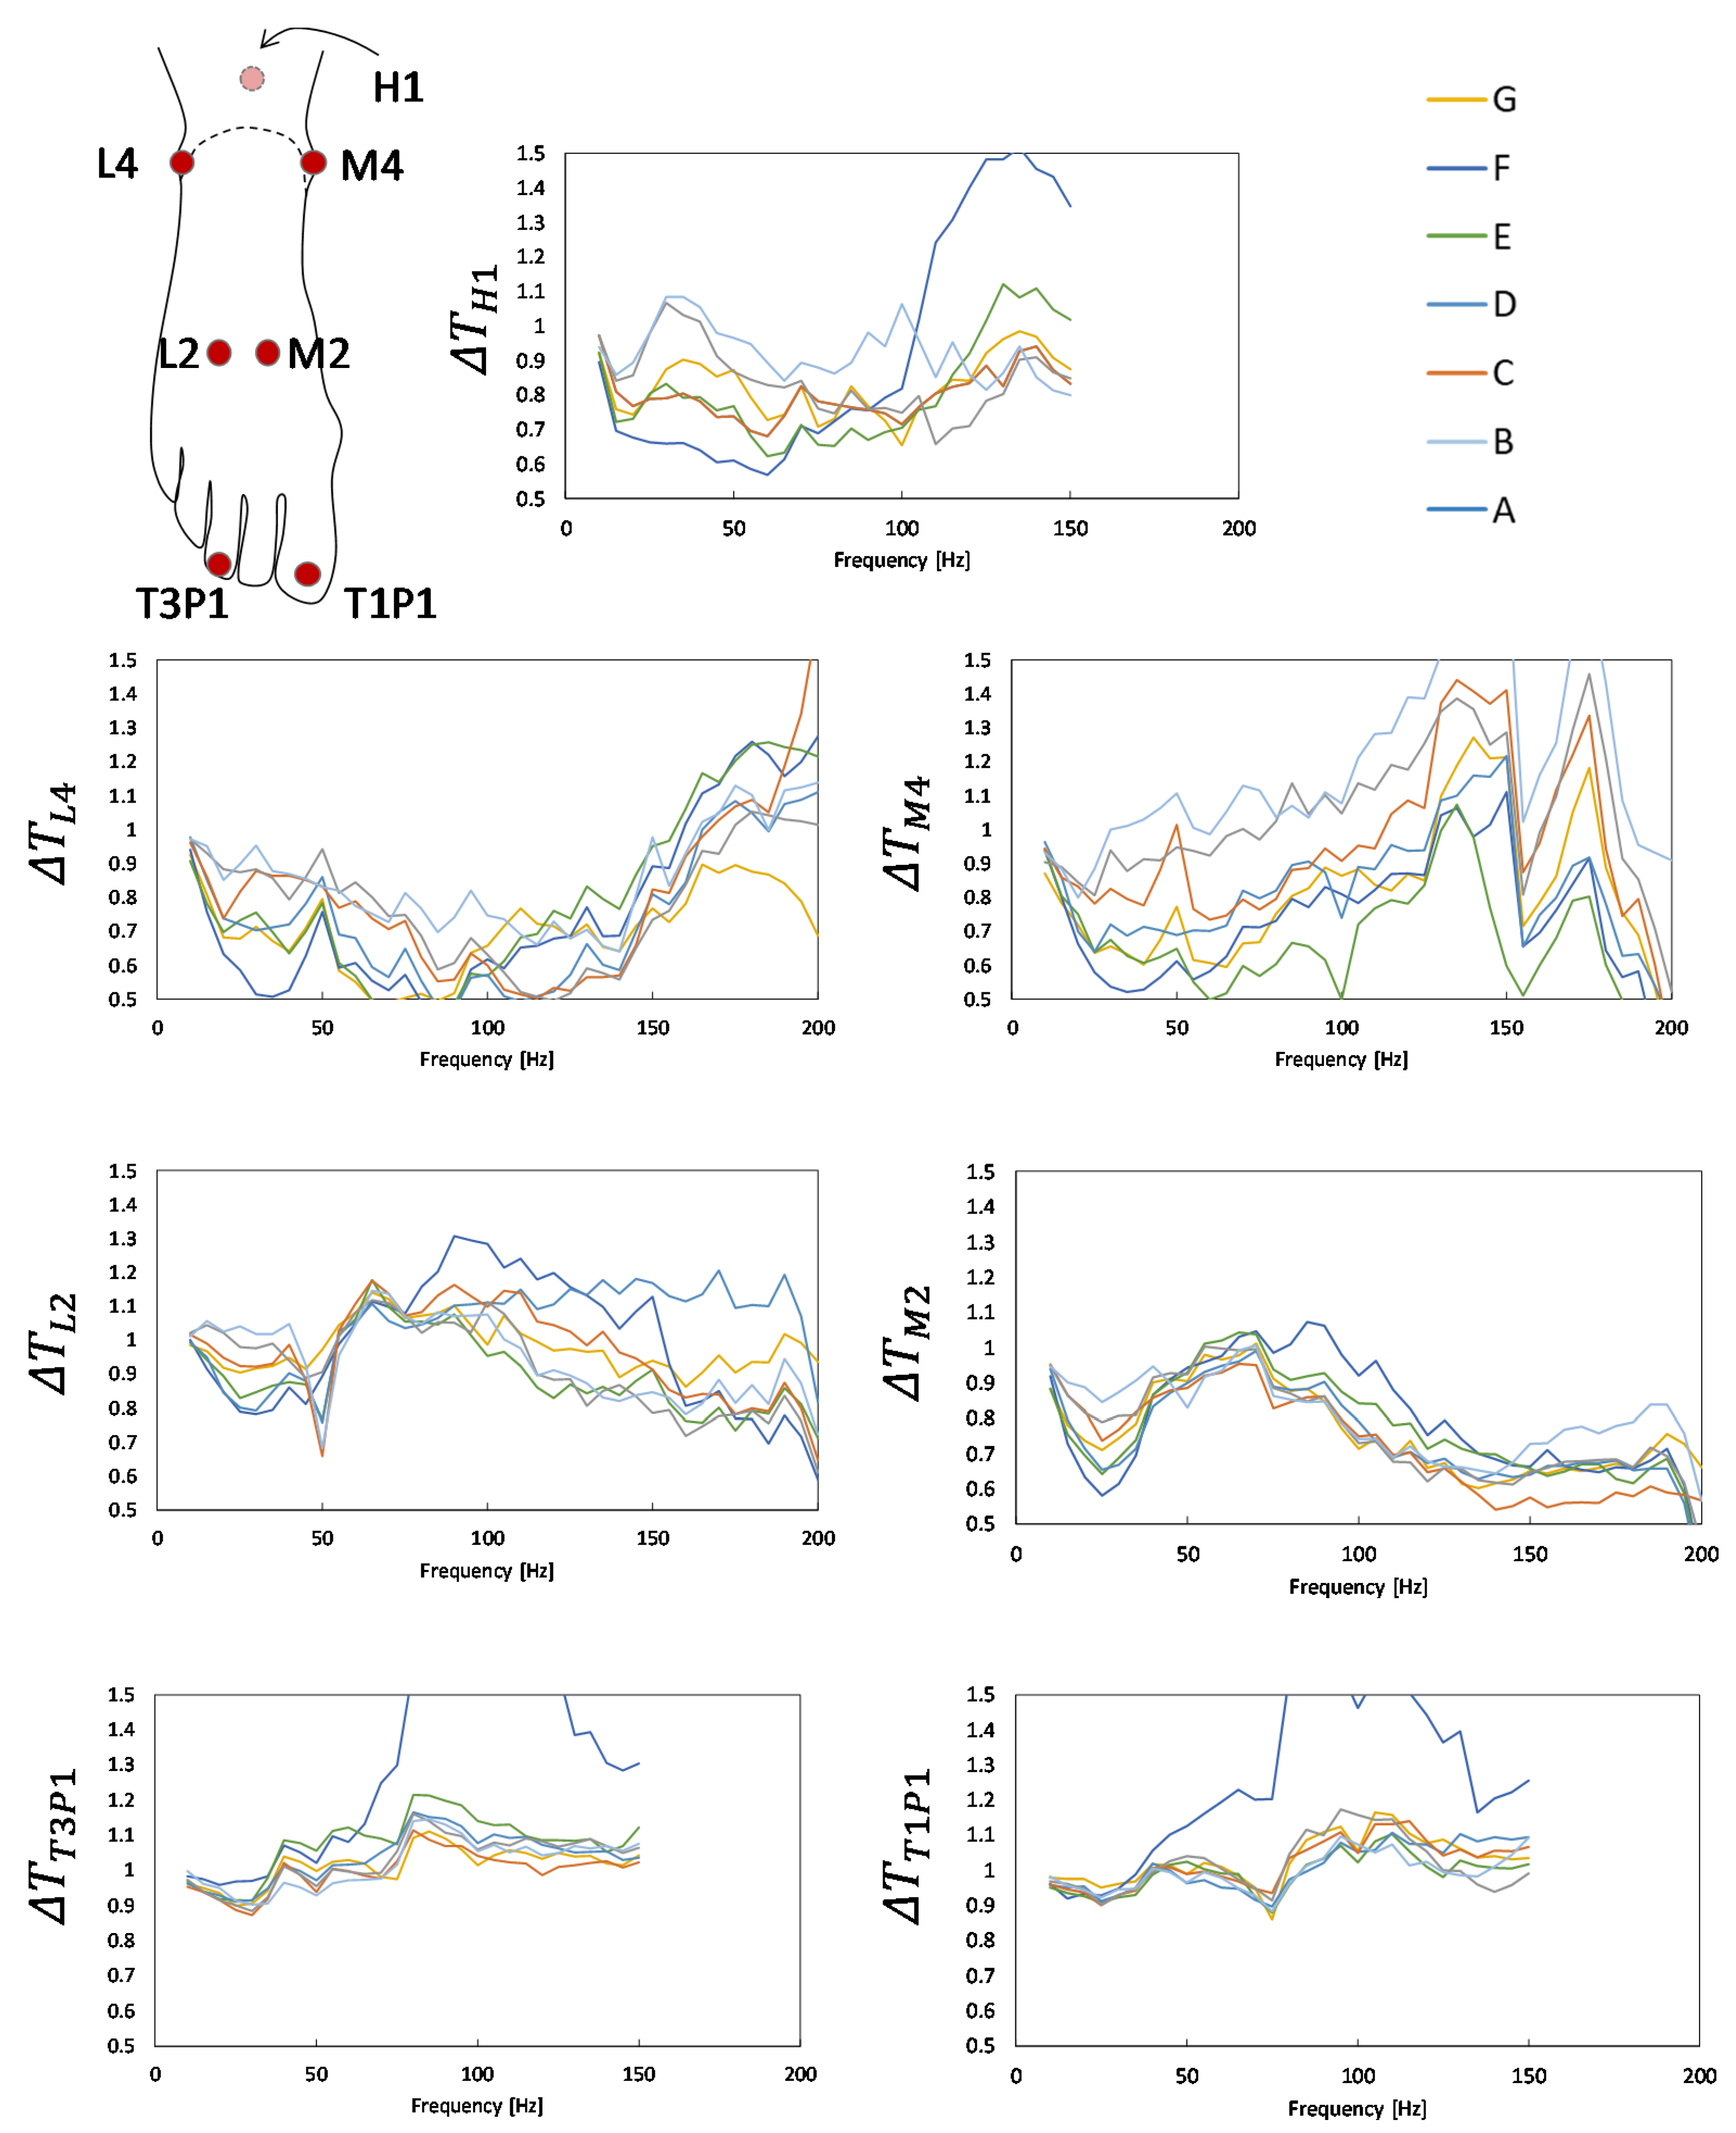
3.1. Vibration Transmissibility
3.2. Questionnaires
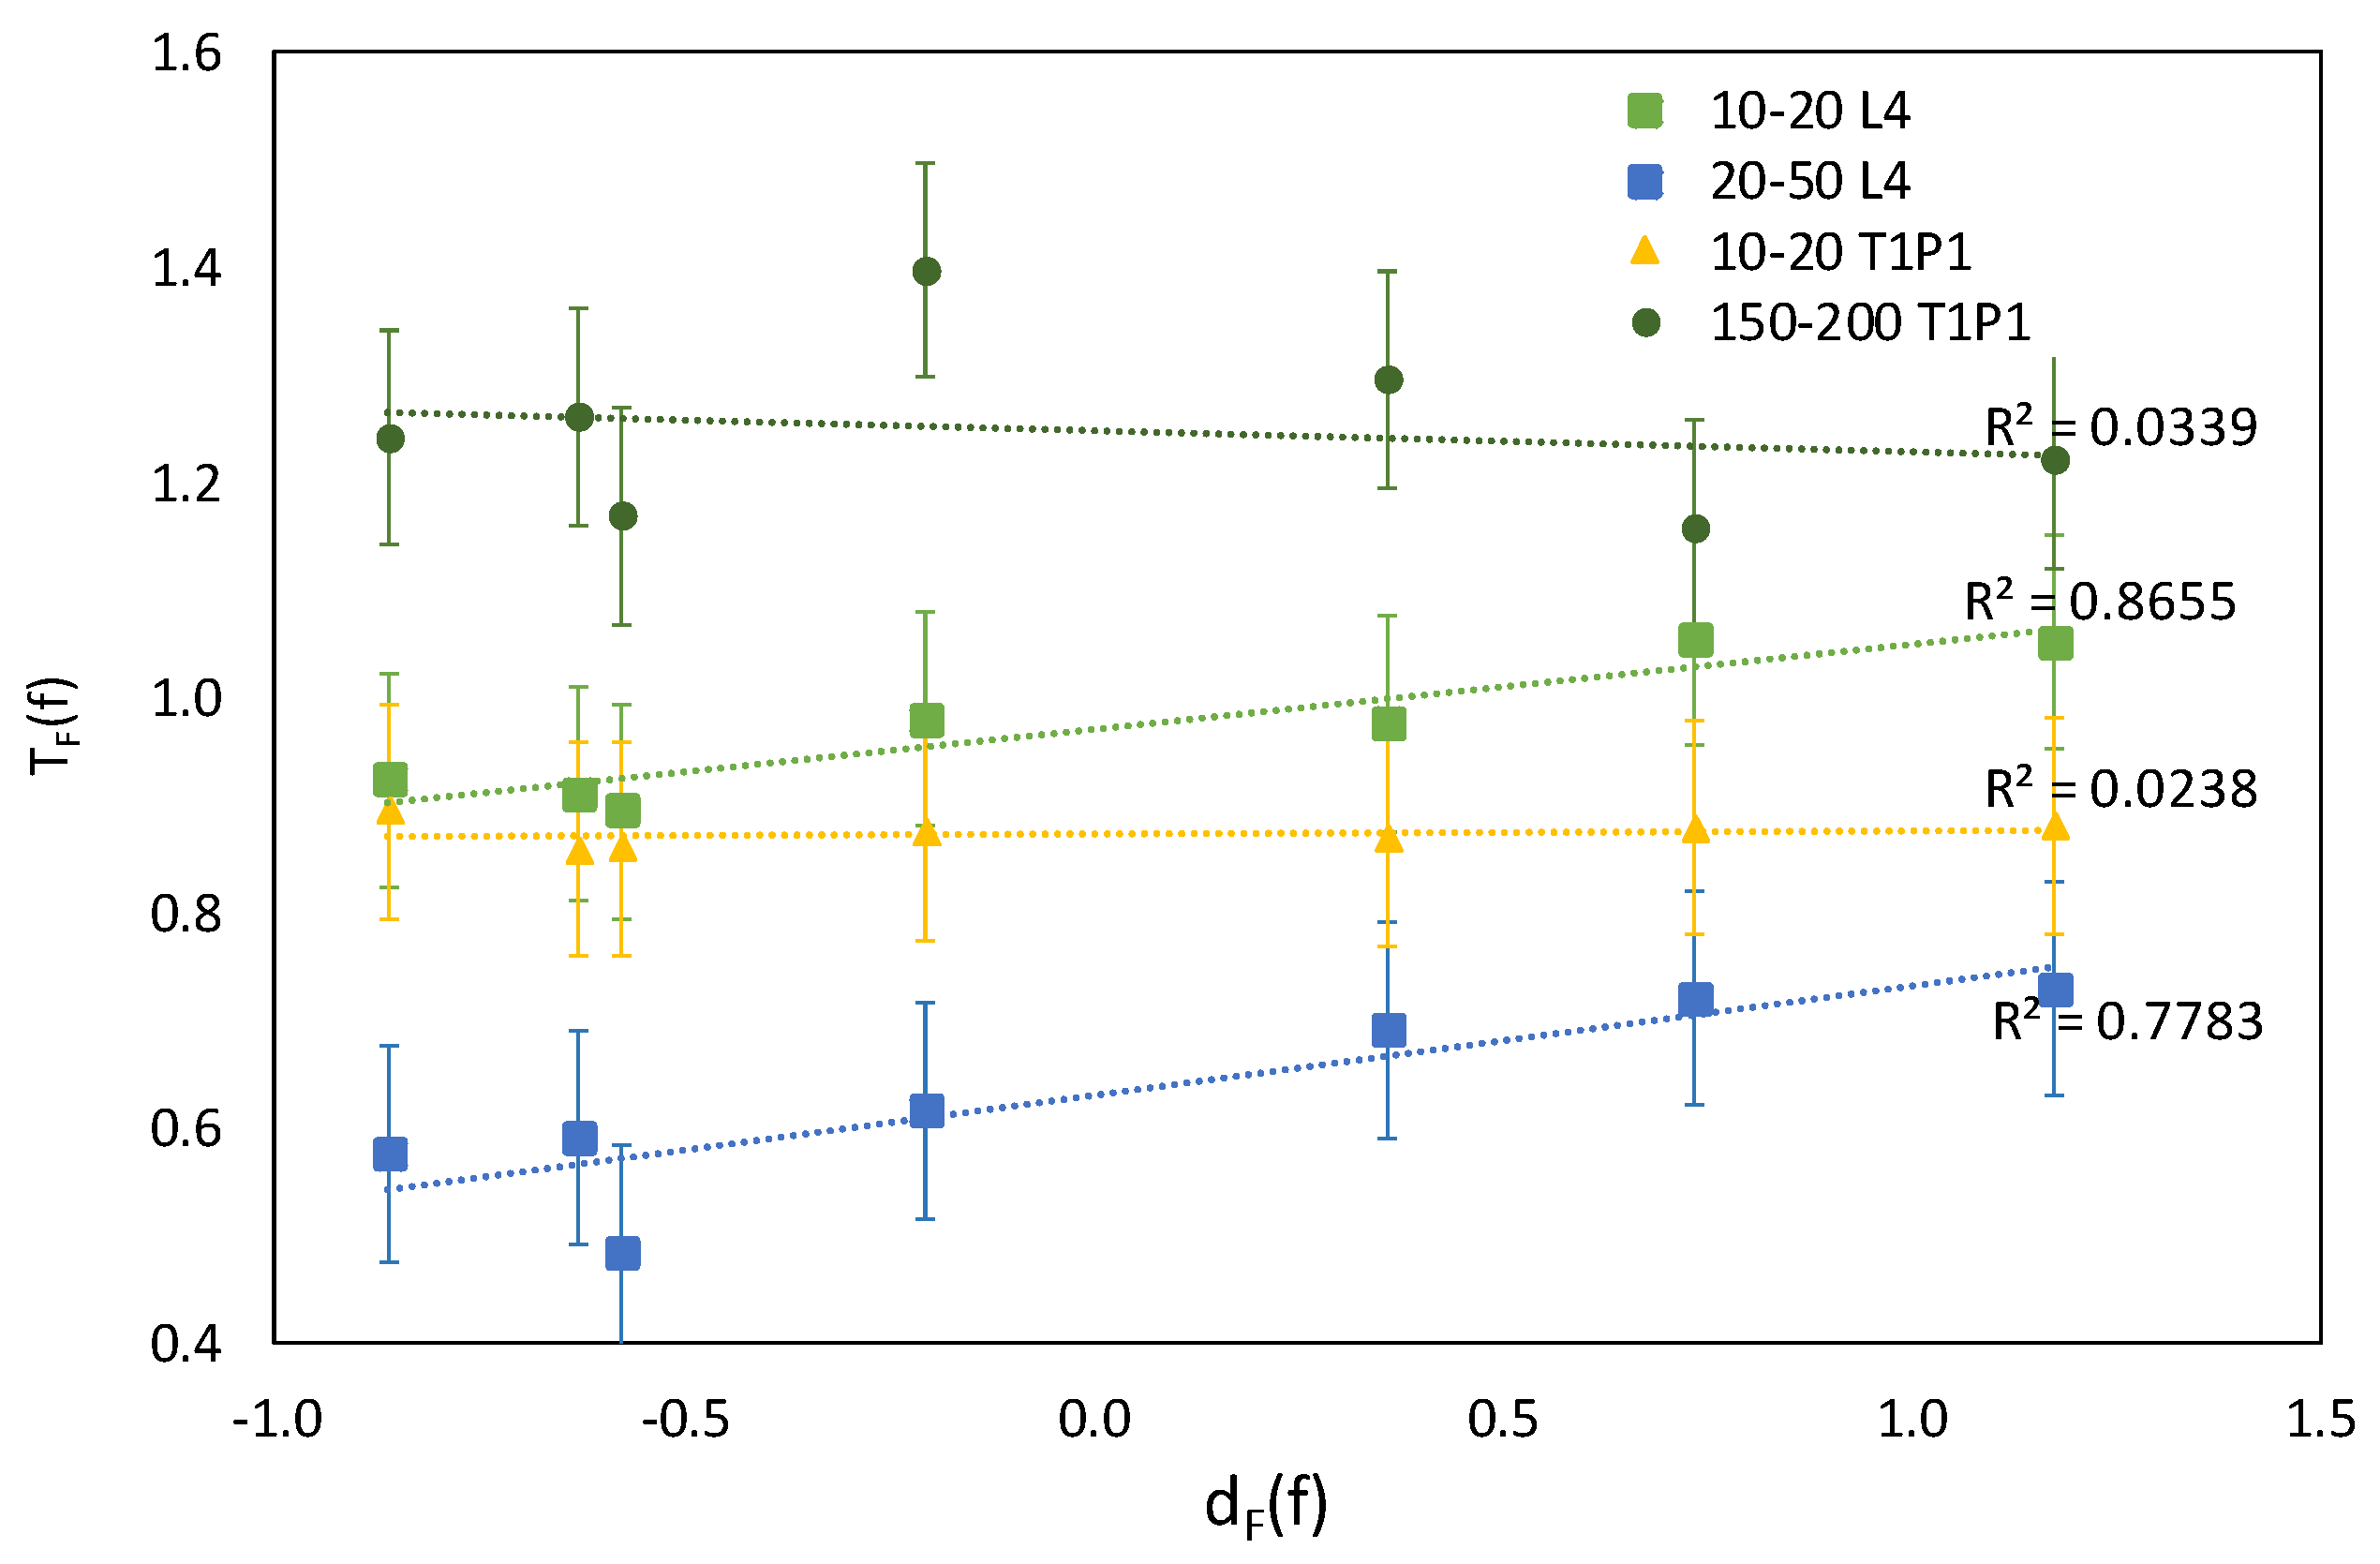
3.3. Correlation Analysis
4. Discussion
4.1. FTV Associated with the Midsole/Insole Materials
4.2. Comfort Associated with the Midsole/Insole Materials
4.3. Limitations and Future Directions
5. Conclusions
Author Contributions
Funding
Institutional Review Board Statement
Informed Consent Statement
Data Availability Statement
Acknowledgments
Conflicts of Interest
References
- Bovenzi, M. Low back pain disorders and exposure to whole-body vibration in the workplace. Semin. Perinatol. 1996, 20, 38–53. [Google Scholar] [CrossRef]
- Hedlund, U. Raynaud’s phenomenon of fingers and toes of miners exposed to local and whole-body vibration and cold. Int. Arch. Occup. Environ. Health 1989, 61, 457–461. [Google Scholar] [CrossRef]
- Leduc, M.; Eger, T.; Godwin, A.; Dickey, J.; House, R. Examination of vibration characteristics, and reported musculoskeletal discomfort for workers exposed to vibration via the feet. J. Low Freq. Noise Vib. Act. Control 2011, 30, 197–206. [Google Scholar] [CrossRef]
- Thompson, A.M.S.; House, R.; Krajnak, K.; Eger, T. Vibration-white foot: A case report. Occup. Med. 2010, 60, 572–574. [Google Scholar] [CrossRef][Green Version]
- Tingsgard, I.; Rasmussen, K. Vibration-induced white toes. Ugeskr. Laeger 1994, 156, 4836–4838. [Google Scholar]
- Eger, T.; Thompson, A.; Leduc, M.; Krajnak, K.; Goggins, K.; Godwin, A.; House, R. Vibration induced white-feet: Overview and field study of vibration exposure and reported symptoms in workers. Work 2014, 47, 101–110. [Google Scholar] [CrossRef]
- House, R.; Jiang, D.; Thompson, A.; Eger, T.; Krajnak, K.; Sauvé, J.; Schweigert, M. Vasospasm in the feet in workers assessed for HAVS. Occup. Med. 2011, 61, 115–120. [Google Scholar] [CrossRef]
- Goggins, K.A.; Tarabini, M.; Lievers, W.B.; Eger, T.R. Biomechanical response of the human foot when standing in a natural position while exposed to vertical vibration from 10–200 Hz. Ergonomics 2019, 62, 644–656. [Google Scholar] [CrossRef]
- Goggins, K.A.; Tarabini, M.; Lievers, W.B.; Eger, T.R. Standing centre of pressure alters the vibration transmissibility response of the foot. Ergonomics 2019, 62, 1202–1213. [Google Scholar] [CrossRef]
- Chadefaux, D.; Goggins, K.; Cazzaniga, C.; Marzaroli, P.; Marelli, S.; Katz, R.; Eger, T.; Tarabini, M. Development of a two-dimensional dynamic model of the foot-ankle system exposed to vibration. J. Biomech. 2020, 99, 109547. [Google Scholar] [CrossRef]
- Morioka, M.; Griffin, M.J. Magnitude-dependence of equivalent comfort contours for fore-and-aft, lateral and vertical whole-body vibration. J. Sound Vib. 2006, 298, 755–772. [Google Scholar] [CrossRef]
- ISO 10819—Mechanical Vibration and Shock—Hand-Arm Vibration—Measurement and Evaluation of the Vibration Transmissibility of Gloves at the Palm of the Hand; International Organization for Standardization: Geneva, Switzerland, 2013; pp. 1–26.
- Milosevic, M.; McConville, K.M.V. Evaluation of protective gloves and working techniques for reducing hand-arm vibration exposure in the workplace. J. Occup. Health 2012, 54, 250–253. [Google Scholar] [CrossRef] [PubMed]
- Dong, R.G.; Welcome, D.E.; Peterson, D.R.; Xu, X.S.; McDowell, T.W.; Warren, C.; Asaki, T.; Kudernatsch, S.; Brammer, A. Tool-specific performance of vibration-reducing gloves for attenuating palm-transmitted vibrations in three orthogonal directions. Int. J. Ind. Ergon. 2014, 44, 827–839. [Google Scholar] [CrossRef] [PubMed]
- Xu, X.S.; Riley, D.A.; Persson, M.; Welcome, D.E.; Krajnak, K.; Wu, J.Z.; Govinda Raju, S.R.; Dong, R.G. Evaluation of anti-vibration effectiveness of glove materials using an animal model. Biomed. Mater. Eng. 2011, 21, 193–211. [Google Scholar] [CrossRef]
- Welcome, D.E.; Dong, R.G.; Xu, X.S.; Warren, C.; McDowell, T.W. Tool-specific performance of vibration-reducing gloves for attenuating fingers-transmitted vibration. Occup. Ergon. 2016, 13, 23–44. [Google Scholar] [CrossRef]
- McPoil, T.G. Athletic footwear: Design, performance and selection issues. J. Sci. Med. Sport 2000, 3, 260–267. [Google Scholar] [CrossRef]
- Chiu, H.T.; Shiang, T.Y. Effects of insoles and additional shock absorption foam on the cushioning properties of sport shoes. J. Appl. Biomech. 2007, 23, 119–127. [Google Scholar] [CrossRef]
- Tarabini, M.; Eger, T.; Goggins, K.; Goi, F.; Corti, F. Effect of Work Boot Characteristics on Vibration Transmitted to Workers’ Feet and Subjective Discomfort. In Proceedings of the 20th Congress of the International Ergonomics Association (IEA 2018), Florence, Italy, 26–30 August 2018. [Google Scholar]
- Tarabini, M.; Solbiati, S.; Saggin, B.; Scaccabarozzi, D. Setup for the Measurement of Apparent Mass Matrix of Standing Subjects. IEEE Trans. Instrum. Meas. 2016, 65, 1856–1864. [Google Scholar] [CrossRef]
- Tarabini, M.; Solbiati, S.; Saggin, B.; Scaccabarozzi, D. Apparent mass matrix of standing subjects exposed to multi-axial whole-body vibration. Ergonomics 2016, 59, 1038–1049. [Google Scholar] [CrossRef]
- Dickey, J.P.; Eger, T.R.; Oliver, M.L.; Boileau, P.E.; Trick, L.M.; Edwards, A.M. Multi-axis sinusoidal whole-body vibrations: Part II—Relationship between Vibration Total Value and discomfort varies between vibration axes. J. Low Freq. Noise Vib. Act. Control 2007, 26, 195–204. [Google Scholar] [CrossRef]
- Bendat, J.S.; Piersol, A.G. Random Data: Analysis and Measurement Procedures; John Wiley & Sons: New York, NY, USA, 2011. [Google Scholar]
- Tarabini, M.; Solbiati, S.; Moschioni, G.; Saggin, B.; Scaccabarozzi, D. Analysis of non-linear response of the human body to vertical whole-body vibration. Ergonomics 2014, 57, 1711–1723. [Google Scholar] [CrossRef]
- Tarabini, M.; Saggin, B.; Scaccabarozzi, D.; Gaviraghi, D.; Moschioni, G. Apparent mass distribution at the feet of standing subjects exposed to whole-body vibration. Ergonomics 2013, 56, 842–855. [Google Scholar] [CrossRef]
- Goggins, K.; Godwin, A.; Lariviere, C.; Eger, T. Study of the biodynamic response of the foot to vibration exposure. Occup. Ergon. 2016, 13, 53–66. [Google Scholar] [CrossRef]
- Xu, X.S.; Welcome, D.E.; McDowell, T.W.; Wu, J.Z.; Wimer, B.; Warren, C.; Dong, R.G. The vibration transmissibility and driving-point biodynamic response of the hand exposed to vibration normal to the palm. Int. J. Ind. Ergon. 2011, 41, 418–427. [Google Scholar] [CrossRef]
- ISO 2631-1—Mechanical Vibration and Shock—Evaluation of Human Exposure to Whole-Body Vibration. Part I: General Requirements; International Organization for Standardization: Geneva, Switzerland, 1997; pp. 1–30.
- ISO 5349-1—Mechanical Vibration—Measurement and Evaluation of Human Exposure to Hand-Transmitted Vibration—Part 1: General Requirements; International Organization for Standardization: Geneva, Switzerland, 2001; pp. 1–24.
- Xu, X.S.; Welcome, D.E.; Warren, C.M.; McDowell, T.W.; Dong, R.G. Development of a finger adapter method for testing and evaluating vibration-reducing gloves and materials. Meas. J. Int. Meas. Confed. 2019, 137, 362. [Google Scholar] [CrossRef]
- Harazin, B.; Grzesik, J. The transmission of vertical whole-body vibration to the body segments of standing subjects. J. Sound Vib. 1998, 215, 775–787. [Google Scholar] [CrossRef]
- Shibata, N. Effect of shelf aging on vibration transmissibility of anti-vibration gloves. Ind. Health 2017, 55, 575–579. [Google Scholar] [CrossRef]


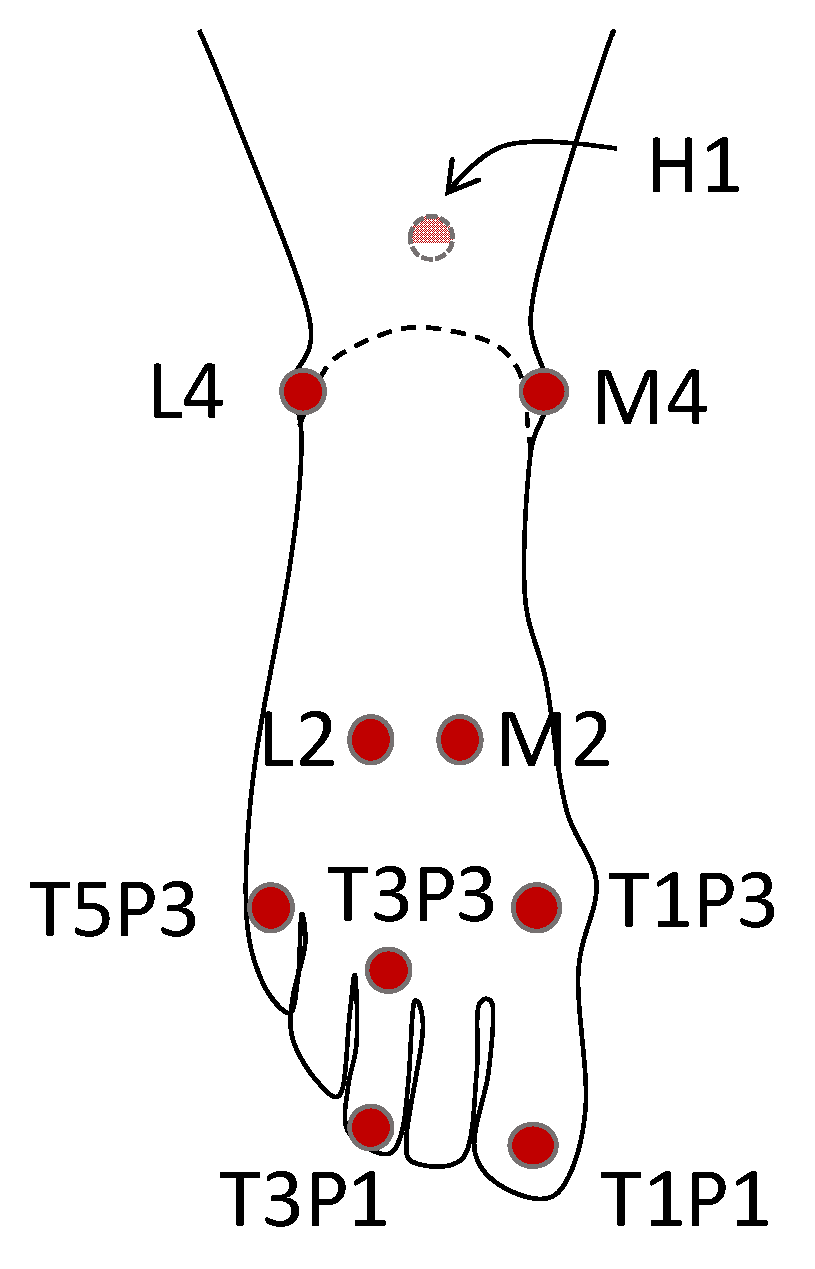
| Marker Name | Description of Placement |
|---|---|
| T1P1 | Middle of the nail bed of the 1st toe |
| T1P3 | Joint between the metatarsal and the phalange of the 1st toe |
| T3P1 | Middle of the nail bed of the 3rd toe |
| T3P3 | Between the 2nd and 3rd phalange joint of the 3rd toe |
| T5P3 | Between the 2nd and the 3rd phalange joint of the 5th toe |
| M2 | Middle of the foot on the medial side in line with the 2nd toe |
| L2 | middle of the foot on the lateral side in line with the 4th toe |
| M4 | The most protruding portion of the ankle medial malleolus |
| L4 | The most protruding portion of the ankle lateral malleolus |
| H1 | Head of the calcaneus at the insertion point of the Achilles Tendon |
| Forefoot (T1P1, T3P3) | |||||||
| Frequency Range [Hz] | A | B | C | D | E | F | G |
| 10–200 | 1 | 3 | 2 | 4 | 4 | 21 | 5 |
| 10–20 | −3 | −5 | −5 | −5 | −7 | −5 | −3 |
| 20–50 | −5 | −4 | −4 | −3 | −3 | −1 | 0 |
| 50–100 | 3 | 5 | 7 | 7 | 9 | 33 | 5 |
| 100–150 | 0 | 4 | 3 | 5 | 4 | 32 | 5 |
| 150–200 | 6 | 6 | 3 | 5 | 5 | 10 | 10 |
| 10–20 | 1 | 3 | 2 | 4 | 4 | 21 | 5 |
| Midfoot (L2, M2) | |||||||
| Frequency range [Hz] | A | B | C | D | E | F | G |
| 10–200 | −11 | −13 | −13 | −10 | −15 | −9 | −12 |
| 10–20 | −3 | −5 | −7 | −13 | −14 | −16 | −12 |
| 20–50 | −7 | −9 | −14 | −21 | −19 | −22 | −13 |
| 50–100 | −4 | −2 | −2 | −2 | −1 | 7 | −2 |
| 100–150 | −20 | −21 | −16 | −9 | −18 | −2 | −18 |
| 150–200 | −21 | −29 | −30 | −13 | −29 | −27 | −20 |
| 10–20 | −11 | −13 | −13 | −10 | −15 | −9 | −12 |
| Rearfoot (L4, M4, H1) | |||||||
| Frequency range [Hz] | A | B | C | D | E | F | G |
| 10–200 | −6 | −12 | −18 | −22 | −26 | −27 | −24 |
| 10–20 | −10 | −10 | −13 | −14 | −19 | −21 | −19 |
| 20–50 | −6 | −10 | −19 | −26 | −28 | −40 | −26 |
| 50–100 | −8 | −14 | −24 | −28 | −39 | −35 | −31 |
| 100–150 | −4 | −17 | −17 | −21 | −16 | 1 | −16 |
| 150–200 | −6 | −11 | −11 | −17 | −8 | 11 | −17 |
| 10–20 | −6 | −12 | −18 | −22 | −26 | −27 | −24 |
| Normalized Discomfort | |||||||
|---|---|---|---|---|---|---|---|
| Participant | Midsoles | Insoles | |||||
| k | A | B | C | D | E | F | G |
| 1 | 0.7 | 1.4 | −0.5 | −1.2 | 0.1 | 0.7 | −1.2 |
| 2 | 1.2 | 1.2 | 0.6 | −0.5 | −0.2 | −1.1 | −1.1 |
| 3 | 1.1 | 0.7 | 1.1 | −0.5 | −0.1 | −1.4 | −0.9 |
| 4 | 0.9 | 0.2 | 0.9 | −0.5 | −1.8 | −0.5 | 0.9 |
| 5 | 1.3 | 0.6 | −0.2 | −0.9 | 0.9 | −0.2 | −1.6 |
| 6 | 1.2 | −0.2 | 0.7 | 0.3 | −1.1 | 0.7 | −1.5 |
| 7 | 1.2 | 1.2 | 0.6 | −1.2 | −1.2 | 0.0 | −0.6 |
| 8 | 1.6 | 0.8 | −0.4 | −0.4 | 0.4 | −1.2 | −0.8 |
| 9 | 1.4 | 0.9 | 0.5 | 0.0 | −0.9 | −0.5 | −1.4 |
| 10 | 1.9 | 0.3 | −0.4 | −0.1 | −1.2 | −0.8 | 0.3 |
| 11 | 1.3 | 0.9 | 0.3 | 0.5 | −0.6 | −1.6 | −0.8 |
| 12 | 0.3 | −0.2 | 1.9 | 0.3 | −0.8 | −1.3 | −0.2 |
| 13 | 1.6 | 0.9 | 0.1 | 0.1 | −0.7 | −1.0 | −1.0 |
| 14 | 1.5 | 1.0 | 0.5 | −0.9 | −0.4 | −0.9 | −0.9 |
| 15 | 1.6 | 1.1 | 0.2 | −0.3 | −0.8 | −1.0 | −0.8 |
| 16 | 0.1 | 0.6 | 1.2 | 0.6 | −1.6 | 0.1 | −1.0 |
| 17 | 1.1 | 1.1 | 0.2 | 0.6 | −0.6 | −1.0 | −1.4 |
| 18 | 1.5 | 1.0 | −0.1 | 0.4 | −1.1 | −0.6 | −1.1 |
| 19 | 1.3 | 0.2 | 0.2 | −1.0 | −1.0 | 1.3 | −1.0 |
| 20 | 1.0 | 1.2 | −0.1 | 0.4 | −0.1 | −1.4 | −1.2 |
| 1.2 | 0.7 | 0.4 | −0.2 | −0.6 | −0.6 | −0.9 | |
| 0.4 | 0.5 | 0.6 | 0.6 | 0.7 | 0.8 | 0.6 | |
Publisher’s Note: MDPI stays neutral with regard to jurisdictional claims in published maps and institutional affiliations. |
© 2021 by the authors. Licensee MDPI, Basel, Switzerland. This article is an open access article distributed under the terms and conditions of the Creative Commons Attribution (CC BY) license (https://creativecommons.org/licenses/by/4.0/).
Share and Cite
Tarabini, M.; Eger, T.; Goggins, K.; Moorhead, A.P.; Goi, F. Effect of the Shoe Sole on the Vibration Transmitted from the Supporting Surface to the Feet. Vibration 2021, 4, 743-758. https://doi.org/10.3390/vibration4040041
Tarabini M, Eger T, Goggins K, Moorhead AP, Goi F. Effect of the Shoe Sole on the Vibration Transmitted from the Supporting Surface to the Feet. Vibration. 2021; 4(4):743-758. https://doi.org/10.3390/vibration4040041
Chicago/Turabian StyleTarabini, Marco, Tammy Eger, Katie Goggins, Alex P. Moorhead, and Filippo Goi. 2021. "Effect of the Shoe Sole on the Vibration Transmitted from the Supporting Surface to the Feet" Vibration 4, no. 4: 743-758. https://doi.org/10.3390/vibration4040041
APA StyleTarabini, M., Eger, T., Goggins, K., Moorhead, A. P., & Goi, F. (2021). Effect of the Shoe Sole on the Vibration Transmitted from the Supporting Surface to the Feet. Vibration, 4(4), 743-758. https://doi.org/10.3390/vibration4040041