Article

Characterizing the Frequency Response of Compliant Materials by Laser Döppler Vibrometry Coupled Acoustic Excitation

1
Instituto Federal do Rio Grande do Norte, Parnamirim 59143-455, Brazil
2
Mechanical Engineering and Resource Sustainability Center, University of Minho, Campus de Azurém, 4800-058 Guimarães, Portugal
3
InAcoustics, Engenharia Acústica, Vibrações e Ambiente, Lda, 4470-157 Maia, Portugal
*
Author to whom correspondence should be addressed.
Vibration 2021, 4(1), 64-74; https://doi.org/10.3390/vibration4010005
Submission received: 7 December 2020 / Revised: 4 January 2021 / Accepted: 6 January 2021 / Published: 10 January 2021

Abstract

:
Low-stiffness or compliant materials are inherently difficult to characterize in terms of dynamic mechanical properties. Their free-vibration behavior is not frequently analyzed, given that performing classic vibration testing in these type of materials may imply the tampering of the results by external sources, either by changes in the geometry of the sample, by gravity-induced buckling, or the instrumentation itself (e.g., the mass of accelerometers). This study proposes an approach to determine the frequency response of these types of materials, using a noncontact methodology based on acoustic excitation and displacement measurement by Laser Döppler Vibrometry. The detailed method may be optimized by changing the sample design into a half-cane configuration to increase sample stiffness. This approach significantly increases the sample eigenmodes, facilitating their excitation by the acoustic pressure source. Numerical analysis using the values of the dynamic Young’s modulus from the experimental approaches validates the overall procedure. It is shown that the combination of numerical analysis and the proposed experimental method is a possible route for the determination of the dynamic Young’s modulus of these types of materials by inverse engineering.

1. Introduction

The optimization of industrial systems and mechanisms is frequently dependent on their dynamic behavior [1]. The displacements and overall dynamic behavior of a mechanical system have a strong impact on its performance, as its poor planning usually implies a loss in accuracy and velocities [2], and even compromise structural integrity [3].
Current numerical approaches (e.g., modal and harmonic analysis) allow a very close prediction of the dynamic behavior of structures [4], given that the input parameters for these computational routines are correctly implemented [5]. Material properties, for instance, are fundamental to obtain a reliable prediction of the dynamic behavior of a structure.
There are still challenges in the characterization of the dynamic mechanical behavior of compliant samples. Even though there are experimental techniques that allow the estimation of the viscoelastic properties of these materials, such as Dynamic Mechanical Analysis, they usually require the pre-tension of the samples [6] and are limited in their range of frequencies (generally up to 200 Hz) [7]. Thus, these methods do not allow the characterization of samples in free-vibration and a wide range of frequencies.
Within the most common equipment to excite samples in experimental modal analysis are shakers and impact hammers [8], using a nondestructive approach with high repeatability [9], sensitivity [10], and resolution [11]. The measurement of instant velocities or accelerations in the samples is commonly performed by the use of vibrometers and accelerometers [12,13]. Most of these techniques, however, may not be appropriate in samples with low density (i.e., mass) and low stiffness [14]. In fact, the mass of these instruments may effectively influence the dynamic response of properties with such physical properties [15]. This generates a need to design techniques and methods to characterize the free-vibration mechanical properties of compliant materials.
Sound pressure using a loudspeaker, for instance, could be a possible route that allows noncontact sample excitation in a wide range of frequencies. This technique, as a relatively low-power method, may be appropriate for low-mass and low-stiffness samples [16], and rather than performing a single-point excitation of the samples, this technique applies a well-distributed pressure on the surface of the samples. Bokil and Shirahatti [17] developed an analytical model based on a sound–structure interaction for modal analysis purposes; however, the method does not contemplate damping effects. A general problem is the insufficient use of acoustic pressure to excite these types of samples is not sufficient to obtain a frequency response function (FRF) due to the absence of load monitoring.
Previous experiments by Wu and Moslehi [18] have shown that such an approach may be used to extract similar modal parameters as single-point excitation approaches. Techniques such as these have been used to perform Operational Modal Analysis (OMA) [12], in which the tested sample is subjected to equivalent conditions to its real application and no external excitation is used. Xu and Zhu [19] have used OMA techniques in aluminum plates that are excited by a loudspeaker, while having also performed classic modal analysis using an impact hammer. Results from both approaches have been shown to display a 1.5% resonant frequency variation.
Roozen et al. [20] used an array of loudspeakers to generate a diffuse field in building elements, measuring the response by laser vibrometry. Urban et al. [21] proposed an approach to determine façade sound insulation by using an acoustic source, measure acoustic insulation by microphones, and analyze vibrometry in the tested structures using accelerometers.
Amraoui and Lieven [12] developed an acoustic reflector constituted by an elliptic plate with an acoustic source powered through a focal point to perform a localized acoustic excitation. Referring to the described experimental apparatus, modal analysis was performed in epoxy–carbon fiber laminates. Results have shown that there may be a shift in the value of the resonant frequencies by the structural and acoustic excitations. These differences are more significant as the sample mass is lower.
Sattiyaraju and Ramesh [22] studied the dynamic response of a microcantilever beam excited by a loudspeaker, and displacements were recorded by digital microscopy. The experimental results were compared and validated by numerical simulations using COMSOL. Recently, it has been shown that the vibrational analysis of microsized strings by Laser Döppler Vibrometry is influenced by unidirectional frequency changes using different laser power settings, especially in systems coupled with phase-change materials [23].
This study reports an approach that uses a loudspeaker to perform well-distributed acoustic excitation in low-mass and low-stiffness samples, while displacement velocity is monitored using Laser Döppler Vibrometry. To address the measurement of loads in the sample, sound pressure was measured by a microphone. Different sample geometries were used to address the issues caused by low stiffness in the membrane samples.

2. Methodology

Samples were collected from Kraft paper rolls. Given their thin configuration (0.32 mm thickness), the overall samples were very compliant. This new method to determine the dynamic behavior of membranes is divided into two approaches: (i) modal analysis in a cantilever beam sample and (ii) in an optimized sample for the developed approach in a half-cane sample.

2.1. Modal Analysis—Cantilever Beam Approach

Samples were sectioned from Kraft paper rolls into rectangular (100 × 8 mm2) cantilever shapes. According to Figure 1a, a 20 mm length of the samples was used to fix the samples using rigid support. Ten reflectors (3M Scotchlite Reflective Material SOLAS Grade 3150) with adhesive taping backs were then glued to the surface of the paper, in accordance with the schematics in Figure 1a. A total of five samples were tested using this configuration.
Figure 1b details the instrumentation used for these tests, corresponding to the apparatus shown in Figure 2. Sample excitation was performed by a loudspeaker (50 mm distance to the samples) radiating white noise in a 40 to 400 Hz frequency range, generated by a spectral analyzer (LMS Scadas Mobile, Leuven, Belgium). The 40 Hz minimum was established based on the range of the minimum frequency that may have been produced by the loudspeaker. Sound pressure during sample excitation was recorded by a microphone (PCB Piezotronics 130E20, Depew, USA), and displacement velocity was measured using a Döppler Laser Vibrometry (Polytec PFV-5000, Wildbronn, Germany). Laser signals and microphone measurements were collected by the referred spectral analyzer and analyzed using the TestXpress V10 software. The frequency response function of the individual samples was also combined into an average response of the multiple beams using the aforementioned software. To avoid result tampering due to external noise sources or room acoustic conditions, tests were conducted inside a fully anechoic chamber with temperatures and relative humidity of, respectively, 18–22 °C and 47–55%. According to the study of Adriana et al. [24] on the dynamic mechanical properties of Kraft paper samples, it is expected that the testing environment (i.e., temperature and humidity) does not impact the stiffness and internal friction in these types of materials. Consequently, they should not be considered variables in this analysis.

2.2. Modal Analysis—Optimized Half-Cane Sample

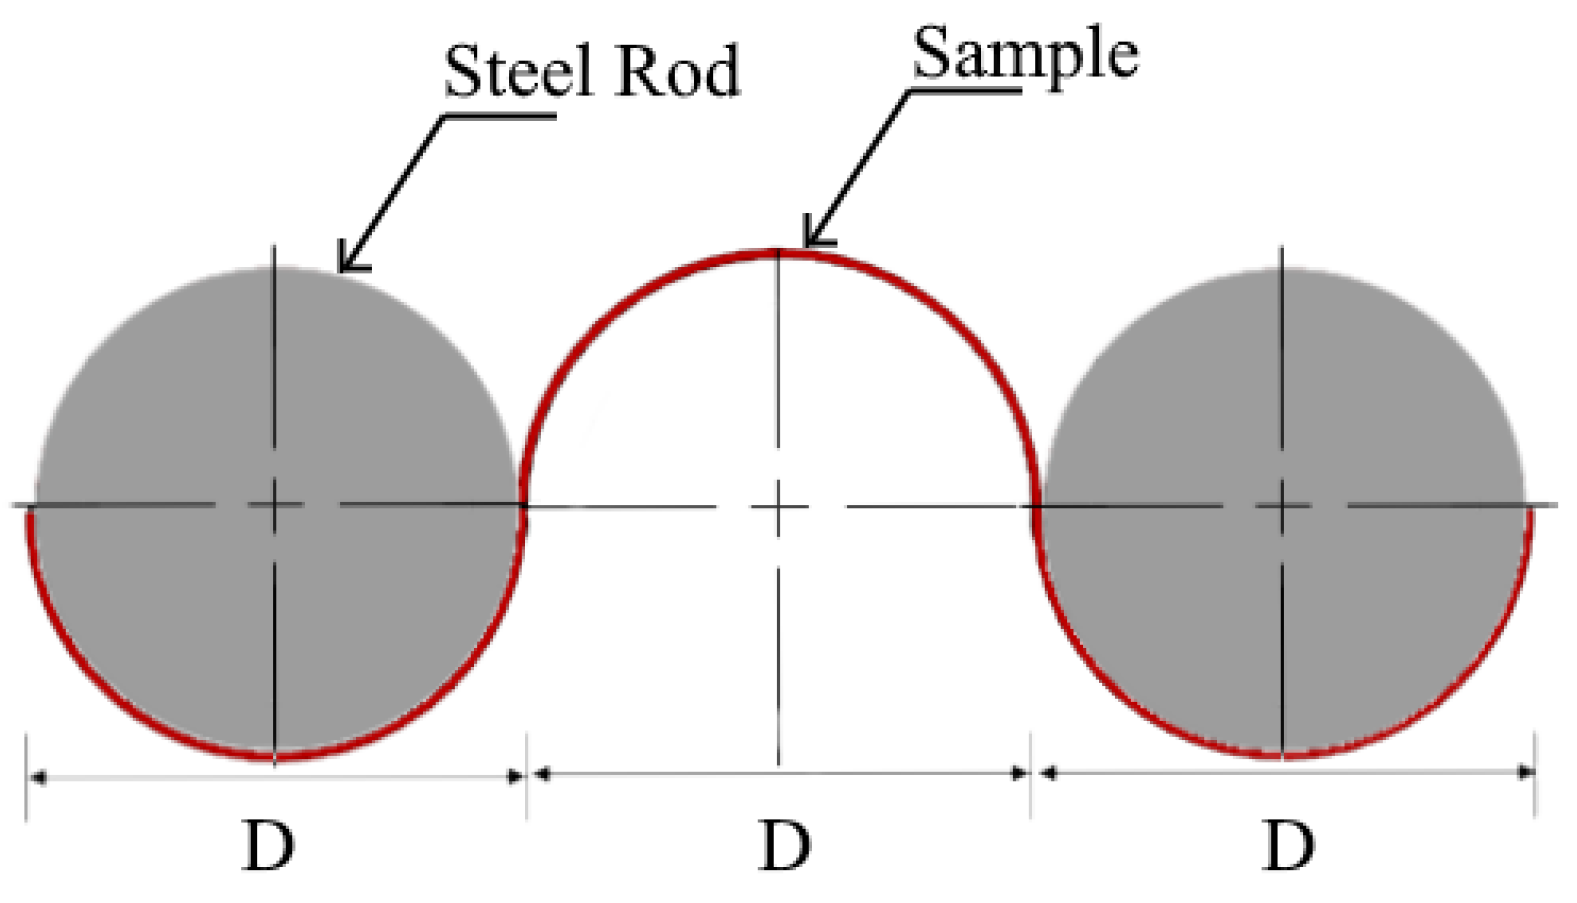
One of the main problems with the sample configuration in the previous section is its low stiffness. This type of sample is prone to buckling and may easily deform by exterior loads (e.g., effect of gravity in measurement instruments, such as shakers and accelerometers) that tamper with the test results. Thus, a novel sample configuration was designed to increase the stiffness in the sample and address these issues without the introduction of external pre-tension. According to Figure 3, Kraft paper samples were molded into a half-cane configuration with a 32.4 mm diameter (D), fixed (glued with epoxy resin) by two rigid steel rods (A304) with the same diameter. It is estimated that the half-cane configuration (I = 0.1098(R4 − r4) − 0.283R2r2(R − r)/(R + r)~393.23 mm4, where R and r are, respectively the major and minor radius of the sample) itself (i.e., excluding the effect of the steel rods) is able to significantly increase the moment of area, relative to the cantilever configuration (I = bh3/12~0.02 mm4, where b and h are, respectively the width and thickness of the beam).
A model of the testing apparatus for the half-cane approach is shown in Figure 4, in which the same acoustic excitation through a loudspeaker and displacement measurement by a Laser Döppler Vibrometer may be observed. Given the higher stiffness of this system (i.e., structural shape), it is expected that the eigenfrequencies are also higher; thus, the white noise was generated in the range of 40–2000 Hz. A total of 24 equidistant (14 mm) reflectors (3M Scotchlite Reflective Material SOLAS Grade 3150) with adhesive taping backs were glued to its 350 mm length.
Sound pressure was also monitored by a microphone (PCB Piezotronics 130E20), and data were recorded using a spectral analyzer (LMS Scadas Mobile) and analyzed referring to the LMS TestXPress V10 software. The real apparatus may be visualized in Figure 4. A total of five samples were tested using this configuration. The frequency response function of the individual samples was also combined into an average response of the multiple beams using the aforementioned software. To avoid result tampering due to external noise sources or room acoustic conditions, tests were conducted inside an anechoic chamber with temperatures and relative humidity of, respectively, 19–24 °C and 47–53%.
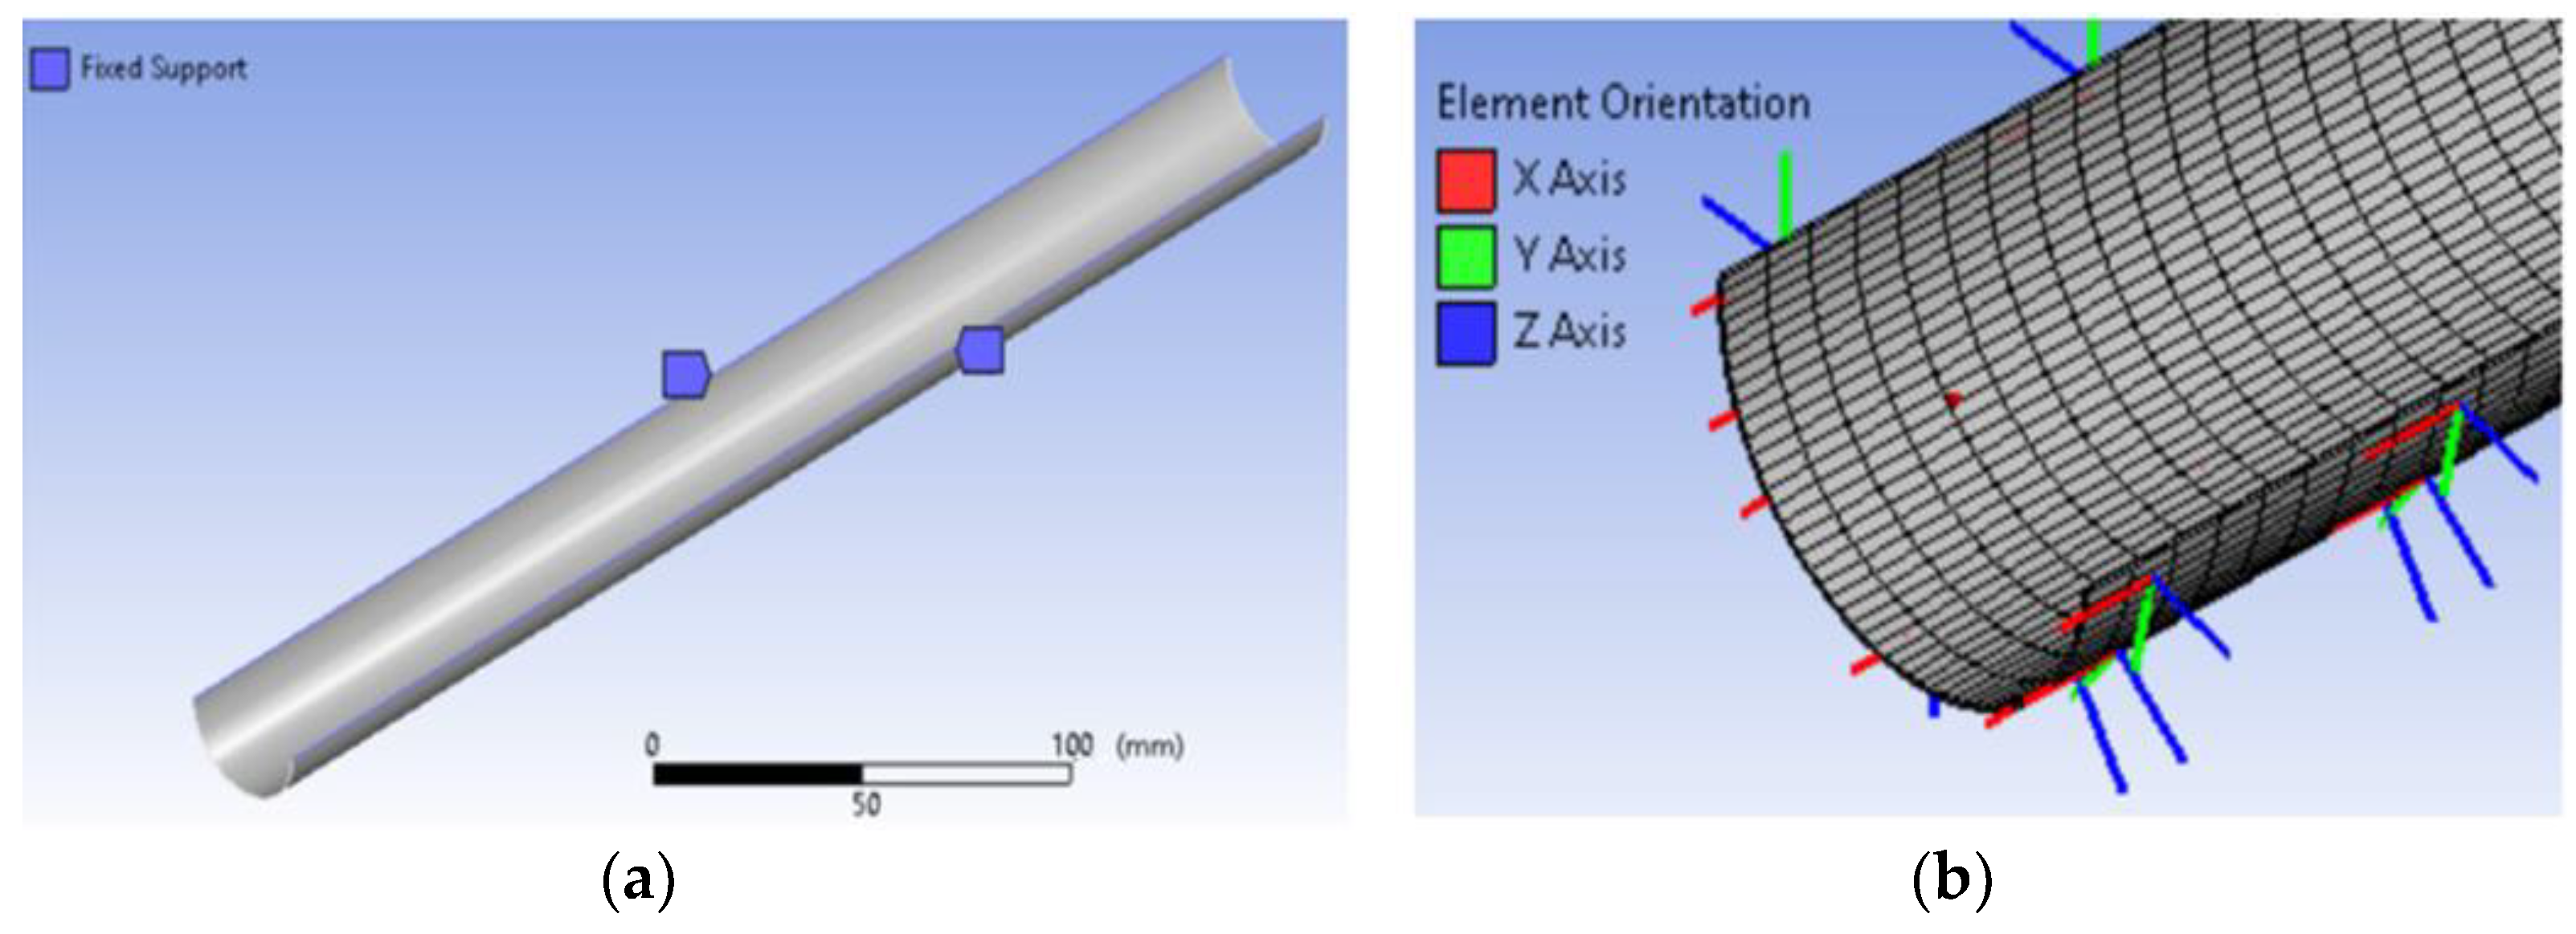
Given the complex shape of the half-cane configuration, the modal behavior was detailed using numerical simulations. The ANSYS 17. software 0 was used to design and simulate the modal behavior in the first four eigenmodes of these samples using, respectively, the Design Modeler and Modal Analysis modules. The virtual model (Figure 5a) was designed in accordance with the dimensions of the real sample, assuming that the base material is isotropic and elastic with a Poisson’s ratio of 0.2, a static Young’s modulus of 1.02 MPa, and a density of 602 kg/m3. While this value of modulus was used as an input for the first simulation and determining the shapes of the eigenmodes, the Young’s modulus was used as a variable in an updating process to correlate the experimental and numerical eigenfrequencies to determine the dynamic Young’s modulus of each mode.
According to Figure 5a, boundary conditions were introduced by fixing the lateral sides of the half-cane sample in its length direction. Meshing was optimized by discretizing the model with 0.1 × 0.5 mm2 SHELL181 elements, as shown in Figure 5b, as Nguyen et al. [25] showed that 2D elements are suited for this type of simulation.

3. Results and Discussion

3.1. Cantilever Beam Approach

According to the Euler–Bernoulli beam theory [13], the eigenfrequencies (ωn) and shapes of the eigenmodes (Wn(x)) of an isotropic and uniform cantilever beam (Figure 5) are described by Equations (1) and (2), where the term βn is correlated with a defined n eigenmode and is able to fulfill the condition in Equation (3).
ω n = ( β n l ) 2 E I z ρ A l 4
W n ( x ) = ( c o s β n x c o s h β n x ) c o s β n l + c o s h β n l s e n β n l + s e n h β n l ( s e n β n x s e n h β n x )
c o s β n l   c o s h β n l + 1 = 0
For a cantilever beam, Wn(x) of an isotropic and uniform cantilever beam (Figure 5) are described by Equations (2) and (3). The first three eigenmodes are described by the relations β1l = 1.875, β2l = 4.694, and β3l = 7.855. For n > 3 eigenmodes, the values of βnl may be determined using Equation (4).
β n l = ( n 0.5 ) π
For a cantilever with a rectangular cross-section with a thickness H, Equation (1) may be reorganized into Equation (5), allowing the estimation of the Young’s modulus (E) of the material in conformity with the E756-05 standard [26]. Cn is the dimensionless constant, related to the eigenmode n associated with the term βnl in Equation (6).
E = 12 ρ l 4 f n 2 H 2 C n 2
C n = ( β n l ) 2 2 π
From Equation (6), it is possible to determine that for the first three eigenmodes, C1 = 0.560, C2 = 3.507, and C3 = 9.819. For higher eigenmodes (i.e., n > 3), the values of Cn may be determined by Equation (7).
C n = ( n 0.5 ) 2 π 2
The analytical analysis of Equations (1)–(6) allows the estimation of the eigenfrequencies, shapes of the eigenmodes, and the dynamic (i.e., frequency-dependent) Young’s modulus of the samples. These values may be compared with the results of the proposed experimental procedure to assess its validity.
Figure 6 displays the average frequency response functions (FRFs) of the five cantilever beam samples that were excited by acoustic pressure and monitored by Laser Döppler Vibrometry. Based on these results, it is established that the samples have a good repeatability due to the high correlation of their results (R2 = 0.93).
The results portrayed in Figure 6 were used to determine the eigenfrequencies, and the experimental measurement of the amplitude in the measurement points was used to plot the shapes of the eigenmodes. These were also correlated with the shapes of the eigenmodes predicted by the analytic analysis and are combined in Table 1.
By the comparison between the experimental and analytical shapes, it may be observed that they can be correlated for n = 2 to 4. The first mode, however, could not be visualized in the experimental approach. This is due to the loudspeaker’s physical inability to excite frequencies lower than 40 Hz.
Based on the experimental eigenfrequencies of the cantilever samples, the values of the dynamic Young’s modulus could be determined by an inverse engineering approach using Equation (5), as presented in Table 2.

3.2. Optimized Half-Cane Sample Approach

An attempt to increase the overall eigenfrequencies in low-stiffness samples was performed by changing their geometry into a half-cane configuration (see Figure 3 and Figure 4). Figure 7 shows the average FRF of the five tested samples, in which a high correlation was assured between the specimens (R2 = 0.91).
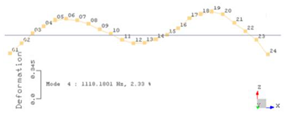
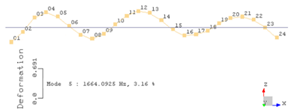
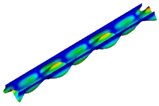
This analysis allowed the extraction of the eigenfrequencies of the half-cane samples, according to Table 3. It is shown that the change of the sample geometry was an effective route to increase the overall eigenfrequencies of the system (e.g., comparing second to fourth eigenmodes in Table 1 and Table 3). Given the more complex geometry of the samples, relative to the cantilever beam configuration, the numerical simulations were used to correlate the monitored experimental eigenfrequencies with their correct eigenfrequency and, more importantly, determine if it was possible to excite the first eigenmode using this approach.
The comparison of the experimental and numerical eigenfrequencies shows that there is a high correlation between the two methods (R2 = 0.99). It may be seen that due to the increase in sample stiffness, the first eigenmode was able to be excited by the loudspeaker.
A final validation of the correlation between the experimental and numerical analysis was performed by the comparison between the resultant eigenmode shapes (Table 4). While it is apparent that the shapes obtained by the two methods are the same, the Modal Assurance Criterion (MAC) matrix in Figure 8 shows that there is an excellent correlation to the results of both methods.
Additionally, Table 3 displays the values of the dynamic Young’s modulus that were obtained by inverse engineering using an updating approach (i.e., correlating experimental and numerical eigenfrequencies with the Young’s modulus as a variable). Comparing these values with those calculated for the cantilever approach (Table 2), it is determined these tend to slightly increase (i.e., increase stiffness) as frequency is also increased.

3.3. Considerations on the Method for the Determination of Dynamic Young’s Modulus

It has been established that acoustic pressure may be successfully used to excite samples with low stiffness and low mass, and Laser Döppler Vibrometry is an efficient route to measure the amplitude in the samples. The use of a half-cane geometry is also essential to increase the stiffness of samples so they may be fully characterized in terms of modal analysis.
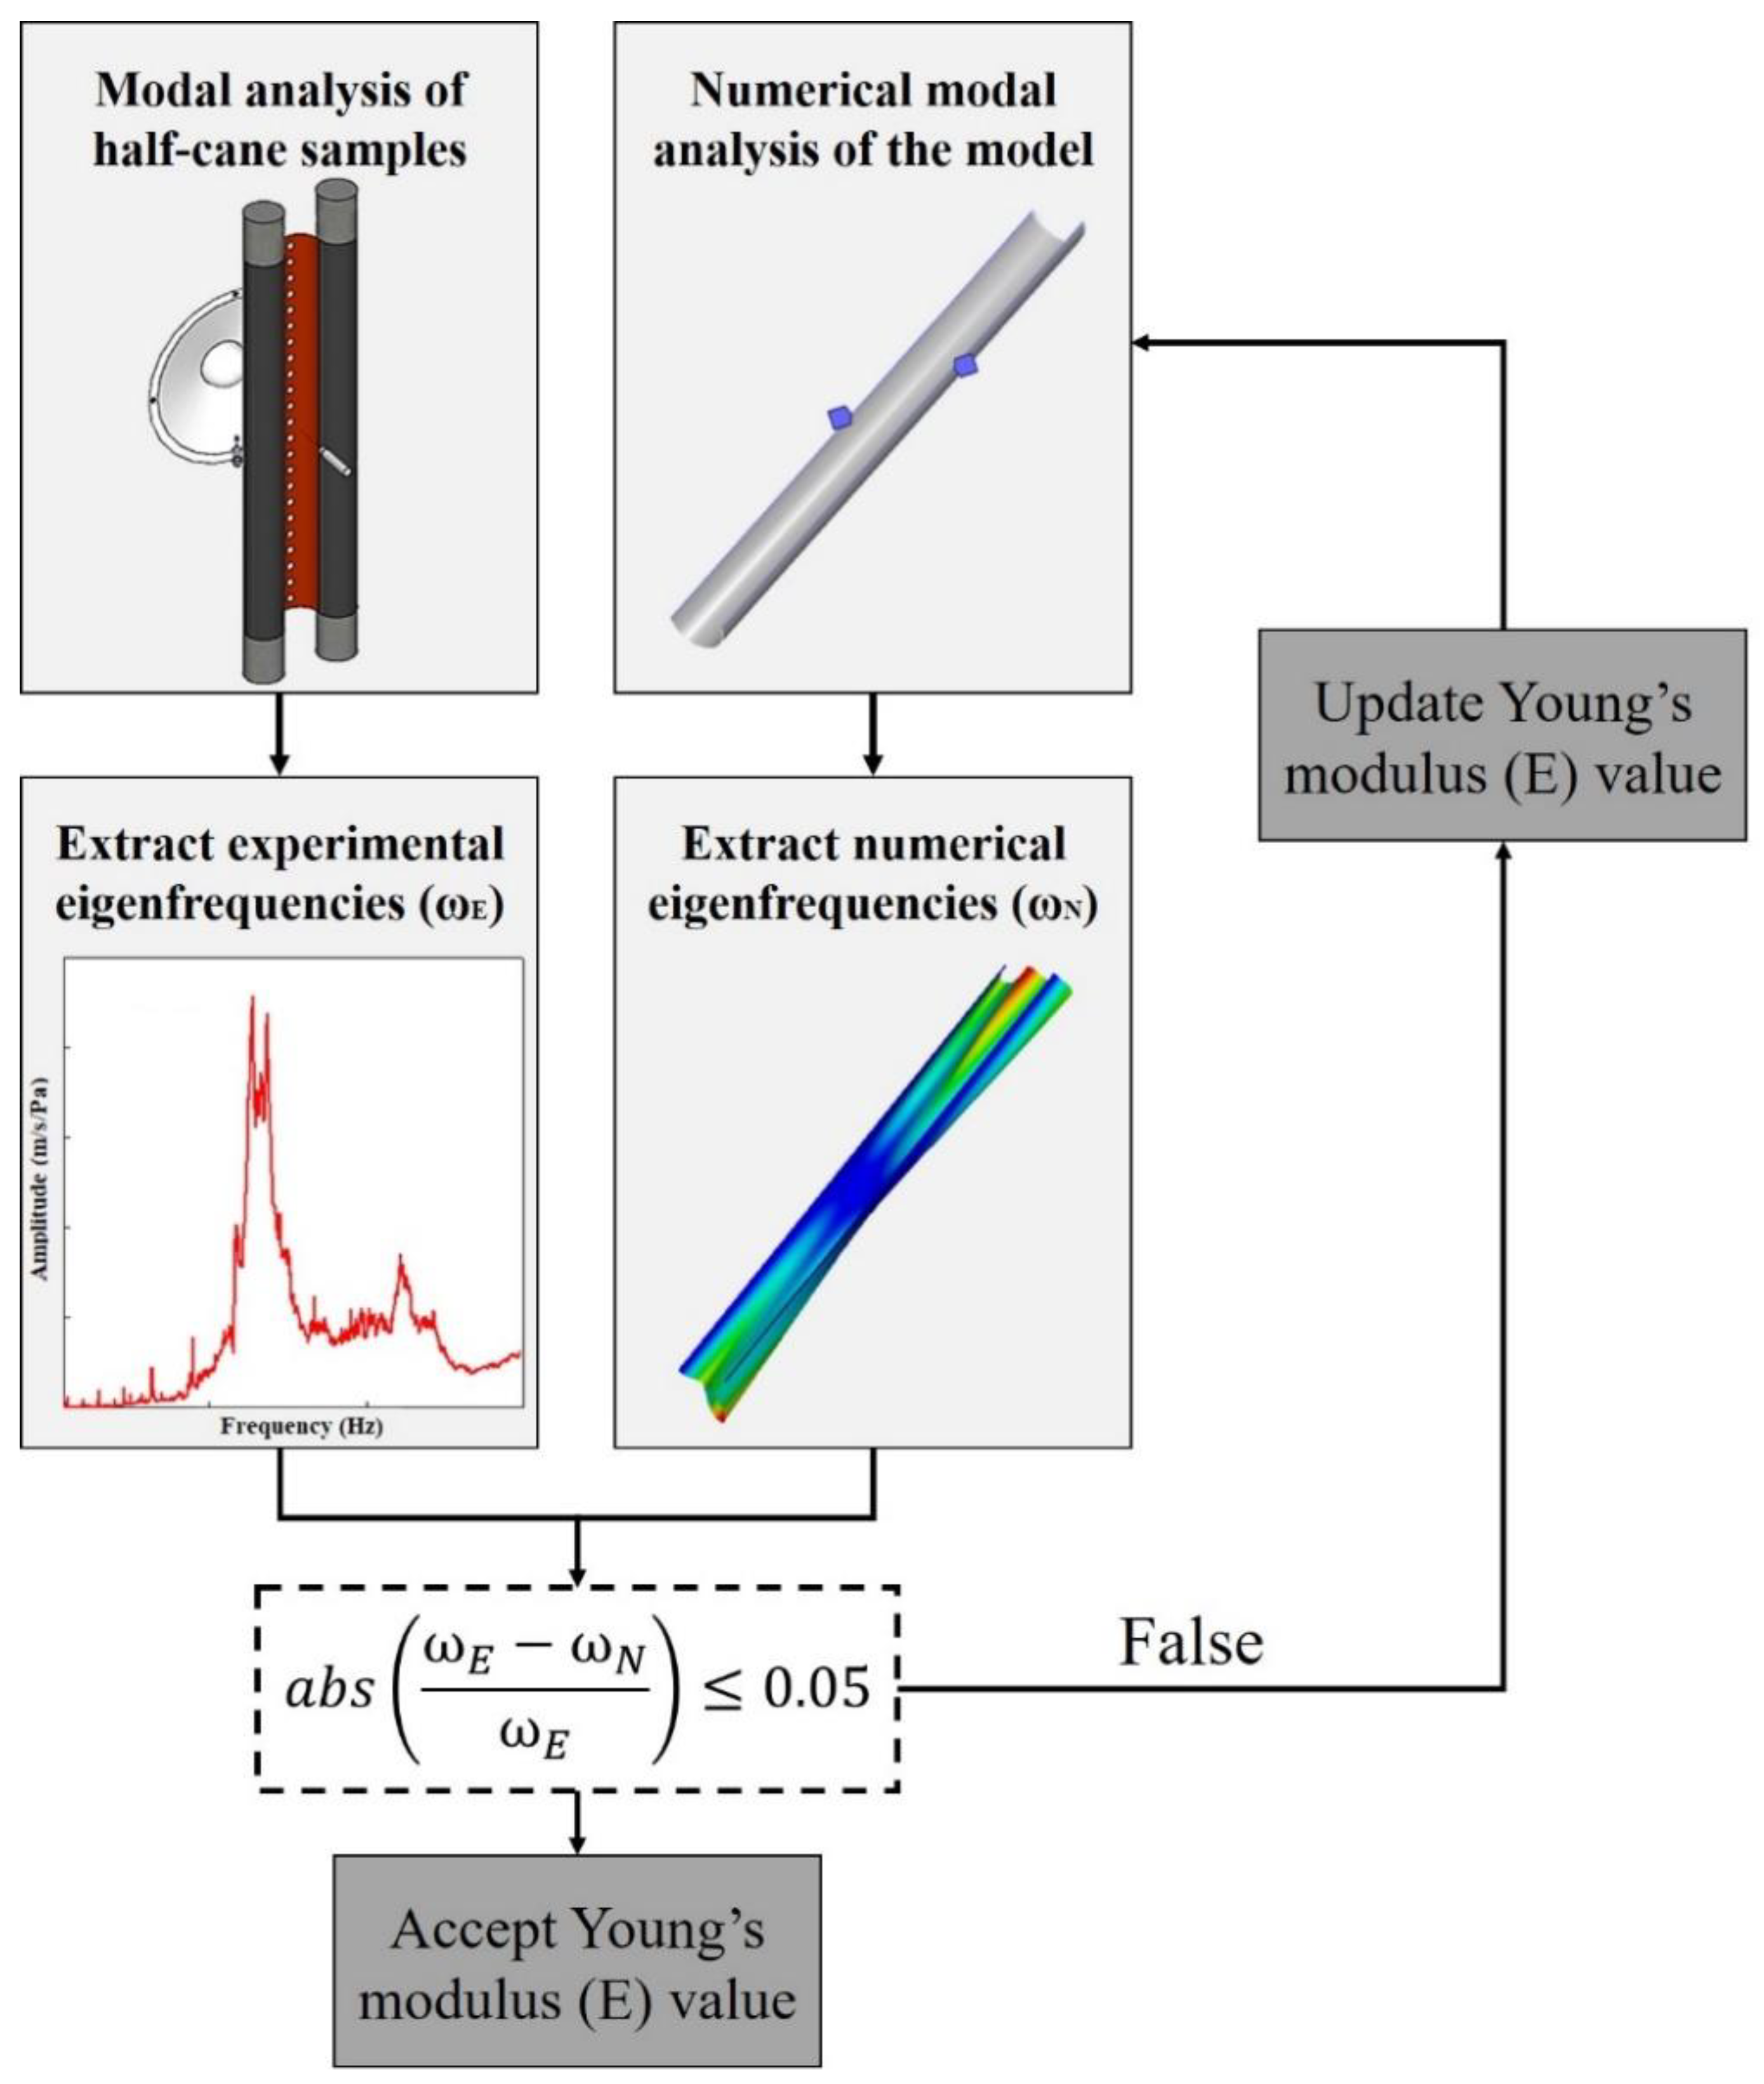
This also allows the coupling of the developed method with numerical routines, such as modal analysis by finite-element analysis, to estimate the dynamic Young’s modulus of membranes with low mass and low stiffness. Therefore, the combination of all these details generates the approach detailed in the flowchart from Figure 9.

4. Discussion

This study shows the development of a methodology to characterize the dynamic behavior and determine the dynamic Young’s modulus in compliant materials. While the latter are inherently difficult to characterize, due to their tampered response in regular testing techniques (e.g., using accelerometers and shakers), it is found that their behavior may be captured by the use of acoustic excitation coupled with Laser Döppler Vibrometry.
The method may, however, be optimized by changing the geometry of the samples. Given the difficulty in exciting low frequencies by acoustic sources (in this study, below 40 Hz), it is found that it is possible to promote excitation of the first eigenfrequency by testing samples with a half-cane configuration. This significantly enhances the stiffness of the tested sample and increases the first eigenfrequency into a range, which may be easily excited.
It is also shown that numerical routines display highly correlated results in the proposed method. Numerical eigenfrequencies that use the dynamic (i.e., frequency-dependent) Young’s modulus as an input have been validated by a MAC matrix, meaning that the coupling of numerical analysis with the proposed method may also be performed. A novel methodology is proposed for that effect, being a future useful tool to determine the dynamic Young’s modulus in these types of materials.

Author Contributions

Conceptualization, A.R., J.M. and O.I.; methodology, A.R. and J.M.; software, J.M.; validation, J.M. and O.I.; formal analysis, A.R.; investigation, A.R.; resources, J.M. and O.I.; data curation, A.R.; writing—original draft preparation, A.R.; writing—review and editing, A.R., J.M. and O.I.; visualization, A.R.; supervision, J.M. and O.I. All authors have read and agreed to the published version of the manuscript.

Funding

This research received no external funding.

Informed Consent Statement

Not applicable.

Data Availability Statement

The data presented in this study are available on request from the corresponding author. The data are not publicly available due to being part of an ongoing study.

Conflicts of Interest

The authors declare no conflict of interest.

References

  1. Xiao, W.; Xu, Z.; Bian, H.; Li, Z. Lightweight Heavy-Duty CNC Horizontal Lathe Based on Particle Damping Materials. Mech. Syst. Signal Process. 2021, 147, 107127. [Google Scholar] [CrossRef]
  2. Wang, L.; Li, J.; Yang, Y.; Wang, J.; Yuan, J. Active Control of Low-Frequency Vibrations in Ultra-Precision Machining with Blended Infinite and Zero Stiffness. Int. J. Mach. Tools Manuf. 2019, 139, 64–74. [Google Scholar] [CrossRef]
  3. Gharaibeh, M.A. A Numerical Study on the Effect of the Fixation Methods on the Vibration Fatigue of Electronic Packages. Microelectron. Reliab. 2020, 115, 113967. [Google Scholar] [CrossRef]
  4. Nadkarni, I.; Bhardwaj, R.; Ninan, S.; Chippa, S.P. Experimental Modal Parameter Identification and Validation of Cantilever Beam. Mater. Today Proc. 2020. [Google Scholar] [CrossRef]
  5. Pereira, D.A.; Guimarães, T.A.M.; Resende, H.B.; Rade, D.A. Numerical and Experimental Analyses of Modal Frequency and Damping in Tow-Steered CFRP Laminates. Compos. Struct. 2020, 244, 112190. [Google Scholar] [CrossRef]
  6. Carneiro, V.H.; Puga, H. Temperature Variability of Poisson’s Ratio and Its Influence on the Complex Modulus Determined by Dynamic Mechanical Analysis. Technologies 2018, 6, 81. [Google Scholar] [CrossRef] [Green Version]
  7. Menard, K.P. Dynamic Mechanical Analysis: A Practical Introduction; CRC Press: Boca Raton, FL, USA, 2008; ISBN 1-4200-5313-2. [Google Scholar]
  8. Pandiripalli, B. Repeatability and Reproducibility Studies: A Comparison of Techniques; Wichita State University: Wichita, KS, USA, 2010. [Google Scholar]
  9. Witos, M. Modal Analysis as a High Sensitive NDT Method of Compressor Blades; NDT: Prague, Czech Republic, 2015; pp. 12–14. [Google Scholar]
  10. Hu, H.; He, Z.; Zhang, Y.; Gao, S. Modal Frequency Sensitivity Analysis and Application Using Complex Nodal Matrix. IEEE Trans. Power Deliv. 2013, 29, 969–971. [Google Scholar] [CrossRef]
  11. Ege, K.; Boutillon, X.; David, B. High-Resolution Modal Analysis. J. Sound Vib. 2009, 325, 852–869. [Google Scholar] [CrossRef] [Green Version]
  12. Amraoui, Y.M.; Lieven, N.A.J. Noncontacting Excitation and Measurement of Light Structures. J. Vib. Acoust. 2003, 125, 114–119. [Google Scholar] [CrossRef]
  13. Rao, S.S. Vibration of Continuous Systems; Wiley Online Library: Hoboken, NJ, USA, 2007; Volume 464. [Google Scholar]
  14. Carneiro, V.H.; Lopes, D.; Puga, H.; Meireles, J. Numerical Inverse Engineering as a Route to Determine the Dynamic Mechanical Properties of Metallic Cellular Solids. Mater. Sci. Eng. A 2020, 140428. [Google Scholar] [CrossRef]
  15. Chomette, B.; Le Carrou, J.-L. Operational Modal Analysis Applied to the Concert Harp. Mech. Syst. Signal Process. 2015, 56–57, 81–91. [Google Scholar] [CrossRef]
  16. Lafleur, F.; Thomas, M.; Laville, F. Modal Analysis of Structures Using Acoustical Excitation; Internoise: Nice, France, 2000. [Google Scholar]
  17. Bokil, V.B.; Shirahatti, U.S. A Technique for the Modal Analysis of Sound-Structure Interaction Problems. J. Sound Vib. 1994, 173, 23–41. [Google Scholar] [CrossRef]
  18. Wu, J.; Moslehy, F.A. On Modal Testing Using Speaker for Excitation; SPIE: Bellingham, WA, USA, 1995; Volume 2460, p. 24. [Google Scholar]
  19. Xu, Y.F.; Zhu, W.D. Operational Modal Analysis of a Rectangular Plate Using Non-Contact Excitation and Measurement. J. Sound Vib. 2013, 332, 4927–4939. [Google Scholar] [CrossRef]
  20. Roozen, N.B.; Leclère, Q.; Urbán, D.; Kritly, L.; Glorieux, C. Assessment of the Sound Reduction Index of Building Elements by near Field Excitation through an Array of Loudspeakers and Structural Response Measurements by Laser Doppler Vibrometry. Appl. Acoust. 2018, 140, 225–235. [Google Scholar] [CrossRef]
  21. Urbán, D.; Roozen, N.B.; Muellner, H.; Zaťko, P.; Niemczanowski, A.; Rychtáriková, M.; Glorieux, C. Vibrometry Assessment of the External Thermal Composite Insulation Systems Influence on the Façade Airborne Sound Insulation. Appl. Sci. 2018, 8, 703. [Google Scholar] [CrossRef] [Green Version]
  22. Satthiyaraju, M.; Ramesh, T. Modal Analysis of Microcantilever Using Vibration Speaker. In Proceedings of the 2016 COMSOL Conference, Munich, Germany, 12–14 October 2016. [Google Scholar]
  23. Bukhari, S.A.; Goswami, A.; McGee, R.; Abraham, R.; Hume, D.; Chung, H.J.; Thundat, T. Bidirectional Frequency Tuning of Vanadium Dioxide (VO 2) Microstring Resonator by Optothermal Excitation; IEEE: New York, NY, USA, 2020; pp. 961–964. [Google Scholar]
  24. Adriana, G.; Jussi, L.; Robert, S.; Franz, S. Humidity Response of Kraft Papers Determined by Dynamic Mechanical Analysis. Thermochim. Acta 2013, 570, 33–40. [Google Scholar] [CrossRef]
  25. Nguyen, D.H.; Ho, L.V.; Bui-Tien, T.; De Roeck, G.; Wahab, M.A. Damage Evaluation of Free-Free Beam Based on Vibration Testing. Appl. Mech. 2020, 1, 10. [Google Scholar] [CrossRef]
  26. Standard, A. Standard Test Method for Measuring Vibration-Damping Properties of Materials; E756-05; ASTM: West Conshohocken, PA, USA, 2010. [Google Scholar]
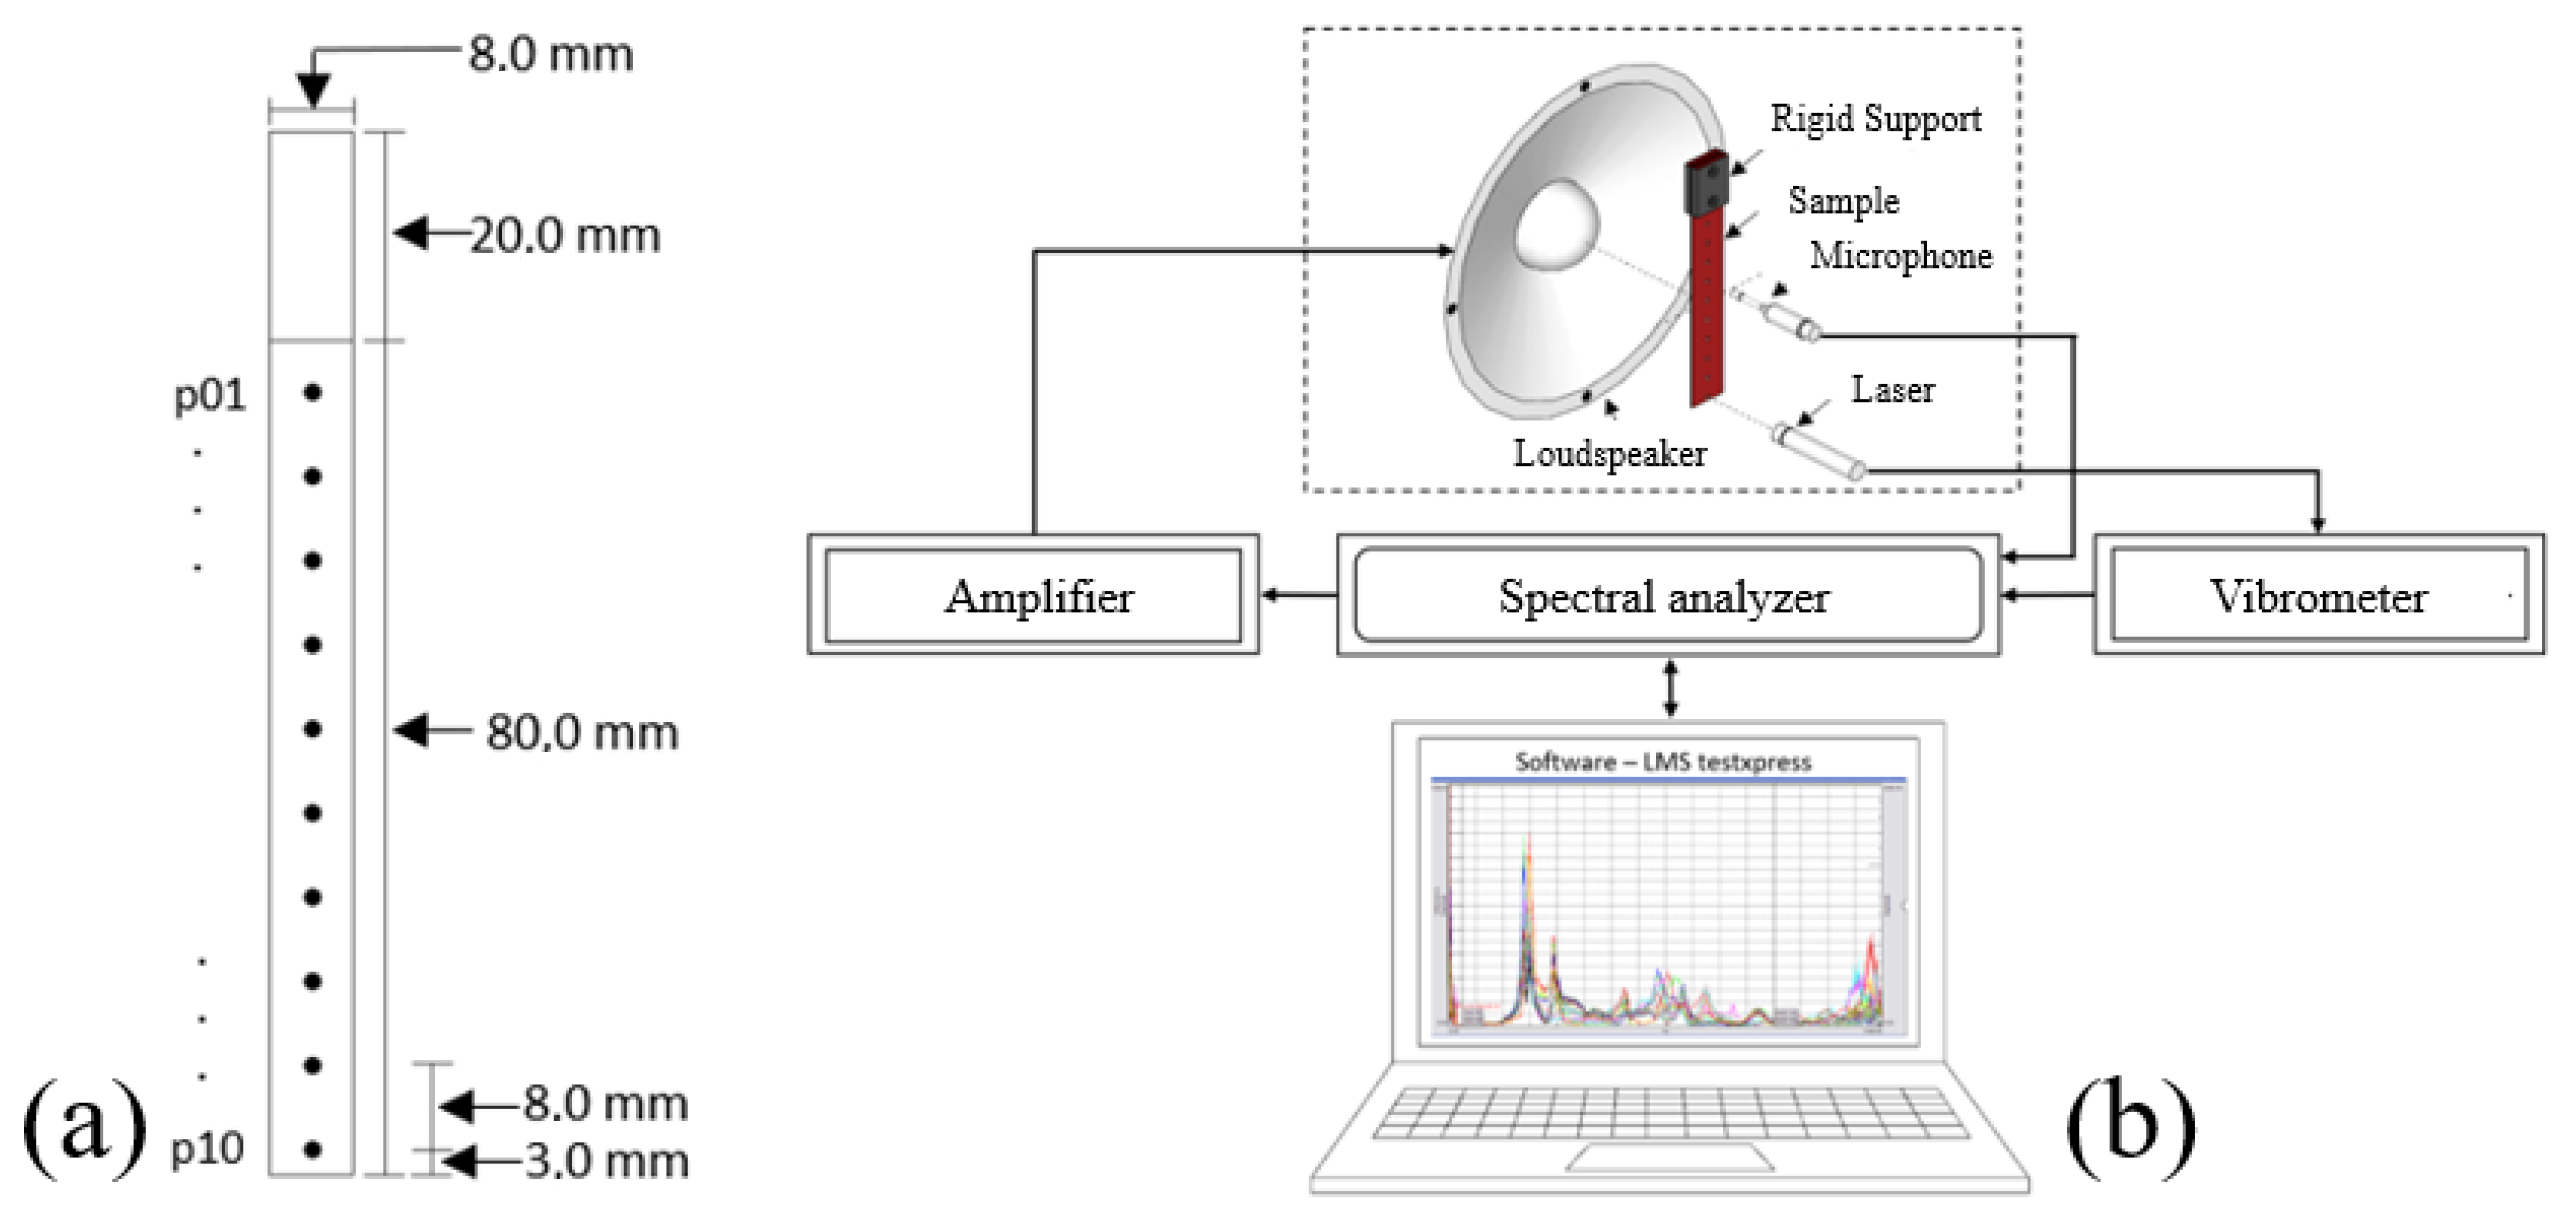
Figure 1. Detail of (a) samples and (b) instrumentation for cantilever beam modal analysis.
Vibration 04 00005 g001
Figure 2. Experimental apparatus for the testing of cantilever beam samples detailing sample cantilever sample fixation, loudspeaker excitation, and measurement instrumentation.
Vibration 04 00005 g002
Figure 3. Design of the half-cane configuration to increase membrane stiffness detailing the geometrical details and fixation to steel rods.
Vibration 04 00005 g003
Figure 4. Experimental apparatus for the half-cane sample test detailing the method design and instrumentation.
Vibration 04 00005 g004
Figure 5. Detail of the numerical model showing the (a) boundary conditions and (b) meshing.
Vibration 04 00005 g005
Figure 6. Frequency response function (FRF) of five cantilever beams with three eigenfrequencies (59 Hz, 161 Hz, and 321 Hz).
Vibration 04 00005 g006
Figure 7. Frequency response function (FRF) of five half-cane specimens with five eigenfrequencies (635 Hz, 675 Hz, 1118 Hz, and 1664 Hz).
Vibration 04 00005 g007
Figure 8. Modal Assurance Criterion (MAC) matrix comparing the results from the experimental and numerical approaches.
Vibration 04 00005 g008
Figure 9. Flowchart for the proposed inverse engineering procedure to determine the dynamic Young’s modulus in compliant materials.
Vibration 04 00005 g009
Table 1. Experimental eigenfrequencies and comparison with analytical eigenmodes.
EigenmodeExperimental Eigenfrequency (Hz)Shape
ExperimentalAnalytical
1N.A.N.A. Vibration 04 00005 i001
259 ± 2 Vibration 04 00005 i002 Vibration 04 00005 i003
3161 ± 3 Vibration 04 00005 i004 Vibration 04 00005 i005
4321 ± 4 Vibration 04 00005 i006 Vibration 04 00005 i007
Table 2. Experimental dynamic Young’s modulus.
EigenmodeDynamic Young’s Modulus (MPa)
20.782 ± 0.003
30.813 ± 0.002
40.821 ± 0.005
Table 3. Comparison between experimental and numerical eigenfrequencies in half-cane samples.
EigenmodeEigenfrequency (Hz)
ExperimentalNumericalΔ—Variation (%)Dynamic Young’s Modulus (MPa)
1635 ± 3683−4.60.832
2675 ± 3710−5.20.837
31118 ± 1410476.40.842
41664 ± 2216560.50.861
Table 4. Comparison between experimental and numerical eigenmode shapes in half-cane samples.
EigenmodeShape
ExperimentalNumerical
1 Vibration 04 00005 i008 Vibration 04 00005 i009
2 Vibration 04 00005 i010 Vibration 04 00005 i011
3 Vibration 04 00005 i012 Vibration 04 00005 i013
4 Vibration 04 00005 i014 Vibration 04 00005 i015
Publisher’s Note: MDPI stays neutral with regard to jurisdictional claims in published maps and institutional affiliations.