Article

Frequency Measurement of Musical Instrument Strings Using Piezoelectric Transducers

by
Nicolas Lynch-Aird
1,*,† and
Jim Woodhouse
2,†
1
The Old Forge, Burnt House Lane, Battisford, Suffolk IP14 2ND, UK
2
Department of Engineering, University of Cambridge, Trumpington St, Cambridge CB2 1PZ, UK
*
Author to whom correspondence should be addressed.
The authors contributed equally to this work.
Vibration 2018, 1(1), 3-19; https://doi.org/10.3390/vibration1010002
Submission received: 28 November 2017 / Revised: 18 December 2017 / Accepted: 9 January 2018 / Published: 13 January 2018

Abstract

:
The use of a piezoelectric transducer to monitor the tuning of a musical instrument string has been investigated. It has been shown that the transverse resonance frequencies of the string can be identified by electrical measurements on a low-cost actuator/sensor, sufficiently discreetly to be done during a performance. This frequency measurement approach can be used as the basis for a tuning control mechanism to maintain a musical instrument string at the required pitch, without it having to be plucked or played. Such a system would be of direct benefit to harp players in particular, who have no other means to adjust a mistuned string during a performance. Some of the practical issues and implications of adding such a tuning control system to the harp are considered.

1. Introduction

Stringed instruments are sensitive to temperature and humidity changes. In particular, plain gut or nylon strings on a harp can be sufficiently sensitive to environmental changes as to become noticeably out of tune during the course of a performance. For instruments like the violin, the player can make corrections by changing their fingering. For open-string instruments such as the harp, though, the player can only wait for a break in the music to retune an errant string.
Automated string tuning systems have been developed [1,2], but these generally require the instrument to be switched into a specific tuning mode, with the string being plucked or struck in order to generate a tone that can be compared with the required musical pitch. A motor is then used to adjust the string tension as necessary. Even if such a system were adapted for use during a performance, it would not help with the situation where the string is already noticeably out of tune when it next comes to be played. Furthermore, any such system will always require multiple tuning iterations for each string because the adjustment scaling factor, used to convert the measured tuning error into the required string winding adjustment, will never be known exactly.
A study of the mechanical properties of centreless-ground (“rectified”) nylon harp strings has shown that holding such strings at a constant tension may be enough to keep them acceptably in tune [3]. Many players, however, prefer natural gut strings, which are much more sensitive to changes in humidity and can change in unpredictable ways: on the same instrument, a given gut string may go sharp while an adjacent string goes flat. Ideally, a tuning control scheme needs some way of measuring the pitch of a string without the need for that string to be plucked and without making an audible noise that would disrupt a performance going on around the instrument. Tuning corrections could then be made repeatedly, and discreetly, maintaining the string at the correct pitch and ready for use.
The simplest way to monitor an individual string, without interfering with its playing properties, is to make the necessary measurements at one or other of the string’s terminations. Some kind of actuator would be used to apply a low-level mechanical input, and some kind of sensor would measure the response. Ideally, these functions would be combined in the same device, which would also be inexpensive and robust. Such a system is described and tested in this paper, based on a low-cost piezoelectric disc transducer. Electric and electro-acoustic harps often use piezoelectric pickups, with each string passing over a separate pickup at the point where the string meets the soundboard. However, these pickups have a different structure from the transducer used here, and it will be demonstrated in Section 4.7 that they are less effective for the purposes of monitoring tuning in the manner explored here.
As well as exploring the ability to measure the string pitch, the study also investigates the effects of varying the string stress and the use of different drive levels. An approximate theoretical model is developed and compared with measurements; and the performance of a possible tuning system is demonstrated. Finally, some consideration is also given to other possible pitch measurement approaches based on the use of piezoelectric transducers.

2. Methods and Materials

2.1. Test Rig

A simple test rig (Figure 1) was constructed on which a string could be mounted approximately 13 mm above a wooden baseboard. A motorised string winder was mounted at one end of the string, allowing precise string length adjustments to be made when required. From the winding shaft, the string passed a fixed vertical bridge pin 5.5 mm in diameter. At its other end the string passed over a small bridge resting on the piezoelectric transducer, and then sloped down to a clamping point on the baseboard. The bridge consisted of a semi-cylindrical steel spacer, 4 mm in length, holding the string about 2.5 mm above the transducer disc. The mass of the spacer was about 0.2 g. The termination points at each end of the vibrating length of string (the vertical bridge pin and the horizontal spacer) were set at 90° to each other so that the effective vibrating length of the string was not affected by the polarisation direction of the transverse vibration [3,4].
The string used for these tests was a centreless-ground nylon string from the Bowbrand “Pedal Nylon” range, with an unstretched diameter of 0.84 mm and an unstretched linear density of 0.593 g/m. The string vibrating length L between the vertical bridge pin and the piezoelectric transducer was 223 mm. The length of the string tail section, from the piezoelectric transducer down to the end clamp attached to the baseboard, was 66 mm, with a break angle of about 3°.
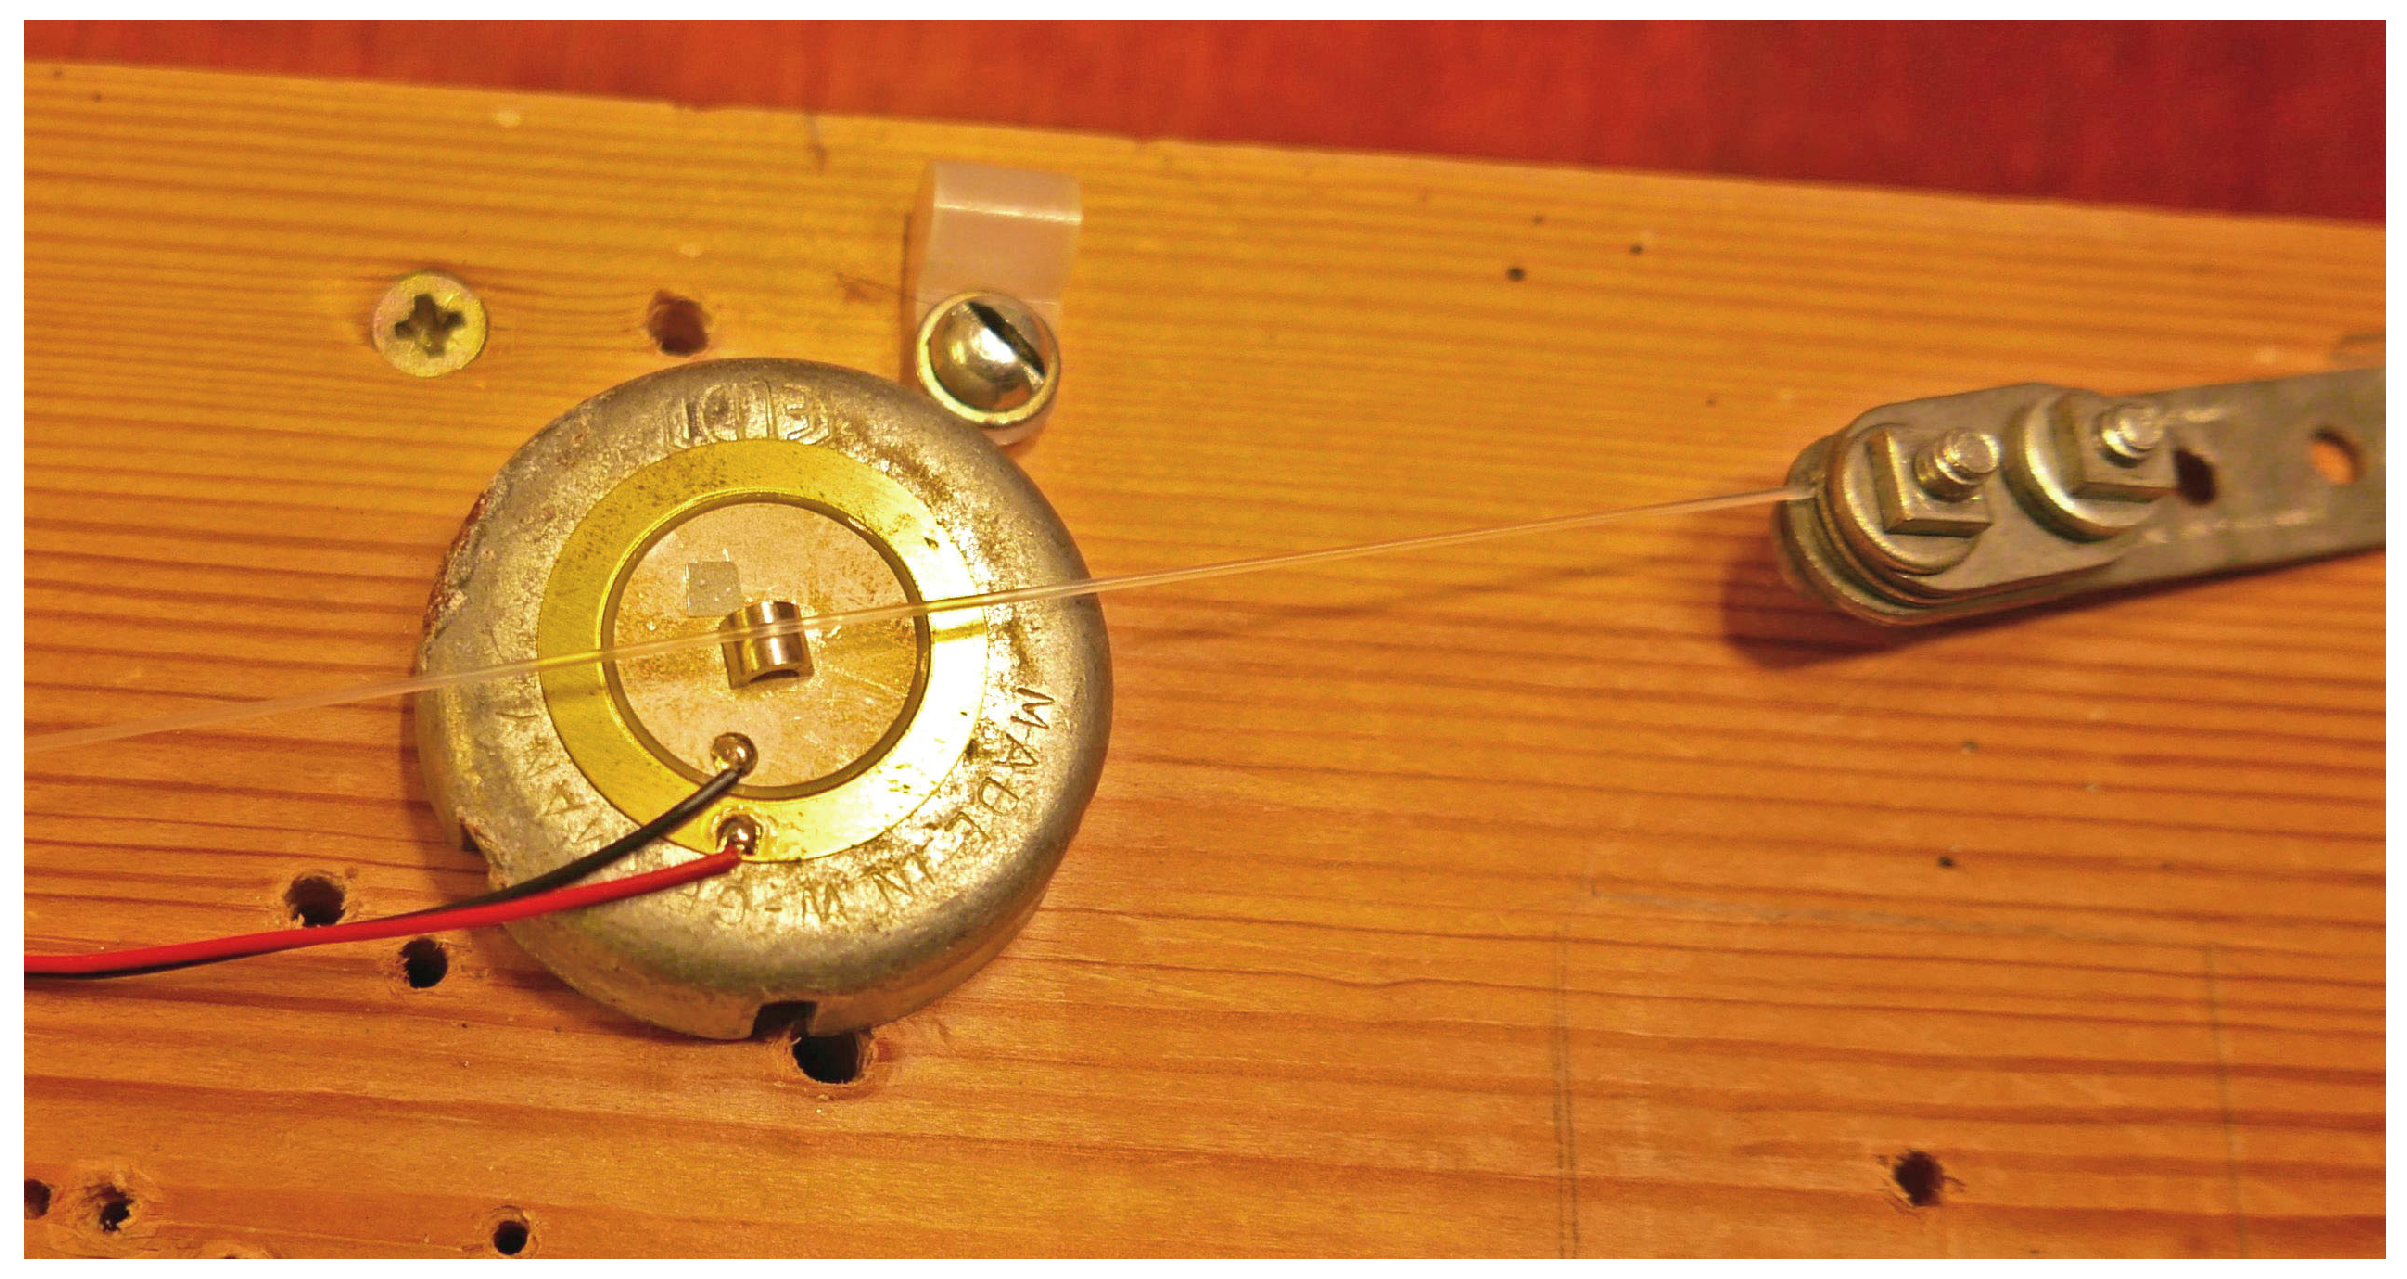
For the main tests to be described, the transducer used was a low-cost disc unit marketed as a piezoelectric sounder (Maplin QY13P [5]). This consists of a circular metal base plate 27 mm in diameter and 0.3 mm thick, with a piezoelectric disc 20 mm in diameter and 0.2 mm thick bonded to one face. The base plate forms one electrode, while a thin metal coating on the other side of the piezoelectric disc provides the second electrode. This type of transducer is designed so that the piezoelectric layer contracts or expands radially in response to an applied electrical voltage, causing the base plate to bend in an axisymmetric manner: it ‘domes’ in and out, similar to the fundamental mode of vibration of a circular diaphragm. To allow this motion to occur unimpeded, the transducer was supported on an annular cup washer with a cavity under most of the base plate. Direct measurements with a laser-Doppler vibrometer confirmed that the transducer did indeed move in the expected direction, normal to the plane of the base plate [6]. Figure 2 shows the piezoelectric transducer mounted on its annular washer, with the string running over the semi-cylindrical spacer positioned in the centre of the top electrode.
Following an initial series of investigations, the test rig was left for a period of about six months prior to taking the set of measurements reported here. This had the advantage of allowing plenty of time for the string to settle. While variations in the string tension and frequency could be expected to result from changes in the ambient temperature [3], the string was (at least for the purpose of these tests) no longer creeping. To take advantage of this stability, the test sequence was organised to complete as many measurements as possible before making any tuning adjustments.

2.2. Electrical Measurements

In operation, a sinusoidal voltage was applied to the transducer, producing normal motion which drove the string into vibration. That vibration resulted in a reaction force at the bridge, causing additional axisymmetric bending motion in the base plate of the transducer (which acts as a spring). This in turn produced strain in the piezoelectric layer, which has the effect of modulating the capacitance of the piezoelectric transducer. This modified capacitance can be monitored via an electrical measurement.
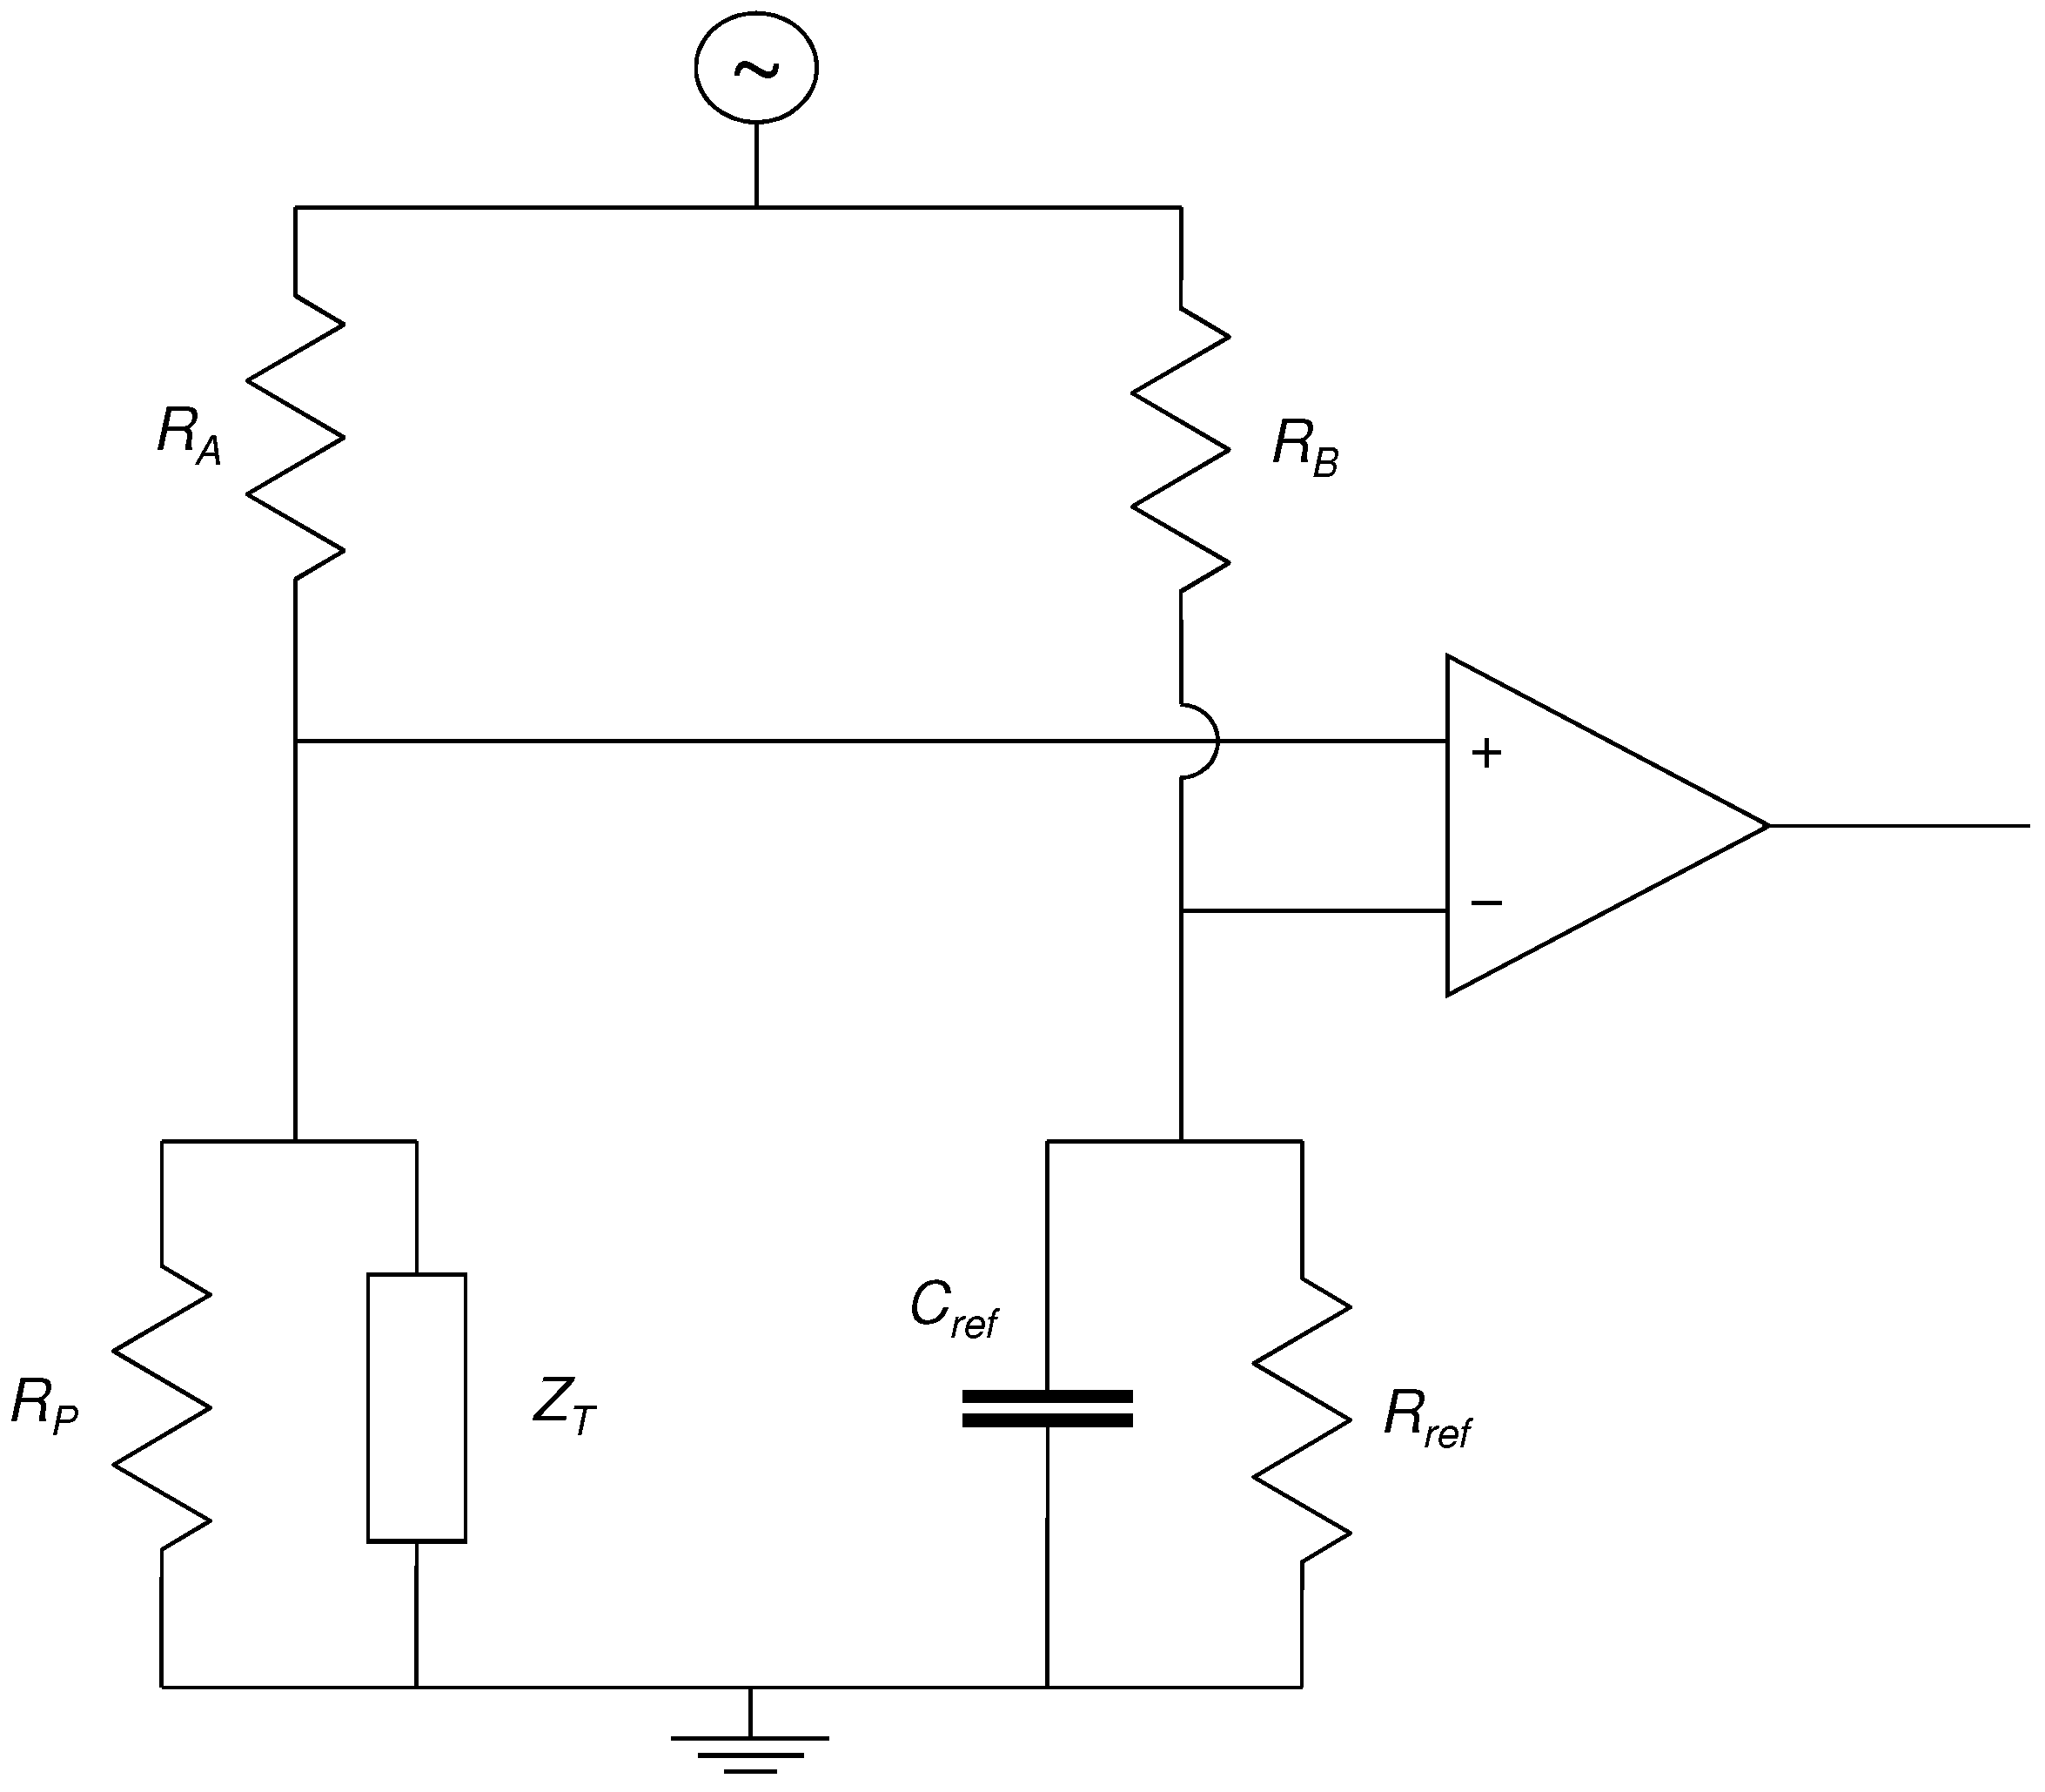
The electrical impedance Z T of the piezoelectric transducer was measured as a function of frequency using the bridge circuit shown in Figure 3. In order to select the reference capacitance C r e f , some idea of the transducer capacitance was required. Initial measurements were made using a home-built capacitance meter which applied positive and negative voltage steps, via a reference resistor, and measured the rise and fall times of the voltage across the capacitance. This had a test cycle frequency of about 42 Hz, so the values obtained should be close to the DC capacitance for the piezoelectric transducer. Using this approach gave a capacitance of around 23–24 nF when the transducer was removed from the rig and able to move freely. The reference impedance for the other arm of the bridge was therefore selected to be a capacitor of about the same size, with a nominal value of 22 nF, and a measured value (using the same capacitance meter) of 26 nF.
For the intended test frequency range the impedance of both the test and reference capacitors was expected to be in the region of 10 k Ω . The resistive elements of the bridge, R A and R B , were chosen accordingly. To allow easy exploration of the effects of variations in the bridge balance, these two components were provided using a single 20 k Ω linear potentiometer. The instrumentation amplifier used for measuring the voltage difference across the bridge (Texas Instruments INA121P) was chosen for its very high input impedance ( 10 12 Ω ) and the ability to set its gain using a single external resistor. A bias current path to ground was required for each input, and two 10 M Ω resistors, R P and R r e f , were included for that purpose. A second instrumentation amplifier was connected directly across the piezoelectric transducer for use in recording manual pluck responses from the string. The plucks were made using a plastic guitar plectrum.
A two-channel digital oscilloscope and function generator (Velleman PCSGU250) was used both to provide the input signal to the impedance bridge, and to measure and record the output. While having limited input resolution and sampling duration, this low-cost unit had the advantage of being straightforward to operate under software control. One oscilloscope channel was used to measure the bridge output, while the other channel was switched between recording the output of the signal generator, when measuring the transducer impedance, and the output of the second instrumentation amplifier, when recording pluck responses.
As will be explained in Section 4.3, it is beneficial to measure the bridge output relative to the input signal in complex form. Sine functions were fitted to the recorded waveforms for the bridge input and output using a least-squared-error approach: a function y = A + B sin ( ω t + C ) of known frequency ω can be fitted as y = A + P sin ω t + Q cos ω t where P = B cos C and Q = B sin C . The magnitudes and phases of the fitted functions were then combined to give the complex output.
Tests were also run using a simple voltage divider configuration, with just the reference and test impedances connected in series. In this configuration, however, the overall testing sensitivity is seriously limited by any gain differences in the instrumentation amplifiers, oscilloscope input circuits or analogue-to-digital converters used to measure the voltages across the two impedances. The bridge circuit, while being somewhat more complex to analyse, was found to give significantly better performance.

3. Theoretical Background

3.1. Mechanical System

The mechanical system is shown in idealised form in Figure 4. A perfectly flexible string of length L, tension T and mass per unit length μ is rigidly fixed at one end (at x = 0 ), and terminated at the other end ( x = L ) by a spring of stiffness K, representing the transducer disc. A voltage V e i ω t applied to the transducer produces a force F e i ω t = α V e i ω t on the string, where α is a constant and ω is angular frequency [7]. For this harmonic response problem, the string displacement must take the form:
u ( x , ω ) = A sin ω x c
where A is a constant and c = T / μ is the wave speed. Force balance at the junction of the string and the spring then requires:
F = T u x ( L , ω ) + K u ( L , ω ) = T A ω c cos ω L c + K A sin ω L c .
Thus, the receptance of the coupled string and spring is given by:
R ( ω ) = Y F = 1 Z 0 ω cot ω L c + K
where Y ( ω ) = u ( L , ω ) and Z 0 = T μ is the string’s characteristic impedance.
The stiffness K will turn out not to play a very important role in the measurements, but it is useful to have an idea of its value. This can be estimated from a standard formula for the central displacement of a circular plate with simply-supported edges, in response to a concentrated load near the centre ([8], see Table 24):
K = 4 3 π E h 3 a 2 ( 1 ν ) ( 3 + ν )
for a plate of radius a and thickness h, made of material with Young’s modulus E and Poisson’s ratio ν . Using the dimensions given above for the transducer base plate, and typical values E = 100 GPa and ν = 0.33 for brass, the result is K 30 kN/m. The actual stiffness will be higher, for two reasons: first, there will be a contribution from the piezoelectric layer; second, the effective diameter will be smaller than the overall diameter because of the support details of the annular washer, and those supports may also provide boundary conditions a little stiffer than idealised hinged supports.
Various additional elements were considered for inclusion in the mechanical model, including the mass of the spacer between the string and the piezoelectric transducer, and the elastic stiffness of the tail section of the string pulling the string against the transducer. The only addition found to make a significant contribution was internal damping of the mechanical system, which is needed to reduce resonance peaks to finite magnitudes. Modal frequencies and associated damping factors of the string on the test rig can be readily measured from pluck tests. To incorporate these into the theoretical model, the first few poles of the receptance R ( ω ) can be calculated, with their corresponding residues. Newton-Raphson iteration starting near the known resonance frequencies of the rigidly mounted string (i.e., with K ) was used to compute these poles by finding roots ω n of the equation:
Z 0 ω n + K tan ω n L c = 0 .
Using l’Hôpital’s rule, the corresponding residues p n are given by:
p n = Z 0 cot ω n L c Z 0 L c ω n sin 2 ω n L c .
A damped version of R ( ω ) can then be found by using the same residues, but replacing the real pole frequencies ω n by complex values incorporating the measured Q factors Q n :
ω ¯ n = ω n 1 + i 2 Q n .
For the simplest case with just the first pole, the result takes the form:
R a p p r o x ( ω ) 1 K + T / L + p 1 ω ω ¯ 1
where the initial constant term is the DC value R ( 0 ) . More poles could be added in if desired.

3.2. Electrical System

The displacement Y ( ω ) is proportional to the induced strain in the piezoelectric layer, so the transducer capacitance will satisfy:
C C 0 + β Y e i ω t = C 0 + α β V 1 R ( ω ) e i ω t
where C 0 is the baseline value, V 1 is the voltage across the device, and β is a constant. R could be replaced by R a p p r o x to allow for internal damping. The analysis of the bridge circuit of Figure 3 in the presence of a time-varying capacitance requires a little care. For simplicity the resistors R P and R r e f will be omitted from this calculation, because their effect is negligible.
The directly measured bridge output B ( ω ) is the voltage difference across the bridge V 1 V 2 normalised by the drive voltage V. Throughout this paper, “bridge output” will refer to this normalised voltage difference. If the current in the left-hand branch of the bridge is I 1 , then:
I 1 = V ( t ) V 1 ( t ) R A = d d t C ( t ) V 1 ( t ) .
If V 1 ( t ) were purely sinusoidal, as one would at first think, the product C ( t ) V 1 ( t ) would only involve the varying capacitance through a nonlinear term which would appear at frequency 2 ω . However, empirically it is found that the output is dominated by sinusoidal variation at frequency ω . The missing ingredient is a feature of the piezoelectric layer which has not yet been mentioned. As a result of the poling process during manufacture of the device, a remanent electric field is “frozen” into the interior of the layer [7]. The effect can be represented approximately by including a DC component of voltage V 0 in addition to the sinusoidal component. A linearised approximation is then possible:
d d t C ( t ) V 1 ( t ) d d t ( C 0 + C e i ω t ) ( V 0 + V 1 e i ω t ) i ω [ C 0 V 1 + V 0 C ] e i ω t
where:
C = β Y = α β V 1 R ( ω ) .
Equation (10) can then be solved for V 1 in this linearised approximation for harmonic response, and combined with the corresponding linear result for the right-hand branch of the bridge to yield:
B ( ω ) = V 1 V 2 V = 1 1 + i ω R A [ C 0 + α β V 0 R ( ω ) ] 1 1 + i ω R B C r e f
1 1 + i ω R A C 0 1 1 + i ω R B C r e f i ω R A α β V 0 R ( ω ) [ 1 + i ω R A C 0 ] 2
where the binomial expansion has been used in the final approximation, on the assumption that the effect of the term involving R ( ω ) is relatively small. The first two terms on the right-hand side of Equation (14) cancel if the bridge is perfectly balanced, leaving the third term which is proportional to the receptance R (which can be replaced by R a p p r o x to represent the effect of damping). Thus, a measurement of B with a well-balanced bridge would be expected to show a peak near each resonance of the string, exactly as hoped in the context of designing an automated tuning system. Note that the three calibration constants α , β and V 0 appear only via their combined product, so that there is only a single value to be identified from measurements on the real transducer. The response is modified if the bridge is out of balance, as will be explored in Section 4.3.

4. Results

4.1. Initial Characterisation of the Unloaded Piezoelectric Transducer

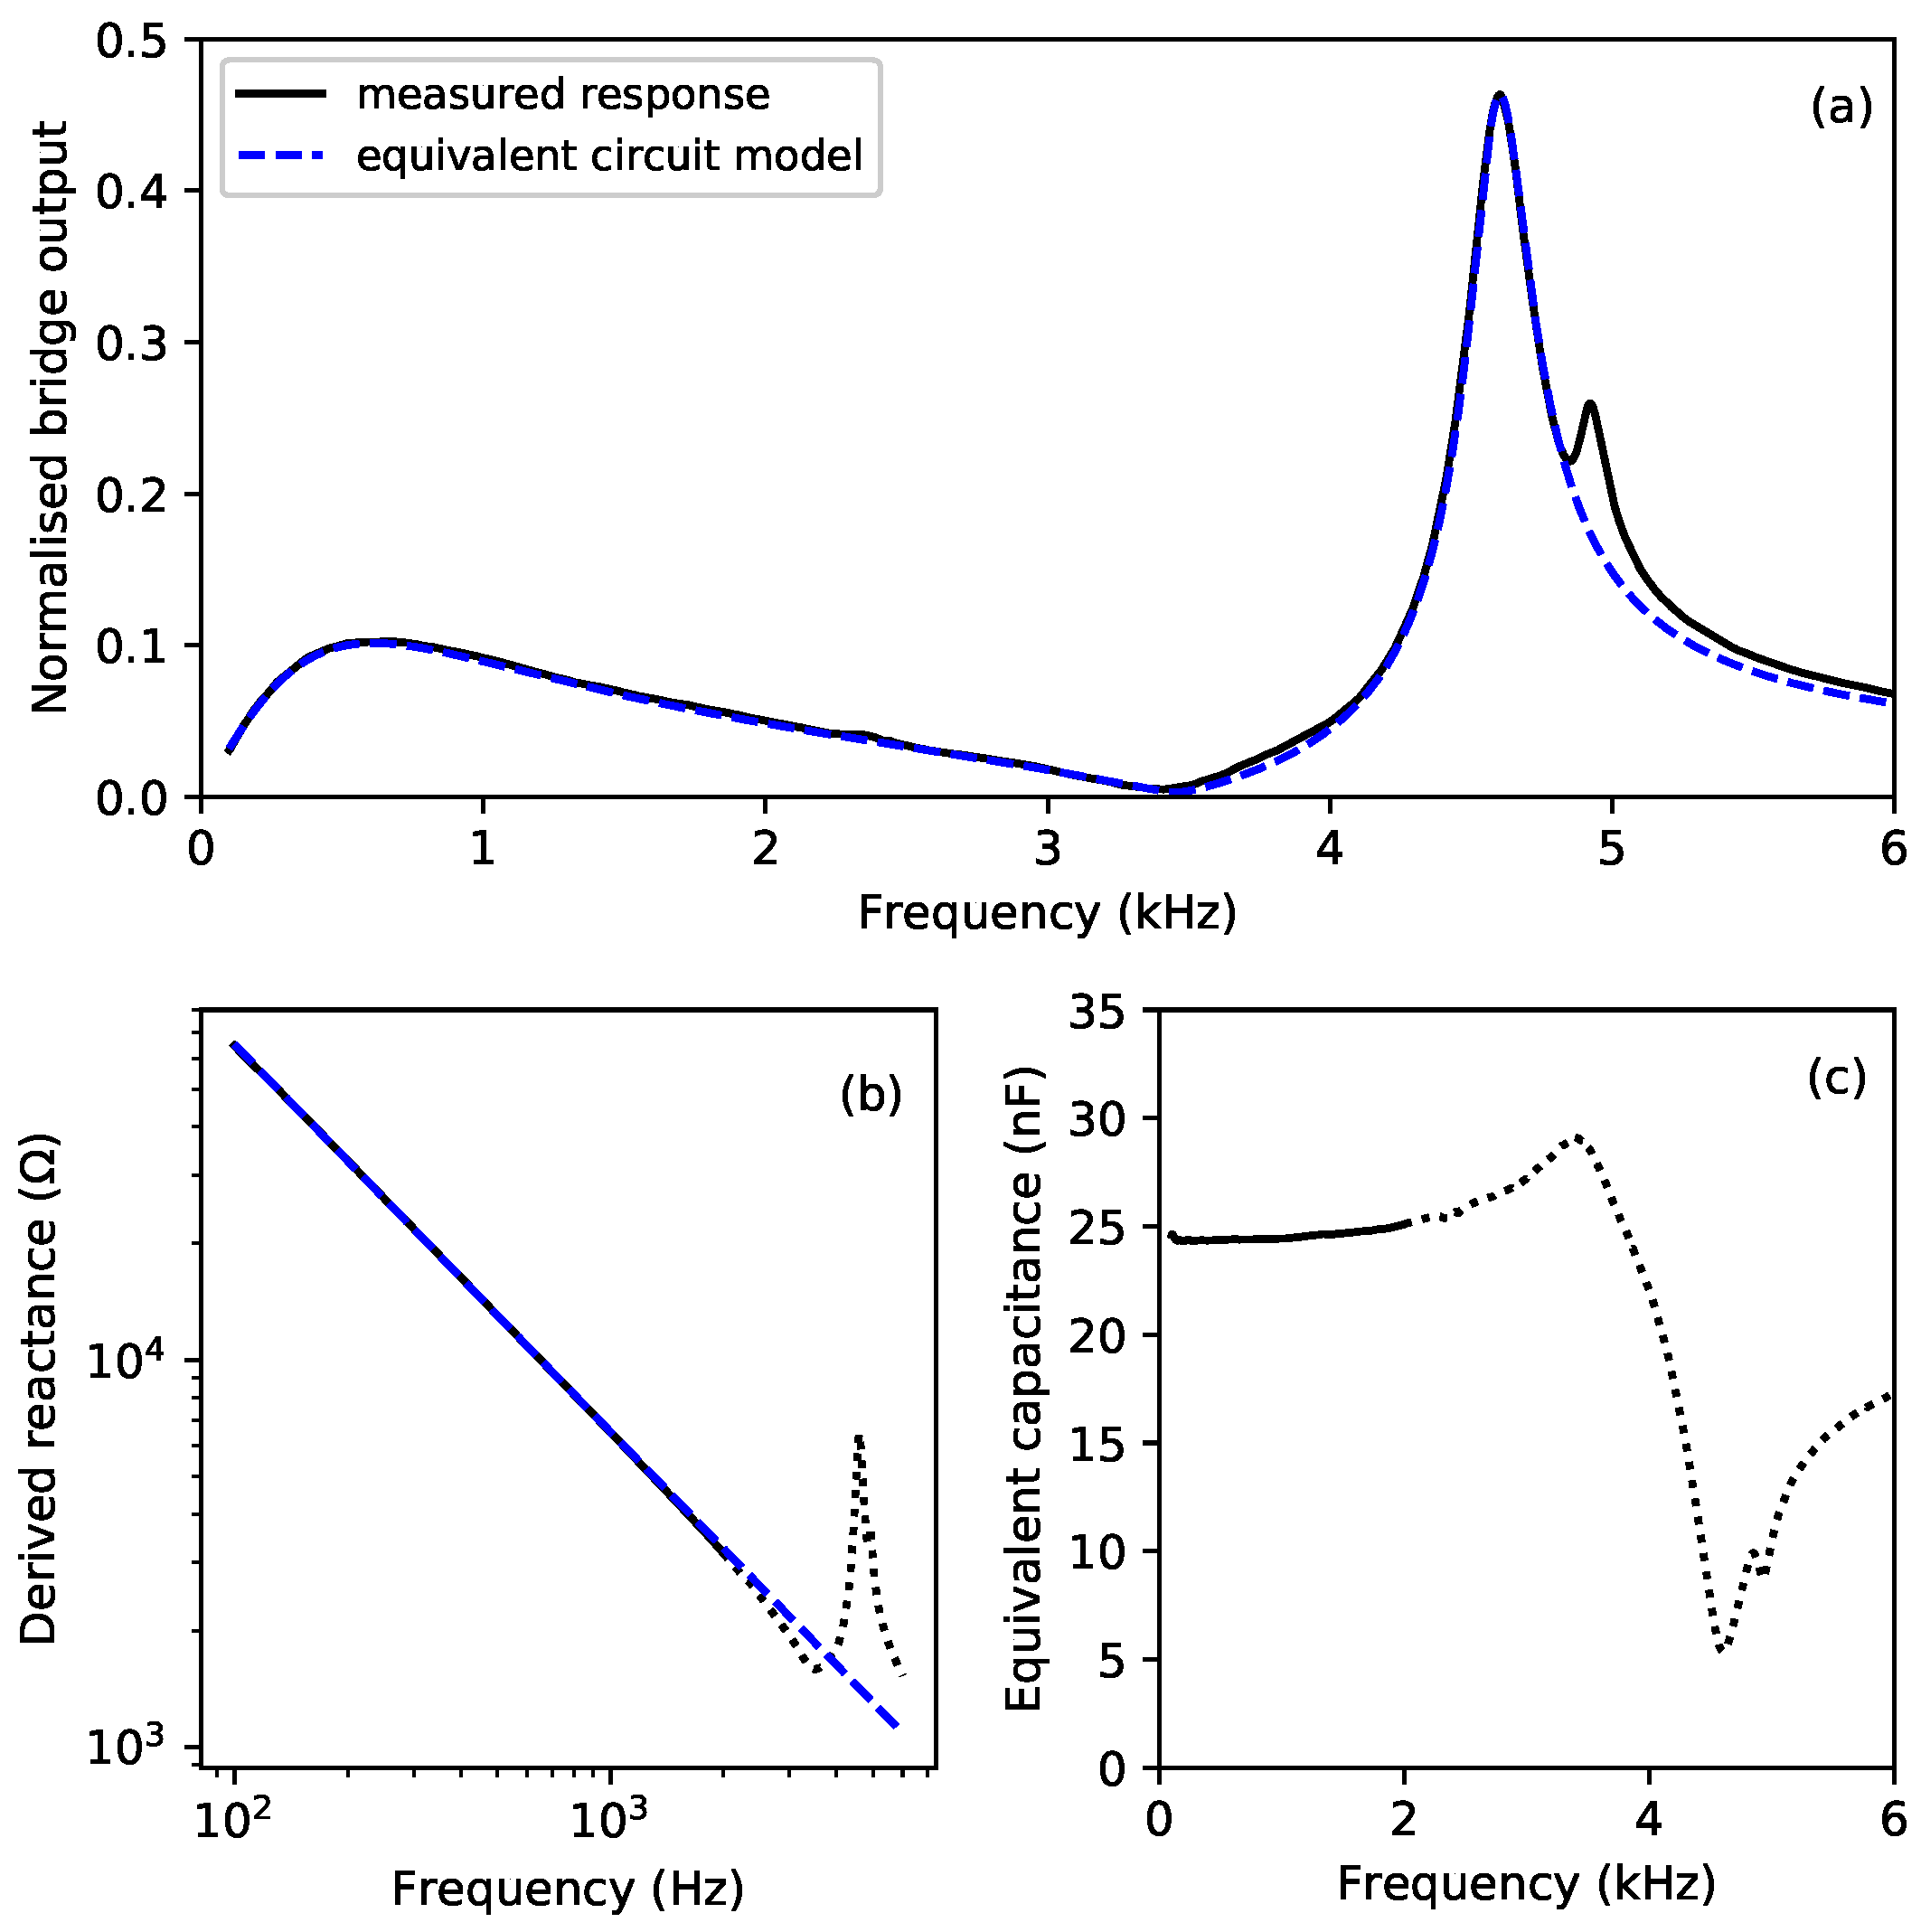
The first test was an impedance scan of the unloaded piezoelectric transducer, removed from the rig and without load from the string. Figure 5a shows the bridge output response as a function of frequency. The values of R A and R B were measured using a digital multimeter as 9.38 and 10.94 k Ω , respectively.
If the transducer impedance is purely reactive, its value can be obtained in a straightforward manner from the magnitude of the bridge output. Figure 5b shows the absolute value of the derived reactance response, plotted on a log-log scale. As expected the low-frequency part of this plot, up to about 2 kHz, shows a straight-line response with gradient 1 , indicating that the transducer can indeed be treated as a capacitance at low frequencies. Figure 5c shows the corresponding capacitance response on a linear frequency scale: this should only be considered valid over the low-frequency region. The average capacitance over the frequency range 200 Hz–1 kHz was 24.4 nF, matching the value obtained previously with the capacitance meter.
Within the electrical engineering community, the behaviour near the first mechanical resonance of a simple piezoelectric transducer of the type used in this study is usually modelled by an equivalent circuit consisting of a series LCR circuit in parallel with a capacitance [7]. Presumably this linear circuit analysis relies on the same DC approximation of the remanent field as used above, although this is rarely made explicit in the recent literature. The values of the capacitance and inductance in the LCR arm can be obtained from the series and parallel resonance frequencies, which lie close to the points of minimum and maximum impedance respectively. The dashed blue line in Figure 5a shows the result of fitting such a model to the measured bridge output response. The fit obtained is excellent, with only a secondary peak at about 4.9 kHz being unexplained by this simple model. The series resonance frequency obtained was 4.3 kHz, which was reassuringly close to the manufacturer’s nominal value of 4.2 ± 0.5 kHz.
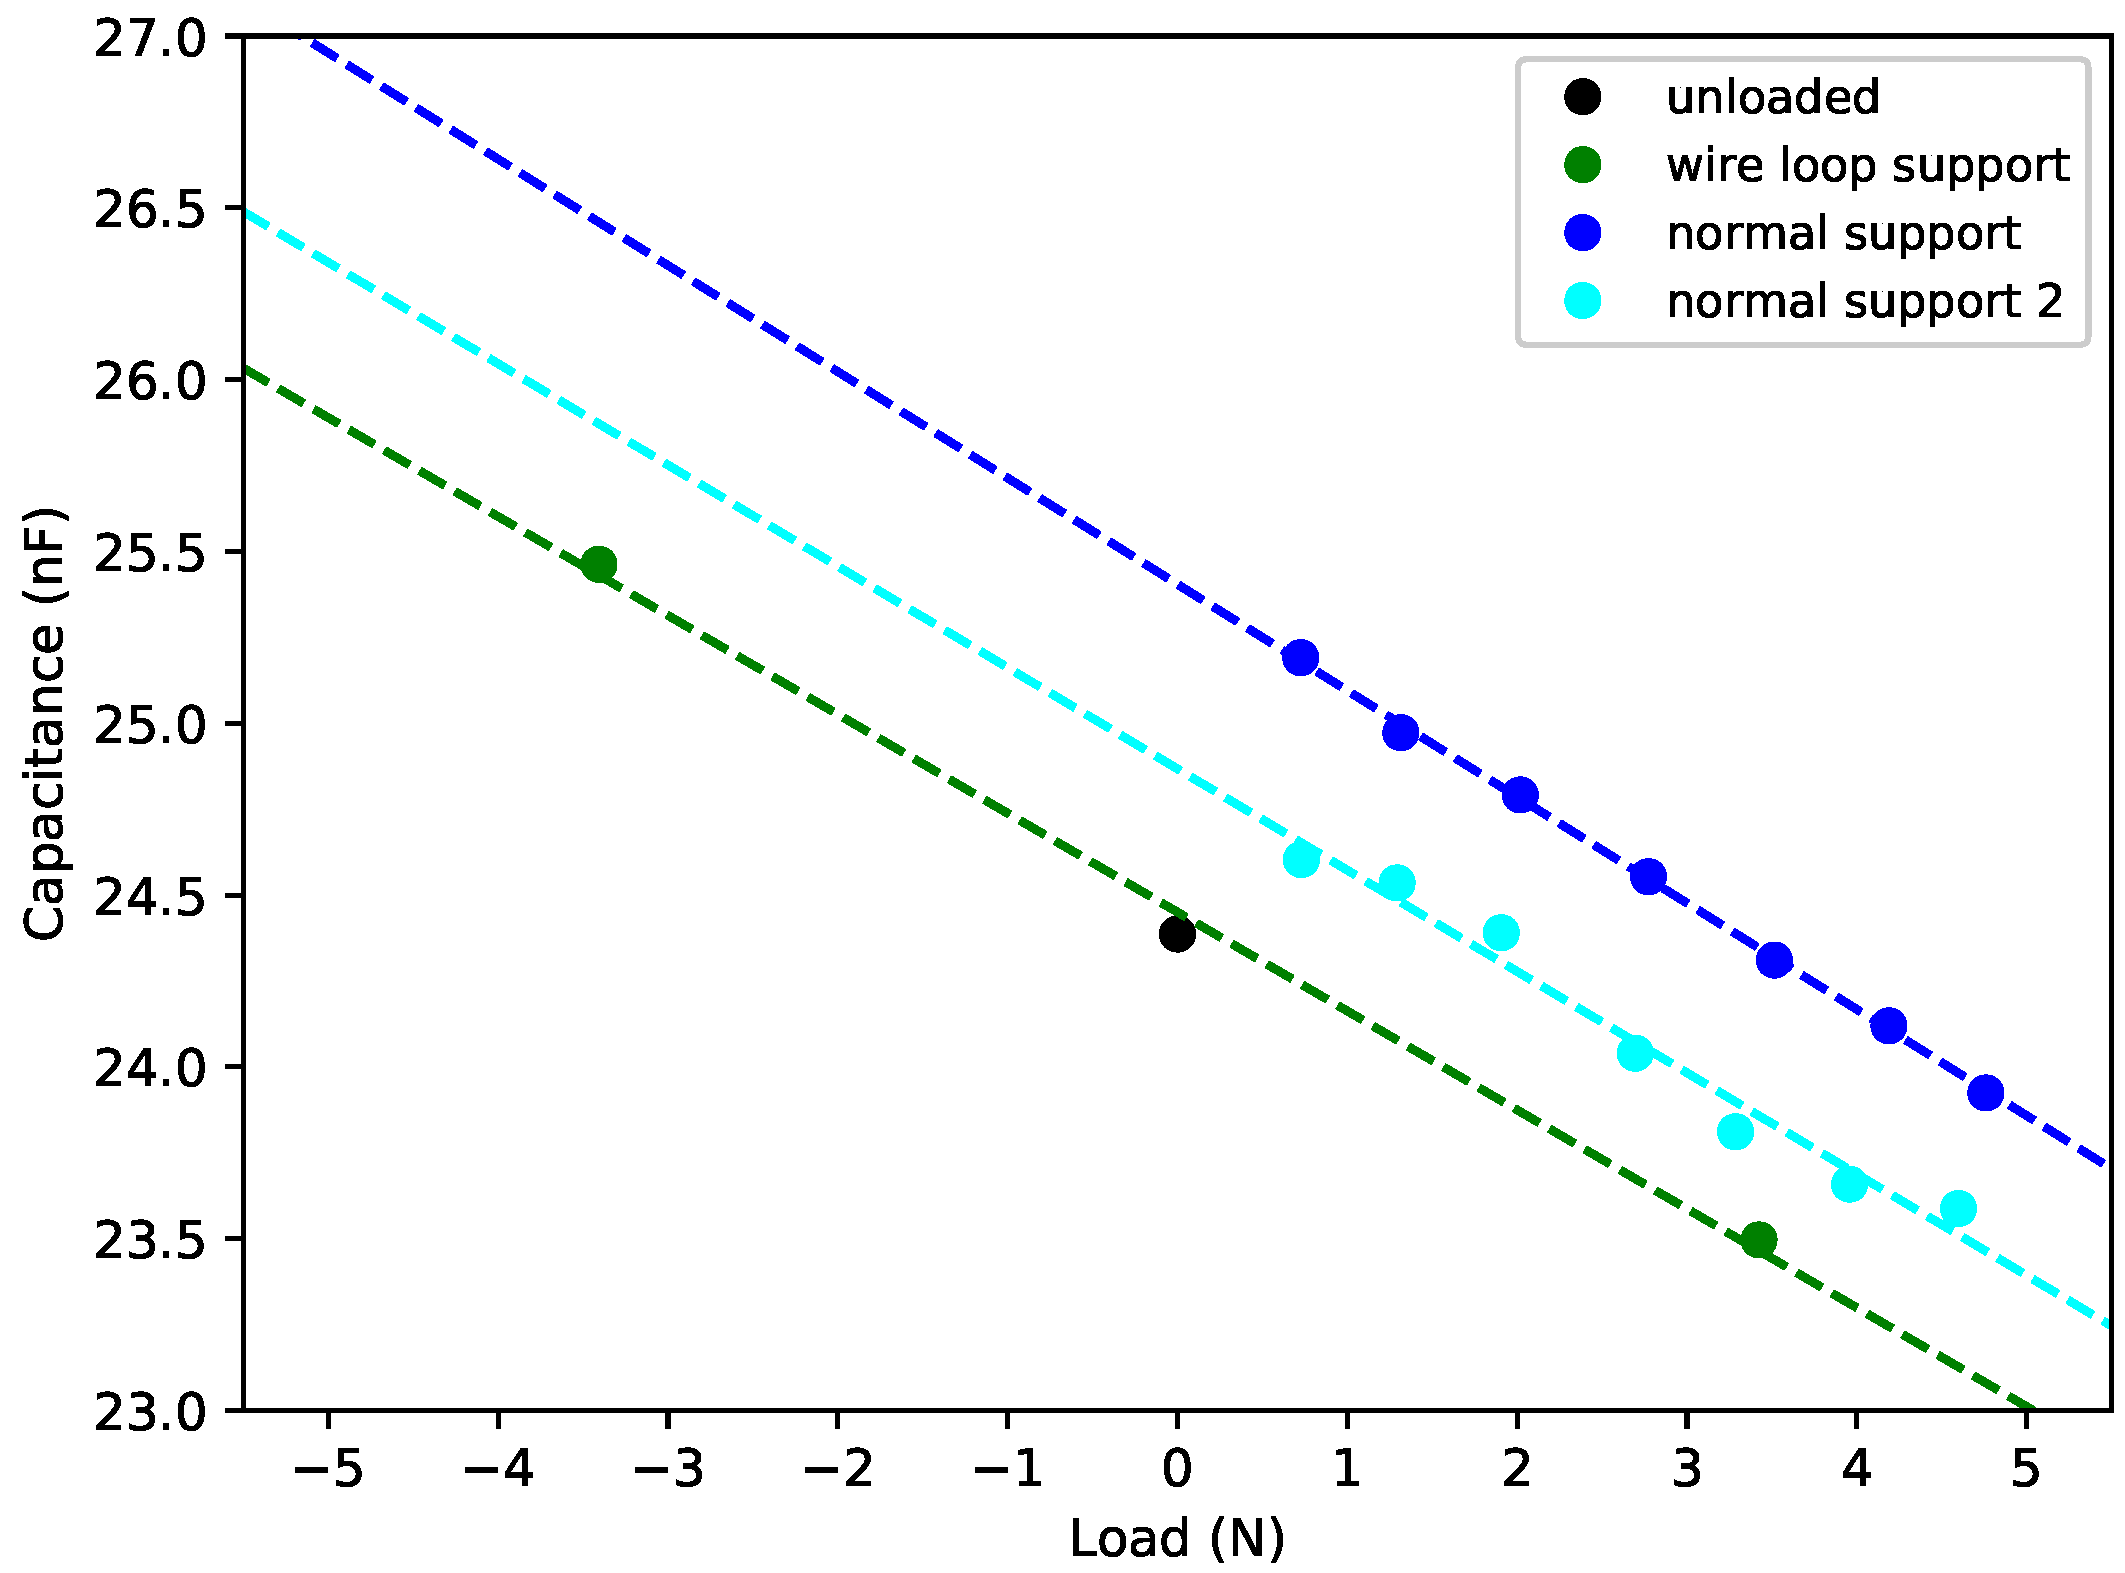
It is important to the intended sensing mechanism that the low-frequency capacitance of the transducer, in the region of the fundamental frequency of the string, but below the mechanical resonance of the transducer, should vary with the applied load. To explore this effect, the transducer was mounted on the test rig in the normal way (Figure 1 and Figure 2), and the applied load was varied by altering the string tension. In each case the capacitance was derived from the low-frequency bridge output response. Figure 6 shows two sets of results obtained, on different days (blue and cyan plots). The vertical shift between the two cases is due to sensitivity of the transducer capacitance to changes in the ambient temperature, probably a consequence of thermal sensitivity in the dielectric constant of the piezoelectric material [7]. An important implication for any practical application is that an impedance bridge of the type used here will not remain balanced as the ambient temperature varies, with a net contribution from the first two terms of Equation (14) appearing in the bridge output response.
With the transducer mounted in the normal way, the load could only be applied in one direction. To obtain the green plot in Figure 6, the support arrangement was temporarily changed to use a horseshoe-shaped loop of wire instead of the cup washer, which allowed the transducer to be turned over without the support interfering with its leads. Tests were run with the transducer in both its normal orientation (electrode on top) and upside down. In this case, a third point was provided by the capacitance of the unloaded transducer, as given above. All three sets of responses show a clear linear trend, and the fitted lines have consistent gradients. The rate of variation of capacitance with load is perhaps surprisingly large, which results in high sensitivity for the dynamic measurements to be described shortly.

4.2. Loaded Transducer Response and String Resonances

The piezoelectric transducer was replaced in its normal position on the test rig, as shown in Figure 2, and an impedance scan was recorded. A manual string pluck response was also recorded for comparison. Figure 7 shows the bridge output (black) together with the FFT of the pluck response (red). The FFT has been scaled to suit the vertical scale range of the bridge output response. The bridge output response from the unloaded transducer (dotted black) is included for reference. Spikes in the bridge response can be clearly seen near the string fundamental (834.6 Hz) and the first few overtones. The spike at about 2.9 kHz was the fundamental for the string tail section (Figure 1 and Figure 2). Comparing the loaded and unloaded responses, it can be seen that the mechanical resonance of the transducer had fallen significantly. The low-frequency capacitance had also fallen, relative to the unloaded case, to 23.3 nF; consistent with Figure 6. Note that the frequency region of interest, around the string fundamental, was still well below the transducer resonance; so the transducer could be treated as a capacitance for the purposes of the model developed in Section 3.

4.3. Variations in Impedance Bridge Balance

When viewed at the plotting scale of Figure 7, it appears that the bridge output shows a peak at the string resonance frequency. However, closer examination confirms the prediction of Equation (14): the precise peak frequencies in measurements like the solid black curve in Figure 7 are influenced by the state of balance of the bridge circuit. Using a value for the transducer capacitance of C 0 = 23.3 nF, and C r e f = 26 nF, suggested that the values of R A and R B for the impedance bridge to be balanced should be 10.5 k Ω and 9.5 k Ω respectively. The initial values of R A = 9.38 k Ω and R B = 10.94 k Ω therefore corresponded to the bridge being somewhat out of balance. For the bridge to be out of balance by about the same amount, but in the opposite direction should have required R A = 11.74 k Ω and R B = 8.26 k Ω .
Figure 8 shows the bridge output responses obtained around the string fundamental (834.6 Hz) with approximately these three resistance ratios, plus another two for approximately twice the degree of imbalance in either direction. For the green response it appears that the bridge setting was indeed close to balanced, with a single response peak at the string resonance, as expected from Equation (14). The magenta response corresponded to the bridge balance condition for the previous tests, with the response dipping prior to rising to a distinct peak as the frequency increased through the string resonance. The red response, with the bridge further out of balance in the same direction, has a similar shape to the magenta response, but with an increase in its vertical offset. Changing the bridge to be out of balance in the opposite direction (cyan and blue) gave responses with a very similar shape, but with the dip now following the peak as the frequency increased. In the four unbalanced cases it can be seen that the size of the vertical offset has increased with the degree of imbalance in the bridge; as expected from the first two terms of Equation (14).
The dashed lines in Figure 8 plot the responses predicted by the simple model of Equation (14), with R ( ω ) replaced by R a p p r o x ( ω ) and using just the first pole, as in Equation (8). It was found that the first term on the right-hand side of Equation (8), which for musical instrument strings will be dominated by the transducer stiffness K, actually made only a very small contribution, which could be allowed for by a small adjustment in the low-frequency transducer capacitance C 0 . It was expected that a temperature-related adjustment would be needed anyway in the value of C 0 , since the measurements presented in this section were made on a different day to the measurements presented in Section 4.2. Taking this approach, of ignoring the first term on the right-hand side of Equation (8), it was then only necessary to fit a value for the combined scale factor α β V 0 p 1 .
The value for the Q factor at the string fundamental was obtained by analysing a recorded pluck response, as described in Section 3, giving Q 1 = 655 . The value of C 0 was set to 23.5 nF instead of the value 23.3 nF obtained from the loaded impedance response (Section 4.2), while the combined scale factor used was α β V 0 p 1 = 3.6 × 10 8 . As can be seen from Figure 8, the match is excellent, suggesting that the simple model given in Equation (14) is capturing the key behaviour rather well.
Referring again to Equation (14), the net effect of the first two terms should be to add a complex offset that varies only slowly with frequency compared to the rapid variation associated with the resonance peak. This suggests a possible approach to “balancing” the bridge in software: if an average value of the complex offset can be estimated, by examining the bridge output response away from the string resonance, the measured bridge output can be corrected by subtraction of this constant offset. The result should be a clear peak at the string resonance.
Figure 9 demonstrates this approach. Figure 9a is a repeat of the measured bridge output magnitude responses from Figure 8, while Figure 9b shows the evolution with frequency of the complex values of these responses. It can be seen that it is only necessary to move a few Hz away from the string resonance for the associated response deviations to have become relatively insignificant, compared to the slowly-varying background offset, with the latter varying with the bridge balance setting. Complex offset corrections, shown as dashed lines in Figure 9b, were calculated by taking the averages of the real and imaginary responses over the 1 Hz intervals at either end of the measured responses, i.e., between about 14 and 15 Hz either side of the string resonance. Figure 9c shows the results of applying these balance corrections. The shape and amplitude of the corrected responses match very closely. In fact, this approach was sensitive enough to identify small variations in the string resonance, probably due to temperature changes between successive measurements while the bridge balance was being adjusted. These offsets, relative to the green (near-balanced) response, and in the order that the responses are listed in Figure 8, amounted to 0.5, 0.1, 0.0, 0.0, and 0.1 Hz respectively. Corresponding corrections have been added to the frequency values in Figure 8 and Figure 9.

4.4. Variations in Drive Level

Most of the tests reported here were run with drive waveform levels in the range 6–10 V pp to produce clear response plots. At these drive levels, however, the tones generated by the piezoelectric transducer and string were quite audible, especially at the fundamental string frequency. Figure 10 shows the bridge output responses obtained with lower drive levels, reducing the drive amplitude by up to a factor of 30. At the lowest levels the test tones could only just be heard at the string fundamental. On the other hand, the test string was not attached to a soundboard which, by design, would be expected to amplify any sound coming from the string. Encouragingly, the bridge output responses obtained still showed a clear variation in amplitude, with a distinct dip and peak: the shape of the bridge output response did not change. These results also demonstrate the linearity of the overall measurement approach. With careful design of the bridge and sensing electronics and wiring, and also of the piezoelectric transducer, the drive levels could almost certainly be reduced further. The drive level could also be varied adaptively during the frequency scan, reducing it as the measured response passes through its peak.

4.5. Variations in String Stress

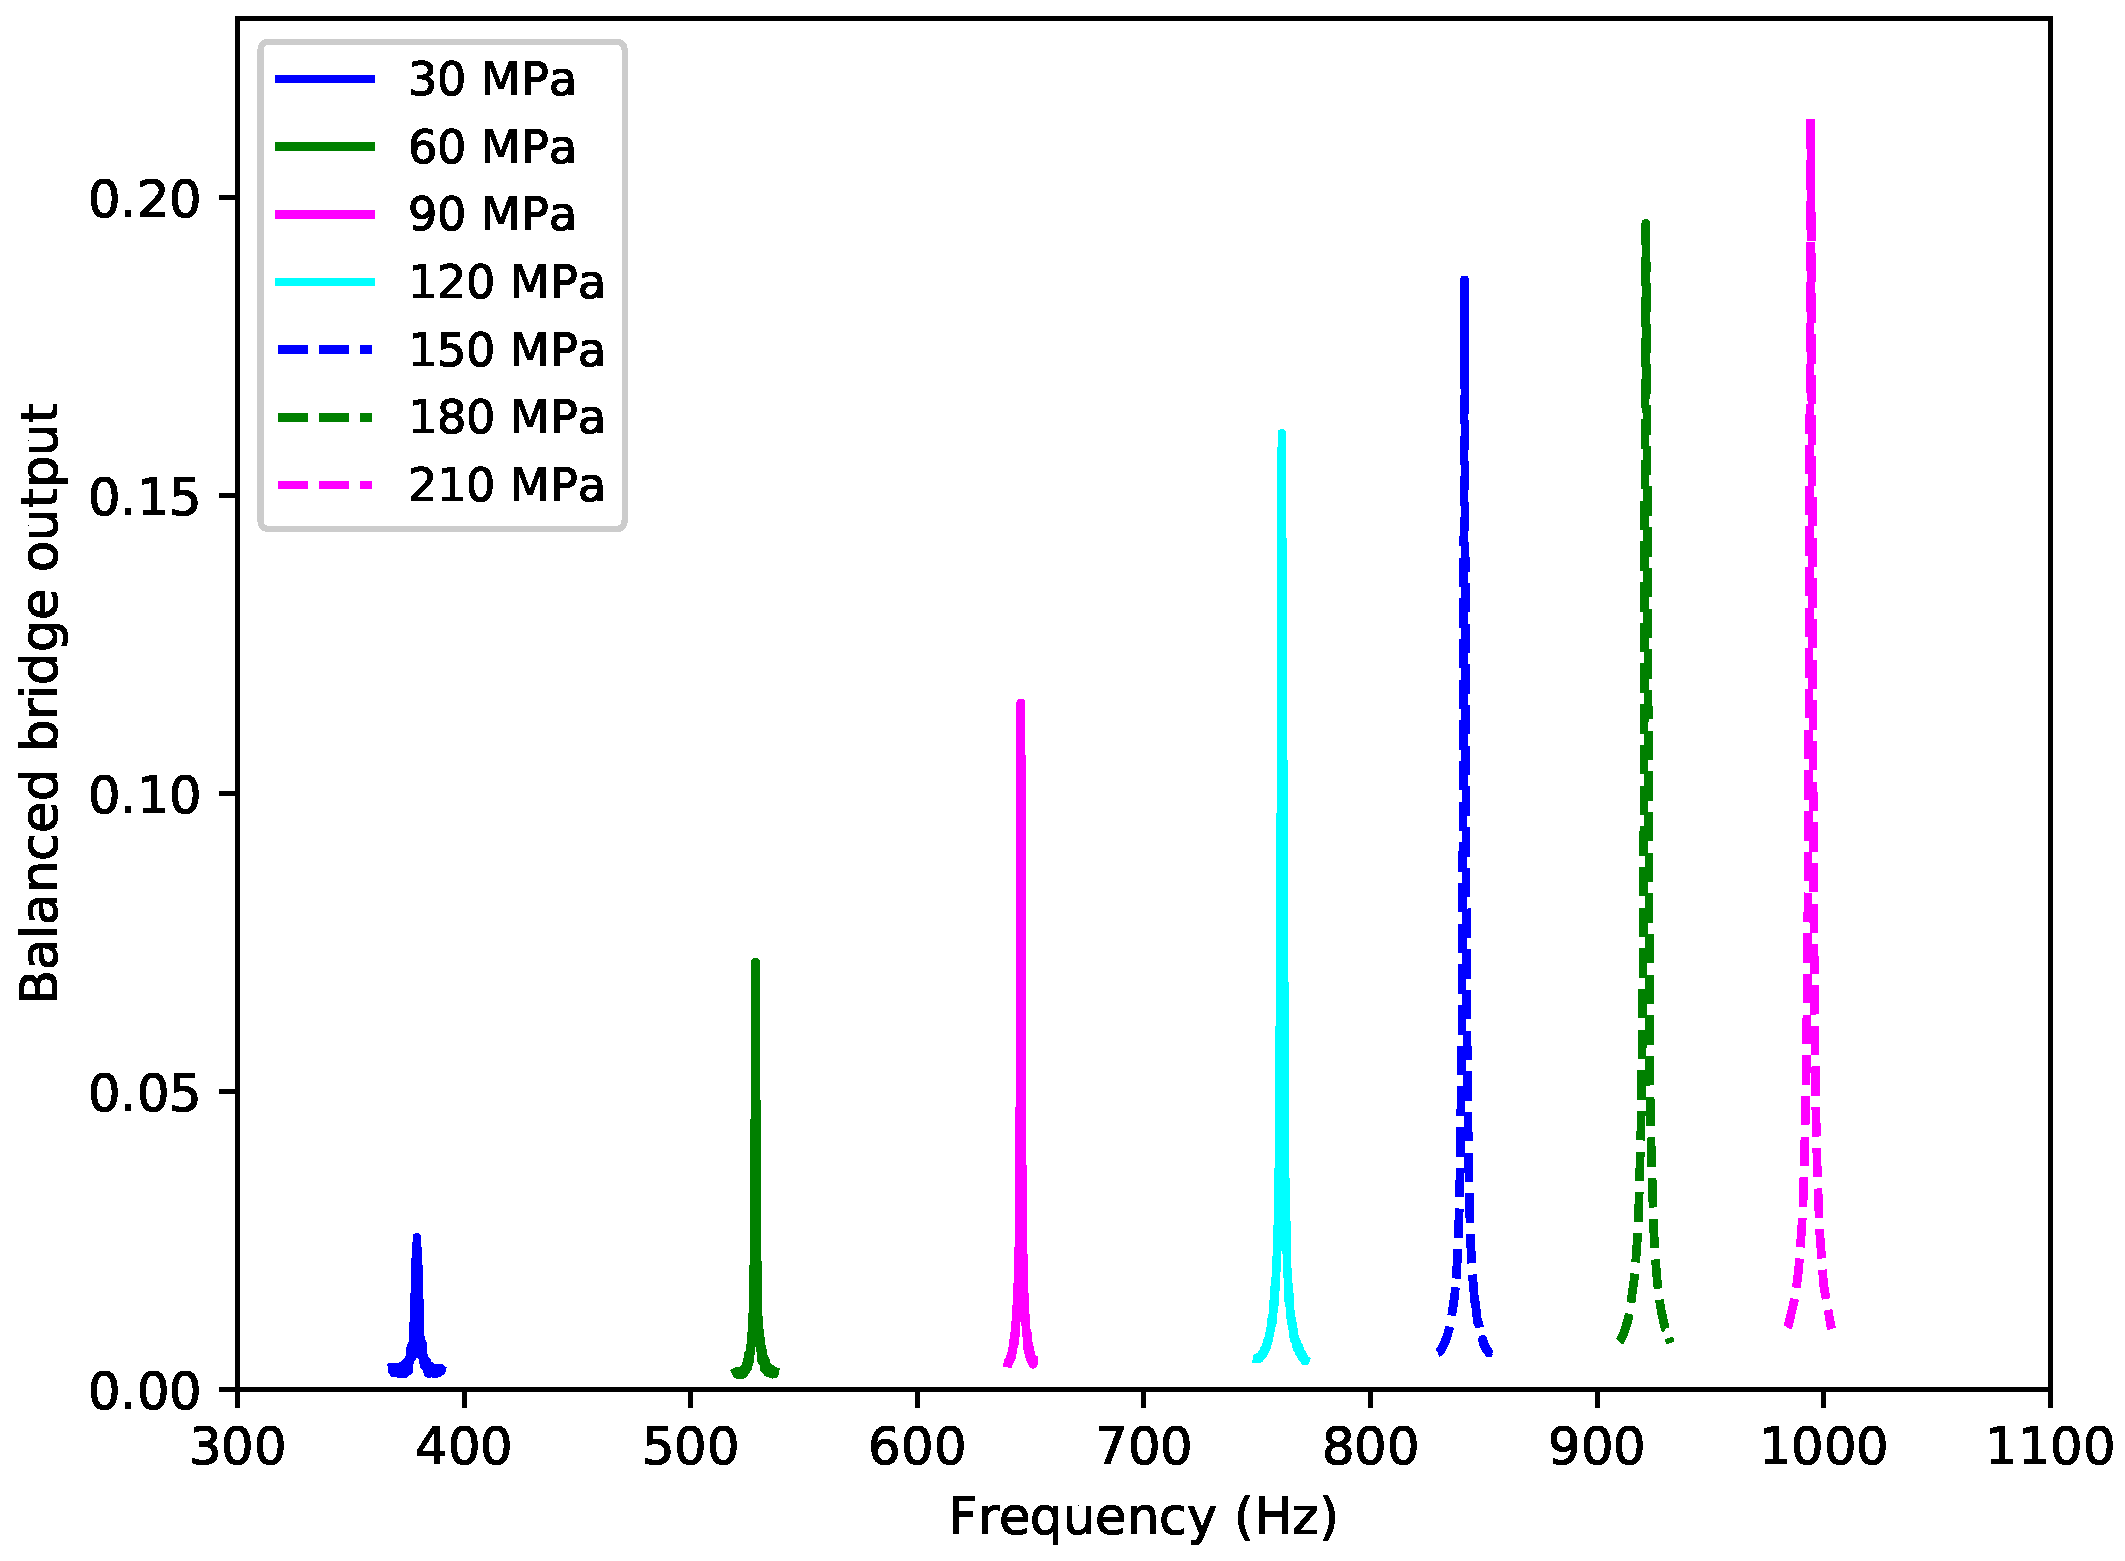
The longitudinal stress in the non-metallic (nylon or gut) strings of a concert harp range from about 50 MPa for the lowest notes up to about 270 MPa for the top notes [9]. To explore what effect the string stress might have on the ability to measure its tuning by the proposed method, the test string was retuned to a number of fundamental frequencies, corresponding approximately to stress levels from about 30–210 MPa in 30 MPa steps. Such large tuning changes inevitably caused the string to start creeping again, but, since the aim was to investigate the general nature of the corresponding bridge responses rather than their precise details, some creeping in the string resonance during the impedance scans did not present a problem.
Figure 11 shows the results obtained. In every case, a clear spike in the balanced bridge output was seen. The magnitude of the balanced output peak was smaller at low stress levels, and increased fairly steadily with the fundamental frequency. This suggests that this impedance scanning technique could be used as the basis for measuring the frequency of unplucked strings across the full range of gut or nylon strings on the harp.

4.6. Tuning Performance

Based on these encouraging results of the proposed measurement method, a tuning algorithm was written which used impedance scanning to determine the string frequency and the necessary tuning adjustment. Calculating the length of string to be wound onto or off the winding shaft to make a given tuning adjustment requires knowledge of the string’s Young’s modulus: specifically, the string’s “tangent modulus” (the stress/strain ratio for small perturbations). For nylon strings this quantity varies significantly with the string stress, but the previous study of nylon harp strings led to an expression which can be used to predict the Young’s modulus with sufficient accuracy to provide a stable tuning control algorithm [3].
The tuning algorithm measured the string fundamental frequency using the approach described in Section 4.3: calculating and applying a complex offset to balance the measured bridge output response, and then identifying the fundamental string frequency from the peak value. For each tuning iteration, the algorithm used the measured frequency and the desired target frequency to determine the scanning range to be used for the next frequency measurement. For a given target frequency f 0 and tuning error δ f , the scanning range was set to f 0 0.5 δ f to f 0 + 1.5 δ f for δ f > 0 , or the symmetrical equivalent for δ f < 0 . This approach was found to be more robust, than just assuming an accuracy margin for the tuning adjustments, when dealing with a creeping string. For the first iteration, the frequency measurement was determined from a manual string pluck. This matches the way such a tuning approach would likely be used in practice, with the instrument initially tuned on the basis of manual plucking or playing of the strings, before the start of a performance, and with the impedance-based tuning algorithm being used to maintain the string frequency during the performance.
Figure 12 shows tuning behaviour from two different test runs: one without any tuning correction applied, and one with the tuning algorithm in operation. At the start of the test the frequency of the string, which had been allowed to settle overnight, was measured as 801 Hz. The string was then tuned up to 844 Hz (a big enough step to ensure it started creeping again) and its frequency was monitored using the impedance scanning technique, but without making any corrections. The magenta line in Figure 12 shows the results obtained. The tuning error is given in cents, there being 100 cents in one equal-tempered semitone [10]. It is generally accepted that the minimum perceptible change in pitch of a musical note is never lower than about 3 ¢; the exact value varies with the pitch and complexity of the sound [11]. For most of the test period the tuning error became increasingly negative, indicating the string was going flat: the string was creeping, causing its tension and pitch to fall. The red section of the response indicates a period when a desk lamp, with a 60 W incandescent bulb, was placed near the string to provide some local heating. Raising the temperature of a settled nylon string makes it go sharp [3]. In this case, however, the effect of heating merely offset the underlying creep for a while. It was also found during the previous study of nylon strings [3] that raising the temperature above the historic maximum temperature, to which a string had been exposed, would trigger a further episode of rapid creep. This appears to have happened part way through the period of heating (this test was run using a new string after the previous string was broken by accidentally over-tightening it).
At the end of the first run the string frequency was re-measured as 830 Hz. The string was then tuned up to 875 Hz (a similar tuning jump to the first run), and now the tuning control algorithm was activated. The blue line in Figure 12 shows the results, with the red section again indicating a period of local heating. With the exception of some short periods, after the initial large tuning change and at the start and end of the heating period, the control algorithm maintained the string tuning within ± 2 ¢ , and at no time did the tuning error exceed 3.5 ¢. It is also worth noting that for both of these test runs the input drive level was reduced to 0.7 V pp , with no noticeable degradation in performance (see Section 4.4).

4.7. Other Measurement Configurations

Some tests were also run using a piezoelectric harp pickup from Camac Harps. This was a rectangular piezoelectric plate approximately 7 × 3 mm in size, about 1 mm thick, and with a capacitance of 440 pF. In common with many other piezoelectric pickups used with musical instruments, this transducer was not intended to flex in any way: it was presumably designed to generate a voltage proportional to the force exerted by the string via bulk compression or shear, with very little associated deformation. This, in conjunction with the pickup’s small size, meant that it was not possible (at least with the available drive voltages of up to about 30 V pp ) to obtain a useful impedance scan response with this transducer.
As an alternative frequency measurement approach, the configuration of the test rig was changed so that the string passed over the Maplin piezoelectric disc transducer at the end near the motorised winder, and over the Camac pickup at the other (clamped) end. Tones were injected into the string using the Maplin transducer, and the responses measured at the other end using the Camac pickup. As expected, there was a detectable increase in the output from the Camac pickup when the test frequency passed through the string resonance, but the overall performance was far inferior to that obtained using the impedance scanning approach with the Maplin transducer. This suggests that alternative pitch measurement techniques based on injecting a pulse-train or some other signal at one end of the string, and measuring the response at the other end, may also perform relatively poorly.

5. Discussion and Conclusions

This study has shown that the transverse resonance frequencies of a stretched flexible string can be determined from the electrical impedance response of a piezoelectric transducer in contact with the string at one of its endpoints. The successful measurements were made using a low-cost circular piezoelectric transducer, 27 mm in diameter, designed to flex its base plate. The transducer is driven with a sinusoidal waveform at a low level, inducing some barely-audible vibration in the string. The vibrating string then exerts force back on the transducer, resulting in a modulation of its capacitance which can be detected using a bridge circuit. By sweeping the sinusoid over a range near the fundamental resonance of the string, a peak at the resonance frequency can be detected.
The capacitance of a piezoelectric transducer, below its own mechanical resonance, can be expected to vary noticeably with temperature due to the thermal sensitivity of the dielectric constant of the piezoelectric material [7]. Consequently, the impedance measurement bridge will usually be operating somewhat out of balance. The result is to obscure the precise frequency of the string resonance. However, through the development of a simple explanatory model for the transducer behaviour, a straightforward approach has been demonstrated for correcting the bridge balance in software. The string resonance can then be robustly and accurately identified.
It has also been demonstrated that this frequency measurement approach can be used as the basis for a tuning control mechanism, capable of maintaining a musical instrument string at the required pitch, without the string having to be plucked or played. An instrument equipped with such a system would be stabilised against changes in both the strings and in the instrument frame and soundboard. This would be of direct benefit to musicians, and to harp players in particular, who have no other means to adjust a mistuned string during a performance.
Tests using a much smaller Camac harp pickup, designed to work with small bulk strains rather than by flexure, were not able to distinguish the string resonance via the transducer impedance response. This suggests that a quite different transducer design will be required from that normally used for the pickups in electric and electro-acoustic harps. This need not be a drawback, since it seems likely that the transducers for auto-tuning purposes would work best if mounted on a base that is as solid and inert as possible: this would reduce any influence of vibration of the base structure and also minimise cross-coupling between adjacent strings. This suggests positioning the transducers at the far end of the string, away from the soundboard.
A brief attempt was also made to measure the string resonance by injecting tones at one end of the string and measuring the response amplitude at the other end. While the resonance could be identified, as a peak in the output level, the drive levels required for successful operation were much higher than with the impedance measurement approach. Such an approach would have the additional drawback of requiring a separately wired transducer at each end of the string. Most electric or electro-acoustic harps that have a separate piezoelectric pickup on each string still have multiple pickups connected in parallel to a common amplifier circuit.
On the pedal or lever harp, there would be a potential issue with the fourchettes or other semitone mechanisms, mounted along the neck of the instrument. These work by gripping the string, slightly shortening its vibrating length and hence raising the sounding pitch. A number of possible solutions may be available depending on how the tuning control system is to be used. In concert performances, there are often long periods when the harp is not being played. One possibility, therefore, would be for the player to disengage the semitone controls (pedals or levers) so that the tuning control mechanism can operate on the open strings until the harp is to be played.
If it is desired that the tuning control mechanism should be in more continuous use, then a means will be needed to deactivate it when the string is played. This could perhaps be achieved by detecting large-amplitude string excitation, or by using sensors to detect when the player’s hands or fingers are near the strings. A delay would have to be allowed before reactivating the tuning control to allow the string vibration to decay. The existing mechanical pedal and lever mechanisms could then be replaced by electro-mechanical servo units, which automatically disengage the fourchettes, or equivalent, when the tuning control is active. Alternatively, the piezoelectric transducers could be set to make contact with the string below the fourchettes, and engaged or disengaged under servo control. The latter option might allow the tuning control system to be retrofitted to an existing instrument. Although these suggestions all sound rather complicated, it should be borne in mind that the cost of a full-size concert harp can run into tens of thousands of dollars. While considerable development effort would be required, all the necessary components are readily available at relatively low cost.
During the course of a performance, the reference pitch of an orchestra can change, but the harp player has no means to follow such changes. A system capable of making automated tuning adjustments, however, could also have its reference pitch adjusted (perhaps manually by the player), causing the whole instrument to be retuned accordingly.
A further problem that may be encountered by any tuning control system operating only on the string fundamental stems from the fact that, in practice, there are always two “fundamental frequencies”. Real strings and their associated termination geometry are never perfectly symmetric, so that the two polarisations of string vibration will always have slightly different resonance frequencies [4]. On the test rig, efforts were made to minimise the influence of these split peaks; but an automated tuning control system on a real instrument would need to cope with this phenomenon.

Supplementary Materials

The following are available online at https://www.mdpi.com/2571-631X/1/1/2/s1: the measurement data files, plus a file guide and the Python code for generating the plots.

Acknowledgments

The authors thank John Durrell and Sohini Kar-Narayan of the University of Cambridge for advice on the behaviour of piezoelectric materials; Jakez François of Camac Harps for providing samples of the Camac piezoelectric pickups; Justin Grimwood for assistance with fabricating the string winder assembly; David Anderson of Accusound for electronic circuits advice and suggestions; and Matteo Frigo and Steven G. Johnson for making their FFTW algorithm freely available (www.fftw.org). The plots were prepared using the Matplotlib graphics package [12].

Author Contributions

Nicolas Lynch-Aird conceived of, designed and performed the experiments. Both authors contributed equally to analysis of the results and writing the paper.

Conflicts of Interest

The authors declare no conflict of interest.

Abbreviations

The following abbreviations are used in this manuscript:
DCDirect Current
FFTFast Fourier Transform
LCRInductance Capacitance Resistance

References

  1. Adams, C. Device and Method for Automatically Tuning a Stringed Instrument, Particularly a Guitar. U.S. Patent 20080282869, 20 November 2008. [Google Scholar]
  2. Tronical. How It Works? Available online: https://www.tronicaltune.com/how-it-works (accessed on 16 December 2017).
  3. Lynch-Aird, N.J.; Woodhouse, J. Mechanical properties of nylon harp strings. Materials 2017, 10, 497. [Google Scholar] [CrossRef] [PubMed]
  4. Woodhouse, J. Plucked guitar transients: Comparison of measurements and synthesis. Acta Acust. United Acust. 2004, 90, 945–965. [Google Scholar]
  5. Maplin. 3V Ceramic Piezo Transducer 27/4.2. Available online: https://www.maplin.co.uk/p/3v-ceramic-piezo-transducer-2742-qy13p (accessed on 16 December 2017).
  6. Green, T. Mechanical Behaviour of Nylon Musical Strings. Master’s Dissertation, Cambridge University, Cambridge, UK, 2015. [Google Scholar]
  7. Waanders, J.W. Piezoelectric Ceramics: Properties and Applications; Philips Components: Eindhoven, The Netherlands, 1991. [Google Scholar]
  8. Young, W.C.; Budynas, R.G. Roark’s Formulas for Stress and Strain, 7th ed.; McGraw-Hill Professional: New York, NY, USA, 2002. [Google Scholar]
  9. Waltham, C. Harp. In The Science of String Instruments; Rossing, T.D., Ed.; Springer: New York, NY, USA, 2010; Chapter 9. [Google Scholar]
  10. Benson, D.J. Music: A Mathematical Offering; Cambridge University Press: Cambridge, UK, 2007; p. 166. [Google Scholar]
  11. Kollmeier, B.; Brand, T.; Meyer, B. Perception of speech and sound. In Springer Handbook of Speech Processing; Benesty, J., Sondhi, M.M., Huang, Y., Eds.; Springer: Berlin/Heidelberg, Germany, 2008; Chapter 4; p. 65. [Google Scholar]
  12. Hunter, J.D. Matplotlib: A 2D graphics environment. Comput. Sci. Eng. 2007, 9, 90–95. [Google Scholar] [CrossRef]
Figure 1. A schematic representation of the test rig.
Vibration 01 00002 g001
Figure 2. The piezoelectric transducer sitting on top of its circular support. The string is held away from the transducer and support with a semi-cylindrical steel spacer, with a mass of about 0.2 g. The main string section enters from the left of the picture, while the tail section and end clamp are to the right of the transducer assembly.
Vibration 01 00002 g002
Figure 3. The impedance measurement bridge circuit. C r e f = 26 nF; R P = R r e f = 10 M Ω . R A and R B were provided by a 20 k Ω potentiometer which could be adjusted to change the bridge balance. The instrumentation amplifier used was an INA121P, set for unit gain.
Vibration 01 00002 g003
Figure 4. Sketch of the mechanical model, with a stretched string terminated in a spring representing the transducer stiffness.
Vibration 01 00002 g004
Figure 5. (a) The normalised bridge output response of the unloaded piezoelectric transducer; (b) the absolute value of the corresponding impedance of the piezoelectric transducer, assuming it could be treated as predominantly reactive, plotted on log-log scales; (c) the corresponding capacitance response of the unloaded piezoelectric transducer. All three plots cover the range 0.1–6 kHz.
Vibration 01 00002 g005
Figure 6. Variation in the transducer capacitance with the applied static load. For the blue and cyan plots the transducer was mounted on the test rig in the normal way (Figure 2), and the load was varied by altering the string tension. For the green plot, the transducer was instead mounted on a wire loop support, which enabled the transducer to be turned over to measure the effect of a reversed load.
Vibration 01 00002 g006
Figure 7. The bridge output for the piezoelectric transducer loaded by the string (black solid line). The FFT of a manual pluck response is shown for comparison (red solid line). Spikes in the impedance response can be seen near the first few string resonances. The spike at about 2.9 kHz corresponds to the fundamental resonance of the string tail section. The bridge output response for the unloaded transducer is included for reference (dotted black line).
Vibration 01 00002 g007
Figure 8. The output response around the string fundamental frequency (834.6 Hz) with different settings for the resistive arms of the impedance bridge. When the bridge was close to balance (green), the output response had a single peak close to the string resonance. When the bridge was sufficiently out of balance, the response had a distinct peak and trough, with the string resonance lying somewhere between these two points. Changing the direction of the bridge imbalance reversed the order of the peak and trough, but not the overall form of the response. The dashed lines show the predicted responses from Equation (14).
Vibration 01 00002 g008
Figure 9. (a) A repeat of the measured magnitude responses from Figure 8; (b) the real and imaginary parts of the same bridge output responses; (c) the adjusted magnitude responses, after adding a balance correction offset.
Vibration 01 00002 g009
Figure 10. The bridge output responses for different input amplitudes.
Vibration 01 00002 g010
Figure 11. The balanced bridge output responses obtained around the string fundamental frequencies for a range of stress levels.
Vibration 01 00002 g011
Figure 12. Tuning variations with and without the tuning control algorithm. In both cases the string fundamental was increased by about 45 Hz at the start of the test run, causing the string to start creeping. The red sections indicate periods when local heating was applied by placing a 60 W incandescent bulb close to the string. The dashed lines are at ± 3 ¢ .
Vibration 01 00002 g012