1. Introduction
The coffee tree is a tropical evergreen that grows in regions between the tropics of Cancer and Capricorn between 700 and 2000 m above mean sea level [
1]. The coffee fruit is a green small fruit of irregular geometry that is bitter when unripe and sweet when ripe. Colombian coffee and its sub-products are internationally recognized for the excellent quality, from which the profits generate a considerable socio-economic impact in the producer regions [
2]. Coffee fruits are harvested manually by hand-picking ripe fruits one by one. Manual gathering means less than 2.5% of green fruits can be harvested in Colombia [
3]. The harvesting stage is the most expensive and complex of the coffee production process in Colombia. Therefore, there is an interest in studying diverse methods of selectively harvesting ripe coffee fruits.
The direct mechanization in the harvesting of fruits has helped reduce production costs as well as increase the productivity in the harvesting process. Different technologies have been implemented with success in fruits such as apples, peaches, cherries, and olives [
4,
5,
6]. These have overcome limitations such as topography, spatial distribution of the crop, relation between weight and detachment force, etc. A fundamental principle should be applied in mechanized harvesting to achieve the selective detachment of fruits by vibration. It involves transmitting motion to the fruits until the inertial force exceeds the bonding strength between the fruit and the pedicel-peduncle interface [
7]. However, the challenge is more complicated if only ripe fruits should be selectively detached. In the last decades, mechanical harvesting has played an important role in the coffee production chain [
8,
9], since the mechanization process depends on the geographic variability of the crop, fruit selectivity, damage to the plants, and so on. For example, in Colombia coffee crops usually found in mountainous terrains, the harvesting is performed year-round as plants cannot be damaged and only ripe fruits must be harvested. These aspects mean that the mechanization cannot be implemented with success, as in Brazil [
10].
Different vibratory devices have been designed and implemented on the trunk or branches of the tree [
11,
12]. However, harvesting by mechanical vibration requires a knowledge of the mechanical parameters involved in the detachment of fruits, including those related to the natural frequencies, motion amplitude, and application of the vibration time [
10]. Determination of these parameters permits obtaining better performance in the detachment of ripe fruits, as well as diminishes the impact of the motions over the tree. As such, the mechanical properties of the subsystems (i.e., fruit-peduncle) of the tree should be studied to describe their dynamic behavior. It is more feasible from a dynamic point of view to characterize the fruit-peduncle interface since it has small topological differences with respect to the geometry of the trees [
13,
14,
15,
16].
Vibration frequencies and their performance on selective harvesting have been studied experimentally [
11,
17,
18,
19]. Different frequency intervals were established experimentally to stimulate selective harvesting, but these intervals were determined without characterizing the sub-systems. Recently, the efficiency of fruit detachment from coffee plants subjected to mechanical vibrations was studied [
20]. These tests combined different frequencies, which were 16.4 Hz, 20.3 Hz, 24 Hz, 25.6 Hz, 30.0 Hz, and 33.0 Hz. Results showed low selective performance in the detachment of ripe fruits compared with the detached unripe fruits. This means that the modal parameters of the sub-systems (fruit peduncle) should be studied in detail to concentrate the energy of the vibration on the ripe fruits. It is important to understand the detachment mechanisms of ripe fruits, since experimental studies have not had success when the tree itself was stimulated. This is seen an opportunity to comprehend the dynamics of the coffee fruits, since vibrations in inadequate frequencies could damage the trunk, defoliate the tree, and detach unripe fruits.
Recently, numerical simulations were performed to determine the frequency intervals at which the fruit system can be excited with vibration. For example, a modal analysis for determining the vibration modes of coffee fruits was realized [
14]. However, in this study, the mechanical properties of the fruit were not defined clearly. A complementary modal analysis on the fruit peduncle system was performed by Tinoco et al. [
15] to identify natural frequencies with its respective associated vibration modes. The study showed convergence in the determination of natural frequencies, which were called selective frequencies. These showed significant differences between the different ripening stages. Specifically, the differences were demarked with fruits in incomplete ripening stages. To achieve the simulations, the mechanical and geometrical properties of the fruit were obtained with numerical procedures combined with experimental data. The natural frequencies and modal shapes of the fruit-stem-branch system were computed by applying a stochastic finite element method which was performed by Coelho et al. [
21]. The elastic modulus and the specific mass were treated as random variables in the simulation. Therefore, the natural frequencies were determined as a function of the mechanical properties, including its variability. The study performed by Tinoco et al. [
22] showed a harmonic finite element analysis of a glomerulus of three fruits in different ripening stages that were combined in four groups of fruits. Applying a chirp force signal verified which fruit could be detached based on an experimental detachment model. Results indicated that dynamic excitations applied in between 130 to 150 Hz detached only ripe fruits.
The aim of this study was to analyze the stresses generated at the pedicel-fruit and pedicel-peduncle interfaces by means of forced vibrations using finite element analysis. The topology of the fruit (computer aided design (CAD) models) was reproduced applying the methodology reported by Tinoco et al. [
15]. Additionally, an estimation of the Young’s modulus is proposed from an analytical equation to the semi-experimental data of elasticity obtained by Tinoco [
19].
2. Geometric Model for the Fruit Coffea arabica L. var. Colombia [15]
Coffea arabica L. var. Colombia fruits can be represented from anthesis until maturation by a computer model established by Tinoco et al. [
15] which can describe the growth from an initial volume
until a posterior volume
.
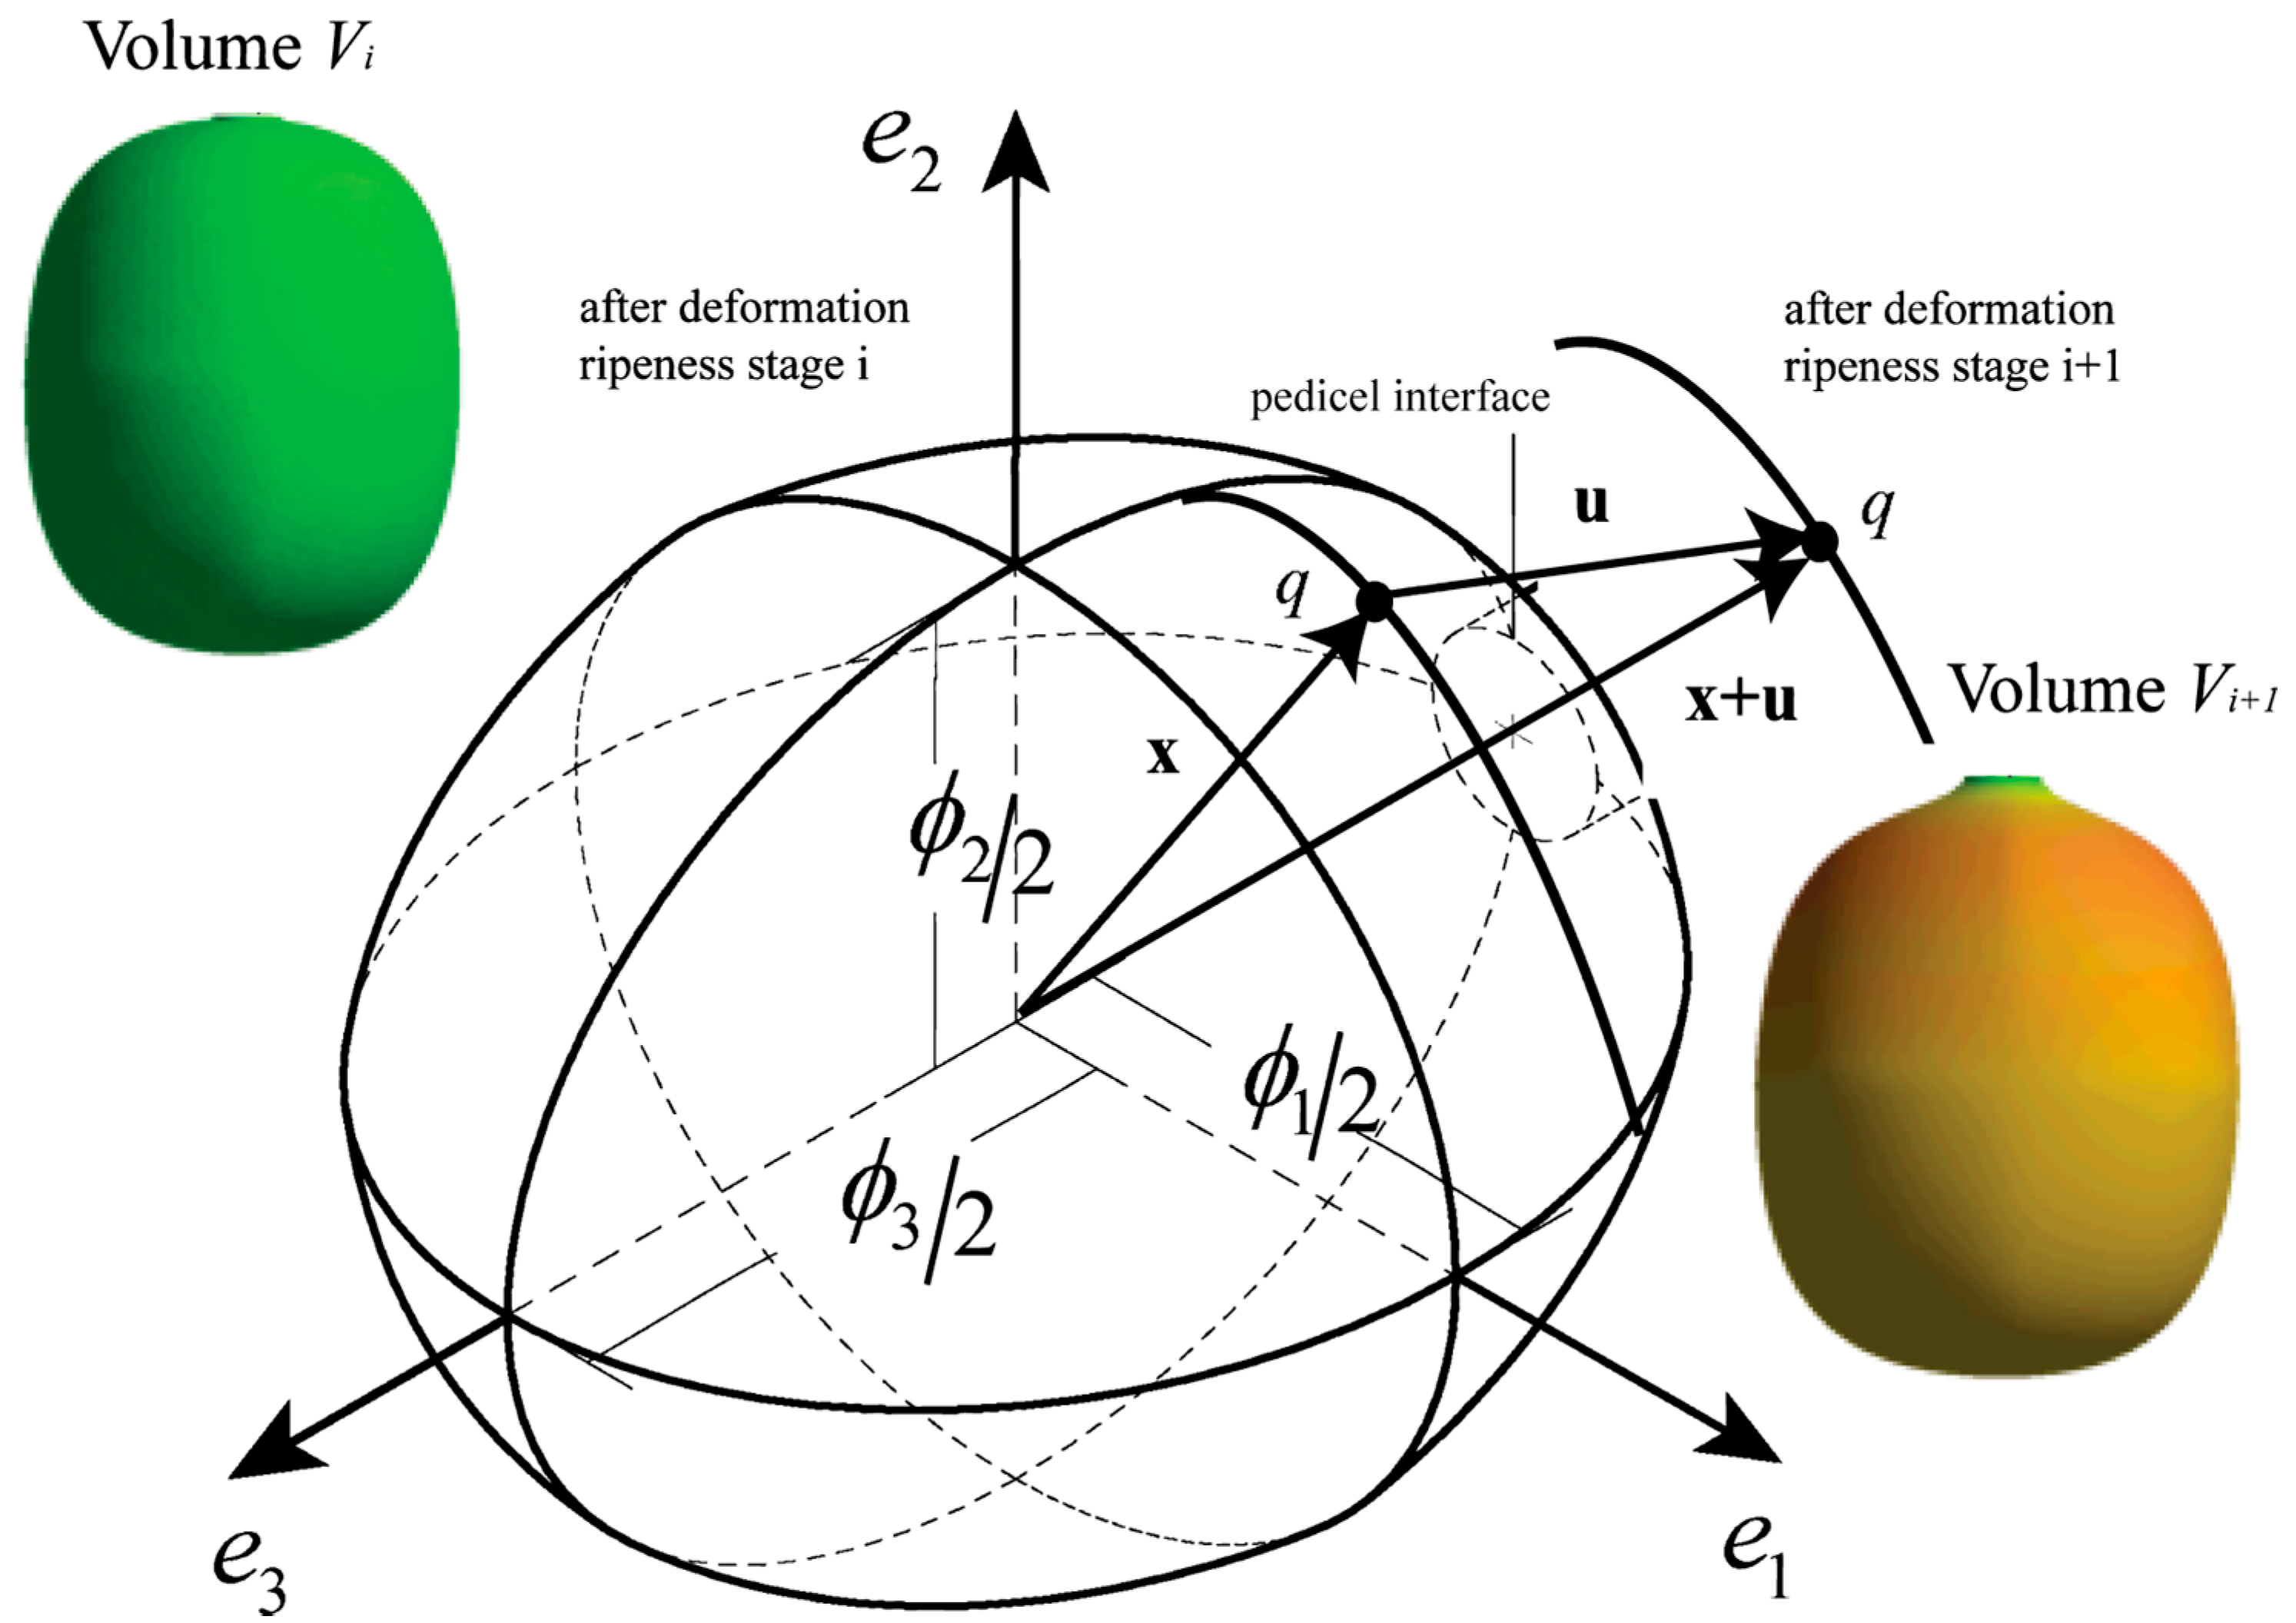
Figure 1 shows a fruit oriented at the three directions defined by the unitary vectors
,
and
, which define the shape in each stage of ripening, where
and
are equatorial directions for the diameters
and
, respectively, such that
.
is the polar diameter in the
direction, orthogonal to the plane
−
. Diameter
is the highest diameter in this plane, which consequently defines
. The directions
,
and
are orthogonal by definition. Orthogonal diameters are variables that depend on the ripening time [
23], and the hyperplanes established by
,
and
are symmetric planes in the fruit, as demonstrated by Tinoco et al. [
15].
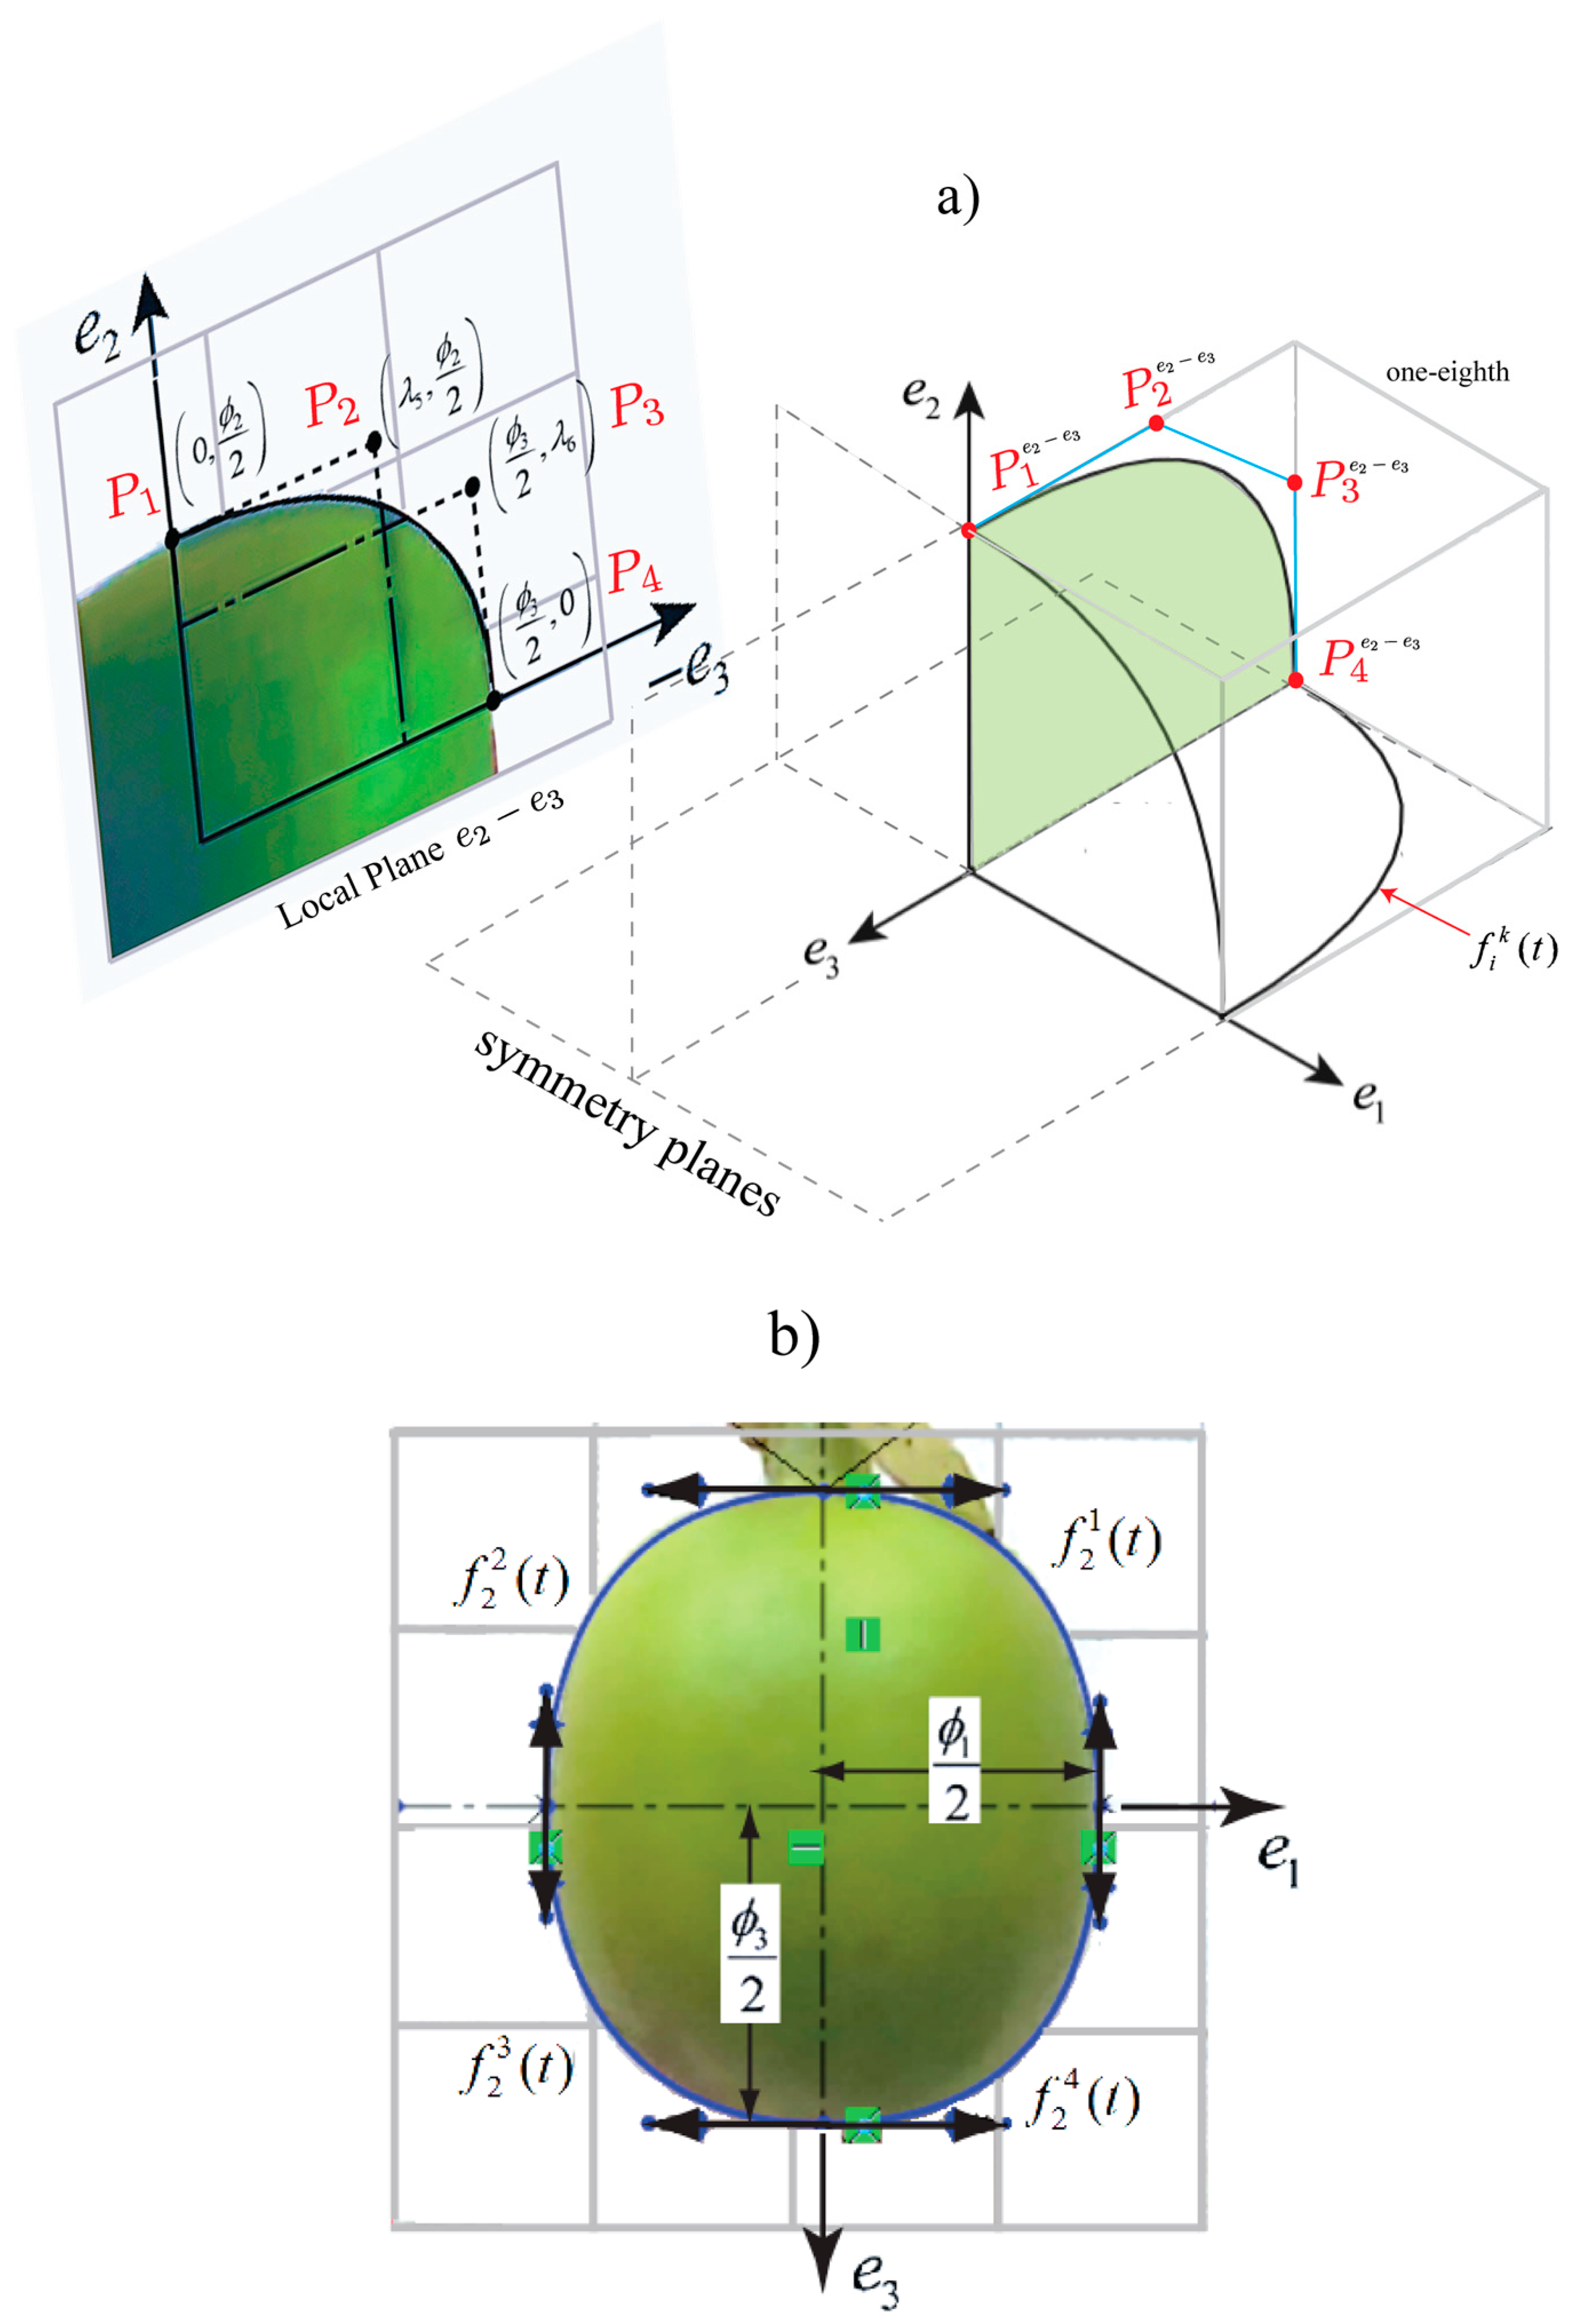
A set of equations
, dependent on the time, represent one-eighth of the fruit. This is limited by the planes
, as illustrated in
Figure 2. Bezier cubic functions are established as functions for the set
. Each boundary is constructed from the control points
,
,
and
determined for each plane
. These functions describe the shape in each eighth by means of the following calculation:
where
,
and
is the quarter of the fruit in the plane. Considering the symmetry planes, each eighth is symmetric to these planes. Coffee fruit geometries were designed in SolidWorks
® software 2014 (Dassault Systèmes SolidWorks Corp., Waltham, MA, USA) applying the methodology described by Tinoco et al. [
15], which included using digital images for the geometric reconstruction of the fruit, as shown in
Figure 2b. The fruit models are the same obtained in the study carried out by Tinoco et al. [
22]. Posteriorly, geometric models of the fruits will be used for harmonic finite element analysis.
4. Finite Element Analysis of Fruit-Peduncle Structure
In this section, we present a finite element model (FEM) to study the stresses generated at the pedicel-fruit and pedicel-peduncle interfaces at different ripening stages. Analysis involved the application of a harmonic force on isolated coffee fruits as described in
Figure 5. A computer SONY VAIO PC (M350 2.27 GHz i3 CPU, 8 GB RAM) with Windows 7 operating system was used to carry out a harmonic analysis in ANSYS
® software version 14.5 (ANSYS Inc., Canonsburg, PA, USA). There were necessary computer aided design (CAD) models (geometric models) of fruit to define the finite element model. Five fruits were designed in the following stages: unripe 196, unripe 210, semi-ripe 224, ripe 231, and overripe 238. For each fruit model, geometry of the pedicel and peduncle was assumed to be cylindrical and was designed using the geometric data published by Álvarez et al. [
28] and Martinez-Rodríguez et al. [
25]. The deviation of the pedicel with respect to the peduncle was assumed to be 45°, since direction is irrelevant for the stiffness of the peduncle and the diameter was considered to be 2.11 mm. CAD models were drawn using SolidWorks
® software 2014 (Dassault Systèmes SolidWorks Corp., Waltham, MA, USA) with the methodology outlined in
Section 2, which was proposed by Tinoco et al. [
15]. Elastic properties of the fruit and peduncle-pedicel are described in
Section 5 and correspond to numerical approximation performed by Tinoco et al. [
15]. As shown in
Figure 5, kinematical considerations for the fruit-peduncle model are described by the following boundary conditions: (1) clamped at the point A and (2) free structures (fruit and pedicel). The fruit-pedicel and pedicel-peduncle interfaces are bonded and continuous. Different mesh types were used for the simulation of each structure. The selected elements were hexahedral for the pedicel and tetrahedral for the peduncle.
For the simulation, a harmonic force was applied to the fruit in the
direction as shown in
Figure 5. The applied force was
, where
is frequency. The application of the force was performed in a frequency range between 0 and 4000 Hz. With respect to the location of the force, it is known that dynamic excitations in frequency stimulate the natural behavior of the systems, independently of the location of forces, if the system satisfies the same boundary conditions. This statement is not true for nonlinear cases that include friction and vibro-impact among others. In the case of any external force applied constantly on the fruit, the stress values will be different in the interfaces of the fruit and peduncle. However, these will have a qualitative sense in our study, since the aim was to show that there are frequency intervals where ripe fruits can be dynamically stimulated without affecting the unripe fruits. For harmonic stress analysis, the stresses were be determined at the interfaces of the pedicel (inferior and superior) with the following stress intensity determined by the following expression:
where
is the maximum principal stress and
is the minimum principal stress. It is important to point out that the stresses were be obtained at the edge of the inferior and superior interfaces of the pedicel as described in
Figure 5.
5. Results and Discussion
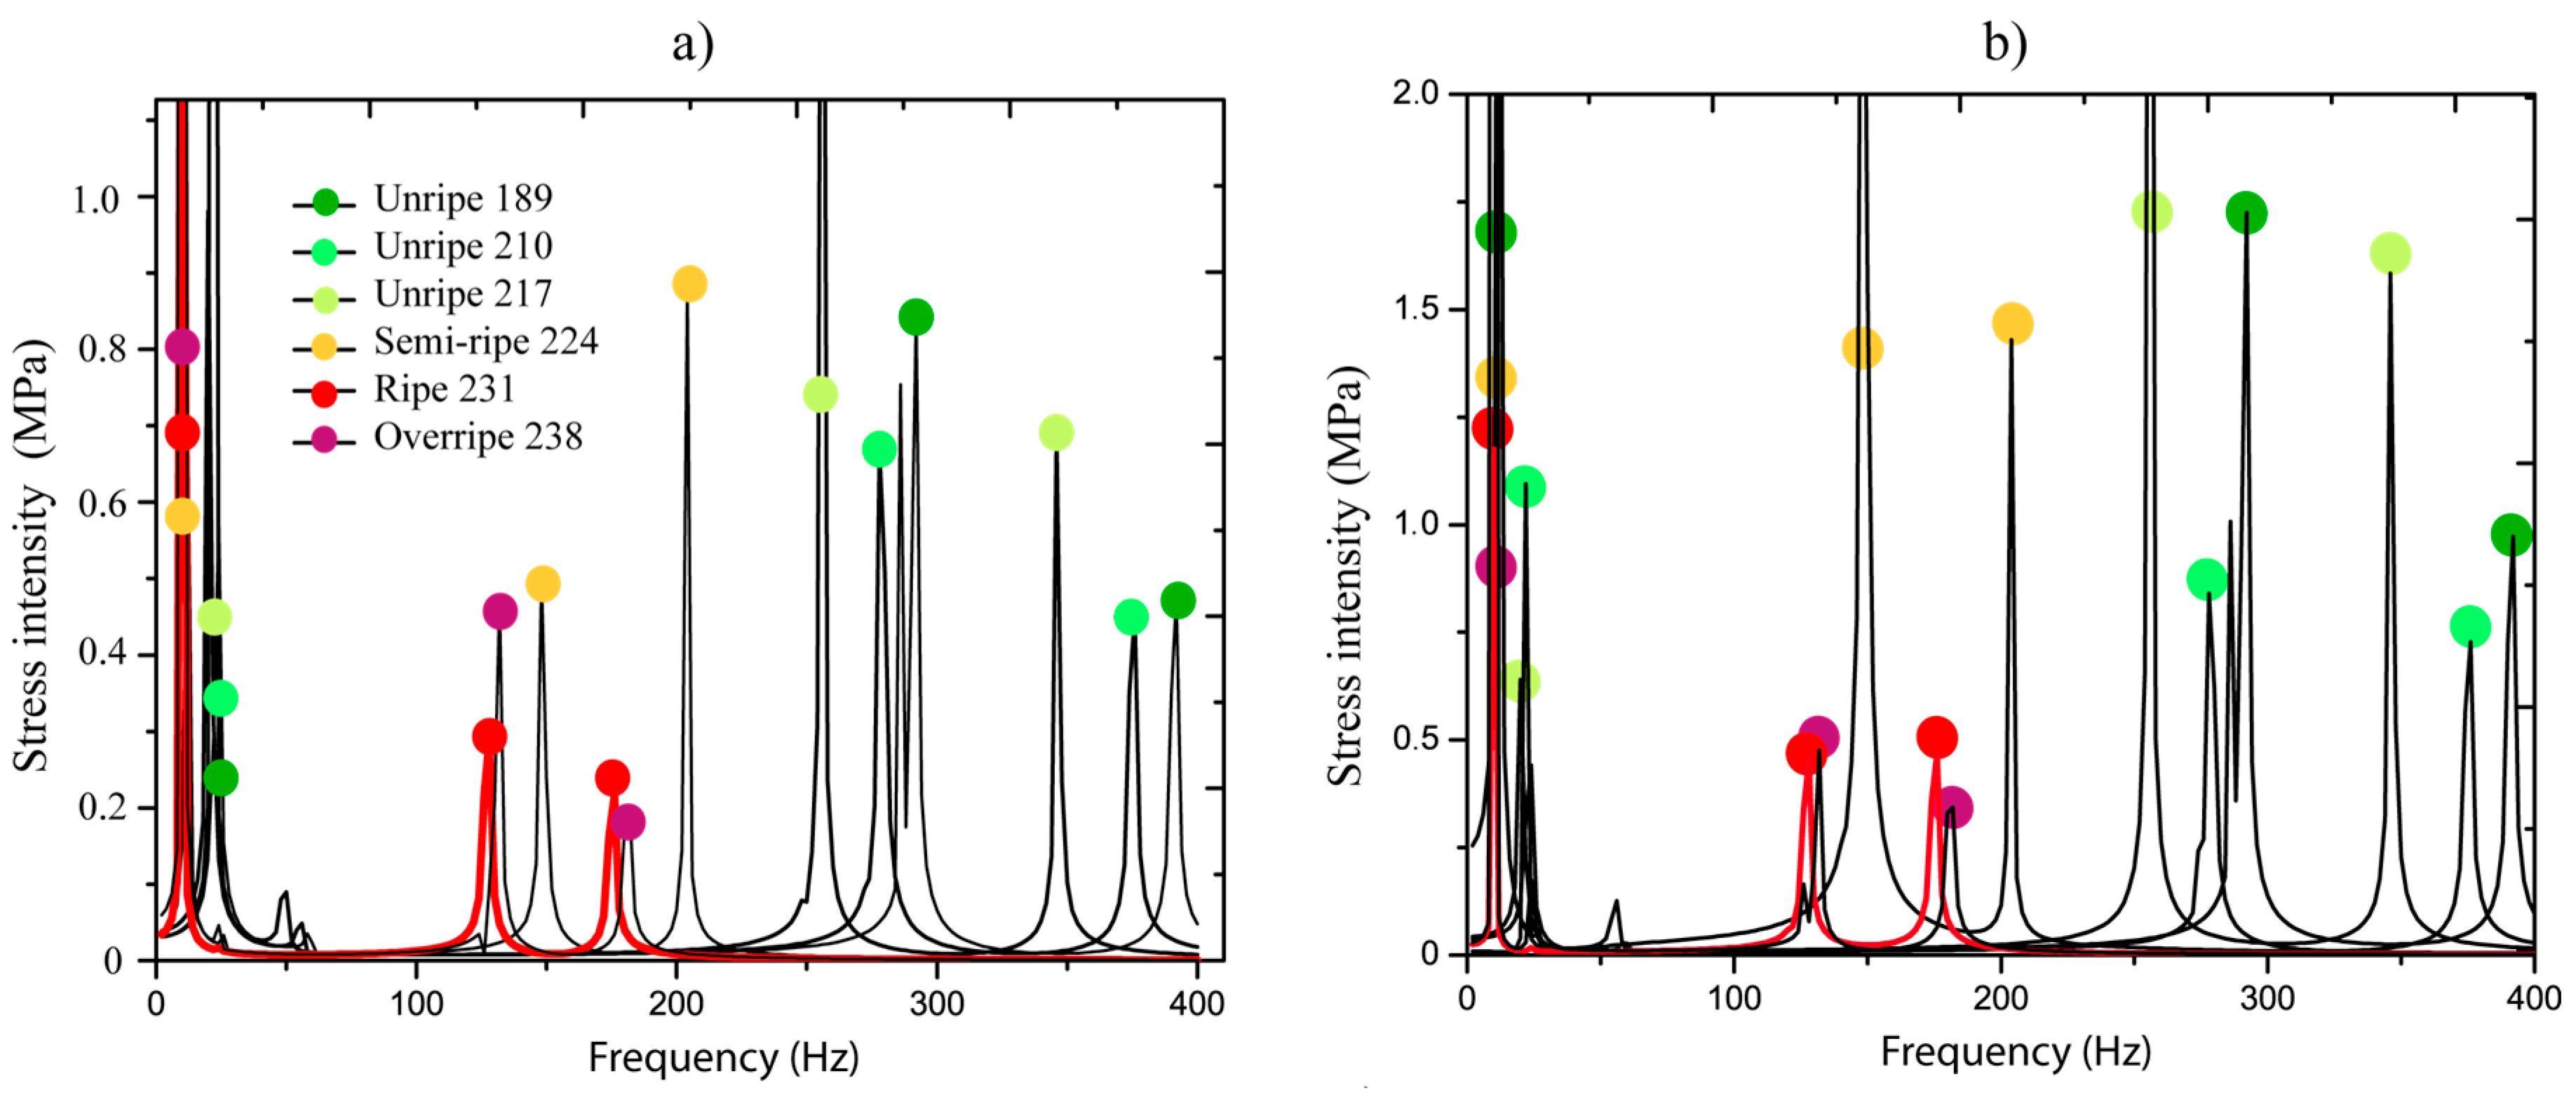
Figure 6a,b show the stresses generated at the pedicel interfaces by the harmonic force applied in the frequency interval of 0–400 Hz. The force was applied on fruits in different ripening stages (189, 210, 217, 224, 231, and 224 DAA), the ripening is measured in days after anthesis (DAA). Colors represent each ripening stage and the highlighted red line indicates the ripe fruit (231 DAA). We observed that, for each ripening stage, just three peaks appeared in all frequency bandwidths, which corresponded to the natural resonances. It was indicated that, for each natural frequency, kinematics associated to the resonance exists, which is called vibration mode or shape. It is important to point out these dynamic characteristics because they are considered in the analysis.
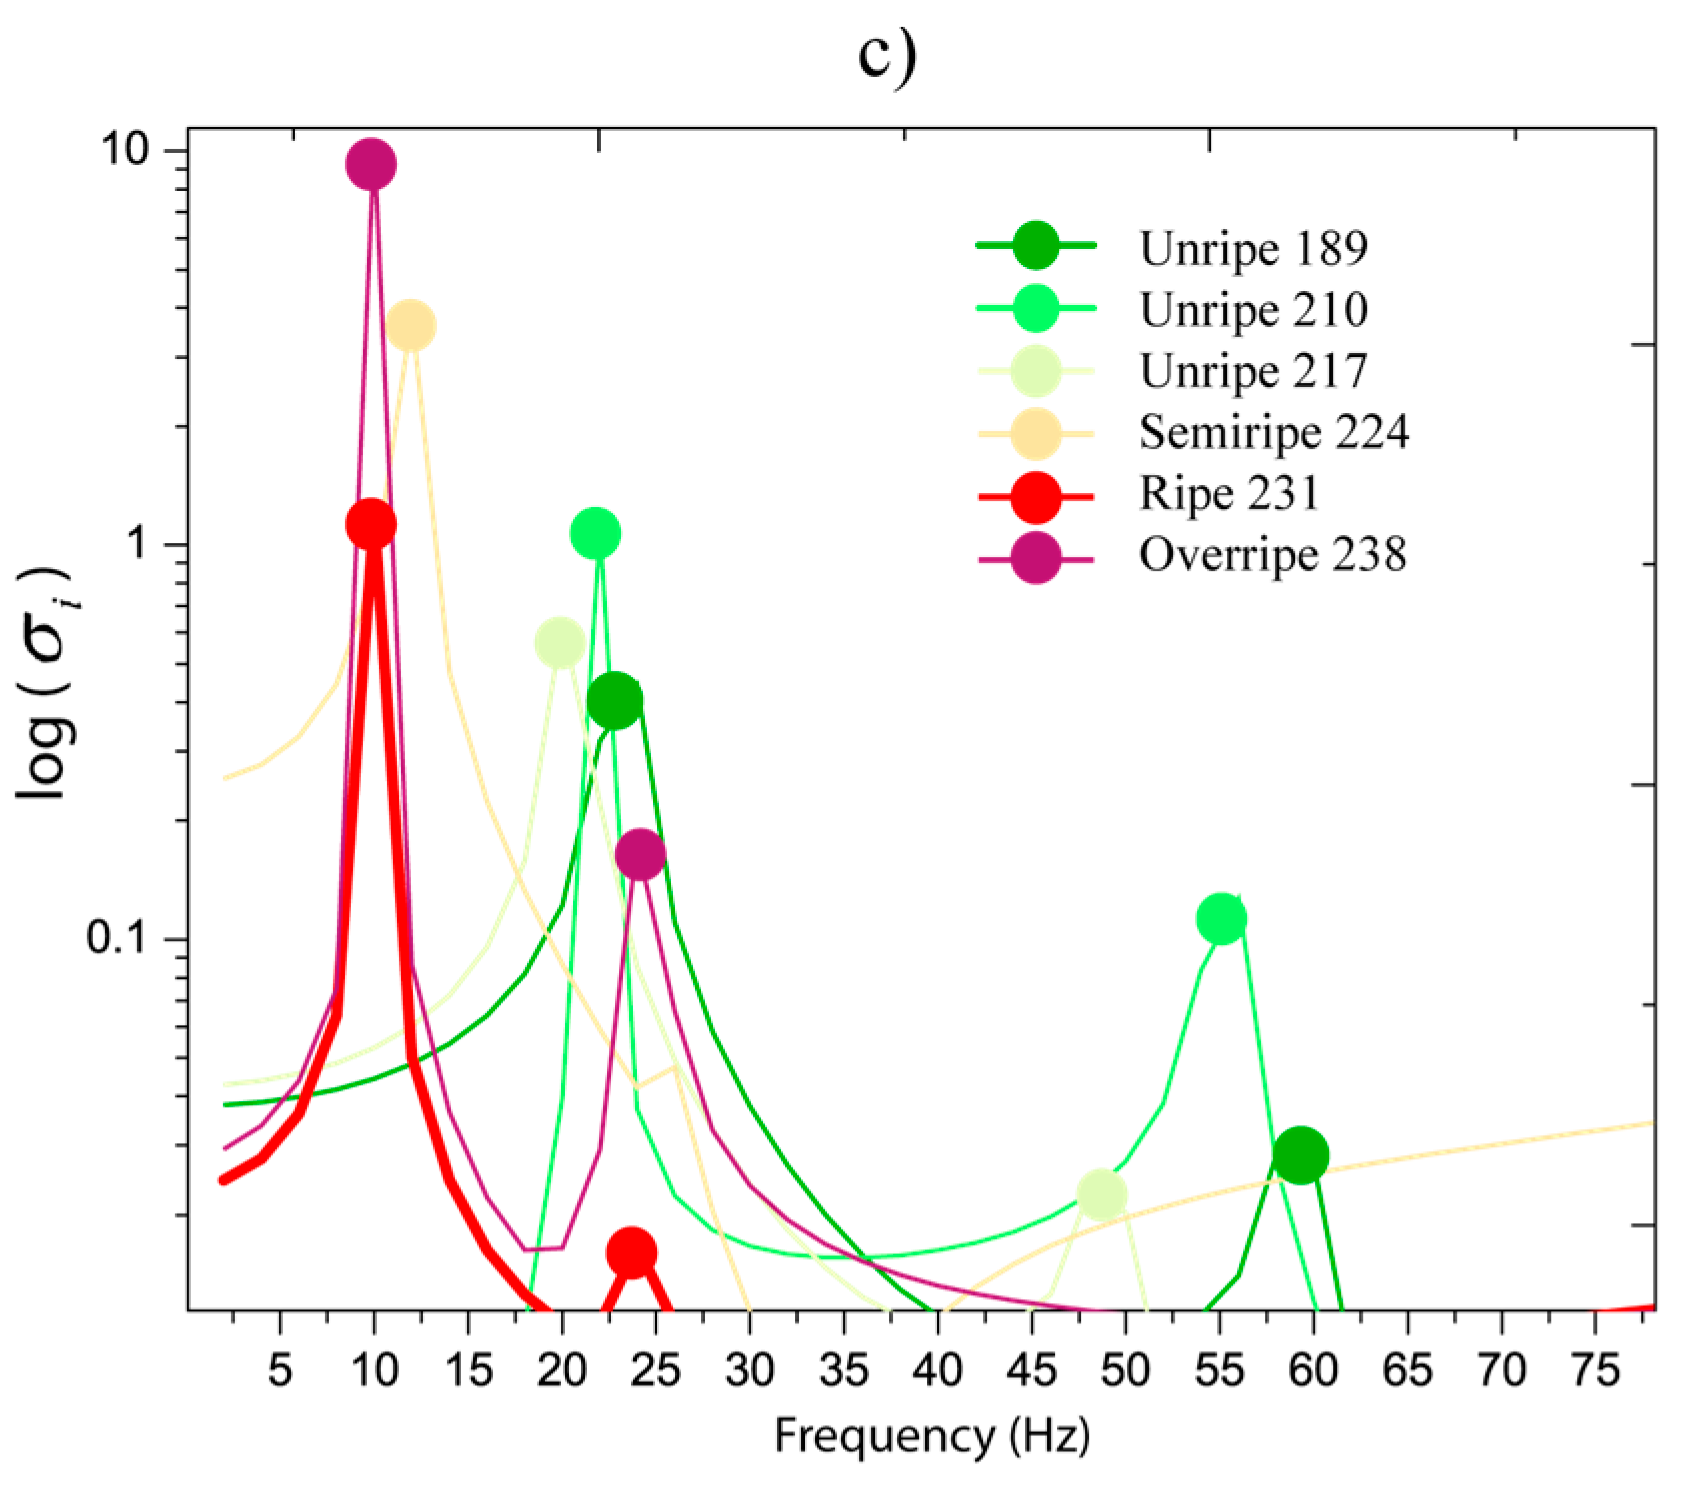
Figure 6c demonstrates that stresses are greater when the ripening is close to the overripe state in the first resonance frequency. Basically, the stress values oscillated in 0.2 and 1 MPa in the unripe state from 189 to 217 DAA. When ripe, 224 to 238 DAA, the stress values are between 1 to 10 MPa. We observed that resonances in 5–30 Hz are very close. This indicates that if a system with various fruits in different ripening stages is excited, all fruits will be stimulated and this is not favorable for selective harvesting purposes. The main idea is that fruits in ripe stages are dynamically stimulated.
In
Figure 6a,b, the behavior of resonances 2 and 3 are analyzed, respectively. We determined that when the fruit is in any ripening stage, the ratio
between the natural frequencies has a mean of 73.7% with a standard deviation of 0.93%. This means that the natural frequency 2 represents 73.7% of natural frequency 3 in all ripening stages. The relationship shows that when the natural frequency 2 is moving to the left (ripening process), the ratio
stays constant.
Figure 6a,b show that the stress values in natural frequency 2 are greater than those produced in the third resonance in the majority of cases. Therefore, a higher detachment impact over the interfaces (pedicel-peduncle and pedicel-fruit) can be produced by the dynamics of resonance 2. Further, we observed that the natural frequencies 2 and 3 were isolated for the ripe fruit at 231 DAA (red line) of the others frequencies, which correspond to unripe stages (lower than 231 DAA). This defines the existence of a dynamic stimulus inside the interval 100 to 200 Hz that can directly excite only ripe fruits.
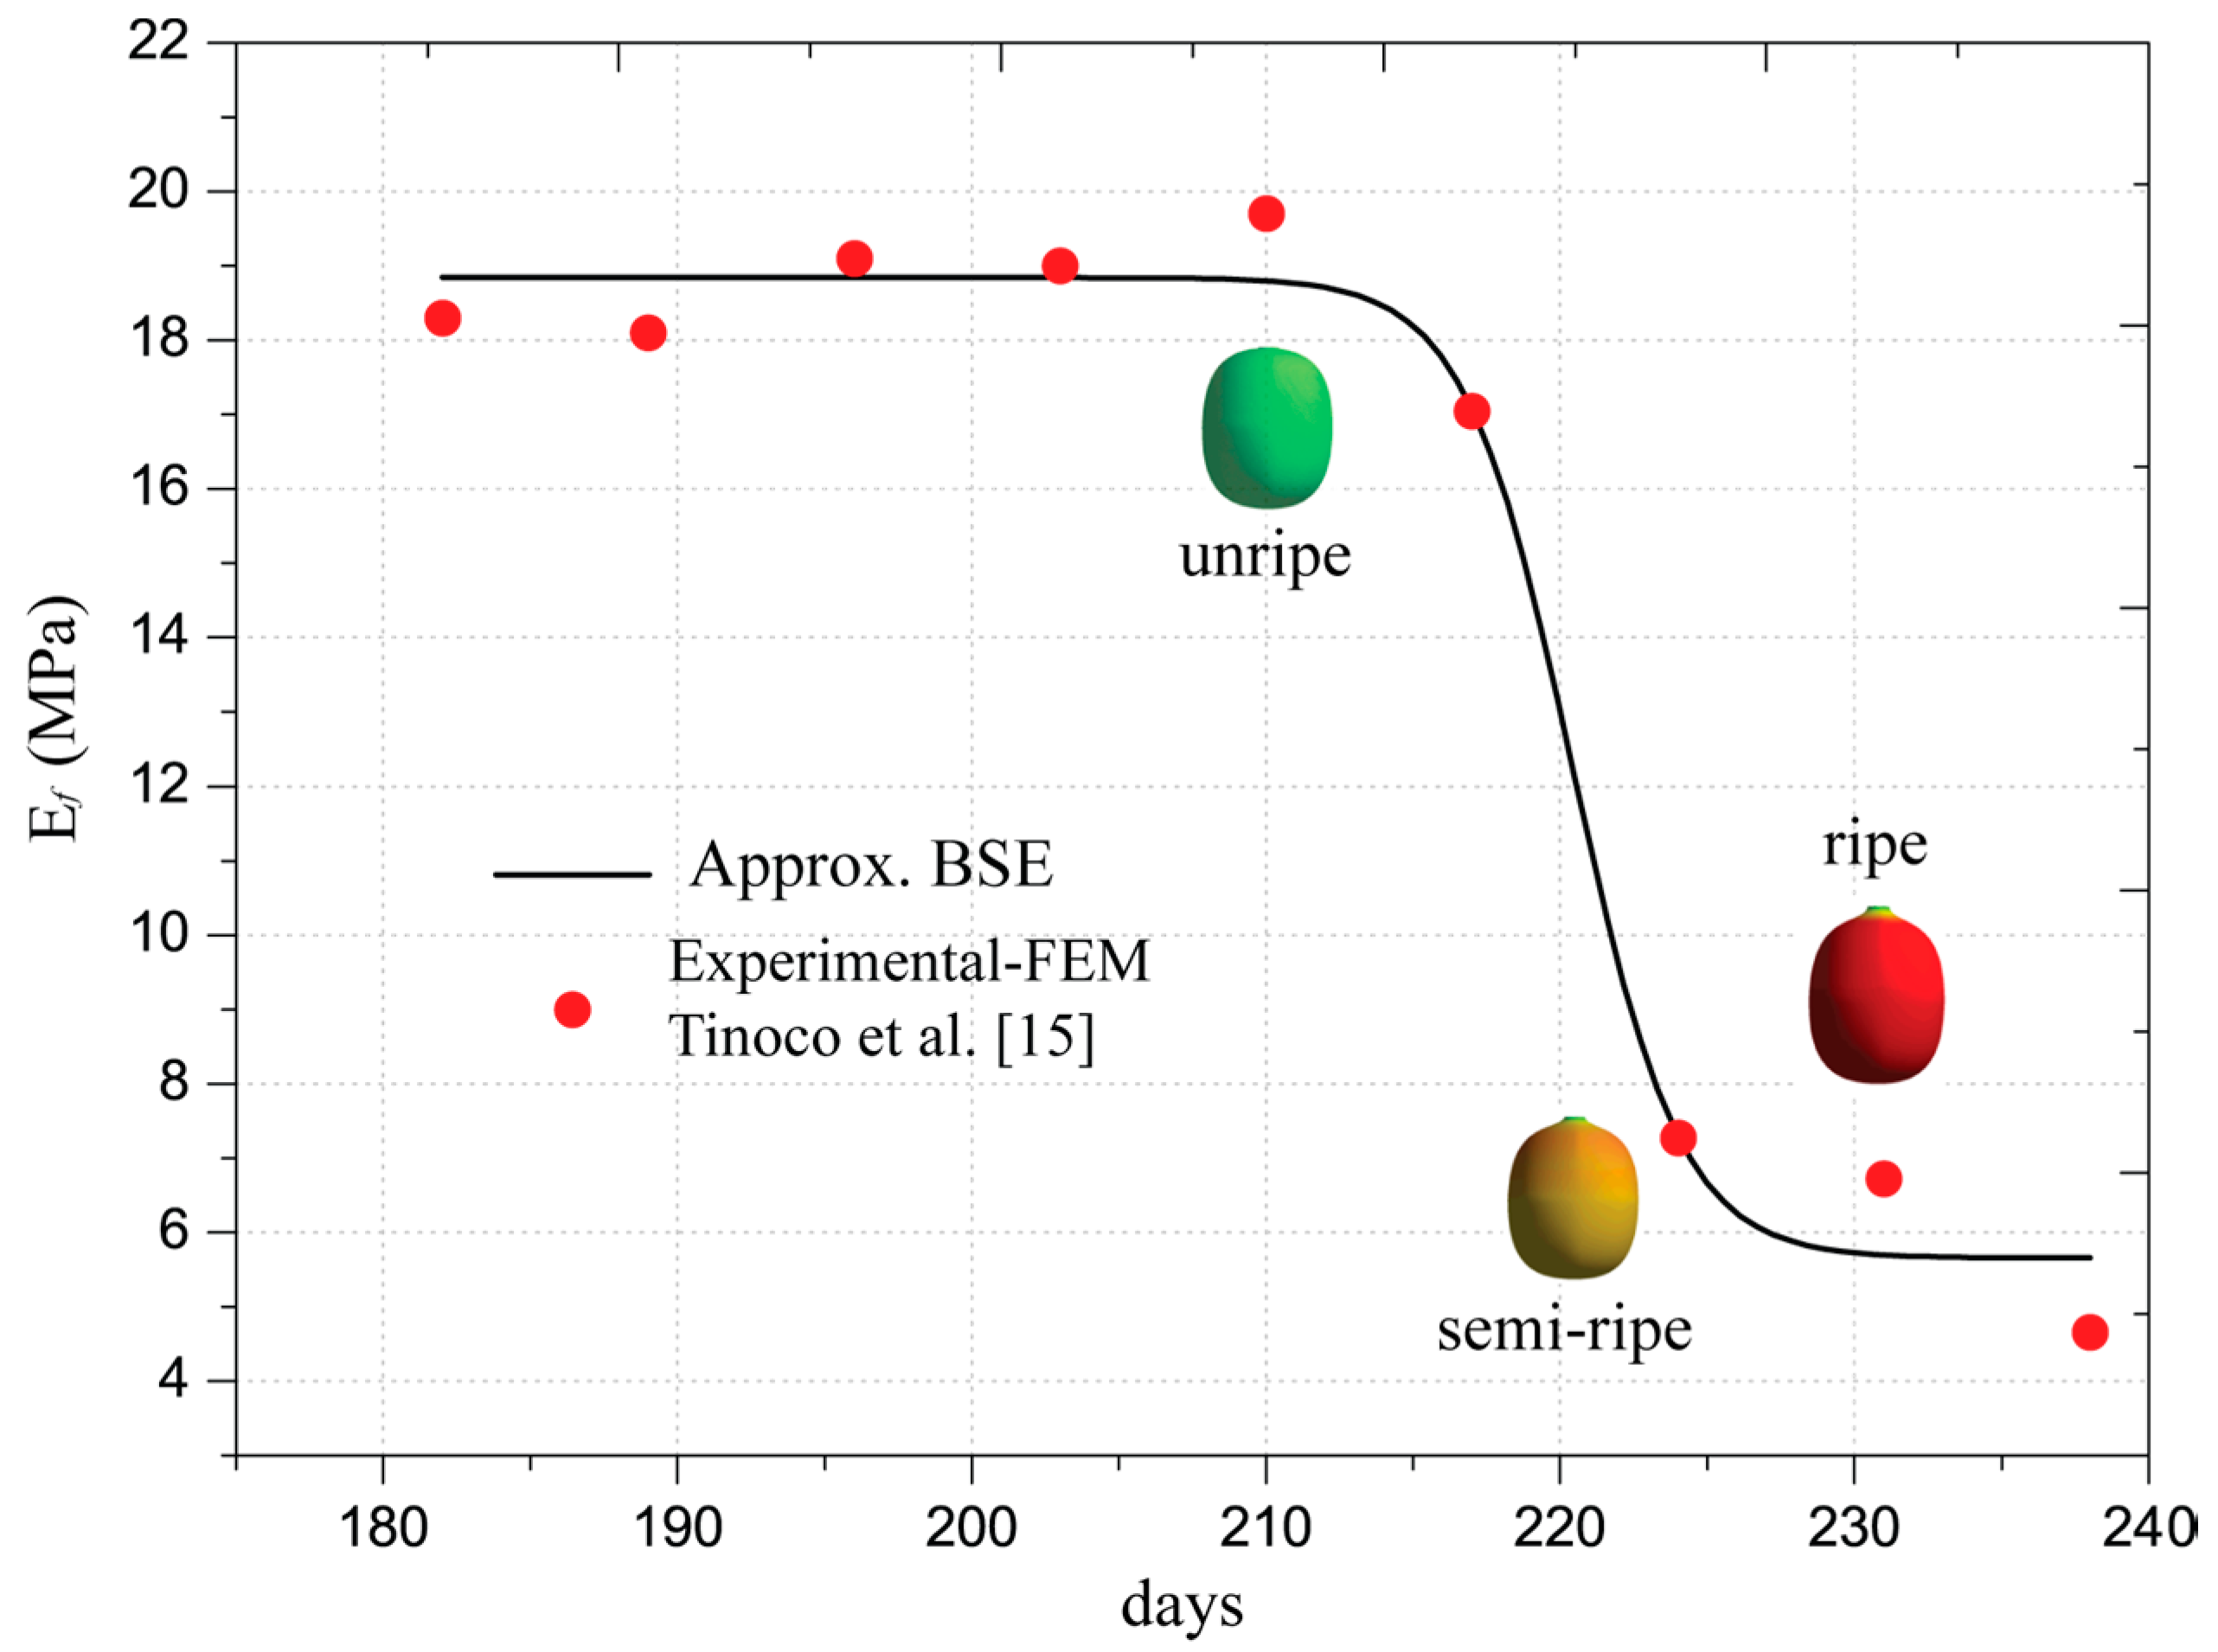
To prove clearly how the natural frequencies 2 and 3 move with respect to the ripening days, two models were approximated using the Boltzmann Sigmoidal Model (BSE) in Equation (3). The constants of the models are listed in
Table 3 and the model is plotted in
Figure 7. The approximations fit with a good accuracy since the correlation
R was close to 1 and the
F is less than 0.05 in ANOVA.
The curves in
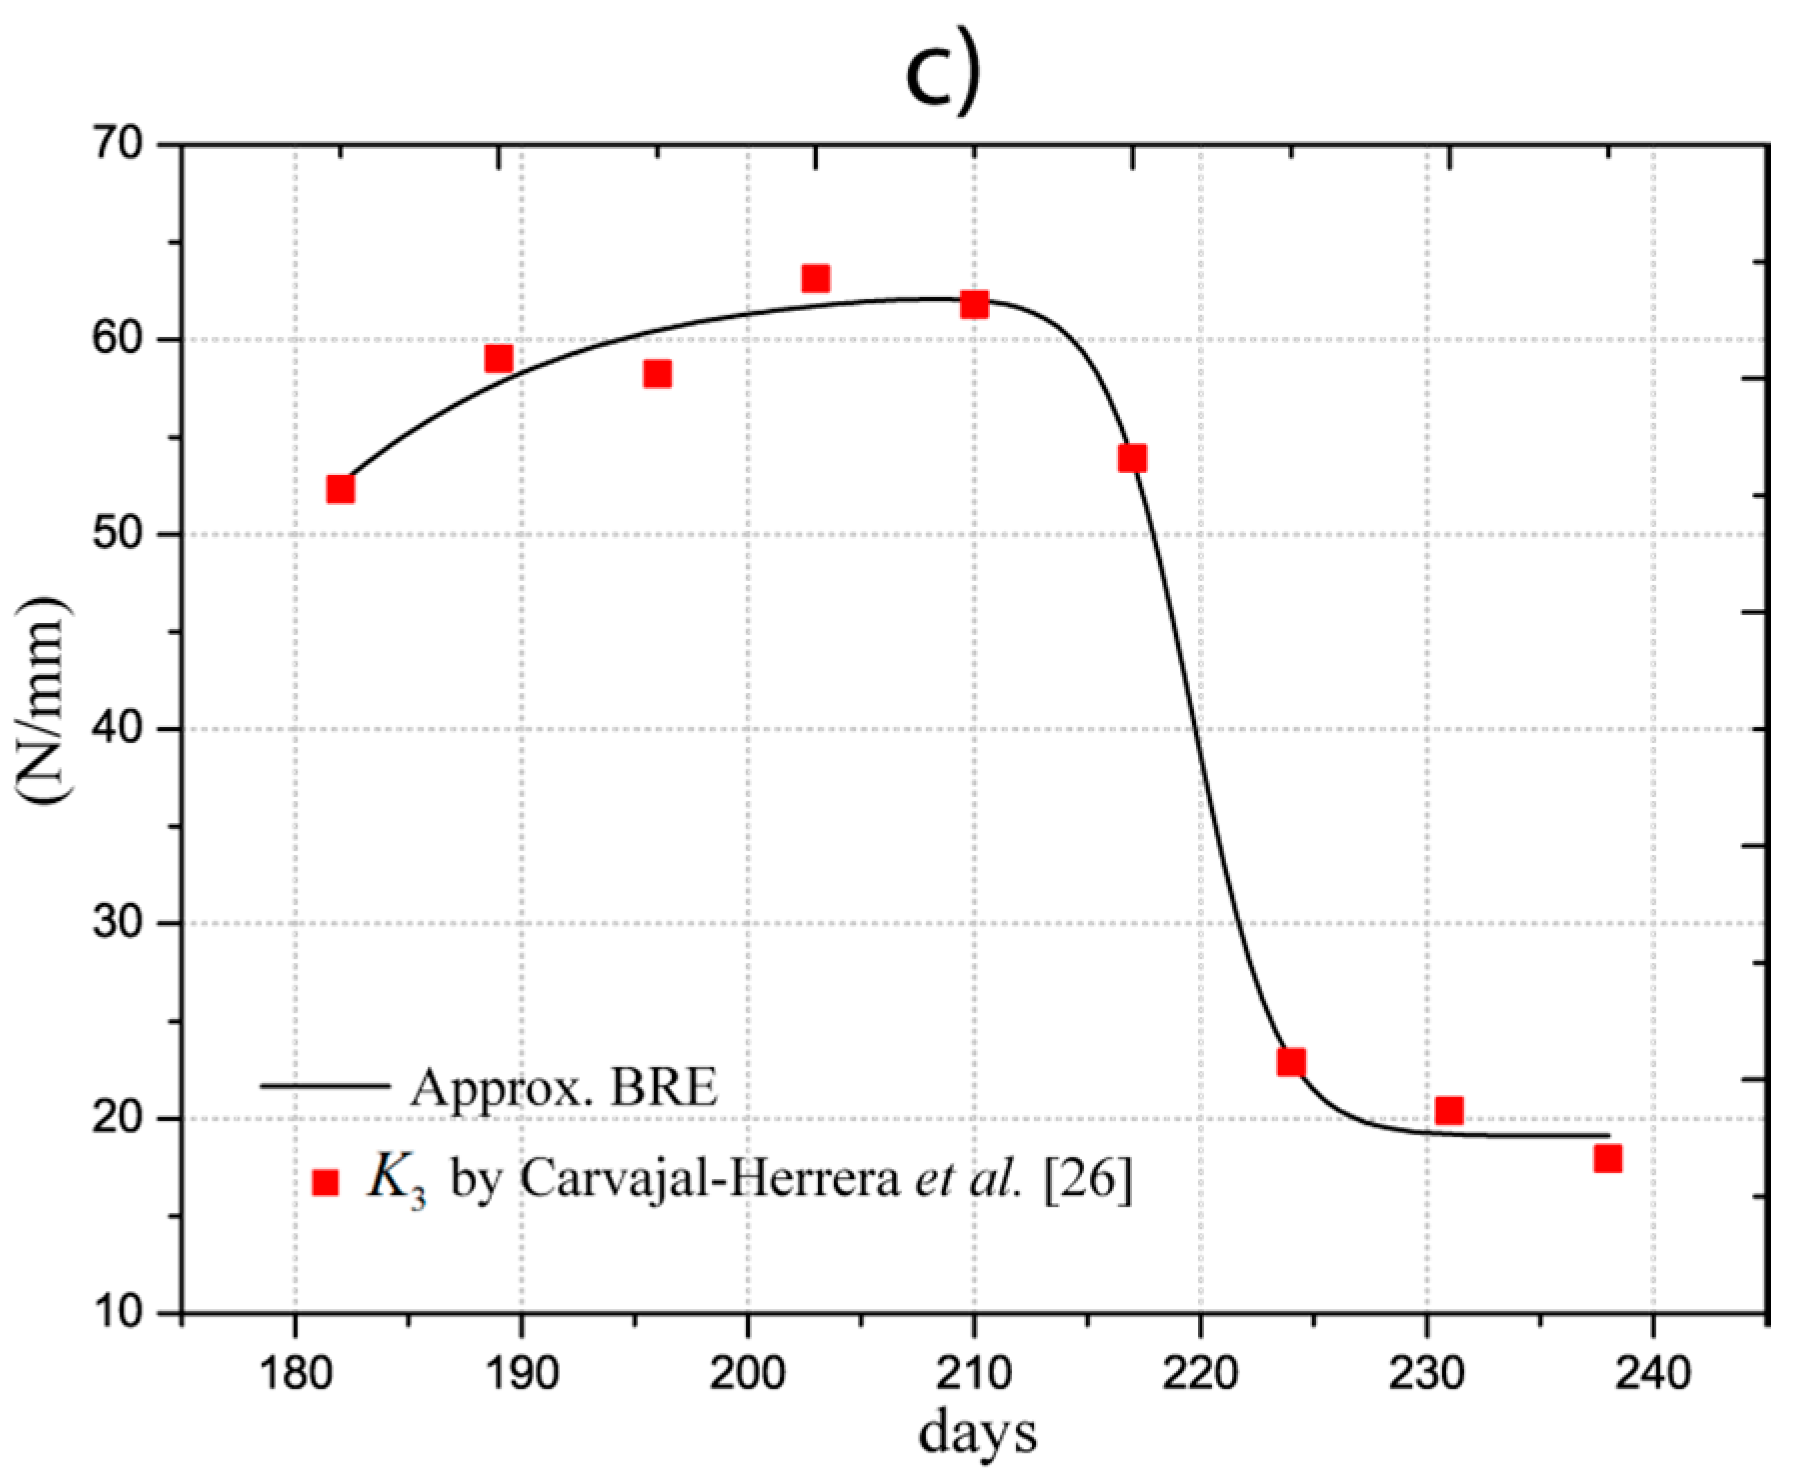
Figure 7 illustrate that both natural frequencies follow the elastic model of the fruit, since it has the same behavior as shown in
Figure 2. Basically, the results imply that the natural frequencies decrease as fruit ripening increases. For the analysis, the frequency interval 120–150 Hz was chosen and is shown in
Figure 7 in gray. In this interval, fruits could be stimulated in the ripening stages 224–238 DAA without any dynamic interference with the other ripening stages. In the case of natural frequency 3, the frequency interval was delimited by 170 to 210 Hz. Nevertheless, if there was excitation in vibration mode 3, the fruits in ripening stages in 220–223 DAA are also excited. Therefore, the frequency range 120 to 150 Hz is better to only stimulate the resonance 2; it was shown to be a feasible frequency spectrum for selective harvesting. Notably, any system coupled to the peduncle, such as a branch will not affect the resonance, since in theory, these will also be coupled in the whole system.
Maximum principal stresses and principal vectors were determined from the simulation to differentiate the stresses generated at the pedicel interfaces, as illustrated in
Figure 8, where the principal vectors for vibration modes 2 and 3 are shown. In
Figure 8a, the stresses generate a bending state in vibration mode 2, since there are fibers under tension (red arrows) and compression (blue arrows) at the same time. This behavior provides a great advantage from a dynamic point of view because the stresses are concentrated at the pedicel-fruit and the pedicel-peduncle joints.
Figure 8a describes the values of the maximum principal stresses that reached a maximum value of 5.03 Mpa for mode 2 using a color scale. In reality, these stresses should overcome the failure stresses of the pedicel fibers to detach the coffee fruit.
In
Figure 8b, the principal directions of mode 3 are analyzed; these act under tension or compression, at the same time producing shear stresses. Maximum principal stresses achieved 0.2 MPa at the interfaces, which are lower than the stress intensity of mode 2 (bending state). The strength properties at the interfaces define the detachment rules and these can be experimentally determined for any variety of coffee fruit.
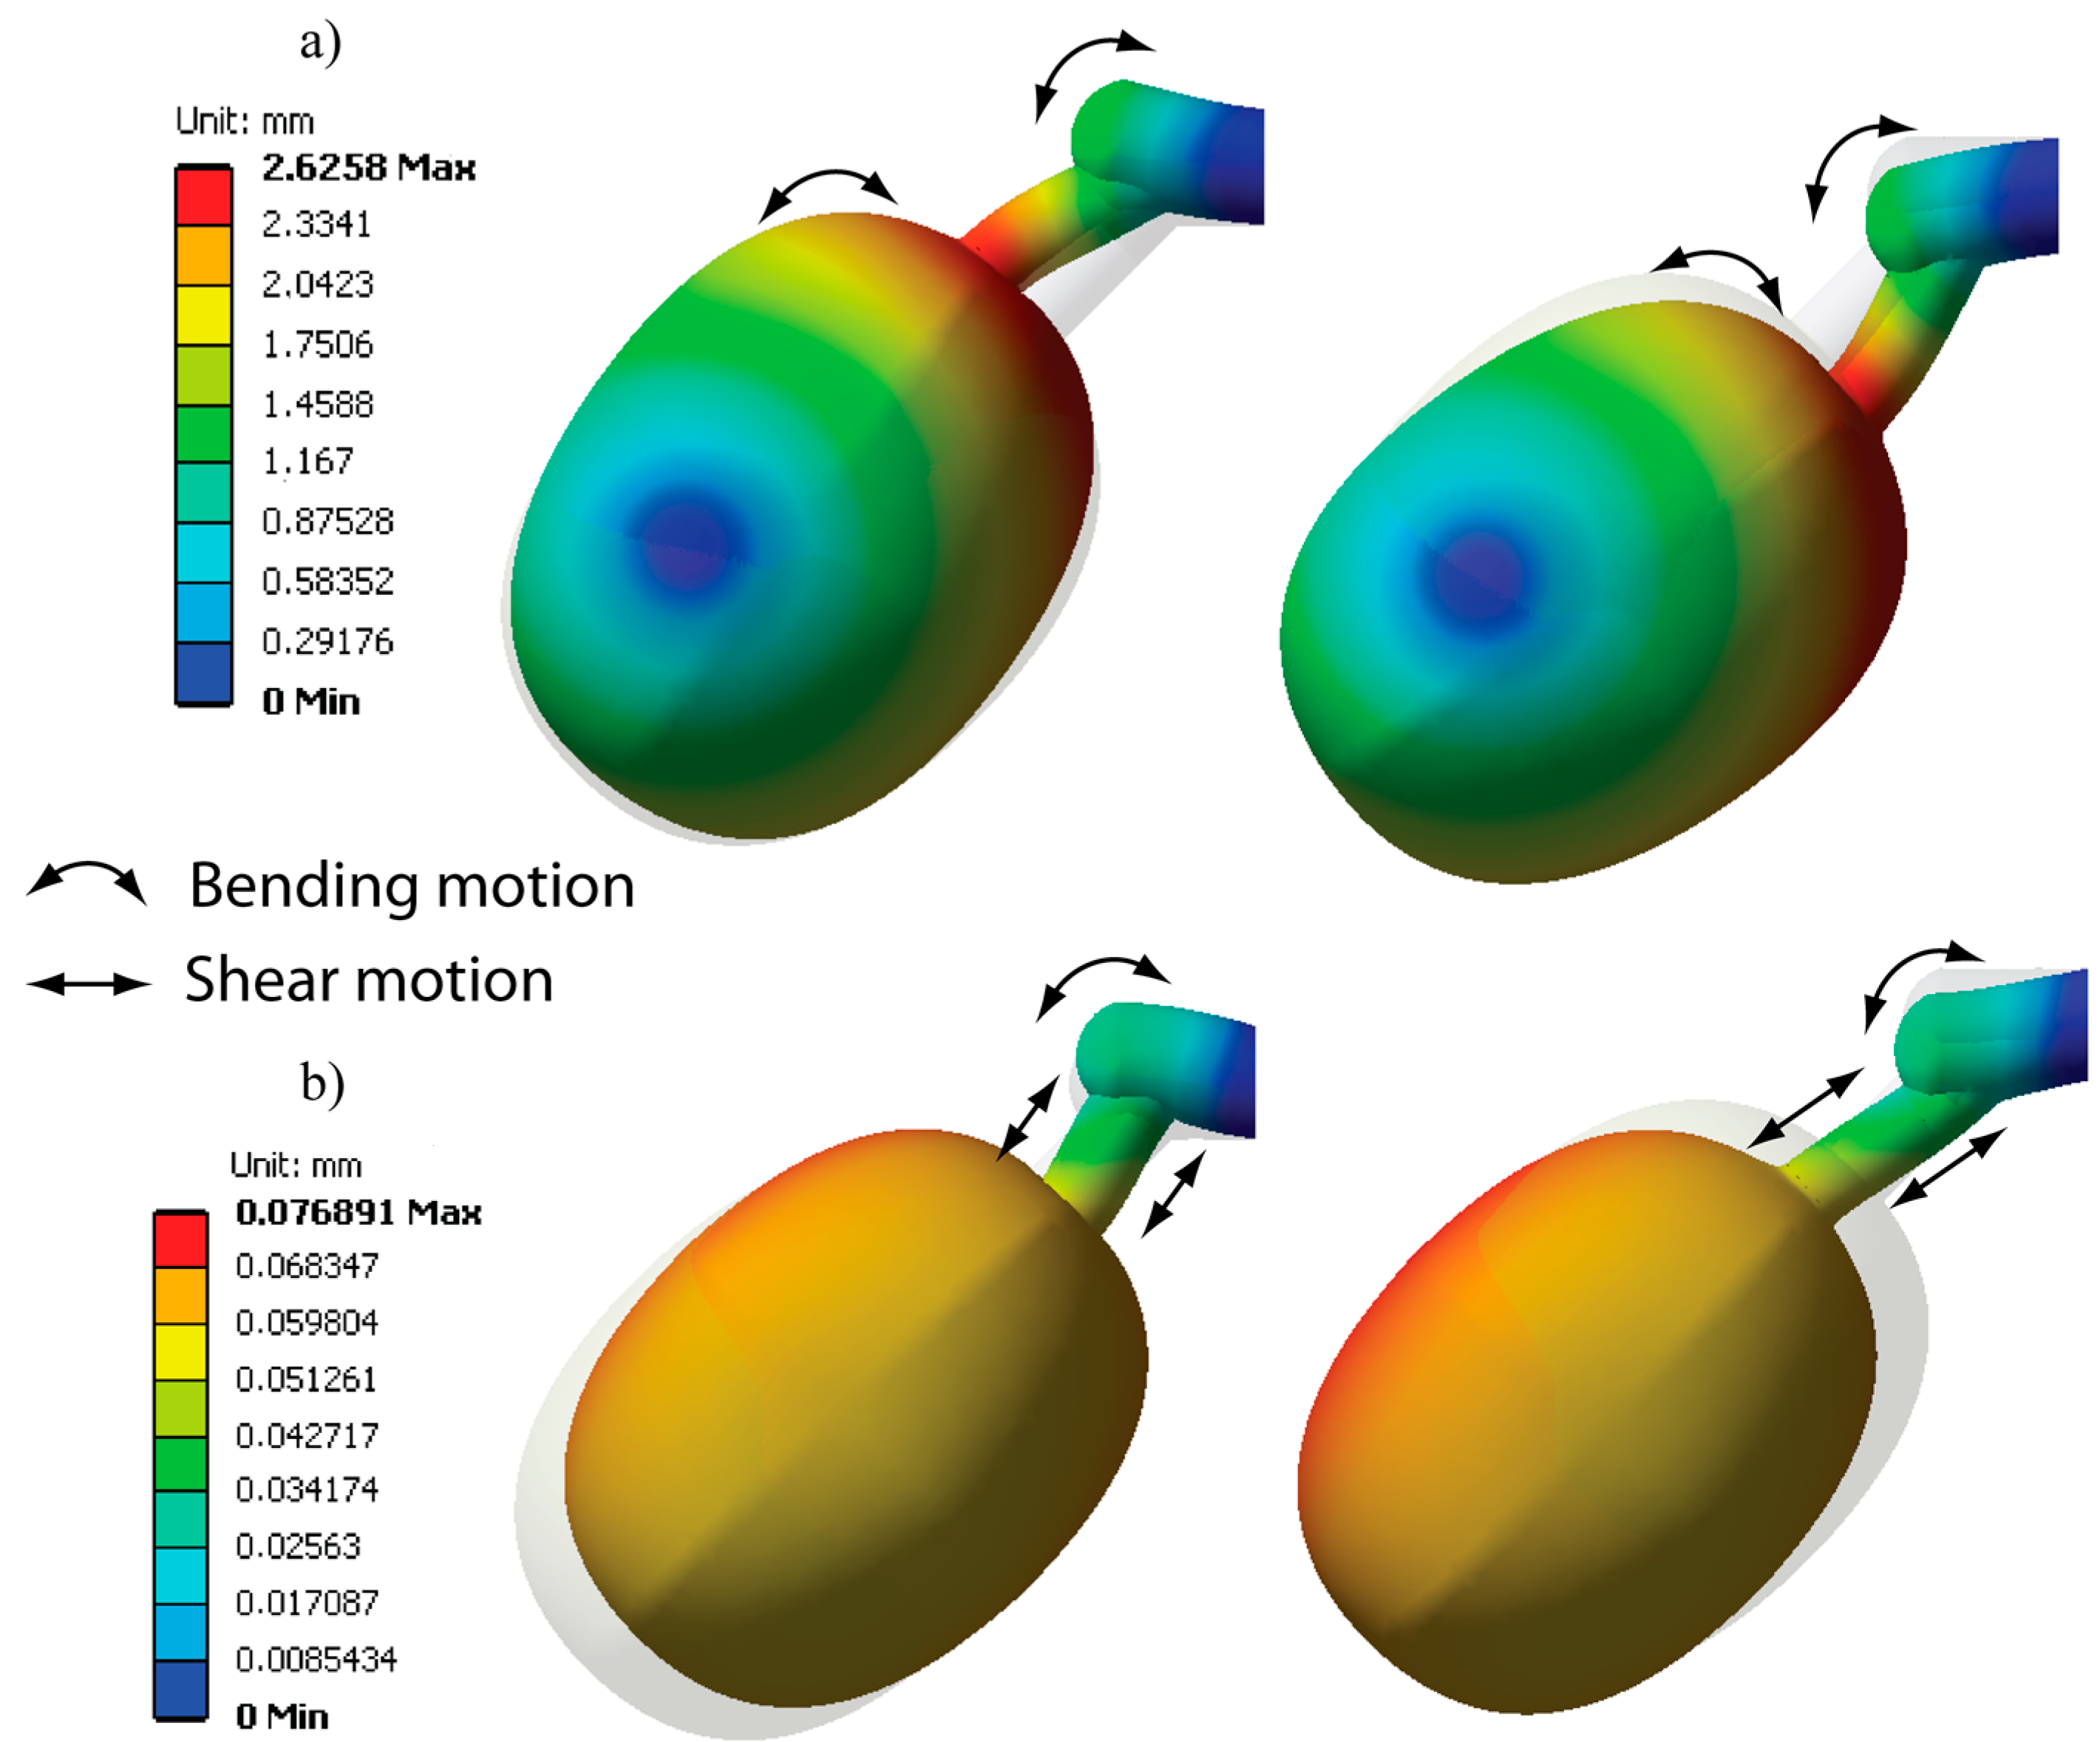
Vibration shapes were computed as shown in
Figure 9. The motion refers to the displacements that the fruits experience in resonances 2 and 3. For mode 2, we observed that the principal motion causes pedicel bending, since the fruit tends to rotate as explained by the stress analysis. The maximum amplitude of the displacement was reached at the pedicel-fruit interface, achieving a maximum value of 2.6 mm. This bending motion helps to produce a failure mechanism at the interfaces. Further, it can be seen that a point of zero motion was evidenced in the fruit, which is demarked in the graph in blue. It implies that the fruit has two points of pivot that promote the rotation of the fruit-peduncle system.
Figure 9b shows the motion of vibration mode 3. In this mode, fruit follows an axial motion with a small rotation that generates shear stress at the pedicel and bending in the peduncle. The maximum displacement achieved by the fruit was 0.07 mm; this value is very small compared with the displacement obtained in mode 2. According to the analysis performed, the frequency spectrum of 120 to 150 Hz for purposes of selective harvesting is presented as a feasible interval for stimulating the detachment of ripe fruits.
