Article

The Wildfire-Triggered Natech Exposure of Fuel Infrastructure at the Wildland–Urban/Industrial Interface in South Korea: Mapping and Scenario-Based Thermal Radiation Analysis


by
Jin-chan Park
1,
Jong-chan Yun
2 and
Min-ho Baek
3,*
1
National Fire Agency, Sejong 30128, Republic of Korea
2
Department of Safety Policy Research, National Fire Research Institute, Asan 31555, Republic of Korea
3
Department of Fire & Emergency Management, Kangwon National University, Samcheok 25913, Republic of Korea
*
Author to whom correspondence should be addressed.
Fire 2026, 9(4), 150; https://doi.org/10.3390/fire9040150
Submission received: 3 March 2026 / Revised: 26 March 2026 / Accepted: 27 March 2026 / Published: 7 April 2026

Abstract

Data on wildfires (burned area ≥ 100 ha) in South Korea were compiled for 2000–2025 and analyzed together with the national geospatial inventories of hazardous fuel facilities to characterize wildfire-triggered Natech exposure and potential consequence distances. In total, 47 large wildfire events were identified, burning approximately 139,800 ha, with all events occurring during the late winter–spring window (February–May). The spatial overlays of wildfire footprints with facility locations identified 805 gasoline/diesel stations and 227 LPG filling stations located within wildfire-affected districts, corresponding to 14.1% of gas stations and 11.5% of LPG stations in the nationwide facility dataset. Facility exposure was geographically clustered, with the highest concentrations occurring in the eastern and southeastern wildfire hotspots. To quantify potential technological impact extents under wildfire escalation, ALOHA simulations were conducted for a wildfire-induced BLEVE/fireball scenario involving a 10,000 L mobile tank with representative fuels (propane for LPG, n-octane for gasoline, and n-dodecane for diesel). The modeled thermal radiation threat zone radii (10, 5, and 2 kW·m−2) were 228/322/502 m for propane, 250/353/550 m for n-octane, and 254/358/559 m for n-dodecane. Together, the event-based wildfire dataset, facility overlay results, and scenario-based impact distances provide an integrated, quantitative basis for assessing wildfire-triggered Natech conditions at the wildland–urban/industrial interface in South Korea.

1. Introduction

Global wildfire activity has intensified dramatically in recent decades. Around the world, wildfires are burning larger areas with greater frequency and severity as climate change drives hotter, drier conditions [1]. Multiple studies confirm that the annual forest area burned globally has more than doubled since the early 2000s [2]. Four of the five worst years for wildfires on record have occurred since 2020 [2]. This escalation is due to not only climate factors but also the expansion of human development into fire-prone landscapes. The global wildland–urban interface (WUI)—zones where homes and other structures intermingle with flammable vegetation—expanded by ~35% from 2000 to 2020 [3,4]. As a result, more communities and assets now lie in the path of extreme fires, heightening the risk to lives, property, and infrastructure. South Korea is no exception to these trends. Although about 63% of its land is forested and historically the country experienced mostly small, quickly controlled forest fires [5], the 21st century has brought an alarming rise in large wildfire events (≥100 ha). Major conflagrations have struck Korea’s east coast in particular, fueled by warming temperatures, drought, and strong seasonal winds. The 2000 “East Coast” wildfire burned nearly 24,000 ha and stood as the nation’s largest wildfire for two decades [6]. It has since been rivaled or exceeded by recent fires: an April 2019 wind-driven blaze in Gangwon-do scorched over 5 km2, destroyed thousands of structures, and forced 4000 residents to evacuate [7,8], and in March 2022, the Uljin–Samcheok wildfire complex consumed approximately 20,000–24,000 ha [6], temporarily threatening a liquefied natural gas plant and even the Hanul nuclear power station [6]. Most recently, in early 2025, South Korea experienced its worst wildfire disaster on record: a series of ultra-dry, wind-fanned fires in Gyeongsangbuk-do that charred an estimated 35,000–100,000 ha and caused dozens of fatalities [7,9]. These events underscore a harsh new reality of mega-wildfires in Korea, mirroring global wildfire extremes but in a landscape densely packed with settlements and critical infrastructure.
While the impacts of wildfires on homes and ecosystems are well studied, a critical complication remains underexplored: the potential for wildfires to ignite hazardous installations and trigger secondary disasters. Wildfires encroaching on facilities such as gas stations, petroleum storage depots, and liquefied petroleum gas (LPG) tanks pose the nightmare scenario of natural hazard-triggered technological (Natech) accidents [10,11]. In such cases, the heat and embers from a wildfire could cause fuel or chemical tanks to explode or release toxins, compounding the disaster. This risk has been largely overlooked in both wildfire science and industrial safety management. For instance, a recent risk analysis framework noted that the role of wildfires is “rarely taken into account” in industrial plant safety assessments, despite the possibility of large flammable inventories causing severe domino effects if a wildfire’s heat impinges on them [12]. Similarly, a European Commission report highlights that when wildfires intersect with industrial sites—the so-called wildland–industrial interface (WII)—they can trigger fires, explosions, or toxic releases, yet there is currently “no integrated…system” in place to prevent such accidents [13,14]. In short, wildfire-induced Natech events represent an emerging, under-quantified hazard. Past incidents, while relatively few, have demonstrated this hazard’s reality: historical data document cases of wildfires causing industrial accidents in Europe [14,15], and anecdotal reports from North America and Australia suggest that fires have come perilously close to fuel storage facilities during major wildfire sieges. Nonetheless, this threat has not received proportionate attention in the scientific literature or in emergency planning, especially in South Korea. Extreme wildfires can create multi-hazard crises by breaching the technological realm—yet our understanding of the frequency and consequences of such scenarios remains limited.
This gap raises pressing concerns for both public safety and disaster management. A wildfire-triggered explosion or chemical release would greatly amplify the danger to firefighters and civilians, potentially producing blast waves or toxic smoke in the midst of an already chaotic wildfire evacuation. First responders could find themselves confronting not only a forest fire but also a hazardous materials emergency—a scenario for which standard wildfire training is grossly insufficient. Communities might have to cope with dual disasters: for example, residents fleeing flames could be caught in an explosion at a roadside petrol station, or vital lifeline infrastructure (power grids, pipelines, water supply) could be crippled by fire-induced technological failures.
In South Korea, where petrochemical facilities and gas stations are often located near the forested edges of cities and towns, the implications are dire. The 2022 Uljin wildfire’s close brush with an LNG import terminal and a nuclear power plant illustrates how even a near miss can be a wake-up call [6]. Had the wind shifted unfavorably, firefighters battling the forest fire might have simultaneously faced a major industrial inferno or radiation emergency. Likewise, the 2019 Gangwon-do wildfire was reportedly ignited by a broken electrical transformer, demonstrating how entangled natural and technological hazards can become [16]. Despite these warnings, South Korea’s current wildfire preparedness plans focus almost entirely on the containment of the natural fire and evacuation of populations, with little mention of protecting industrial sites or handling Natech contingencies. A recent case study of a Korean WII incident found that a power plant narrowly escaped a Natech disaster during a wildfire thanks to aggressive emergency action—a fortunate outcome that “should remind us to prepare for future Natech disasters” and to implement “integrated…wildfire-specific Natech risk management” before a catastrophic event occurs [11]. In short, there is a critical gap in Korea’s safety framework: the intersection of wildfire and technological hazard is not fully addressed, leaving responders and communities vulnerable to cascading disasters.
In light of these challenges, our study undertakes a novel multi-disciplinary approach to assess and model wildfire–Natech risks in South Korea. We compile and analyze a comprehensive geodataset of all large wildfires (burn area ≥ 100 ha) in South Korea from 2000 to the present, drawing on official forest fire records. These wildfire footprints and frequencies are then spatially overlaid with the locations of hazardous fuel facilities nationwide—including gas stations, LPG filling stations, and known sites of mobile fuel storage (such as depots for fuel trucks).
By intersecting historical wildfire maps with infrastructure maps, we identify where wildfires have historically encroached upon, or come within close range of, flammable fuel installations. Building on this spatial analysis, we then apply the ALOHA (Areal Locations of Hazardous Atmospheres) modeling program to simulate the potential consequences if a wildfire were to ignite specific fuel facilities. ALOHA, developed by NOAA and the US EPA, is a well-established hazard modeling tool capable of predicting toxic or flammable gas dispersion, thermal radiation from fires, and blast overpressure zones from explosions (including boiling liquid expanding vapor explosions, BLEVEs) [17]. Using ALOHA, we model worst-case scenarios for representative facility types under wildfire conditions—for example, the rupture and BLEVE of a 50-ton LPG storage tank at a filling station due to flame impingement or intense fire engulfment of a 10,000 L gasoline tanker truck leading to a vapor cloud explosion. For each scenario, ALOHA provides quantitative threat distances (impact radii) for thermal burns, explosion blast damage, and flammable vapor dispersion. We run these simulations with conservative “worst-case” assumptions (e.g., full fuel inventory, no firefighting intervention, dry and windy weather akin to extreme wildfire days) to delineate the maximum impact zones. By integrating these model outputs with population and infrastructure data, we estimate how many people, buildings, and critical systems would fall within the danger zones if such a Natech event occurred during a wildfire. This methodology—combining historical wildfire–facility overlap analysis with advanced consequence modeling—enables us to pinpoint high-risk locations (potential wildfire–Natech “hotspots”) and to quantify the magnitude of secondary disaster that could unfold. All simulations are grounded in real-world test conditions reflecting Korean industry: the 50-ton LPG bullet tank is a common size at local fuel stations, and 10,000 L approximates the capacity of tanker trucks used to supply gasoline and diesel to rural areas. Through these steps, this study develops a detailed risk profile of Natech scenarios specific to wildfires in the Korean context, something that has not been done previously.
This research offers both scientific and practical advancements at the nexus of wildfire and technological disaster risk. Conceptually, this study is the first of its kind in Korea to comprehensively evaluate wildfire-triggered Natech risks through data-driven analysis and simulation. It brings together the traditionally separate domains of forest fire science and industrial safety engineering, demonstrating a framework to bridge natural and technological hazard assessments. The introduction of WUI/WII considerations into wildfire risk mapping and the use of a chemical accident model (ALOHA) in a wildfire context represent methodological innovations that can be applied in other regions facing similar dual hazards. Our findings provide unprecedented insights into how often and under what conditions wildfires have the potential to impact hazardous fuel facilities in South Korea. In doing so, we identify specific vulnerability hotspots—for example, clusters of gas stations along forested highway corridors in Gangwon-do and Gyeongsang-do or LPG storage sites on the wildland fringe of cities—where targeted mitigation is urgently needed. The simulated impact radii for explosions and heat flux in those scenarios will inform evidence-based safety distances and buffer zone policies. These results have immediate relevance for Korean fire safety and emergency planning: policymakers can use our risk maps to prioritize fuel facility hardening or fuel break projects, regulators can revisit siting and clearance standards for hazardous installations near forests, and disaster management agencies can incorporate Natech contingencies into wildfire response plans (e.g., specialized training and equipment for handling chemical fires during wildfires). Finally, this study contributes to the global discourse on Natech disasters by providing a case study in a climate context (humid temperate East Asia) that has received little attention compared to the West. The insights into how climate change-exacerbated wildfires intersect with densely populated, infrastructure-heavy landscapes will be valuable for other countries experiencing WUI growth and seeking to bolster technological disaster resilience. In summary, our work not only fills a critical knowledge gap in Korean disaster science but also offers a template for integrating wildfire and Natech risk modeling—a novel contribution with implications for disaster risk reduction policy in an era of compounding hazards. Although Natech events may involve a wide range of hazardous industrial facilities, the present study specifically focuses on fuel infrastructure, namely LPG filling stations and gasoline/diesel service stations exposed to wildfire in South Korea.

2. Literature Review

Recent decades have seen significant increases in wildfire activity in many forested regions worldwide. A warming climate—marked by higher temperatures, prolonged droughts, and more erratic weather—has lengthened fire seasons and intensified fire weather extremes, leading to more frequent, larger, and more severe wildfires [4,18]. For example, climate change attribution studies and fire records indicate that the frequency, size, and burn season length of wildfires have trended upward in parts of North America, Mediterranean Europe, and Australia [5,18]. In the western United States, observed warming and drying have markedly increased the incidence of large fires (often defined as ≥100 ha) and the area burned, as well as the occurrence of high-severity fire behavior [4]. It is important to distinguish fire intensity—the energy output of a fire, often quantified by fireline heat release—from fire severity, which refers to the fire’s ecological effects (e.g., biomass consumed, tree mortality). High-intensity fires (e.g., with extreme flame lengths and spread rates) can but do not always translate to high severity on ecosystems. Severity is typically measured by the loss of organic matter or tree mortality post-fire [19]. Large fires today are causing unprecedented ecosystem impacts in some regions, with an increasing fraction of burned areas experiencing high burn severity (near-total vegetation kill) [20,21]. These severe fires can reduce forest resilience by altering vegetation composition and causing longer recovery times [4].
The increasing prevalence of wildfires is tightly linked to climate factors. High temperatures and low humidity dry out fuels, while strong winds can drive rapid fire spread [10,22]. Prolonged rainfall deficits and drought—captured by indices like the Keetch–Byram Drought Index or Canadian Fire Weather Drought Code—are consistently associated with greater fire risk [23]. In South Korea, for instance, precipitation deficit has been identified as the principal determinant of forest fire occurrence, with spring drought conditions creating primed fuel beds [8,24]. By contrast, wind speed has a more pronounced influence on fire behavior and growth rather than ignition frequency [25,26]. This aligns with global fire science consensus that hot, dry, and windy conditions—often summarized in fire danger rating systems—lead to the most extreme fire behavior [4,27]. Another key concept is the return interval of large fires. In many ecosystems, climate change is shortening these return intervals, meaning that the same area burns more often than historically, which can impede ecosystem recovery. In practical terms, fire managers monitor the area burned each season as a basic metric of fire activity but also track fireline intensity (through flame length or energy release components) and burn severity (via post-fire assessments or remote sensing of vegetation change) to fully gauge fire impacts [19,21].
South Korea has historically experienced numerous wildfires, though mostly small (<100 ha) until recent decades. Research shows that while the annual number of forest fires in Korea has been gradually increasing (about +5.8 fires per year on average from 1991 to 2020), The total area burned per year has not shown a significant increasing trend, likely due to aggressive suppression efforts [8]. In fact, statistical analysis finds no significant increase in burned area over 1980–2024 and even slight declines in area burned during spring and fall fire seasons [5]. However, the risk of large fires (≥100 ha) is heightened and has become more concentrated in the mountainous northeast (Gangwon-do and northern Gyeongsangbuk-do provinces) [5,8]. Climate change impacts—warmer spring temperatures, reduced spring rainfall and snowpack—have elongated the fire season in Korea by about 25 days in recent decades [8,28,29]. The core fire season has shifted earlier (from early April to mid-March peak) as earlier snowmelt and drier conditions set. These trends, combined with the accumulation of fuels from successful reforestation, have created conditions conducive to occasional large, severe fires despite generally effective firefighting response [30,31].
South Korea’s largest fires on record illustrate these evolving risks. The April 2000 East Coast wildfires (centered in Gangwon-do and Gyeongbuk) burned an estimated 23,794 ha of forest over nine days [32,33,34], by far the most extensive burn area in modern Korean history. These fires destroyed hundreds of homes and required massive mobilization, spurring debate on forestry policy and restoration strategies [32]. Two decades later, in early April 2019, an extreme wind-driven fire ignited in Goseong, Gangwon-do. That blaze spread rapidly overnight through wildland–urban interface areas into neighboring Sokcho and surrounding counties. Although relatively smaller in area (~525 ha burned) [35], the 2019 Gangwon-do fire was devastating: it killed at least 2 people, injured dozens, destroyed over 130 homes and 2000 structures, and forced the evacuation of more than 4000 residents [7,36]. Most recently, the March 2022 Uljin–Samcheok wildfire in southeastern Korea burned approximately 20,923 ha of woodland [37,38]. This event, which lasted for over a week amid record drought, was the largest wildfire in Korea since 2000 and prompted the evacuation of nearly 7000 people [39,40]. The 2022 fire’s scale and intensity—at one point a 6 km flame front moved through mountainous pine forests—highlighted the role of extreme wind and dryness; officials noted the affected region had half its normal spring rainfall and was experiencing a “climate crisis” drought [41]. Notably, 2022’s fires also broke records for duration (213 h) and burned area in a single event [38,41]. These cases underscore that, even in a country with strong firefighting capacity, unfavorable weather and climate conditions can align to produce conflagrations of extraordinary size and impact.
Looking globally and at Korea, the evidence consistently points to a trend: wildfires are becoming more frequent in many areas, driven by climate-induced fuel aridity and extreme weather, as well as human factors like land-use change. While the global total area burned each year has not skyrocketed—indeed, some satellite studies even show a decline in global burned area due to reduced savanna fires [5,42,43]—this paradox is reconciled by understanding regional differences. Fire activity is decreasing in some grassland regions (due to agricultural expansion and fire suppression) but intensifying in forests and at the wildland–urban interface where fires were historically rarer [8,18,44,45]. In short, when and where fuels, climate, and people intersect, wildfires are hitting harder. This calls for integrating climate projections into wildfire management (e.g., using IPCC scenario data to anticipate fire weather changes [4,46,47]) and refining metrics beyond area burned alone—such as fire severity and return interval shifts—to capture the full impact of the changing wildfire regime.
The expansion of the WUI—the zone where human developments (homes, businesses, infrastructure) abut or intermingle with flammable vegetation—has created heightened wildfire risks to communities and technology. The WUI is growing worldwide: one recent analysis found that the global WUI area increased by ~35% from 2000 to 2020 [3,48,49], now covering nearly 5% of Earth’s land surface [18,50]. More than half of the people affected by wildfires globally in 2003–2020 lived in WUI areas [18,50].
As housing and industries encroach into fire-prone landscapes, the exposure of built assets to wildfire is increasing dramatically. In Asia-Pacific regions, WUI growth is notable—for instance, Japan now sees over half of its wildfires occur in WUI zones where forests meet settlements [3,18,51] South Korea is similarly vulnerable: with ~63% forest cover and villages or facilities often nestled in foothills, there are many “interface” areas even if not formally defined as WUIs. Korean fire data show clusters of fire ignitions near cities like Seoul and Busan, largely due to human activities [8,52].
This indicates a substantial interface fire risk, as fires often start near developed areas. The WUI fire problem lies in that burning vegetation can easily ignite structures (homes, farms, factories), and conversely, human ignitions in the WUI are a leading cause of wildfires. The tragic 2019 Gangwon-do fires illustrated this bidirectional risk: a downed power line in a WUI area sparked the wildfire, which then rapidly spread through villages and tourist areas [7,53,54]. In WUI fires, structure losses can be immense because embers and flames penetrate populated areas, as seen in the destruction of over 2000 buildings in the 2019 incident [7]. Effective WUI risk mitigation (e.g., creating defensible space, fire-resistant building materials) is therefore a critical adaptation strategy in Korea and globally [8,54,55].
Beyond homes, the WUI includes industrial and hazardous facilities—a less-studied aspect often termed the WII [56,57]. When wildfires intersect with sites that store flammable or toxic materials, they can trigger so-called Natech events—natural hazard-triggered technological disasters. In the context of wildfires, a Natech accident could mean an industrial fire, explosion, or toxic release caused by an encroaching wildfire [58]. Hazardous fuel facilities are of particular concern. These include oil and gas storage depots, petroleum refineries, gas stations, liquefied petroleum gas (LPG) filling stations, chemical plants, and other installations containing combustible fuels. A wildfire’s heat flux can be tremendous—continuous flame fronts produce radiant heat capable of pressurizing and rupturing storage tanks, and wind-driven embers can penetrate facility defenses to ignite fuels [57,59]. If flammable vapor is released and ignited, or a vessel fails under heat (e.g., causing a boiling liquid expanding vapor explosion, BLEVE), the result can be catastrophic, compounding the disaster. An OECD/EU report on Natech risks emphasizes that installations handling hazardous substances are vulnerable to natural hazards and that climate change (e.g., more extreme wildfires) further heightens these risks [60]. Unlike a typical wildfire, which primarily threatens structures by burning, a wildfire–Natech scenario means that the fire could cause an industrial accident—for example, a toxic gas release or an explosion that endangers emergency responders and residents well outside the wildfire’s perimeter [61].
Although full-blown Natech disasters from wildfires are rare, near misses underscore the need for proactive risk management. In March 2022, the Uljin–Samcheok wildfire in South Korea came alarmingly close to critical fuel infrastructure, temporarily threatening a liquified natural gas plant and the Hanul Nuclear Power Plant [6,62]. Firefighters staged defensive operations; no damage occurred, but the incident prompted authorities to designate such sites for special protection during emergencies [6,62]. Internationally, the 2016 Fort McMurray wildfire in Alberta swept through Canada’s oil sands region and threatened the Cheecham crude oil tank farm. Emergency crews built firebreaks and sprinklers, evacuated workers and shut down production; the tanks did not ignite, but the shutdown cost billions and showed how a wildfire could ignite a massive oil storage explosion and environmental emergency [63]. Other reports document wildfires igniting pipelines or burning storage yards, as seen at events and the Joint Research Centre recorded accidents triggered by wildfires, such as a 2007 Greek blaze that burned an industrial waste facility and a 2017 Chilean fire that overtook a lumber plant and oil depot [57]. These examples confirm that wildfire Natech events are a real and growing concern.
Gas stations and LPG filling stations exemplify hazardous fuel facilities in the WUI. South Korea has over 10,000 gas stations, many adjacent to forest land [10,58]. Each may hold tens of thousands of liters of gasoline and diesel in underground tanks and LPG tanks above ground; if a fast-moving wildfire engulfs such a station, the combination of fuel pumps, storage vessels and pressurized cylinders poses an extreme explosion hazard [10,59]. Firefighters frequently report propane tank explosions during WUI fires; a near miss during the 2019 Gangwon-do wildfire was averted when crews doused an LPG storage tank just as embers landed, preventing a BLEVE [10]. International fire investigations echo these concerns; during the 2018 Camp Fire in Paradise, California, numerous propane tanks exploded like bombs [64].
Reducing these risks requires integrated prevention and preparedness. Prevention focuses on creating defensible space and fuel breaks around vulnerable installations; many jurisdictions mandate vegetation clearance, such as 30 m around critical infrastructure [65]. Preparedness includes early warning systems, facility-specific action plans, portable water cannons and fire-resistant wrapping for tanks. The OECD Natech guide [60] advises operators to integrate natural hazard scenarios into safety management systems and regulators to ensure high-hazard industry is sited away from fire-prone zones [60].
The wildfire–industrial interface is therefore an emerging challenge. The Uljin–Samcheok near disaster shows that even advanced countries must bolster Natech preparedness. Protecting hazardous fuel facilities from wildfire requires updated building codes, heat-triggered suppression systems, careful land-use planning and joint drills between wildfire fighters and industrial hazmat teams. Continued research—such as mapping industrial sites in high-fire-hazard zones and assessing their vulnerability—will support improved policies. As wildfires intensify in a warming world, proactive measures will be crucial to reduce Natech risks and protect communities and the environment.

3. Materials

3.1. Wildfire Dataset (2000–2025)

This study uses a national database of wildfires in the Republic of Korea covering 2000–2025, restricted to events with a burned area ≥ 100 ha. Source records were obtained from the Korea Forest Service (KFS) statistical yearbooks and the National Fire Agency (NFA) incident archives. The KFS records provide, for each event, the occurrence date, burned area, ignition location, and reported cause; since 2010, fire size classes were standardized, with “large fires” defined as those exceeding 100 ha [8]. Where available in official documentation, fire boundary information was present in NFA situation reports; these reports also specify the relevant administrative jurisdiction (Si/Gun/Gu). No results are presented in this section. For data consistency and reproducibility, a quality control (QC) protocol was applied before analysis. Province–year totals and national annual totals were calculated once per incident, merging multi-location events (e.g., the 2020 Uiseong–Andong complex fire) into a single record to prevent duplication. Outlier values clearly inconsistent with historical Korean wildfire scales (e.g., individual entries > 20,000 ha) were flagged based on domain knowledge and excluded from statistical trend interpretation while being retained in the raw for transparency. This QC process ensured that all the results presented in later sections accurately reflect validated and non-duplicative wildfire records.

3.2. Gas Station Dataset

Information on gasoline/diesel service stations was obtained from the nationwide registry maintained by the Korea Petroleum Quality & Distribution Authority (K-Petro). This registry includes, for each facility, the address and geographic coordinates, brand/operating company, type of operation (independent or franchised), and storage capacity for gasoline, diesel and kerosene. According to K-Petro’s Opinet statistics reported by the press, South Korea had 10,528 operational gas stations as of June 2025, down from 11,499 in 2019; the number of stations peaked at 13,004 in 2010 and has been steadily declining [64]. We geocoded all active stations and assigned their storage capacities to facilitate spatial analysis. Facilities were represented as points at the centroid of their parcel and grouped by administrative unit. The attributes enabled the calculation of fuel storage load within wildfire exposure zones.

3.3. LPG Filling Station Dataset

Data on LPG filling stations were collated from the Korea Gas Safety Corporation (KGS), which supervises LPG installations. Historical KGS statistics indicate that around 933 LPG filling stations operated nationwide in 2001–2002, classified into cylinder-only stations, which exclusively handle the filling and distribution of portable LPG cylinders for household and commercial use; combined cylinder–vehicle stations, which serve both cylinder refilling and automotive LPG fueling on the same premises; and vehicle-only stations, which provide refueling services exclusively for LPG-powered vehicles [66,67]. These stations were distributed across land-use categories: 451 in greenbelt areas, 213 in quasi-agricultural zones, 88 in industrial areas, 133 in residential zones, 19 in commercial districts and 29 in other locations [66,67]. Contemporary KGS registers provide each station’s location, number of storage tanks, tank capacities, installation type (aboveground/underground) and inspection status. We compiled a spatial point database of LPG stations, summarized total storage capacity and calculated station density per province. Although the absolute number of stations has evolved since early 2000s, this dataset captures the spatial pattern and capacity distribution of the LPG supply network.

3.4. Dataset Integration and Case Selection

To focus our analysis on a concrete example, we selected the 2025 Gyeongbuk wildfire—the largest recent wildfire in South Korea—as a case study. We used the integrated geodatabase to evaluate how LPG filling stations and gasoline/diesel service stations were affected by this event. The wildfire perimeter was overlaid with geocoded points for all fuel facilities, and any station within 500 m of the burn boundary was classified as exposed. For these exposed facilities, we recorded the fire’s burned area and associated meteorological conditions and extracted facility attributes such as fuel type, storage capacity and operational status. We then summarized counts and aggregate fuel volumes within the case study perimeter. This targeted integration enables an assessment of how the 2025 Gyeongbuk wildfire’s footprint intersected with critical fuel infrastructure and provides the foundation for the ALOHA-based modeling of explosion and fire risk distances.

4. Methods

4.1. Data Collection and Preparation

4.1.1. Wildfire Data (2000–2025)

We queried the KFS openAPI and retrieved complementary NFA incident reports for 2000–2025, compiled the resulting records, and retained only events meeting the ≥100 ha threshold. Records were harmonized to a common schema and cross-checked to remove duplicates arising from multi-day or multi-jurisdiction reporting. Administrative identifiers from the source materials were used to assign each event to the appropriate Si/Gun/Gu.
Where perimeter information existed in NFA situation reports, we digitized these boundaries as vector polygons and attached the corresponding official burned area and administrative attributes. For events lacking explicit polygons, we retained the best-available location information (e.g., ignition locality) as provided by the sources; no imputation was performed. Remote sensing burn scar maps were consulted solely to assist polygon delineation when referenced by NFA documentation; no independent reinterpretation of burned area was introduced.
All event records that satisfied the inclusion criteria were integrated into a single analysis-ready dataset. This dataset was then explored visually in Tableau to examine temporal structure (annual distribution and seasonal concentration) and spatial clustering across provinces and metropolitan cities. The visualizations produced at this stage served only to support subsequent analyses and quality control (e.g., identification of outliers or inconsistent geographies); they did not alter the underlying source values. No numerical findings are reported in this section.

4.1.2. Hazardous Facility Data

Data on gasoline and diesel fueling stations were obtained from K-Petro, which maintains the national registry of operational facilities. Variables included geographic coordinates, operator type, product type, and, where available, underground tank capacities and the number of dispensing pumps. Data on LPG filling stations were collected from the KGS. These records reported the total number of stations, addresses, geographic coordinates, storage tank capacities, installation type (aboveground or underground), and inspection status. The hazardous facility dataset was cleaned for duplicates, geocoded to a consistent projection, and classified into cylinder-only, cylinder + vehicle, and vehicle-only operational types. Mobile fuel tanks were represented using national logistics guidelines on typical truck capacities (10,000 L).

4.1.3. Overlay Analysis

The wildfire and facility datasets were integrated within Tableau. Using Tableau, wildfire perimeters were overlaid with the geocoded point locations of gas stations and LPG stations. A proximity buffer around each fire perimeter was generated to identify potential facility exposures or near misses. Facilities within or intersecting the buffer were flagged as “exposed.” Spatial summaries were created at the provincial scale, and exposure maps were produced to visualize clusters of fuel infrastructure vulnerable to wildfire. This overlay analysis formed the basis for subsequent consequence modeling.

4.2. ALOHA Simulations

ALOHA (Version 5.4.7) was used to assess technological hazard zones that can occur when a wildfire spreads into hazardous fuel facilities. The analysis focused on three hazard types relevant to fuel tank involvement: explosion-related effects (BLEVE/fireball), vapor dispersion (flammable cloud), and thermal radiation. The purpose of this step was not to predict an actual accident outcome but to delineate the spatial extent of ALOHA threat zones—red, orange, and yellow—so that the potential human impact area can be understood when wildfire exposure causes a tank to fail and produces secondary damage. ALOHA derives these zones by calculating hazard intensity from the selected chemical and scenario inputs, then classifying the impact area into red–orange–yellow zones that represent decreasing severity with distance.

4.2.1. Scenario Configuration

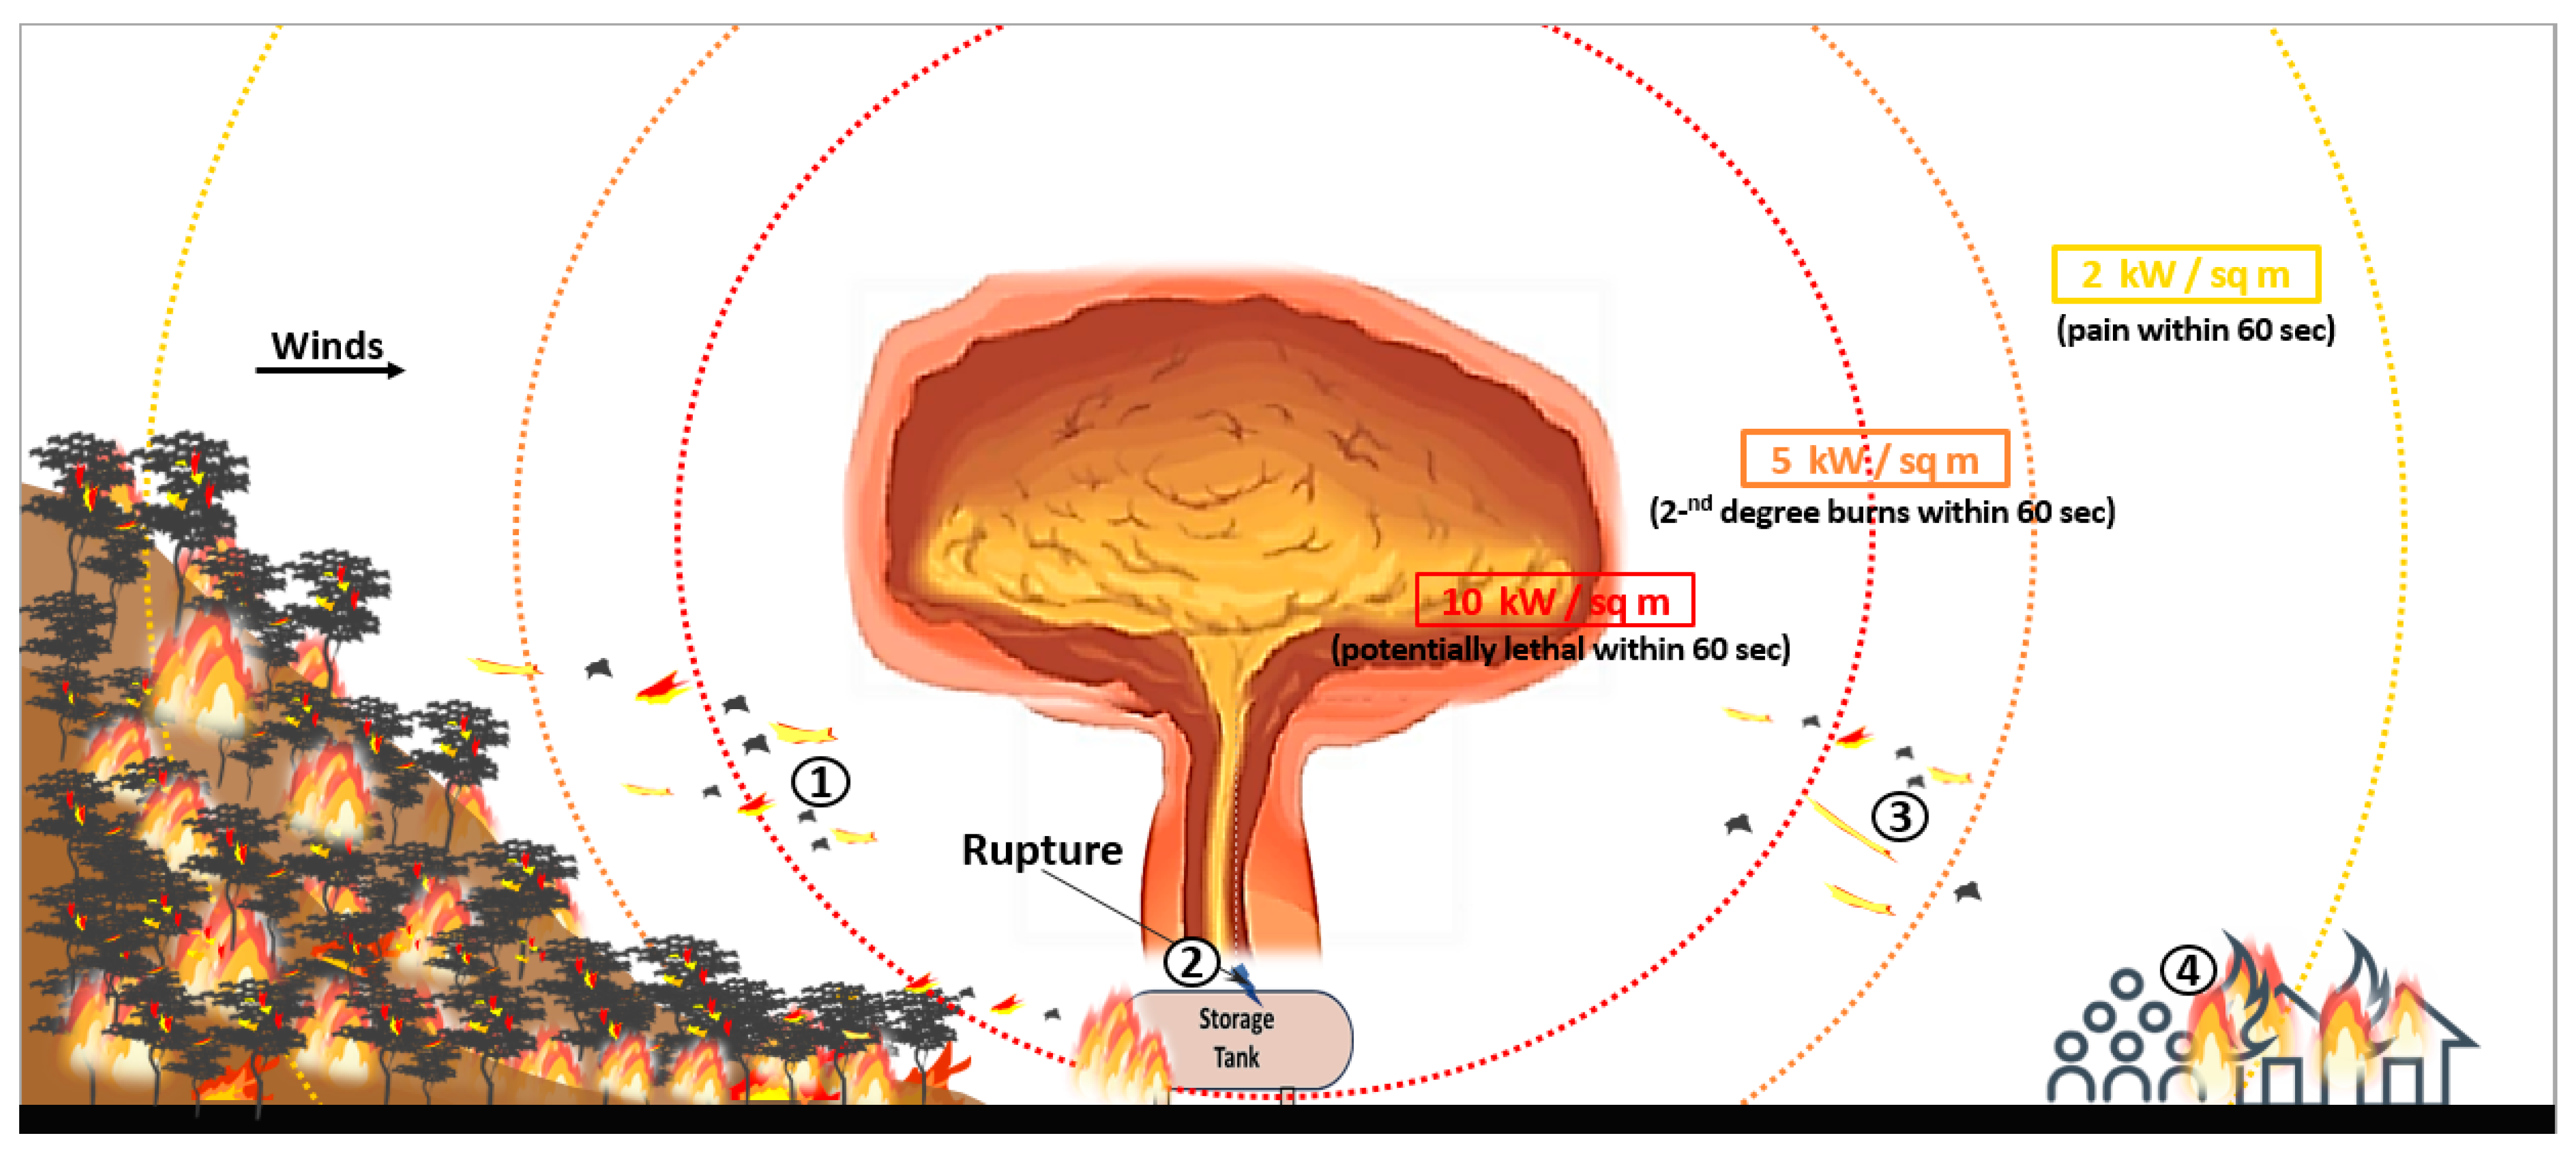
Figure 1 presents the scenario framework used to analyze wildfire-triggered Natech escalation at hazardous fuel facilities potentially exposed to wildfire. The hazardous substances selected for modeling were intended to represent the principal fuels stored at the two facility types considered in this study, namely LPG filling stations and gasoline/diesel service stations. Accordingly, propane was used as the representative substance for LPG, n-octane for gasoline, and n-dodecane for diesel. To standardize the simulation configuration and enable direct comparison across fuels, the storage system was defined as a 10,000 L tank, corresponding to capacities commonly used for large mobile tank storage and comparable industrial storage units.
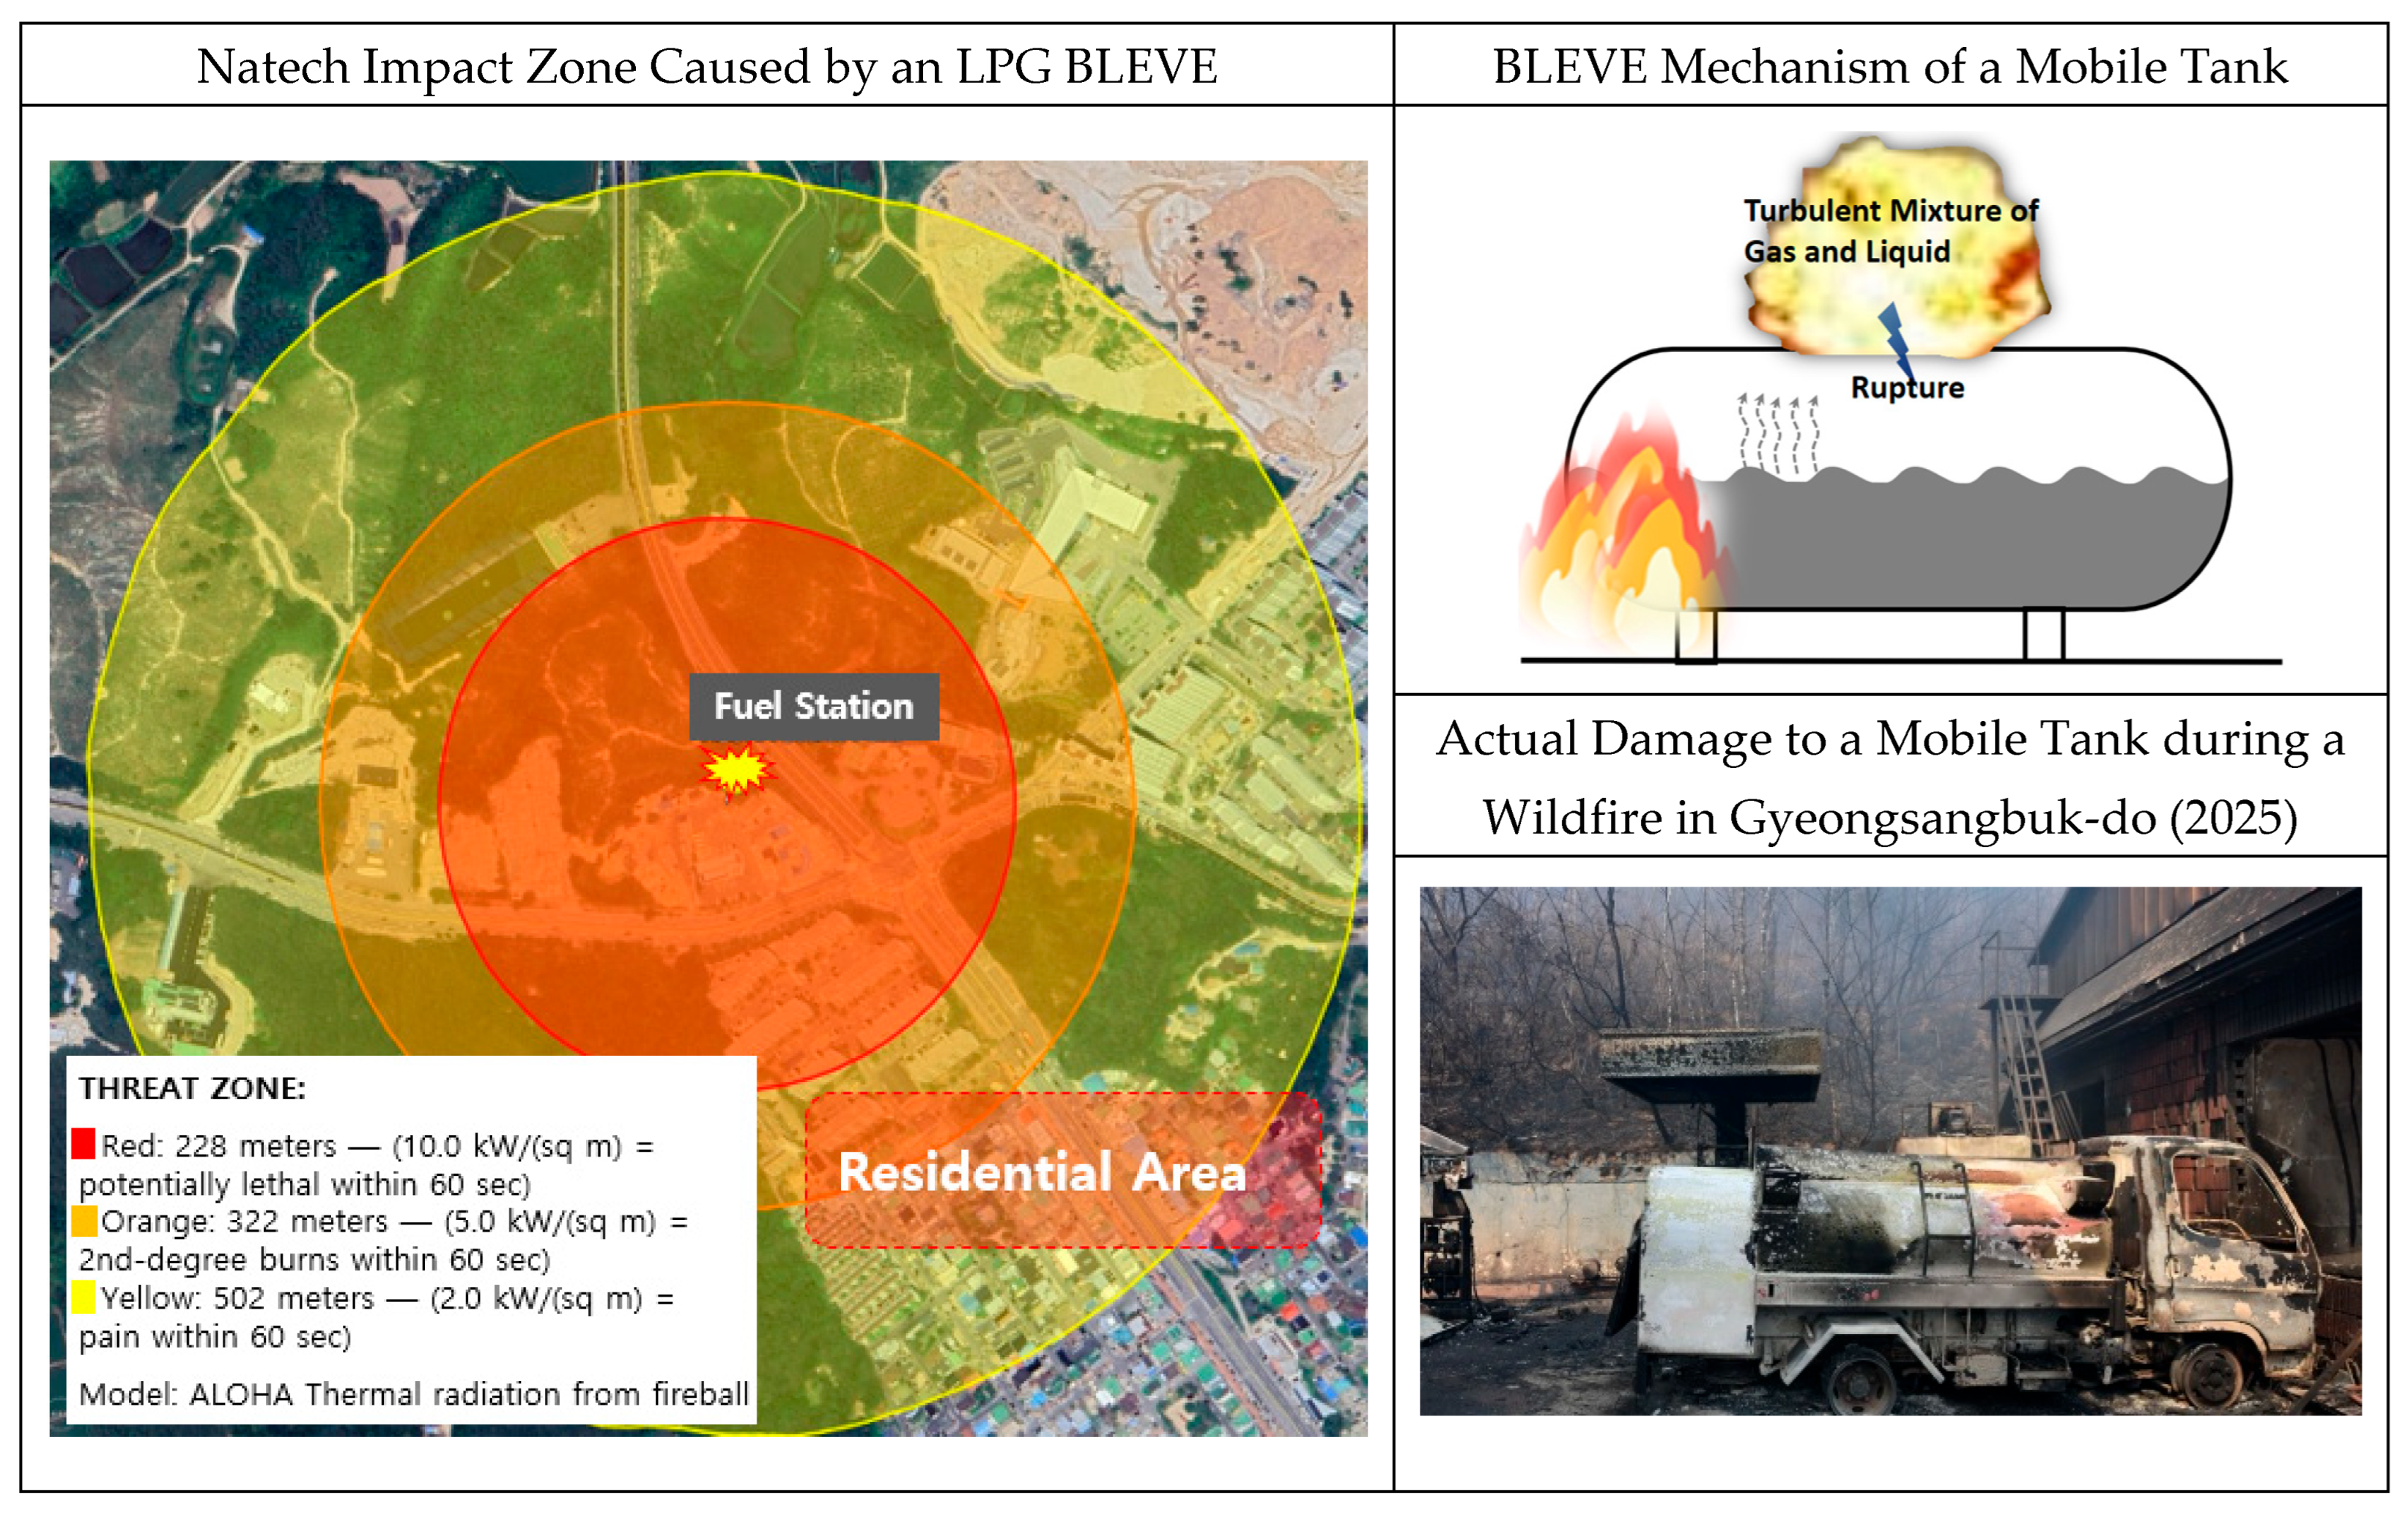
The consequence scenarios were differentiated according to fuel storage conditions and physical accident plausibility under wildfire exposure. For LPG, which is stored under pressurized conditions, a BLEVE (boiling liquid expanding vapor explosion) with fireball formation was adopted as the representative escalation scenario under severe external heating. This configuration reflects the well-established potential for rapid phase transition and intense thermal radiation release when a pressurized LPG vessel is engulfed by a wildfire or subjected to sustained flame impingement.
By contrast, gasoline and diesel are generally stored under atmospheric conditions. Therefore, for these liquid fuels, the representative accident scenario was defined as a pool fire following release and ignition, which more realistically reflects the expected fire behavior of atmospheric liquid fuel storage under wildfire-induced damage. In addition, to examine a conservative upper-bound thermal radiation footprint under extreme external heating conditions and to provide a standardized comparison with LPG, hypothetical BLEVE/fireball simulations were also conducted for gasoline and diesel. These additional simulations were not intended to represent the most probable physical escalation pathway for atmospheric liquid fuels but rather to provide sensitivity-based upper-bound comparison cases.
The principal output of interest was the thermal radiation threat zone distance, expressed as the radial extent from the source to predefined injury thresholds. These distances were used to evaluate the potential off-site exposure of nearby populations and surrounding assets under wildfire-triggered Natech conditions. Because ALOHA does not quantify hazardous fragments generated by tank rupture, fragment effects were recognized as a possible consequence in BLEVE-type events but were not explicitly modeled in the present study.
As illustrated in Figure 1, the scenario framework proceeds through four generalized stages:
(1)
Wildfire spread and spotting into the facility area;
(2)
Fuel storage involvement and escalation, resulting in a BLEVE/fireball for LPG and, for comparison purposes only, hypothetical BLEVE/fireball for gasoline and diesel, whereas the representative pathway for gasoline and diesel is a pool fire after release and ignition;
(3)
Thermal radiation emission, with possible fragment generation in BLEVE-type events;
(4)
Secondary consequences, including off-site thermal exposure, potential casualties, and damage to adjacent structures or surrounding infrastructure.
This scenario configuration was designed to distinguish clearly between physically representative accident behavior and conservative upper-bound comparison cases. Accordingly, the LPG BLEVE/fireball results were treated as directly relevant to pressurized fuel storage, whereas the gasoline and diesel pool fire results were used as the primary basis for interpreting likely wildfire-related consequence patterns. The additional gasoline and diesel BLEVE/fireball results were retained only as supplementary upper-bound comparison cases under extreme wildfire heating assumptions.

4.2.2. Scenario Input Parameters

Table 1 shows that scenario inputs followed the alternative-case parameter set specified in the Technical Guidance on Selecting Worst-case and Alternative-case Accident Scenarios issued by the Korea Occupational Safety and Health Agency (KOSHA GUIDE P-107-2020). Accordingly, atmospheric stability class D was applied, and key meteorological and surface parameters—including mean wind speed, air temperature, relative humidity, cloud cover, and ground roughness—were set as the baseline inputs. The ALOHA BLEVE module was used to estimate the fireball thermal radiation threat zones, which are output as red–orange–yellow impact distances based on heat flux thresholds. The resulting threat zone outputs were exported to a GIS environment and overlaid with wildfire-affected administrative areas and fuel facility exposure maps. This allowed for an evaluation of whether wildfire-triggered explosion/fire impacts could plausibly extend to nearby residents, roads, and critical infrastructure.

5. Results

5.1. Wildfire Dataset Analysis

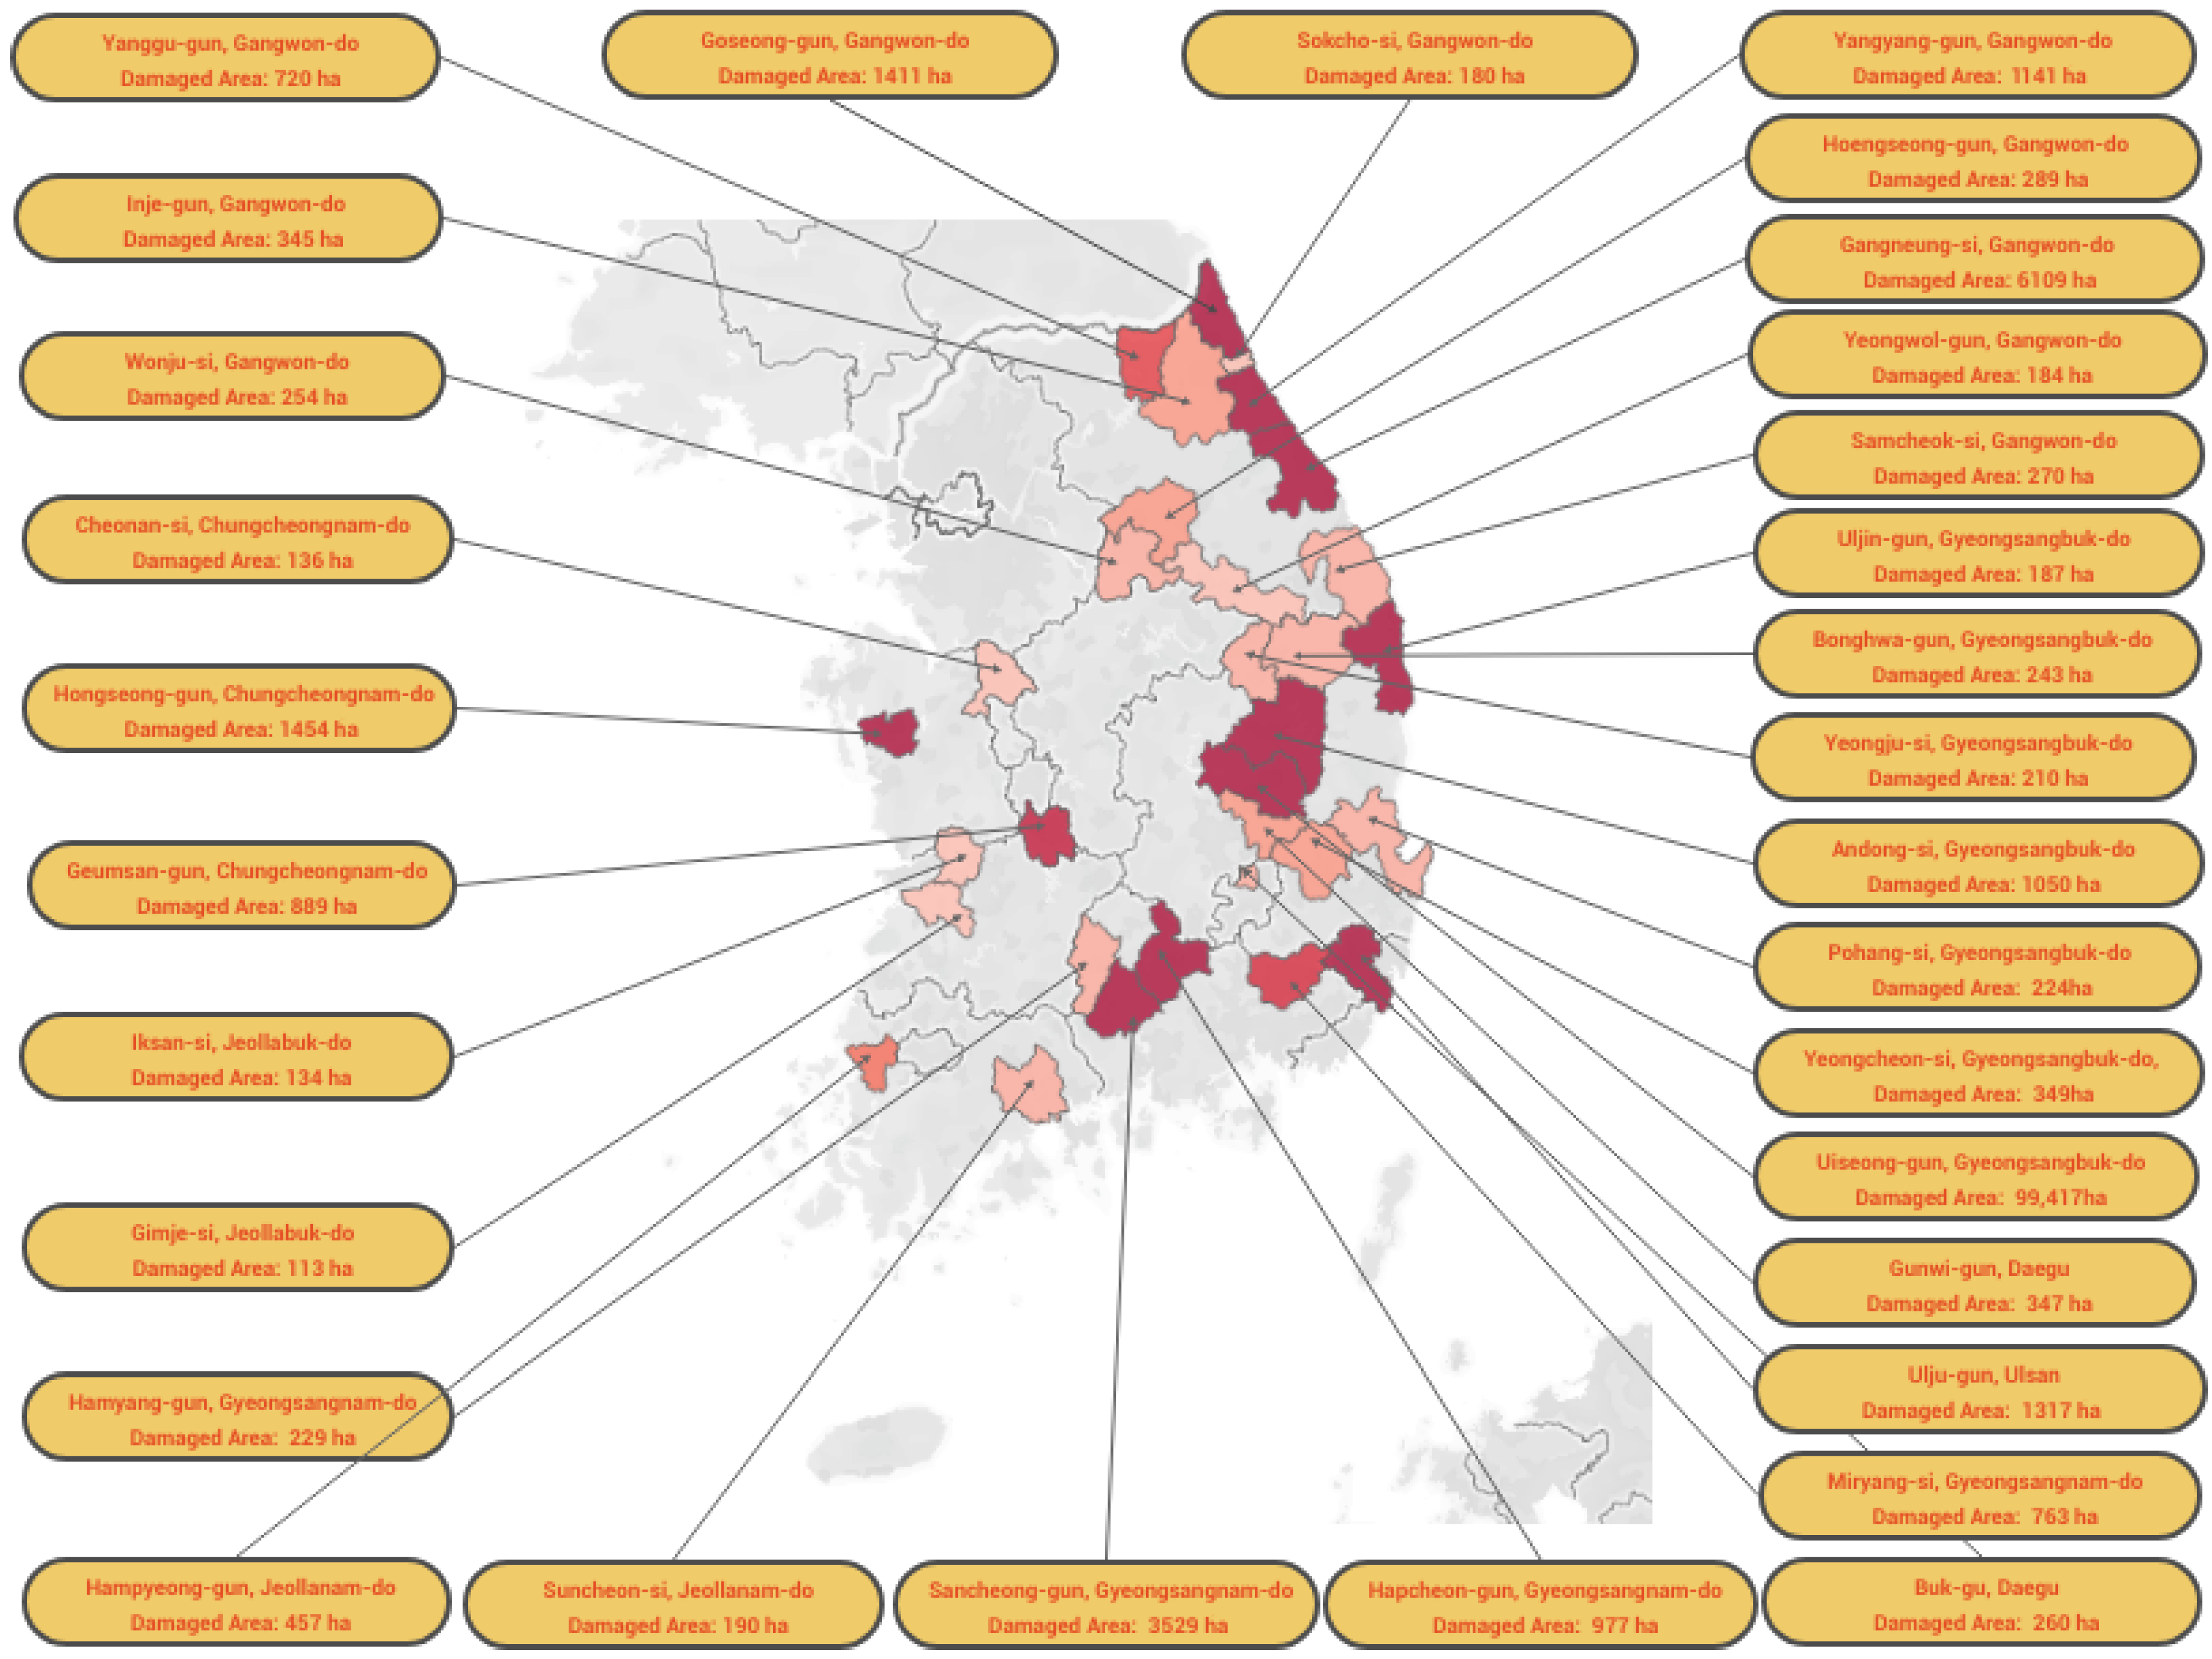
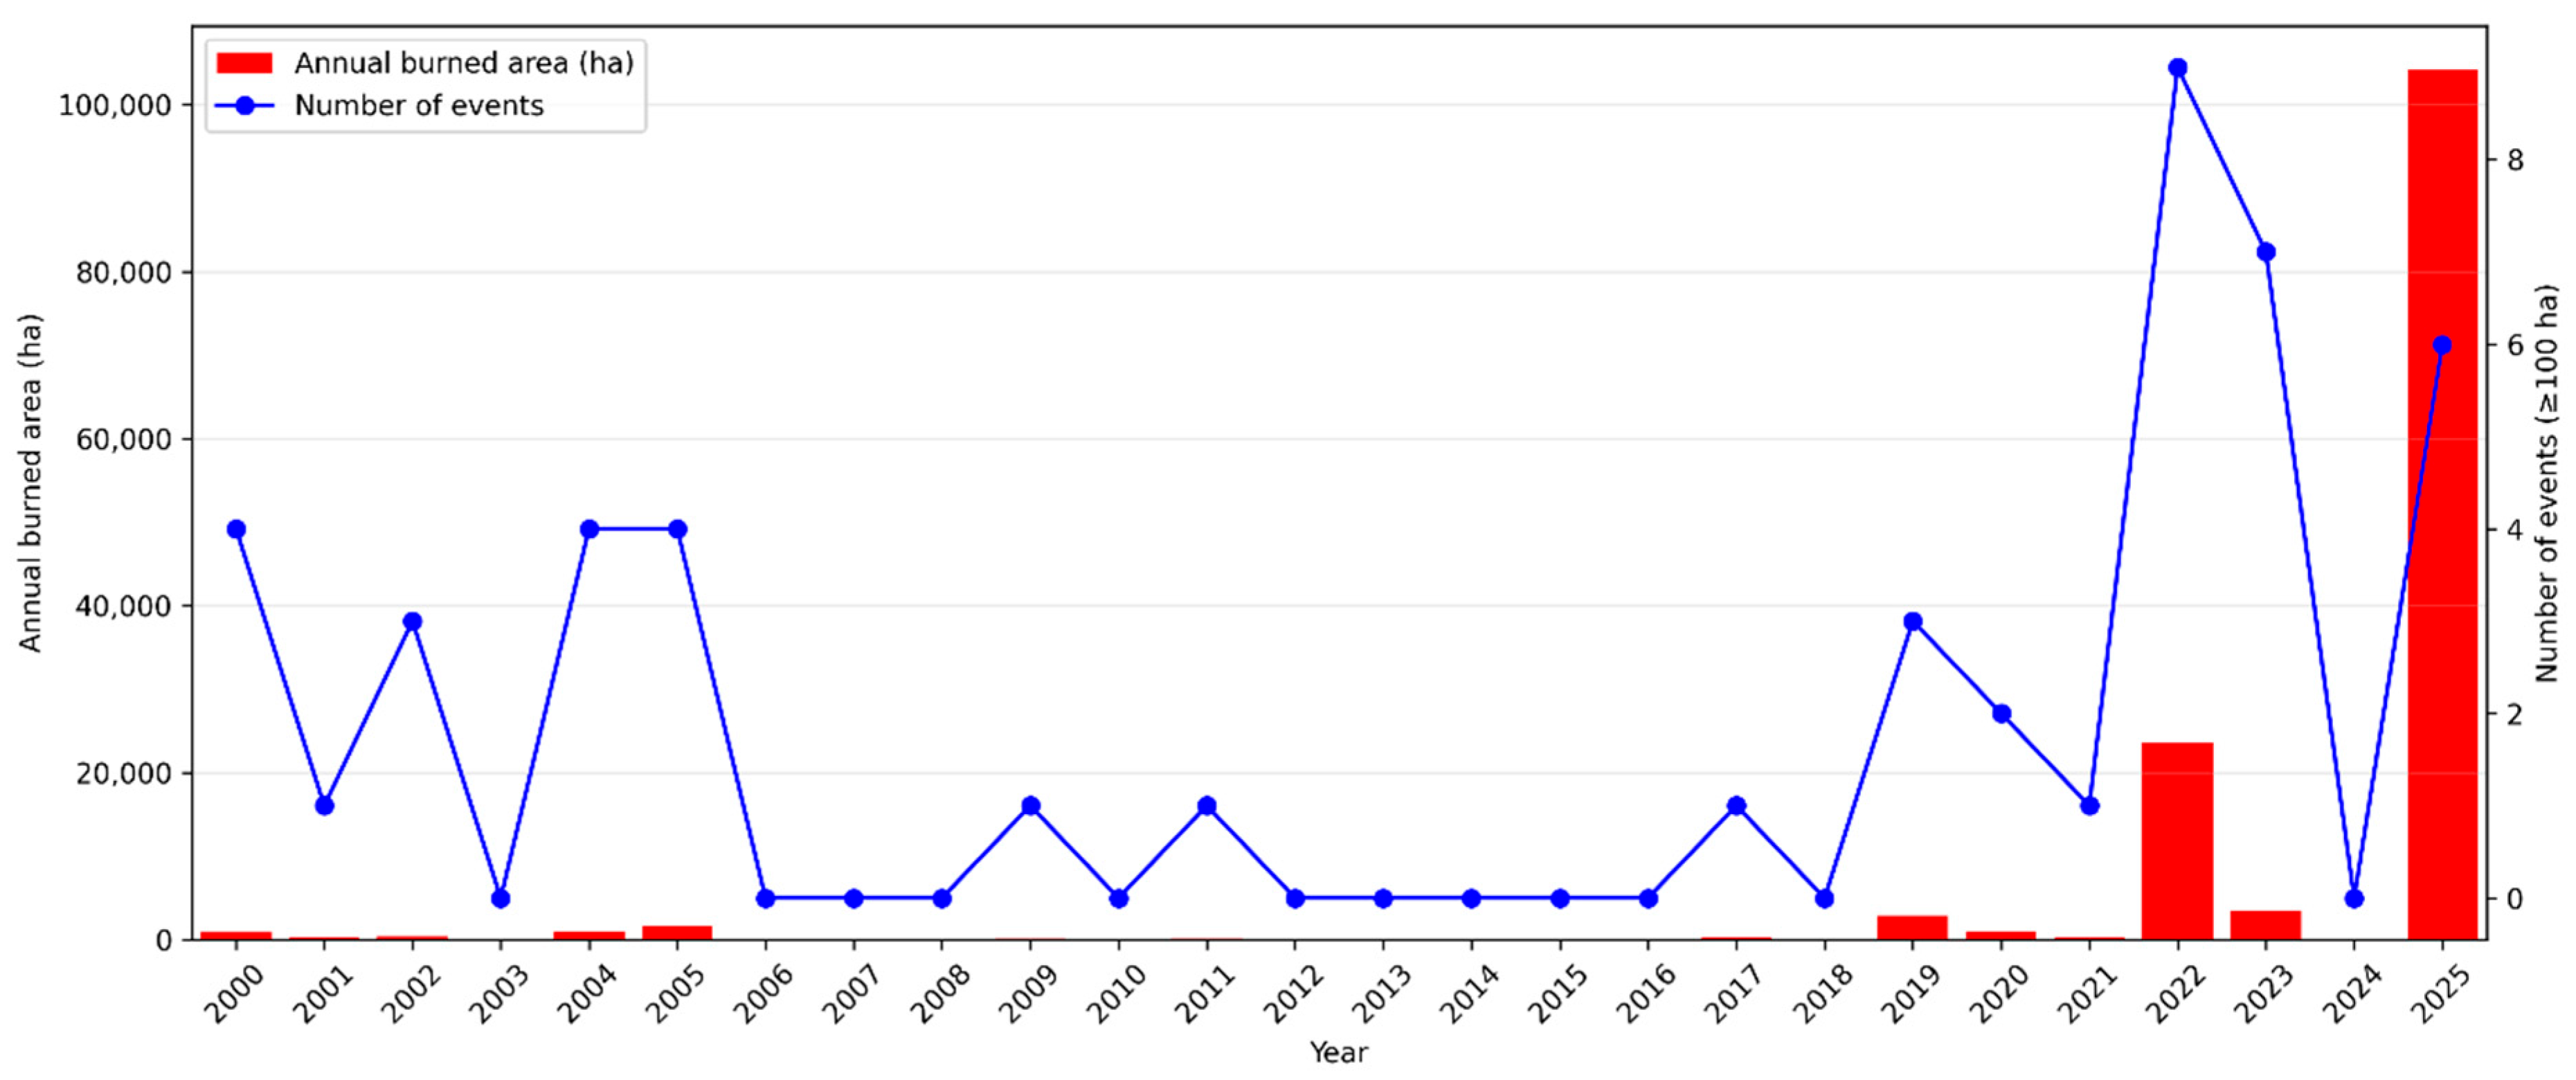
A total of 47 large wildfire events (burned area ≥ 100 ha) were recorded in South Korea from 2000 to 2025 (Table 2). Cumulatively, these fires burned approximately 139,800 ha of forest. The spatial distribution of large fire occurrences was highly uneven (Figure 2), with clear concentrations in specific provinces (detailed in Section 5.2). The annual burned area fluctuated dramatically over the study period (Figure 3). Most years saw relatively low impact or no large fires at all, whereas a few years experienced extreme wildfire activity. Peak and zero years: The annual total burned area remained below 3000 ha in all years from 2000 to 2021, with about half of the years (12 out of 26) recording no ≥ 100 ha fires. This quiet period was punctuated by sporadic moderate spikes (e.g., 2005 and 2019 each exceeded 1000 ha), before an unprecedented peak in 2025, when over 100,000 ha burned (Figure 3). In contrast, several years in the 2000s and 2010s (e.g., 2003, 2006–2008, 2010, 2012–2016, 2018, 2024) had zero large fire events, underscoring high inter-annual variability.
Extreme individual wildfire events had a disproportionately large influence on the total burned area. The two largest fires, both occurring in March 2025 (in Uiseong-gun and Gyeongsangbuk-do), burned approximately 52,700 ha and 46,600 ha each. Together, these two mega-fires account for nearly three-quarters (~71%) of the cumulative burned area from all ≥ 100 ha fires in 2000–2025. Another notably extreme event was the March 2022 Uljin wildfire (~16,300 ha), which, combined with the 2025 mega-fires, means that just three events (6% of cases) contributed roughly 80–85% of the total area burned. Consequently, the size distribution of events is highly skewed. The average burned area per event was on the order of 3000 ha, but the median was only ~250 ha, indicating that most large fires were an order of magnitude smaller than the few gigantic outliers. Indeed, the majority of recorded events clustered near the lower end of the ≥100 ha range—about one-third of events (15 fires, 32%) exceeded 500 ha, and only nine events (19%) surpassed 1000 ha. In contrast, the handful of “mega-fire” events (>10,000 ha) dominate the statistics, exemplifying an extreme Pareto-like concentration of burned area in a few catastrophic fires. These findings are summarized in Figure 3 (annual time series) and Table 2 (regional totals), which highlight the outsized role of the peak year 2025 and its constituent events.

5.2. Regional Distribution

Spatially, wildfires were concentrated in a few hotspot regions, with notable disparities among provinces (Figure 2, Table 2). Gangwon-do and Gyeongsangbuk-do together accounted for the bulk of large fire occurrences: Gangwon-do recorded the most events (16 out of 47, ~34% of all ≥ 100 ha fires), while Gyeongsangbuk-do had the second highest count (14 events). Other provinces experienced far fewer large fires over the 26-year period (e.g., Gyeongsangnam-do with 6 events; Chungcheongnam-do with 3; Ulsan metropolitan area with 2; and only 1–2 events each in Jeollanam-do, Jeollabuk-do, and Daegu; see Table 2). Notably, several regions saw no wildfires at all—for example, Seoul, Gyeonggi-do, Chungcheongbuk-do, and Jeju-do recorded zero ≥ 100 ha fire events in 2000–2025. This indicates that the risk of large fires was geographically specific rather than nationwide. The hotspot provinces are clearly those in the east and southeast: as shown in Figure 1, large fire event locations predominantly cluster along the mountainous eastern coastline (Gangwon-do) and the southeast interior (Gyeongsang-do), whereas the densely populated northwest and the agriculturally dominated central west are characterized by comparatively lower spatial intensity and smaller cumulative extents of large fire activity.
There were also striking regional differences in the total area burned by large fires (Table 2). Gyeongsangbuk-do overwhelmingly led in burned area, with approximately 118,000 ha (about 85% of the country’s total) burned by its 14 large fires. This extraordinary share is largely attributable to the catastrophic 2022 and 2025 events in that province (notably the Uljin and Uiseong fires). In contrast, Gangwon-do—despite having the most frequent large fires—accumulated only about 10,900 ha (~8% of the total) across its 16 events. This indicates that Gangwon-do’s fires, while frequent, tended to be much smaller on average than Gyeongsangbuk-do’s. Other regions contributed relatively minor portions of the burned area: Gyeongsangnam-do (~5500 ha total, ~4% of national total), Chungcheongnam-do (~2480 ha, ~1.8%), and Ulsan (~1320 ha, ~1%) each experienced a few moderate-size fires. The remaining affected provinces (Jeollanam-do, Jeollabuk-do, Daegu) together accounted for only about 1% of the burned area in total, reflecting one-off events in these locales. The provinces further illustrate strong spatial concentration. For example, Gyeongsangbuk-do remains near baseline in most years but exhibits pronounced spikes in 2022 and 2025, whereas Gangwon-do shows intermittent smaller peaks across multiple years (e.g., 2000, 2004–2005, 2019) without an outbreak comparable in magnitude to Gyeongsangbuk-do’s 2025 fires. This spatial concentration indicates that South Korea’s large wildfire impacts, particularly in terms of area burned, are dominated by episodic extremes occurring in a limited number of high-risk provinces.

5.3. Event Characteristics

The characteristics of the large wildfire events in this dataset reveal consistent patterns in size, timing, and variability. Size distribution: Most ≥100 ha fires were relatively moderate in size, with a clear majority towards the lower end of the range. The frequency distribution is strongly right-skewed: while the median event burned only ~250 ha, a few colossal fires reached tens of thousands of hectares. In fact, only three events (6% of the total count) exceeded 10,000 ha, yet these few mega-fires accounted for roughly four-fifths of the total burned area, as noted above. By contrast, over two-thirds of the events (68%) remained under 500 ha. This disparity highlights that South Korea’s large fire regime is characterized by infrequent but massively destructive outliers amid a backdrop of smaller large fires.
Seasonality: All recorded wildfires occurred in the late winter to spring months. The seasonality signal is very pronounced—100% of the ≥100 ha events ignited between February and May, aligning with the country’s traditional spring fire season. March and April were the peak months: nearly 90% of the events took place in March–April, with April alone accounting for about 60% of all cases. There were no summer, autumn, or early-winter large fires in the 10-year record. This implies a strong seasonal window for large fire risk (without attributing causation, it coincides with the dry, windy spring conditions in Korea). Additionally, the recorded ignition times tended to cluster in mid-day to afternoon hours, although a detailed analysis of fire weather or causes is beyond the scope of the dataset.
Inter-annual variability: The occurrence of wildfires was highly irregular from year to year. As described in Section 5.1, many years saw zero large fires, whereas a few years (notably 2022 and 2025) contributed disproportionately to the totals. The number of ≥100 ha events per year ranged from 0 (in multiple years) up to 9 (in 2022), and the annual burned area ranged from 0 to over 100,000 ha (Figure 2). This extreme variability reflects the episodic nature of fire outbreaks in Korea—quiet years can be abruptly punctuated by a severe fire season. Finally, the duration of events varied with fire size. Smaller fires were often contained on the same day or within 24 h, according to their reported extinguishing times. In contrast, the largest fires burned for several days to over a week; for example, the two massive Uiseong fires of March 2025 each continued for roughly 9–10 days before full extinguishment. This points to the considerable challenges in suppressing mega-fire events, as opposed to the more routine containment of smaller large fires. Overall, the dataset’s results portray a regime of infrequent but seasonally and geographically concentrated large wildfires, dominated in impact by a few extraordinary events interspersed among many milder fire seasons.

5.4. Hazardous Facility Overlay Analysis

Wildfires (≥100 ha) in South Korea have directly intersected with numerous hazardous fuel facilities. We identify 805 gasoline/diesel stations and 227 LPG filling stations that lie within the perimeters of burn scars from 2000 to 2025, based on spatial overlays of wildfire extent and facility locations. This exposure equates to roughly 14.1% of all gas stations and 11.5% of all LPG stations nationwide. In absolute terms, the overlap is significant: for context, the March 2025 wildfires alone scorched over 104,191.24 ha in southeastern counties, underscoring the scale of infrastructure at risk.
Wildfire–facility intersections are highly concentrated in a few regions. Gangwon-do—historically prone to large forest fires—exhibits the highest overlap, with 210 gas stations and 71 LPG stations within burned areas. This represents approximately 62.1% of all gas stations and 55.5% of LPG stations in Gangwon-do, the highest provincial proportion in the nation. Gyeongsangbuk-do follows with 201 gas stations (around 37.4% of Gyeongbuk’s gas stations) and 42 LPG stations (about 19.3% of its LPG stations) being exposed. Other affected provinces include Chungcheongnam-do, Jeollabuk-do, Gyeongsangnam-do, and Jeollanam-do, with more moderate counts of impacted facilities (on the order of a few dozen to around 100 sites each), corresponding to roughly 10–30% of their total fuel stations in each case. Notably, two metropolitan areas—Daegu and Ulsan—also saw wildfires encroach on their rural outskirts. Daegu had about 22 gas stations and 7 LPG stations intersecting burn scars (approximately 9.9% and 10.9% of the city’s gas and LPG facilities, respectively). Ulsan saw roughly 36 gas stations and 14 LPG stations exposed (around 31% and 40% of that city’s gas and LPG stations). By contrast, provinces and major cities with little forested area (e.g., Seoul, Gyeonggi-do) experienced no wildfires during this period and hence saw no direct infrastructure exposure.
Table 3 details the facility exposure by province and fuel type. Provinces like Gangwon-do and Gyeongbuk clearly emerge as wildfire hotspots, together accounting for nearly half of all exposed facilities. In terms of infrastructure risk, the mountainous, forested regions in the northeast and southeast are the most vulnerable—a pattern reflecting the geography of major fire events (e.g., the 2000 East Coast fires, the 2019–2020 Gangwon-do fires, and the record-breaking 2022–2025 fires). These findings indicate that a significant share of South Korea’s fuel infrastructure—especially LPG stations, which are often located in rural fringe areas—has been directly impacted by wildfires in recent decades. Mitigating measures (e.g., creating defensible space around fuel stations, fireproofing structures) should therefore be prioritized in these high-risk provinces.
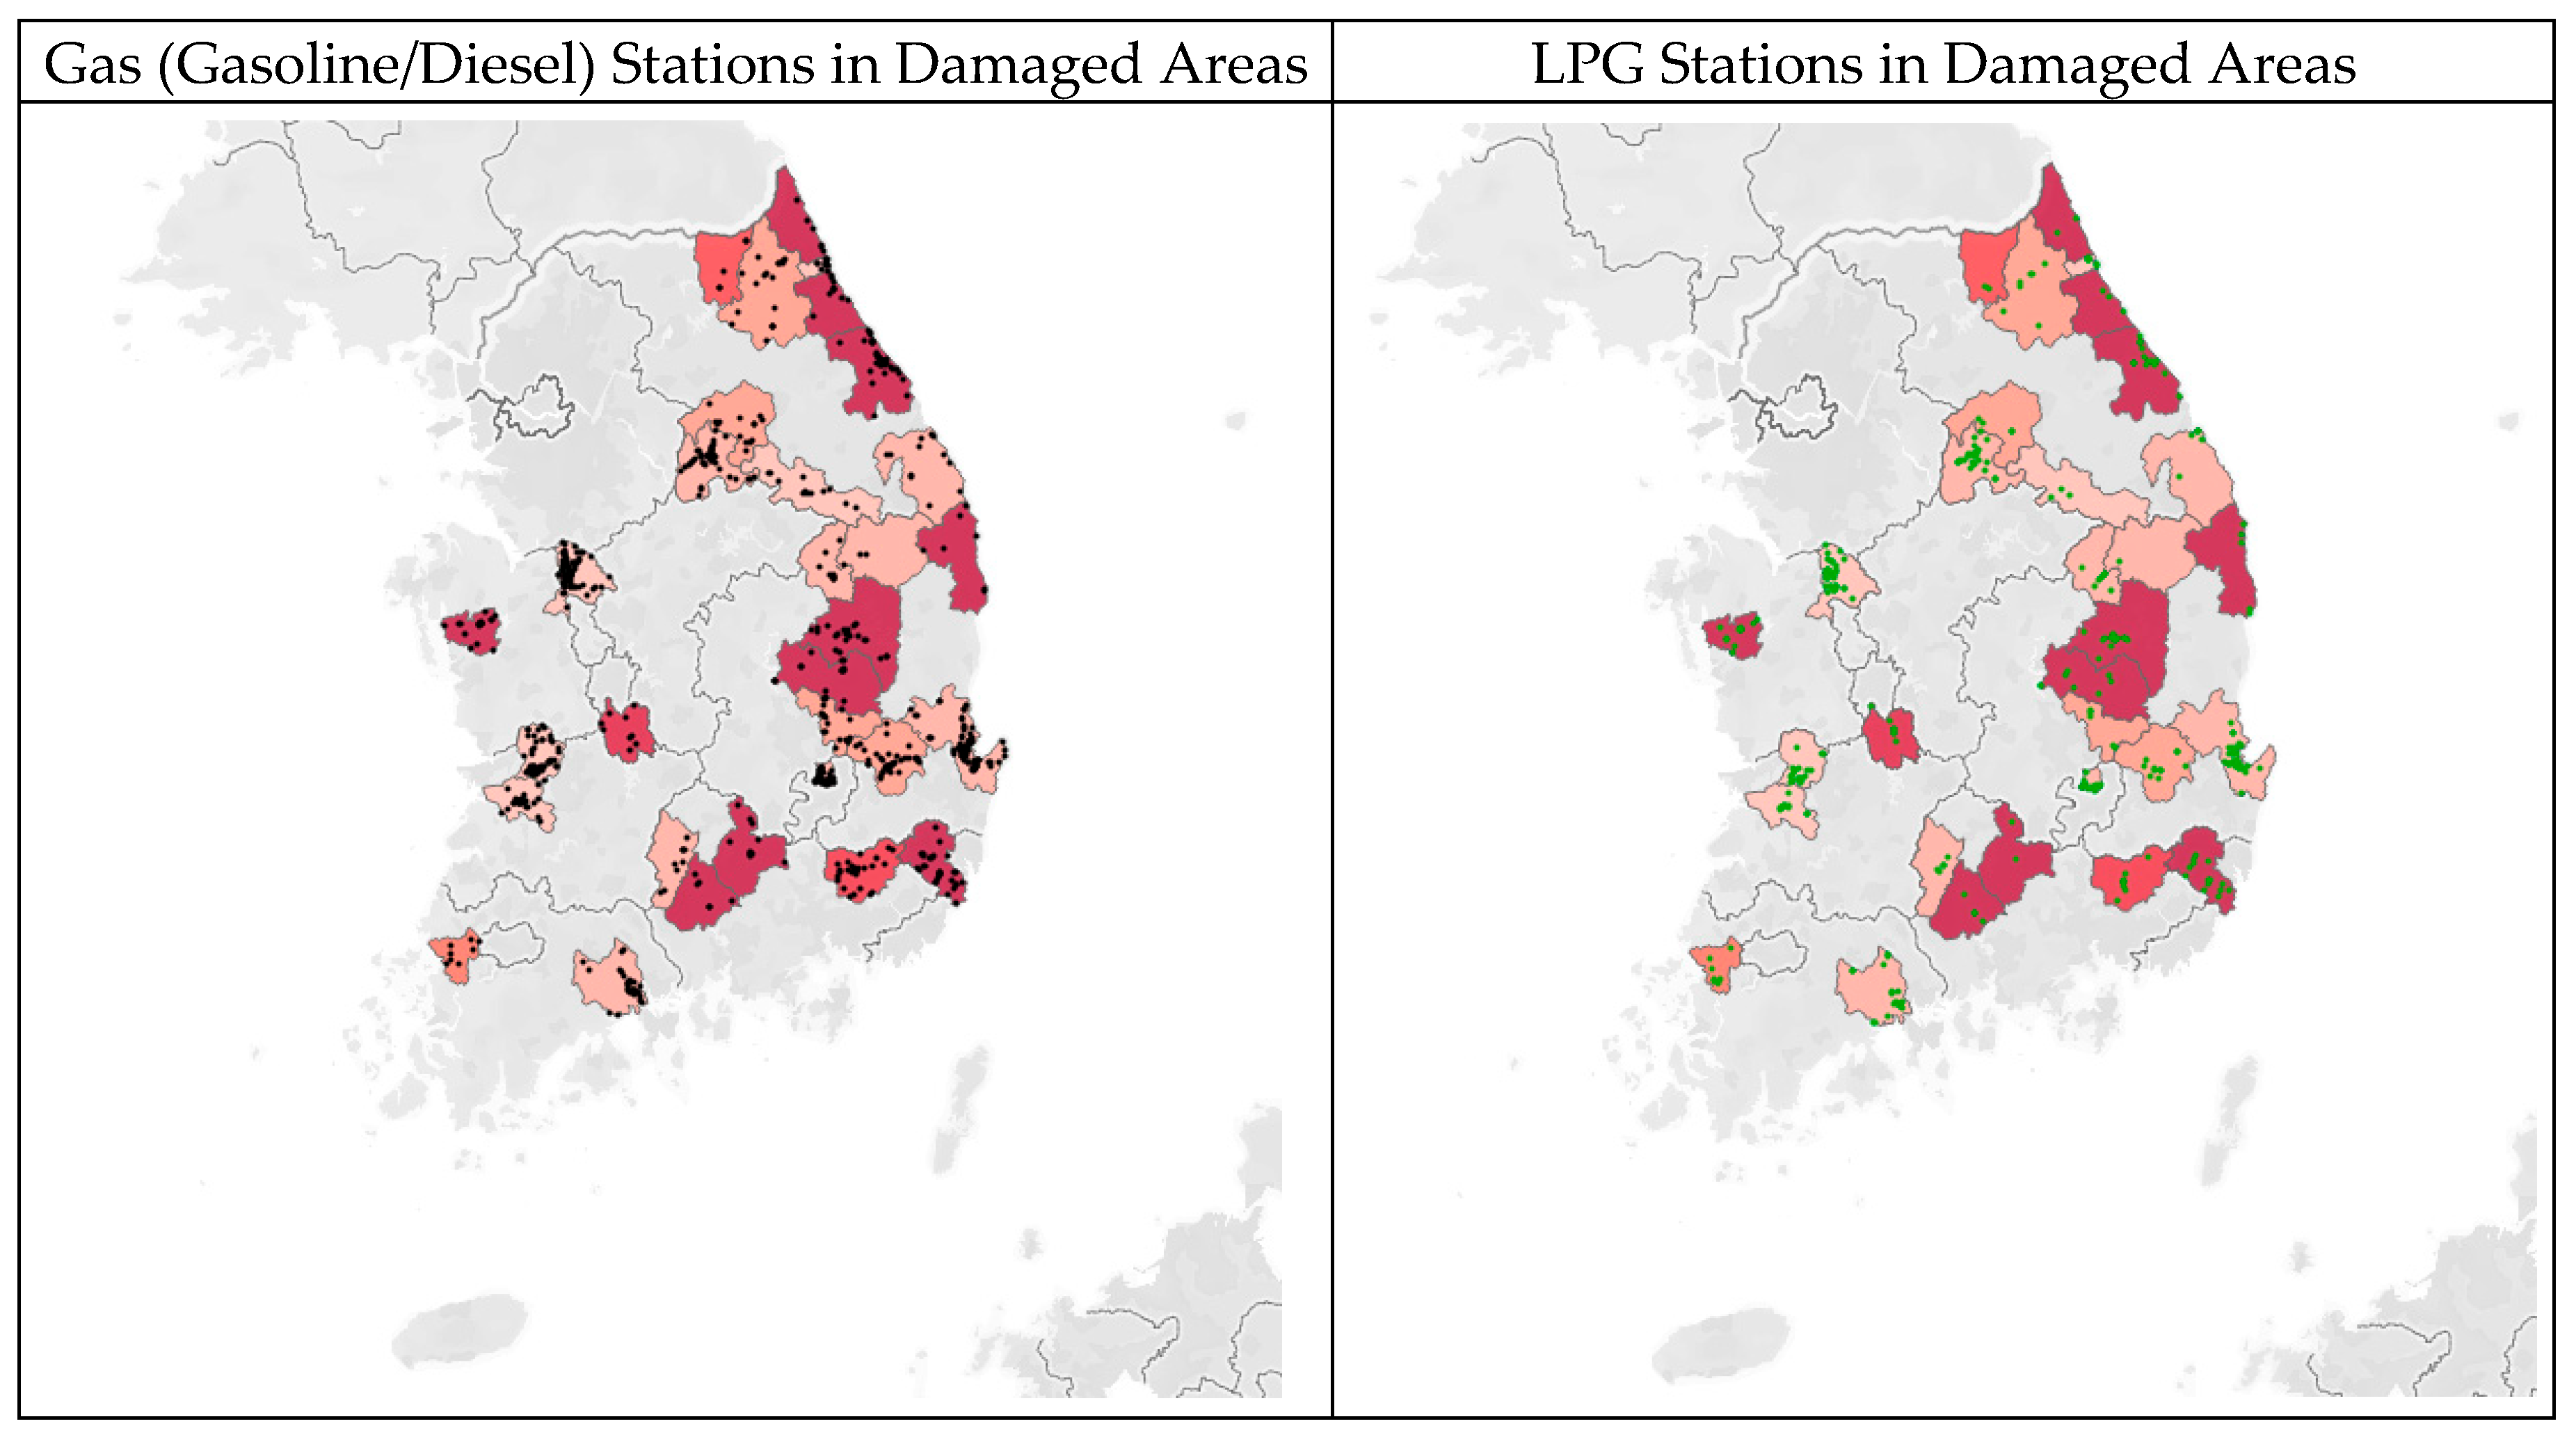
Figure 4 shows the geographic overlap of large wildfire burn areas (2000–2025) with fuel facilities in South Korea. Black circles indicate gasoline/diesel stations, and green circles indicate LPG stations that fell inside wildfire perimeters. Wildfire-exposed facilities are heavily concentrated in Gangwon-do and Gyeongbuk provinces, with scattered cases in several other regions. Hazardous fuel facilities intersecting ≥ 100 ha wildfire areas are shown by province and facility type (2000–2025). The counts of exposed facilities are given, with the percentage of each province’s total facilities in parentheses. Nationwide, roughly 14.1% of gas stations and 11.5% of LPG stations were affected by large wildfires.

5.5. ALOHA Simulation Results

Consistent with the scenario configuration described in Section 4.2.1, the ALOHA consequence analysis distinguished between physically representative accident scenarios and conservative upper-bound comparison cases according to fuel type and storage condition. For LPG, the representative escalation scenario was a BLEVE/fireball because LPG is stored under pressure and may undergo rapid phase transition under severe external heating. For gasoline and diesel, which are typically stored under atmospheric conditions, the representative scenario was pool fire following release and ignition. In addition, hypothetical BLEVE/fireball simulations were performed for gasoline and diesel only to examine conservative upper-bound thermal radiation distances under extreme wildfire heating assumptions and to enable comparison with the LPG BLEVE/fireball case.
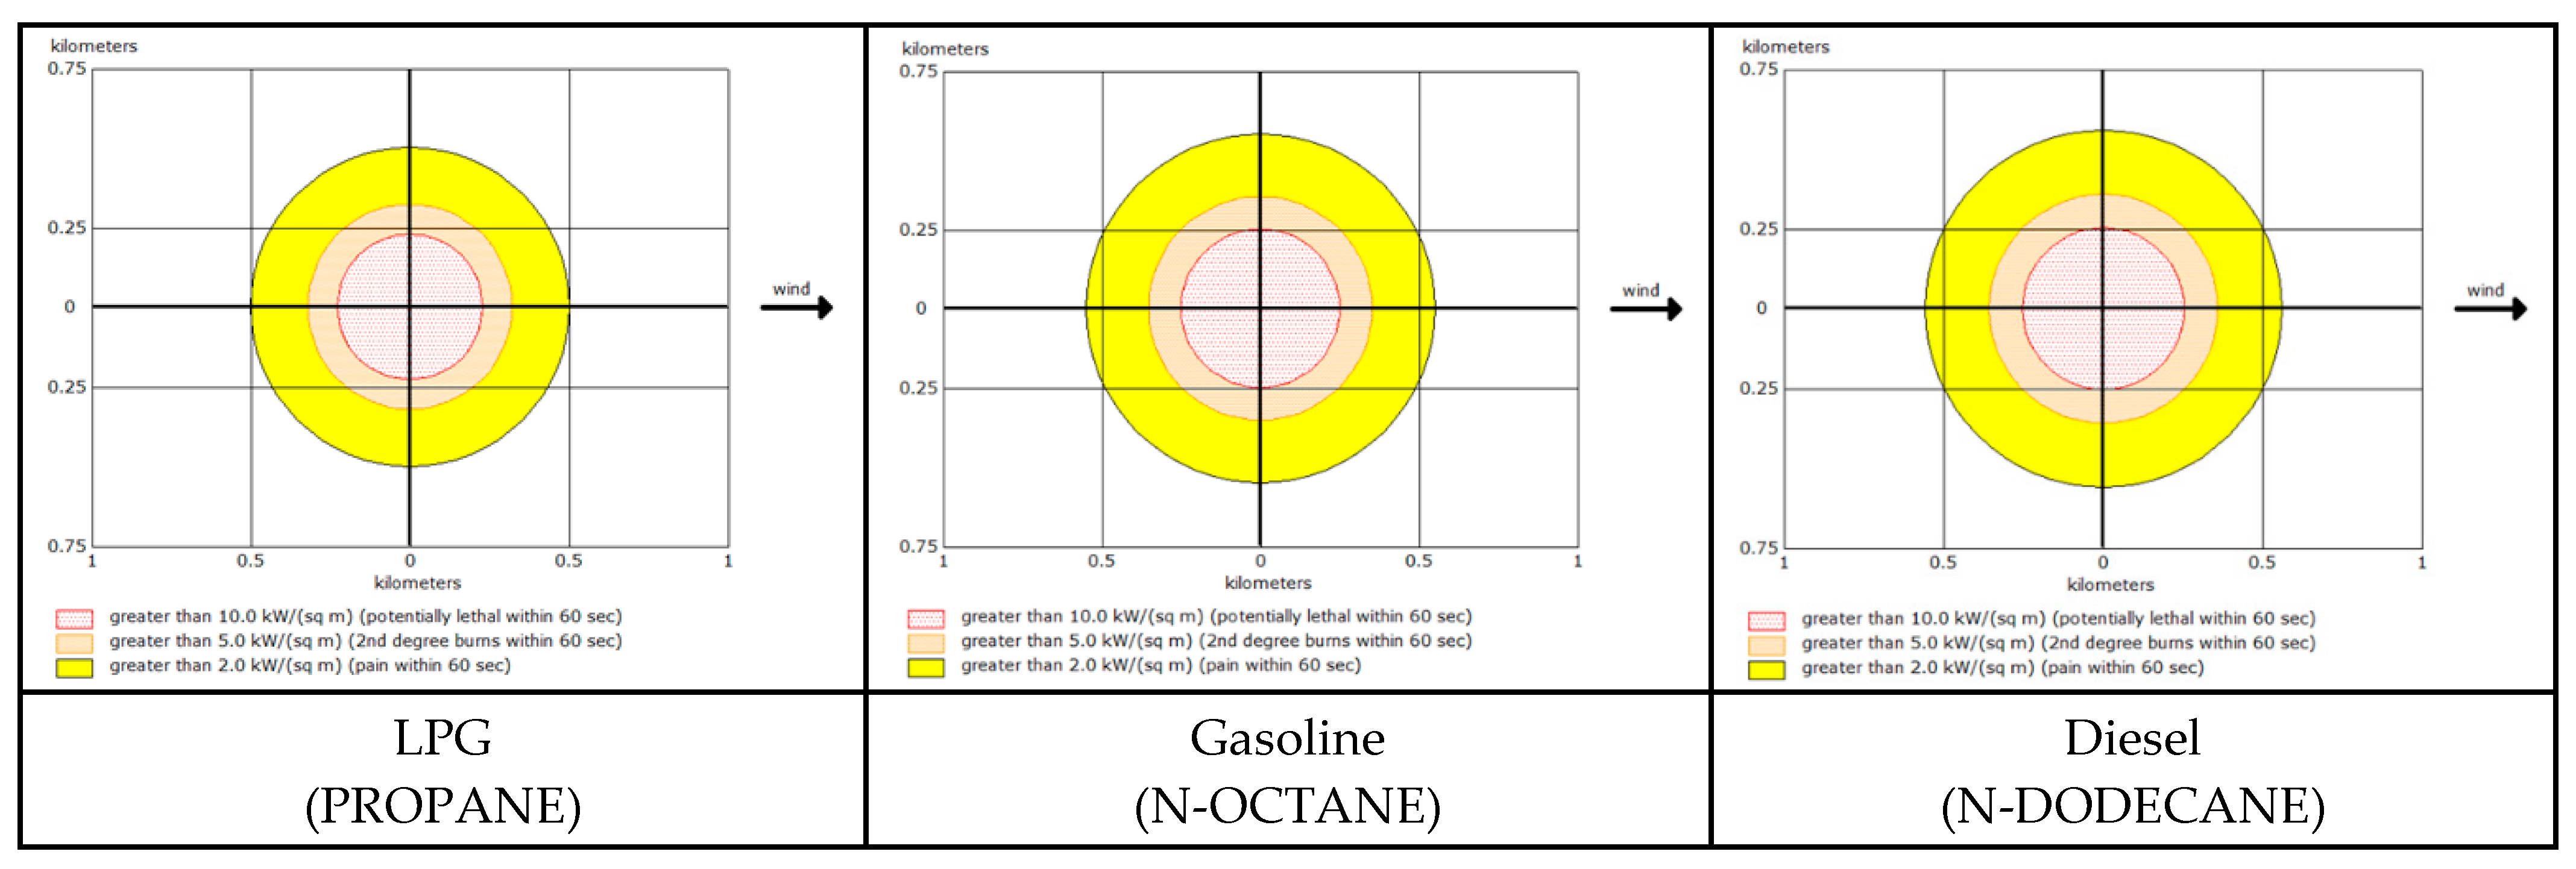
Table 4 summarizes the thermal radiation threat zone distances obtained from the BLEVE/fireball simulations for LPG (propane), gasoline (n-octane), and diesel (n-dodecane) using three injury-based thresholds: 10 kW/m2 (red zone; potentially lethal within 60 s), 5 kW/m2 (orange zone; second-degree burns within 60 s), and 2 kW/m2 (yellow zone; pain within 60 s). At the most severe threshold of 10 kW/m2, the red zone radius was 228 m for LPG, 250 m for gasoline, and 254 m for diesel, with a mean value of 244 m. At 5 kW/m2, the orange zone radius increased to 322 m for LPG, 353 m for gasoline, and 358 m for diesel, with a mean of 344 m. At 2 kW/m2, the yellow zone radius further expanded to 502 m for LPG, 550 m for gasoline, and 559 m for diesel, with a mean of 537 m.
Across the BLEVE/fireball simulations in Table 4, the predicted thermal radiation distance increased consistently as the heat flux threshold decreased. For LPG, the radius increased by 94 m from the red to orange zone (228 to 322 m; +41.2%) and by 180 m from the orange to yellow zone (322 to 502 m; +55.9%), yielding a net increase of 274 m from 10 to 2 kW/m2 (+120.2%). Comparable scaling was observed for gasoline (250 to 353 m; +41.2%; 353 to 550 m; +55.8%; net +120.0%) and diesel (254 to 358 m; +40.9%; 358 to 559 m; +56.1%; net +120.1%). Using the mean values, the average radial extent increased from 244 m at 10 kW/m2 to 344 m at 5 kW/m2 and 537 m at 2 kW/m2, corresponding to stepwise increases of 100 m (+41.0%) and 193 m (+56.1%), respectively.
Within these hypothetical BLEVE/fireball comparison cases, between-fuel differences were modest but systematic. Relative to LPG, gasoline increased the threat zone radius by 22 m at 10 kW/m2 (250 vs. 228 m; +9.6%), 31 m at 5 kW/m2 (353 vs. 322 m; +9.6%), and 48 m at 2 kW/m2 (550 vs. 502 m; +9.6%). The radius for diesel exceeded that of LPG by 26 m at 10 kW/m2 (254 vs. 228 m; +11.4%), 36 m at 5 kW/m2 (358 vs. 322 m; +11.2%), and 57 m at 2 kW/m2 (559 vs. 502 m; +11.4%). Diesel radius was only slightly larger than that of gasoline, differing by 4–9 m across the three thresholds. However, these numerical differences should not be interpreted as indicating that gasoline or diesel would constitute more physically plausible or more catastrophic wildfire-triggered BLEVE hazards than LPG under real service station conditions. Rather, they reflect the behavior of the model under standardized upper-bound comparison assumptions.
Table 5 presents the thermal radiation threat zone distances for the representative pool fire scenarios of gasoline and diesel. For gasoline, the predicted radii were 54 m at 10 kW/m2, 78 m at 5 kW/m2, and 122 m at 2 kW/m2. For diesel, the corresponding radii were 55 m, 78 m, and 121 m, respectively. The two fuels exhibited nearly identical thermal radiation footprints under pool fire conditions, indicating that, as atmospheric liquid fuels, gasoline and diesel produce similar levels of thermal exposure in the representative post-release fire scenario.
A comparison of Table 4 and Table 5 shows that the hypothetical BLEVE/fireball cases for gasoline and diesel produced substantially larger thermal radiation distances than the representative pool fire cases. For gasoline, the BLEVE/fireball distances were 250 m, 353 m, and 550 m for the red, orange, and yellow zones, respectively, compared with 54 m, 78 m, and 122 m for the pool fire scenario. For diesel, the BLEVE/fireball distances were 254 m, 358 m, and 559 m, whereas the pool fire distances were 55 m, 78 m, and 121 m. Overall, the upper-bound BLEVE/fireball distances for gasoline and diesel were approximately 4.5- to 4.6-fold greater than those predicted for the representative pool fire scenarios across the three thresholds.
Taken together, these results distinguish clearly between likely consequence patterns and conservative upper-bound comparison outcomes. For atmospheric liquid fuels, the pool fire results in Table 5 provide a more physically plausible basis for interpreting wildfire-related thermal radiation risk, whereas the gasoline and diesel BLEVE/fireball results in Table 4 are retained only as supplementary upper-bound comparison cases under extreme external heating assumptions. By contrast, the LPG BLEVE/fireball results remain directly relevant because they are consistent with the pressurized storage characteristics of LPG systems.
Figure 5 visualizes the concentric thermal radiation threat zones derived from the BLEVE/fireball simulations. Figure 6 further translates the mean upper-bound threat zone distances from Table 4 into a map-based spatial overlay to illustrate the potential off-site extent of thermal exposure under a conservative Natech escalation scenario. In this overlay, the innermost high-intensity zone remains concentrated around the fuel facility, whereas the intermediate and outer zones extend outward into the surrounding built environment. Notably, the outer thermal radiation envelope reaches the adjacent residential area, indicating that, under an upper-bound escalation scenario, the hazard footprint may extend beyond the facility boundary and affect nearby populations. Accordingly, Figure 6 should be interpreted as an illustrative conservative exposure map based on standardized upper-bound BLEVE/fireball distances, rather than as a depiction of the most probable consequence pattern for gasoline or diesel storage under wildfire conditions.

6. Discussion

6.1. Interpretation of Major Findings

This study extends current wildfire risk research by interpreting the large wildfire exposure of fuel facilities through a wildfire-triggered Natech perspective. The results indicate that large wildfire occurrence in South Korea was temporally episodic and spatially clustered and that this clustering aligned with where fuel infrastructure is embedded in the wildland–urban interface (WUI) and wildland–industrial interface (WII). In practice, this alignment matters because co-location converts a primarily ecological hazard into a multi-hazard emergency: the same fire perimeter that threatens forests and communities can also threaten pressurized tanks, underground storage systems, and fuel transfer equipment, thereby creating the conditions for a technological escalation during an ongoing wildfire incident [3,11,24,51].
The spatial concentration observed in the eastern and southeastern regions is consistent with the operational reality that these landscapes repeatedly experience the combination of wind-exposed mountain corridors, continuous conifer fuels, and interface development along transport routes and valley settlements. These geographic features also structure the national fuel supply network: major roads, logistics corridors, and peri-urban service areas commonly place gas stations and LPG filling stations close to forest edges. The resulting wildfire–facility proximity patterns should be understood as an exposure configuration rather than a coincidence of independent hazards. When large fires recur in the same geographic corridors, repeated intersection with fuel facilities becomes a predictable feature of the hazard landscape, even if the precise sites and fire footprints differ across years [5,7,10].
A key interpretive point is that “lower-intensity” large wildfire presence in other regions does not imply the absence of concern. The results indicate relatively smaller cumulative large fire footprints outside the primary hotspot corridors, but the presence of facilities within wildfire-affected districts demonstrates that exposure is geographically distributed. This means that rare large fire incursions into regions with comparatively fewer events can still produce consequential interface encounters, especially where fuel facilities are located near forested hillslopes, greenbelts, or peri-urban vegetation belts. The findings therefore support a framing in which the wildfire–fuel infrastructure problem is nationally relevant, while the likelihood of repeated encounters is concentrated in specific high-frequency corridors [65,68].

6.2. Implications of ALOHA-Based Impact Distances

The ALOHA outputs clarify that wildfire-triggered technological hazards at fuel facilities are not uniform in their physical mechanisms or spatial footprints. The LPG continuous leak scenarios reflect a dispersion-dominated hazard: a pressurized release produces a flammable vapor cloud whose hazard footprint is governed by atmospheric mixing, wind-driven transport, and near-ground buoyancy behavior. In contrast, BLEVE/fireball scenarios represent an energy release-dominated hazard: a vessel failure under heat impingement can generate a transient but intense thermal radiation field and potential fragment hazards, with consequences that concentrate around the source yet can extend beyond the facility boundary depending on the release and vessel conditions [69,70].
The results further highlight that nighttime atmospheric stability is a defining control for dispersion outcomes. Under stable nocturnal conditions, suppressed turbulence and reduced vertical mixing allow flammable concentrations to persist and extend farther downwind, increasing the spatial reach of the flammable cloud relative to more mixed daytime conditions. This pattern is important in a wildfire context because large fires frequently persist overnight and because response operations and evacuations often occur under diminished visibility and constrained situational awareness. From a consequence perspective, the nighttime dispersion pattern elevates the probability that ignition could occur at a distance from the release point (e.g., via spot fires, ember showers, vehicle ignition sources, or infrastructure faults), increasing the complexity of managing multiple potential ignition sources across a wider area [71,72].
For gasoline and diesel BLEVE/fireball scenarios, the ALOHA results indicate a different sensitivity profile. Compared with vapor dispersion, fireball thermal radiation footprints tend to be less responsive to stability class, because the dominant processes involve heat release and radiative transfer rather than atmospheric mixing. This distinction supports a hazard taxonomy useful for incident characterization: stationary LPG facilities are more likely to present wide-area flammable vapor concerns under adverse dispersion conditions, while mobile fuel tanks and certain storage configurations can present comparatively localized yet high-intensity thermal radiation hazards if a catastrophic vessel failure occurs. Interpreting the ALOHA results in this way helps separate the operational questions of (i) managing broad exclusion and ignition control in dispersion scenarios versus (ii) managing near-field thermal exposure and rapid escalation in BLEVE/fireball scenarios [73,74,75].

6.3. Wildfire–Natech Perspective

The findings contribute to the growing literature on natural hazard-triggered technological (Natech) disasters by providing scenario-based evidence for wildfire-triggered technological escalation involving common fuel infrastructure. Wildfires are increasingly recognized as credible Natech triggers, yet they remain underrepresented compared with earthquakes, floods, or storms in many industrial safety frameworks. This study addresses this imbalance by focusing on everyday, distributed infrastructure (service stations and filling stations) rather than only major industrial complexes. This emphasis is significant because distributed facilities are numerous, are often located near the WUI/WII, and can be exposed during fast-moving interface fires, producing cascading hazards that strain response systems [65,68,76].
International wildfire experience underscores the relevance of this Natech framing. Wildfires in North America and Australia have repeatedly demonstrated how infrastructure vulnerability can compound a wildfire emergency through damage to power systems, pipelines, storage yards, and pressurized fuel containers, including recurring reports of propane cylinder involvement and secondary fires during interface events. The Fort McMurray wildfire and recent catastrophic interface fires in the western United States illustrate how the wildfire exposure of fuel and industrial assets can force shutdowns, the evacuation of industrial workforces, and complex protection operations that extend beyond standard wildfire suppression. In South Korea, the documented encroachment of major wildfires toward critical infrastructure has already shown that “near-miss” conditions are plausible in the national context. Within this international–domestic continuum, the present study positions South Korea’s large wildfire regime as a credible driver of Natech-type escalation pathways and demonstrates that wildfire–facility encounters should be treated as a recurring multi-hazard configuration rather than an exceptional anomaly [77,78].

6.4. Practical Relevance

The results of this study carry practical relevance for multiple stakeholders involved in wildfire response and hazardous facility management, when viewed specifically through the lens of mobile fuel tank hazards associated with gas stations. From the perspective of national fire and disaster response authorities, including fire services and wildfire management agencies, the findings highlight that wildfires may intersect with fuel infrastructure in ways that introduce localized but high-intensity technological hazards. In particular, the wildfire exposure of mobile or transport-associated fuel tanks creates incident environments where thermal radiation hazards may arise abruptly and independently of wildfire flame fronts [79].
For wildfire management agencies, the results emphasize that large wildfire incidents cannot be treated solely as landscape-scale fire problems when fuel storage and handling systems are present within or adjacent to affected areas. The spatial overlap documented in this study indicates that wildfire suppression operations may unfold in proximity to mobile fuel tanks that retain the potential for rapid escalation under thermal exposure. This operational reality implies that wildfire incidents increasingly encompass mixed hazard conditions, even in the absence of permanent industrial installations [59,80,81].
At the local government level, the findings underscore the role of municipalities as coordination nodes between wildfire response agencies and private fuel facility operators. Local authorities are frequently responsible for managing evacuation zones, access restrictions, and public safety messaging in areas where wildfire activity coincides with fuel stations. The presence of mobile fuel tanks introduces an additional layer of complexity, as the spatial extent of potential thermal radiation effects may not align with administrative boundaries or standard wildfire exclusion perimeters [82,83].
From the standpoint of private gas station operators and fuel distributors, the results indicate that wildfire exposure extends beyond structural damage to facilities. Mobile fuel tanks located within wildfire-affected districts may remain intact yet be subjected to prolonged radiant heat or indirect fire effects, maintaining the potential for high-consequence failure modes. The analytical significance of this finding lies in recognizing that wildfire exposure constitutes a recurring operational condition for certain fuel-handling assets, rather than an exceptional scenario limited to direct flame impingement [61,80].
For hazardous materials safety managers and on-site safety officers, this study highlights that wildfire-related hazards involving mobile fuel tanks are characterized by intense thermal radiation over relatively constrained spatial scales, rather than wide-area dispersion phenomena. This distinction is practically relevant because it shapes how hazard zones are identified, communicated, and managed during multi-agency responses. The results indicate that, during wildfire incidents, attention must be given to the possibility of rapid escalation associated with mobile fuel storage, even when broader wildfire behavior appears moderate or spatially distant [80,84,85].
Across stakeholders, the results collectively demonstrate that wildfires act as external stressors capable of activating localized technological hazards linked to fuel storage and transport systems. The practical relevance of these findings lies not in prescribing specific countermeasures but in clarifying that wildfire incidents involving mobile fuel tanks inherently require cross-domain situational awareness among wildfire suppression agencies, emergency responders, local governments, and private facility operators. By documenting these interactions empirically, this study provides a foundation for understanding how wildfires increasingly challenge conventional separations between environmental hazards and technological safety management [68,80].

7. Conclusions

This study investigated wildfire-triggered Natech exposure of fuel infrastructure in South Korea by integrating spatial overlay analysis with scenario-based thermal-radiation modeling. The results showed that LPG filling stations and gasoline/diesel service stations are repeatedly located within wildfire-affected districts, particularly in wildfire-prone interface regions, indicating that such facilities represent a recurring component of wildfire exposure in South Korea. The consequence analysis further demonstrated that, under severe escalation conditions, thermal-radiation impacts may extend beyond facility boundaries and create off-site exposure to adjacent built-up areas, including residential environments. For LPG, BLEVE/fireball remained the relevant high-severity scenario, whereas for gasoline and diesel, pool fire provided the more physically representative accident scenario, with BLEVE/fireball retained only as a conservative upper-bound comparison case. The delineated thermal-radiation zones therefore provide practical reference distances for precautionary siting and spatial planning in wildfire-prone WUI/WII areas, particularly in relation to surrounding land use, separation from residential areas and critical infrastructure, and the need for conservative buffer space. These findings should be interpreted within the scope of wildfire-exposed fuel infrastructure, rather than as a generalized assessment of all Natech-prone industrial facilities.
Future research should therefore prioritize coupled wildfire–atmosphere–Natech modeling frameworks that integrate high-resolution fire spread models, mesoscale meteorology, and technological failure scenarios. Expanding the analytical scope beyond fuel facilities to include other hazardous installations—such as chemical storage sites, power infrastructure, or waste treatment facilities—would further advance the understanding of wildfire-triggered cascading risks. Additionally, the use of real-time or near-real-time datasets could support the development of operational decision-support tools capable of addressing wildfire–industrial interface risks during active incidents. The findings of this study should be interpreted within the scope of wildfire-exposed fuel infrastructure, particularly LPG filling stations and gasoline/diesel service stations, rather than as a generalized assessment of all Natech-prone industrial facilities.
Together, these directions would strengthen the empirical and theoretical foundations of wildfire–Natech research and enhance the capacity to manage compound hazards in a warming, fire-prone world.

Author Contributions

Conceptualization, J.-c.P.; methodology, J.-c.P. and J.-c.Y.; software, J.-c.P. and J.-c.Y.; validation, J.-c.P.; formal analysis, J.-c.P.; investigation, J.-c.P.; resources, J.-c.P.; data curation, J.-c.P.; writing—original draft preparation, J.-c.P. and J.-c.Y.; writing—review and editing, J.-c.P.; visualization, J.-c.P. and J.-c.Y.; supervision, J.-c.P. and M.-h.B.; project administration, J.-c.P.; funding acquisition, M.-h.B. All authors have read and agreed to the published version of the manuscript.

Funding

This research received no external funding.

Institutional Review Board Statement

Not applicable.

Informed Consent Statement

Not applicable.

Data Availability Statement

The data used in this study are available from the corresponding author upon reasonable request.

Acknowledgments

The authors acknowledge Kangwon National University (Samcheok, Republic of Korea) for support of the open-access publication charge for this article. The authors gratefully acknowledge Kangwon National University (Samcheok, Republic of Korea) for supporting the open-access publication charge for this article. During the preparation of this work, the authors used ChatGPT (OpenAI; model: GPT-5.4 Thinking) in order to improve language and readability. After using this tool/service, the authors reviewed and edited the content as needed and take full responsibility for the content of the publication.

Conflicts of Interest

The authors declare no conflicts of interest.

Abbreviations

The following abbreviations are used in this manuscript:
ALOHAAreal Locations of Hazardous Atmospheres
BLEVEBoiling Liquid Expanding Vapor Explosion
KFSKorea Forest Service
KGSKorea Gas Safety Corporation
KPetroKorea Petroleum Quality & Distribution Authority
LPGLiquefied Petroleum Gas
NatechNatural Hazard-Triggered Technological Disaster
QCQuality Control
WIIWildland–Industrial Interface
WUIWildland–Urban Interface

References

  1. Planas, E.; Paugam, R.; Àgueda, A.; Vacca, P.; Pastor, E. Fires at the wildland-industrial interface. Is there an emerging problem? Fire Saf. J. 2023, 141, 103906. [Google Scholar] [CrossRef]
  2. World Resources Institute. Global Trends in Forest Fires; World Resources Institute (WRI): Washington, DC, USA, 2022. [Google Scholar]
  3. Guo, Y.; Wang, J.; Ge, Y.; Zhou, C. Global expansion of wildland-urban interface intensifies human exposure to wildfire risk in the 21st century. Sci. Adv. 2024, 10, eado9587. [Google Scholar] [CrossRef] [PubMed]
  4. Wasserman, T.N.; Mueller, S.E. Climate influences on future fire severity: A synthesis of climate-fire interactions and impacts on fire regimes, high-severity fire, and forests in the western United States. Fire Ecol. 2023, 19, 43. [Google Scholar] [CrossRef]
  5. Park, J.; Suh, J.; Baek, M. Climatic and Forest Drivers of Wildfires in South Korea (1980–2024): Trends, Predictions, and the Role of the Wildland–Urban Interface. Forests 2025, 16, 1476. [Google Scholar] [CrossRef]
  6. Center for Disaster Philanthropy. South Korean Wildfires; Center for Disaster Philanthropy: Washington, DC, USA, 2022. [Google Scholar]
  7. Wikipedia. 2019 Goseong Fire. 2019. Available online: https://en.wikipedia.org/wiki/2019_Goseong_fire (accessed on 1 January 2026).
  8. Kim, J.; Kim, T.; Lee, Y.-E.; Im, S. Spatial and temporal variability of forest fires in the Republic of Korea over 1991–2020. Nat. Hazards 2025, 121, 9801–9821. [Google Scholar] [CrossRef]
  9. The Independent. South Korea Wildfires Cause Forecast. The Independent. 28 March 2025. Available online: https://www.the-independent.com/climate-change/news/south-korea-wildfires-cause-forecast-b2742221.html (accessed on 1 January 2026).
  10. Park, J.; Yun, J.; Suh, J.; Baek, M. A Study on the Impact Assessment of LPG Filling Stations in the Event of Large Wildfires in WUI-P. J. Soc. Disaster Inf. 2024, 20, 909–921. [Google Scholar]
  11. Park, H.; Nam, K.; Lim, H. Is critical infrastructure safe from wildfires? A case study of wildland-industrial and-urban interface areas in South Korea. Int. J. Disaster Risk Reduct. 2023, 95, 103849. [Google Scholar] [CrossRef]
  12. Khakzad, N.; Dadashzadeh, M.; Reniers, G. Quantitative assessment of wildfire risk in oil facilities. J. Environ. Manag. 2018, 223, 433–443. [Google Scholar] [CrossRef]
  13. Luo, X.; Tzioutzios, D.; Suárez-Paba, M.C.; Cruz, A.M. Climate Change Impacts on Natech Risk. In Oxford Research Encyclopedia of Natural Hazard Science; Oxford Academic: New York, NY, USA, 2024. [Google Scholar]
  14. European Commission. Wildfires and Technological Disasters: A Review of Natech Risk and Research Needs; Publications Office of the European Union: Luxembourg, 2020. [Google Scholar]
  15. Ricci, F.; Moreno, V.C.; Cozzani, V. Natech accidents triggered by heat waves. Safety 2023, 9, 33. [Google Scholar] [CrossRef]
  16. Allkpop. Explosion of a Transformer Ignites a Huge Fire Now Spreading Through the Area of Sokcho, Gangwon-do. Allkpop, 2019.
  17. Office of Information and Technology; U.S. Department of Veterans Affairs. VA Technical Reference Model (TRM); U.S. Department of Veterans Affairs: Washington, DC, USA, 2023. Available online: https://www.oit.va.gov/services/trm/ToolPage.aspx?tid=9015 (accessed on 1 January 2026).
  18. Schug, F.; Bar-Massada, A.; Carlson, A.R.; Cox, H.; Hawbaker, T.J.; Helmers, D. The global wildland–urban interface. Nature 2023, 621, 94–99. [Google Scholar] [CrossRef]
  19. Keeley, J.E. Fire intensity, fire severity and burn severity: A brief review and suggested usage. Int. J. Wildland Fire 2009, 18, 116–126. [Google Scholar] [CrossRef]
  20. He, K.; Shen, X.; Anagnostou, E. Global burn severity in forest ecoregions: Trends, climate drivers, and predictive insights. npj Nat. Hazards 2025, 2, 61. [Google Scholar] [CrossRef]
  21. Kurbanov, E.; Vorobev, O.; Lezhnin, S.; Sha, J.; Wang, J.; Li, X.; Cole, J.; Dergunov, D.; Wang, Y. Remote Sensing of Forest Burnt Area, Burn Severity, and Post-Fire Recovery: A Review. Remote Sens. 2022, 14, 4714. [Google Scholar] [CrossRef]
  22. Mohammadi, Z.; Lohmander, P.; Kašpar, J.; Berčák, R.; Holuša, J.; Marušák, R. The effect of climate factors on the size of forest wildfires (case study: Prague-East district, Czech Republic). J. For. Res. 2022, 33, 1291–1300. [Google Scholar] [CrossRef]
  23. Miller, E.A. A Conceptual Interpretation of the Drought Code of the Canadian Forest Fire Weather Index System. Fire 2020, 3, 23. [Google Scholar] [CrossRef]
  24. Jo, H.-W.; Krasovskiy, A.; Hong, M.; Corning, S.; Kim, W.; Kraxner, F.; Lee, W.-K. Modeling Historical and Future Forest Fires in South Korea: The FLAM Optimization Approach. Remote Sens. 2023, 15, 1446. [Google Scholar] [CrossRef]
  25. Butler, B.; Quarles, S.; Standohar-Alfano, C.; Morrison, M.; Jimenez, D.; Sopko, P.; Wold, C.; Bradshaw, L.; Atwood, L.; Landon, J.; et al. Exploring fire response to high wind speeds: Fire rate of spread, energy release and flame residence time from fires burned in pine needle beds under winds up to 27 m s−1. Int. J. Wildland Fire 2019, 29, 81–92. [Google Scholar] [CrossRef]
  26. Johnsson, E.L.; Johnsson, E.L.; Butler, K.; Fernandez, M.G.; Nazare, S.; Maranghides, A. Wind-Driven Fire Spread to a Structure from Firewood Piles; US Department of Commerce, National Institute of Standards and Technology: Gaithersburg, MD, USA, 2023.
  27. Elliott, K.G.; Flannigan, M.D.; Tymstra, C. Enhanced prediction of extreme fire weather conditions in spring using the Hot-Dry-Windy Index in Alberta, Canada. Int. J. Wildland Fire 2024, 33, WF24015. [Google Scholar] [CrossRef]
  28. World Weather Attribution. Climate Change Made Weather Conditions Leading to Deadly South Korean Wildfires About Twice as Likely. 2025. Available online: https://www.worldweatherattribution.org/climate-change-made-weather-conditions-leading-to-deadly-south-korean-wildfires-about-twice-as-likely/ (accessed on 14 January 2026).
  29. Jeon, E.-H.; Ham, E.-G. The Impact of Climate Change on Fire. J. Wellbeing Manag. Appl. Psychol. 2024, 7, 15–20. [Google Scholar]
  30. Kreider, M.R.; Higuera, P.E.; Parks, S.A.; Rice, W.L.; White, N.; Larson, A.J. Fire suppression makes wildfires more severe and accentuates impacts of climate change and fuel accumulation. Nat. Commun. 2024, 15, 2412. [Google Scholar] [CrossRef]
  31. Fernández-Guisuraga, J.M.; Calvo, L. Fuel build-up promotes an increase in fire severity of reburned areas in fire-prone ecosystems of the western Mediterranean Basin. Fire Ecol. 2023, 19, 72. [Google Scholar] [CrossRef]
  32. Jung, S.; Lee, J.; Lee, K.; Cho, S.; Kim, B.; Shin, Y. Twenty-Years of Regeneration Dynamics for Tree Species in Burnt Pine Forests with Different Severity and Initial Regeneration. Available online: https://ssrn.com/abstract=4085438 (accessed on 12 January 2026).
  33. Choung, Y.; Lee, B.-C.; Cho, J.-H.; Lee, K.-S.; Jang, I.-S.; Lim, S.-H.; Hong, S.-K.; Jung, W.-C.; Choung, H.-L. Forest responses to the large-scale east coast fires in Korea. Ecol. Res. 2004, 19, 43–54. [Google Scholar] [CrossRef]
  34. Hwang, Y.; Kweon, H.; Kang, W.; Lee, J.-W.; Kwon, S.; Jung, Y.; Bae, J.; Lee, K.; Sim, Y. Comparison of vegetation recovery according to the forest restoration technique using the satellite imagery: Focus on the Goseong (1996) and East Coast (2000) forest fire. Korean J. Agric. Sci. 2023, 50, 555–567. [Google Scholar] [CrossRef]
  35. Reuters. Thousands Flee Wildfire in South Korea’s Eastern Coast, One Dead—Yonhap. Reuters, 5 April 2019.
  36. Hong, J.S.; Hyun, S.Y.; Lee, J.H.; Sim, M. Mental health effects of the Gangwon wildfires. BMC Public Health 2022, 22, 1183. [Google Scholar] [CrossRef] [PubMed]
  37. Kim, N.G.; Kim, M.-I. Numerical Simulation of Wildfire Smoke and Estimation of the Resident Health Impact—A Case Study of 2022 Uljin-Samcheok Wildfire. Crisisonomy 2022, 18, 71–80. [Google Scholar]
  38. Baek, S.; Lim, J.; Kim, W. Analysis on the fire progression and severity variation of the massive forest fire occurred in Uljin, Korea, 2022. Forests 2022, 13, 2185. [Google Scholar] [CrossRef]
  39. The Korea Times. Korea’s Worst-Ever Wildfires Contained in 149 Hours, 48,000 ha of Forest Scorched. The Korea Times, 28 March 2025.
  40. France 24. South Korea Wildfires: Largest on Record—Disaster Chief. France 24, 27 March 2025.
  41. The Guardian. South Korea Fires: Death Toll Rises in Worst in History. The Guardian, 27 March 2025.
  42. Kim, J.S.; Kang, S.H. Climate Change and Wildfire Dynamics in South Korea: A Systematic Review of Research and Policy Implications. Journal of Environmental Policy 2024, 32, 77–103. [Google Scholar] [CrossRef]
  43. Doerr, S.H.; Santín, C. Global trends in wildfire and its impacts: Perceptions versus realities in a changing world. Philos. Trans. R. Soc. B Biol. Sci. 2016, 371, 20150345. [Google Scholar] [CrossRef]
  44. Lamsaf, H.; Lamsaf, A.; Kerroum, M.A.; Almeida, M. Assessing trends in wildland-urban interface fire research through text mining: A comprehensive analysis of published literature. J. For. Res. 2024, 35, 71. [Google Scholar] [CrossRef]
  45. Trotta, G.; Cadez, L.; Boscutti, F.; Vuerich, M.; Asquini, E.; Boscarol, G.; Cingano, P.; Azzani, G.; Pischedda, S.; Tomao, A.; et al. Interpreting the shifts in forest structure, plant community composition, diversity, and functional identity by using remote sensing-derived wildfire severity. Fire Ecol. 2024, 20, 94. [Google Scholar] [CrossRef]
  46. Choi, J.; Chae, H. Assessing wildfire risk in South Korea under climate change using the Maximum Entropy model and Shared Socioeconomic Pathway scenarios. Atmosphere 2024, 16, 5. [Google Scholar] [CrossRef]
  47. Synolakis, C.E.; Karagiannis, G.M. Wildfire risk management in the era of climate change. PNAS Nexus 2024, 3, 151. [Google Scholar] [CrossRef] [PubMed]
  48. Yirka, B. Satellite Analysis Shows Wildland-Urban Interface Areas Expanding Rapidly. Phys.org. 2024. Available online: https://phys.org/news/2024-11-satellite-analysis-wildland-urban-interface.html (accessed on 1 January 2026).
  49. Tang, W.; He, C.; Emmons, L.; Zhang, J. Global expansion of wildland-urban interface (WUI) and WUI fires: Insights from a multiyear worldwide unified database (WUWUI). Environ. Res. Lett. 2024, 19, 044028. [Google Scholar] [CrossRef]
  50. Kumar, M.; AghaKouchak, A.; Abatzoglou, J.T.; Sadegh, M. Compounding effects of climate change and WUI expansion quadruple the likelihood of extreme-impact wildfires in California. npj Nat. Hazards 2025, 2, 17. [Google Scholar] [CrossRef]
  51. Chen, B.; Wu, S.; Jin, Y.; Song, Y.; Wu, C.; Venevsky, S.; Xu, B.; Webster, C.; Gong, P. Wildfire risk for global wildland–urban interface areas. Nat. Sustain. 2024, 7, 474–484. [Google Scholar] [CrossRef]
  52. Min, J.K. A Study on Measures to Prevent Fire Spread in Logistics Facilities due to Forest Fires in Wildland Urban Interface. J. Soc. Disaster Inf. 2024, 20, 922–934. [Google Scholar]
  53. Almeida, M. Scientific Perspectives on Wildfire Risk Management at the WUI Property Scale; Imprensa da Universidade de Coimbra/Coimbra University Press: Coimbra, Portugal, 2025. [Google Scholar]
  54. Taccaliti, F.; Marzano, R.; Bell, T.L.; Lingua, E. Wildland–urban interface. Wildland–urban interface: Definition and physical fire risk mitigation measures, a systematic review. Fire 2023, 6, 343. [Google Scholar] [CrossRef]
  55. Moritz, M.A.; Hazard, R.; Johnston, K.; Mayes, M.; Mowery, M.; Oran, K. Beyond a Focus on Fuel Reduction in the WUI: The Need for Regional Wildfire Mitigation to Address Multiple Risks. Front. For. Glob. Change 2022, 5, 848254. [Google Scholar] [CrossRef]
  56. Lopes, R.F.; Rodrigues, J.P.C.; Paula, D.; Camargo, A.L. Guidelines for the protection of industrial buildings from wildland-industrial interface fires. In Proceedings of the CEEC 2023: 2nd International Conference on Construction, Energy, Environment and Sustainability, Funchal, Madeira Island, Portugal, 27–30 July 2023. [Google Scholar]
  57. Kern, H.; Krausmann, E. Wildfires Triggering Natech Events; Publications Office of the European Union: Luxembourg, 2020; Available online: https://publications.jrc.ec.europa.eu/repository/handle/JRC121315 (accessed on 1 January 2026).
  58. Ricci, F.; Scarponi, G.E.; Pastor Ferrer, E.; Planas Cuchi, E.; Cozzani, V. Asset integrity in the case of wildfires at wildland-industrial interfaces. Chem. Eng. Trans. 2022, 90, 247–252. [Google Scholar]
  59. United States Environmental Protection Agency. Wildfire Guide: Preparation and Recovery for Underground and Aboveground Storage Tank Systems; EPA Publication; U.S. Environmental Protection Agency (EPA): Washington, DC, USA, 2021.
  60. OECD European Commission Joint Research; United Nations Economic Commission for Europe. Managing Risks from Natural Hazards to Hazardous Installations (Natech): A Guide for Senior Leaders in Industry and Public Authorities; OECD Series on Chemical Accidents; OECD Publishing: Paris, France; European Commission: Brussels, Belgium; United Nations: Paris, France, 2024. [Google Scholar]
  61. Lee, J.; Ryu, J.; Park, S.; Yoon, M.-O.; Lee, C. Study on the Evaluation of Radiant Heat Effects of Oil Storage Tank Fires Due to Environmental Conditions. Fire Sci. Eng. 2020, 34, 72–78. [Google Scholar] [CrossRef]
  62. Wikipedia. 2022 Uljin Forest Fire. Wikipedia. 2022. Available online: https://en.wikipedia.org/wiki/2022_Uljin_forest_fire (accessed on 1 January 2026).
  63. Reuters. Canada Wildfire Rages Near Oil Sand Facilities, Extending Shutdowns. Reuters, 18 May 2016.
  64. Wikipedia. Camp Fire (2018). 2018. Available online: https://en.wikipedia.org/wiki/Camp_Fire_(2018) (accessed on 1 January 2026).
  65. Naser, M.Z.; Kodur, V. Vulnerability of structures and infrastructure to wildfires: A perspective into assessment and mitigation strategies. Nat. Hazards 2025, 121, 9995–10015. [Google Scholar] [CrossRef]
  66. The Korea Herald. Number of Gas Stations in Korea Falls to Record Low. The Korea Herald, 2025.
  67. Park, K.; Jo, Y. An approach to assess and manage the risk of an urban LPG station in Korea. WIT Trans. Ecol. Environ. 2004, 72, 9. [Google Scholar]
  68. Kalapodis, N.; Sakkas, G.; Kazantzidou-Firtinidou, D.; Alcasena, F.; Cardarilli, M.; Eftychiadis, G.; Koerner, C.; Moore-Merrell, L.; Gugliandolo, E.; Demestichas, K.; et al. Towards Resilient Critical Infrastructure in the Face of Extreme Wildfire Events: Lessons and Policy Pathways from the US and EU. Infrastructures 2025, 10, 246. [Google Scholar] [CrossRef]
  69. Gu, Y.-J.; Song, B.; Lee, W.; Song, B.; Shin, J. Analysis of the Damaged Range Caused by LPG Leakage and Vapor Clouds Considering the Cold Air Flow. J. Korean Inst. Gas 2022, 26, 27–35. [Google Scholar]
  70. Islam, M.A.; Banik, S.; Rahman, K.; Islam, M. 190-Study of the Analyzing the Effect of Releasing LPG in the Environment with Different Wind Velocity Using ALOHA. In Proceedings of the International Conference on Mechanical, Industrial and Energy Engineering 2022, Khulna, Bangladesh, 22–24 December 2022. [Google Scholar]
  71. Liu, Y.; Heilman, W.E.; Potter, B.E.; Clements, C.B.; Jackson, W.A.; French, N.H.F.; Goodrick, S.L.; Kochanski, A.K.; Larkin, N.K.; Lahm, P.W.; et al. Smoke Plume Dynamics. In Wildland Fire Smoke in the United States: A Scientific Assessment; Peterson, D.L., McCaffrey, S.M., Patel-Weynand, T., Eds.; Springer International Publishing: Cham, Switzerland, 2022; pp. 83–119. [Google Scholar]
  72. Decker, Z.C.J.; Robinson, M.A.; Barsanti, K.C.; Bourgeois, I.; Coggon, M.M.; DiGangi, J.P.; Diskin, G.S.; Flocke, F.M.; Franchin, A.; Fredricks, C.D.; et al. Nighttime and daytime dark oxidation chemistry in wildfire plumes: An observation and model analysis of FIREX-AQ aircraft data. Atmos. Chem. Phys. 2021, 21, 16293–16317. [Google Scholar] [CrossRef]
  73. Hwang, W. A Study on the Impact of Damage Caused by an Explosion Accident at a Downtown Gas Station: Focusing on Radiant Heat. J. Korean Soc. Hazard Mitig. 2020, 20, 103–111. [Google Scholar] [CrossRef]
  74. Manescau, B.; Chetehouna, K.; Sellami, I. BLEVE Fireball Effects in a Gas Industry: A Numerical Modeling Applied to the Case of an Algeria Gas Industry. In Fire Safety and Management Awareness; Zafar, D.F., Ghosal, A., Eds.; IntechOpen: London, UK, 2020. [Google Scholar]
  75. Kim, H.-S.; Kong, H.-S. Comparative Analysis for Risks of Small LPG Storage Tanks Using Damage Prediction Program. Res. Mil. 2022, 12, 2685–2694. [Google Scholar]
  76. Nicotra, G.; Rossi, E.; Decarli, L.; Di Talia, V.; Tugnoli, A.; Cozzani, V. Natech (Natural Hazard Triggering Technological Disasters) Events Risk Management: An Operational Approach. In Proceedings of the SPE International Health, Safety, Environment and Sustainability Conference and Exhibition, Abu Dhabi, United Arab Emirates, 10–12 September 2024. [Google Scholar]
  77. Park, H.; Cruz, A.M. Insights on Chemical and Natech Risk Management in Japan and South Korea: A Review of Current Practices. Int. J. Disaster Risk Sci. 2022, 13, 359–371. [Google Scholar] [CrossRef]
  78. Simms, C.D. Canada’s Fort McMurray fire: Mitigating global risks. Lancet Glob. Health 2016, 4, e520. [Google Scholar] [CrossRef] [PubMed]
  79. Hung, M.-C.; Lin, C.-Y.; Hsiao, G.L.-K. Safe Firefighting Distances Using FDS and ALOHA for Oil Tank Fires. Fire 2024, 7, 445. [Google Scholar] [CrossRef]
  80. Ricci, F.; Scarponi, G.E.; Pastor, E.; Planas, E.; Cozzani, V. Safety distances for storage tanks to prevent fire damage in Wildland-Industrial Interface: A case study. Process Saf. Environ. Prot. 2021, 147, 693–702. [Google Scholar] [CrossRef]
  81. Doregar Zavareh, R.; Dana, T.; Roayaei, E.; Monavari, S.M.; Jozi, S.A. The Environmental Risk Assessment of Fire and Explosion in Storage Tanks of Petroleum Products. Sustainability 2022, 14, 10747. [Google Scholar] [CrossRef]
  82. Cawson, J.G.; Burton, J.E.; Pickering, B.J.; Marshall, E.; Elliot-Kerr, S.; Parkins, K.; Penman, T.D. Decision Science for Multi-Objective Fuel Management: Integrating Fire Risk Reduction and Biodiversity Conservation. Fire 2025, 8, 100. [Google Scholar] [CrossRef]
  83. Young, B.A.; Thompson, M.P.; Moran, C.J.; Seielstad, C.A. Modeling Neighborhoods as Fuel for Wildfire: A Review. Fire Technol. 2025, 61, 5049–5071. [Google Scholar] [CrossRef]
  84. Crocker, W. Thermal radiation hazards of liquid pool fires and tank fires. I. Chem. E. Symp. Ser. 1986, 97, 159–184. [Google Scholar]
  85. Lee, S.K.; Lim, J.Y. Important safety considerations for arrangement of flammable storage tanks. Process Saf. Prog. 2023, 42, 752–762. [Google Scholar] [CrossRef]
Figure 1. Conceptual schematic of wildfire-induced tank rupture and thermal radiation zones during BLEVE/fireball scenario, illustrating the sequence of (1) wildfire spread, (2) firebrand-induced ignition near fuel facilities, (3) tank rupture and explosion, and (4) subsequent fire spread to adjacent residential structures.
Fire 09 00150 g001
Figure 2. Spatial distribution of large wildfire events (≥100 ha) in South Korea from 2000 to 2025. Shaded areas represent administrative regions affected by large wildfires, with annotations indicating region names and corresponding burned areas (ha). A color gradient ranging from light pink to dark red is used to indicate the relative scale of wildfire impact, where darker shades correspond to larger burned areas and higher fire severity. The spatial pattern reveals a pronounced clustering of large wildfire events along the eastern and southeastern coastal regions, particularly in Gangwon-do and Gyeongsangbuk-do, whereas western and inland regions exhibit relatively lower frequency and intensity of large wildfire occurrences.
Fire 09 00150 g002
Figure 3. Annual burned area and number of ≥100 ha wildfire events in South Korea (2000~2025).
Fire 09 00150 g003
Figure 4. Spatial distribution of hazardous fuel facilities within large wildfire-affected districts in South Korea (2000–2025). The left panel presents gas (gasoline/diesel) stations in damaged areas, and the right panel presents LPG stations in damaged areas. Wildfire-affected districts are displayed using a red color gradient, with darker shades indicating larger burned area, whereas non-affected areas are shown in light gray. Facility locations are indicated by black dots for gas stations and green dots for LPG stations.
Fire 09 00150 g004
Figure 5. Thermal radiation threat zones by fuel type under BLEVE/fireball scenarios. Concentric rings denote the 10 kW/m2 (red), 5 kW/m2 (orange), and 2 kW/m2 (yellow) thresholds for LPG (propane), gasoline (n-octane), and diesel (n-dodecane).
Fire 09 00150 g005
Figure 6. A map-based representation of thermal radiation hazard zones under an LPG BLEVE scenario. The analysis indicates that the high-intensity thermal radiation zone extends into the adjacent residential area, demonstrating a significant potential risk to nearby populations in a wildfire-induced Natech scenario, showing that the outer thermal radiation zone may extend into the adjacent residential area.
Fire 09 00150 g006
Table 1. Summary of input parameters applied in the ALOHA simulation for the BLEVE/fireball scenario, including atmospheric conditions, leak characteristics, and surface environment settings.
DivisionInput Values
Atmospheric Stability Class (1)D
Leak Amount10,000 L
Leak Source HeightGround Source
Wind Speed3 m/s
Temperature25 °C
Measured Height10 m
Humidity50%
Ground RoughnessUrban or Forest
Cloud Cover (0~10) (2)5
(1) Atmospheric stability class: A (Very unstable), B (Unstable), C (Slightly unstable), D (Neutral), E (Slightly stable), F (Stable). (2) Cloud cover: 10 (Complete cover), 7·5 (Partly cloudy), 3 or 0 (Clear) tenths.
Table 2. Province-level summary of wildfires (≥100 ha) in South Korea, 2000–2025 (number of events, total burned area, and share of national total).
ProvinceNumber of ≥100 ha Wildfire EventsTotal Burned Area (ha)Share of National Total Burned Area (%)
Gyeongsangbuk-do14118,126.384.5%
Gangwon-do1610,903.47.8%
Gyeongsangnam-do65497.43.9%
Chungcheongnam-do32479.41.8%
Ulsan21317.40.9%
Jeollanam-do2665.00.5%
Daegu2606.60.4%
Jeollabuk-do2246.70.2%
Table 3. Gas stations and LPG filling stations located in wildfire-affected districts in South Korea, by province (2000–2025): total facilities and wildfire-exposed facilities.
ProvinceTotal Gas StationsGas Stations in Wildfire-Affected Districts, n (%)Total LPG StationsLPG Stations in Wildfire-Affected Districts, n (%)
Busan2520 (0.0%)630 (0.0%)
Chungcheongbuk-do3800 (0.0%)1200 (0.0%)
Chungcheongnam-do415115 (27.7%)17018 (10.6%)
Daegu22222 (9.9%)647 (10.9%)
Daejeon1580 (0.0%)470 (0.0%)
Gangwon-do338210 (62.1%)12871 (55.5%)
Gwangju1600 (0.0%)510 (0.0%)
Gyeonggi-do11380 (0.0%)4210 (0.0%)
Gyeongsangbuk-do538201 (37.4%)21842 (19.3%)
Gyeongsangnam-do54169 (12.8%)18919 (10.1%)
Incheon2190 (0.0%)660 (0.0%)
Jeju340 (0.0%)380 (0.0%)
Jeollabuk-do438112 (25.6%)13832 (23.2%)
Jeollanam-do38040 (10.5%)14924 (16.1%)
Sejong350 (0.0%)80 (0.0%)
Seoul3300 (0.0%)740 (0.0%)
Ulsan11836 (30.5%)3514 (40.0%)
Total5696805 (14.1%)1979227 (11.5%)
Table 4. Thermal radiation threat zone distances (m) for BLEVE/fireball scenarios by fuel type. Distances correspond to 10 kW/m2 (red; potentially lethal within 60 s), 5 kW/m2 (orange; second-degree burns within 60 s), and 2 kW/m2 (yellow; pain within 60 s) for LPG (propane), gasoline (n-octane), and diesel (n-dodecane); the mean across fuels is also reported.
DivisionThreat Zone of Thermal Radiation (m)
LPG
(PROPANE)
Gasoline
(N-OCTANE)
Diesel
(N-DODECANE)
Average
Red zone
(thermal radiation: 10 kW/m2)
228250254244
Orange zone
(thermal radiation: 5 kW/m2)
322353358344
Yellow zone
(thermal radiation: 2 kW/m2)
502550559537
Table 5. Thermal radiation threat zone distances (m) for pool fire scenarios by fuel type. Distances correspond to 10 kW/m2 (red; potentially lethal within 60 s), 5 kW/m2 (orange; second-degree burns within 60 s), and 2 kW/m2 (yellow; pain within 60 s) for gasoline (n-octane) and diesel (n-dodecane); the mean across fuels is also reported.
DivisionThreat Zone of Thermal Radiation (m)
Gasoline
(N-OCTANE)
Diesel
(N-DODECANE)
Average
Red zone
(thermal radiation: 10 kW/m2)
545555
Orange zone
(thermal radiation: 5 kW/m2)
787878
Yellow zone
(thermal radiation: 2 kW/m2)
122121122
Disclaimer/Publisher’s Note: The statements, opinions and data contained in all publications are solely those of the individual author(s) and contributor(s) and not of MDPI and/or the editor(s). MDPI and/or the editor(s) disclaim responsibility for any injury to people or property resulting from any ideas, methods, instructions or products referred to in the content.