Article

Synoptic and Regional Meteorological Drivers of a Wildfire in the Wildland–Urban Interface of Faro (Portugal)

by
Flavio Tiago Couto
1,2,*,
Cátia Campos
1,
Carolina Purificação
1,
Filippe Lemos Maia Santos
1,
Hugo Nunes Andrade
3,
Nuno Andrade
4,
André Becker Nunes
5,
Nuno Guiomar
6 and
Rui Salgado
1,2
1
Center for Sci-Tech Research in Earth System and Energy (CREATE), Universidade de Évora, Romão Ramalho Street, 59, 7000-671 Évora, Portugal
2
Departamento de Física, Escola de Ciências e Tecnologia (ECT), Universidade de Évora, Romão Ramalho Street, 59, 7000-671 Évora, Portugal
3
Programa de Pós Graduação em Oceanologia, Instituto de Oceanografia, Universidade Federal do Rio Grande (FURG), Avenida Itália, Km 8, Rio Grande 96203-900, RS, Brazil
4
Doctorate Program in Tourism, University of Extremadura, 06006 Badajoz, Spain
5
Faculdade de Meteorologia, Universidade Federal de Pelotas (UFPEL), Capão do Leão 96160-000, RS, Brazil
6
Mediterranean Institute for Agriculture, Environment and Development (MED) & Global Change and Sustainability (CHANGE), Universidade de Évora, Apartado 94, 7006-554 Évora, Portugal
*
Author to whom correspondence should be addressed.
Fire 2025, 8(9), 362; https://doi.org/10.3390/fire8090362
Submission received: 28 July 2025 / Revised: 3 September 2025 / Accepted: 10 September 2025 / Published: 11 September 2025
(This article belongs to the Special Issue Effects of Climate Change on Fire Danger)

Abstract

A major fire occurred in the wildland–urban interface in southern Portugal, on 13 July 2022, becoming uncontrolled due to weather conditions. This study investigates how atmospheric dynamics increased fire danger in Mainland Portugal during early July 2022. The synoptic circulation from European Centre for Medium-Range Weather Forecasts (ECMWF) analysis and mesoscale conditions from Meso-NH model simulation at 1.5 km resolution revealed atmospheric conditions before and during the fire. Fire risk was assessed using the Fire Weather Index (FWI) from Meso-NH outputs. A blocking pattern was configured by an upper-level low-pressure system in early July, remaining semi-stationary west of Mainland Portugal until 18 July. The counter-clockwise circulation of the cut-off low resulted in dry, warm air advection from North Africa, enhancing fire danger over the Iberian Peninsula. In southern Portugal, a jet-like wind with strong east/southeasterly flow from Gibraltar Strait favored rapid fire spread. This circulation below 1 km altitude from the Mediterranean Sea enhanced fire danger through strong winds, independent of the large-scale blocking pattern. This study presents an atmospheric scenario for evaluating fire danger in Southern Portugal, important for pre-firefighting management that complemented previous studies for the region. Also, high-resolution FWI calculations using Meso-NH emphasized the importance of improved temporal and spatial resolution for fire danger assessment.

1. Introduction

In Mediterranean and temperate biomes, protected areas are becoming increasingly susceptible and vulnerable to wildfire, which can damage ecosystems if they exceed their resilience threshold, endanger species and threaten people [1]. In 2022, several wildfires occurred throughout mainland Portugal, presenting some peculiarities. The cross-border wildfire that started in the Montesinho Natural Park burned an area of almost 2400 ha in Northern Portugal during the winter season [2]. In August 2022, a large wildfire spread in the Serra da Estrela Natural Park with a total burned area of at least 25,000 ha. This event was active for several days and its short-term damage and losses were provisionally estimated at ~€38M, without taking into account secondary damages arising from flooding and post-fire water contamination [3] and impacts in other economical activities, namely in the tourism sector [4].
Protected areas and their unique landscapes and biodiversity also contribute significantly to rural development in marginal areas by attracting nature-based tourism, creating jobs, and supporting local economies [5]. The stakeholders of the Vale do Guadiana Natural Park (PNVG), for example, recognize the impact of climate change in favoring wildfires, as the fact that biodiversity losses due to the fires directly affect the PNVG’s attractiveness [6]. However, wildfires also become significantly more complex where human activity is higher, particularly in wildland–urban interfaces (WUI) [7]. In these areas, high fuel loads coexist with residential and industrial buildings, and pose serious challenges to wildfire management, especially in guaranteeing people’s safety and infrastructure’s protection [8], as well as evacuation planning, e.g., [9,10,11]. The challenge is further intensified in areas with few safe escape routes, where evacuation options are limited and when warning times are short [12].
Therefore, increasing knowledge of wildfire spreads for specific regions is crucial to improving early warning systems for extreme events, and thus triggering pre-suppression activities and enhancing community preparedness. In this context, weather information can support fire danger forecasts, particularly relevant in complex WUI. Synoptic patterns are recognized in several regions as producing favorable conditions for large and extreme wildfires [13,14,15,16], in particular when acting as blocking systems and interacting with complex terrain. Little et al. [17] showed that persistent geopotential height positive anomalies at 500 hPa were associated with heatwaves and increased wildfire activity during a 20-year period. However, a large part of the blocking systems is related to stationary anticyclones near the surface, which favor fair weather, keeping temperatures high and relative humidity low for several days and sometimes characterizing heatwave conditions. This synoptic configuration was recently highlighted contributing to fuel drying and extensive wildfires over Eastern Siberia [14] and increasing fire danger in North China [18,19]. The high-pressure system dynamics, namely their positioning and slow displacement, have also influenced wildfires in extreme South of Brazil [20]. In the Saudi-African high-pressure system, it is known to favor wildfires in the western Alborz Mountains (Iran) [21]. These anticyclonic patterns can also be embedded within Omega-type blocking systems, such as reported during an uncommon extreme heat period in Northern France and Southern United Kingdom during September 2023 [22].
Furthermore, anticyclones over the western United States generate strong, dry, hot, and gusty winds that blow from inland desert regions toward the Pacific Ocean along the Southern California coast [23]. Known as the Santa Ana winds, these winds are channeled through the mountain landscapes [24,25,26], which intensifies their speed and raises their temperature, factors that contribute to creating highly favorable conditions for fast and catastrophic wildfires [27,28,29]. In Northern California, these intense downslope winds are referred to as Diablo winds [30] and have been associated with extreme fire behavior and highly destructive WUI wildfires [31,32,33]. Similarly, anticyclonic anomalies centered over the Southeastern Pacific Ocean can induce strong, hot, and dry downslope easterly winds known as Puelche winds in Southern Chile [34] and which are linked to peak fire days [35]. Tomašević et al. [36] highlighted the importance of antecedent climatic conditions and synoptic-scale patterns in shaping fuel loads and mesoscale dynamics that drive fire behavior. Kartsios et al. [37] emphasized the complex terrain’s influence in altering the mean airflow during two extreme wildfires that reached the WUI of two coastal urban settlements in the Attica Region (Greece), and which resulted in over 100 fatalities in July 2018. In many coastal areas, fire activity is driven by multiple interconnected factors: (a) fuel accumulation resulting from landscape-linked value chain dynamics, as well as from conservation policies that restrict land use intensity in areas of high ecological value; (b) extensive wildland–urban interfaces, which strain firefighting resources by dispersing them across large areas and compromise safety due to the low density of escape routes that can quickly become blocked in panic situations; and (c) high population densities during peak fire season, which increase the number of ignition events and the risk of fatalities.
The Algarve region in Southern Portugal is well known for presenting the key socio-ecological characteristics that can favor large and extreme wildfires occurrence [38,39,40], in particular a high amount of aboveground biomass and low live fuel moisture content during the summer [41]. Moreover, Purificação et al. [42,43,44] analyzed several wildfires case studies from recent decades, demonstrating how the interaction between atmospheric circulation and complex local topography played a critical role in modulating fire behavior and enhancing fire spread. These episodes, represented by convection-permitting simulations, demonstrated the fire weather conditions sensitivity to local topographic features. However, the unique dynamics of each wildfire event pose challenges to generalize fire behavior and conditions across specific regions.
This study is based on the premise that synoptic configuration information alone is insufficient to predict the fire evolution in Southern Portugal, and that in-depth knowledge of atmospheric conditions is crucial for identifying and accurately forecasting wildfire risk. Therefore, this case study aims to explore the main meteorological factors associated with a WUI wind-driven fire that occurred in Algarve’s lowlands. The following section details both the case study and the methodology. Section 3 presents the results, which are then discussed in Section 4. The main conclusions are outlined in Section 5.

2. Materials and Methods

2.1. Case Study

This study explores the wildfire that occurred in Algarve’s lowlands (southernmost part of Mainland Portugal), which started at 2230 UTC on 12 July 2022, in the western area of the Ria Formosa Natural Park. The most active fire spread period occurred on the afternoon of 13 July, with fire spreading westward across the golf courses and luxury villas in Quinta do Lago. The total burned area was 742.06 hectares and the fire scar illustrated in Figure 1 reveals that although fire started in the Natural Park perimeter, namely in the Gambelas area, it spread over vegetation in the WUI toward Almancil and Quarteira (Loulé municipality), and consumed shrubland, traversed a golf course, and reached accommodation units in Quinta do Lago. The wildfire also destroyed the support house of the São Lourenço Golf Club and consumed a farm in Ferrarias, leading to the evacuation of animals from the property. The extensive damage to the properties highlights the economic impact that wildfires can have on local communities.

2.2. Large-Scale Meteorological Fields

The large-scale atmospheric circulation and air physical properties were assessed from the operational archive of the European Centre for Medium-Range Weather Forecasts (ECMWF), using the Meteorological Archival and Retrieval System (MARS), at a horizontal resolution of 0.125 × 0.125 degrees at 0000 UTC, 0600 UTC, 1200 UTC, and 1800 UTC [45].
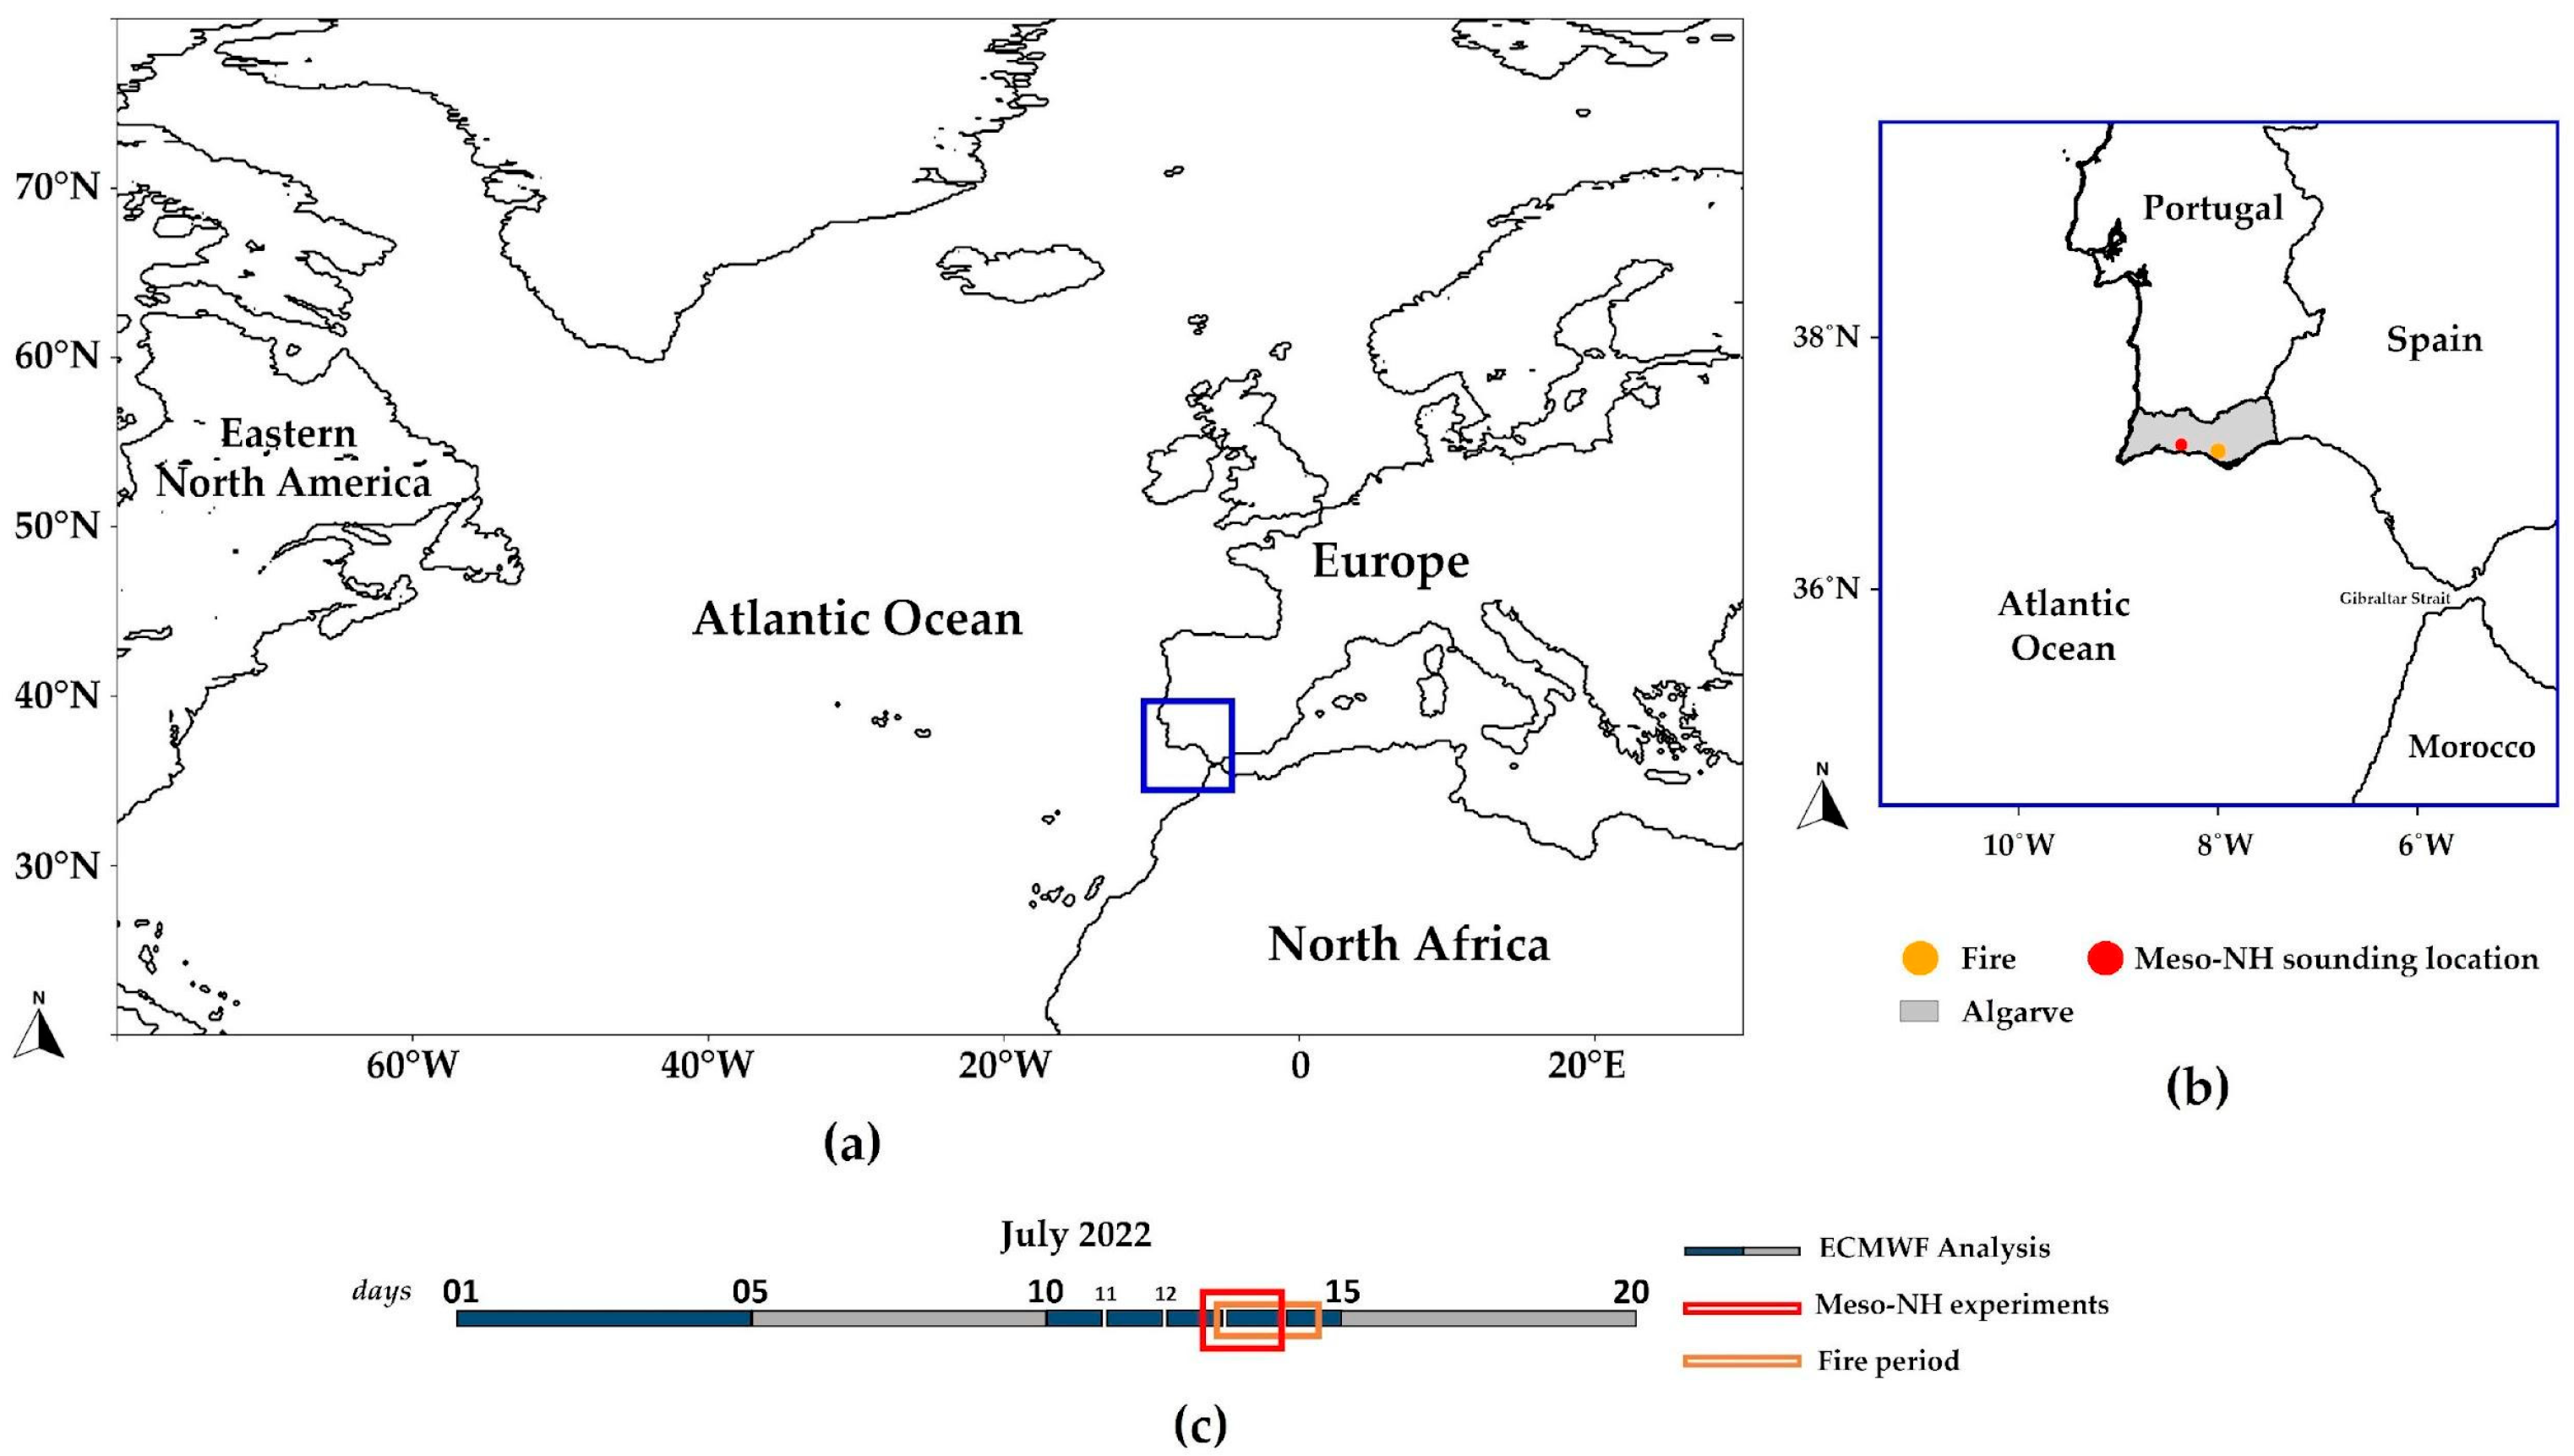
The large domain displayed in Figure 2a covers Eastern Canada, the United States, the North Atlantic Ocean, North Africa, and Europe, and it is used to explore large-scale atmospheric dynamics. The following meteorological fields were considered for the traditional synoptic levels (850 hPa, 500 hPa and 250 hPa): air temperature and relative humidity at lower levels; wind (speed and direction); potential vorticity; and ozone mass mixing ratio at upper levels, for the period from 1 to 20 July. The goal of the analysis is to explain the main synoptic configurations before, during, and after the wildfire in the Faro region.

2.3. Mesoscale Atmospheric Environment

The Meso-NH atmospheric model [46] was used to explore the mesoscale circulation over the study region. The Meso-NH is a non-hydrostatic limited-area model of the French research community, allowing the representation of the dynamical motions and physical processes that occur in the Earth’s atmosphere. The model was configured with a single domain of 1500 m resolution and 400 × 400 grid points, covering Southern Portugal and Southwest Spain, including the Gibraltar Strait (Figure 2b). The vertical grid is designed with 60 sigma levels, not equally spaced, stretching gradually from 20 m, near the bottom, to 600 m, near the top, with the top close to 19 km altitude. The experiment began at 1800 UTC on 12 July and ended at 0000 UTC on 14 July, encompassing the fire ignition and the most critical period of fire spread (Figure 2c). Such a configuration was chosen aiming to represent on a regional scale the atmospheric conditions during the wildfire and in a resolution better than the ECMWF analysis, while still maintaining low computation costs.
In our study, the model physical configurations were similar to those successfully used by Couto et al. [2] and do not consider the fire effects. For instance, at such a horizontal resolution, the model explicitly resolves deep convection and the shallow convection is parameterized using the Eddy Diffusivity Kain-Fritsch (EDKF) scheme [47]. The cloud microphysics was parameterized according to the ICE3 scheme [48], which considers five types of hydrometeors (cloud droplets, raindrops, graupel, snow, and ice crystals). The radiation parameterization was based on the Rapid Radiative Transfer Model [49], and the turbulence was parameterized using a 1.5 order closure 1D scheme [50]. The externalized surface model SURFEX [51] allows surface fluxes to be calculated based on different schemes, depending on the surface type (e.g., nature, urban, ocean, lake). The digital elevation model used on MESO-NH was obtained from the Shuttle Radar Topography Mission (SRTM) database [52]. Here, two numerical experiments were performed, namely EXP1 considering all aspects mentioned above, and a second experiment (EXP2) that was run without orography (i.e., elevation equal to zero for the entire domain), aiming to verify the role played for the regional topography in the atmospheric circulation in this specific event.
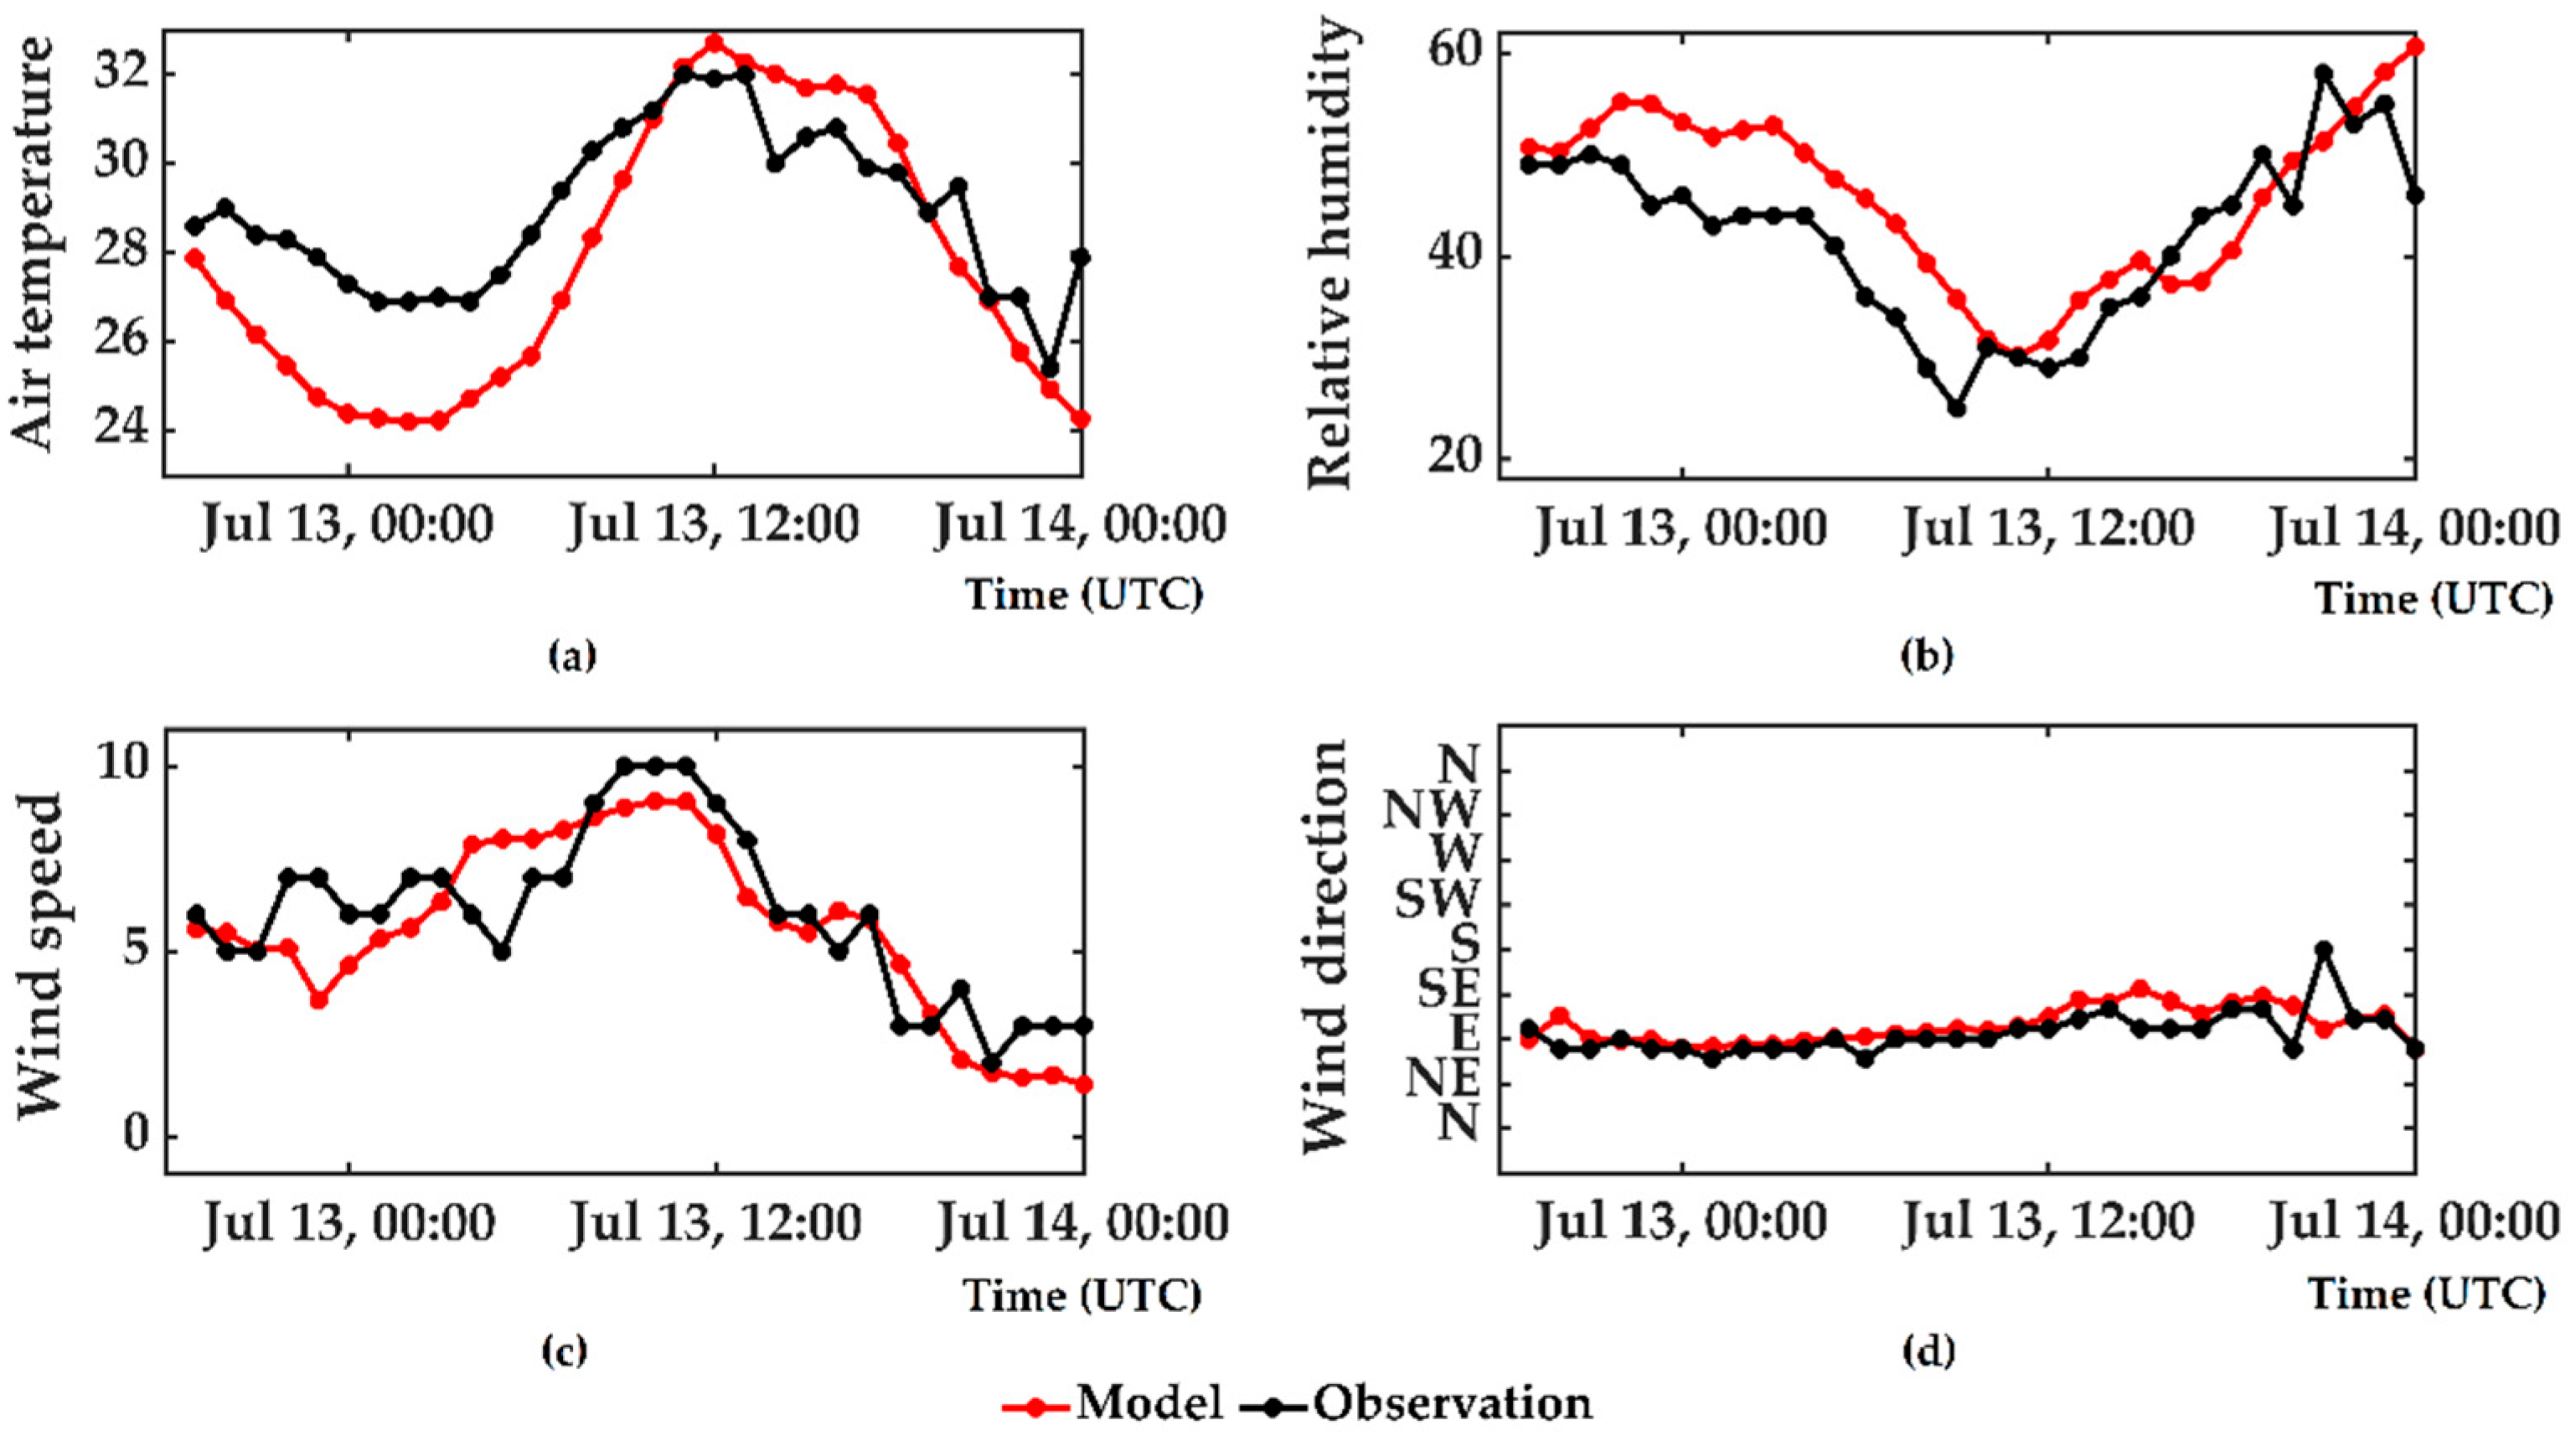
A model verification is found in Appendix A and was made by comparing the simulation of meteorological variables (wind intensity and direction at 10 m, air temperature and relative humidity at 2 m) with observation at the meteorological station closest to the event. The observation data at the meteorological station of Faro was obtained from the OGIMET platform available online and from the SYNOP code [53]. Figure A1 shows the comparison between air temperature, relative humidity and wind (speed and direction). The model underestimates the air temperature between 1900 UTC of 12 July and 0900 UTC on 13 July 2022 (Figure A1a) and consequently overestimates the relative humidity on the same period (Figure A1b). These differences can be partly explained by the fact that we are comparing 1.5 km resolution model data with local values observed at a land station located very close to the coastline. During the afternoon of 13 July 2022, the model effectively captures the air temperature evolution well, as well as the relative humidity evolution in Faro station. Regarding wind speed, Figure A1c shows that the model reproduced wind intensity variations reasonably well overall, despite some under- or overestimation of the values in the morning of 13 July 2022. The wind direction was well captured by the simulation during the entire verification period (Figure A1d).
The Meso-NH output was also used to compute the Fire Weather Index (FWI) [54] for the Algarve region. This index comprises five sub-indices that quantify the effects of fuel moisture and wind on fire behavior [54,55]. For this case study, air temperature and relative humidity at 2 m, as well as wind speed at 10 m from the model, were used. Precipitation during the 24 h prior to the simulation was assumed to be zero in the initial conditions.
The sub-indices related to fuel moisture content include the Fine Fuel Moisture Code (FFMC), the Duff Moisture Code (DMC), and the Drought Code (DC) [54,55]. The FFMC was calculated using meteorological variables derived from the model, while DMC and DC were held standard, based on values reported by the Portuguese Institute for Sea and Atmosphere, I. P. (IPMA) [56]. The Buildup Index (BUI), representing the total amount of fuel available for combustion, was then calculated from the DMC and DC. The Initial Spread Index (ISI), indicating the potential rate of fire spread, was computed by combining the FFMC with the model-derived wind speed. Finally, the Fire Weather Index (FWI) was calculated, providing an assessment of fire danger conditions across the study area.
The FWI calculated from the Meso-NH outputs was also compared with the daily FWI obtained from the ERA5 with 0.25 degree of resolution [57].

2.4. Back-Trajectories

In this study, the Hybrid Single-Particle Lagrangian Integrated Trajectory model (HYSPLIT), developed by NOAA’s Air Resources Laboratory [58], was employed. The backward trajectories calculations were performed online [59]. Data were retrieved for three different locations, altitudes, and time points throughout the study period. The model uses the Global Data Assimilation System (GDAS) with a 1-degree latitude-longitude resolution. The backward trajectories were used to assess the origin of the air parcels and their dynamics during the study period. Initially, the origin of air parcels in the fire region and during the event was considered, followed by an instant during the blocking stage and the dissipation stage. These data helped to understand and validate the atmospheric dynamics during the period, supporting the large-scale and mesoscale analyses.

3. Results

3.1. Large-Scale Circulation

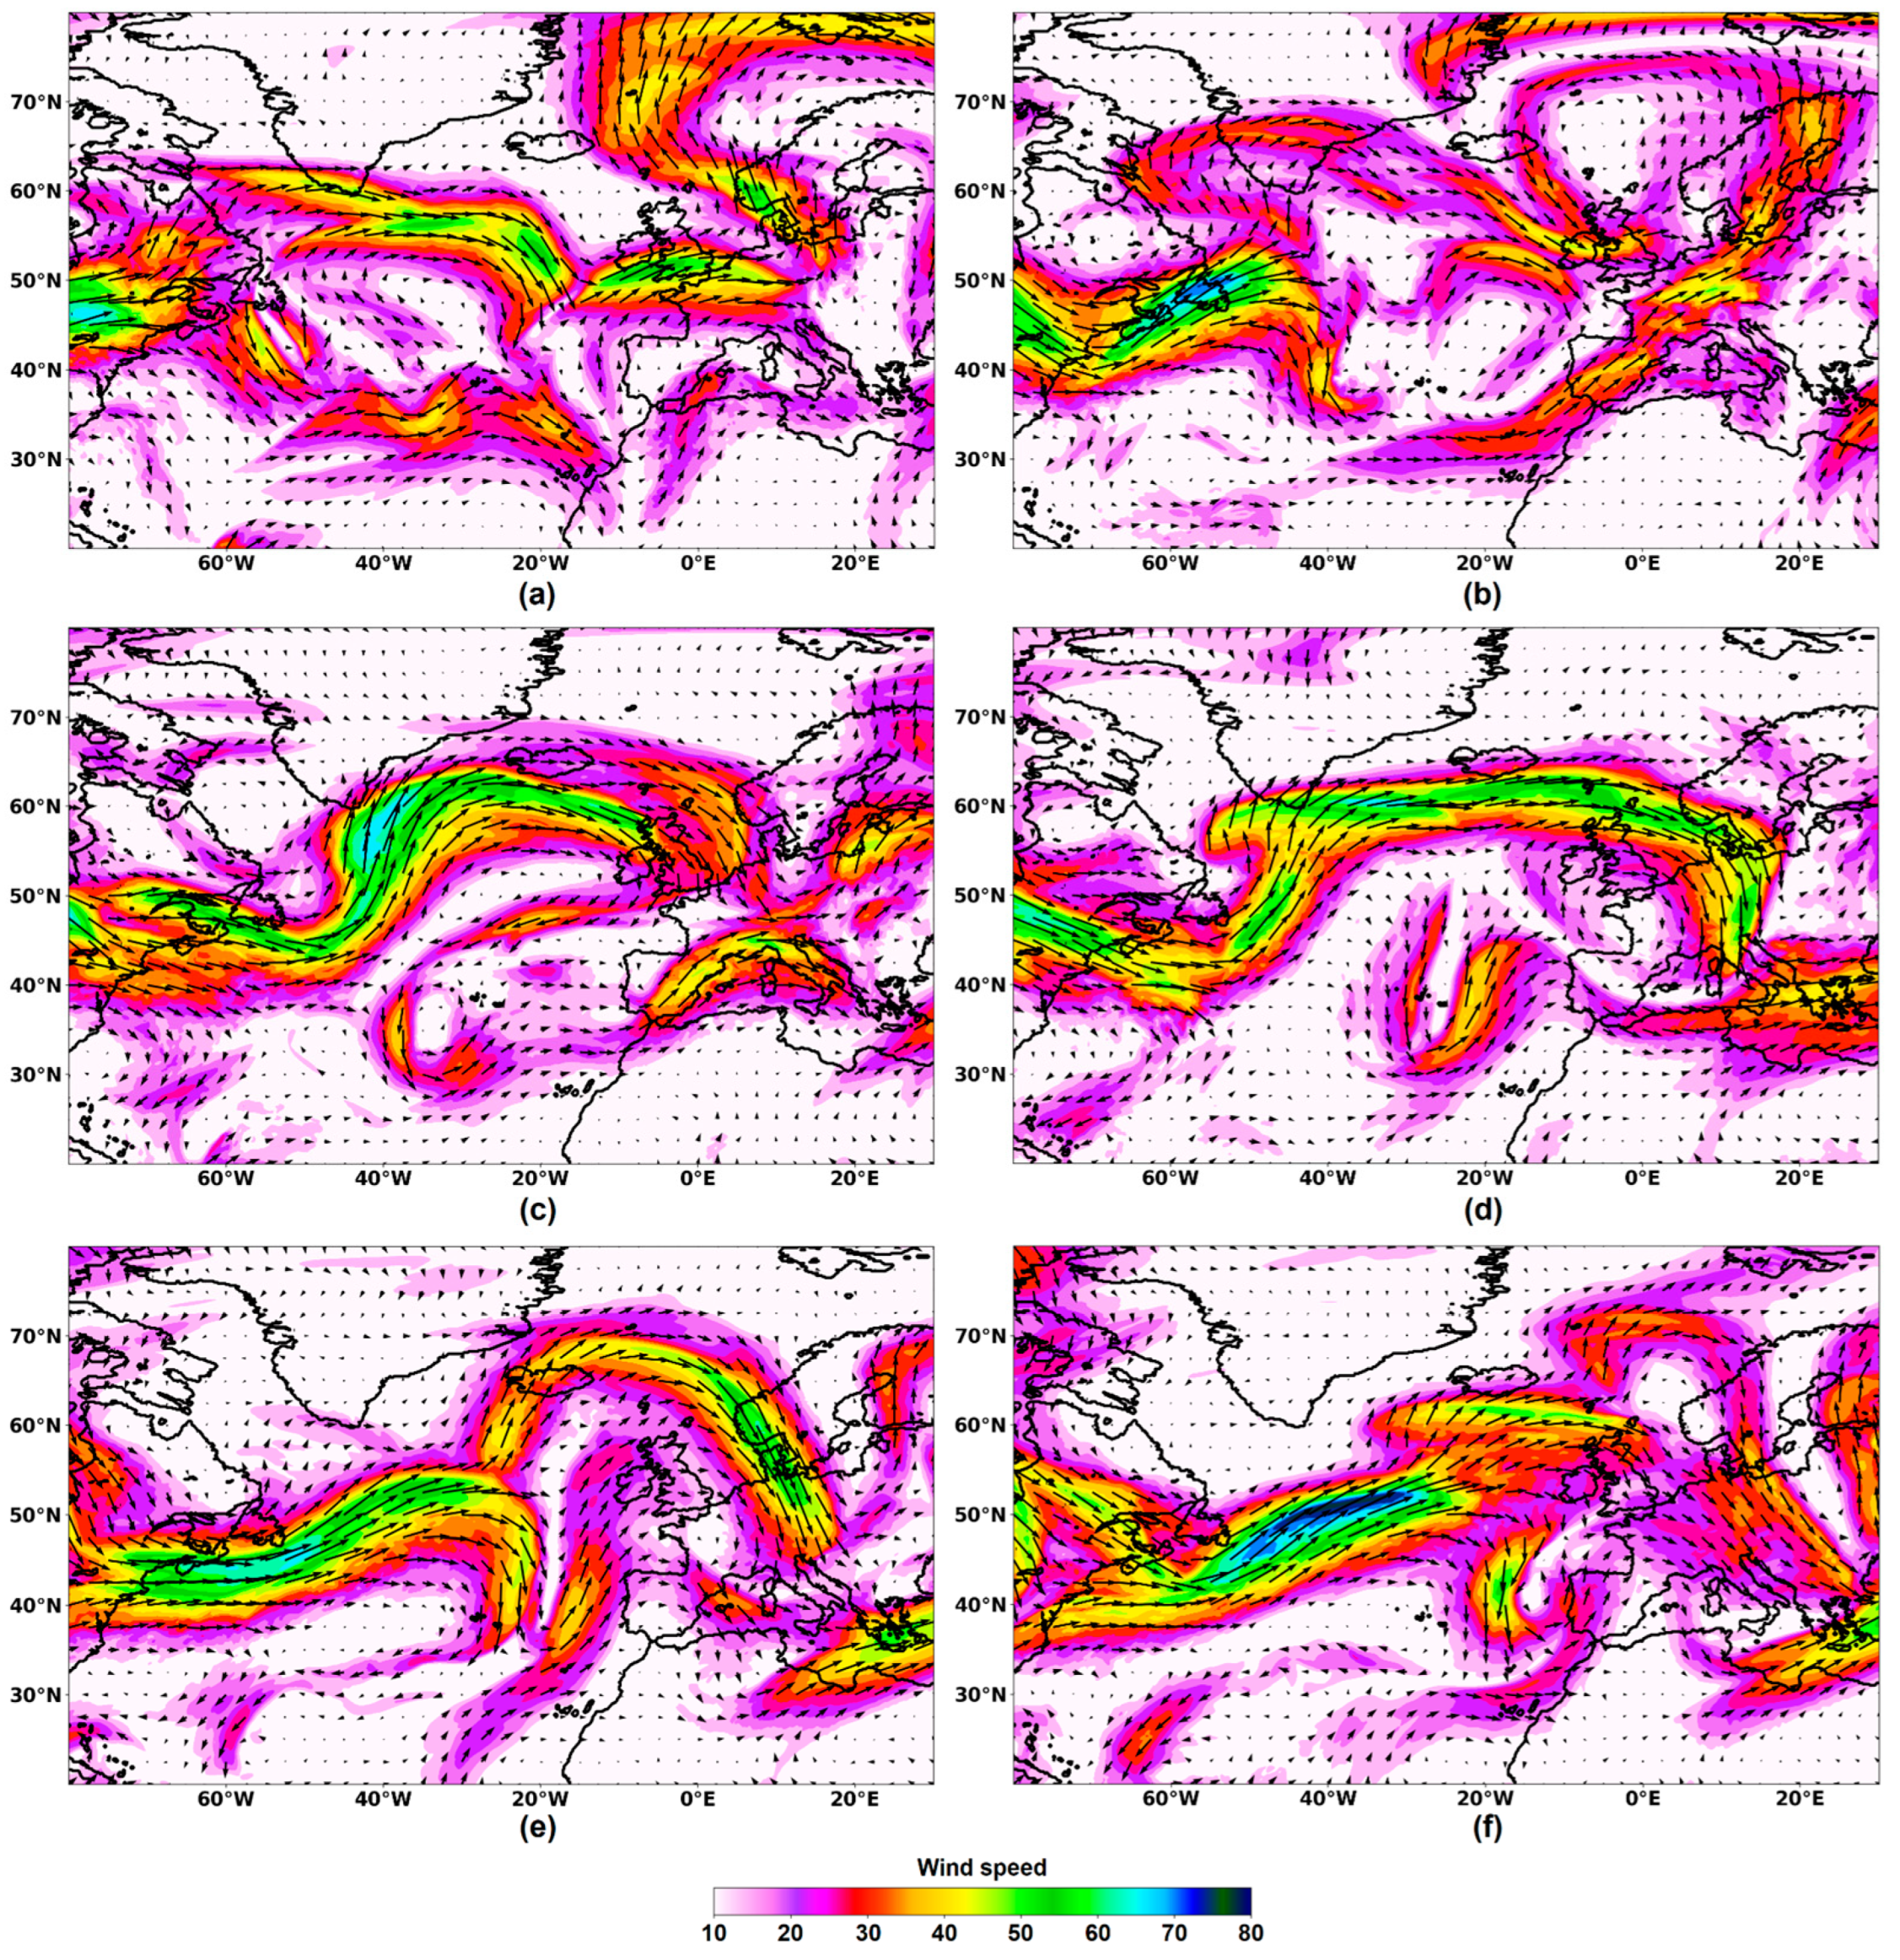
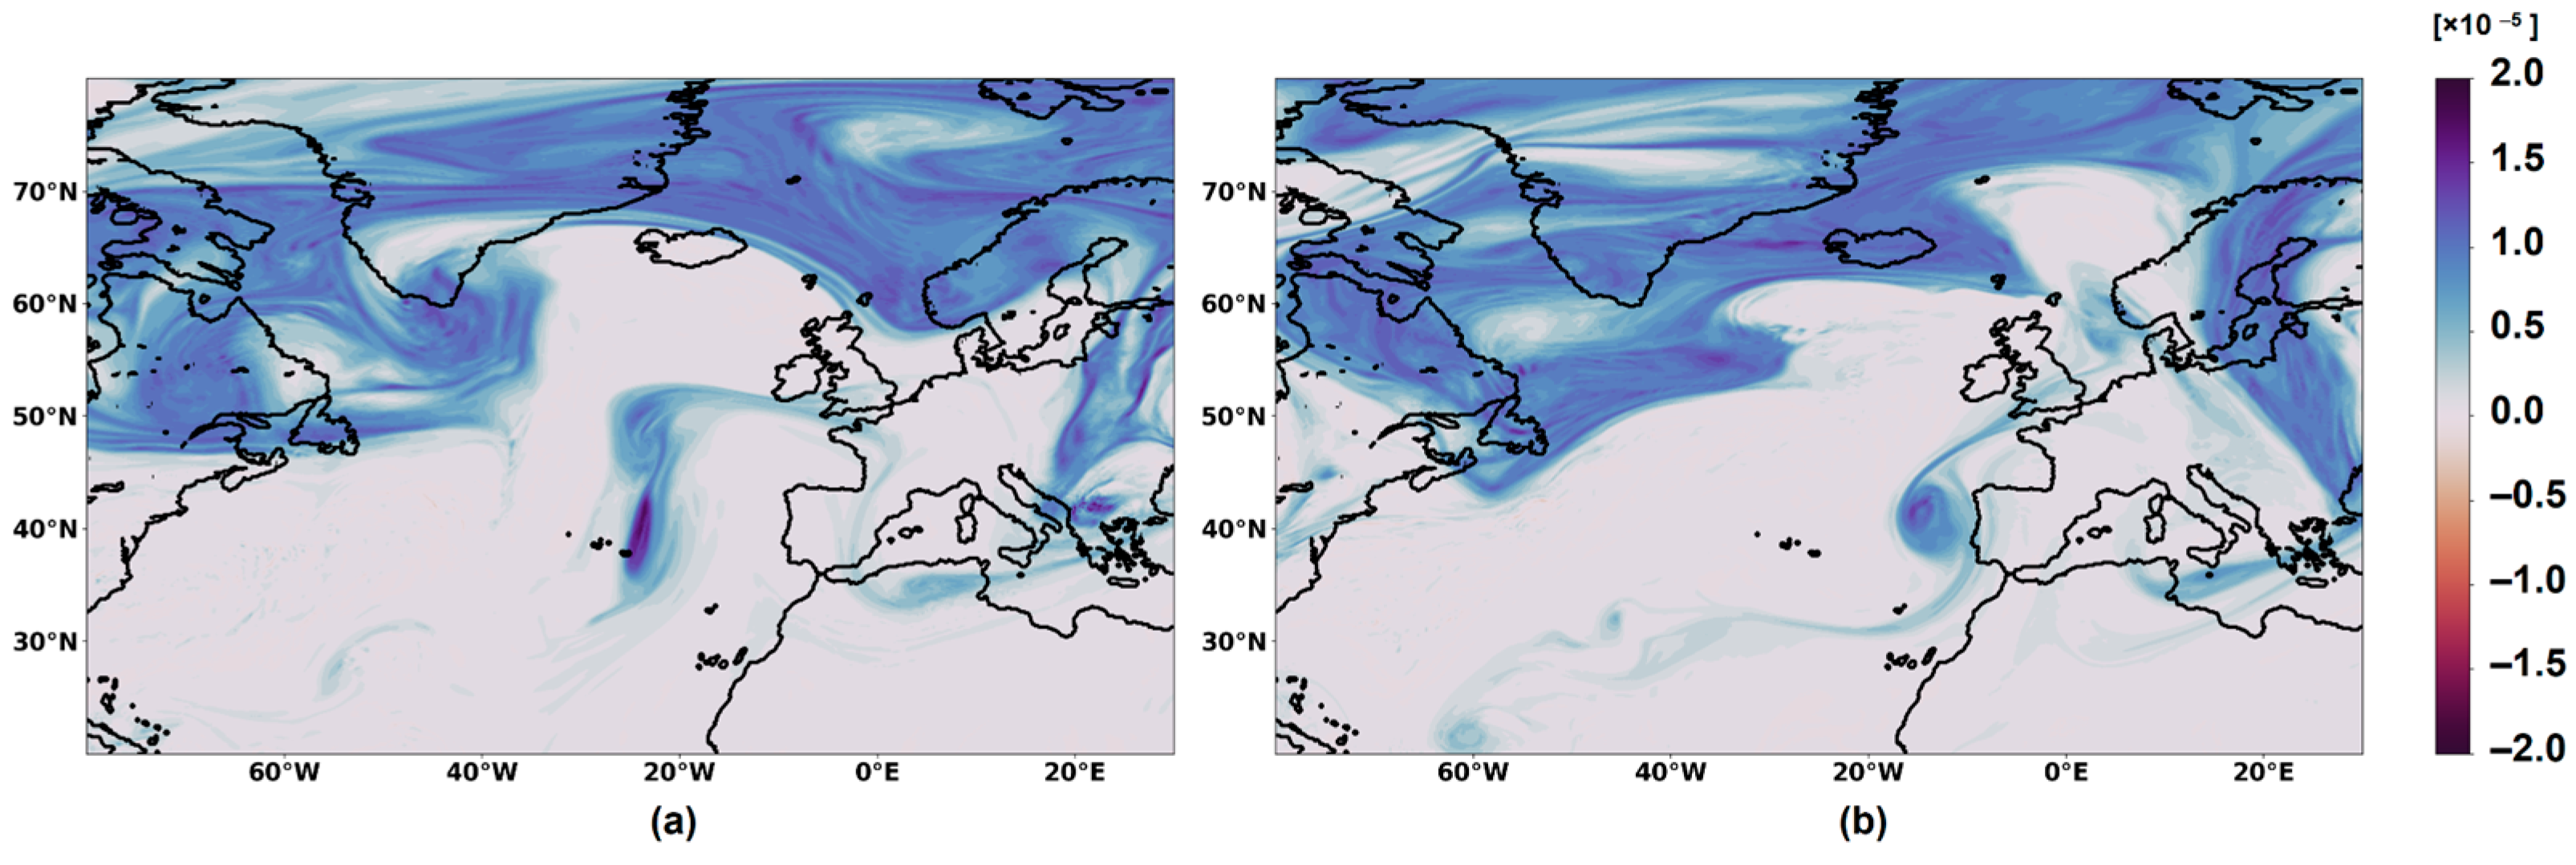
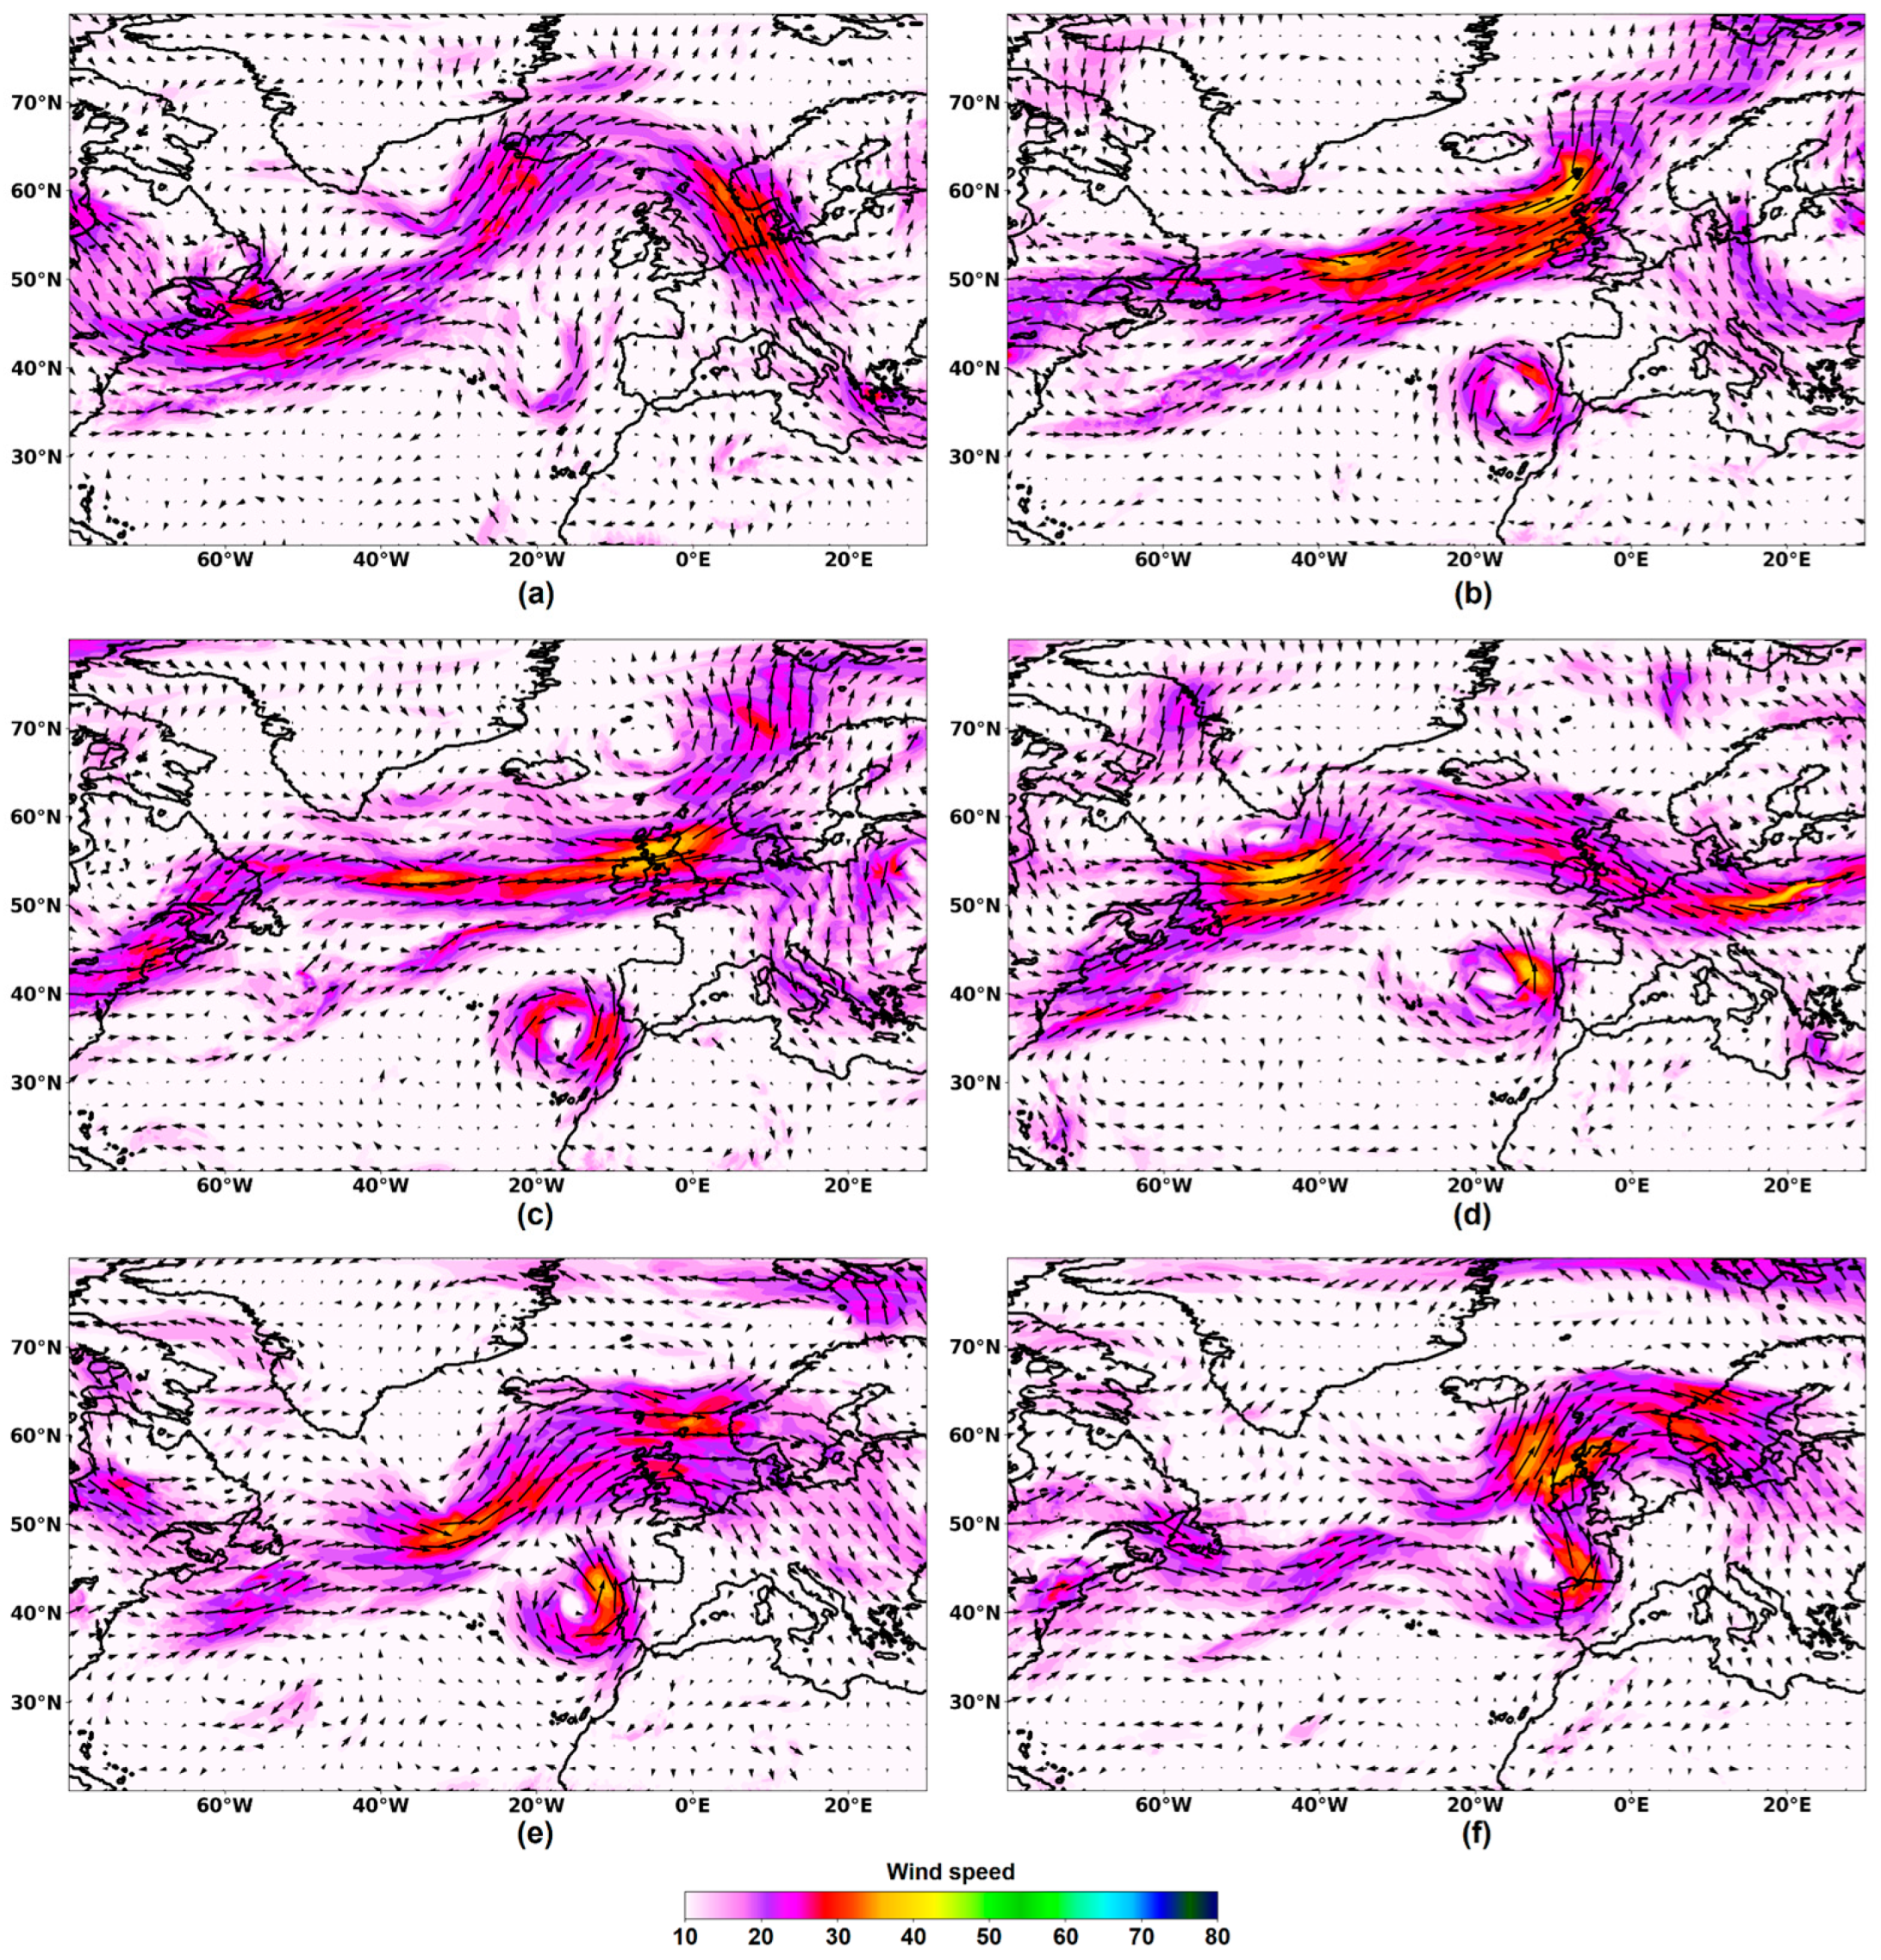
In the upper troposphere, jet stream dynamics conditioned the development of trough-like regions over the North Atlantic Ocean at the beginning of the period on 2 July (Figure 3a). The jet stream is located between 50° N and 60° N, with a high-altitude trough negatively tilted at 55° W and 42° N, and an NNW/SSE oriented axis, as well as a smaller ondulation in a segment of the jet stream with N/S oriented axis over the North Atlantic Ocean in 30° N and 37° W. Figure 3b shows a small ondulation at 40° W and 38° N that intensified in the following days. Figure 3c,d show that this region was not directly influenced by the jet stream dynamics, which appears to be moving northward over the Western Atlantic Ocean, directed to Iceland and reaching central Europe in an almost clockwise circulation. On 8 July (Figure 3d), a well-defined trough was identified in the Azores region, which was amplified on 10 July as a jet stream approached from the west (Figure 3e). These regions are associated with positive vorticity, mainly in the more amplified trough around 25° W/40° N on 9 July 2022, at 0000 UTC (Figure 4a). Figure 3f indicates that this circulation continues to deepen in the following hours, with an almost closed cyclonic circulation at 0000 UTC on 11 July, still presenting a core of positive vorticity (Figure 4b).
Figure 5a shows a positive potential vorticity core westward of Portugal at 0000 UTC on 12 July, as well as an upper air cyclonic vortex already configuring a closed circulation at 0000 UTC on 12 July (Figure 5b). The system is characterized by a cut-off low with a closed circulation and detached from the main jet stream directed northward of the United Kingdom (Figure 5b). The counter-clockwise circulation presents higher ozone values at 250 hPa and a cold core at 500 hPa, as shown in Figure 5c and Figure 5d, respectively. The presence of ozone concentration and potential vorticity within the system serves as a stratospheric air tracer indicator in the upper troposphere.
The evolution of the wind field at 500 hPa is displayed if Figure 6. The U-like circulation pattern found eastward of the Azores archipelago (Figure 6a) follows the trough configuration identified at 250 hPa (see Figure 3e analysis). This region is displaced eastward during the period until it has a closed, counter-clockwise circulation centered west of Portugal on 12 July (Figure 6b). The figure clearly shows that the cut-off low is not directly influenced by the jet stream that remains northward. From this moment on, we consider the system to have entered the blocking stage.
Figure 6c shows the upper air cyclonic vortex still centered at 35° N/18° W on 13 July, which was found in a semi-stationary condition westward of the Iberian Peninsula. The cut-off low system centered slightly to the north on 15 July and 18 July but remained at almost the same longitude (Figure 6d and Figure 6e, respectively). The blocking stage period finished on 18 July, when the upper air cyclonic vortex started moving northeastward toward the Biscay Gulf, as seen on 19 July (Figure 6f).
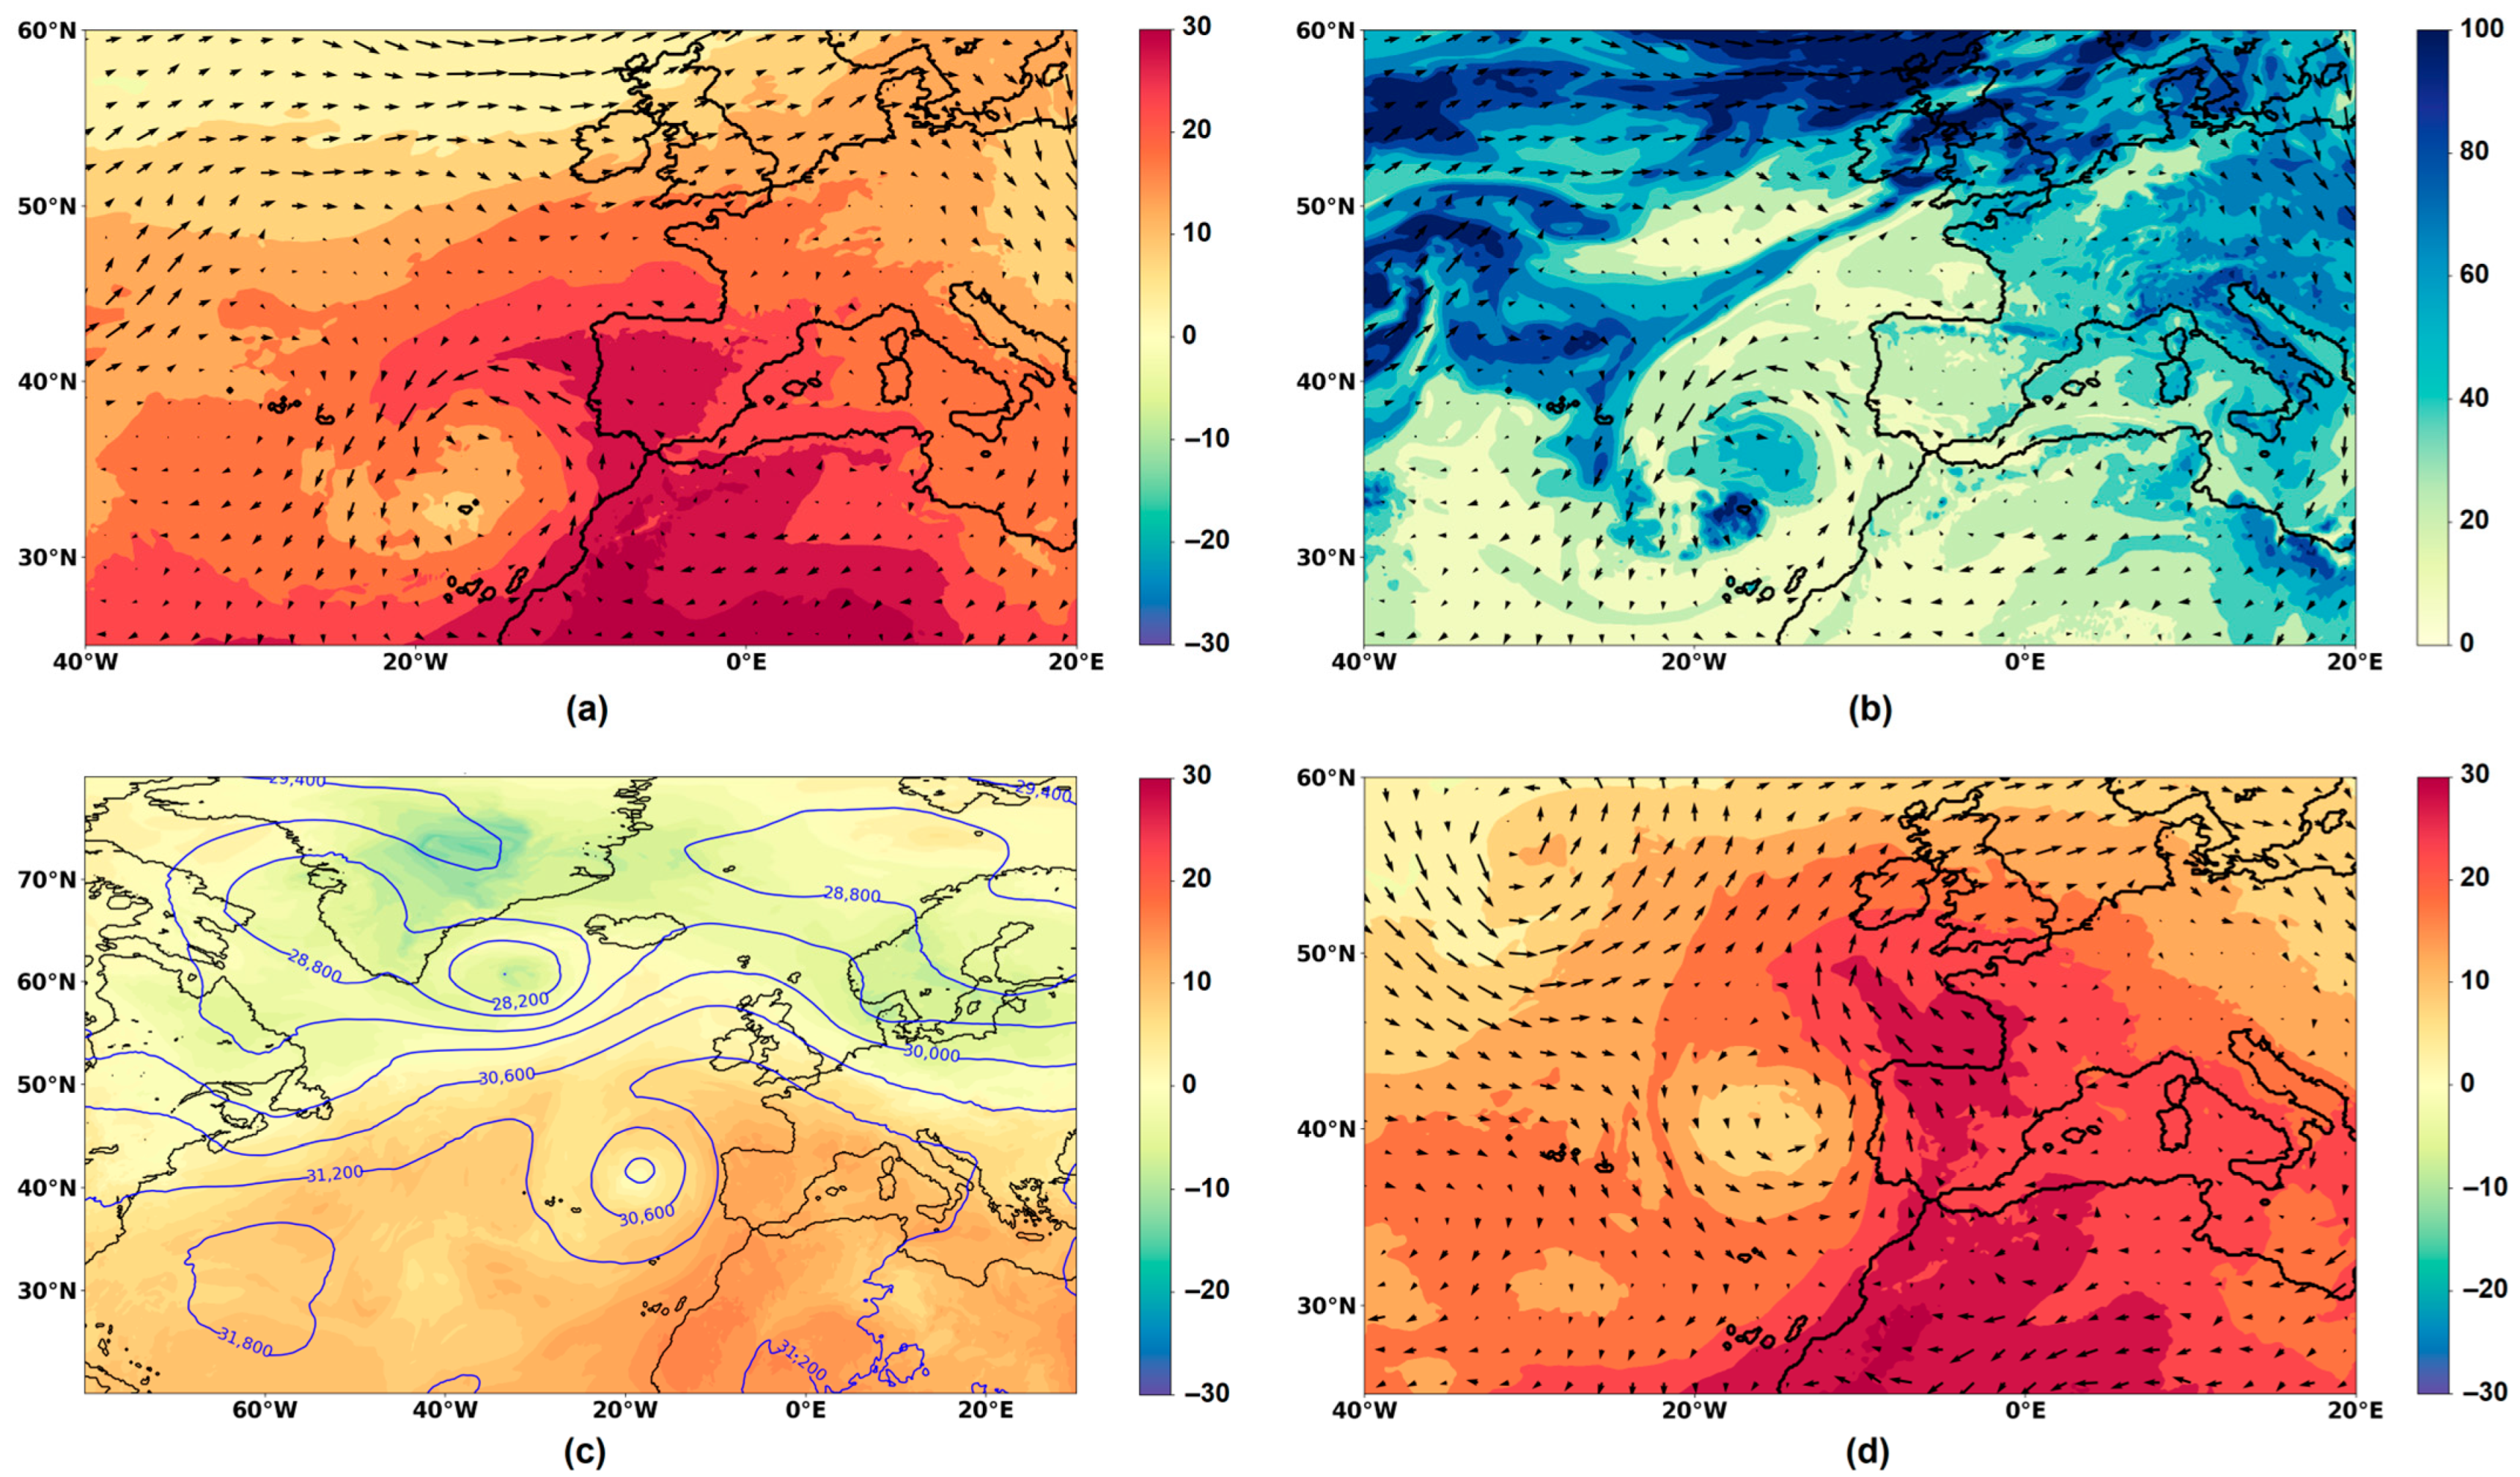
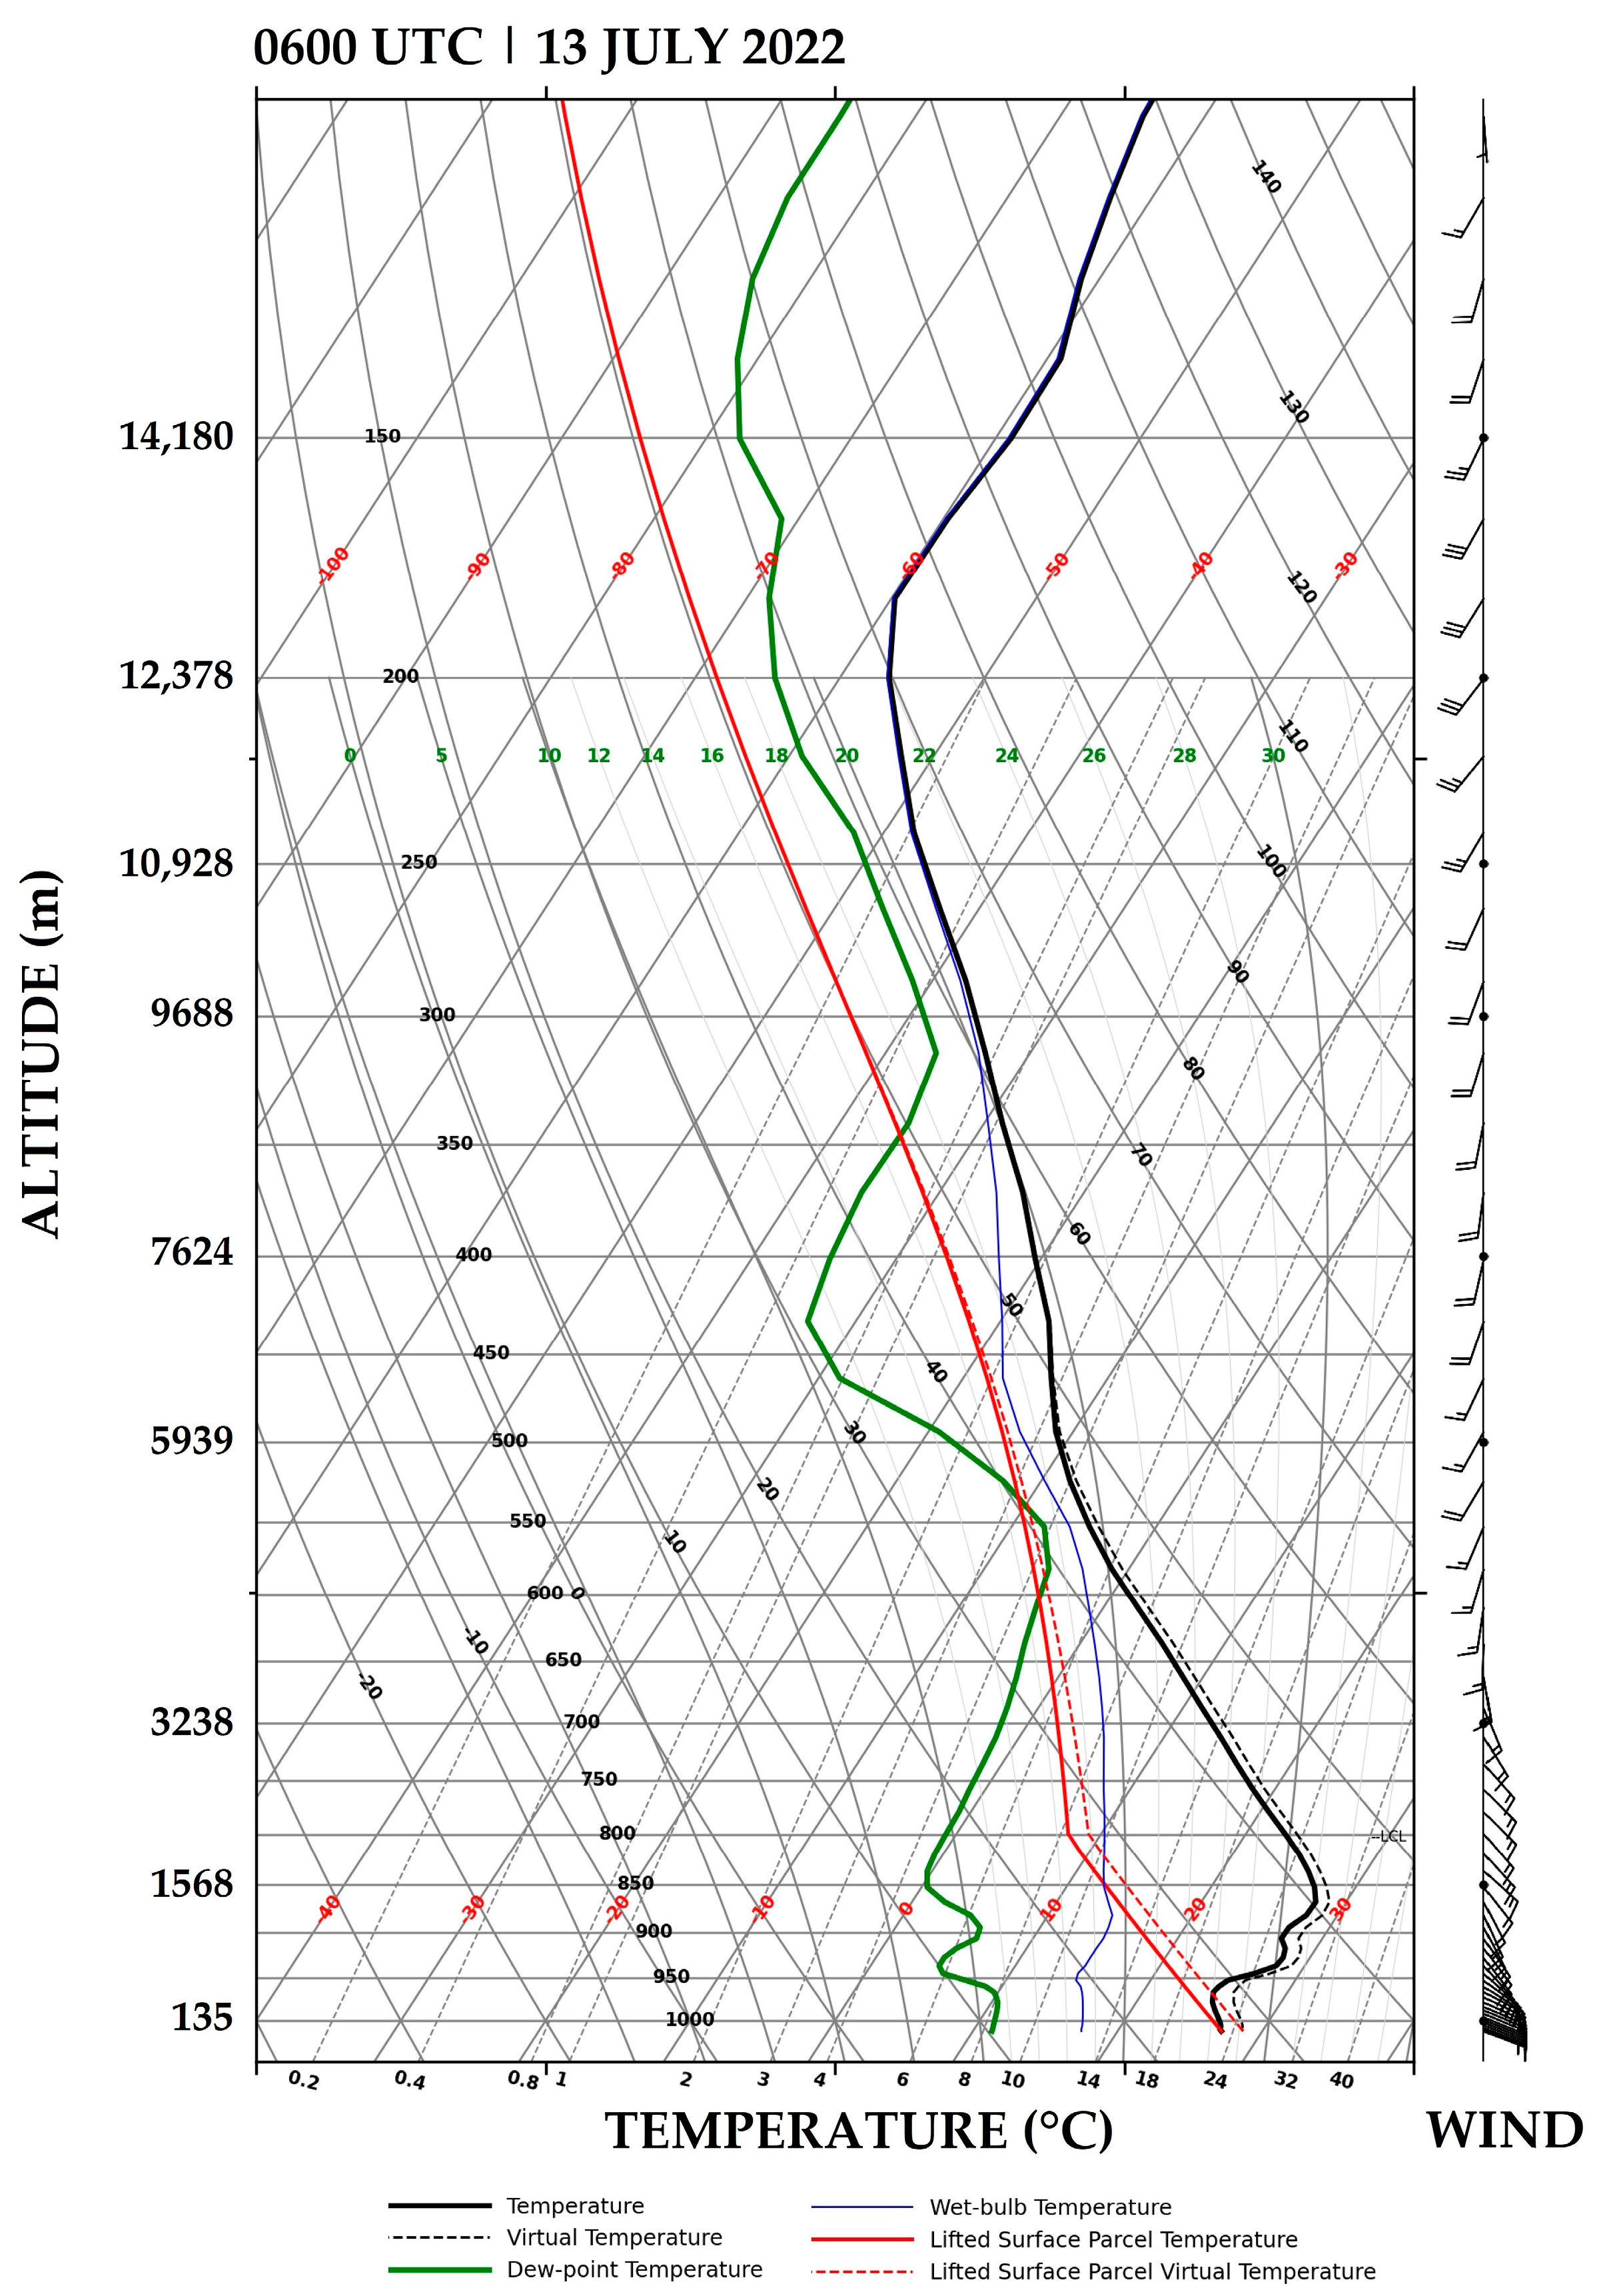
The stationary low system favored the warm air mass advection from North Africa toward the Iberian Peninsula. Figure 7a shows air temperatures between 25 °C and 30 °C at 850 hPa on 12 July 2022 at 1800 UTC. This air mass is also dry with relative humidity below 20% at the 850 hPa level (Figure 7b). This warm and dry air advection is confirmed by the temperature (T) and dew point temperature (Td) vertical profiles, as well as the high temperatures of almost 30 °C at 1500 m above ground level (a.g.l) displayed on the Skew-T/log-P diagram obtained from the EXP1 simulation on 13 July (Figure 8). This environment persisted during the period when the warm air mass extends northward in a ridge pattern toward the Biscay Gulf, as observed at 700 hPa on 16 July (Figure 7c) and at 850 hPa on 18 July (Figure 7d). The atmospheric circulation affecting Portugal during this period, associated with this blocking system, is able to increase the fire danger condition at the surface; however, it is insufficient to explain fire behavior, since it rapidly spread westward.

3.2. Mesoscale Circulation

The first experiment described in Section 2 (EXP1) was used to explore the regional circulation. The high temperatures (around 35 °C) and low relative humidity (below 30%) near the surface (Figure 9a and Figure 9b, respectively) mark the fire weather conditions in Southern Portugal on 13 July, a typical summer condition for the region. However, the wind field at levels below 1 km shows intense southeast/east winds affecting the region throughout the day. At the 500 m a.g.l., for example, strong winds from the Strait of Gibraltar region directly affect the Algarve region in the afternoon (Figure 9c). The vertical wind profile shown on the right side of the thermodynamic diagram (Figure 8) confirms wind shear, which is east/southeast near the surface, and shifts direction with altitude, following the large-scale circulation described in the previous section. This jet-like wind below 1 km was also associated with strong wind gusts at 10 m, with intensities of the order of 20 m·s−1 (Figure 9d). During the afternoon, the intensification of the wind in the mountainous regions of the Algarve was also due to the combined effects of the sea and valley breezes.
To assess the role of the Algarve’s mountains and the Strait of Gibraltar’s topography in establishing the strong winds that affected the Algarve during the fire event, a second numerical experiment with no orography was carried out. Figure 10a,b shows the wind gust classes, highlighting the hachured wind intensities between 10 and 15 m·s−1 (lines) and above 15 m·s−1 (stars). The results indicate a decrease in wind intensity when the orographic effect is removed from the simulation. This impact is more expressive over the Algarve, where strong winds were not simulated (Figure 10b). The difference between the simulations is shown in Figure 10c, with the reddest regions located over the mountainous regions. The results indicate that orography plays an important role in wind intensification near the surface.

3.3. Backward Trajectories

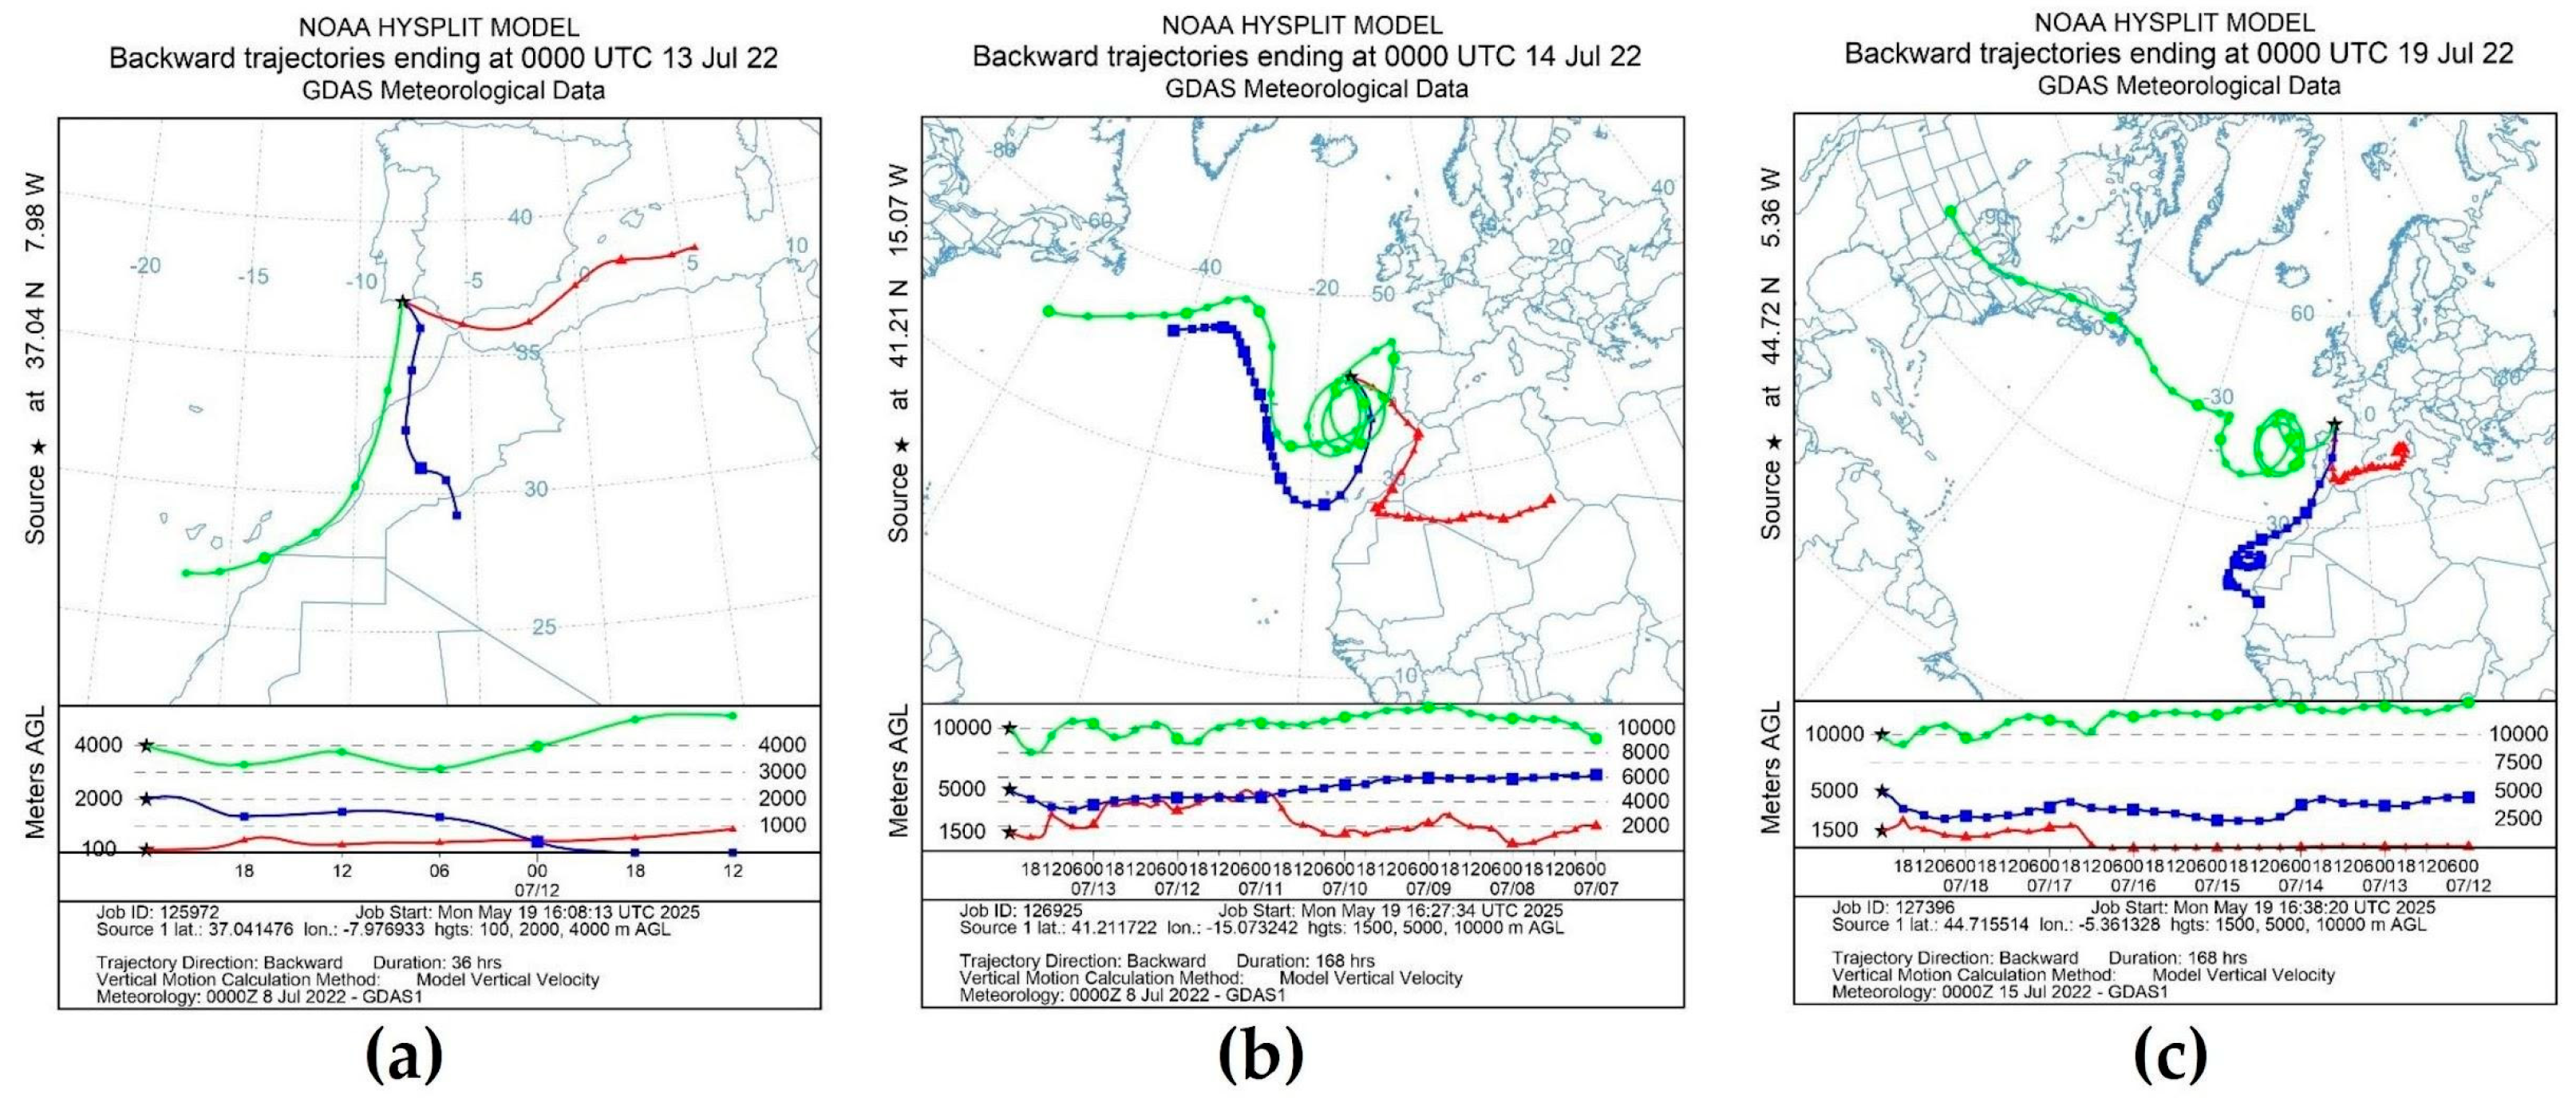
To understand the dynamics of the event, backward trajectories were computed for three different moments and regions along the study period. Figure 11a shows that on 13 July, when the fire was active in the Western Ria Formosa Natural Park, the airflow affecting Southern Portugal came from the Mediterranean Sea at 100 m a.g.l., whereas a southerly flow was found in the middle and upper levels. The latter agrees with the large-scale circulation configuration previously described, i.e., the presence of a cyclonic vortex centered westward of the Iberian Peninsula, favoring the southerly flow over the Western Iberian Peninsula. However, the airflow near the surface indicates the presence of a secondary circulation embedded within the main large-scale circulation.
Figure 11b displays the backward trajectory on 14 July, showing three primary air parcels’ trajectories related to this circulation pattern. The upper level (green line) is marked by the transport of air parcels from the West of the North Atlantic Ocean that enter a circular trajectory West of the Iberian Peninsula on 9 July. The same aspect is observed at mid-levels (blue line), with the air parcels being transported from the North Atlantic Ocean and higher latitudes days before. However, at lower levels (850 hPa, red line), the figure shows that the system contributed to the transport of air parcels from North Africa that flowed over the Sahara Desert during 7–9 July. This result suggests the transport of dusty air over the Portuguese coast into the system.
At the end of the period, the backward trajectories that reach the Biscay Gulf on 19 July clearly show the stationary condition of the meteorological circulation westward of the Iberian Peninsula at upper levels (Figure 11c). The same figure shows that air parcels that were transported from the United States in the upper levels (green line) over the North Atlantic for 3 days were retained in a circular motion for several days before reaching the Biscay Gulf on 19 July. At that moment, the air parcels at middle levels (blue line) are still from the south, whereas at low levels (red lines) there is still an influence of air masses from the Mediterranean Sea.
The backward trajectories, combined with ECMWF analyses, provided insight into the dynamics of the event, both regarding the circulation influencing the fire region and the development and persistence of the blocking system. On the day of the wildfire, the trajectories confirmed the presence of airflows from different directions affecting the region and at different altitudes. This is consistent with the vertical wind profile (Figure 8) and the wind pattern shown in Figure 6c, which showed that the wildfire area was influenced by southwesterly winds aloft and east to southeasterly winds near the surface (Figure 9d and Figure A1d). In the upper troposphere (10,000 m; Figure 11b,c), the trajectories revealed the eastward transport of air parcels that remained embedded in a counterclockwise circulation for several days, consistent with the establishment of the upper-level cut-off low shown in Figure 5 and Figure 6. Additionally, the lower-troposphere trajectories (Figure 11b) indicate the transport of Saharan dust into the blocking system, consistent with the cyclonic circulation at 850 hPa (Figure 7a).

3.4. Fire Weather Index

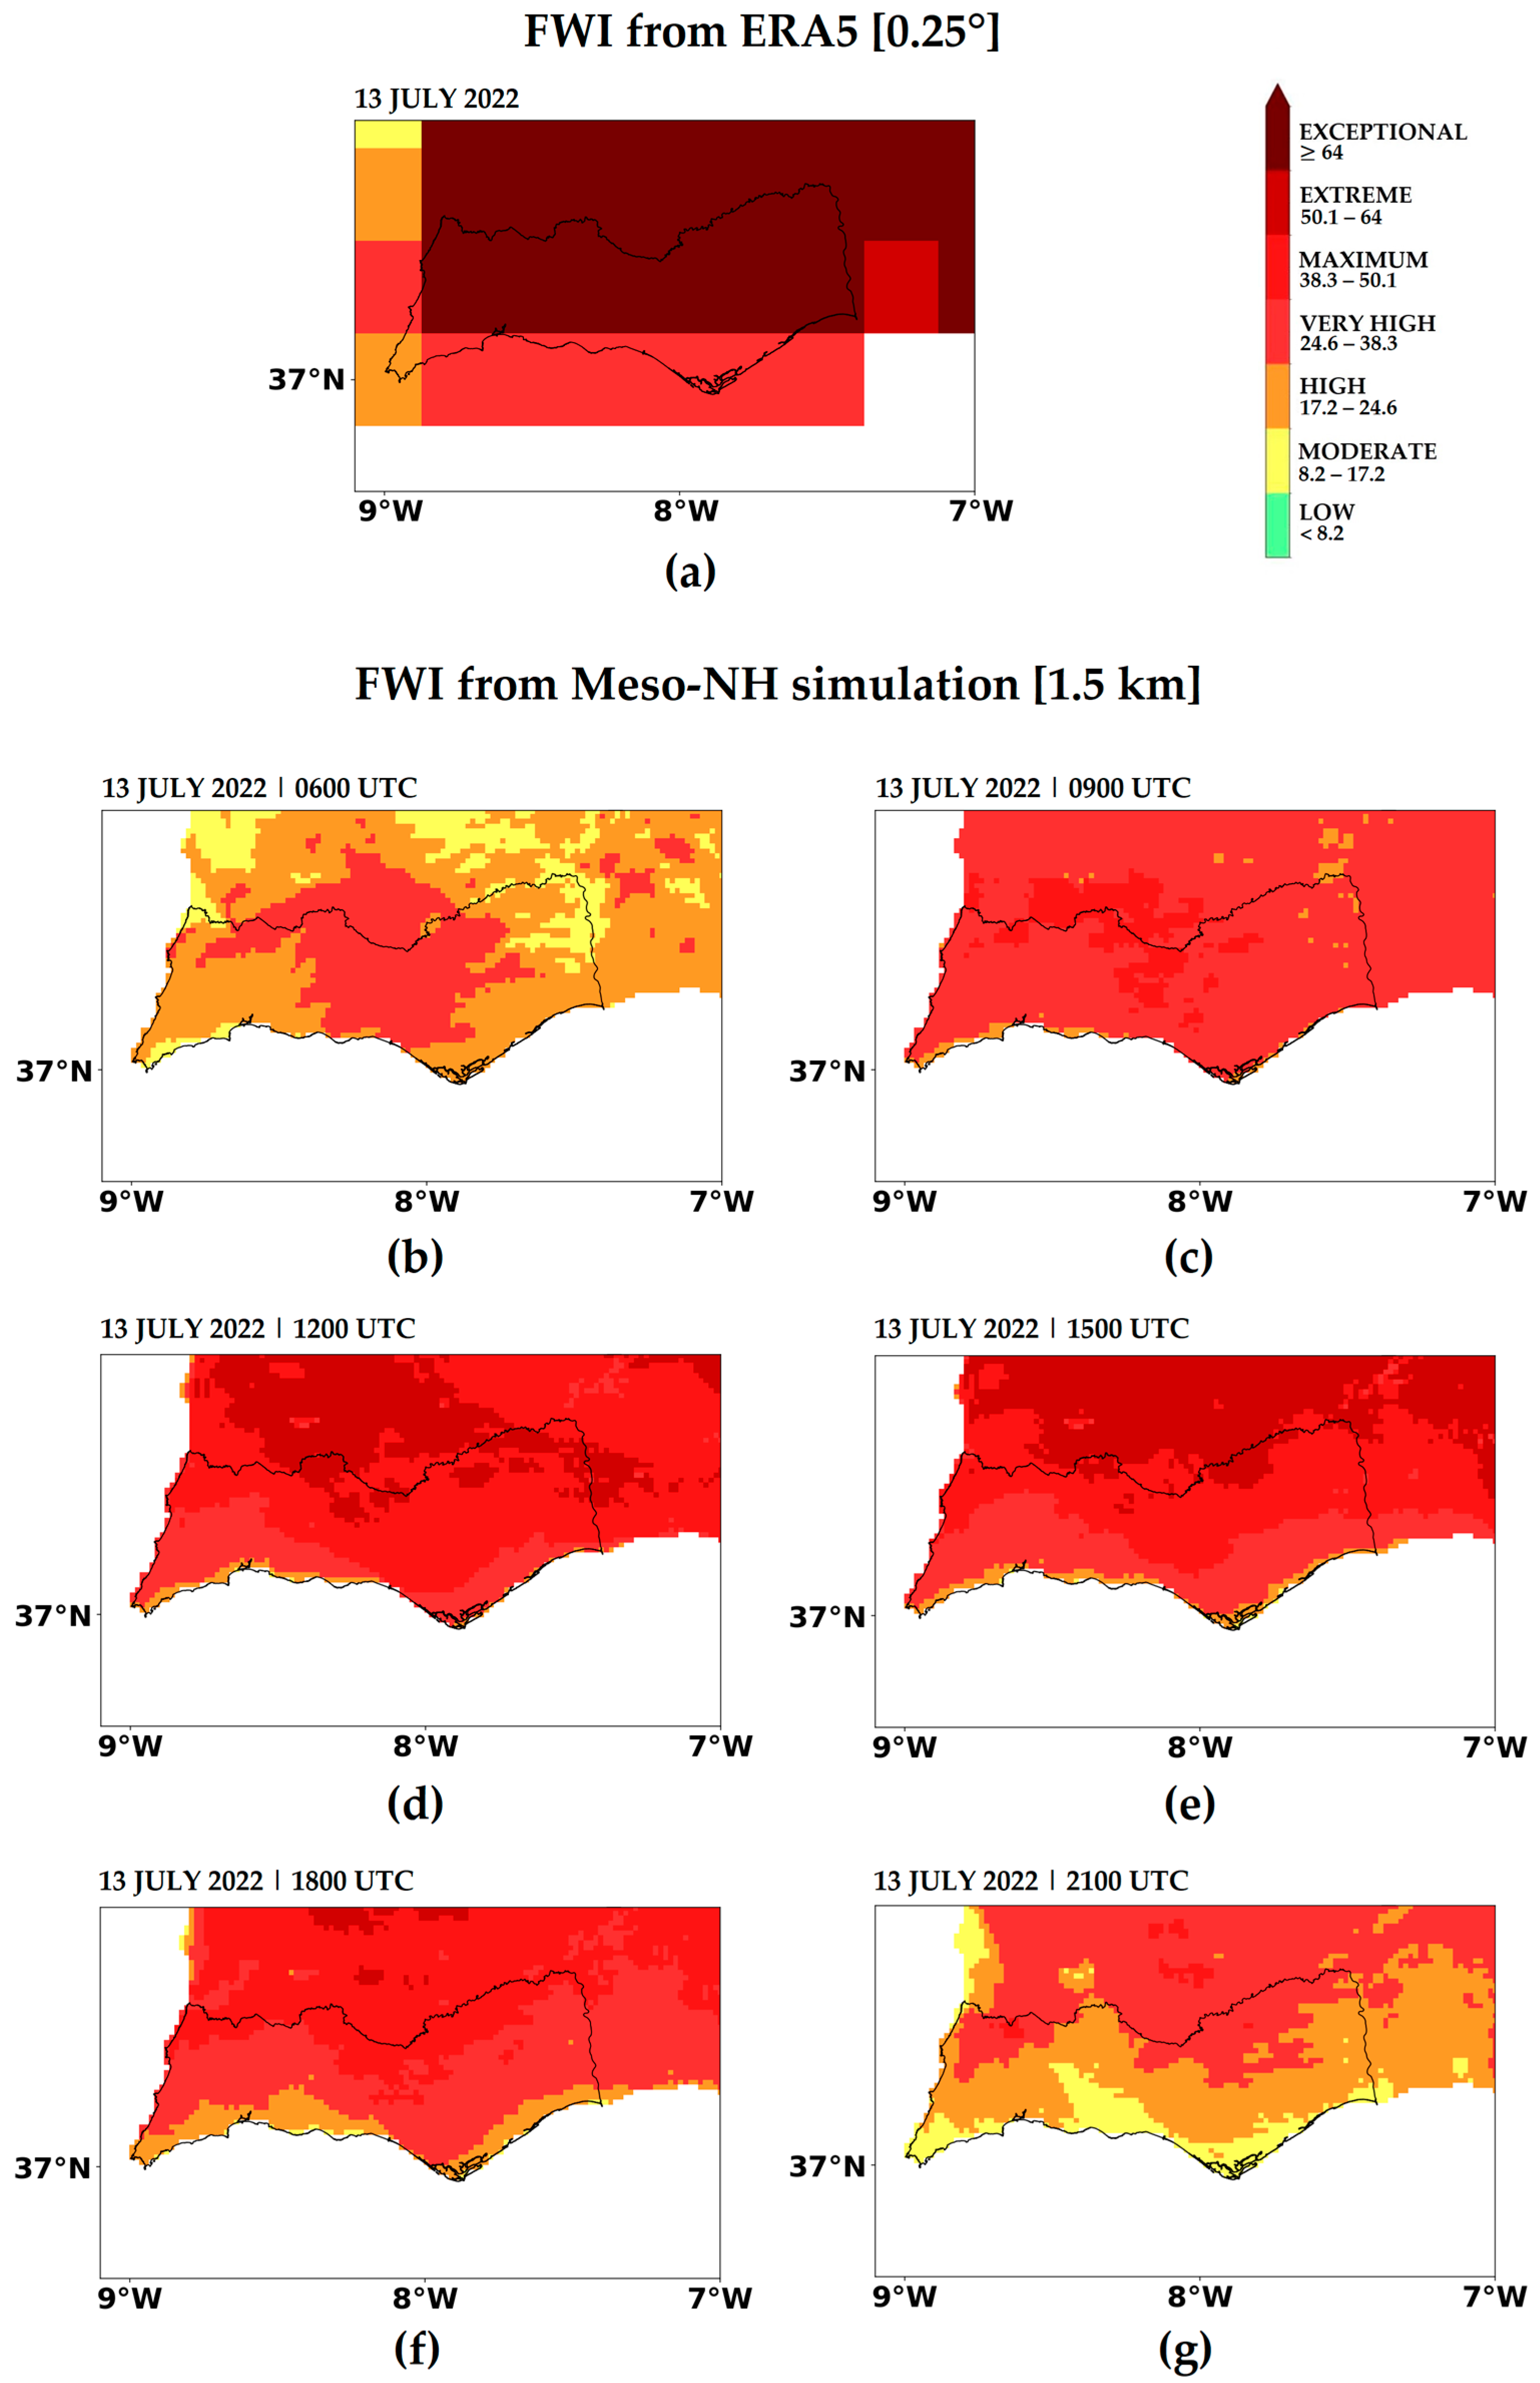
Figure 12 displays the FWI from the ERA5 and calculated from the Meso-NH outputs. Figure 12a shows exceptional fire risk for almost the entire region, except on the coast where values are lower. However, the coarse resolution of ERA5 does not allow for the identification of specific regions, as well as the fire risk in a subdaily scale.
The results considering the Meso-NH outputs show that fire-weather in the Algarve varies spatially and temporally on a regional scale. For instance, the high-resolution simulation highlights the horizontal gradient in the region, which enhances fire danger toward more inland regions. Moreover, FWI varied throughout the day, rising as the temperature increased and relative humidity decreased during the daytime, and as wind speed increased, as illustrated at 0600 UTC (Figure 12b). At this time (Figure 12b), higher FWI values were found in areas experiencing stronger winds encompassing the low and highlands of Central Algarve. Figure 12c–f show maximum and extreme FWI values in the afternoon northward and decreasing in the evening to high and moderate values (Figure 12g). In the wildfire region, FWI was from high in the early morning to very high in the afternoon, followed by a moderate danger in the evening. The ERA5 dataset provides daily FWI values calculated at 1200 UTC (Figure 12a), whereas the Meso-NH outputs allow for results with higher temporal and spatial resolution (Figure 12b–g).

4. Discussion

This case study addresses the topic of fire-weather, in particular synoptic patterns that contributed to increased fire danger in Southern Portugal. In a meteorological context, the fire that occurred in a WUI was an example that synoptic configuration can not be sufficient to explain fire behavior, which rapidly spread westwards from the ignition, in opposition to the predominant southerly flow observed at 850 hPa and above.
Several studies draw attention to the persistence of anticyclones near the surface creating conditions conducive to wildfire spread. In Portugal, the role of anticyclones’ positioning in creating favorable fire weather conditions is recognized from several studies [2,44,60,61,62,63], in particular when local conditions can lead to an intensification of the fair weather conditions, as verified during three large forest fires on Madeira Island [64]. Unlike these previous studies, this study draws attention to an upper-level low-pressure system that configured a blocking pattern.
In the synoptic context, the development of an upper-level trough and its eastward displacement led to a low-pressure system in the middle and upper levels of the troposphere. In its blocking stage, the system developed in July 2022 remained quasi-stationary, close to the Portuguese coast, characterized by a counterclockwise circulation that extended throughout the troposphere. This characteristic favored the advection of a warm and dry air mass from North Africa to the Iberian Peninsula at lower levels, namely at 850 hPa. This blocking pattern was associated with heatwave conditions and the hottest days of that year. According to the IPMA, the study period was marked by the persistence of extremely high maximum temperatures, particularly on 13 July [56]. Besides the warm air advection from North Africa towards the Iberian Peninsula, the positioning of the system also transported dusty air parcels from the Sahara Desert, assessed by backward trajectory calculation of air parcels within the cyclonic circulation. This case study also provides further evidence of the role played by cut-off lows contributing to dust outbreaks in the Western Iberian Peninsula after dust is mobilized in the Sahara Desert. The cut-off lows are already known to favor dust transport out of the Sahara Desert also in other seasons, such as autumn [22], winter [65] and spring [66,67].
Regarding mesoscale aspects, it is worth noting the circulation below 1 km altitude, characterized by strong winds that significantly contributed to the rapid spread of the fire fronts. The prevailing wind direction was from the east, in agreement with the model results. A circulation pattern originating over the Mediterranean Sea was identified and confirmed through backward trajectory analysis calculated for the fire region. The orographic effect responsible for accelerating the flow in the mountainous terrain surrounding the Strait of Gibraltar was also verified through a simulation excluding topography. Recently, winds from the Strait of Gibraltar were identified influencing a large wildfire in the mountainous region of Western Algarve [42]. In the present case study, this circulation is a secondary feature, not directly associated with the atmospheric blocking system.
In addition to atmospheric circulations occurring near the surface, the atmospheric environment in the fire scale can produce several microscale phenomena, such as Vorticity-driven Lateral Spread (VLS) [68], vortex development [69], and pyro-convective clouds [70]. These processes are not considered in the present study, as the simulation focuses on meteorological phenomena only.
Wildfire danger was assessed from the FWI, which responds to the atmospheric conditions near the surface and consequently to weather patterns. In Greece, Papavasileiou et al. [16] identified five synoptic patterns associated with fire weather conditions. Among these, the authors highlighted the most critical pattern associated with extreme fire weather severity, namely the 5th Critical Fire Weather Pattern (CFWP-5), characterized by positive anomalies in the 500 hPa geopotential height field, with high temperatures, dry conditions, and strong winds. This pattern exhibited the highest frequency of days with extreme fire conditions, as indicated by the FWI, ISI, FFMC, and DSR indices. Unlike the authors who use ERA5 data of 0.25° resolution, the present study enhances the FWI spatial discretization. This is particularly important for regions with complex topography, where coarse-resolution data (0.25°) fail to adequately capture local variability and fire weather dynamics. However, the preliminary results from this case study suggest that the Fire Weather Index (FWI) exhibits notable spatial variability, in addition to its diurnal fluctuations. For instance, the high resolution FWI maps revealed that the wildfire in the WUI of Faro occurred under high FWI values in the early morning, very high values during the day, and moderate FWI conditions in the evening. Moreover, the findings indicate that increasing the model resolution enhances the representation of surface–atmosphere interactions, thereby improving the estimation of local wildfire risk through more refined FWI calculations.

5. Conclusions

This study presents a case study of a wind-driven fire in Southern Portugal to show the complexity of the wildfire system in terms of large-scale atmospheric circulation and wildfire risk in a coastal wildland–urban interface.
The meteorological analysis, supported by multiple data sources, helped to explore several aspects of atmospheric dynamics. The results showed the upper air dynamics during the establishment of the blocking pattern in early July 2022. The upper-level configuration gave rise to a trough on 8 July, which deepened and formed an upper-level low-pressure system. This system configured atmospheric blocking between 11 July and 18 July, favoring the maintenance of almost stationary weather conditions able to influence the vegetation state for several days over the Iberian Peninsula, namely high air temperatures and low relative humidity at the surface. In addition, the blocking pattern also contributed to the transport of air parcels from the Saharan desert toward the region.
This study provides important insights into wildfire risk in Southern Portugal, particularly the role of low-level atmospheric circulation below 1 km altitude from the Mediterranean Sea. This regional-scale flow enhanced fire danger by generating strong winds in the area—winds that were not driven by the prevailing large-scale atmospheric blocking pattern. Such circulation was a key factor in the wind-driven fire that occurred in the wildland–urban interface of Faro on 13 July 2022. The study also showed that this circulation is further intensified by the development of combined sea and valley breezes.
Finally, the benefits of Meso-NH outputs in supporting the Fire Weather Index (FWI) calculation are strongly highlighted in this study. Certain regions may present environmental conditions that are not adequately captured by some fire danger indices, particularly when low-resolution data are used, as confirmed in this study by considering the FWI obtained from the ERA5. This limited resolution can result in a poor representation of key atmospheric processes, potentially leading to false alarms or underestimations in fire danger assessments. The preliminary experiment demonstrated that the FWI exhibits significant spatial and temporal variability. In the Algarve region, higher FWI values were observed in the interior areas. Furthermore, in this case study, strong winds identified in the lowlands—where the fire propagated—also contributed to elevated FWI values. A clear diurnal variation was observed, with the highest FWI values occurring during the daytime, corresponding to the ‘very high’ category. However, the FWI in the wildfire-affected area had decreased to a moderate level at the end of the day.
To conclude, the present study demonstrates that, in the context of wildfire risk in southern Portugal, large-scale atmospheric conditions alone may be insufficient to capture the full extent of fire danger. When regional-scale processes are considered, additional risk factors become evident. In particular, a circulation pattern originating over the Mediterranean Sea generated strong winds in the extreme South of Portugal, contributing to the rapid westward spread of the fire. It is noteworthy that this study did not consider the effects of fire on the atmosphere and then local fire-atmosphere interaction phenomena were not represented.
Coupled fire–atmosphere simulations are expected as future work and should complement the present study, enabling a more detailed exploration of fire dynamics in the context of WUI fires. Such a study will show the benefits of using a coupled fire-atmosphere system for decision-making and evacuation strategies in urban interface during large fires. Furthermore, tourism is a central economic driver in Southern Portugal, particularly in the Algarve, and wildfires pose serious threats by endangering visitors and by degrading natural environments that constitute the core of the regional tourism product. In line with broader calls for integration of wildfire hazards into destination management plans and resilience in tourism [71,72,73,74], this case study, although exploring the meteorological environment, will support future work of integrating fire risk assessment into tourism planning, essential to protect both local economies and visitor safety.

Author Contributions

Conceptualization, F.T.C., C.C., C.P. and F.L.M.S.; methodology, F.T.C., C.C. and C.P.; software, F.T.C., C.C. and F.L.M.S.; validation, C.P.; formal analysis, F.T.C., C.C., C.P., H.N.A. and A.B.N.; investigation, F.T.C., C.C., C.P., N.A., A.B.N. and N.G.; resources, F.T.C., F.L.M.S., N.G. and R.S.; data curation, F.T.C., C.C. and F.L.M.S.; writing—original draft preparation, F.T.C.; writing—review and editing, C.C., C.P., F.L.M.S., H.N.A., N.A., A.B.N., N.G. and R.S.; visualization, F.T.C., C.C., F.L.M.S. and N.G.; supervision, n/a; project administration, R.S.; funding acquisition, R.S. All authors have read and agreed to the published version of the manuscript.

Funding

This research was funded by the European Union through the European Regional Development Fund in the framework of the Interreg V-A Spain-Portugal program (POCTEP) under the FIREPOCTEP+ (Ref. FIREPOCTEP+ (0139_FIREPOCTEP_MAS_6_E)) project. The work is also funded by national funds through FCT—Fundação para a Ciência e Tecnologia, I.P., in the framework of the UIDB/06107—Centro de Investigação em Ciência e Tecnologia para o Sistema Terra e Energia. Nuno Guiomar was funded by National Funds through FCT under the projects MED UIDB/05183 (DOI 10.54499/UIDB/05183/2020) and CHANGE LA/P/0121/2020 (DOI 10.54499/LA/P/0121/2020). Filippe L. M. Santos was supported by FCT by project reference 2022.11960.BD and DOI identifier https://doi.org/10.54499/2022.11960.BD.

Institutional Review Board Statement

Not applicable.

Informed Consent Statement

Not applicable.

Data Availability Statement

ECMWF—MARS catalogue: https://www.ecmwf.int/en/forecasts/dataset/operational-archive (accessed on 19 December 2023); Hybrid Single-Particle Lagrangian Integrated Trajectory model (HYSPLIT): https://www.ready.noaa.gov/hypub-bin/trajtype.pl?runtype=archive (accessed on 23 June 2025); Sentinel-2 image, Copernicus Open Access Hub (https://browser.dataspace.copernicus.eu/) (accessed on 15 July 2025), and OGIMET for the weather station data (https://www.ogimet.com/home.phtml.en) (accessed on 28 August 2025).

Acknowledgments

The authors are grateful to the European Centre for Medium-Range Weather Forecasts (ECMWF; https://www.ecmwf.int/) (accessed on 19 December 2023) for providing meteorological analysis, HYSPLIT (https://www.ready.noaa.gov/hypub-bin/trajtype.pl?runtype=archive) (accessed on 23 June 2025) for providing backward trajectories, Copernicus Open Access Hub (https://browser.dataspace.copernicus.eu/) by Sentinel-2 image (accessed on 15 July 2025), and OGIMET for the weather station data (https://www.ogimet.com/home.phtml.en) (accessed on 28 August 2025). Author A.B.N thanks CNPq (National Council for Scientific and Technological Development) for the PQ-2 fellowship (Process 312432/2023-2). H.N.A. thanks the Coordination for the Improvement of Higher Education Personnel—Brazil (CAPES) for the fellowship.

Conflicts of Interest

The authors declare no conflicts of interest.

Appendix A

Model Verification.
Figure A1. Time series point-to-point comparison of (a) air temperature (°C), (b) relative humidity (%), and (c) wind speed (m·s−1) and (d) direction (°) from the Faro weather station located near to the wildfire. The comparison is made using the EXP1 simulation.
Fire 08 00362 g0a1

References

  1. Resco de Dios, V.; Schütze, S.J.; Camprubí, A.C.; Balaguer-Romano, R.; Boer, M.M.; Paulo, M.; Fernandes, P.M. Protected areas as hotspots of wildfire activity in fire-prone Temperate and Mediterranean biomes. J. Environ. Manag. 2025, 385, 125669. [Google Scholar] [CrossRef]
  2. Couto, F.T.; Santos, F.L.M.; Campos, C.; Andrade, N.; Purificação, C.; Salgado, R. Is Portugal Starting to Burn All Year Long? The Transboundary Fire in January 2022. Atmosphere 2022, 13, 1677. [Google Scholar] [CrossRef]
  3. Mendonça, J.M.; Mágoas, C. Relatório Final do Grupo de Peritos dos Incêndios Rurais; AGIF: Lisboa, Portugal, 2023; Available online: https://www.agif.pt/app/uploads/2023/04/Relat%C3%B3rio-Final-do-Grupo-de-Peritos-dos-Inc%C3%AAndios-Rurais.pdf (accessed on 25 June 2025).
  4. Almeida, M.; Soviev, M.; San-Miguel, J.; Durrant, T.; Oom, D.; Branco, A.; Ferrari, D.; Boca, R.; Maianti, P.; de Rigo, D.; et al. Report on the Large Wildfires of 2022 in Europe; Publications Office of the European Union: Luxembourg, 2024. [Google Scholar] [CrossRef]
  5. Mose, I.; Weixlbaumer, N. A new paradigm for protected areas in Europe? In Protected Areas and Regional Development in Europe; Mose, I., Ed.; Ashgate Publishing: Hampshire, UK, 2007; pp. 3–20. [Google Scholar]
  6. Andrade, N.; Couto, F.T.; Serra, J. Assessing Fire Risk Perception in the Vale do Guadiana Natural Park, Portugal. Fire 2023, 6, 243. [Google Scholar] [CrossRef]
  7. Radeloff, V.C.; Helmers, D.P.; Kramer, H.A.; Mockrin, M.H.; Alexandre, P.M.; Bar-Massada, A.; Butsic, V.; Hawbaker, T.J.; Martinuzzi, S.; Syphard, A.D.; et al. Rapid growth of the US wildland-urban interface raises wildfire risk. Proc. Natl. Acad. Sci. USA 2018, 115, 3314–3319. [Google Scholar] [CrossRef] [PubMed]
  8. Modaresi Rad, A.; Abatzoglou, J.T.; Kreitler, J.; Alizadeh, M.R.; AghaKouchak, A.; Hudyma, N.; Nauslar, N.J.; Sadegh, M. Human and infrastructure exposure to large wildfires in the United States. Nat. Sustain. 2023, 6, 1343–1351. [Google Scholar] [CrossRef]
  9. Aguirre, P.; León, J.; González-Mathiesen, C.; Román, R.; Penas, M.; Ogueda, A. Modelling the vulnerability of urban settings to wildland–urban interface fires in Chile. Nat. Hazards Earth Syst. Sci. 2024, 24, 1521–1537. [Google Scholar] [CrossRef]
  10. Li, P.; Zhao, B.; Soga, K.; Comfort, L. Exploring Wildfire Evacuation Strategies for Diverse Communities. Transp. Res. Rec. 2024, 2678, 719–735. [Google Scholar] [CrossRef]
  11. Raei, B.; Kinateder, M.; Bénichou, N.; Gomaa, I.; Wang, X. Are the data good enough? Spatial and temporal modeling of evacuee behavior using GPS data in a small rural community. Int. J. Disaster Risk Reduct. 2025, 116, 105054. [Google Scholar] [CrossRef]
  12. Ramos, C.; Yuan, Y. Neighborhood-Scale Wildfire Evacuation Vulnerability in Hays County, TX. Geographies 2024, 4, 481–499. [Google Scholar] [CrossRef]
  13. Zhang, W.; Wang Simon, S.-Y.; Chikamoto, Y.; Gillies, R.; LaPlante, M.; Hari, V. A weather pattern responsible for increasing wildfires in the western United States. Environ. Res. Lett. 2025, 20, 14007. [Google Scholar] [CrossRef]
  14. Tomshin, O.; Solovyev, V. Synoptic Weather Patterns during Fire Spread Events in Siberia. Sci. Total Environ. 2024, 921, 171205. [Google Scholar] [CrossRef] [PubMed]
  15. Ruffault, J.; Moron, V.; Trigo, R.M.; Curt, T. Daily synoptic conditions associated with large fire occurrence in Mediterranean France: Evidence for a wind-driven fire regime. Int. J. Climatol. 2017, 37, 524–533. [Google Scholar] [CrossRef]
  16. Papavasileiou, G.; Giannaros, T.M. Synoptic-Scale Drivers of Fire Weather in Greece. Sci. Total Environ. 2024, 925, 171715. [Google Scholar] [CrossRef] [PubMed]
  17. Little, K.; Castellanos-Acuna, D.; Jain, P.; Graham, L.; Kettridge, N.; Flannigan, M. Persistent positive anomalies in geopotential heights drive enhanced wildfire activity across Europe. Phil. Trans. R. Soc. B 2025, 380, 20230455. [Google Scholar] [CrossRef]
  18. Wu, M.; Zhang, C.; Li, M.; Du, W.; Chen, J.; Zhao, C. Self-Organizing Map-Based Classification for Fire Weather Index in the Beijing–Tianjin–Hebei Region and Their Potential Causes. Atmosphere 2025, 16, 403. [Google Scholar] [CrossRef]
  19. Bai, M.; Zhang, P.; Xing, P.; Du, W.; Hao, Z.; Zhang, H.; Shi, Y.; Liu, L. Spatiotemporal Characteristics, Causes, and Prediction of Wildfires in North China: A Study Using Satellite, Reanalysis, and Climate Model Datasets. Remote Sens. 2025, 17, 1038. [Google Scholar] [CrossRef]
  20. da Silva Nascimento, A.L.; da Silva Teixeira, M.; Alonso, M.F.; Nunes, A.B.; Laureanti, N.C.; Javarini, L.P. Synoptic patterns associated with the occurrence of fire foci in the Ecological Station Taim and Campos Neutrais—Brazil. Rev. Bras. de Climatol. 2023, 32, 463–493. [Google Scholar] [CrossRef]
  21. Keikhosravi, G.; Dizaj, A.Y. Investigation of synoptic patterns of fire occurrence in the forests of the western Alborz Mountains. Theor. Appl Clim. 2023, 154, 1151–1163. [Google Scholar] [CrossRef]
  22. Couto, F.T.; Kartsios, S.; Lacroix, M.; Andrade, H.N. A Quick Look at the Atmospheric Circulation Leading to Extreme Weather Phenomena on a Continental Scale. Atmosphere 2024, 15, 1205. [Google Scholar] [CrossRef]
  23. Rolinski, T.; Capps, S.B.; Zhuang, W. Santa Ana Winds: A Descriptive Climatology. Weather Forecast. 2019, 34, 257–275. [Google Scholar] [CrossRef]
  24. Cao, Y.; Fovell, R.G. Downslope Windstorms of San Diego County. Part I: A Case Study. Mon. Weather Rev. 2016, 144, 529–552. [Google Scholar] [CrossRef]
  25. Raphael, M.N. The Santa Ana Winds of California. Earth Interact. 2003, 7, 1–13. [Google Scholar] [CrossRef]
  26. Abatzoglou, J.T.; Barbero, R.; Nauslar, N.J. Diagnosing Santa Ana Winds in Southern California with Synoptic-Scale Analysis. Weather Forecast. 2013, 28, 704–710. [Google Scholar] [CrossRef]
  27. Keeley, J.E.; Guzman-Morales, J.; Gershunov, A.; Syphard, A.D.; Cayan, D.; Pierce, D.W.; Flannigan, M.; Brown, T.J. Ignitions explain more than temperature or precipitation in driving Santa Ana wind fires. Sci. Adv. 2021, 7, eabh2262. [Google Scholar] [CrossRef] [PubMed]
  28. Moritz, M.A.; Moody, T.J.; Krawchuk, M.A.; Hughes, M.; Hall, A. Spatial variation in extreme winds predicts large wildfire locations in chaparral ecosystems, Geophys. Res. Lett. 2010, 37, L04801. [Google Scholar] [CrossRef]
  29. Billmire, M.; French, N.H.F.; Loboda, T.; Owen, R.C.; Tyner, M. Santa Ana winds and predictors of wildfire progression in southern California. Int. J. Wildland Fire 2014, 23, 1119–1129. [Google Scholar] [CrossRef] [PubMed]
  30. Agyakwah, W.; Lin, Y.-L.; Kaplan, M.L. Essential Organizing and Evolving Atmospheric Mechanisms Affecting the East Bay Hills Fire in Oakland, California (1991). Fire 2025, 8, 72. [Google Scholar] [CrossRef]
  31. Smith, C.; Hatchett, B.J.; Kaplan, M. A Surface Observation Based Climatology of Diablo-Like Winds in California’s Wine Country and Western Sierra Nevada. Fire 2018, 1, 25. [Google Scholar] [CrossRef]
  32. Wiles, J.T.; Lin, Y.L.; Kaplan, M.L. Multi-scale numerical simulations of the synoptic environment, Diablo windstorm, and wildfire formation mechanisms for the Tubbs Fire (2017). Meteorol. Atmos. Phys. 2024, 136, 5. [Google Scholar] [CrossRef]
  33. Coen, J.L.; Schroeder, W.; Quayle, B. The Generation and Forecast of Extreme Winds during the Origin and Progression of the 2017 Tubbs Fire. Atmosphere 2018, 9, 462. [Google Scholar] [CrossRef]
  34. Montecinos, A.; Muñoz, R.C.; Oviedo, S.; Martínez, A.; Villagrán, V. Climatological Characterization of Puelche Winds down the Western Slope of the Extratropical Andes Mountains Using the NCEP Climate Forecast System Reanalysis. J. Appl. Meteorol. Climatol. 2017, 56, 677–696. [Google Scholar] [CrossRef]
  35. McWethy, D.B.; Garreaud, R.D.; Holz, A.; Pederson, G.T. Broad-Scale Surface and Atmospheric Conditions during Large Fires in South-Central Chile. Fire 2021, 4, 28. [Google Scholar] [CrossRef]
  36. Tomašević, I.C.; Fox-Hughes, P.; Cheung, K.K.W.; Beggs, P.J.; Vučetić, V.; Marsden-Smedley, J.; Telišman Prtenjak, M. Meteorological analysis of an extreme pyroconvective wildfire at Dunalley-Forcett, Australia. Nat. Hazards 2025, 121, 10843–10875. [Google Scholar] [CrossRef]
  37. Kartsios, S.; Karacostas, T.; Pytharoulis, I.; Dimitrakopoulos, A.P. Numerical investigation of atmosphere-fire interactions during high-impact wildland fire events in Greece. Atmos. Res. 2020, 247, 105253. [Google Scholar] [CrossRef]
  38. Tedim, F.; Remelgado, R.; Borges, C.; Carvalho, S.; Martins, J. Exploring the Occurrence of Mega-Fires in Portugal. For. Ecol. Manag. 2013, 294, 86–96. [Google Scholar] [CrossRef]
  39. Freire, J.G.; DaCamara, C.C. Using cellular automata to simulate wildfire propagation and to assist in fire management. Nat. Hazards Earth Syst. Sci. 2019, 19, 169–179. [Google Scholar] [CrossRef]
  40. Oliveira, T.M.; Barros, A.M.G.; Ager, A.A.; Fernandes, P.M. Assessing the effect of a fuel break network to reduce burnt area and wildfire risk transmission. Int. J. Wildland Fire 2016, 25, 619–632. [Google Scholar] [CrossRef]
  41. Santos, F.L.M.; Couto, F.T.; Dias, S.S.; Ribeiro, N.d.A.; Salgado, R. Vegetation Fuel Characterization Using Machine Learning Approach over Southern Portugal. Remote Sens. Appl. 2023, 32, 101017. [Google Scholar] [CrossRef]
  42. Purificação, C.; Santos, F.L.M.; Henkes, A.; Kartsios, S.; Couto, F.T. Fire-weather conditions during two fires in Southern Portugal: Meteorology, Orography, and Fuel Characteristics. Model. Earth Syst. Environ. 2025, 11, 135. [Google Scholar] [CrossRef]
  43. Purificação, C.; Campos, C.; Henkes, A.; Couto, F.T. Exploring the atmospheric conditions increasing fire danger in the Iberian Peninsula. Q. J. R. Meteorol. Soc. 2024, 150, 3475–3494. [Google Scholar] [CrossRef]
  44. Purificação, C.; Henkes, A.; Kartsios, S.; Couto, F.T. The Role of Atmospheric Circulation in Favouring Forest Fires in the Extreme Southern Portugal. Sustainability 2024, 16, 6985. [Google Scholar] [CrossRef]
  45. ECMWF/MARS. 2025. Available online: https://www.ecmwf.int/en/forecasts/access-forecasts/access-archive-datasets (accessed on 23 June 2025).
  46. Lac, C.; Chaboureau, J.-P.; Masson, V.; Pinty, J.-P.; Tulet, P.; Escobar, J.; Leriche, M.; Barthe, C.; Aouizerats, B.; Augros, C.; et al. Overview of the Meso-NH model version 5.4 and its applications. Geosci. Model Dev. 2018, 11, 1929–1969. [Google Scholar] [CrossRef]
  47. Pergaud, J.; Masson, V.; Malardel, S.; Couvreux, F. A Parameterization of Dry Thermals and Shallow Cumuli for Mesoscale Numerical Weather Prediction. Bound. Lay. Meteorol. 2009, 132, 83–106. [Google Scholar] [CrossRef]
  48. Pinty, J.-P.; Jabouille, P. A mixed-phase cloud parameterization for use in mesoscale non-hydrostatic model: Simulations of a squall line and of orographic precipitations. In Proceedings of the Conference on Cloud Physics, Everett, WA, USA, 17–21 August 1998; American Meteorological Society: Boston, MA, USA, 1999; pp. 217–220. [Google Scholar]
  49. Mlawer, E.J.; Taubman, S.J.; Brown, P.D.; Iacono, M.J.; Clough, S.A. Radiative transfer for inhomogeneous atmospheres: RRTM, a validated correlated-k model for the longwave. J. Geophys. Res. 1997, 102, 16663–16682. [Google Scholar] [CrossRef]
  50. Cuxart, J.; Bougeault, P.; Redelsperger, J.L. A turbulence scheme allowing for mesoscale and large-eddy simulations. Q. J. R. Meteorol. Soc. 2000, 126, 1–30. [Google Scholar] [CrossRef]
  51. Masson, V.; Le Moigne, P.; Martin, E.; Faroux, S.; Alias, A.; Alkama, R.; Belamari, S.; Barbu, A.; Boone, A.; Bouyssel, F.; et al. The SURFEXv7.2 land and ocean surface platform for coupled or offline simulation of earth surface variables and fluxes. Geosci. Model Dev. 2013, 6, 929–960. [Google Scholar] [CrossRef]
  52. SRTM. Available online: https://www.earthdata.nasa.gov/data/alerts-outages/shuttle-radar-topography-mission-version-3-0-srtm-plus-product-release (accessed on 24 June 2025).
  53. OGIMET. Available online: www.ogimet.com (accessed on 1 September 2025).
  54. Wagner, C.E. Development and structure of the Canadian Forest Fire Weather Index System. In Forestry Technical Report. 35; Canadian Forest Service, Petawawa National Forestry Institute: Chalk River, ON, Canada, 1987; 37p. [Google Scholar]
  55. IPMA. Perigo de Incêndio Rural—Índice Meteorológico de Incêndio [FWI]. 2025. Available online: https://www.ipma.pt/pt/enciclopedia/otempo/risco.incendio/index.jsp (accessed on 24 June 2025).
  56. IPMA. Relatório Julho 2022. Incêndios Rurais. Análise meteorológica & Índices de Perigo e de Risco. IPMA, Lisbon. 2022. Available online: https://www.ipma.pt/resources.www/docs/im.publicacoes/edicoes.online/20220920/aLPaHsIyJXBPjLidMnfC/met_20220701_20220731_fog_mm_co_pt.pdf (accessed on 24 June 2025).
  57. Copernicus Climate Change Service, Climate Data Store. Fire Danger Indices Historical Data from the Copernicus Emergency Management Service; Copernicus Climate Change Service (C3S) Climate Data Store (CDS): Bologna, Italy, 2019. [Google Scholar] [CrossRef]
  58. Stein, A.F.; Draxler, R.R.; Rolph, G.D.; Stunder, B.J.B.; Cohen, M.D.; Ngan, F. NOAA’s HYSPLIT atmospheric transport and dispersion modeling system, Bull. Amer. Meteor. Soc. 2015, 96, 2059–2077. [Google Scholar] [CrossRef]
  59. HYSPLIT. 2025. Available online: https://www.ready.noaa.gov/hypub-bin/trajtype.pl?runtype=archive (accessed on 23 June 2025).
  60. Purificação, C.; Andrade, N.; Potes, M.; Salgueiro, V.; Couto, F.T.; Salgado, R. Modelling the Atmospheric Environment Associated with a Wind-Driven Fire Event in Portugal. Atmosphere 2022, 13, 1124. [Google Scholar] [CrossRef]
  61. Lima, D.C.A.; Soares, P.M.M.; Nogueira, M.; Semedo, A. Global Coastal Low-Level Wind Jets Revisited through the New ERA5 Reanalysis. Int. J. Climatol. 2021, 42, 4491–4507. [Google Scholar] [CrossRef]
  62. Trigo, R.M.; Sousa, P.M.; Pereira, M.G.; Rasilla, D.; Gouveia, C.M. Modelling wildfire activity in Iberia with different atmospheric circulation weather types. Int. J. Clim. 2016, 36, 2761–2778. [Google Scholar] [CrossRef]
  63. Pereira, M.G.; Trigo, R.M.; da Camara, C.C.; Pereira, J.M.C.; Leite, S.M. Synoptic patterns associated with large summer forest fires in Portugal. Agric. For. Meteorol. 2006, 129, 11–25. [Google Scholar] [CrossRef]
  64. Couto, F.T.; Salgado, R.; Guiomar, N. Forest Fires in Madeira Island and the Fire Weather Created by Orographic Effects. Atmosphere 2021, 12, 827. [Google Scholar] [CrossRef]
  65. Couto, F.T.; Cardoso, E.H.C.; Costa, M.J.; Salgado, R.; Guerrero-Rascado, J.L.; Salgueiro, V. How a mesoscale cyclonic vortex over Sahara leads to a dust outbreak in South-western Iberia. Atmos. Res. 2021, 249, 105302. [Google Scholar] [CrossRef]
  66. Francis, D.; Eayrs, C.; Chaboureau, J.-P.; Mote, T.; Holland, D.M. A meandering polar jet caused the development of a Saharan cyclone and the transport of dust toward Greenland. Adv. Sci. Res. 2019, 16, 49–56. [Google Scholar] [CrossRef]
  67. López-Cayuela, M.Á.; Córdoba-Jabonero, C.; Bermejo-Pantaleón, D.; Sicard, M.; Salgueiro, V.; Molero, F.; Carvajal-Pérez, C.V.; Granados-Muñoz, M.J.; Comerón, A.; Couto, F.T.; et al. Vertical characterization of fine and coarse dust particles during an intense Saharan dust outbreak over the Iberian Peninsula in springtime 2021. Atmos. Chem. Phys. 2023, 23, 143–161. [Google Scholar] [CrossRef]
  68. Sharples, J.J.; Hilton, J.E. Modeling vorticity-driven wildfire behavior using near-field techniques. Front. Mech. Eng. 2020, 5, 69. [Google Scholar] [CrossRef]
  69. Lareau, N.P.; Nauslar, N.J.; Bentley, E.; Roberts, M.; Emmerson, S.; Brong, B.; Mehle, M.; Wallman, J. Fire-Generated Tornadic Vortices. Bull. Am. Meteorol. Soc. 2022, 103, E1296–E1320. [Google Scholar] [CrossRef]
  70. Couto, F.T.; Filippi, J.-B.; Baggio, R.; Campos, C.; Salgado, R. Triggering Pyro-Convection in a High-Resolution Coupled Fire–Atmosphere Simulation. Fire 2024, 7, 92. [Google Scholar] [CrossRef]
  71. Becken, S.; Hay, J.E. Tourism and Climate Change: Risks and Opportunities; Channel View Publications: Bristol, UK, 2012. [Google Scholar] [CrossRef]
  72. Espiner, S.; Orchiston, C.; Higham, J. Resilience and sustainability: A complementary relationship? J. Sustain. Tour. 2017, 25, 1385–1400. [Google Scholar] [CrossRef]
  73. UNWTO. Tourism and Resilience: Building Forward Better; World Tourism Organization: Madrid, Spain, 2022; Available online: https://www.worldbank.org/en/events/2021/03/24/tourism-resilience-building-forward-better (accessed on 24 June 2025).
  74. Gonzalez-Mathiesen, C.; Ruane, S.; March, A. Integrating Wildfire Risk Management and Spatial Planning—A Historical Review of Two Australian Planning Systems. Int. J. Disaster Risk Reduct. 2021, 53, 101984. [Google Scholar] [CrossRef]
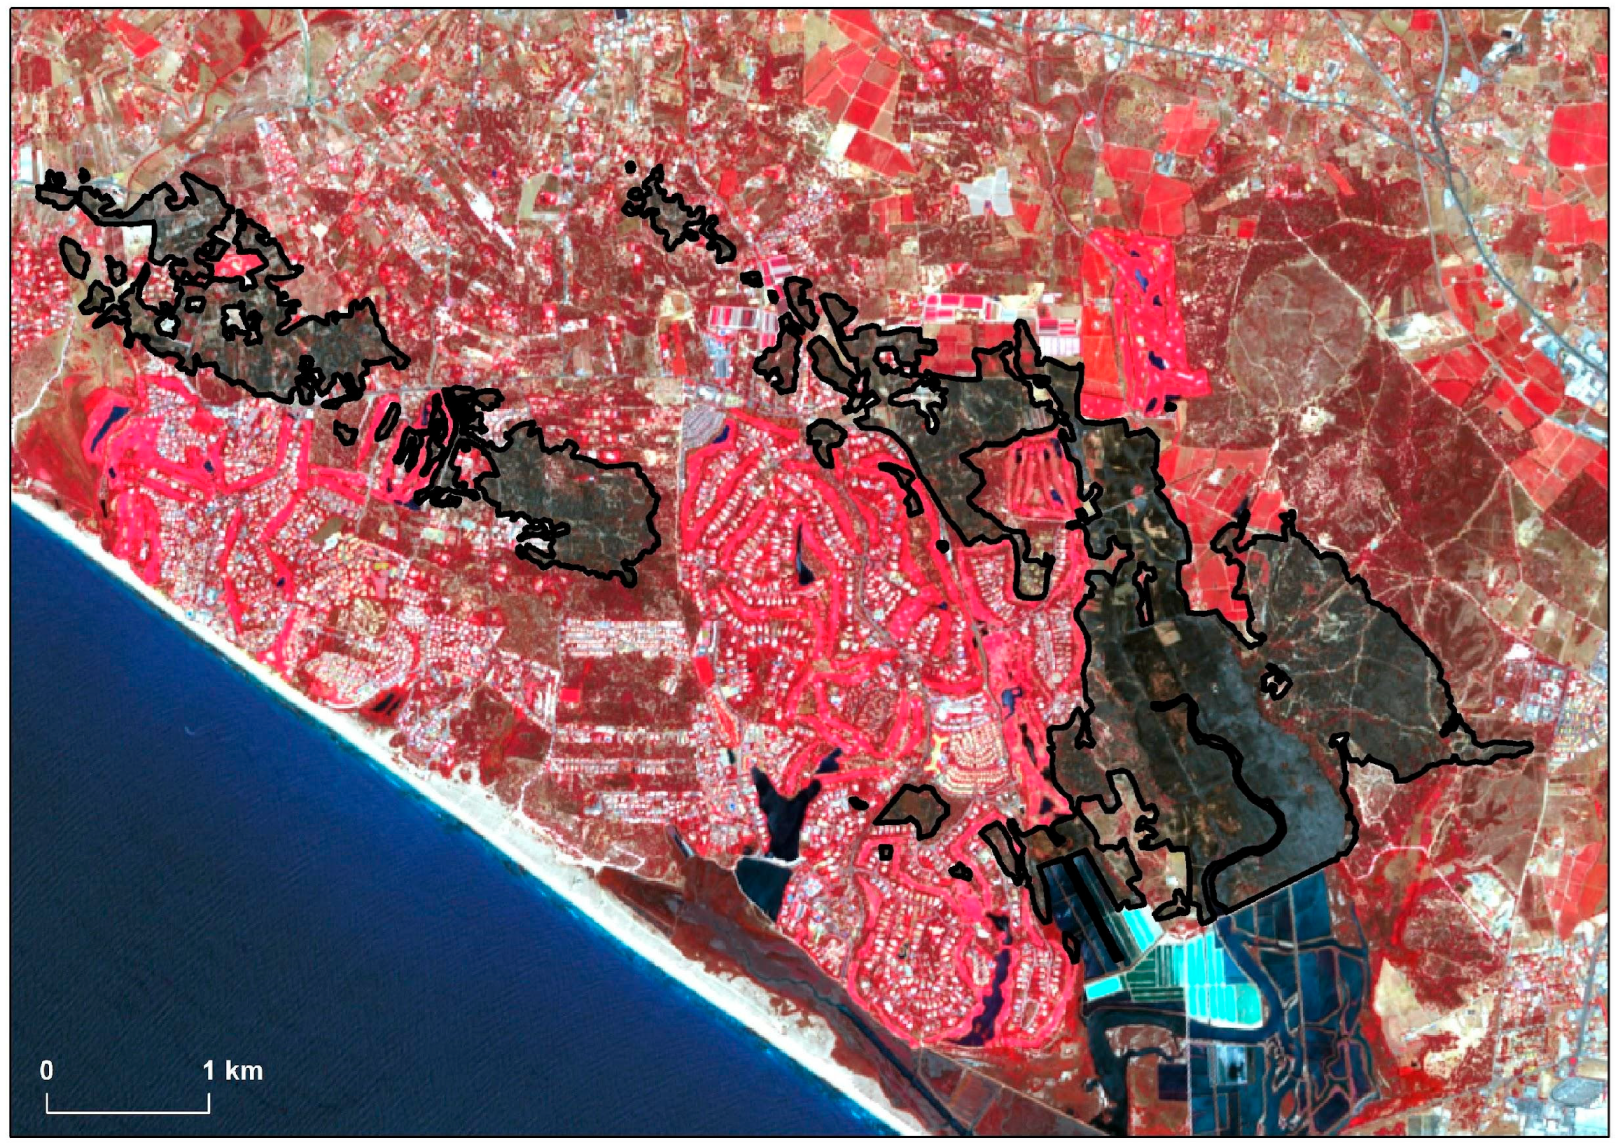
Figure 1. Fire scar (black contour) identified from Sentinel-2 imagery on 18 July 2022, indicating locations affected by the fire on 12–13 July 2022.
Fire 08 00362 g001
Figure 2. (a) Large domain of the ECMWF data covering the North Atlantic Ocean and the Meso-NH domain (blue square), (b) Meso-NH domain with 1.5 km resolution covering Southern Portugal and Gibraltar Strait. The orange dot represents the wildfire location and the red dot describes the sounding location obtained from the EXP1, (c) timeline of the study period used by the ECMWF Analysis (blue/gray), Meso-NH experiments (red rectangle), and fire period (orange rectangle).
Fire 08 00362 g002
Figure 3. Wind speed (m·s−1, shaded areas) and direction (arrows) at 250 hPa during the blocking pattern formation period: (a) 2 July 2022, at 0000 UTC, (b) 4 July 2022, at 0000 UTC, (c) 6 July 2022, at 0000 UTC, (d) 8 July 2022, at 0000 UTC, (e) 10 July 2022, at 0000 UTC, and (f) 11 July 2022, at 0000 UTC.
Fire 08 00362 g003
Figure 4. Potential vorticity (K·m2·kg−1·s−1) at 250 hPa (a) at 0000 UTC on 9 July 2022, and (b) at 0000 UTC on 11 July 2022.
Fire 08 00362 g004
Figure 5. Large-scale fields at 0000 UTC on 12 July 2022 for: (a) Potential vorticity (K·m2·kg−1·s−1) at 250 hPa, (b) Wind speed (m·s−1, shaded areas) and direction (arrows) at 250 hPa level, (c) Ozone mass mixing ratio (kg·kg−1) at 250 hPa level, and (d) Air temperature (°C) and wind direction (arrows) at 500 hPa level.
Fire 08 00362 g005
Figure 6. Wind speed (m·s−1, shaded areas) and direction (arrows) at 500 hPa level: (a) 10 July 2022, at 0000 UTC, (b) 12 July 2022, at 0000 UTC, (c) 13 July 2022 at 0000 UTC, (d) 15 July 2022, at 0000 UTC, (e) 18 July 2022, at 0000 UTC, and (f) 19 July 2022, at 0000 UTC.
Fire 08 00362 g006
Figure 7. Large-scale fields: (a) Air temperature (°C) at 850 hPa at 1800 UTC on 12 July 2022, (b) Relative humidity (%) at 850 hPa at 1800 UTC on 12 July 2022, (c) Air temperature (°C) at 700 hPa at 0000 UTC on 16 July 2022, and (d) Air temperature at 850 hPa at 0000 UTC on 18 July 2022. Arrows in (a,b,d) represent wind direction at 850 hPa, whereas the blue line in (c) the geopotential (m2·s−2) field configuration.
Fire 08 00362 g007
Figure 8. Skew-T/LogP diagram at 0600 UTC on 13 July 2022 obtained from the EXP1 simulation at 1.5 km resolution at coordinates points: 37.15° N and 8.37° W.
Fire 08 00362 g008
Figure 9. Mesoscale features at 1500 UTC on 13 July 2022: (a) air temperature at 2 m and wind direction (arrows), (b) relative humidity at 2 m and wind direction (arrows), (c) wind speed (m·s−1) and direction (arrows) at 500 m a.g.l, and (d) wind gusts (m·s−1) at 10 m and wind direction (arrows). The red dot represents the fire location.
Fire 08 00362 g009
Figure 10. Wind gusts (m·s−1) at 10 m at 0600 UTC on 13 July 2022: (a) EXP1 simulation with orography, (b) EXP2 simulation with no orography, and (c) difference between the numerical experiments, i.e., EXP1 minus EXP2. The red dot represents the fire location.
Fire 08 00362 g010
Figure 11. Backward trajectories from the HYSPLIT model ending (a) at 0000 UTC on 13 July 2022, (b) at 0000 UTC on 14 July 2022, and (c) at 0000 UTC on 19 July 2022.
Fire 08 00362 g011
Figure 12. (a) FWI on 13 July 2022 at 1200 UTC obtained from ERA5 at 0.25-degree resolution; Zoom over the Algarve’s region showing FWI calculated from the Meso-NH outputs with 1.5 km resolution on 13 July 2022 (b) at 0600 UTC, (c) at 0900 UTC, (d) at 1200 UTC, (e) at 1500 UTC, (f) at 1800 UTC, and (g) at 2100 UTC. The color bar is consistent with the FWI classes used by [55]. The black line represents the Algarve region.
Fire 08 00362 g012
Disclaimer/Publisher’s Note: The statements, opinions and data contained in all publications are solely those of the individual author(s) and contributor(s) and not of MDPI and/or the editor(s). MDPI and/or the editor(s) disclaim responsibility for any injury to people or property resulting from any ideas, methods, instructions or products referred to in the content.