Abstract
Wildfires pose severe threats to ecosystems and human settlements, making early detection and rapid response critical for minimizing damage. The adage—“You fight fire in the first second with a spoon of water, in the first minute with a bucket, and in the first hour with a truckload”—illustrates the importance of early intervention. Over recent decades, significant research efforts have been directed toward developing efficient systems capable of identifying wildfires in their initial stages, especially in remote forests and wildland–urban interfaces (WUIs). This review paper introduces the Special Issue of Fire and is dedicated to advanced approaches to wildfire detection, monitoring, and surveillance. It summarizes state-of-the-art technologies for smoke and flame detection, with a particular focus on their integration into broader wildfire management systems. Emphasis is placed on distinguishing wildfire monitoring (the passive collection of data using various sensors) from surveillance (active data analysis and action based on visual information). The paper is structured as follows: a historical and theoretical overview; a discussion of detection validation and available datasets; a review of current detection methods; integration with ICT tools and GIS systems; the identification of system gaps; and future directions and emerging technologies.
1. Introduction
This Special Issue of Fire is dedicated to advanced approaches to wildfire detection monitoring and surveillance. Wildfires are natural phenomena with devastating effects on nature and human properties. Many efforts in fire prevention and protection aim to reduce not only the number of fires, but also the extent of fire damage. It is well-known that early wildfire detection and quick, appropriate interventions are the most important measures for minimizing wildfire damage. Once a wildfire has expanded, it becomes very difficult to control and extinguish. Therefore, there have been many efforts to develop a viable wildfire monitoring system that can aid firefighters by providing real-time visual information in critical moments. Technology advancements over the last couple of decades in the fields of computer vision, artificial intelligence and available processing power have pushed forward efforts in the development of the surveillance systems capable of detecting wildfires at the initial stages. The focus here is on the words ‘the initial stage’ because the necessary firefighting efforts increase with time. The metaphor: “You fight fire in the first second with a spoon of water, in the first minute with a bucket of water, and in the first hour with a truckload of water,” is often used to emphasize the importance of addressing firefighting problem before fire escalates.
This Special Issue aims to bring together and present recent advanced approaches for wildfire smoke and flame detection, as well as advanced systems for wildfire monitoring and surveillance in various natural environments, from inaccessible forest areas to wildland–urban interfaces (WUIs). As an introduction to this Special Issue, we have prepared this review paper primarily to summarize the current approaches to wildfire detection, but also to emphasize the importance of wildfire monitoring and surveillance and their integration with other ICT tools that could greatly improve firefighting strategies.
We intentionally use two distinct terms: wildfire surveillance and wildfire monitoring, even though they are often considered synonymous. They both belong to wildfire observation techniques, but there is a clear difference in their meanings, and much debate surrounds these distinctions. In most discussions, people agree that both involve the routine collection of information on phenomena, but surveillance goes beyond monitoring. In surveillance, the collected data are analyzed, interpreted, and actions are taken based on the findings. In contrast, monitoring may not always involve action, depending on its purpose. Another key difference is that the term surveillance is typically associated with the use of visual sensors to collect information, whereas monitoring does not necessarily rely on visual sensors and can involve various other types of sensors.
This review paper is organized as follows. In Section 2, brief remarks about the history of wildfire detection are made, as well as on the theoretical background of wildfire detection, based on the format theory of observer perception and notation. In Section 3, a short discussion about detection evaluation, validation and testing methods is given, including existing databases that could be used for validation and testing of new detection methods. Section 4 presents our main topic—a review of current approaches to wildfire detection. Section 5 then addresses the integration of wildfire detection into wildfire monitoring and surveillance systems, as well as the linkage of these systems with other advanced ICT tools that enhance their capabilities. Section 6 is dedicated to gaps in wildfire monitoring and surveillance. Finally, Section 7 summarizes the paper and gives some future directions, which will include discussion of emerging technologies in this field.
2. Historical and Theoretical Background to Wildfire Detection and Surveillance
Effective wildfire detection has always been a cornerstone of fire management, as timely recognition of ignition can drastically reduce a fire’s spread and impact. Before the development of modern technologies, wildfire detection relied almost entirely on human observation—the earliest organized approach to wildfire surveillance [1,2]. Human observers were stationed in lookout towers or organized into ground patrols, tasked with visually identifying smoke or flames, and reporting critical information to the authorities. Equipped with binoculars, maps, and communication tools, they sometimes used instruments such as an alidade to determine fire direction relative to known landmarks, enabling more precise location reporting. Standard wildfire detection reports typically included the time of detection, geographical location, and estimates of fire intensity and growth rate [1,2].
While this human-based wildfire surveillance provided an important first line of defense, it was constrained by limited fields of view, visibility conditions, and a heavy reliance on constant human vigilance [2,3,4]. Observers often worked in isolation and extreme weather conditions (especially high summer temperatures), which significantly impacted concentration and performance. Moreover, they were frequently not trained firefighters—mainly for cost reasons—so their reports on fire intensity and progression were often insufficient for decision-making or for shaping firefighting strategies [5]. Human-based wildfire surveillance was typically restricted to summer months, when the risk was highest, though agricultural practices posed risks year-round [5]. Despite these limitations, experienced observers could detect almost every wildfire within their field of view, and with very low false alarm rates [4].
Driven by these constraints, efforts were made to improve human-based surveillance. With the advancement of Information and Communication Technology (ICT), observers were relocated from isolated towers to centralized monitoring centers equipped with remotely operated video cameras [5]. This shift—termed human video-based wildfire surveillance—improved working conditions and enabled the use of better-trained personnel, leading to more reliable assessments of wildfire detection as well as fire growth and spread. However, reliance on human vigilance remained, and limitations such as fatigue, boredom, and reduced attention persisted.
To address these issues, research efforts focused on replacing manual detection with automatic video-based wildfire surveillance systems. In such systems, input sensory data are automatically analyzed to detect wildfire in its initial stages, while the human assumes the role of supervisor rather than primary detector. This progression—from human-based to human video-based to automatic video-based surveillance—represents a fundamental transition in wildfire monitoring. Figure 1 illustrates the main difference between human-based, human video-based and automatic video-based wildfire surveillance systems.
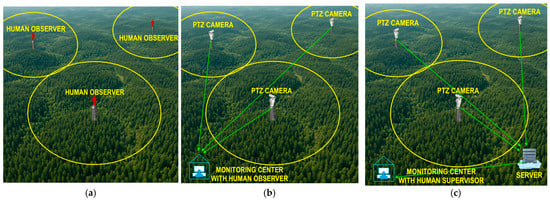
Figure 1.
Organizational difference between (a) human-based, (b) human video-based and (c) automatic video-based wildfire surveillance systems. Yellow circles represent the active observation areas of a human observer or a camera, while green arrows indicate communication links.
The automatic wildfire observer must replace human wildfire observation, so an appropriate observation theory is needed that can explain both human and automatic wildfire observation. The theory must start from the term observer. An observer is an individual or device that perceives and becomes aware of things or events through sensory means. In the context of the observation task, perception plays a crucial role. Human perception is commonly defined as the process of acquiring, selecting, organizing, and interpreting sensory information. This process transforms sensory stimuli into a structured and meaningful experience known as a percept [6]. The research goal is to develop an artificial perception system that replicates human perception, which requires a mathematical framework for understanding the perception process. The most appropriate theory is the formal theory of perception [7], which includes the formal notation of the observer or, more specifically, a competent observer, as a six-tuple [7,8]:
where (X, ) and (Y, ) are measurable spaces, each of them consisting of an abstract space X or Y and their corresponding collections of subspaces and , satisfying the σ–algebra features ( contains X itself and contains Y itself, and both are closed under the set operations of complementation and countable union). X is usually called a configuration (or conclusion) space and Y an observation (or premise) space. E is an element of a subspace (E ∈ ) called a distinguished configuration or configuration event, and S is an element of a subspace (S ∈ ) called an observation or premises event. π is a perspective map, a measurable surjective function π: X⟶Y with π (E) = S and η is a conclusion (or interpretation) kernel, mathematically a Markov kernel, a map that associates to each point s ∈ S with the probability measure η (s, .) supported on (π−1 (s) ∩ E). It is important to emphasize that X is not the real world but its (mathematical) representation. When the observer O observes, it interacts with its object of perception. However, it does not perceive the object itself, but rather it perceives a representation of some property of interaction, where X represents all the properties of relevance to observer O.
O = ((X, ), (Y, ), E, S, π, η)
This formal mathematical observer explanation can be translated to our case of interest, the vision-based wildfire observer [5,9]. Figure 2 shows a schematic representation of this concept.
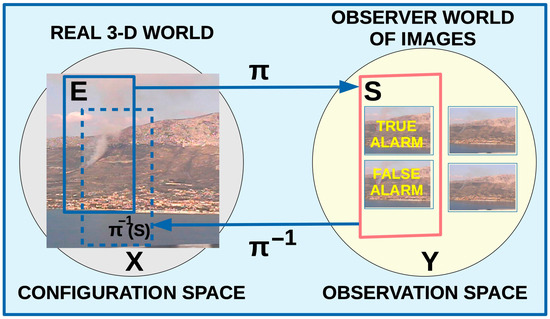
Figure 2.
Vision-based wildfire observer in the context of formal theory of observer perception and notation. The connection between the real 3-D world and the observer world of 2-D images is perspective map π.
On one side, we have wildfire as a natural phenomenon with complex spatial and temporal events having various physical and chemical characteristics. Most important for the vison-based wildfire observer are various visual characteristics, such as chromatic and morphological properties. Detection of wildfire in its initial phase relies primarily on smoke detection because smoke is a visual physical feature that can be seen first. Figure 3 presents representative examples of wildfire imagery in its initial phase.
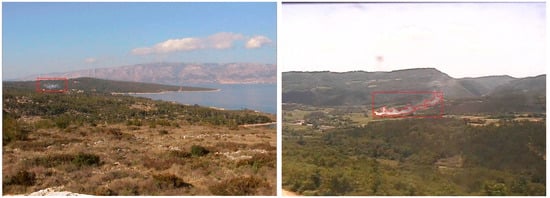
Figure 3.
Wildfire in its initial phase, where smoke is the first visual feature that could be detected. After detection, sometimes only the whole smoke is marked with red rectangle (left) and sometimes additionally all pixels detected as smoke are marked with red line (right). (photos from author’s archive: left is island Hvar, Croatia, 2003 and right Buzet, Istria, Croatia, 2007).
Smoke can be detected based on various static and dynamic chromatic and morphological features. It has specific color characteristics as well as specific dynamic features. The space X includes all these properties. For example, one point x of X could represent chromatic change on the part of the environment where a wildfire starts to develop, or a specific dynamic behavior characteristic of wildfire development. All these events belonging to a wildfire are the configuration event E. Aside from the wildfire in the observed environment, other natural phenomena could occur, such as lightning, storm, or tornado, and all of these have their specific configuration event. The observer perceives these properties through a specific sensor—in our case, a vision sensor. Mathematically, we represent this with a perspective mapping π. For a certain property x from X, the observer receives y = π (x), where y is the point in the observation space Y. If x is a property that is characteristic of a wildfire, then x belongs to the configuration event e from E and y belongs to the premises event s from S. We thus have perspective mapping S = π (E).
Based on the premise event S, the observer decides whether it is a real wildfire or not. There are four possible situations:
- If S is interpreted as belonging to the wildfire and E belongs to the wildfire, we have a Correct Detection or True Positive, represented by the set TP = (π−1 (S) ∩ E).
- If S is interpreted as belonging to the wildfire and E does not belong to the wildfire, we have a False Detection or False Positive, represented by the set FP = (π−1 (S) ∩ EC).
- If S is interpreted as not belonging to the wildfire and E belongs to the wildfire, we have a Missed Detection or False Negative, represented by the set FN = (π−1 (S)C∩ E).
- If S is interpreted as not belonging to the wildfire and E does not belong to the wildfire, we have a Correct Rejection or True Negative, represented by the set TN = (π−1 (S)C∩ EC).
These sets are used in the evaluation of detection quality, which is explained in the next section. The main issue is that the observer cannot precisely determine the correspondence between a point e from set E and a point s from set S. Instead, the observer relies on a conclusion kernel, a probability measure η(s,.) supported in (π−1 (s) ∩ E), representing the estimated relationship between property s (a wildfire property) and the actual property e from configuration space E. Thus, perception for the observer is essentially an inference process—a form of educated guessing. The formal theory of observer perception and notation can therefore be seen as a generalization of Bayesian decision theory [8], commonly used in visual scene recognition [10,11]. Suppose we have an input image im from the set of images X (im ∈ X) and an observer decision wf about wildfire presence on this image from the set S with positive detection (wf ∈ S). The task is to estimate the detection probability p(wf|im). In [5], it was shown that this probability can be estimated using Bayesian theory and cogent confabulation theory [12,13].
Automatic video-based wildfire surveillance systems are typically organized as two-level observers [9]. The low-level observer uses the real 3-D space as configuration space X and the video sequence as observation space Y; a wildfire is a configuration event E, and a video sequence with wildfire is observation event V. The high-level observer takes the video sequence Y as configuration space and individual images as observation space Z; a wildfire video sequence is observation event V, and the set of alarm images is observation event S. In human-based surveillance, the human observer acts as both low- and high-level observer. In human video-based surveillance, the human is only the high-level observer, while the low-level role is performed by a technical system with remotely controlled cameras. In automatic surveillance, both roles are technical. Typically, the camera rotates through preset positions, capturing a sequence for the low-level observer, which is then broken into frames for the high-level observer to evaluate. Its task is to determine whether early-stage wildfire smoke appears and whether p(wf/im) is high enough to indicate a real wildfire. A key issue for any decision-based process is evaluation: How effective is an automatic wildfire detection system? How can we determine whether one system is better than another? These questions are addressed in the next section, with emphasis on the criteria and datasets required for meaningful evaluation.
3. Wildfire Detection Evaluation, Validation and Testing
Assessing the quality of any system begins with evaluating its effectiveness, which is ultimately guided by a central question: How well does the system perform with respect to its intended task? In the context of wildfire observers, performance can be examined from multiple perspectives, each highlighting a different aspect of system capability. Among these, two perspectives are particularly important:
- Processing level, which focuses on time and space efficiency. A system performs better if it operates faster, requires less processing time and hardware, uses less disk space, and consumes less energy (i.e., is a “green” system).
- Detection level, which focuses on detection results. A system performs better if it achieves a high percentage of correct detections and correct non-detections, while keeping the percentage of missed detections and false detections low. This level of evaluation usually requires a ground-truth database, where a reference observer—typically a human—performs the same detection task to generate the benchmark dataset.
In this section we will focus primarily on the detection level evaluation. According to observer theory, we have two spaces: the configuration space X that includes all events e corresponding to real fires E, and the observation space Y that includes all events s corresponding to observer positive fire detection S. In vision-based systems, E is a subset of the input images X, and S is the subset of the processed images Y. As mentioned earlier, four situations are possible, as shown in the confusion matrix and Venn diagrams presented in Figure 4.
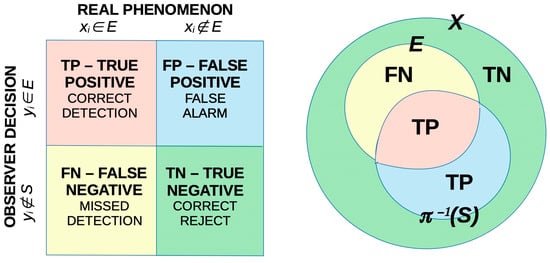
Figure 4.
Confusion matrix and Venn diagram of four possible situations: TP–True Positive when the observer correctly recognize the wildfire on the image, FP–False Positive recognize the wildfire, but the real wildfire does not exist, FN–False Negative fails to recognize the wildfire and TN–True Negative correctly recognizes that there is not a wildfire.
To introduce automatic wildfire observer evaluation measures, we first define the reference observer, which is usually a human observer. The results of his observations are considered as the reference or ground truth. This approach is known as the empirical discrepancy method and is commonly used in image segmentation evaluation [14]. We suppose that the set of ground truth images is equal to the set E of input images with real fire.
Wildfire observer evaluation could be performed on various levels [15]:
- Global binary evaluation of the observer on a series of test images, where the observer is considered as a simple binary classifier for each image, determining whether wildfire is present or not present, regardless of its location on the image. In this evaluation, the ground truth set consists of images divided into two simple subsets. One includes images where wildfire is present (set E), and the other includes images where wildfire is not present (set complement EC).
- Local evaluation at the image level, where the goal is to assess whether the observer correctly identifies the location of wildfire indicators, typically smoke in the early stages of a fire, and accurately recognizes the pixels where smoke is present on the image. For this evaluation, the ground truth images should be manually segmented, in the simplest case into two binary regions: areas where smoke is present and areas where smoke is not. The set E now includes smoke pixels, while its complement EC includes all other no-smoke pixels. Since smoke at its boundary areas is a semi-transparent phenomenon, fuzzy evaluation has also been proposed, where the smoke is segmented as a fuzzy set with increasing membership degrees from 0 to 1 [16].
- Global comprehensive evaluation of the observer based on local evaluation measures, where each image is first evaluated locally, and then, based on all locally evaluated images, the global evaluation of the observer is determined. Each image has its own evaluation values, based on which the global evaluation of the observer is made. In this case, graphical representations are particularly useful.
Using the confusion matrix and the sets TP, FP, FN, and FP, the binary classification model defines various metrics that can be applied to evaluate wildfire observer. They are summarized in Table 1 [16,17,18,19].

Table 1.
Wildfire observer evaluation metrics.
In the global binary evaluation sets, TP, FP, FN and FP are obtained from the ground truth input image set (E ⊂ X) and the output decision image set (S ⊂ Y). For example, if one image im from the input image set really has a fire, it belongs to the set E. If the observer has detected the fire on this image, it will be in the output set S with positive detections, then this image im belongs to the set TP. Similar reasoning occurs for the other three possible situations. In the local evaluation, the only difference is that only one image is analyzed, and each pixel of that image is assigned to a wildfire or a no-wildfire class. If a given pixel is classified as wildfire in the ground-truth image, then it belongs to the set TP.
There is still discussion and debate about which measure, and name can be used to better express the evaluation of a binary classifier: Sensitivity and Specificity or Precision and Recall [17]. As a cumulative measure, usually F1 Score and Mathews Correlation Coefficients are used.
Of special importance in binary classification evaluation are Sensitivity and Specificity. These have been used since World War II by radar engineers for the estimation of the quality of detection of enemy objects in battlefields by ROC (Receiver Operating Characteristics) space [19]. The ordinate axis of the ROC plot is True Positive Rate (Sensitivity) and the abscise axis is False Positive Rate (1–Specificity). In the global binary evaluation, one point in the ROC space is assigned to a specific observer. Figure 5 shows various observers. In the local evaluation, one point in the ROC space corresponds to one image evaluating all its pixels, and the performance of the whole observer (global comprehensive evaluation) could be represented by an ROC curve, as Figure 5 (right) shows. Images are arranged according to increasing values of TPR and FPR.
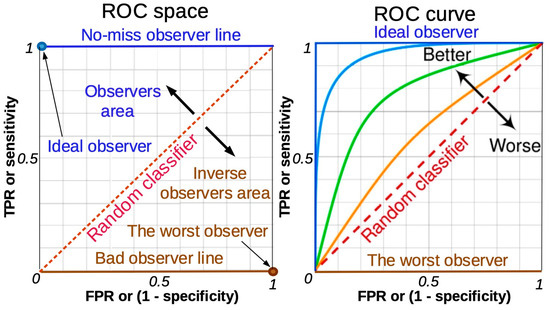
Figure 5.
The ROC (Receiver Operating Characteristics) space (on the left) is often used to evaluate the overall observer performance. The observer is represented as a point in ROC space. The ideal observer is a point in the left upper corner because all real wildfires are recognized (no missed detections), and there are no false alarms. The worst observer is a point in the right bottom corner because all real wildfires were missed detections, and all no-wildfire images were recognized as false detections. The representing point for a good observer must be in the upper triangle above the random guess line. The ROC curve (on the right) is used to evaluate an observer based on all the pixels of each image. One point corresponds to one image, and images are arranged according to increasing values of TPR and FPR. The result is the ROC curve. The ideal observer is an ideal classifier that has correctly classified all pixels on all images. An observer is better if the ROC curve is closer to the ideal observer curve.
An ideal observer, or perfect classifier, achieves a true positive rate (TPR) of 1 and a false positive rate (FPR) of 0 across all test images. In contrast, the diagonal of the ROC space represents the performance of a random classifier, while the ROC curve of a real observer typically lies between these two extremes. A common metric associated with ROC curves is the Area Under the Curve (AUC). This value provides a single-number summary of the performance, with higher AUC scores indicating better classifier quality. An ideal observer achieves AUC = 1, while a random classifier yields AUC = 0.5.
For a more comprehensive global evaluation, ROC curves are often complemented by observer quality graphs. In these graphs, individual performance measures are calculated for each test image and then plotted in ascending order, providing a more detailed view of how the system performs across the entire dataset [16].
Alternative graphical representations of detection task performances are as follows:
- Precision–Recall Graph, which shows the tradeoff between precision and recall for different thresholds. It is often used in situations where classes are heavily imbalanced [20]. It summarizes the trade-off between precision (how many of the detected smoke regions are correct) and recall (how much of the actual smoke is detected). As a single measure, Average Precision (AP) is used. AP refers to the area under the Precision–Recall curve for a single class (e.g., “smoke”). In practice, AP is usually computed using interpolated precision values at specific recall thresholds (e.g., every 0.1 from 0 to 1). Another single measure connected with the Precision–Recall Graph is mean Average Precision (mAP). In single-class problems like smoke detection, mAP is used to average AP over multiple IoU (Intersection-over-Union) thresholds. It provides a single number summarizing overall detection performance.
- DET (Detection Error Tradeoff) curve [21], which emphasizes the trade-off between two error types: false detection rate and missed detection rate [20].
- DER (Detection Evaluation Radar Graph) considers several measures in the form of a radar graph [22]. Typical measures are True Positive Rate, True Negative Rate, Accuracy, Positive Predictive Value, True Negative Accuracy, (MCC + 1)/2.
- Gain and Lift Charts, which show visually how much the observer (classifier) is better than random guessing (the baseline) [23].
- A confusion Matrix Heatmap, which visually represents the distribution of actual and predicted classes. In the confusion matrix (Figure 4—left), values of TP, FP, FN, TN are added and colored to visualize the classificatory quality.
- Kolmogornov–Smirnov (KS) test graphically shows the maximum difference between the cumulative distributions of positive and negative classifications. ROC AUC score has values between 0.5 and 1, while the KS test ranges from 0.0 to 1.0, therefore some researchers suggest that the KS test is more appropriate for binary classificatory evaluation [24].
- Histogram of Predicted Scores compares distributions of classifier scores for positive and negative classes and offers intuitive visualization of score separation between classes. These are related to the ROC curve. A good classifier has well separated positive and negative histograms [25].
For any type of wildfire observer evaluation, a ground truth database is essential. Table 2 shows available datasets for either fire smoke or flame detection in natural landscapes and urban/rural surroundings.
Table 2.
Image Datasets concerning wildfires in natural landscape and fires in rural/urban environments.
4. Current Approaches to Wildfire Detection
This Section presents a review of existing automatic video-based wildfire surveillance systems with an emphasis on wildfire detection principles and algorithms.
In this work, we primarily focus on terrestrial video surveillance systems. These systems offer 24/7 monitoring solution, serving as a robust alternative to human observers by centralizing monitoring efforts and mitigating the hazards associated with remote personnel deployments. In addition to this approach, airborne monitoring, using unmanned and manned aircraft, is also considered. Indeed, algorithms for detecting early signs of fire often can be applied to both ground-based and aerial platforms. Systems utilizing aerial surveillance, particularly those based on unmanned drones, demonstrate significant potential due to their flexibility, as they can be deployed to any location without the need for complex infrastructure or costly equipment installation. The main limitation of drones is their limited flight time, which poses a challenge for continuous surveillance of large areas. Achieving 24/7 coverage through the whole year would require a substantial number of drones even for a limited area. It would also require installation of a number of recharging stations, which again introduces additional complexity and equipment installation and maintenance costs in remote harsh environments.
Satellite-based systems offer a promising avenue for large-scale surveillance due to their extensive coverage capabilities and ability to monitor vast and remote forested areas without the need for ground infrastructure or even the presence of human personnel in the region. These systems also face limitations, primarily related to their spatial and temporal resolution and the obscuring effects of cloud cover, which can hinder continuous and immediate fire detection. Moreover, the revisit time of many satellites may span over several hours or even days. However, recent advancements in this field, such as deployment of satellite constellations with many units, like Google FirSat or OroraTech Forest satellites, promise to mitigate these limitations. Table 3 compares existing and planned satellites dedicated to wildfire detection. As this technology matures, satellite-based remote sensing could play an increasingly important role in wildfire surveillance and management.
Table 3.
Comparison of existing and planned satellites specially designed for wildfire detection.
While ground-based video systems remain the foremost approach for wildfire surveillance, the future of wildfire management will rely on the integration of diverse technologies and data sources, including aerial and satellite platforms, along with advanced data analytics. This approach is expected to enhance early detection capabilities, reduce false alarm rates, and ensure more efficient response and fire management strategies.
In a video-based system, surveillance cameras strategically placed at high vantage points enable the substitution of human observers in remote and hard-to-reach locations with remote video presence. Early camera-based systems were not fully automated and still relied on human surveillance [4,5]. These systems transmitted a video signal from cameras to an operating center, where a human operator can monitor multiple cameras to detect fires. This allows a single human observer to monitor a wider area [4], while not being bothered or distracted by the weather conditions at the observation point. Advances in computer vision enabled automated analysis of images and videos captured by cameras to detect fire in real time [3,4,5]. These algorithms try to mimic human reasoning and detect early signs of a forest fire, which are usually preceded by smoke plumes during the day [4,26,27] and visible fire light during the night [4,28]. These systems still rely on human judgement, as an operator must verify the alarms raised by the system [26]. They can be broadly divided based on type of cameras and detection algorithms.
4.1. Camera Types Used in Automatic Video-Based Wildfire Surveillance Systems
In most applications, cameras sensitive to the visible and near-infrared spectrum are used. These cameras detect radiation within the visible (380–750 nm) and near infrared (NIR: 750–1400 nm) spectral bands, where the radiation has its source in the thermal energy emitted by the fire, or reflected sunlight from the smoke plumes [5,26,29,30]. Detection algorithms are usually focused on detecting smoke as a visible sign of wildfire during the daytime, especially from long distances, as flames are usually not visible from cameras mounted on forest watch towers unless the fire is very close [26]. During the night, cameras operate in the near-infrared spectra. The detection algorithm is focused on detecting visible light scattered from the fire [28].
In practice, systems with thermal cameras are also used. They detect radiation within the mid-wavelength infrared (MWIR: 3–8 μm) and the long-wave infrared (LWIR: 8–15 μm) spectral bands. Infrared cameras offer advantages over visible spectra cameras in fire detection [31] as they can capture heat signatures, allowing them to capture the rise in temperature [26] caused by fires, even in low-visibility conditions, like smoke, fog, and at night. These systems are typically focused on detecting hot spots.
Key differences between visible spectra and the infrared spectra-based detection include detection method: while algorithms based on infrared cameras can directly detect the rise in temperature associated with fire [26], a visual spectra-based system relies on detecting smoke [4] as the first visible sign of fire at greater distance. While this advantage boosts the performance of infrared systems, it can also lead to their main limitation. In rugged terrain with several smaller and higher hills, it is almost impossible to view the flames of a wildfire from a camera, unless the fire is very near [26,32], while the smoke rising from a fire is usually visible from long distances [4,30]. As smoke particles relatively quickly disperse and cool in the atmosphere, the contrast between the smoke and the surrounding air is not sufficient for detection. Figure 6 shows a scene captured by a dual camera with separate recording of the visible spectrum and the long-wave infrared spectrum.
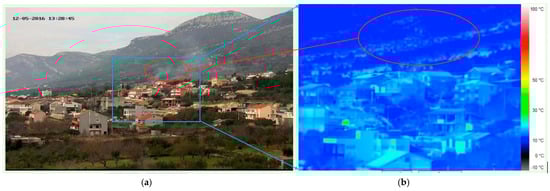
Figure 6.
Smoke visibility in (a) visible spectra and (b) far IR spectra. IR image correspond to blue rectangle on image in visible spectra. Smoke could be easily recognized in visible image (marked red), but not in IR image. (photos from authors archive collected during research on HOLISTIC project [33], location Kaštel Gomilica, Croatia, both images were captured in the same moment 13:28:45 on 12 May 2016).
Images were taken by the experimental dual spectra wildfire surveillance system implemented in Split, Dalmatia County, Croatia, during the HOLISTIC project [33] in the same moment 13:28:45. The visible spectra image shows smoke clearly, but it could not be seen in the infrared image. Although it was May, the temperature of the smoke compared to the surrounding air is not high enough for the infrared camera to record a significant and detectable difference. In the summertime, the situation is even worse. If the ignition point could not be seen directly, the IR camera could not detect the fire smoke. In addition, infrared spectra cameras are significantly more expensive than visible spectra cameras [32,34]. Furthermore, these systems usually need an additional visible spectra camera for distant video presence and incident confirmation [35].
4.2. Detection Algorithms in Automatic Video-Based Wildfire Surveillance Systems
Wildfire detection algorithms can be divided into two broad sets based on the approach to wildfire detection:
- Classic, traditional algorithms based on standard image processing and analysis techniques.
- Newer algorithms based on machine learning and deep learning techniques.
Classic algorithms rely on a set of manually selected features, like the color or the texture of smoke or flames and classify a pixel as fire or not-fire based on a set of rules extracted from available examples [32]. Newer algorithms use machine learning and deep learning techniques to automatically extract features and classify image regions as fire or not-fire based on training on a large set of available examples [27].
4.2.1. Classic Algorithms
Most classic algorithms for wildfire detection in the visible spectra rely on detecting smoke plumes during the day and fire flames during the night. Smoke detection is particularly important for daytime early warning systems because it is usually visible before flames and can be detected from a long distance due to its diffusion characteristics [36]. A daytime smoke detection algorithm can consist of multiple sub-algorithms focused on different manually selected low and mid-level features [26]. In general, the detection of slow-moving objects represents the initial step in smoke detection for most forest fire detection systems [3,4,5,26,32,37]. Candidate detections are then further evaluated to discard non-smoke, like moving objects. A histogram-based smoke segmentation algorithm across different color spaces is proposed in [27]. A nonlinear transformation of the HSI color space is proposed to enhance the separability between smoke and non-smoke pixels. Local histogram features are used in [30], followed by a post-processing algorithm that fuses meteorological data and a voting-based strategy to decide on raising an alarm or not. In [3] slow moving object detection is followed by rising object detection to identify rising smoke plumes. Gray region detection is used to detect smoke, and shadow detection is used to reduce false alarms. A decision fusion framework for wildfire detection is proposed in [26]. Five sub-algorithms are used to detect smoke plumes: slow-moving object detection, smoke-colored region segmentation, wavelet-transform region smoothness detection, shadow elimination and covariance-matrix classification with a decision function, followed by an adaptive decision fusion and a weight update algorithm, where the weight of sub-algorithms evolve over time based on feedback from the system operator. The algorithm proposed in [37] relies on motion detection and visual and shape features, wavelet transform and statistical modeling to detect long-range wildfire smoke. The authors propose a virtual environment for synthetic smoke sequence generation to enrich the available images used to train wildfire detection systems. The wildfire smoke detection algorithm, proposed in [38], identifies candidate blocks using key-frame differences, followed by the extraction of a histogram of gradients as a spatial feature and a histogram of optical flow as a temporal feature. Finally, a random forest classifier is used to detect smoke using an extracted bag-of-features.
Nighttime detection is generally considered easier to perform, as the glow and flicker of flames produce a high contrast to the unenlightened landscape [30]. Like smoke detection, most algorithms use adaptive background subtraction as the first step to avoid false alarms in illuminated areas of the image [4,28]. The night mode detection proposed in [28] uses a combination of flame color characteristics and flame flicker features to detect flames and a spatial–temporal filter to reduce false positives. A special night mode for wildfire detection is used in [4], based on motion detection and fire glow color segmentation. The mode of detection (day or night) is automatically selected based on intra-frame color characteristics.
4.2.2. Machine Learning and Deep Learning Based Algorithms
Advancements in computational power, especially the availability of General-Purpose Graphics Processing Units (GPGPU), have boosted the application of deep learning models for a broad range of practical detection problems, including wildfire detection. Deep learning approaches offer the advantage of automatically learning complex features from raw data, enabling more accurate and robust detection [39], offering end-to-end learning without the need for manual feature extraction [40]. Instead of extracting features manually, deep neural networks automatically obtain relevant features from the training dataset, introducing non-linearity in the decision process, which avoids the limitations of manual feature extraction. Besides the computational power necessary to efficiently train complex neural networks, another important prerequisite for the implementation of deep learning is the availability of a large dataset with real-life examples of the sought-after phenomenon.
An early attempt to apply a Convolutional Neural Network (CNN) to smoke detection problem proposed a method that can automatically learn features from original images [41]. The dataset used in this study comprises smoke and non-smoke images, manually captured from cameras, or sourced from the internet. Smoke images used as positive examples contain smoke covering a large part of the image, while negative samples include plants, buildings, cars, etc.; thus, images in the set are easily distinguishable by a human. A fire detection CNN architecture based on pretrained AlexNet architecture is proposed in [42], with transfer learning used to overcome the limitation of the available training data. A similar approach is used in [43], where a method for fire detection based on transfer learning on top of VGG16 and ResNet50 is proposed. A system that combines deep learning and a Hidden Markov Model is proposed in [44]. The proposed method introduces an “unstable” status between “normal” and “alert” state, which is further evaluated to reduce the false alarm rate. While these methods represent a significant step in addressing the shortcomings of traditional approaches, they cannot be directly used for wildfire detection as they focus on recognizing clearly visible smoke, or open fire at relatively short distances from the camera.
In [45], two different approaches are compared: (a) a single CNN model trained to detect wildfire regardless of daytime or nighttime and (b) two separate CNN models trained for daytime and nighttime detection. The authors found that separate models achieve almost 8% higher precision than the unified model CNN. A lightweight CNN model for real-time fire and smoke detection is proposed in [46], designed to reduce computational cost and provide a memory-efficient detection algorithm suitable for low-resource hardware. The dataset used is based on data previously used in [47] and Unmanned Aerial Vehicle (UAV) images of wildfires collected by the authors, categorized into four classes: (1) smoke-free, (2) smoke, (3) smoke-free with fog and (4) smoke with fog. A feature enhancement technique based on fusion of deep and shallow features is proposed in [48], with an attention mechanism introduced to focus on key details of fused features. Transfer learning is used to avoid overfitting and reduce time costs.
The shortcomings of available datasets for early wildfire detection are reconsidered and a new wildfire detection dataset with high generalization levels for various forest environments, seasons, time of a day and distances is presented in [49]. A hierarchical domain-adaptive learning framework is proposed in [50], utilizing a dual-dataset approach integrating both non-forest and forest-specific datasets to train a model adept at handling diverse wildfire scenarios. A custom dataset compiled from images sourced from different public datasets is used in [51], with visibility filtering based on classifying different levels of visibility introduced to improve machine learning performance in early wildfire detection. To address the class-imbalance problem, i.e., the dominance of images that do not contain visible signs of wildfire, a method based on multi-resolution ResNet-18 features and a Kernel Extreme Learning Machine (KELM) is proposed in [52]. The SHapley Additive exPlanations (SHAP) technique is used to understand the contribution of individual features to prediction outcome.
A wide group of wildfire detection methods is based on the You Only Look Once (YOLO) algorithm and its variants [53]. The YOLO algorithm reframes object detection as a unified regression problem. An image is divided into a grid of sub-images and, for each sub-image, bounding boxes and confidence values representing the probability that the denoted object belongs to a certain class are predicted. A single pass through the image straight from image pixels to bounding box coordinates and class probabilities is required for global reasoning about all objects in the image. High average precision and only one pass through the image, resulting in efficiency suitable for real-time applications, make the YOLO algorithm suitable for application in numerous computer vision problems, including wildfire detection. The YOLO algorithm constantly evolves, achieving better accuracy, speed and efficiency with its latest version YOLOv11 [54].
An overview of methods based on the YOLO algorithm and its versions is given in Table 4. In each row of the table, the version of the YOLO algorithm on which the method is based, and specifics of the proposed approach are given, followed by the dataset on which the algorithm was trained and evaluated, and the evaluation results reported by the authors. Examination of the table shows that it is very difficult to directly compare the proposed approaches and reported results. Part of the problem lies in the fact that almost every piece research uses a different dataset and/or a different way of calculating the evaluation metric. In addition to this, the problem lies in the very goal that the authors set for the proposed algorithm: while in some works the algorithm is trained to detect class “smoke”, in others there are the classes “smoke” and “fire” [55], or “smoke” and “big smoke” [56]. By further examination of the sample images from the dataset used in different papers, it can be seen that the smoke samples differ significantly from set to set: while in some datasets the smoke and fire are clearly visible, in other datasets the sample images contain smoke at great distances and in poor visibility conditions, which is, in some cases, difficult even for a human to detect [57]. Detecting small targets and semi-obscured smoke at greater distances poses a major challenge for algorithms [58], which limits their application for fire detection in the earliest stages.
Some of the proposed approaches concentrate on detecting wildfire in a ground-based surveillance system, while other are adopted in detecting and localizing smoke and wildfires in both ground and aerial images [59]. Application of complex YOLO architectures on limited-resource hardware, used in drone-based aerial surveillance, requires additional model size reduction techniques to reduce computational costs and increase the processing speed. Lightweight algorithms have been proposed, addressing the challenges of complex fire scenarios and limited computational resources, enhancing the generalization and robustness of fire detection [58]. Introducing the lightweight module in YOLOv11n architecture proposed in [60] results in a 53.2% reduction in the number of model parameters and a 28.6% reduction in FLOPs (floating-point operations, a measure of computational cost) compared to the original YOLOv11n model, while increasing the mean average precision by 2.24%.
An in-depth analysis of different versions of the YOLO architecture, namely YOLOv5, YOLOv6, YOLOv7, YOLOv8 and YOLO-NAS, for smoke and wildfire detection is given in [61]. The authors focus on the detection of wildfire in its early stage, which is critical for efficient response and mitigation efforts. The research concludes that no single YOLO architecture excels in all aspects of wildfire detection, highlighting the trade-off between precision and recall and the challenges of accurately detecting wildfire.
These methods are now commonly used in wildfire detection, offering an end-to-end learning that automates the process of feature extraction and learning distinguishing characteristics [40]. Instead of extracting features manually, deep neural networks automatically obtain relevant features from the training dataset, introducing non-linearity in the decision process, which avoids the limitations and singularity of manual feature extraction. Instead of extracting features manually, the deep learning approach automatically obtains smoke features from the training datasets by exploiting a series of convolution and pooling operations, which avoids the limitations and singularity of manual feature extraction and can get a complete description of wildfire smoke [39,62].
Evaluation of potential improvements in a traditional rule-based system for wildfire detection using a deep learning approach is presented in [63]. The research is focused on improving the performance of the CICLOPE wildfire surveillance system [64,65] based on tower-mounted cameras, covering over 2,700,000 hectares of wildland in Portugal. The authors point out a high false alarm rate of the traditional rule-based detection algorithm and propose a deep learning-based model as a secondary confirmation layer to further refine the candidate alarms reported by the rule-based system. The research combines a transfer-learning approach and a training custom model from scratch, producing filters that better identify specific features of the smoke. Finally, a Dual-Channel CNN is proposed that combines transfer learning based on the pretrained DenseNet and the originally developed Spatial and Channel Attention Modularized CNN (SCAM-SCNN) architecture. Evaluation results show that the proposed Dual-Channel model outperforms both approaches if used individually. The authors also found that model robustness can be improved using a time-of-day-based decision boundary, as false alarms more frequently occur in the early morning hours. Different labeling strategies have been evaluated, comparing binary detection (“smoke” and “no-smoke” classes) vs. multi-class classification (“smoke”, “clouds and fog” and “fields and forests” classes), suggesting that binary classification achieves better performance, as multi-class models are forced to learn specific features required to detect additional classes, thus reducing the model’s ability to detect smoke. The main contribution of this research is the integration of a rule-based detection algorithm with a posterior Deep Learning model, thus reducing the need for complex calculations required by CNN, while achieving high prediction accuracy.
Table 4.
An overview of wildfire detection methods based on the YOLO algorithm.
Table 4.
An overview of wildfire detection methods based on the YOLO algorithm.
| Evaluation * | Dataset | Algorithm Specifications | YOLO Type |
|---|---|---|---|
| AP: 71.0 F1: 70.0 | 139 video sequences from operational wildfire surveillance system, annotated by the authors | Multichannel images based on temporal and contextual information, detection, small fire detection on low quality images [57] | YOLOv5 2023 |
| mAP: 70.9 F1: 68.0 | 21,136 images derived from public datasets and online sources, contains forest, indoor, urban, and traffic fires | Integration of separable vision transformer block in the final layer of the backbone network, depthwise and pointwise self-attention mechanism [58] | YOLOv5 2022 |
| mAP: YOLOv5: 93.5 YOLOv6: 83.9 YOLOv8: 91.0 | Custom-assembled data set containing images collected from various Internet platforms and online datasets | Evaluation of different YOLO models on a diverse image dataset representing different wildfire cases [66] | YOLOv5 YOLOv6 YOLOv8 2024 |
| ACC: 90.1 R (TPR): 96.1 P (PPV): 93.6 F1: 94.8 | 14,400 images collected and annotated by the authors | Reduced model size, multiscale feature extraction for small object detection, coordinated attention mechanism to focus model on regions where detections are more likely [67] | YOLOv5 2022 |
| ACC: 96.0 R (TPR): 97.86 P (PPV): 94.61 F1: 95.94 | 4398 images collected and annotated by the authors | A new auto-annotation scheme proposed based on the edge detection, new wildfire dataset [68] | YOLOv5 2023 |
| smoke: AP: 8.8; R(TPR): 10.0; P(PPV): 29.0 big smoke: AP: 81.0; R(TPR): 80.0; P(PPV): 91.0 | Wildfire smoke dataset [69], Boreal Forest fire data; annotated as “smoke” and “big smoke” classes | Transfer learning, freezing backbone layers. Smoke-based wildfire detection in boreal forests [56] | YOLOv5 2023 |
| smoke: AP: 94.3 fire: AP: 76.5 | Aerial flame dataset collected from different YouTube videos, FLAME2 dataset [70], annotated as “smoke” and “fire” | Transfer learning applied in two phases: feature extraction and fine-tuning, varying number of frozen layers in backbone and neck of the YOLOv5 model [55] | YOLOv5 2024 |
| mAP: 91.6 P (PPV): 89.7 R (TPR): 84.6 | Created from publicly available images, containing forest fire images, small fires, smoke patterns and fire spread images | Introducing lightweight modules to enhance contextual understanding with reduced computational overhead, optimized for edge deployment [60] | YOLOv11n 2025 |
| mAP: 71.62 R (TPR): 96.31 P (PPV): 3.39 F1: 6.55 | Data from aerial, infrared and webcam sources, annotated as “smoke” and “fire” classes | YOLO-NAS architecture with ADAM/ADAMW optimizer, data integration from diverse sources (aerial, infrared, satellite, webcam) [71] | YOLO-NAS 2024 |
| mAP: 86.8 R (TPR: 82.1 P (PPV): 87.6 F1: 84.8 | Fire and smoke dataset, 9796 images taken in various conditions, perspectives, and distances. | Hyperparameter tuning, one-factor-at-a-time analysis of individual parameter contribution to model accuracy [72] | YOLOv8 2024 |
| D-Fire: mAP: YOLOv5: 79.5 YOLOv7: 80.4 YOLOv8: 79.7 WSDY mAP: YOLOv5: 95.9 YOLOv7: 96.0 YOLOv8: 98.1 | D-Fire dataset [73] 21,527 images (only fire, smoke, smoke and fire, no fire or smoke categories), WSDY dataset [74] 737 smoke images | Evaluation of different YOLO models for detecting and localizing smoke and wildfires [59] | YOLOv5 YOLOv7 YOLOv8 2024 |
| mAP: 95.19 R (TPR): 87.67 P (PPV): 91.37 | Dataset containing both real and synthetic smoke images [75], synthetic smoke images generated by inserting real or simulated smoke into forest backgrounds | Substituting Convolutional kernels with Omni-Dimensional Dynamic Convolution (ODOConv) multi-dimensional attention mechanism in the backbone of YOLOv8 model [76] | YOLOv8 2024 |
| mAP: 77.5 | Drone thermal imaging dataset, collected and annotated by the authors | Lightweight YOLOv8-based model for real-time wildfire detection on drone thermal images. Partially Decoupled Lightweight Convolution (PDP) and a Residual PDP block for reduced computational cost and improved feature processing efficiency [77] | YOLOv8 2025 |
* Evaluation measures: ACC—Accuracy, AP—Average Precision, mAP—mean Average Precision, P—Precision, PPV—Positive Predictive Value, R—Recall, TPR—True Positive Rate.
5. Integration of Wildfire Detection in Wildfire Monitoring and Surveillance Systems
As the frequency and severity of wildfires increase, the demand for early warning systems that are both accurate and operationally efficient becomes ever more critical. Among available technologies, automatic video-based wildfire surveillance systems offer significant advantages: continuous monitoring, early detection, automated alerts, and—particularly important—integration with other systems.
While stand-alone detection is valuable, the full potential of these systems is realized when they are embedded into a broader framework that includes Geographic Information Systems (GIS), real-time risk indices, fire spread simulation, and enhanced visualization tools, such as augmented reality (AR). Integration enables not only faster response but also more informed, strategic management of wildfire events. Recent reviews confirm that Web-GIS platforms are now widely recognized as critical components in natural hazard management, offering integrated spatial analysis, real-time monitoring, and decision-support functionalities.
In this context, the integrated wildfire management framework developed through the HOLISTIC [33] project exemplifies a state-of-the-art approach that combines automatic video-based wildfire detection, GIS-centric data management, high-resolution fire risk modeling, GIS-based fire spread simulation, AR-enhanced visual interfaces, and advanced Web-GIS user interfaces. Global best practices and comparable systems are discussed where relevant, providing context to highlight the novel contributions and high level of integration achieved in this approach.
5.1. GIS-Centric Architecture and System Integration
A central architectural element of modern wildfire management systems is the GIS platform, which serves as an integration backbone connecting diverse data sources, models, and user interfaces. In such frameworks, wildfire detection systems based on automatic video-based surveillance [5,9] are linked with spatial databases containing information on terrain, vegetation, meteorological conditions, and infrastructure.
The GIS-based architecture is usually organized as a modular system. Key architectural features include the following:
- Data ingestion modules acquiring video-based detection alerts, meteorological data, fuel moisture estimates, and remote sensing products.
- Processing modules implementing wildfire risk index calculations and fire spread simulations.
- Visualization modules based on OpenLayers and AR platforms, providing interactive map-based and video-enhanced interfaces.
- A centralized spatial database supporting dynamic updates and synchronized access to all data layers.
This architecture allows seamless integration of real-time observations, model outputs, and risk visualizations. Figure 7 shows an example of the integration of video-based monitoring and GIS-based architecture.
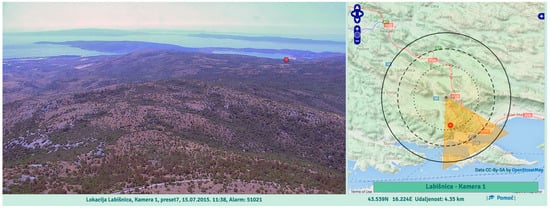
Figure 7.
Integration of video-based monitoring and GIS-based architecture in Croatian firefighter’s video surveillance system OIV Fire Detect AI. Integration is realized in both directions. Images are georeferenced. Clicking on any image pixel shows its location on the map (red circle) and, vice versa, when the camera is in manual mode, clicking on the map moves the camera by azimuth to position the clicked location in the center of the image. On GIS map black circles correspond to distance from camera (5 km, 7.5 km and 10 km). Orange circle section correspond to camera field of view. (photo and map are from author’s archive).
5.2. Integration of Fire Risk Indices
Wildfire risk mapping is a core function of any integrated system, supporting proactive preparedness and public awareness. Worldwide, indices such as FWI or Keetch–Byram are widely used, but increasingly these are being refined toward localized, dynamic, and operationally linked models [78].
The AdriaFireRisk index [79] exemplifies this evolution. Developed from the MIRIP concept [80], it integrates terrain, fuel types, infrastructure data and real-time meteorological inputs to produce micro location-scale assessments. It supports the following:
- Daily updates with full automation.
- Risk visualization via Web-GIS and public panels (AdriaFireRiskPanels).
- Specialized components for eruptive fire risk in steep terrains and fuel moisture modeling.
Because such indices are often spatially fine-grained and technically compatible with detection and simulation modules, they can support automated escalation procedures, targeted warnings, and dynamic operational planning within integrated wildfire management systems.
Recent studies illustrate how such integration is being operationalized at different scales. For example, the European FirEUrisk framework links fire danger, exposure, and vulnerability in a composite index to guide risk reduction and adaptation strategies under climate change [81]. In the United States, the Wildfire Hazard Potential (WHP) dataset provides 270 m resolution risk layers, supporting long-term fuel treatment planning and prioritization of high-risk areas [82]. In Germany, machine learning approaches such as Random Forest have been applied to produce monthly wildfire susceptibility maps with nearly 90% accuracy, combining meteorological, terrain, and vegetation data to support dynamic prevention planning [83]. Similarly, Bayesian network models have been employed in Mediterranean regions (e.g., Sicily) to integrate hazard, exposure, and vulnerability, offering probabilistic projections of wildfire risk evolution toward 2050 [84]. These examples demonstrate a clear trend toward risk indices that are not static but continuously updated, spatially detailed, and directly connected to monitoring and decision-support systems.
5.3. GIS-Based Fire Spread Simulation
Predictive simulation of wildfire spread is increasingly recognized as a critical component of integrated wildfire management systems [85]. While numerous modeling approaches exist (e.g., Rothermel-based models, cellular automata, CFD-based models), operational applicability depends on balancing model fidelity with computational efficiency and integration capabilities.
Fire spread simulation tools are increasingly designed to operate within GIS environments, enabling direct use of spatial data layers, such as terrain, vegetation, and infrastructure. In integrated wildfire management systems, such tools are expected to support real-time or near-real-time operation, as well as interoperability with detection and risk components.
A representative example of this approach is the fire spread simulation module developed within the HOLISTIC project [79], designed for integration with spatial databases and online interfaces. Its typical capabilities include the following:
- Remote execution on dedicated servers for rapid computation.
- Support for variable ignition sources, including both points and areas.
- Incorporation of wind influence adjusted for local topography.
- Optional modeling of suppression barriers or natural fire breaks.
- Generation of time-stepped perimeter outputs suitable for dynamic visualization.
This type of simulation capability can also be extended beyond individual fire events to support large-scale mapping of Propagation Potential, where standardized scenarios are used to quantify how different landscapes might sustain and propagate fire. Such analyses are increasingly applied to inform strategic land management, hazard exposure modeling, and long-term risk planning.
Contemporary research in this field also includes the latest advancements in the development of digital twins for wildfires, which integrate real-time detection systems (such as cameras and sensors) with wildfire spread simulation modules to forecast fire behavior and support decision-making [86].
5.4. Augmented Reality in Wildfire Surveillance
Augmented Reality (AR) tools are increasingly explored in wildfire management as a means of enhancing situational awareness by combining live video surveillance with spatial data. These technologies enable operators to better understand the position and dynamics of fire events by embedding geospatial context directly within visual feeds.
A common approach involves the use of virtual terrain models to align live video streams with 3D representations of the environment. When camera parameters are calibrated, each pixel in the video can be geolocated, enabling functionalities such as the following:
- Estimation of smoke plume dimensions and distances.
- Overlay of map features—such as infrastructure, topography, or danger zones—onto video.
- Real-time visualization of fire perimeters in the camera’s field of view.
Such AR-enhanced interfaces offer an intuitive bridge between sensor input and spatial analysis, contributing to faster interpretation and improved decision-making in time-critical wildfire scenarios.
Examples of practical AR direct implementation in a ground-based wildfire surveillance system, connected with GIS and a cloud network, are described in [15]. The authors highlight the AR interface, which displays toponyms, coordinates, and elevations directly over the video feed, as well as the automatic adjustment of detection parameters at specific locations [87]. Augmented Reality and Mixed Reality have found a particular role in wildfire prevention and detection using UAVs [88,89].
5.5. Web-Based Interface for Integrated Wildfire Monitoring
An integrated wildfire management system is only effective if its outputs are readily accessible and actionable by operators. Modern Web-GIS interfaces serve this purpose by providing a centralized platform that consolidates diverse data streams and analytical tools within a single environment.
Typical functionalities include the following:
- Monitoring of live surveillance feeds and automated detection alerts.
- Visualization of current wildfire risk levels and simulated fire spread outputs.
- Interactive tools for initiating simulations and adjusting scenario parameters.
- Display of supporting layers, such as weather conditions, terrain data, and system logs.
- Click-to-locate functionality, allowing operators to click on a video feed and instantly highlight the corresponding location on the map.
In well-integrated platforms, these components are not isolated modules but operate as interconnected services, supporting continuous updates and rapid transitions from detection to analysis and response. Compared to general-purpose mapping tools, such interfaces are optimized for time-sensitive decision-making, enabling emergency management teams to maintain situational awareness and coordinate resources more effectively.
5.6. Summary and Outlook
The integration of automatic wildfire detection with geospatial analysis, predictive modeling, and advanced visualization tools reflects current trends in modern wildfire management. When combined in a cohesive system, these components enable continuous environmental monitoring, timely detection, and informed decision-making based on spatially and temporally relevant data.
Key elements of such integrated frameworks typically include the following:
- Modular architectures centered on GIS platforms.
- Fine-resolution, dynamically updated fire danger indices.
- Predictive fire spread simulations calibrated to local terrain and conditions.
- Augmented visual interfaces that link video surveillance with spatial context.
- Interactive web-based dashboards designed for operational use.
Ongoing development efforts in this domain aim to extend these capabilities further through enhancements such as fuel moisture modeling, improved simulation algorithms, real-time georeferencing using mobile devices, and more immersive 3D visualization. These innovations support a proactive, data-driven approach to fire prevention and response, particularly relevant in the context of increasing fire risk driven by climate change and land use dynamics.
By leveraging integration at both technical and operational levels, wildfire management systems can move beyond isolated detection or modeling tools toward comprehensive, real-time support environments that assist in every stage of the decision-making process.
6. Gaps in Wildfire Monitoring and Surveillance
Terrestrial video-based monitoring systems have emerged as vital tools in wildfire surveillance and management. In addition to automatic detection and early warning, these systems offer real-time visual feeds that not only facilitate early detection but also enhance situational awareness and provide valuable information for guiding interventions.
However, despite their potential, significant gaps remain in the deployment, coverage, and effectiveness of terrestrial video systems in wildfire management. Challenges such as
- limited spatial coverage,
- environmental conditions affecting visibility,
- data processing limitations, and
- difficulties integrating with other monitoring platforms hinder their overall efficiency.
Addressing these limitations is crucial for maximizing the capabilities of terrestrial systems and ensuring timely, accurate wildfire detection.
Deploying terrestrial video-based wildfire monitoring systems in remote and inaccessible areas often incurs substantial costs. These arise from several factors, including the transportation of equipment—potentially requiring specialized vehicles or even aerial delivery, particularly in rugged terrain. Figure 8 shows an example of such an installation, where a video monitoring system was installed in Paklenica National Park on Velebit mountain, peak Crni vrh (1110 m), in Croatia, reachable only by air via helicopter transport or on foot using mountain trails with pack horses, requiring a 4.5-h ascent.
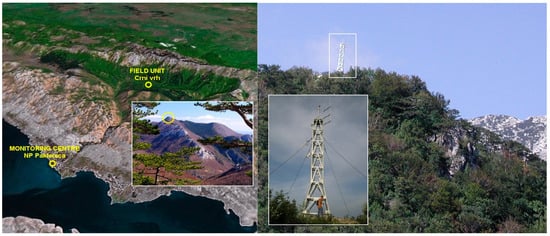
Figure 8.
Demanding installation of wildfire video monitoring tower on mounting Velebit peak Crni vrh (1110 m), reachable only by helicopter or by foot requiring a 4.5-h ascent (photos from author’s archive).
Establishing stable power sources, such as solar panels, wind turbines, batteries, or generators, in infrastructure-poor areas adds further expense. In addition to increased cost, these power sources can introduce maintenance challenges and potential safety risks, such as spontaneous combustion or enhanced fire spread if, for instance, a fuel tank is present on-site. The installation and upkeep of cameras and associated hardware in harsh environments require rugged equipment capable of withstanding extreme temperatures, high winds, and interference from vegetation, which further increases costs. For example, on the Crni vrh installation, a wind gust of 200 km/h has been recorded. Moreover, limited network connectivity in these regions necessitates advanced and costly data transmission solutions, such as satellite links.
In large, uninhabited forested regions, video-based wildfire detection faces the additional challenge of limited detection range—particularly when early-stage fire identification is critical. Fires originating outside a camera’s field of view may go unnoticed until they have grown substantially, reducing opportunities for early intervention. Visibility can also be impaired by thick vegetation, fog, smoke, or adverse weather conditions, further reducing the effectiveness of detection.
These limitations underscore the importance of a multi-layered monitoring strategy—integrating terrestrial systems with aerial and satellite surveillance—to ensure more comprehensive and effective wildfire detection across vast, uninhabited landscapes.
False alarms remain a major challenge in wildfire surveillance systems. These occur when the system misidentifies non-fire phenomena—such as cloud shadows, mountain shadows, weather effects, or light reflections—as wildfires. Figure 9 shows an example of false alarms that would be difficult to detect even for a human observer. A high rate of false alarms can erode trust in the system, lead to unnecessary deployment of resources, and delay responses to actual threats.
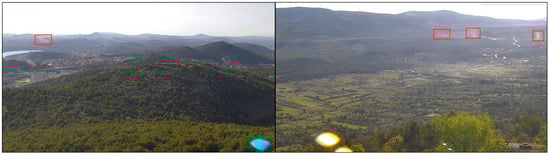
Figure 9.
False alarms marked by red boxes would be difficult to recognize even for a human observer because they look like real wildfire smoke (photos from author’s archive).
Recent advancements, particularly those leveraging deep learning techniques such as convolutional neural networks (CNNs), have shown promising results in reducing false alarms. CNNs excel in image and video analysis by automatically learning complex features and distinguishing patterns associated with fire and smoke, significantly improving detection accuracy. These models can more reliably differentiate true fire signatures from deceptive visual cues than traditional rule-based or simpler algorithms. The explanation can be found in the fact that neural network-based algorithms analyze the entire image simultaneously, whereas traditional algorithms based on digital image processing analyze the image piece by piece. Such segmented analysis would be challenging even for a human observer. Imagine an experiment in which a small rectangular hole is cut into a white sheet of paper and moved across the image, and each time the human observer is asked whether there is a wildfire in that small portion of the image. We are confident that even a human would make mistakes, most often by generating false alarms—identifying areas as wildfires when they are not.
Automatic detection tools, including those powered by CNNs, should be viewed as powerful enhancements to wildfire monitoring rather than replacements for human operators. These systems can deliver rapid alerts, process vast volumes of data, and improve detection accuracy, ultimately increasing safety and operational efficiency. Their primary function is to assist human decision-makers—reducing cognitive load, enabling early warnings, and minimizing false alarms. Final decision-making, however, must remain with trained human operators, who can evaluate context, assess alert credibility, and make informed judgments based on situational awareness and environmental understanding. This is why it is often emphasized that automatic video-based wildfire surveillance systems are essentially semi-automatic since the final decision is always made by a human. To facilitate this decision-making process, it is crucial that the wildfire surveillance system includes a powerful manual mode for remote video presence, allowing the operator to zoom in on the area where a potential alarm was triggered and determine whether it is indeed a wildfire or not.
In essence, automation should make wildfire surveillance safer, more effective, and more manageable—empowering humans to focus their expertise where it is most needed, while maintaining oversight and control of the response process.
7. Synthesis and Future Directions Including Emerging Technologies in Wildfire Monitoring and Surveillance
This review article highlights a significant evolution in wildfire detection and surveillance techniques, progressing from human-based observation methods to sophisticated, automated systems grounded in computer vision and formal perception theory. Historically, human observers stationed in fire lookout towers were responsible for identifying wildfire smoke and fire using only their natural sensors, primarily sight. While experienced observers had a high success rate, this method faced limitations including visibility issues and human fatigue, because observers are often working in challenging conditions.
The development of video-based surveillance improved the situation by relocating human observers to comfortable monitoring centers. However, the most recent advancement involves automatic wildfire detection using computer vision and artificial intelligence. These systems rely either on classical digital image processing and analysis methods or deep learning models to detect visual features like smoke patterns, enhancing the timeliness and accuracy of wildfire response.
A critical component of this advancement is the application of the formal theory of perception, which treats the detection system as an observer processing input data through a structured inference model. This approach helps quantify detection reliability using metrics such as True Positive, False Positive, False Negative, and True Negative. The observer model supports layered detection: a low-level observer processes raw video feeds, while a high-level observer interprets frames for final decision-making.
The article reviews modern approaches to wildfire detection, focusing on automatic video-based surveillance systems and their underlying technologies. In modern video-based systems two main camera types are used:
- Visible/NIR cameras: Detect smoke during the day and flame glow at night; effective for long-range smoke detection but limited in detecting heat.
- Infrared (IR) cameras: Detect heat (hotspots) and can work in low visibility; however, they are costly and less effective if the fire source is obscured, especially in summer when temperature contrast is low.
Concerning detection algorithms, the three categories dominate:
- Classic algorithms that rely on predefined visual features like color, motion, and texture to detect smoke or flames. They use handcrafted rules and often combine multiple sub-algorithms to reduce false alarms.
- Machine Learning (ML) and Deep Learning (DL) methods learn features directly from data, offering higher accuracy. CNNs, transfer learning, and attention mechanisms are widely used. These models require large, diverse datasets and computational resources. Many advanced ML methods now rely on YOLO (You Only Look Once) object detection algorithms due to their real-time efficiency. Newer YOLO variants (v5–v11) are adapted for wildfire detection using lightweight architectures, attention modules, and domain-adaptive learning. Datasets vary widely, making model comparisons difficult. A key challenge remains in detecting distant or low-visibility smoke.
- Hybrid Systems that combine classic detection based on digital image processing and analysis methods with deep learning refinement. They have proven effective, particularly in reducing false alarms and maintaining real-time capability.
While deep learning methods are advancing rapidly, challenges such as dataset variability, limited visibility, hardware constraints, and detection accuracy in early fire stages remain. Hybrid approaches and continuous evaluation are essential for robust wildfire detection systems.
Modern wildfire surveillance systems are increasingly integrating automatic video-based detection with GIS platforms, fire risk indices, fire spread simulations, augmented reality (AR), and web-based interfaces to provide a comprehensive, real-time decision-support environment. These integrated systems allow continuous monitoring, dynamic risk assessment, and predictive modeling, all accessible through centralized Web-GIS dashboards. GIS acts as the system’s backbone, linking video feeds, terrain data, meteorological inputs, and simulation tools. Fire risk indices and wildfire spread simulation models enable even greater operational flexibility of the system. AR enhances situational awareness by overlaying geospatial data on live video, and intuitive web interfaces allow operators to monitor, analyze, and respond more effectively. Such integration ensures faster, more strategic wildfire management in response to increasing climate and land use challenges.
This paper also highlights the limitations and challenges of terrestrial video-based wildfire surveillance systems. While these systems offer real-time monitoring and early warning capabilities, their effectiveness is hindered by limited coverage, environmental visibility issues, high installation and maintenance costs in remote areas, and susceptibility to false alarms. Difficult terrain often requires costly deployment via helicopter or pack animals, and maintaining stable power and data transmission adds complexity. Visibility problems and restricted camera fields of view can delay fire detection. False alarms—often indistinguishable even to humans—can undermine system trust. Advances like convolutional neural networks (CNNs) help reduce such errors, but human operators remain essential for final judgment. Despite the benefits of automation, human oversight remains vital, particularly in interpreting complex scenes and reducing false alarms. These systems are best used as semi-automatic aids, with manual video inspection tools necessary to confirm or dismiss alarms. Therefore, the future of wildfire surveillance lies in the integration of automated systems with human operators, and the expansion of these systems into broader ICT networks, including airborne systema, satellites, and multi-sensor platforms. In airborne systems, manned aircraft and unmanned aerial vehicles are used for fire detection and mapping [90]. Satellite-based monitoring systems cover large areas [91,92]. A multi-layered approach, integrating terrestrial, aerial, and satellite systems, is recommended for robust wildfire monitoring, as well as proactive strategies for mitigating and preventing wildfires [93].
Author Contributions
Conceptualization: D.S. and D.K.; methodology: M.B.; validation: L.Š.; investigation: D.K.; writing—original draft preparation: D.S., D.K., M.B. and L.Š.; writing—review and editing: D.S.; visualization: D.S.; supervision: M.B. All authors have read and agreed to the published version of the manuscript.
Funding
This research received no external funding, but certain photos and maps were captures and created during research on IPA Adriatic HOLISTIC project [33].
Conflicts of Interest
The authors declare no conflicts of interest.
Abbreviations
The following abbreviations are used in this manuscript:
| ACC | Accuracy |
| AP | Average Precision |
| AUC | Area Under the Curve |
| CNN | Convolutional Neural Network |
| FNR | False Negative Rate (Miss Rate) |
| FPR | False Positive Rate (Fallout) |
| F1 | F1 Score |
| GPGPU | General-Purpose Graphics Processing Units |
| GSConv | Ghost-Shuffle Convolution |
| JACC | Jaccard (Tanimoto Similarity) |
| LWIR | Long-wavelength Infrared |
| mAP | mean Average Precision |
| MCC | Matthews Correlation Coefficient |
| MWIR | Mid-wavelength Infrared |
| NIR | Near Infrared |
| R | Recall (True Positive Rate) |
| P | Precision (Positive Predictive Value) |
| PPV | Positive Predictive Value |
| ROC | Receiver Operating Characteristics |
| SCAM-SCNN | Spatial and Channel Attention Modularized CNN architecture |
| TNAC | True Negative Accuracy (Inverse Precision) |
| TNR | True Negative Rate (Specificity, Inverse Recall) |
| TPR | True Positive Rate (Sensitivity, Recall) |
| UAV | Unmanned Aerial Vehicle |
| YOLO | You Only Look Once (YOLO) algorithm |
References
- Rjoub, D.; Alsharoa, A.; Masadeh, A. Unmanned-Aircraft-System-Assisted Early Wildfire Detection with Air Quality Sensors. Electronics 2023, 12, 1239. [Google Scholar] [CrossRef]
- Ko, A.; Lee, N.M.Y.; Sham, R.P.S.; So, C.M.; Kwok, S.C.F. Intelligent Wireless Sensor Network for Wildfire Detection. WIT Trans. Ecol. Environ. 2012, 158, 137–148. [Google Scholar] [CrossRef]
- Töreyın, B.U.; Çetin, A.E. Wildfire Detection Using LMS Based Active Learning. In Proceedings of the IEEE International Conference on Acoustics Speech and Signal Processing, Taipei, Taiwan, 19–24 April 2009; p. 1461. [Google Scholar]
- Štula, M.; Krstinić, D.; Šerić, L. Intelligent Forest Fire Monitoring System. Inf. Syst. Front. 2011, 14, 725–739. [Google Scholar] [CrossRef]
- Stipaničev, D.; Šerić, L.; Braović, M.; Krstinić, D.; Jakovčević, T.; Štula, M.; Bugarić, M.; Maras, J. Vision Based Wildfire and Natural Risk Observers. In Proceedings of the 3rd International Conference on Image Processing Theory, Tools and Applications (IPTA), Istanbul, Turkey, 15–18 October 2012; pp. 37–42. [Google Scholar] [CrossRef]
- Lindsa, P.; Norman, D.A. Human Information Processing: An Introduction to Psychology; Academic Press: New York, NY, USA, 1972. [Google Scholar]
- Benett, B.M.; Hoffman, D.D.; Prakashi, C. Observer Mechanics—A Formal Theory of Perception; Public Domain; Academic Press Inc.: Cambridge, MA, USA, 1989. [Google Scholar]
- Benett, B.M.; Hoffman, D.D.; Prakashi, C.; Richman, S. Observer theory, Bayes theory, and psychophysics. In Perception as Bayesian Inference; Knill, D., Richards, W., Eds.; Cambridge University Press: Cambridge, UK, 1996; pp. 163–212. [Google Scholar]
- Stipaničev, D. Automatic Surveillance Methods. In Encyclopedia of Wildfires and Wildland-Urban Interface (WUI) Fires; Manzello, S.L., Ed.; Springer: Berlin/Heidelberg, Germany, 2019. [Google Scholar] [CrossRef]
- Benett, B.M.; Hoffman, D.D.; Prakashi, C. Perception and Evolution. In Perception and the Physical World: Psychological and Philosophical Issue in Perception; Heyer, D., Mausfeld, R., Eds.; John Wiley & Sons: Hoboken, NJ, USA, 2002; pp. 229–245. [Google Scholar]
- Yuille, A.L.; Bülthoff, H.H. Bayesian Decision Theory and Psychophysics. In Perception as Bayesian Inference; Knill, D., Richards, W., Eds.; Cambridge University Press: Cambridge, UK, 1996; pp. 163–212. [Google Scholar]
- Hecht-Nielsen, R. Cogent Confabulation. Neural Netw. 2005, 18, 111–115. [Google Scholar] [CrossRef] [PubMed]
- Hecht-Nielsen, R. The mechanism of Thought. In Proceedings of the 2006 IEEE International Joint Conference on Neural Network Proceedings, Vancouver, BC, Canada, 16–21 July 2006; pp. 419–426. [Google Scholar]
- Zhang, Y.J. A Survey of Evaluation Methods for Image Segmentation. Pattern Recognit. 1996, 29, 1335–1346. [Google Scholar] [CrossRef]
- Bodrožić, L.; Stipaničev, D.; Štula, M. Observer Network and Forest Fire Detection. Inf. Fusion 2011, 12, 160–175. [Google Scholar] [CrossRef]
- Jakovcevic, T.; Šerić, L.; Stipaničev, D.; Krstinić, D. Wildfire smoke-detection algorithms evaluation. In Proceedings of the VI International Conference on Forest Fire Research, Coimbra, Portugal, 15–18 November 2010. [Google Scholar]
- Powers, D.M.W. Evaluation: From Precision, Recall and F-measure to ROC, Informedness, Markedness and Correlation. J. Mach. Learn. Technol. 2011, 2, 37–63. [Google Scholar]
- Bown, W.C. Sensitivity and Specificity versus Precision and Recall, and Related Dilemmas. J. Classif. 2024, 41, 402–426. [Google Scholar] [CrossRef]
- Fawcett, T. An Introduction to ROC analysis. Pattern Recognit. Lett. 2006, 27, 861–874. [Google Scholar] [CrossRef]
- Saito, T.; Rehmsmeier, M. The precision-recall plot is more informative than the ROC plot when evaluating binary classifiers on imbalanced datasets. PLoS ONE 2015, 10, e0118432. [Google Scholar] [CrossRef]
- Martin, A.; Doddington, A.G.; Kamm, T.; Ordowski, M.; Przybocki, M. The DET Curve in Assessment of Detection Task Performance. In Proceedings of the Eurospeech ‘97, Rhodes, Greece, 22–25 September 1997; Volume 4, pp. 1895–1898. [Google Scholar]
- Bacevicius, M.; Paulauskaite-Taraseviciene, A. Machine Learning Algorithms for Raw and Unbalanced Intrusion Detection Data in a Multi-Class Classification Problem. Appl. Sci. 2023, 13, 7328. [Google Scholar] [CrossRef]
- Nisbet, R.; Elder, J.; Miner, G.D. Handbook of Statistical Analysis and Data Mining Applications; Academic Press: London, UK, 2009. [Google Scholar]
- Adeodato, P.J.; Melo, S.B. On the equivalence between Kolmogorov-Smirnov and ROC curve metrics for binary classification. arXiv 2016, arXiv:1606.00496. [Google Scholar] [CrossRef]
- Fernández, A.; García, S.; Galar, M.; Prati, R.C.; Krawczyk, B.; Herrera, F. Learning from Imbalanced Data Sets; Springer International Publishing: Cham, Switzerland, 2018. [Google Scholar]
- Günay, O.; Töreyın, B.U.; Köse, K.; Çetin, A.E. Entropy-Functional-Based Online Adaptive Decision Fusion Framework with Application to Wildfire Detection in Video. IEEE Trans. Image Process. 2012, 21, 2853. [Google Scholar] [CrossRef]
- Krstinić, D.; Stipaničev, D.; Jakovčević, T. Histogram-Based Smoke Segmentation in Forest Fire Detection System. Inf. Technol. Control. 2009, 38, 237–244. [Google Scholar]
- Günay, O.; Taşdemir, K.; Töreyın, B.U.; Çetin, A.E. Video Based Wild Fire Detection at Night. Fire Saf. J. 2009, 44, 860. [Google Scholar] [CrossRef]
- He, X.; Xu, X. Optimal Band Selection of Multispectral Sensors for Wildfire Detection. In Proceedings of the 2017 Sensor Signal Processing for Defence Conference (SSPD), London, UK, 6–7 December 2017; pp. 1–5. [Google Scholar] [CrossRef]
- Krstinic, D. Automatic Forest Fire Detection in Visible Spectra. In Proceedings of the 21st International Central European Conference on Information and Intelligent Systems, Varaždin, Croatia, 30 April 2010. [Google Scholar]
- Reig, I.B.; Serrano, A.; Vergara, L. Multisensor Network System for Wildfire Detection Using Infrared Image Processing. Sci. World J. 2013, 2013, 402196. [Google Scholar] [CrossRef] [PubMed]
- Günay, O.; Töreyın, B.U.; Kose, K.; Cetin, A.E. Online Adaptive Decision Fusion Framework Based on Entropic Projections onto Convex Sets with Application to Wildfire Detection in Video. Opt. Eng. 2011, 50, 77202. [Google Scholar] [CrossRef]
- Stipaničev, D.; Šerić, L.; Krstinić, D.; Bugarić, M.; Vuković, A. IPA Adriatic Holistic Forest Fire Protection Project—The year after. In Advances in Forest Fire Research 2018; Viegas, D.X., Ed.; ADAI: Coimbra, Portugal, 2018; pp. 88–98. [Google Scholar] [CrossRef]
- Thermography. Available online: https://en.wikipedia.org/wiki/Thermography (accessed on 20 August 2025).
- Stipaničev, D.; Štula, M.; Krstinić, D.; Šerić, L.; Jakovčević, T.; Bugarić, M. Advanced Automatic Wildfire Surveillance and Monitoring Network. In Proceedings of the VI International Conference on Forest Fire Research, Coimbra, Portugal, 15–18 November 2010. [Google Scholar]
- Ko, B.C. Wildfire Smoke Detection Using Temporospatial Features and Random Forest Classifiers. Opt. Eng. 2012, 51, 17208. [Google Scholar] [CrossRef]
- Labati, R.D.; Genovese, A.; Piuri, V.; Scotti, F. Wildfire Smoke Detection Using Computational Intelligence Techniques Enhanced With Synthetic Smoke Plume Generation. IEEE Trans. Syst. Man Cybern. Syst. 2013, 43, 1003–1012. [Google Scholar] [CrossRef]
- Ko, B.C.; Park, J.; Nam, J.-Y. Spatiotemporal Bag-of-Features for Early Wildfire Smoke Detection. Image Vis. Comput. 2013, 31, 786–795. [Google Scholar] [CrossRef]
- Mukhiddinov, M.; Abdusalomov, A.; Cho, J. A Wildfire Smoke Detection System Using Unmanned Aerial Vehicle Images Based on the Optimized YOLOv5. Sensors 2022, 22, 9384. [Google Scholar] [CrossRef]
- Jeong, M.; Park, M.; Nam, J.-Y.; Ko, B.C. Light-Weight Student LSTM for Real-Time Wildfire Smoke Detection. Sensors 2020, 20, 5508. [Google Scholar] [CrossRef]
- Tao, C.; Zhang, J.; Wang, P. Smoke Detection Based on Deep Convolutional Neural Networks. In Proceedings of the 2016 International Conference on Industrial Informatics—Computing Technology, Intelligent Technology, Industrial Information Integration (ICIICII), Wuhan, China, 3–4 December 2016. [Google Scholar] [CrossRef]
- González, A.; Zúñiga, M.; Nikulin, C.; Carvajal, G.; Cárdenas, D.; Pedraza, M.A.; Fernandez, C.A.; Munoz, R.I.; Castro, N.; Rosales, B.; et al. Accurate Fire Detection through Fully Convolutional Network. In Proceedings of the 7th Latin American Conference on Networked and Electronic Media (LACNEM 2017), Valparaiso, Chile, 6–7 November 2017; pp. 1–6. [Google Scholar] [CrossRef]
- Sharma, J.; Granmo, O.; Goodwin, M.; Fidje, J.T. Deep Convolutional Neural Networks for Fire Detection in Images. In Communications in Computer and Information Science; Springer Science+Business Media: Berlin/Heidelberg, Germany, 2017; p. 183. [Google Scholar]
- Hung, K.-M.; Chen, L.; Wu, J.-A. Wildfire Detection in Video Images Using Deep Learning and HMM for Early Fire Notification System. In Proceedings of the 12th International Congress on Advanced Applied Informatics (IIAI-AAI), Toyama, Japan, 7–11 July 2019; IEEE: New York, NY, USA, 2019. [Google Scholar]
- Zhang, A.; Zhang, A.S. Real-Time Wildfire Detection and Alerting with a Novel Machine Learning Approach. Int. J. Adv. Comput. Sci. Appl. 2022, 13, 0130801. [Google Scholar] [CrossRef]
- Almeida, J.S.; Huang, C.; Nogueira, F.G.; Bhatia, S.; de Albuquerque, V.H.C. EdgeFireSmoke: A Novel Lightweight CNN Model for Real-Time Video Fire–Smoke Detection. IEEE Trans. Ind. Inform. 2022, 18, 7889–7898. [Google Scholar] [CrossRef]
- Khan, S.; Muhammad, K.; Mumtaz, S.; Baik, S.W.; Albuquerque, V.H.C. de Energy-Efficient Deep CNN for Smoke Detection in Foggy IoT Environment. IEEE Internet Things J. 2019, 6, 9237–9245. [Google Scholar] [CrossRef]
- Zhang, Z.; Guo, Y.; Chen, G.; Xu, Z.-D. Wildfire Detection via a Dual-Channel CNN with Multi-Level Feature Fusion. Forests 2023, 14, 1499. [Google Scholar] [CrossRef]
- Shalan, A.; Walee, N.A.; Hefny, M.; Rahman, M.K. Improving Deep Machine Learning for Early Wildfire Detection from Forest Sensory Images. In Proceedings of the 5th International Conference on Artificial Intelligence, Robotics and Control (AIRC), Cairo, Egypt, 22–24 April 2024. [Google Scholar] [CrossRef]
- El-Madafri, I.; Peña, M.; Torre, N.O. Dual-Dataset Deep Learning for Improved Forest Fire Detection: A Novel Hierarchical Domain-Adaptive Learning Approach. Mathematics 2024, 12, 534. [Google Scholar] [CrossRef]
- Walee, N.A.; Shalan, A.; Kadlec, C.; Rahman, M.K. Optimizing Deep Learning Accuracy: Visibility Filtering Approach for Early Wildfire Detection in Forest Sensor Images. In Proceedings of the IEEE/ACIS 9th International Conference on Big Data, Cloud Computing, and Data Science (BCD), Kitakyushu, Japan, 16–18 July 2024; pp. 59–64. [Google Scholar] [CrossRef]
- Jegan, R.; Birajdar, G.K.; Chaudhari, S. Deep Residual Multi-resolution Features and Optimized Kernel ELM for Forest Fire Image Detection Using Imbalanced Database. Fire Technol. 2025. [Google Scholar] [CrossRef]
- Redmon, J.; Santosh, D.H.H.; Ross, G.; Farhadi, A. You Only Look Once: Unified, Real-Time Object Detection. arXiv 2015, arXiv:1506.02640. [Google Scholar] [CrossRef]
- Khanam, R.; Hussain, M. YOLOv11: An Overview of the Key Architectural Enhancements. arXiv 2024, arXiv:2410.17725. [Google Scholar] [CrossRef]
- Vazquez, G.; Zhai, S.; Yang, M. Transfer Learning Enhanced Deep Learning Model for Wildfire Flame and Smoke Detection. In Proceedings of the 2024 International Conference on Smart Applications, Communications and Networking (SmartNets), Harrisonburg, VA, USA, 28–30 May 2024; pp. 1–4. [Google Scholar] [CrossRef]
- Raita-Hakola, A.; Rahkonen, S.; Suomalainen, J.; Markelin, L.; de Oliveira, R.A.; Hakala, T.; Koivumäki, N.; Honkavaara, E.; Pölönen, I. Combining YOLO V5 and Transfer Learning for Smoke-Based Wildfire Detection in Boreal Forests. Int. Arch. Photogramm. Remote Sens. Spat. Inf. Sci. 2023, XLVIII-1/W, 1771–1778. [Google Scholar] [CrossRef]
- Krstinić, D.; Šerić, L.; Ivanda, A.; Bugarić, M. Multichannel Data from Temporal and Contextual Information for Early Wildfire Detection. In Proceedings of the 2022 7th International Conference on Smart and Sustainable Technologies (SpliTech), Bol, Croatia, 20–23 June 2023; IEEE: New York, NY, USA, 2023. [Google Scholar]
- Xu, H.; Li, B.; Zhong, F. Light-YOLOv5: A Lightweight Algorithm for Improved YOLOv5 in Complex Fire Scenarios. Appl. Sci. 2022, 12, 12312. [Google Scholar] [CrossRef]
- Gonçalves, L.A.O.; Ghali, R.; Akhloufi, M.A. YOLO-Based Models for Smoke and Wildfire Detection in Ground and Aerial Images. Fire 2024, 7, 140. [Google Scholar] [CrossRef]
- Tao, Y.; Li, B.; Li, P.; Qian, J.; Qi, L. Improved Lightweight YOLOv11 Algorithm for Real-Time Forest Fire Detection. Electronics 2025, 14, 1508. [Google Scholar] [CrossRef]
- Casas, E.; Ramos, L.; Bendek, E.; Rivas, F. Assessing the Effectiveness of YOLO Architectures for Smoke and Wildfire Detection. IEEE Access 2023, 11, 96554–96583. [Google Scholar] [CrossRef]
- Li, T.; Zhao, E.; Zhang, J.; Hu, C. Detection of Wildfire Smoke Images Based on a Densely Dilated Convolutional Network. Electronics 2019, 8, 1131. [Google Scholar] [CrossRef]
- Gonçalves, A.M.; Brandão, T.; Ferreira, J.C. Wildfire Detection with Deep Learning—A Case Study for the CICLOPE Project. IEEE Access 2024, 12, 82095–82110. [Google Scholar] [CrossRef]
- CICLOPE Wildfire Monitoring System. Available online: https://www.ciclope.com.pt/ (accessed on 28 May 2025).
- Baptista, M.; Oliveira, B.; Paulo, C.; Joao, C.F.; Tomaso, B. Improved Real-Time Wildfire Detection Using a Surveillance System. In Proceedings of the World Congress on Engineering (WCE 2019), London, UK, 3–5 July 2019. [Google Scholar]
- Haroun, A.; Tagmouni, A.; Chergui, S.; Ladlani, R.; Bechar, A.; Melchane, S.; Kherbachi, S. Advancing Wildfire Detection: Using YOLOv8 on Multifarious Images. In Proceedings of the 9th International Conference on Control and Robotics Engineering (ICCRE), Osaka, Japan, 10–12 May 2024; pp. 359–364. [Google Scholar] [CrossRef]
- Wei, C.; Xu, J.; Li, Q.; Jiang, S. An Intelligent Wildfire Detection Approach through Cameras Based on Deep Learning. Sustainability 2022, 14, 15690. [Google Scholar] [CrossRef]
- Saleem, A.; Abdulhadi, S. Wildfire Detection System Using Yolov5 Deep Learning Model. Int. J. Comput. Digit. Syst. 2023, 14, 10149–10158. [Google Scholar] [CrossRef]
- Dwyer, B. Wildfire Smoke Dataset. Roboflow Universe Repository. 2022. Available online: https://public.roboflow.com/object-detection/wildfire-smoke (accessed on 27 May 2025).
- Hopkins, B.; O’Neill, L.; Afghah, F.; Razi, A.; Rowell, E.; Watts, A.; Fule, P.; Coen, J. FLAME 2: Fire Detection and Modeling: Aerial Multi-Spectral Image Dataset; IEEE Dataport: Piscataway, NJ, USA, 2022. [Google Scholar] [CrossRef]
- Maillard, S.; Khan, M.S.; Cramer, A.K.; Sancar, E.K. Wildfire and Smoke Detection Using YOLO-NAS. In Proceedings of the 2024 IEEE 3rd International Conference on Computing and Machine Intelligence (ICMI), Mt Pleasant, MI, USA, 13–14 April 2024; pp. 1–5. [Google Scholar] [CrossRef]
- Ramos, L.; Casas, E.; Bendek, E.; Romero, C.; Rivas, F. Hyperparameter Optimization of YOLOv8 for Smoke and Wildfire Detection: Implications for Agricultural and Environmental Safety. Artif. Intell. Agric. 2024, 12, 109–126. [Google Scholar] [CrossRef]
- de Venâncio, P.V.A.B.; Lisboa, A.C.; Barbosa, A.V. An Automatic Fire Detection System Based on Deep Convolutional Neural Networks for Low-Power, Resource-Constrained Devices. Neural Comput. Appl. 2022, 34, 15349–15368. [Google Scholar] [CrossRef]
- Hemateja, A.V.N.M. WildFire-Smoke-Dataset-Yolo. 2021. Available online: https://www.kaggle.com/datasets/ahemateja19bec1025/wildfiresmokedatasetyolo (accessed on 28 May 2025).
- Zhang, Q.; Lin, G.; Zhang, Y.; Gao, X.; Wang, J. Wildland Forest Fire Smoke Detection Based on Faster R-CNN Using Synthetic Smoke Images. Procedia Eng. 2018, 211, 441–446. [Google Scholar] [CrossRef]
- Zhou, J.; Li, Y.; Yin, P. A Wildfire Smoke Detection Based on Improved YOLOv8. Int. J. Inf. Commun. Technol. 2024, 25, 52–67. [Google Scholar] [CrossRef]
- Wang, L.; Doukhi, O.; Lee, D.J. FCDNet: A Lightweight Network for Real-Time Wildfire Core Detection in Drone Thermal Imaging. IEEE Access 2025, 13, 14516–14530. [Google Scholar] [CrossRef]
- San-Miguel-Ayanz, J.; Durrant, T.; Boca, R.; Maianti, P.; Libertà, G.; Artés Vivancos, T.; Oom, D.; Branco, A.; de rigo, D.; Ferrari, D.; et al. Forest Fires in Europe, Middle East and North Africa 2019; JRC Technical Reports, EUR 30402 EN; Publications Office of the European Unio: Luxemburg, 2020. [Google Scholar] [CrossRef]
- Bugarić, M.; Stipaničev, D.; Jakovčević, T. AdriaFirePropagator and AdriaFireRisk: User friendly Web based wildfire propagation and wildfire risk prediction software. In Advances in Forest Fire Research 2018; Viegas, D.X., Ed.; ADAI: Coimbra, Portugal, 2018; pp. 890–899. [Google Scholar]
- Bugarić, M.; Braović, M.; Stipaničev, D. Statistical evaluation of site-specific wildfire risk index calculation for Adriatic regions. In Advances in Forest Fire Research 2018, Proceedings of the VII International Conference on Forest Fire Research, Coimbra, Portugal, 17–20 November 2014; Viegas, D.X., Ed.; ADAI: Coimbra, Portugal, 2014. [Google Scholar]
- Chuvieco, E.; Yebra, M.; Martino, S.; Thonicke, K.; Gómez-Giménez, M.; San-Miguel, J.; Oom, D.; Velea, R.; Mouillot, F.; Molina, J.R.; et al. Towards an Integrated Approach to Wildfire Risk Assessment: When, Where, What and How May the Landscapes Burn. Fire 2023, 6, 215. [Google Scholar] [CrossRef]
- Wildfire Hazard Potential (WHP); Version 2023 Continuous (Metadata Created May 31, 2024; Updated April 21, 2025); U.S. Forest Service, Wildfire Modeling Institute: Missoula, MT, USA, 2023. Available online: https://research.fs.usda.gov/firelab/products/dataandtools/wildfire-hazard-potential (accessed on 20 August 2025).
- Thies, B. Machine Learning Wildfire Susceptibility Mapping for Germany. Nat. Hazards 2025, 121, 12517–12530. [Google Scholar] [CrossRef]
- Marquez Torres, A.; Signorello, G.; Kumar, S.; Adamo, G.; Villa, F.; Balbi, S. Fire risk modeling: An integrated and data-driven approach applied to Sicily. Nat. Hazards Earth Syst. Sci. 2023, 23, 2937–2959. [Google Scholar] [CrossRef]
- Finney, M.A. The challenge of quantitative risk analysis for wildland fire. For. Ecol. Manag. 2025, 211, 97–108. [Google Scholar] [CrossRef]
- Huang, Y.; Li, J.; Zheng, H. Modeling of Wildfire Digital Twin: Research Progress in Detection, Simulation, and Prediction Techniques. Fire 2024, 7, 412. [Google Scholar] [CrossRef]
- Stipaničev, D.; Bugarić, M.; Šerić, L.; Jakovčević, T. Web GIS Technologies in Advanced Cloud Computing Based Wildfire Monitoring System. In Proceedings of the 5th International Wildland Fire Conference WILDFIRE 2011, Sun City, South Africa, 9–13 May 2011. Paper No. 68. [Google Scholar]
- Shabnam, S.E. Mixed reality and remote sensing application of unmanned aerial vehicle in fire and smoke detection. J. Ind. Inf. Integr. 2019, 15, 42–49. [Google Scholar] [CrossRef]
- Costa, C.; Gomes, E.; Rodrigues, N.; Gonçalves, A.; Ribeiro, R.; Costa, P.; Pereira, A. Augmented reality mobile digital twin for unmanned aerial vehicle wildfire prevention. Virtual Real. 2025, 29, 71. [Google Scholar] [CrossRef]
- Allison, R.S.; Johnston, J.M.; Craig, G.; Jennings, S. Airborne Optical and Thermal Remote Sensing for Wildfire Detection and Monitoring. Sensors 2016, 16, 1310. [Google Scholar] [CrossRef]
- Szpakowski, D.M.; Jensen, J. A Review of the Applications of Remote Sensing in Fire Ecology. Remote Sens. 2019, 11, 2638. [Google Scholar] [CrossRef]
- Lentile, L.B.; Holden, Z.A.; Smith, A.M.S.; Falkowski, M.J.; Hudak, A.T.; Morgan, P.; Lewis, S.A.; Gessler, P.E.; Benson, N. Remote Sensing Techniques to Assess Active Fire Characteristics and Post-Fire Effects. Int. J. Wildland Fire 2006, 15, 319–345. [Google Scholar] [CrossRef]
- Chan, C.C.; Alvi, S.A.; Zhou, X.; Durrani, S.; Wilson, N.; Yebra, M. IoT Ground Sensing Systems for Early Wildfire Detection: Technologies, Challenges and Opportunities. arXiv 2023, arXiv:2312.10919. [Google Scholar] [CrossRef]
Disclaimer/Publisher’s Note: The statements, opinions and data contained in all publications are solely those of the individual author(s) and contributor(s) and not of MDPI and/or the editor(s). MDPI and/or the editor(s) disclaim responsibility for any injury to people or property resulting from any ideas, methods, instructions or products referred to in the content. |
© 2025 by the authors. Licensee MDPI, Basel, Switzerland. This article is an open access article distributed under the terms and conditions of the Creative Commons Attribution (CC BY) license (https://creativecommons.org/licenses/by/4.0/).