Abstract
The combustion of liquid fuels that have leaked into inert porous media, such as sand, is a critical issue for industrial safety and fire risk assessment. Despite its importance, the complex influence of porous media on the combustion process, particularly the governing mechanisms of flame morphology and heat release, remains poorly understood, hindering accurate hazard prediction. This study addresses this gap by systematically investigating the combustion characteristics of 92# gasoline on quartz sand substrates with thicknesses ranging from 0 to 4 cm. Through a series of controlled laboratory experiments, key parameters including mass loss rate, heat release rate (HRR), and flame morphology were quantified. The findings reveal that, unlike the classical three-stage combustion of pool fires, the presence of porous media introduces a “slow burning period,” resulting in a unique four-stage combustion mode. The sand layer significantly suppresses combustion intensity, with the dimensionless heat release rate (Q*) being proportional to the dimensionless layer thickness (d*) raised to the power of −2.54. Crucially, flame height was found to be governed not by the HRR, but by a competition between the capillary effect (driving upward fuel transport) and the thermal effect (insulation and heat absorption). Based on this mechanism, a novel flame height prediction model was developed, which showed excellent agreement with 23 experimental datasets (R2 = 0.92, average relative error 1.72%). This study elucidates the core physical mechanisms governing liquid fuel combustion in porous media. The proposed model provides a robust theoretical foundation for predicting fire development and assessing the risks associated with leaked fuel fires, offering a valuable tool for safety engineering and emergency response.
1. Introduction
Liquid fuels, as critical energy substances, are extensively utilized in industrial production, transportation, and related sectors. Their safe storage, transport, and usage hold strategic importance. Damage to pipelines, corrosion of storage tanks, or transportation accidents can result in substantial leakage of flammable liquids into porous surface media, e.g., soil or sand, creating large-scale potential ignition sources. When ignited, such scenarios exhibit combustion behavior distinct from conventional free liquid pool fires, frequently manifesting complex phenomena including prolonged duration, difficulty of extinguishment, and susceptibility to sudden explosions. These pose severe threats to personnel safety, ecological systems, and infrastructure integrity. Catastrophic incidents such as the 2013 Lac-Mégantic rail disaster in Canada, and the 2020 tanker truck explosion in Wenling, China, underscore the critical need for fundamental research on liquid fuel combustion mechanisms in porous media.
Early research established fundamental understanding in this field. Hirano et al. [1]. first observed that flame spread in crude oil sludge is significantly influenced by fuel volatility. The groundbreaking work of Takeno and Hirano [2] demonstrated that porous media particle size governs the dominance between two heat transfer mechanisms: conduction and liquid convection. Subsequent investigations by Suzuki et al. [3,4] and Ishida [5] further examined factors including wind effects and fuel volatility on flame propagation.
Research in the 21st century has shifted toward quantitative analysis of combustion physical mechanisms. Regarding heat transfer mechanisms, Chao et al. [6,7] experimentally and computationally confirmed that under most conditions, conductive heat transfer through porous media skeletons dominates fuel gasification and combustion rates—distinct from radiative feedback in liquid pool fires. Recent studies employ advanced diagnostics to refine this understanding: Zhang et al. [8,9] not only reaffirmed conduction’s dominance but also identified an additional decay period in the combustion stages of development, stability, and extinction, attributable to dry sand layer insulation effects. Song et al. [10] developed simultaneous solid/gas-phase temperature measurement technology, enabling precise analysis of solid/gas thermal non-equilibrium phenomena critical for microscale heat distribution analysis. Concerning mass transfer mechanisms, fuel transport from porous media depths to combustion surfaces occurs primarily through capillary wicking, essential for sustained combustion. Systematic investigations by Zanganeh and Moghtaderi [11,12,13,14] detailed interrelationships among fuel permeation, infiltration time, and capillary flow. Fu et al. [15] demonstrated that at low fuel ratios, capillary rise and thermal conduction jointly govern flame propagation. Whereas classical capillary theories, e.g., the Lucas−Washburn equation, oversimplify pore structures, current research utilizes Pore Network Models (PNMs) or direct numerical simulations, e.g., the Lattice Boltzmann method to accurately resolve multiphase flow and phase transition processes in tortuous pore networks. These approaches provide new theoretical tools for quantifying mesoscale fuel supply rates.
Combustion within porous media represents a quintessential thermal-mass coupling phenomenon. Variations in parameters such as sand layer thickness, particle size, and fuel type concurrently influence thermal conduction efficiency and capillary transport capacity, inducing complex nonlinear behavior [16,17,18,19,20,21]. For instance, both Li et al. [17] and Zhai et al. [18] identified a critical sand layer thickness beyond which combustion rate suppression saturates. This observation reveals the competitive interplay between dry sand insulation effects and capillary mass transfer resistance. Despite significant progress, existing research predominantly focuses on idealized uniform infiltration states—either unsaturated or fully saturated—lacking systematic characterization of the transitional behavior between these regimes. In practical leakage scenarios, an oil-sand mixture typically forms, comprising a surface layer of freely flowing liquid overlying an infiltrated sand stratum. The combustion dynamics, heat release characteristics, and associated hazards, e.g., splashing and detonation during the transition from surface-liquid consumption exhibiting pool fire behavior to internal-liquid consumption dominated by wicking mechanisms, remain poorly understood.
To address the research gap in this field, this study innovatively focuses on gasoline, the most hazardous fuel type, by establishing a self-designed multidimensional experimental platform capable of simultaneously measuring mass loss rate, heat release rate, flame morphology, and temperature fields. Through precise control of quartz sand layer thickness and initial gasoline loading, the combustion behavior of gasoline was systematically evaluated across evolving infiltration states, ranging from unsaturated to supersaturated conditions, including the formation of “oil-bubble sand.” The primary innovations and objectives of this study are (1) to precisely quantify the dynamic evolution patterns of mass loss rate, heat release rate, flame temperature, and morphology under different infiltration states; (2) to reveal the critical physical parameters and governing mechanisms underlying the transition from pool-like combustion to wick-dominated regimes; and (3) to develop empirical/semi-empirical predictive models tailored for this complex combustion scenario, thereby providing theoretical foundations and data support for risk assessment, early warning systems, and efficient mitigation strategies for liquid-fuel leakage fires.
2. Experimental Design and Procedure
2.1. Experimental Setup
The experiment was conducted indoors in a windless environment, and the experimental setup is shown in Figure 1.
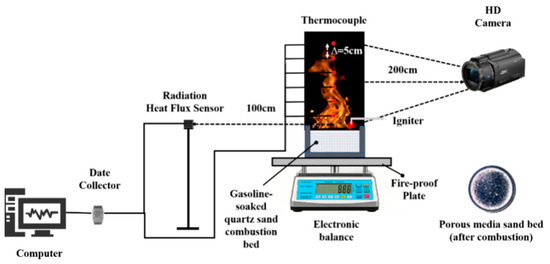
Figure 1.
Experimental setup diagram.
The experimental apparatus comprises three primary systems: combustion, ignition, and data acquisition.
- (1)
- Combustion System: A stainless-steel circular basin diameter: 11.7 cm, wall thickness: 1 mm, height: 5 cm contained quartz sand impregnated with combustible liquid. The quartz sand 70−100 mesh had an average particle size of 0.165 mm, bulk density of ~1.5 g/cm3, measured porosity of 0.43, and was dried at 100 °C for 24 h and air-cooled to achieve 0 moisture content. The combustible liquid was 92-octane gasoline density: 0.74 g/cm3; net calorific value: 44 MJ/kg, selected for its low flash point. By varying gasoline loading relative to sand layer thickness, conditions ranging from unsaturated infiltration to supersaturated oil-sand mixtures with free liquid surfaces were established.
- (2)
- Ignition System: A high-energy electromagnetic igniter was employed, controlled via a computer terminal.
- (3)
- Data Acquisition System: ① Temperature: A K-type thermocouple array wire with a diameter of 0.5 mm recorded data at 1 Hz. Six thermocouples were vertically spaced at 5 cm intervals: 5, 10, 15, 20, 25, and 30 cm above the sand bed surface or liquid surface in oil-sand mixtures along the basin’s central axis. Quasi-steady-state temperature distributions were derived from processed time-series data. ② Thermal radiation: A heat flux sensor positioned 1 m horizontally from the flame centerline at basin rim height was recorded at 1 Hz. Radiative heat flux density was calculated from the acquired signal. ③ Mass measurement: A 1 Hz-sampling electronic balance recorded mass loss rate in real time. Heat release rate HRR was subsequently calculated from the mass loss rate. Imaging: A SONY 4K camera—resolution: 1920 × 1080; framerate: 30 fps—recorded flame morphology evolution. A calibrated ruler provided scale for flame height and morphological feature quantification.
The specific parameters of the experimental equipment are shown in Table 1.

Table 1.
The specifications of the experimental equipment.
2.2. Experimental Design and Steps
All experiments were conducted under quiescent atmospheric conditions: ambient pressure: 101 kPa; relative humidity: 50. Experimental conditions were systematically varied across two dimensions to encompass states from undersaturated infiltration to supersaturated oil-sand mixtures with free liquid layers: gasoline mass 30 g, 60 g, 90 g, 120 g, and 150 g, and sand bed thickness 0 cm, 1 cm, 2 cm, 3 cm, and 4 cm. Preliminary observations confirmed that gasoline masses ≥ 60 g with a 1 cm sand bed thickness consistently formed free liquid layers, exhibiting combustion behavior identical to conditions with higher gasoline loading of 90 g, 120 g, and 150 g. Consequently, the 120 g and 150 g gasoline conditions were excluded to avoid redundancy. The final experimental matrix comprised the following combinations.
The specific experimental conditions are shown in Table 2.
Table 2.
Experimental design.
The experimental protocol comprised the following steps: Ambient temperature and humidity were recorded. Pre-dried quartz sand cooled post-baking was added to the oil basin to the predetermined height corresponding to each test condition. Specified gasoline mass was introduced into the basin. Data acquisition modules and the imaging system of the SONY4K camera were initiated with synchronized recording. Ignition was performed using the electromagnetic igniter. Data were saved following complete fuel consumption. Each test condition was replicated three times. Collected datasets included: time-resolved oil basin mass; calculated heat release rate HRR; temperature histories at all thermocouple positions; flame morphology images; and radiative heat flux density measurements. Primary uncertainty sources were thermocouple radiation correction error ± 5 and electronic balance measurement noise ± 0.1 g. These uncertainties exerted negligible influence on overall result interpretation.
3. Results and Discussion
3.1. Analysis of the Influence of Porous Media Substrate on Fuel Quality Loss Characteristics
The Mass Loss Rate (MLR) serves as a fundamental parameter characterizing combustion intensity. Figure 2 depicts the temporal evolution of the MLR during the combustion of 90 g gasoline on porous media substrates of varying thickness. As shown in Figure 2a, compared to the typical pool fire behavior observed under sand-free conditions, the combustion process on the infiltrated sand bed exhibits distinct four-stage evolution characteristics. Specifically, Figure 2b illustrates these four stages under the 90 g + 3 cm experimental condition. This staged progression aligns with findings reported by Zhang et al. [8] and directly manifests the coupled heat and mass transfer mechanisms inherent to porous media combustion.


Figure 2.
Rate of gasoline quality loss under different infiltration states.
(1) Development Stage (the MLR is rapidly increasing until it stabilizes): During initial ignition, flame-derived thermal radiation and convection provide feedback heat to the fuel surface, driving rapid gasoline evaporation. In oil-saturated sand conditions with a free liquid layer, e.g., 1 cm and 2 cm sand layers, capillary suction from surface sand particles increases the effective evaporation area. Concurrently, transient heat absorption and re-release by sand particles create a localized thermal insulation effect. This results in an initial MLR peak observed in the 2 cm sand layer condition, exceeding that of a pure pool fire. This phenomenon reveals that porous media can enhance, rather than suppress, initial fire intensity under specific conditions, presenting an enhanced fire risk. (2) Steady Burning Stage (the MLR tends to stabilize): As surface fuel depletes, the flame front recedes, forming a progressively thickening dry sand layer beneath the combustion surface. Combustion control transitions fundamentally: from flame feedback dominance to conduction-dominated heat transfer through the dry sand layer. This dry layer acts as a thermal barrier, significantly impeding downward heat transfer to the liquid fuel. Consequently, thicker sand layers exhibit greater thermal resistance, yielding a lower steady-state MLR and a sharply reduced duration for this stage. Quantitative analysis confirms this insulation effect: the steady phase constitutes 81.8% of the total duration for a 1 cm sand layer, decreasing to 39.0% for a 4 cm layer. (3) Decay Stage (the MLR shows a gradual downward trend, with the flame temperature at a height of 10 cm remaining below 400 °C): This stage represents a distinctive characteristic of porous media combustion. Sustained combustion gradually elevates the temperature throughout the sand bed. Deep fuel vaporization becomes governed not only by conductive heat from above but also by the thermal accumulation effect of the heated sand matrix. However, vaporized fuel must traverse increasingly longer and more tortuous capillary pathways to reach the combustion surface, significantly increasing mass transfer resistance. The counteracting influences of declining heat transfer efficiency and increasing mass transfer resistance cause a pronounced reduction in the MLR decay rate, resulting in a plateau-like slow-burning period. This effect intensifies with greater sand layer thickness. (4) Extinction Stage (The MLR tends to stabilize, approaching zero): Terminal combustion exhibits high flame instability, characterized by sporadic oscillations and localized luminosity. This behavior stems from the random, intermittent evaporation and ejection of residual fuel trapped within deep pores, leading to localized microscale combustion events. Notably, residual fuel content increases substantially under thick sand layer conditions ≥ 3 cm, reducing combustion efficiency and posing a potential secondary ignition hazard.
Furthermore, the splashing combustion phenomenon captured in Figure 3 primarily occurs under oil-saturated sand conditions during the critical transition when the free liquid layer nears depletion and the flame front contacts the sand-liquid interface. Vigorous boiling at this interface ejects sand particles and fuel droplets, significantly enhancing fire unpredictability and associated hazards.
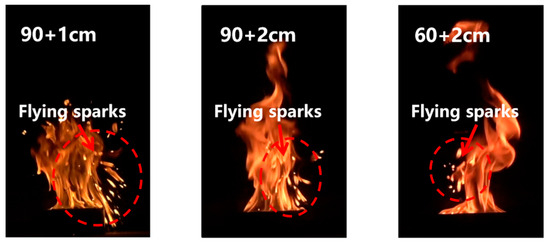
Figure 3.
Flame diagram of gasoline splashing combustion on porous media substrate.
The stable combustion period represents the primary focus for research on combustible liquid fires. The MLR during this phase was determined for all test conditions, with the results summarized in Table 3.
Table 3.
Mass loss rate of gasoline combustion on porous media substrate.
Experimental data indicate that under saturated sand conditions (e.g., 30 g gasoline), the MLR exhibits a monotonic reduction with increasing sand layer thickness. However, at elevated fuel quantities—particularly under oil-saturated sand conditions where a free liquid layer forms (e.g., ≥60 g gasoline)—MLR sensitivity to sand layer thickness diminishes, approaching a saturation value governed by oil pan diameter and fuel properties. This saturation occurs because once sand pores become fuel-saturated and excess fuel accumulates above the porous matrix, further fuel addition fails to proportionally increase the MLR. Combustion rates become constrained by heat transfer limitations and oxygen supply, with flame intensity approaching the system-scale maximum. Conversely, in fuel-lean unsaturated regimes, increased fuel loading prolongs evaporation capacity, enabling more complete flame development. This demonstrates that combustion intensity reaches the system upper limit when fuel supply exceeds the gasification rate sustainable by conductive heat transfer.
3.2. Study on the Influence of Porous Media Substrate on the Heat Release Rate of Fire Source
The heat release rate (HRR) represents a fundamental parameter for characterizing the combustion behavior of flammable liquids. It is conventionally calculated as the product of the instantaneous mass loss rate and the fuel’s heat of combustion, expressed as follows:
In this formulation, Q(t) represents the heat release rate of the combustion source, ṁ(t) denotes the mass loss rate, and ΔHc is the heat of combustion of the fuel. The heat of combustion for gasoline is 44 kJ/g. The temporal profile of the heat release rate for porous media-based gasoline combustion was calculated and is presented in Figure 4.
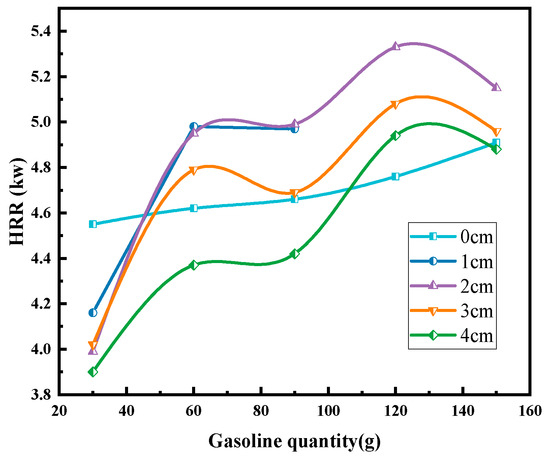
Figure 4.
Heat release rate variation of gasoline combustion source on porous media substrate.
Figure 4 analysis reveals that heat release rate HRR exhibits an increasing trend with fuel loading. However, the HRR demonstrates discontinuous variation with quartz sand layer thickness. This behavior arises from the concurrent influence of ambient temperature, fuel quantity, and sand layer thickness on the HRR. To further examine the relationship between the combustion source HRR and sand layer thickness, normalization analysis was performed by nondimensionalizing both parameters. The heat release rate of the combustion source is expressed as follows [21]:
where Q* denotes the dimensionless heat release rate; represents the source heat release rate kJ/s; Cp is the specific heat capacity of air kJ/(kg⋅K); T∞ indicates ambient temperature K; ρ∞ signifies air density kg/m3; g is gravitational acceleration m/s2; and h corresponds to quartz sand layer thickness m.
For dimensionless treatment of sand layer thickness, the oil pan diameter (D)—a key determinant of pool fire heat release characteristics—serves as the normalizing length scale. Thus, quartz sand layer thicknesses are normalized against:
where () represents the dimensionless quartz sand layer thickness, defined as h being the physical quartz sand layer thickness in m and D the oil pan diameter in m.
The functional relationship between normalized heat release rate HRR and quartz sand layer thickness for porous media substrate pool fires is given as follows [22]:
where k and m are fitting coefficients, with k being dependent on the type of liquid fuel.
Figure 5 illustrates the relationship between dimensionless quartz sand layer thickness () and dimensionless heat release rate (Q*). For pool fires in oil pans of identical scale, (Q*) exhibits primary dependence on quartz sand layer thickness, with fuel quantity demonstrating negligible influence. Furthermore, the magnitude of this thickness effect diminishes with increasing (). Specifically, the data follows the power-law relationship: Q*∝h*(−2.54) across all tested porous media substrate thicknesses. This scaling exponent closely aligns with prior research, though formula coefficients differ due to variations in experimental conditions [22]:

Figure 5.
Relationship between non-dimensional quartz sand layer thickness and non-dimensional fire source heat release rate.
The fitting correlation coefficient of Formula (5) is 0.99, and the dimensionless HRR calculated by this formula has a good correlation with the dimensionless HRR data of different fuel quantities.
3.3. Temperature Characteristics of Fuel Plumes in Porous Media Substrate Environment
The temperature field within flame plumes directly characterizes the spatial distribution of thermal energy and serves as a critical parameter for evaluating fire-induced thermal impacts on surrounding environments. Quasi-steady-state plume temperature profiles under varied experimental conditions were measured using a thermocouple array positioned along the central axis above the fire source, as illustrated in Figure 6.
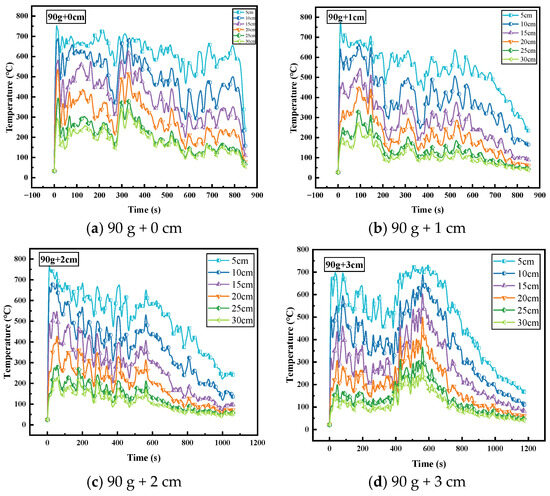
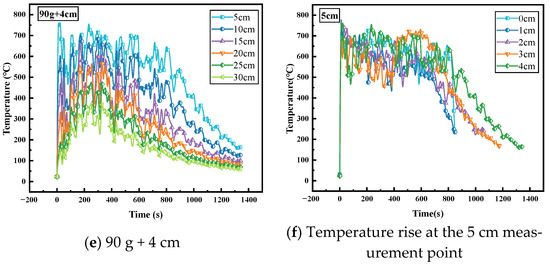
Figure 6.
Flame plume temperature of 90 g gasoline immersed in porous media substrates of different thicknesses and heights.
Figure 6 demonstrates the significant influence of quartz sand layer thickness on flame plume temperature distribution for 90 g gasoline combustion. Without a sand layer, the temperature profile exhibits characteristic medium-scale pool fire behavior: temperature rises rapidly from the flame root, peaks at Z = 10–15 cm ≈ 756 °C, and subsequently decays due to increased entrainment of ambient air. This peak region corresponds to the continuous flame zone of maximum reaction intensity. Temperature decay follows classical plume theory, governed by the balance between combustion-generated buoyancy and entrained air inertia. Introduction of quartz sand layers reduces flame temperatures across all conditions, with suppression magnitude proportional to sand thickness. This attenuation arises from the coupling of three physical mechanisms: (1) Energy Partitioning: The porous media acts as a thermal mass, absorbing significant combustion energy that would otherwise heat fuel/air mixtures. This energy increases sand particle temperatures, reducing net energy available for gas-phase combustion and directly lowering flame temperatures. (2) Reduced mass loss rate: As established in Section 3.1, sand layers decrease the MLR during stable combustion. Reduced fuel supply per unit lowers the heat release rate HRR, inherently producing lower-temperature flames. (3) Altered Flame Root Dynamics: Sand layers disrupt air entrainment patterns at the flame base. Compared to smooth liquid pool fires, surface roughness and localized fuel vapor leakage through porous media create suboptimal fuel/air mixing ratios, reducing combustion efficiency and temperature.
The radiative heat flux data presented in Figure 7 corroborates the preceding analysis. The overall trend closely tracks both the MLR and plume temperature profiles. Notably, under 1 cm and 2 cm quartz sand layer conditions in an oil-bubble sand configuration, significant radiative heat fluctuations occur during early combustion stages. These fluctuations align precisely with the previously discussed splashing phenomenon, where ejected high-temperature droplets or sand particles transiently approach the heat flux meter, inducing instantaneous signal peaks. To enable direct cross-comparison of plume temperatures across experimental conditions, temperature rise values were normalized. The dimensionless temperature rise is defined as [23]:
where represents the dimensionless temperature rise, denotes the temperatures at different measurement points, and signifies the temperature at infinity, which is taken as the ambient temperature.
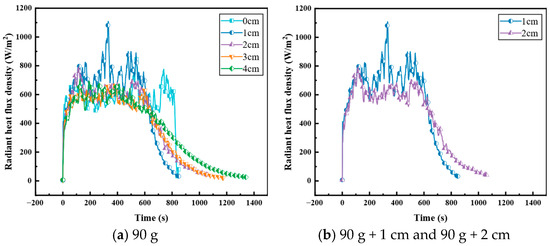
Figure 7.
Radiation heat flux density of 90 g gasoline.
Building upon this, the relationship with dimensionless height above the fuel pan is expressed as follows [23]:
where a and b are fitting coefficients; represents the dimensionless oil pan distance, where x denotes the height of the temperature measurement point and D signifies the diameter of the oil pan.
Fit the data of each operating condition to obtain the relationship between dimensionless temperature rise and dimensionless distance from the oil pan, as shown in Figure 8.
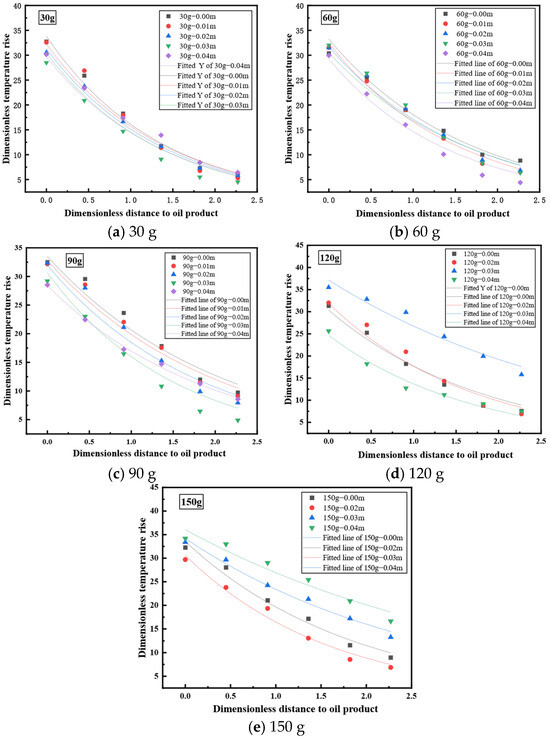
Figure 8.
Non dimensional temperature rise diagram of 90 g gasoline immersed in porous media substrates of different thicknesses.
The fitting coefficients a and b for each operating condition are shown in Table 4.
Table 4.
Statistical table of fitting coefficients a and b for various operating conditions.
To investigate the effect of dimensionless sand layer thickness on plume temperature, the fitting coefficients a and b were fitted to the dimensionless sand layer thickness, and the fitting curves are shown in Figure 9.
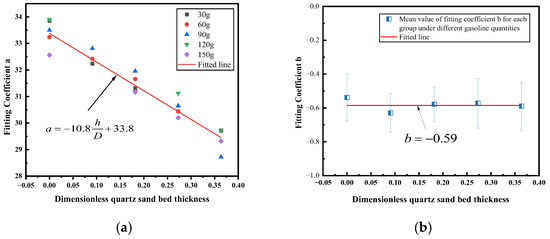
Figure 9.
Curve fitting of coefficients a and b. (a) Coefficient a fitting curve; (b) Coefficient b fitting curve.
Coefficient fitting reveals that parameter a exhibits primary dependence on sand layer height, while parameter b remains invariant to fuel supply conditions and porous media substrate properties, effectively constituting a constant. The fitting results demonstrate that the dimensionless temperature rise and the dimensionless quartz sand layer thickness obey the following relationship:
3.4. The Influence and Mechanism Explanation of Porous Media Substrate on Flame Morphology
3.4.1. Analysis of Experimental Phenomenon Characteristics of Flame Morphology
Figure 10 shows the flame morphology of 90 g gasoline burning on porous media substrates of different thicknesses.
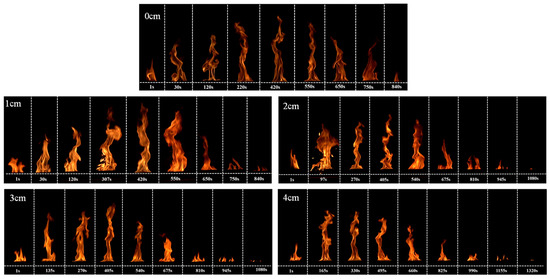
Figure 10.
Flame morphology of 90 g gasoline immersed in porous media substrates of different thicknesses.
Comparative analysis reveals distinct combustion behaviors for 90 g gasoline. Under free-burning pool fire conditions with no sand cover, combustion develops uniformly with a short duration, producing tall, luminous flames. Introduction of a porous media substrate significantly alters combustion dynamics: flame height exhibits non-monotonic variation, with an initial increase followed by a decrease, while total combustion duration increases. Progressive thickening of the quartz sand layer substantially extends the attenuated burning phase, consistent with established trends. Specifically, a 1 cm sand layer demonstrates combustion enhancement via the “oil-bubble sand” phenomenon, corroborating prior combustion rate observations. Visual assessment indicates broader and brighter flames relative to pure pool fires, particularly during early-stage combustion. This reaffirms the transient enhancement effect attributable to capillary suction and thermal insulation by surface sand particles. Pronounced splashing combustion at t = 307 s and concomitant flame shape instability underscore the hazard associated with this transitional phase.
Conversely, sand layers exceeding 2 cm thickness exhibit pronounced suppression effects: flame height and luminosity decrease progressively. Flames display increased oscillation amplitude and reduced intensity, particularly during the attenuated burning phase, where the flame base becomes visually imperceptible. Only intermittent blue flames manifest at the sand surface, consistent with obstructed heat and mass transfer. Figure 11 documents flame height evolution for 90 g gasoline within varied-thickness porous media substrates. Figure 12 presents the corresponding flame probability density distribution, confirming the non-monotonic height trend and aligning with morphological analysis. The probability cloud further illustrates progressive flame height reduction and spatial contraction with increasing sand layer thickness, consistent with observed flame morphology.
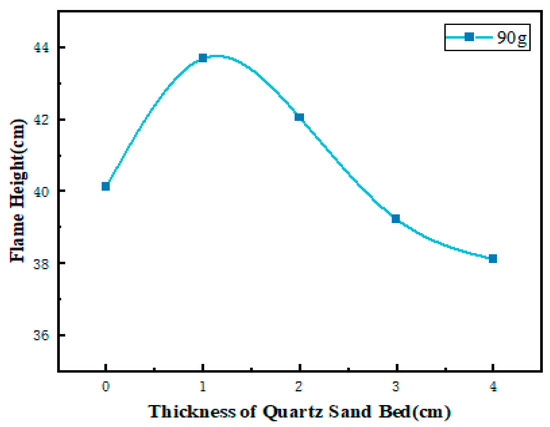
Figure 11.
Flame height diagram of 90 g gasoline immersed in porous media substrates of different thicknesses.
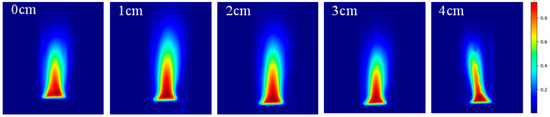
Figure 12.
Cloud map of flame probability density distribution of 90 g gasoline immersed in porous media substrates of different thicknesses.
Table 5 presents flame height measurements across experimental conditions. Comparison with the established Heskestad [24] empirical formula for pool fires (Hf = 0.235 Q0.4 − 1.02 D, where Hf denotes flame height, Q represents heat release rate, and D is the fuel pan diameter) reveals a deviation from the expected power-law relationship. This deviation arises from the coupled capillary and thermal insulation effects inherent to porous media substrates. The quartz sand employed, with a mean particle diameter = 0.15 mm and porosity = 0.42, exhibits strong capillary suction, enabling continuous upward fuel transport through the sand layer to sustain the flame zone. Concurrently, quartz sand’s low thermal conductivity relative to metals creates an insulating barrier between the fuel and underlying cold surfaces, reducing conductive heat losses. Thicker sand layers amplify this “thermal insulation” effect, retaining combustion heat near the fuel surface. This elevates flame root temperatures and enhances buoyancy, thereby increasing flame height—particularly during early-stage combustion where inhibited heat loss promotes peak fuel evaporation rates. However, the insulation effect exhibits duality: (a) beneficial heat retention for combustion enhancement, but (b) detrimental heat absorption by the sand matrix itself, delaying fuel evaporation—especially pronounced in thick sand layers.
Table 5.
Statistical table of flame height.
3.4.2. Mechanism Explanation of Porous MEDIA on Flame Morphology
To elucidate the respective influences of capillary action and thermal insulation on flame height, the following assumptions are adopted: (1) fuel transport occurs vertically within the sand bed, with lateral evaporation neglected; (2) local thermal equilibrium exists between solid and gas phases in the sand bed; (3) buoyancy dominance persists in the turbulent diffusion flame zone. Under these conditions, flame height can be characterized using Heskestad’s empirical correlation:
- (1)
- In granular packed beds, ideal circular tubes are absent. The pore structure is conventionally represented as an equivalent bundle of capillaries, with permeability determined via the Kozeny–Carman formulation [23]:
Within the formulation, dp denotes the average particle diameter 0.165 mm and ε represents porosity 0.43.
The theoretical capillary rise height is determined using Jurin’s formula [25]:
Within this formulation, γ denotes the fuel′s surface tension, θ represents the contact angle, ρ1 is the liquid fuel density, g signifies gravitational acceleration, and reff designates the equivalent capillary radius.
The equivalent capillary radius is expressed through the Kozeny–Carman empirical formulation [24]:
The empirical constant C ranges from 0.21 to 0.25, with C = 0.21 adopted in this study. Using the quartz sand particle size and porosity, the calculated equivalent capillary radius reff is 27 μm. With gasoline properties of 20 °C, density 0.74 kg/m3, surface tension 21 mN/m, and a contact angle of 20°, the theoretical capillary rise height hc is 11 cm. This value significantly exceeds the experimental sand layer thickness (h ≤ 4 cm), demonstrating that capillary-driven fuel supply remains sufficient throughout the experiments.
- (2)
- According to the Hagen–Poiseuille–Lucas–Washburn model, steady-state capillary flux is calculated as follows [26]:
Within the formulation, ε denotes porosity, represents the driving force gradient, γ is the fuel surface tension, ρ1 is the fuel density, and hc is the theoretical capillary rise height. When the experimental sand layer thickness h is less than hc, z ≈ h; therefore,
The steady-state capillary flux Jcap is insensitive to the thickness h of the sand layer, but sensitive to the porosity ε. Furthermore, dimensionless processing is applied to the capillary pressure difference and buoyancy pressure difference.
- (3)
- According to the Young–Laplace model, the capillary pressure difference can be expressed as follows [27]:
Within this formulation, γ is the fuel′s surface tension, θ is the contact angle, reff is the equivalent capillary radius, is the theoretical capillary rise heigh, is the liquid fuel density, and g signifies gravitational acceleration.
- (4)
- According to the Archimedes model, the buoyancy pressure difference can be expressed as follows [27]:
Within this formulation, denotes the air density, and h represents the sand layer thickness.
The dimensionless processing of the two results in the following:
The capillary buoyancy coupling coefficient is further defined as follows:
When (Ca > 1), the capillary driving effect exceeds the buoyancy enhancement induced by insulation effects. Conversely, when (Ca < 1), buoyancy induced by insulation predominates. To characterize insulation effects, the insulation coefficient is introduced according to the dimensionless thermal inertia parameter defined in the ASHRAE Handbook [28]:
Within the formulation, denotes the porous medium substrate’s volumetric heat capacity, represents the volumetric heat capacity of air, α is the thermal diffusivity of the sand bed, and tb signifies the characteristic combustion time. These parameters are treated as constants, therefore:
Normalize the insulation coefficient without dimensionality:
Among them, the normalized thickness href is taken as 0.01 m.
- (5)
- Adapted from the Heskestad free pool fire prediction formulation, a multiplicative correction factor is proposed for porous bed flames to account for the competing mechanisms of fuel quantity, diminished capillary fuel supply, and enhanced insulation:
For zero quartz sand layer thickness, flame height increased with fuel mass, but exhibited markedly diminished growth rates beyond 90 g. Consequently, mref was fixed at 90 g. Fitting 23 experimental datasets via the Levenberg–Marquardt algorithm yielded the following coefficients: a = 31.69, k1 = 0.18, k1 = 0.5, k1 = 0.12, k1 = 0.8, k1 = 0.15.
- (6)
- The final prediction model is represented as follows:
The estimated model yields a coefficient of determination (R2) of 0.92, indicating a strong correlation with experimental measurements. Figure 13 presents a comparison between experimental and predicted values, demonstrating excellent agreement, with an average relative error of 1.72%.
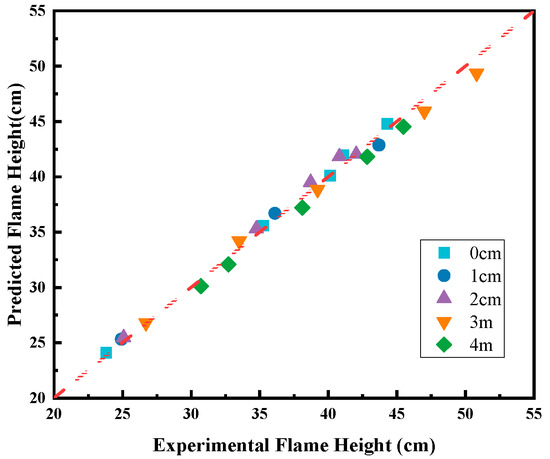
Figure 13.
Comparison between experimental and predicted values.
4. Conclusions
This study systematically investigates the combustion behavior of gasoline on a quartz sand substrate, yielding several critical quantitative and qualitative insights into the governing physical mechanisms. The main conclusions are summarized as follows:
- (1)
- Modified Combustion Process: The introduction of a porous substrate transforms the classical three-stage pool fire model by adding a ‘decay stage’, resulting in a four-stage framework. This modification is directly attributed to the dual effects of the dry sand layer formed during combustion—simultaneously acting as a thermal insulator and imposing mass transfer limitations.
- (2)
- Suppression of Combustion Intensity: The presence of the sand layer significantly attenuates combustion intensity. Dimensionless analysis reveals a power-law relationship between the dimensionless heat release rate () and the dimensionless sand layer thickness (), expressed as ∝ . This correlation enables quantitative prediction of fire intensity across varying sand layer configurations.
- (3)
- Attenuation of Flame Plume Temperature: The sand substrate also reduces the temperature profile of the flame plume. A predictive correlation for the dimensionless temperature rise has been established, demonstrating its dependence on both the dimensionless height and sand layer thickness. The derived equation, , quantitatively confirms that thicker sand layers lead to globally reduced temperature distributions within the flame plume.
- (4)
- Competition-Based Flame Height Prediction Model: Flame height is determined not solely by combustion intensity but by the interplay between capillary effects (fuel supply) and thermal effects (insulation and heat sink capabilities). To quantify this complex interaction, a novel predictive model was developed by coupling the capillary-buoyancy coefficient (Ca) with the dimensionless thermal inertia parameter (). The derived equation, , validated against 23 experimental datasets, the model exhibits excellent agreement (R2 = 0.92) with an average relative error of 1.72%.
These findings provide foundational understanding and robust quantitative tools for assessing unique risks associated with liquid fuel fires in porous media. Future work should focus on expanding model applicability, including investigations into additional liquid fuels (e.g., diesel, kerosene) and varied porous media properties (e.g., quartz sand particle size).
Author Contributions
Conceptualization, X.J.; methodology, K.L., X.J. and R.L.; software, P.Z., J.D., Y.Z. and S.W.; validation, K.L.; formal analysis, K.L.; investigation, J.D.; data curation, S.Z.; writing-original draft, K.L.; writing-review & editing, S.Z.; project administration, S.Z., Y.Z. and S.W.; funding acquisition, X.J. All authors have read and agreed to the published version of the manuscript.
Funding
This research was funded by the Chongqing Municipal Special Fund for Technological Innovation and Application Development (Grant No. CSTB2023TIAD-KPX0089), the Natural Science Foundation of China (52302422 and 52272338), the Natural Science Foundation of Chongqing, China (CSTB2024NSCQ-QCXMX0080 and CSTB2024NSCQ-MSX1039), the Natural Science Foundation of Chongqing (CSTB2023NSCQ-MSX0127), the Municipal Education Commission Science and Technology Research Program Project of Chongqing (KJZD-K202512901); All are gratefully acknowledged.
Data Availability Statement
Data sharing is not applicable (only appropriate if no new data is generated or the article describes entirely theoretical research): No new data were created or analyzed in this study.
Conflicts of Interest
The authors declare no conflicts of interest.
References
- Hirano, T.; Suzuki, T.; Sato, J.; Ohtani, H. Flame spread over crude oil sludge. Symp. (Int.) Combust. 1985, 20, 1611–1618. [Google Scholar] [CrossRef]
- Takeno, K.; Hirano, T. Behavior of combustible liquid soaked in porous beds during flame spread. Symp. (Int.) Combust. 1989, 22, 1223–1230. [Google Scholar] [CrossRef]
- Suzuki, T.; Kawamata, M.; Hirano, T. Flame spread over fuel-soaked sand in an opposed airflow. Fire Saf. Sci. 1989, 2, 199–208. [Google Scholar] [CrossRef]
- Suzuki, T.; Kawamata, M.; Matsumoto, K.; Hirano, T. Behavior of the reverse flow in front of the leading flame edge over fuel-soaked sand. Fire Saf. Sci. 1991, 3, 227–236. [Google Scholar] [CrossRef]
- Ishida, H. Initiation of fire growth on fuel-soaked ground. Fire Saf. J. 1992, 18, 213–230. [Google Scholar] [CrossRef]
- Kong, W.J.; Chao, C.Y.H.; Wang, J.H. Behavior of non-spread diffusion flames of combustible liquid soaked in porous beds. Proc. Combust. Inst. 2002, 29, 251–257. [Google Scholar] [CrossRef]
- Chao, C.Y.H.; Wang, J.H.; Kong, W. Effects of fuel properties on the combustion behavior of different types of porous beds soaked with combustible liquid. Int. J. Heat Mass Transf. 2004, 47, 5201–5210. [Google Scholar] [CrossRef]
- Zhang, Y.; Chen, C.; Lei, P.; Zhao, D.; Chen, C. A study on heat transfer feature and burning-decontamination rate of porous media bed soaked by combustible liquid. Int. J. Heat Mass Transf. 2023, 200, 123529. [Google Scholar] [CrossRef]
- Zhang, Y.; Chen, C.; Jiao, W.; Lei, P.; Chen, C. Experimental study on burning characteristic of liquid fuel–immersed porous media bed: Effect of particle gradation. Fuel 2023, 344, 128103. [Google Scholar] [CrossRef]
- Song, Z.; Jian, W.; Zhang, S. Simultaneous measurement of gas and solid temperatures in porous media. Int. J. Heat Mass Transf. 2024, 229, 125767. [Google Scholar] [CrossRef]
- Zanganeh, J.; Moghtaderi, B. Experimental study of temperature distribution and flame spread over an inert porous bed wetted with liquid fuel. Int. J. Emerg. Multidiscip. Fluid Sci. 2010, 2, 1–14. [Google Scholar] [CrossRef]
- Zanganeh, J.; Moghtaderi, B. Experimental and mathematical analysis of fuel penetration through unconsolidated porous media. Fire Mater. 2013, 37, 160–170. [Google Scholar] [CrossRef]
- Zanganeh, J.; Moghtaderi, B. Effect of fuel-soaked time and fuel ratio on the flame spread rate over a porous bed wetted with liquid fuel. Fire Saf. J. 2013, 59, 151–159. [Google Scholar] [CrossRef]
- Zanganeh, J.; Moghtaderi, B. Investigation of flame propagation over an inclined fuel-wetted porous bed. Fire Saf. J. 2014, 67, 113–120. [Google Scholar] [CrossRef]
- Fu, Y.Y.; Gao, Z.H.; Ji, J.; Li, K.Y.; Zhang, Y.M. Experimental study of flame spread over diesel and diesel-wetted sand beds. Fuel 2017, 204, 54–62. [Google Scholar] [CrossRef]
- Li, H.; Li, Z.; Wang, Q.; Ren, H. Heat transfer and spread characteristics of continuous ethanol spill fires on sand substrates. Process Saf. Environ. Prot. 2023, 176, 528–536. [Google Scholar] [CrossRef]
- Li, Z.; Wang, Q.; Li, H.; Mao, S. Experimental study on spread radius and burning rate of spill fires on a fine sand substrate. J. Therm. Anal. Calorim. 2023, 148, 12109–12118. [Google Scholar] [CrossRef]
- Zhai, X.; Chen, P.; Sun, S.; Li, L. Experimental study on heat transfer and propagation speed of spill fire on porous media substrate with micro-inclination. Int. Commun. Heat Mass Transf. 2023, 145, 106860. [Google Scholar] [CrossRef]
- Zhai, X.; Chen, P.; Li, L.; Liang, D. Experimental study on continuous spill fire of liquid fuel on porous bed. Energy Sources Part A Recovery Util. Environ. Eff. 2023, 45, 1937–1951. [Google Scholar] [CrossRef]
- Chen, C.K.; Lei, P.; Zhang, Y.L.; Xiao, H.; Xu, T.; Jiao, W.B. Experimental study of influence of fuel ratio on flame spread over a porous sand bed. Proc. Combust. Inst. 2020, 38, 511–519. [Google Scholar]
- Li, Y.; Gao, W.; Liu, F.; Zhang, Y.; Wang, J. An experimental study on flame geometrical characteristics and air entrainment of rectangular pool fires with different aspect ratios. Fire Saf. J. 2022, 131, 103603. [Google Scholar]
- Zhang, Y.; Chen, C.; Lei, P.; Zhao, D.Y. Experimental Study on Effect of Infiltration Depth on Burning Characteristic and Fuel Residual Feature of Inert Porous Media Bed Soaked by Combustible Liquid. Fire Technol. 2024, 60, 1163–1184. [Google Scholar] [CrossRef]
- Kong, D.; Liu, P.; Wang, C.; Chen, G. Small-scale experiment study on burning rate characteristics of boilovers. J. China Univ. Pet. (Ed. Nat. Sci.) 2017, 41, 136–143. [Google Scholar]
- Heskestad, G. Fire plumes, flame height, and air entrainment. In SFPE Handbook of Fire Protection Engineering, 5th ed.; Hurley, M.J., Ed.; Springer: New York, NY, USA, 2016; pp. 583–620. [Google Scholar]
- Quéré, D. Capillary phenomena: Capillary rise and Jurin’s law. Europhys. News 2007, 38, 12–15. [Google Scholar]
- Washburn, E.W. The dynamics of capillary flow. Phys. Rev. 1921, 17, 273–283. [Google Scholar] [CrossRef]
- Naylor, D.; Tsai, S.S.H. Archimedes’ principle with surface tension effects in undergraduate fluid mechanics. Int. J. Mech. Eng. Educ. 2021, 50, 749–763. [Google Scholar] [CrossRef]
- ASHRAE. ASHRAE Handbook: Fundamentals; American Society of Heating, Refrigerating and Air-Conditioning Engineers: Peachtree Corners, GA, USA, 2017. [Google Scholar]
Disclaimer/Publisher’s Note: The statements, opinions and data contained in all publications are solely those of the individual author(s) and contributor(s) and not of MDPI and/or the editor(s). MDPI and/or the editor(s) disclaim responsibility for any injury to people or property resulting from any ideas, methods, instructions or products referred to in the content. |
© 2025 by the authors. Licensee MDPI, Basel, Switzerland. This article is an open access article distributed under the terms and conditions of the Creative Commons Attribution (CC BY) license (https://creativecommons.org/licenses/by/4.0/).