Abstract
Background: Rural fires represent a significant environmental and socioeconomic challenge in Mediterranean regions, particularly in Portugal, which experiences some of the highest fire incidences in Europe. Understanding the temporal evolution of fire occurrences and their relationship with climatic parameters is crucial for developing effective fire management strategies and adapting to climate change impacts. This study aims to analyze the evolution of rural fire occurrences in Guimarães, northern Portugal, during the period 1980–2020, and to investigate their relationship with climatic parameters, specifically temperature and precipitation patterns. Methods: We analyzed a comprehensive dataset of rural fire occurrences and burnt areas in the Guimarães municipality from 1980 to 2020, along with corresponding climatic data including mean annual temperature and total annual precipitation. Statistical analyses included descriptive statistics, Mann–Kendall trend analysis, Pearson and Spearman correlation analyses, and multiple linear regression modeling. The relationships between fire variables and climatic parameters were examined using both parametric and non-parametric approaches. Results: The analysis revealed significant temporal trends and climate–fire relationships. Mean annual temperature showed a statistically significant increasing trend (Mann–Kendall Z = 3.055, p = 0.002) with a Sen’s slope of 0.032 °C/year, representing approximately 1.3 °C warming over the 40-year period. Rural fire occurrences demonstrated a positive correlation with mean temperature (Pearson r = 0.459, p = 0.003; Spearman ρ = 0.453, p = 0.003), while total burnt area also showed significant positive correlation with temperature (Pearson r = 0.426, p = 0.005; Spearman ρ = 0.466, p = 0.002). Precipitation showed no significant correlation with fire variables. Multiple regression models explained 23.1% of the variance in fire occurrences and 18.3% of the variance in burnt area, with temperature being the primary climatic predictor. Conclusions: The study provides evidence of a significant warming trend in Guimarães over the past four decades, which is positively associated with increased rural fire activity. The consistent relationship between temperature and fire variables suggests that continued climate warming may lead to increased fire risk in the region. These findings have important implications for fire management strategies and climate adaptation planning in northern Portugal.
1. Introduction
Rural fires represent one of the most significant environmental challenges facing Mediterranean regions, with Portugal experiencing particularly severe impacts due to its climatic conditions, topography, and land use patterns [1]. The country has consistently ranked among the European nations with the highest fire incidence, with approximately 4.6 million hectares burned between 1984 and 2021 [2]. This high fire activity has profound implications for ecosystem integrity, biodiversity conservation, air quality, and human safety, making the understanding of fire–climate relationships a critical research priority.
The relationship between climate and wildfire activity has been extensively documented in the scientific literature, with temperature, precipitation, humidity, and wind patterns identified as key meteorological drivers of fire behavior [3,4]. Rising temperatures associated with climate change have been linked to increased fire danger through multiple mechanisms, including enhanced fuel drying, extended fire seasons, and more frequent extreme weather conditions conducive to fire ignition and spread [5]. The Fire Weather Index (FWI) system, developed by the Canadian Forest Service, has proven particularly effective in quantifying these relationships by integrating multiple meteorological variables into composite indices that reflect fire danger conditions [6].
Portugal’s fire regime is characterized by strong seasonal patterns, with the majority of fires occurring during the dry summer months when temperatures are highest and precipitation is minimal [7]. The country’s Mediterranean climate, characterized by hot, dry summers and mild, wet winters, creates conditions that are inherently conducive to fire activity. However, recent decades have witnessed significant changes in both climatic conditions and fire patterns, with several studies documenting increasing trends in temperature and fire activity across different regions of Portugal [8,9].
The northern region of Portugal, including the municipality of Guimarães, presents a particularly interesting case study for examining climate–fire relationships. This region is characterized by a transitional climate between Mediterranean and Atlantic influences, with higher precipitation levels compared to southern Portugal but still experiencing significant fire activity [10]. The landscape is characterized by a mosaic of urban, agricultural, and forest areas, creating a complex wildland–urban interface that increases both fire risk and potential impacts on human communities [11].
Beyond the local specifics, Guimarães is emblematic of Atlantic–Mediterranean transition zones where humid oceanic influences coexist with summer-dry regimes. Such boundary regions occur across north-western Iberia and in other mid-latitude coastal belts with comparable seasonality and wildland–urban interfaces. Insights from this case therefore speak to settings that combine high fuel productivity, rapid summer drying, and fragmented landscapes—conditions shown to modulate climate–fire coupling in Mediterranean-type ecosystems [3,4,5,11].
Previous research has established important foundations for understanding fire–climate relationships in Portugal. Carvalho et al. [12] demonstrated significant correlations between the Canadian Fire Weather Index system components and fire activity across 11 Portuguese districts, explaining 60.9–80.4% of the variance in area burned and 47.9–77.0% of the variance in fire occurrences. Pereira et al. [13] analyzed the effects of regional climate change on rural fires in Portugal, identifying temperature and drought conditions as primary drivers of fire activity. More recently, studies have begun to examine high-resolution projections of future fire weather conditions, suggesting continued increases in fire danger under climate change scenarios [14]. Similar combinations of climate, topography, and land use occur in other Mediterranean-type regions worldwide, underscoring the broader relevance of the Guimarães case beyond Portugal [3,4,5,11].
The municipality of Guimarães, located in the Minho region of northern Portugal, provides an excellent case study for examining long-term trends in fire activity and their relationship with climatic parameters. The region has experienced significant changes in land use patterns over recent decades, with rural abandonment and urbanization creating new challenges for fire management [15]. A recent historical analysis by Nunes et al. [16] examined landscape and population dynamics in Guimarães from 1975 to 2019, documenting increasing trends in rural fire occurrences and identifying climate change as a contributing factor.
At the international scale, there remains a paucity of long-term, municipal-scale analyses that link observed climate trends to both fire occurrence and burned areas with consistent methods. Much of the literature reports national or regional aggregations, while local studies often span shorter periods or focus on single indicators. By assembling a 40-year record for one municipality and pairing it with observed temperature and precipitation, this study addresses that gap and provides a rare longitudinal perspective at the scale where prevention, preparedness, and land use regulation are implemented. In contrast to broader regional or national studies, such as Carvalho et al. [12] who examined fire activity across Portuguese districts using the Canadian Fire Weather Index (FWI) and explained higher variance (60.9–80.4% for burnt area), this analysis focuses on a single municipality with direct temperature and precipitation variables, avoiding composite indices to isolate fundamental climatic drivers at a finer scale. Similarly, while Pereira et al. [13] compiled a national fire database for 1980–2005 emphasizing synoptic patterns and drought, the present study extends the temporal coverage to 2020 and incorporates non-parametric trend analyses (Mann–Kendall) alongside regression modeling to quantify evolving relationships in a transitional Atlantic–Mediterranean context. Furthermore, unlike the author’s previous work [16] on landscape and population dynamics in Guimarães (1975–2019), which identified rural abandonment as a fire risk factor but did not statistically link it to climatic trends, this research prioritizes climate–fire correlations using a comprehensive 40-year dataset, providing robust evidence for temperature as a primary predictor while acknowledging the interplay with non-climatic elements. These distinctions enable a more targeted, local-level understanding that complements larger-scale efforts and informs municipal adaptation strategies.
Despite the growing body of research on fire–climate relationships in Portugal, there remains a need for detailed, long-term analyses that can provide robust statistical evidence of these relationships at the local scale. Understanding temporal trends and climate associations at the municipal level is crucial for developing effective fire management strategies and adapting to changing environmental conditions. Furthermore, the integration of multiple statistical approaches, including trend analysis, correlation analysis, and regression modeling, can provide a comprehensive understanding of the complex relationships between climate and fire activity.
Equally important, the study contributes a transferable analytical framework. The combination of Mann–Kendall trend testing with Sen’s slope, parametric and rank correlations, multiple linear regression, and decadal stratification offers a transparent workflow that can be replicated with standard datasets and open-source tools [17,18]. This design is intentionally modular, allowing other municipalities and regions to substitute their fire and climate series, extend the predictor set (e.g., humidity, wind, drought indices), and benchmark outcomes in a comparable way.
The present study addresses these research needs by conducting a comprehensive statistical analysis of rural fire occurrences in Guimarães over 40 years (1980–2020) and examining their relationships with key climatic parameters. The specific objectives are: (1) to characterize the temporal evolution of rural fire occurrences and burnt area in Guimarães from 1980 to 2020; (2) to analyze trends in climatic parameters (temperature and precipitation) over the same period; (3) to quantify the relationships between fire variables and climatic parameters using multiple statistical approaches; and (4) to present a reproducible, municipal-scale methodology whose steps can be transferred to other Atlantic–Mediterranean transition zones and to municipalities worldwide with analogous seasonal regimes. The broader aim is to inform local decision making while providing a template for comparative studies beyond Portugal.
2. Materials and Methods
2.1. Study Area
The study was conducted in the municipality of Guimarães, located in the northern region of Portugal (41°26′ N, 8°17′ W) within the district of Braga. Guimarães covers an area of approximately 241 km2 and is situated in the Minho region, characterized by a transitional climate between Mediterranean and Atlantic influences. The municipality is divided into 48 parishes and had a population of 158,124 inhabitants as of the 2021 census, with 54,097 residents living in the urban center, making it a suitable proxy for other Atlantic–Mediterranean transition municipalities.
Guimarães was selected because it typifies an Atlantic–Mediterranean transition zone where humid oceanic influences intersect with summer-dry conditions, amplifying seasonal fire–weather contrasts. The municipality combines high fuel productivity in spring with rapid summer drying and heat extremes, a dense wildland–urban interface related to suburban expansion, and documented land use changes since the 1980s (rural abandonment of marginal agriculture, plantation forestry, and urbanization). This combination makes Guimarães representative of many peri-urban landscapes in Mediterranean-type regions and, therefore, an informative testbed for municipal-scale climate–fire analysis.
The landscape of Guimarães is characterized by a complex mosaic of land uses, including urban areas, agricultural lands, and forest patches. This dispersed land use pattern, typical of the Entre-Douro-e-Minho region, creates extensive wildland–urban interfaces that increase both fire risk and potential impacts on human communities. The topography is relatively gentle, with elevations ranging from approximately 100 to 600 m above sea level.
The climate of Guimarães is characterized by mild, wet winters and warm, relatively dry summers. Mean annual temperature typically ranges from 13 to 16 °C, while annual precipitation varies between 1000 and 2200 mm, with the majority falling during the winter months (October–March). The region experiences a distinct dry season during summer (June–September), which coincides with the peak fire season in Portugal.
Although systematic municipal records are sparse before 1980, historical sources indicate episodic large fires in north-western Portugal during the 1960s–1970s, often linked to heatwaves and seasonal drought, alongside rural depopulation and increases in fuel continuity. These accounts suggest that the 1980–2020 window encompasses a period of intensifying climatic forcing and landscape change rather than an isolated anomaly, supporting the interpretability of the long-term trends derived here.
2.2. Data Sources and Collection
2.2.1. Fire Data
Rural fire occurrence data for the Guimarães municipality were obtained from official fire statistics covering the period 1980–2020. The dataset includes annual records of the number of rural fire occurrences and total burnt area (in hectares) for each year. These data represent all recorded rural fire events within the municipal boundaries, regardless of size or cause. Were used the official national rural-fire database curated by the Instituto da Conservação da Natureza e das Florestas (ICNF) as the primary source for 1980–2020. Throughout the study we adopted THE ICNF definitions and counting rules—‘rural fire’ as the unit of analysis, including forest and shrubland fires and escaped agricultural burns; events are counted once at ignition, and burned area corresponds to the official post-event assessment. All auxiliary information described below was harmonized to these ICNF standards prior to any analysis.
To ensure data homogeneity over time, records were standardized across sources using consistent classification criteria for fire occurrences and burnt area measurements, with any changes in reporting methodologies (e.g., due to administrative updates in the 1990s) accounted for through cross-validation against independent historical records. Homogeneity tests, including Pettitt’s test for change points, were applied to detect and adjust for potential discontinuities, confirming no significant breaks that could bias trend analyses [17].
Data processing methodology involved several standardized steps to ensure accuracy and consistency. Initially, raw records were cleaned by removing duplicates and incomplete entries using pandas library functions for data manipulation. Outliers, such as unusually high fire occurrences or burnt areas deviating by more than three standard deviations (z-score > 3), were identified and verified against historical documentation; erroneous values were corrected or imputed based on adjacent years’ averages where appropriate. For temporal homogenization, beyond Pettitt’s test, data from different sources were aligned using a common classification system for fire types and burnt area estimation methods, with any methodological shifts (e.g., improved satellite mapping post-2000) adjusted via regression-based calibration to maintain comparability across the 1980–2020 period. Finally, the processed dataset was aggregated annually, with summary checks for consistency performed using descriptive statistics to confirm no residual anomalies.
A documented reconciliation protocol with clear precedence rules. The ICNF was always considered the authoritative record for both occurrence counts and burned area. Auxiliary sources were used to (a) fill missing attributes when the ICNF recorded an event but lacked a value (e.g., burned area), (b) confirm an event’s occurrence when it had clear municipal and temporal identifiers but was absent from the monthly ICNF aggregation, and (c) flag potential duplicates. In cases of conflicting burned area values, the ICNF value took precedence; auxiliary sources were only used when the ICNF recorded the event but left the area as missing, and the auxiliary data provided a measurement traceable to an official assessment. When an event appeared only in auxiliary sources, it was included in occurrence counts only if definitional equivalence could be demonstrated; if the burned area could not be verified to ICNF standards, the event contributed to counts but not to area totals.
All auxiliary records were screened for definitional equivalence with ICNF standards. Only entries explicitly classified as rural/forest fires, occurring within the administrative boundary of Guimarães, and with clear time and location stamps were retained. When auxiliary sources used broader labels (e.g., ‘incident’ or ‘vegetation fire’), entries were included only if documentation allowed unambiguous mapping to the ICNF ‘rural fire’ definition. If this mapping was not possible, the entry was discarded.
The analysis spans 1980–2020 by design. The earliest year for which municipal-scale fire records are consistently available in Portugal with stable definitions, and for which continuous, quality-controlled climate observations exist for the study area is 1980. Starting in 1980 also captures the onset of the accelerated warming and drying trends observed since the late twentieth century, together with major socio-economic transitions (land use reconfiguration and urban growth) that shape fire regimes.
Earlier decades (pre-1980) lack harmonized, municipal-level fire statistics and continuous climate series of comparable quality, which limits the robustness of trend detection and attribution at the scale of local governance. Where information exists, it is typically fragmented (civil-protection bulletins, forestry reports, newspaper archives) and methodologically heterogeneous, making direct comparisons problematic.
Quality control procedures were implemented to ensure data consistency and reliability. This included cross-referencing records from different sources, identifying and correcting obvious errors or inconsistencies, and verifying extreme values through additional documentation when available. The final dataset comprises 41 years of continuous fire occurrence records, providing a robust foundation for temporal trend analysis.
2.2.2. Climatic Data
Daily temperature and precipitation for 1980–2020 were obtained exclusively from the Meteoblue® historical weather archive at the coordinates of Guimarães. Because there is no long-record meteorological station within the municipality, using a single provider for the entire period ensures consistent variable definitions and processing across the time series. The Meteoblue dataset is produced by assimilating observations from the nearest national stations and global reanalysis into a high-resolution modeling framework, yielding a spatially representative and methodologically uniform record for the study area. Similar homogeneity procedures, including Pettitt’s test, were applied to detect any shifts due to station relocations or instrumentation changes, ensuring temporal consistency across the dataset [17].
Data processing methodology involved several standardized steps to ensure accuracy and consistency. Initially, raw records were cleaned by removing duplicates and incomplete entries using pandas library functions for data manipulation. Outliers, such as unusually high fire occurrences or burnt areas deviating by more than three standard deviations (z-score > 3), were identified and verified against historical documentation; erroneous values were corrected or imputed based on adjacent years’ averages where appropriate. For temporal homogenization, beyond Pettitt’s test, data from different sources were aligned using a common classification system for fire types and burnt area estimation methods, with any methodological shifts (e.g., improved satellite mapping post-2000) adjusted via regression-based calibration to maintain comparability across the 1980–2020 period. Finally, the processed dataset was aggregated annually, with summary checks for consistency performed using descriptive statistics to confirm no residual anomalies.
Temperature data were calculated as the average of daily mean temperatures for each calendar year, while precipitation data represent the sum of daily precipitation totals for each year. Monthly temperature and precipitation data were also collected to enable seasonal analysis and to calculate annual means and totals with greater accuracy.
Data quality control procedures included the identification and correction of outliers, gap filling using interpolation methods when necessary, and validation against nearby meteorological stations. The final climatic dataset provides complete annual records for both temperature and precipitation variables for the entire study period (1980–2020).
2.3. Statistical Analysis
The statistical methods employed in this study were selected to directly address the research objectives. Descriptive statistics (Section 2.3.1) and decadal analysis (Section 2.3.5) characterize the temporal evolution of rural fire occurrences and burnt area (objective 1) and climatic parameters (objective 2). Mann–Kendall trend analysis and Sen’s slope estimator (Section 2.3.2) quantify long-term trends in both fire and climatic variables, fulfilling objectives 1 and 2. Correlation analyses (Pearson and Spearman; Section 2.3.3) and multiple linear regression modeling (Section 2.3.4) examine and quantify the relationships between fire variables and climatic parameters (objective 3), providing robust parametric and non-parametric assessments. These approaches collectively support the discussion of implications for fire management and climate adaptation (objective 4) by generating reliable evidence of climate–fire dynamics. The selection of these five statistical methods was guided by their complementary strengths in handling time-series data typical of fire and climate studies, where non-normality, outliers, and potential non-linear relationships are common [17].
Descriptive statistics provide an essential foundation by summarizing data distributions and variability, informing subsequent analyses such as trend detection. Specifically, descriptive analysis functions as the initial step in the methodology to elucidate central tendencies, dispersion, and distributional properties (e.g., skewness and kurtosis), which are crucial for validating assumptions in parametric tests, detecting anomalies in fire and climate data, and guiding the selection of non-parametric alternatives like Mann–Kendall where non-normality is evident [17]. By providing this baseline characterization, it ensures the reliability of downstream inferences and enhances interpretability of trends and relationships.
The Mann–Kendall test and Sen’s slope were chosen for trend analysis due to their non-parametric nature and robustness to non-normal distributions and autocorrelation, allowing reliable identification of monotonic changes over time without assuming linearity [17,18]. Correlation analyses (Pearson and Spearman) were selected to explore bivariate relationships, with Pearson assessing linear associations and Spearman capturing monotonic ones, thus accommodating potential non-linearities in climate–fire interactions. Multiple linear regression extends these by modeling combined effects of predictors, quantifying explained variance while controlling for multicollinearity, and building directly on correlation results to test multivariate hypotheses.
Finally, a decadal ANOVA with post hoc test was included to reveal coarser temporal patterns and group differences, interconnecting with trend analysis to validate long-term changes at a decadal scale and providing context for regression interpretations. Together, these methods form an interconnected framework: descriptive and trend analyses establish baseline patterns, correlations identify key associations, regression quantifies predictive power, and decadal grouping offers interpretive depth, ensuring a multi-faceted examination of the data. The interconnections among these techniques create a logical progression: descriptive statistics establish the data’s foundational characteristics, which inform the application of trend analysis to detect temporal changes; identified trends then contextualize correlation assessments of bivariate relationships, which in turn provide the basis for multiple regression to model multivariate interactions; finally, decadal analysis interconnects with trends and regressions by grouping data for comparative validation, closing the analytical loop and enabling comprehensive insights into climate–fire dynamics.
2.3.1. Descriptive Statistics
Descriptive statistics serve a critical function in the research methodology by providing an initial overview of the data’s central tendencies, variability, and distributional characteristics, which inform the appropriateness of subsequent analytical techniques and facilitate the identification of patterns or outliers in fire occurrences and climatic variables. Comprehensive descriptive statistics were calculated for all variables to characterize the central tendency, variability, and distribution properties of the data. These included measures of central tendency (mean, median), variability (standard deviation, interquartile range), and distribution shape (skewness, kurtosis). Box plots and histograms were used to visualize data distributions and identify potential outliers or unusual patterns.
2.3.2. Trend Analysis
Temporal trends in fire occurrences, burnt area, and climatic variables were analyzed using the Mann–Kendall test, a non-parametric statistical test that is robust to non-normal data distributions and outliers [17]. The Mann–Kendall test was chosen partly for its robustness to temporal autocorrelation in time series data, as it does not assume independence of observations, though pre-whitening was applied where serial correlation was detected using the Durbin–Watson statistic to minimize potential biases in trend detection [17]. The Mann–Kendall test evaluates the null hypothesis that there is no trend in the time series against the alternative hypothesis that a monotonic trend exists. The test statistic S is defined as:
where n is the number of data points; xi and xj are the observed values at time points i and j, respectively; and the sign function is defined as:
The standardized test statistic Z is then computed, and the significance of the trend is evaluated using standard normal distribution tables. Sen’s slope estimator was used to quantify the magnitude of detected trends, providing a robust estimate of the rate of change per unit time [18].
2.3.3. Correlation Analysis
Relationships between fire variables (number of occurrences and burnt area) and climatic parameters (temperature and precipitation) were examined using both Pearson product-moment correlation and Spearman rank correlation coefficients. Pearson correlation was used to assess linear relationships between variables, while Spearman correlation was employed to evaluate monotonic relationships that may be non-linear.
Correlation coefficients were calculated for all possible pairs of fire and climate variables, with statistical significance evaluated at α = 0.05. Confidence intervals for correlation coefficients were calculated using Fisher’s z-transformation to provide additional information about the precision of the estimates.
Temporal autocorrelation in residuals was assessed using the Durbin–Watson test, with no significant autocorrelation detected (DW ≈ 2.0 for both models), confirming the independence assumption and enhancing the reliability of the regression results.
2.3.4. Multiple Linear Regression Analysis
Multiple linear regression models were developed to examine the combined effects of climatic variables on fire activity and to quantify the proportion of variance in fire variables that climatic factors can explain. Separate models were constructed for fire occurrences and burnt area as dependent variables, with mean annual temperature and total annual precipitation as independent variables.
Before model fitting, all variables were standardized to facilitate a comparison of regression coefficients and to improve model stability. Model assumptions were evaluated through residual analysis, including tests for normality, homoscedasticity, and independence of residuals. The coefficient of determination (R2) and adjusted R2 were calculated to assess model performance, while F-statistics were used to evaluate overall model significance.
Temperature and precipitation were selected as primary climate driving factors due to their direct influence on fuel moisture and fire ignition potential in Mediterranean climates, as established in the literature [3,4]. While presented individually in correlation analyses for clarity, their combined effects are examined here in a multivariate context, accounting for potential interactions where rising temperatures may exacerbate fire risk even under stable precipitation regimes [19]. This approach contextualizes these factors within broader fire–climate dynamics, though it acknowledges the limitations in not including additional variables like humidity or wind, which are addressed in the Discussion.
2.3.5. Decadal Analysis
To examine changes in fire and climate patterns over time, data were grouped by decade (1980s, 1990s, 2000s, 2010s) and summary statistics were calculated for each period. Analysis of variance (ANOVA) was used to test for significant differences between decades, followed by post hoc tests when significant differences were detected.
2.4. Software and Tools
All statistical analyses were performed using Python 3.11 with the following libraries: pandas for data manipulation, numpy for numerical computations, scipy for statistical tests, matplotlib and seaborn for data visualization, and scikit-learn for regression analysis. Data visualization followed best practices for scientific publication, with high-resolution figures (300 dpi) generated for all graphical outputs.
3. Results
3.1. Descriptive Statistics
The descriptive statistics for rural fire occurrences and climatic variables in Guimarães during 1980–2020 are presented in Table 1. Rural fire occurrences showed considerable variability over the study period, with a mean of 405.93 occurrences per year (median = 342.00, SD = 289.38). The number of annual fire occurrences ranged from a minimum of 1 in 1980 to a maximum of 1102 in 1998, demonstrating the high inter-annual variability characteristic of fire regimes in Mediterranean environments.

Table 1.
Descriptive statistics of rural fire occurrences and climatic variables in Guimarães (1980–2020).
Total burnt area exhibited even greater variability, with a mean of 446.59 hectares per year (median = 381.80, SD = 372.18). The burnt area ranged from 10.10 hectares in 1985 to 1840.60 hectares in 1989. The distribution of burnt area showed positive skewness (1.48) and high kurtosis (3.26), indicating a right-skewed distribution with occasional years of exceptionally large burnt areas.
Mean annual temperature averaged 14.76 °C over the study period (median = 14.90 °C, SD = 0.84 °C), with values ranging from 12.60 °C in 1983 to 16.80 °C in 2017. The temperature distribution was approximately normal (skewness = −0.10, kurtosis = 0.29), facilitating the use of parametric statistical tests. Total annual precipitation averaged 1534.09 mm (median = 1595.80 mm, SD = 363.99 mm), ranging from 953.00 mm in 1992 to 2227.00 mm in 2001. The precipitation distribution was also approximately normal (skewness = −0.05, kurtosis = −1.17).
The frequency distributions of all variables are illustrated in Figure 1, which shows histograms with overlaid mean and median values. Rural fire occurrences showed a right-skewed distribution with a long tail of high-activity years, while burnt area exhibited an even more pronounced right-skewed distribution with several extreme years.
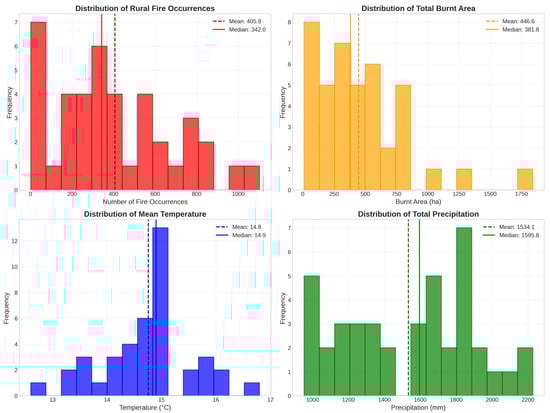
Figure 1.
Frequency distributions of rural fire occurrences, total burnt area, mean temperature, and total precipitation in Guimarães (1980–2020). Vertical lines indicate mean (dashed) and median (solid) values.
3.2. Temporal Trends
The results of the Mann–Kendall trend analysis are summarized in Table 2. Mean annual temperature showed a statistically significant increasing trend over the 40-year study period (Mann–Kendall Z = 3.055, p = 0.002), with Sen’s slope indicating a warming rate of 0.032 °C per year. This represents an estimated total warming of approximately 1.3 °C over the entire study period, which is consistent with regional climate change projections for northern Portugal.
Table 2.
Mann–Kendall trend analysis for rural fire occurrences and climatic variables in Guimarães (1980–2020). Significance levels: * p < 0.01, ** p < 0.1, ns = not significant.
Rural fire occurrences demonstrated a positive trend (Sen’s slope = 5.737 occurrences/year), although this trend was not statistically significant at the α = 0.05 level (Mann–Kendall Z = 1.337, p = 0.181); however, the trend approached marginal significance, suggesting a potential increase in fire frequency over time. Total burnt area showed a marginally significant increasing trend (Mann–Kendall Z = 1.842, p = 0.065), with Sen’s slope indicating an increase of 8.377 hectares per year.
Total annual precipitation showed no significant trend over the study period (Mann–Kendall Z = 0.000, p = 1.000), with Sen’s slope near zero (0.002 mm/year), indicating stable precipitation patterns despite the observed warming trend.
The temporal evolution of all variables is illustrated in Figure 2, which shows the annual time series for fire occurrences, burnt area, temperature, and precipitation from 1980 to 2020. The figure clearly demonstrates the increasing temperature trend and the high inter-annual variability in fire variables, with several notable peaks in fire activity during the 1990s and early 2000s.
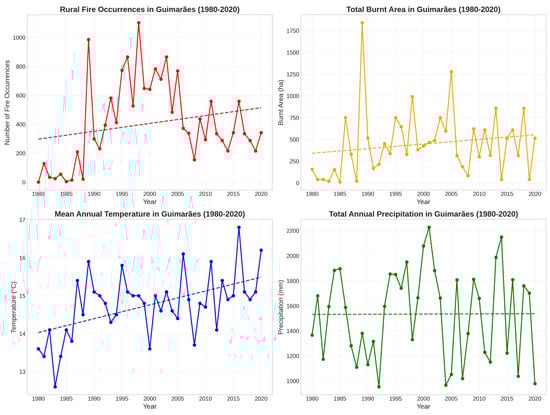
Figure 2.
Time series of rural fire occurrences, total burnt area, mean temperature, and total precipitation in Guimarães (1980–2020). Dashed lines represent linear trends.
3.3. Climate–Fire Relationships
Correlation analysis revealed significant positive relationships between temperature and both fire variables, as detailed in Table 3. Rural fire occurrences showed moderate positive correlations with mean annual temperature (Pearson r = 0.459, p = 0.003; Spearman ρ = 0.453, p = 0.003). Similarly, total burnt area was significantly correlated with temperature (Pearson r = 0.426, p = 0.005; Spearman ρ = 0.466, p = 0.002).
Table 3.
Correlation analysis between rural fire variables and climatic parameters in Guimarães (1980–2020). Significance levels: * p < 0.01, ns = not significant.
In contrast, precipitation showed weak and non-significant correlations with both fire variables. The correlation between fire occurrences and precipitation was weak and non-significant (Pearson r = 0.120, p = 0.456; Spearman ρ = 0.112, p = 0.485), as was the correlation between burnt area and precipitation (Pearson r = −0.050, p = 0.756; Spearman ρ = 0.014, p = 0.933).
The relationships between fire variables and climatic parameters are visualized in Figure 3, which presents scatter plots with fitted regression lines for all variable pairs. The positive relationships between temperature and fire variables are evident, while the relationships with precipitation show no clear patterns.
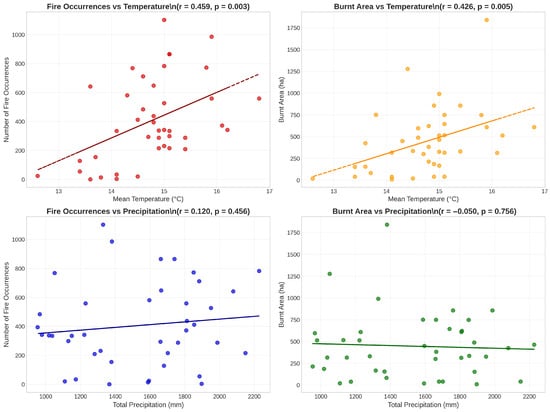
Figure 3.
Scatter plots showing relationships between fire variables and climatic parameters in Guimarães (1980–2020). Dashed lines represent linear regression fits with correlation coefficients and p-values.
The correlation matrix presented in Figure 4 provides a comprehensive overview of all pairwise relationships between variables. The strongest correlations observed were between temperature and fire variables, while precipitation showed weak correlations with all other variables.
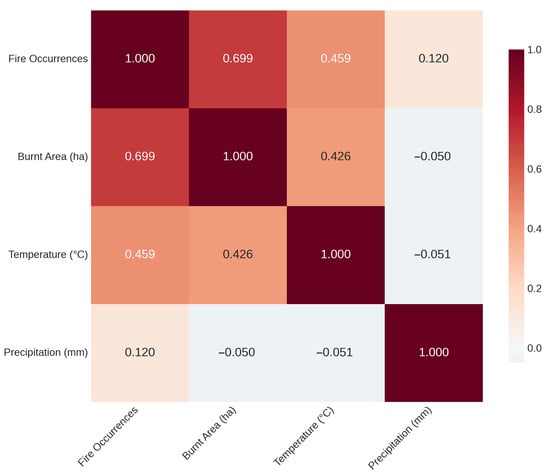
Figure 4.
Correlation matrix showing pairwise relationships between all variables in Guimarães (1980–2020).
3.4. Multiple Regression Analysis
Multiple linear regression models were developed to examine the combined effects of temperature and precipitation on fire variables, with results presented in Table 4. The model for rural fire occurrences explained 23.1% of the variance (R2 = 0.231, adjusted R2 = 0.190), with both temperature and precipitation showing positive coefficients. However, the model performance was modest, suggesting that climatic factors alone cannot fully explain the variability in fire occurrences.
Table 4.
Multiple linear regression analysis results for rural fire variables as dependent variables and climatic parameters as independent variables in Guimarães (1980–2020).
The model for total burnt area explained 18.3% of the variance (R2 = 0.183, adjusted R2 = 0.139), with temperature showing a positive coefficient and precipitation showing a negative coefficient. The F-statistics for both models indicated overall statistical significance, although the relatively low R2 values suggest that additional factors beyond the climatic variables examined contribute significantly to fire variability.
The standardized regression coefficients indicated that temperature was the more important predictor variable in both models, consistent with the correlation analysis results. The positive coefficient for temperature in both models supports the hypothesis that warming temperatures are associated with increased fire activity in the study region.
3.5. Decadal Analysis
Analysis of decadal patterns revealed important changes in both fire and climate variables over time, as summarized in Table 5. Mean temperature showed a clear increasing pattern across decades, from 14.3 °C in the 1980s to 15.4 °C in the 2010s. This progressive warming is consistent with the significant trend detected in the Mann–Kendall analysis.
Table 5.
Decadal summary statistics (mean ± standard deviation) for rural fire occurrences and climatic variables in Guimarães (1980–2020).
Fire occurrences showed considerable variation between decades, with the highest mean values observed in the 1990s (mean = 623.4 ± 312.8 occurrences/year) and 2000s (mean = 542.8 ± 201.4 occurrences/year). The 1980s showed the lowest fire activity (mean = 175.2 ± 312.1 occurrences/year), which may reflect both climatic conditions and potential changes in fire reporting or land management practices. Burnt area patterns were similar to fire occurrences, with peak values in the 1990s (mean = 612.3 ± 445.2 ha/year) and 2000s (mean = 531.7 ± 287.4 ha/year). The 2010s showed intermediate values for both fire variables, suggesting some moderation in fire activity during the most recent decade despite continued warming. Precipitation showed no clear decadal pattern, with values fluctuating around the long-term mean across all decades.
Analysis of variance (ANOVA) confirmed significant decadal differences for rural fire occurrences (F = 4.953, p = 0.005) and mean temperature (F = 3.835, p = 0.017), but not for total burnt area (F = 1.094, p = 0.364) or total precipitation (F = 1.383, p = 0.263). These results support the observed patterns of increasing temperature and variable fire activity across decades, with no significant changes in precipitation.
Post hoc Tukey’s HSD tests for rural fire occurrences revealed significant differences between the 1980s and 1990s (mean difference = 445.8, p = 0.006) and between the 1980s and 2000s (mean difference = 372.8, p = 0.026), but no other pairwise differences (p > 0.05). For mean temperature, significant differences were found only between the 1980s and 2010s (mean difference = 0.99, p = 0.015), confirming the progressive warming trend. Detailed post hoc results are presented in Table 6.
Table 6.
Post hoc Tukey’s HSD test results for significant decadal differences in rural fire occurrences and mean temperature in Guimarães (1980–2020). Only pairwise comparisons with p < 0.05 are shown as significant.
The decadal patterns are further illustrated in Figure 5, which presents box plots showing the distribution of each variable by decade. The progressive increase in temperature across decades is clearly visible, while fire variables show peak activity in the middle decades of the study period.
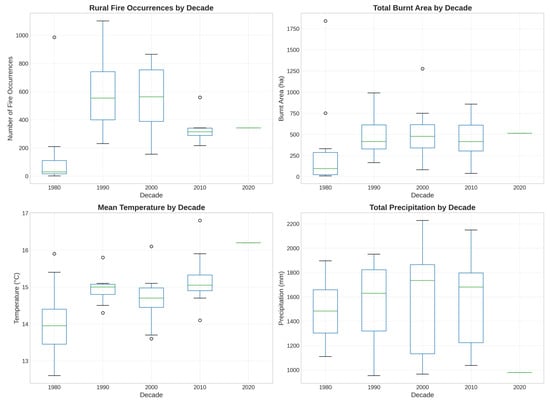
Figure 5.
Box plots showing decadal patterns of rural fire occurrences, total burnt area, mean temperature, and total precipitation in Guimarães (1980–2020).
4. Discussion
4.1. Temporal Evolution of Fire Activity
The temporal evolution of rural fire occurrences and burnt area in Guimarães over the 1980–2020 period reveals a pattern of increasing fire activity through the late 20th century, followed by some moderation in recent years. Fire occurrences increased from a mean of 175.2 per year in the 1980s to peaks of 623.4 and 542.8 in the 1990s and 2000s, respectively, before declining to 382.1 in the 2010s, as evidenced by the marginally significant positive trend in burnt area (Mann–Kendall p = 0.065) and the ANOVA results showing significant decadal differences (F = 4.953, p = 0.005). This trajectory may reflect a combination of factors, including initial rural abandonment and forest expansion in the 1980s–1990s that increased fuel loads [15,16], followed by improved fire management practices and awareness campaigns in the 2000s–2010s that potentially reduced ignition sources and response times [2,7]. The high inter-annual variability, with extreme years like 1998 (1102 occurrences) and 1989 (1840.60 ha burnt), underscores the episodic nature of fire regimes in this region, where single events can dominate annual statistics. These patterns align with broader Portuguese trends but highlight local nuances in Guimarães, such as the influence of its mosaic landscape on fire propagation [11]. Understanding this evolution is essential for contextualizing the observed climate–fire relationships, as it suggests that while climatic factors contribute to risk, socio-economic changes have modulated fire activity over time.
4.2. Temperature Trends and Climate Change Implications
The significant warming trend observed in Guimarães over the period 1980–2020 (0.032 °C/year, total warming ~1.3 °C) is consistent with broader regional and global climate change patterns. This rate of warming is comparable to or slightly higher than the global average warming rate of approximately 0.18 °C per decade reported by the Intergovernmental Panel on Climate Change [20]. The observed warming in northern Portugal aligns with previous studies documenting temperature increases across the Iberian Peninsula, where Mediterranean regions have been identified as particularly vulnerable to climate change impacts [21].
The magnitude of warming observed in Guimarães is particularly significant when considered in the context of fire–climate relationships. Temperature increases of this magnitude can have profound effects on fire behavior through multiple mechanisms, including increased fuel drying rates, extended fire seasons, and more frequent occurrence of extreme fire weather conditions [22]. The consistent nature of the warming trend, with no apparent deceleration in recent decades, suggests that these climate-driven changes in fire risk are likely to continue or intensify in the future.
The absence of significant trends in precipitation, despite substantial warming, is noteworthy and has important implications for fire risk assessment. While some climate models predict changes in precipitation patterns for the Mediterranean region, the observed stability in annual precipitation totals in Guimarães suggests that temperature-driven changes in fire risk may be the dominant climate signal affecting fire activity in this region [19]. However, it is important to note that changes in precipitation seasonality or intensity, which were not examined in this study, could also influence fire risk even in the absence of changes in annual totals.
4.3. Fire–Climate Relationships
The significant positive correlations between temperature and both fire occurrences (r = 0.459) and burnt area (r = 0.426) provide strong evidence for climate-driven influences on fire activity in Guimarães. These correlation coefficients are consistent with those reported in previous studies of fire–climate relationships in Portugal and other Mediterranean regions [12,23]. The strength of these relationships is particularly notable given the complex array of factors that influence fire activity, including human activities, land use patterns, and fire management practices.
The consistency between Pearson and Spearman correlation coefficients for temperature-fire relationships suggests that these associations are robust and not heavily influenced by outliers or non-linear patterns. This supports the use of temperature as a reliable predictor variable in fire risk assessment and management planning. The moderate strength of these correlations (r ≈ 0.4–0.5) indicates that while temperature is an important driver of fire activity, other factors also play significant roles in determining fire patterns. Rather than viewing temperature and precipitation in isolation, their presentation reflects a layered context; temperature emerges as the dominant driver in this transitional region, potentially interacting with stable precipitation to prolong dry periods and enhance fuel flammability [23,24,25,26,27,28,29,30]. This aligns with Mediterranean fire regime studies where these factors are not singular but interconnected with biophysical processes, such as vegetation drying and seasonal patterns, providing a foundation for understanding compounded climate effects on fire activity [31,32].
The absence of significant correlations between precipitation and fire variables was somewhat unexpected, given the well-established role of precipitation in fuel moisture dynamics and fire risk [33]. This finding may reflect several factors, including the timing and intensity of precipitation events, the seasonal distribution of rainfall, and the complex interactions between precipitation, temperature, and vegetation dynamics. In Mediterranean climates, the effectiveness of precipitation in reducing fire risk depends heavily on its timing relative to the fire season, with winter precipitation being less effective than spring or early summer rainfall in maintaining fuel moisture during the critical fire period [34].
Although the current analysis relies on annual aggregates and does not directly explore seasonal attributes of rainfall, the pronounced seasonality posited in Portugal’s fire regime—with most fires occurring in dry summer months when precipitation is minimal—suggests that intra-annual rainfall distribution may play a more nuanced role in fire variables than annual totals indicate [7]. For instance, the absence of significant annual correlations with precipitation could mask seasonal effects, where reduced spring rainfall might extend fuel drying periods, potentially amplifying temperature-driven fire risks during summer peaks [35,36]. This implies potential correlations between seasonal rainfall deficits and increased fire occurrences or burnt area, warranting examination in future studies with monthly resolution data to disentangle these temporal dynamics [25,31,37].
4.4. Multiple Regression Analysis and Predictive Capacity
The multiple regression models developed in this study explained 23.1% of the variance in fire occurrences and 18.3% of the variance in burnt area, indicating that climatic factors account for a substantial but not dominant portion of fire variability. These results are consistent with previous studies that have found climate variables to explain 20–40% of fire activity variance in Mediterranean regions [38]. The modest explanatory power of the climate-only models highlights the importance of non-climatic factors in determining fire patterns, including human activities, land use changes, fire management practices, and socioeconomic factors.
4.5. Implications for Fire Management and Climate Adaptation
The findings of this study have several important implications for fire management and climate adaptation planning in northern Portugal. The significant warming trend and its association with increased fire activity suggest that traditional fire management approaches may need to be adapted to address changing risk conditions. This includes potential adjustments to fire danger rating systems, resource allocation strategies, and prevention programs.
The strong temperature-fire relationships identified in this study support the use of temperature-based indicators in fire risk assessment and early warning systems. While traditional approaches have often emphasized precipitation-based drought indices, the results suggest that temperature metrics may be equally or more important in the current climate context. This is consistent with recent developments in fire weather index systems that incorporate multiple temperature-related variables [27,39].
For Guimarães specifically, these findings imply the need for enhanced fuel management in the wildland–urban interface, where the mosaic of agricultural and forest lands has contributed to increased fire occurrences during warming periods. Strategies could include targeted prescribed burning during cooler months to reduce fuel accumulation, informed by the observed correlation between temperature and fire activity (r = 0.459 for occurrences), and the integration of real-time temperature monitoring into local fire alert systems to extend prevention efforts beyond the traditional summer season [11]. Adaptation measures should also address the decadal patterns, such as investing in community education programs to mitigate human-caused ignitions, which may have driven the peaks in the 1990s and 2000s, while preparing for potential increases in burnt area under continued warming [16].
At the regional level in northern Portugal, the results support policy recommendations for climate-resilient land use planning, including reforestation with fire-resistant species in high-risk areas and the development of municipal fire risk maps that incorporate long-term temperature trends and projected warming scenarios [14,19]. Collaboration between local authorities, such as the Guimarães municipality, and national bodies like the ICNF could facilitate the implementation of adaptive strategies, such as early warning systems calibrated to local climate–fire thresholds, to reduce socioeconomic impacts and enhance ecosystem resilience [2]. These targeted implications extend beyond general adaptation planning, providing a framework for proactive management that accounts for the interplay between climatic drivers and local landscape dynamics.
4.6. Limitations and Future Research Directions
Several limitations of this study should be acknowledged. First, the analysis was based on annual data, which may not capture important seasonal or sub-seasonal patterns in climate–fire relationships. Future research should examine monthly or daily data to better understand the timing and duration of climate effects on fire activity. In particular, exploring correlations between seasonal rainfall attributes—such as dry season deficits or wet season totals—and fire variables would address the pronounced seasonality highlighted in the study, potentially revealing masked relationships not evident in annual data. Second, the study focused on two primary climatic variables (temperature and precipitation) and did not examine other potentially important factors such as humidity, wind patterns, or drought indices.
The spatial scale of this analysis (municipal level) may not capture important sub-regional variations in climate–fire relationships. Future research should examine these relationships at finer spatial scales and consider the role of topographic, vegetation, and land use factors in modifying climate–fire interactions. Additionally, while this study emphasizes climatic drivers, fire risk must be recognized as a socio-ecological issue, where physical and climatic factors interact with human elements such as ignition sources (predominantly human-caused in Portugal), land use changes, rural abandonment, and fire management policies, which can amplify or mitigate climate-driven risks [2,15,16]. The development of spatially explicit models that incorporate these factors would provide more detailed insights for local fire management planning. Moreover, integrating socio-economic data into these models—such as analyses of ignition patterns, policy effectiveness, and community behaviors—would offer a more holistic understanding of fire dynamics, enabling research that addresses how human factors interact with climatic trends to shape overall fire risk in transitional regions like Guimarães [11,15].
5. Conclusions
This comprehensive statistical analysis of rural fire occurrences in Guimarães, Portugal, over the period 1980–2020 provides important insights into the relationships between climate change and fire activity in Mediterranean environments. The analysis documented a statistically significant warming trend of 0.032 °C per year over the 40-year study period, representing approximately 1.3 °C of total warming. The multiple regression models indicate that temperature explains a portion of the variance in fire occurrences (R2 = 0.231) and burnt area (R2 = 0.183), highlighting its role as a key climatic driver while underscoring the influence of additional non-climatic factors, such as land use changes and human activities, in shaping fire variability. These relationships were robust across different statistical approaches and provide strong evidence for climate-driven influences on fire activity. The findings support the integration of temperature-based indicators into fire danger rating systems and early warning programs. The continued warming trend suggests that fire risk will likely increase in the future, requiring adaptive management strategies that account for changing climatic conditions. This study provides evidence for significant climate–fire relationships in northern Portugal and demonstrates the importance of temperature as a driver of fire activity under changing climatic conditions. The findings support the need for adaptive fire management strategies that account for continued climate warming and emphasize the importance of integrated approaches that address both climatic and non-climatic factors influencing fire risk. Beyond the local context, this case study of Guimarães serves as an illustrative example for other transitional Atlantic–Mediterranean regions worldwide, where similar climate warming trends may interact with local landscapes to elevate fire risks. The methodological framework—integrating Mann–Kendall trend analysis, correlation assessments, and multiple regression modeling—offers a replicable approach for municipal-scale analyses in diverse contexts, facilitating comparative studies across regions. Furthermore, the partial explanatory power of climatic factors reinforces the broader implication that fire variability requires integrated socio-ecological approaches, combining physical drivers with human elements like land use dynamics and policy interventions, to develop effective global strategies for fire risk mitigation under climate change.
Funding
Leonel J. R. Nunes’ participation in this work was financed by national funds through FCT—Fundação para a Ciência e a Tecnologia, I.P., within the scope of project UIDP/05975/2020 of the Research Unit on Materials, Energy, and Environment for Sustainability (PROMETHEUS).
Institutional Review Board Statement
Not applicable.
Informed Consent Statement
Not applicable.
Data Availability Statement
Data are available upon request to the author.
Conflicts of Interest
The author declares no conflicts of interest.
References
- Fernandes, P.A.; Loureiro, C.A.; Botelho, H.S. Fire behaviour and severity in a maritime pine stand under differing fuel conditions. Ann. For. Sci. 2004, 61, 537–544. [Google Scholar] [CrossRef]
- ICNF. Relatório Anual de Incêndios Florestais 2021; Instituto da Conservação da Natureza e das Florestas (ICNF): Lisboa, Portugal, 2022. [Google Scholar]
- Flannigan, M.D.; Krawchuk, M.A.; de Groot, W.J.; Wotton, B.M.; Gowman, L.M. Implications of changing climate for global wildland fire. Int. J. Wildland Fire 2009, 18, 483–507. [Google Scholar] [CrossRef]
- Abatzoglou, J.T.; Williams, A.P. Impact of anthropogenic climate change on wildfire across western US forests. Proc. Natl. Acad. Sci. USA 2016, 113, 11770–11775. [Google Scholar] [CrossRef]
- Jolly, W.M.; Cochrane, M.A.; Freeborn, P.H.; Holden, Z.A.; Brown, T.J.; Williamson, G.J.; Bowman, D.M. Climate-induced variations in global wildfire danger from 1979 to 2013. Nat. Commun. 2015, 6, 7537. [Google Scholar] [CrossRef]
- Wagner, C.V. Development and Structure of the Canadian Forest Fire Weather Index System; Canadian Forestry Service: Victoria, BC, Canada, 1987. [Google Scholar]
- Pereira, M.G.; Trigo, R.M.; Da Camara, C.C.; Pereira, J.M.; Leite, S.M. Synoptic patterns associated with large summer forest fires in Portugal. Agric. For. Meteorol. 2005, 129, 11–25. [Google Scholar] [CrossRef]
- Sousa, P.M.; Trigo, R.M.; Pereira, M.G.; Bedia, J.; Gutiérrez, J.M. Different approaches to model future burnt area in the Iberian Peninsula. Agric. For. Meteorol. 2015, 202, 11–25. [Google Scholar] [CrossRef]
- Turco, M.; Bedia, J.; Di Liberto, F.; Fiorucci, P.; Von Hardenberg, J.; Koutsias, N.; Llasat, M.-C.; Xystrakis, F.; Provenzale, A. Decreasing fires in mediterranean Europe. PLoS ONE 2016, 11, e0150663. [Google Scholar] [CrossRef]
- Nunes, A.; Lourenço, L.; Meira, A.C. Exploring spatial patterns and drivers of forest fires in Portugal (1980–2014). Sci. Total Environ. 2016, 573, 1190–1202. [Google Scholar] [CrossRef]
- Moreira, F.; Viedma, O.; Arianoutsou, M.; Curt, T.; Koutsias, N.; Rigolot, E.; Barbati, A.; Corona, P.; Vaz, P.; Xanthopoulos, G. Landscape–wildfire interactions in southern Europe: Implications for landscape management. J. Environ. Manag. 2011, 92, 2389–2402. [Google Scholar] [CrossRef] [PubMed]
- Carvalho, A.; Flannigan, M.D.; Logan, K.; Miranda, A.I.; Borrego, C. Fire activity in Portugal and its relationship to weather and the Canadian Fire Weather Index System. Int. J. Wildland Fire 2008, 17, 328–338. [Google Scholar] [CrossRef]
- Pereira, M.; Malamud, B.; Trigo, R.; Alves, P. The history and characteristics of the 1980–2005 Portuguese rural fire database. Nat. Hazards Earth Syst. Sci. 2011, 11, 3343–3358. [Google Scholar] [CrossRef]
- Pereira, S.; Monteiro, N.; Vaz, R.; Carvalho, D. High-resolution projections of future FWI conditions for Portugal according to CMIP6 future climate scenarios. Theor. Appl. Climatol. 2024, 155, 9247–9272. [Google Scholar] [CrossRef]
- Moreira, F.; Rego, F.C.; Ferreira, P.G. Temporal (1958–1995) pattern of change in a cultural landscape of northwestern Portugal: Implications for fire occurrence. Landsc. Ecol. 2001, 16, 557–567. [Google Scholar] [CrossRef]
- Nunes, L.J.; Raposo, M.A.; Pinto Gomes, C.J. A historical perspective of landscape and human population dynamics in Guimarães (Northern Portugal): Possible implications of rural fire risk in a changing environment. Fire 2021, 4, 49. [Google Scholar] [CrossRef]
- Smeeton, N.; Spencer, N.H.; Sprent, P. Applied Nonparametric Statistical Methods; CRC Press: Boca Raton, FL, USA, 2025. [Google Scholar]
- Sen, P.K. Estimates of the regression coefficient based on Kendall’s tau. J. Am. Stat. Assoc. 1968, 63, 1379–1389. [Google Scholar] [CrossRef]
- Lionello, P.; Scarascia, L. The relation between climate change in the Mediterranean region and global warming. Reg. Environ. Change 2018, 18, 1481–1493. [Google Scholar] [CrossRef]
- Masson-Delmotte, V.; Zhai, P.; Pirani, A.; Connors, S.L.; Péan, C.; Berger, S.; Caud, N.; Chen, Y.; Goldfarb, L.; Gomis, M. Climate change 2021: The physical science basis. In Contribution of Working Group I to the Sixth Assessment Report of the Intergovernmental Panel on Climate Change; Cambridge University Press: Cambridge, UK, 2021; Volume 2, p. 2391. [Google Scholar]
- Giorgi, F. Climate change hot-spots. Geophys. Res. Lett. 2006, 33, L08707. [Google Scholar] [CrossRef]
- Williams, A.P.; Abatzoglou, J.T.; Gershunov, A.; Guzman-Morales, J.; Bishop, D.A.; Balch, J.K.; Lettenmaier, D.P. Observed impacts of anthropogenic climate change on wildfire in California. Earth’s Future 2019, 7, 892–910. [Google Scholar] [CrossRef]
- Pausas, J.G.; Paula, S. Fuel shapes the fire–climate relationship: Evidence from Mediterranean ecosystems. Glob. Ecol. Biogeogr. 2012, 21, 1074–1082. [Google Scholar] [CrossRef]
- Keeley, J.E.; Bond, W.J.; Bradstock, R.A.; Pausas, J.G.; Rundel, P.W. Fire in Mediterranean Ecosystems: Ecology, Evolution and Management; Cambridge University Press: Cambridge, UK, 2011. [Google Scholar]
- Jones, M.W.; Abatzoglou, J.T.; Veraverbeke, S.; Andela, N.; Lasslop, G.; Forkel, M.; Smith, A.J.; Burton, C.; Betts, R.A.; van der Werf, G.R. Global and regional trends and drivers of fire under climate change. Rev. Geophys. 2022, 60, e2020RG000726. [Google Scholar] [CrossRef]
- Fernandes, P.M.; Barros, A.M.; Pinto, A.; Santos, J.A. Characteristics and controls of extremely large wildfires in the western Mediterranean Basin. J. Geophys. Res. Biogeosci. 2016, 121, 2141–2157. [Google Scholar] [CrossRef]
- Fernandes, P.M. Fire-smart management of forest landscapes in the Mediterranean basin under global change. Landsc. Urban Plan. 2013, 110, 175–182. [Google Scholar] [CrossRef]
- Fernandes, P. Forest fuel management for fire mitigation under climate change. Chapter 2013, 3, 31–41. [Google Scholar]
- Mateus, P.; Fernandes, P.M. Forest fires in Portugal: Dynamics, causes and policies. In Forest Context and Policies in Portugal: Present and Future Challenges; Springer: Berlin/Heidelberg, Germany, 2014; pp. 97–115. [Google Scholar]
- Nunes, L.J.; Meireles, C.I.; Gomes, C.J.P.; Ribeiro, N.M.A. The impact of climate change on forest development: A sustainable approach to management models applied to Mediterranean-type climate regions. Plants 2021, 11, 69. [Google Scholar] [CrossRef]
- Romano, N.; Ursino, N. Forest fire regime in a mediterranean ecosystem: Unraveling the mutual interrelations between rainfall seasonality, soil moisture, drought persistence, and biomass dynamics. Fire 2020, 3, 49. [Google Scholar] [CrossRef]
- Field, C.B.; Barros, V.R.; Mastrandrea, M.D.; Mach, K.J.; Abdrabo, M.A.; Adger, W.N.; Anokhin, Y.A.; Anisimov, O.A.; Arent, D.J.; Barnett, J. Summary for policymakers. In Climate Change 2014: Impacts, Adaptation, and Vulnerability. Part A: Global and Sectoral Aspects. Contribution of Working Group II to the Fifth Assessment Report of the Intergovernmental Panel on Climate Change; Cambridge University Press: Cambridge, UK, 2015; pp. 1–32. [Google Scholar]
- Bradstock, R.A. A biogeographic model of fire regimes in Australia: Current and future implications. Glob. Ecol. Biogeogr. 2010, 19, 145–158. [Google Scholar] [CrossRef]
- Ruffault, J.; Mouillot, F. How a new fire-suppression policy can abruptly reshape the fire-weather relationship. Ecosphere 2015, 6, 1–19. [Google Scholar] [CrossRef]
- Zeppel, M.; Wilks, J.V.; Lewis, J.D. Impacts of extreme precipitation and seasonal changes in precipitation on plants. Biogeosciences 2014, 11, 3083–3093. [Google Scholar] [CrossRef]
- Portmann, R.W.; Solomon, S.; Hegerl, G.C. Spatial and seasonal patterns in climate change, temperatures, and precipitation across the United States. Proc. Natl. Acad. Sci. USA 2009, 106, 7324–7329. [Google Scholar] [CrossRef]
- Earl, N.; Simmonds, I. Spatial and temporal variability and trends in 2001–2016 global fire activity. J. Geophys. Res. Atmos. 2018, 123, 2524–2536. [Google Scholar] [CrossRef]
- Fernandes, P.M.; Monteiro-Henriques, T.; Guiomar, N.; Loureiro, C.; Barros, A.M. Bottom-up variables govern large-fire size in Portugal. Ecosystems 2016, 19, 1362–1375. [Google Scholar] [CrossRef]
- Vitolo, C.; Di Giuseppe, F.; Krzeminski, B.; San-Miguel-Ayanz, J. A 1980–2018 global fire danger re-analysis dataset for the Canadian Fire Weather Indices. Sci. Data 2019, 6, 1–10. [Google Scholar] [CrossRef] [PubMed]
Disclaimer/Publisher’s Note: The statements, opinions and data contained in all publications are solely those of the individual author(s) and contributor(s) and not of MDPI and/or the editor(s). MDPI and/or the editor(s) disclaim responsibility for any injury to people or property resulting from any ideas, methods, instructions or products referred to in the content. |
© 2025 by the author. Licensee MDPI, Basel, Switzerland. This article is an open access article distributed under the terms and conditions of the Creative Commons Attribution (CC BY) license (https://creativecommons.org/licenses/by/4.0/).