Article

Canopy Fuel Characteristics and Potential Fire Behavior in Dwarf Pine (Pinus pumila) Forests

1
College of Forestry, Northeast Forestry University, Harbin 150040, China
2
Research Center of Cold Temperate Forestry, Chinese Academy of Forestry, Harbin 150086, China
3
Science and Technology Innovation Center of Wildland Fire Prevention and Control of Beihua University, Forestry College, Beihua University, Jilin 132013, China
4
Ecology and Nature Conservation Institute, Chinese Academy of Forestry, Beijing 100091, China
*
Author to whom correspondence should be addressed.
Fire 2025, 8(9), 347; https://doi.org/10.3390/fire8090347
Submission received: 28 July 2025 / Revised: 28 August 2025 / Accepted: 29 August 2025 / Published: 1 September 2025

Abstract

Crown fire hazard assessment and behavior prediction in dwarf pine (Pinus pumila) forests are dictated by the amount of canopy fuel available, topography, and weather. In this study, we collected data on CFL (available canopy fuel load), CBD (canopy bulk density), and CBH (canopy base height) through the destructive sampling of dwarf pine trees in the Greater Khingan Mountains of Northeast China. Allometric equations were developed for estimating the canopy’s available biomass, CFL, and CBD to support the assessment of canopy fuel. Three burning scenarios were designed to investigate the impact of various environmental parameters on fire behavior. Our findings indicated that the average CFL of a dwarf pine was 0.36 kg·m−2, while the average CBD was measured at 0.17 kg·m−3. The vertical variation trends of both CFL and CBD exhibited consistency, with values increasing progressively from the bottom to the top of the tree crown. Fire behavior simulations indicated that the low CBH of dwarf pine trees increased the likelihood of crown fires. Various factors, including wind speed, slope, and CBH, exerted considerable influence on fire behavior, with wind speed emerging as the most critical determinant. Silvicultural treatments, such as thinning and pruning, may effectively reduce fuel loads and elevate the canopy base height, thereby decreasing both the probability and intensity of crown fires.

1. Introduction

Wildfires are important disturbance factors affecting the sustainable development of forests around the world [1,2]. According to previously published statistics, there are approximately 22 × 104 forest fires globally each year, with a burned area of up to 3.5 × 10⁶ ha [3]. As China’s largest state-owned forest area, accounting for 22.89% of the country’s total forest area, the Greater Khingan Mountains consequently experience the highest forest fire point density (the number of forest fire points per unit area) and the most severe fire hazards [4,5]. Among them, lightning-induced fires mostly occur in dwarf pine (Pinus pumila) forests [6]. The highly flammable species can provide large amounts of terpenoid emissions to increase combustion rates [7]. Dwarf pines are widely distributed in the far east of Russia and the Greater Khingan Mountains at an altitude of 800–1600 m [8]. Due to the tree’s prostrate growth and multi-branched pattern, dwarf pine forests are thought to be more prone to crown fires than other conifer species [9]. In addition, dwarf pines often grow in the understory of the Larix gmelinii forests, and the vertical fuel continuity formed by their low canopy and the tall Larix gmelinii trees increases the risk of fire spreading to the upper forest canopy [10].
Canopy fuels serve as the fuel basis for the occurrence and spread of crown fires [11]. The canopy structure largely determines fuel output and influences fire behavior. Therefore, accurate prediction of crown fire behavior necessitates a quantitative assessment of canopy fuel characteristics. Key parameters influencing crown fire spread include the available canopy fuel load (CFL), canopy base height (CBH), and canopy bulk density (CBD) [12,13,14]. These variables—CFL, CBD, and CBH—serve as critical inputs in most crown fire models and for systems such as FlamMap, FARSITE, FVS—FFE, and BEHAVE [15,16]. Therefore, evaluating canopy fuel properties is of great significance for forest managers to assess forest fire risks. In Byram’s fireline intensity formula [17] (Equation (1)), CFL is used to calculate the total fuel consumed at the fire front.
I = H W f R 60
In Van Wagner’s crown fire initiation and spread model formula (Equations (2) and (3)), CBH and CBD are indispensable parameters for predicting the fireline intensity of surface fires that then initiate crown fires and for calculating the critical rate of spread for maintaining active crown fires [18].
I i n i t i a t i o n = C B H 460 + 25.9 F M C 100 3 / 2
R a c t v = 3.0 C B D
The available canopy fuel load can be estimated based on the vertical distribution of available canopy biomass [19]. Estimating forest biomass is the foundation for studying canopy fuels and is usually achieved through allometric equations [20]. The allometric equation is a mathematical model that describes the relationship between biomass and common stand variables (e.g., tree height, ground diameter, crown length, and crown width) [21]. Due to variations in regional conditions, climate, and stand density, stand characteristics differ across regions. These differences influence forest biomass accumulation, thereby introducing uncertainty in canopy fuel assessments. Therefore, it is necessary to establish allometric growth equations that are suitable for specific regions based on local conditions. Most existing studies on allometric equations focus on tree species such as the Ponderosa pine (Pinus ponderosa) [22], subalpine fir (Abies lasiocarpa), lodgepole pine (Pinus contorta) [23], radiata pine (Pinus radiata) [19], young black pine (Pinus nigra Arnold) [21], and longleaf pine (Pinus palustris) [24]; use of the allometric growth equation is relatively rare in the study of shrub tree species.
The objectives of this study are to: (1) assess the crown fuel characteristics of dwarf pines; (2) develop allometric equations for available canopy biomass, CFL, and CBD in dwarf pine stands; (3) predict fire behavior in dwarf pine forests. These findings provide a theoretical foundation for improving fire prevention, monitoring, and suppression strategies in dwarf pine ecosystems. This study puts forward the following two scientific hypotheses: (1) There is a significant correlation between the ground diameter, crown length, and canopy fuels of dwarf pines. (2) Wind speed is the most important factor affecting fire behavior in dwarf pine forests.

2. Materials and Methods

2.1. Study Area

The study area is located in the Huzhong Forestry Bureau District in the Greater Khingan Mountains, Heilongjiang Province, China (122°39′30″–124°21′00″ E, 51°14′40″–52°25′00″ N). This area belongs to the high-latitude cold region of China, with a continental monsoon climate featuring four distinct seasons. The annual average temperature is −4.3 °C, and precipitation is mainly concentrated in July and August. The annual precipitation is 350~500 mm, and the average annual evaporation is 905.7 mm. The winter is cold and of long duration, with a snow period of up to 5 months, and the snow depth in the forest can reach 30–50 cm.
Soil types in this area include brown coniferous forest soil, dark brown soil, gray forest soil, meadow soil, swamp soil, and alluvial soil, among which brown coniferous forest soil is the most representative. In terms of geology, granite is the dominant rock type, which is mostly concentrated in the northern and central parts of the region.
In terms of vegetation composition, the study area is dominated by coniferous forests, with the main coniferous tree species including Larix gmelini, Pinus sylvestris var. mongolica, Picea koraiensis, and Pinus pumila. The main broad-leaved tree species are Betula platyphylla, Populus davidiana, and Chosenia arbutifolia. The shrub layer is dominated by Vaccinium vitis-idaea, Ledum palustre, and Rhododendron simsii, forming a complete-structured and typical cold–temperate forest ecosystem. The study area supports a mixed forest of Pinus pumila (Figure 1) and Larix gmelini, where Pinus pumila is the dominant tree species with a coverage rate of 90%, while the coverage rate of Larix gmelini and other associated tree species is 10%. In the stands, the average height of Pinus pumila is 2.6 m, and no forest fires have occurred in the past 50 years. The average fire return interval of natural fires in the Greater Khingan Mountains is 120–150 years [25].

2.2. Field Sampling

Three representative stands (20 m × 30 m each) were established in dwarf pine forests. Information for each stand was recorded, including topographic data (altitude, slope, aspect, and slope position) and stand variables (ground diameter, tree height, canopy base height, crown length, and crown width). Three 1 m × 1 m subplots, bearing herbaceous plants, shrubs, and fuels with different time lags (1 h, 10 h, 100 h), were surveyed using the harvest method in each stand. Samples were labeled, weighed, and transported to the laboratory for analysis.
Canopy fuel investigations generally involve two methods: indirect estimation methods and whole-harvest sampling [26]. The whole-harvest method was used to quantify the canopy fuel loads in this study. Each individual within a clump was treated as a single tree due to its clump-forming shrub characteristics [9]. A total of 56 representative dwarf pine clumps were selected for destructive sampling, with criteria including a distribution of ground diameter from small to large, healthy growth, no disease damage, intact crowns without breakage, and uniform canopy distribution. For each clump, tree height (m), ground diameter (cm), CBH (m), crown length (m), and crown width (m) were measured. From the base to the treetop, each clump was vertically divided into 0.5 m segments (with segments shorter than 0.5 m still being classified as a full layer) and the canopy fuels in each layer were categorized into six types: branches (diameter < 0.6 cm, diameter 0.6–1 cm, diameter 1–2.5 cm, and diameter > 2.5 cm), needles, and cones. Each fuel type in every layer was labeled and distinguished, with fresh weights being recorded separately before the samples were weighed and transported to the laboratory for analysis.

2.3. Calculation of Canopy Fuel Load and Canopy Bulk Density

Canopy fuel and surface fuel samples collected in the field were oven-dried at 105 °C to a constant mass, with the dry weights recorded subsequently. The moisture contents of various fuels were calculated using the absolute moisture content formula. The available fuel biomass of each layer of dwarf pine was calculated based on the fuel moisture content, using the following formula (Equation (4)).
W = i = 1 n W 1 + W 2
W: canopy fuel biomass of a single dwarf pine plant (kg); n: total number of canopy layers of a single dwarf pine plant; i: canopy layer; W1: biomass of branches (kg); W2: biomass of the needles (kg).
CFL and CBD are calculated with the following equations [18].
C F L = i = 1 n W 1 + W 2 N S
C B D = i = 1 n W 1 + W 2 N S C L
CFL: available canopy fuel load (kg·m−2); N: average number of dwarf pine plants per stand; S: stand area (m2); CBD: canopy bulk density (kg·m−3); CL: average crown length per stand (m).

2.4. Calorific Value Determination of Fuels

The calorific value represents the energy released when a unit mass of a substance is completely combusted at a certain temperature [27]. The flammability of fuels is reflected by their calorific value, which is also one of the most important indicators for predicting fire behavior. For this study, the dwarf pine samples were dried in the laboratory, ground into powder, and about 1 g was pressed into a block using a tablet press. The samples were then dried to remove moisture and weighed on a balance (accurate to 0.0001 g). The calorific value (kJ·kg−1) was measured using a PRR3600 fully automatic oxygen–nitrogen calorimeter. Each sample was measured three times, and the average calorific value of the samples was taken as the final result.

2.5. Construction of the Allometric Equation for Canopy Fuel in Dwarf Pine

Pearson correlation analysis was performed to examine the relationships among the available biomass, CFL, and CBD of the dwarf pine canopy for various modeling factors, including tree height, ground diameter, crown length, crown width, and CBH. Factors exhibiting high correlation coefficients were identified for further analysis. A stepwise screening method was employed to select those factors that demonstrated the best fit. Using data from 3/4 of the parsed wood, a linear regression analysis was performed on the selected optimal factors and their relationship with the available biomass of the canopy, CFL, and CBD. Given the non-normal distribution observed between the independent and dependent variables, as well as the presence of heteroscedasticity, a logarithmic transformation was applied to the equation. Taking the logarithm of both sides of the model transforms it into the following form:
ln y i = β 0 + β 1 ln x 1 + β 2 ln x 2 + + β i ln x i
Based on the established equations for the canopy’s available biomass, CFL, and CBD, the remaining 1/4 of the data was utilized to assess model accuracy. The indicators R2, RMSE, and MAE were employed to evaluate the precision of these equations [28].
R 2 = 1 i = 1 n   ( y i y ^ i ) 2 i = 1 n   ( y i y ¯ ) 2
R M S E = y i y ^ i 2 n
M A E = y i y ^ i n
R2: coefficient of determination; RMSE: the root mean square error; MAE: mean absolute error; y i : observed value; y ^ i : predicted value; n: sample size.

2.6. Calculation of Potential Fire Behavior Parameters

The Rothermel model is a semi-physical and semi-empirical model based on the law of the conservation of energy (Equation (11)). It applies to various types of fuels and topographical conditions and is the most widely used calculation in current fire models [29]. Based on the Rothermel model, Scott and others [18] used formulas from Van Wagner (Equation (12)) and the Canadian Forest Fire Danger Rating Group, a linear function for crown fire behavior, to calculate the rate of spread between Rsurface and Ractive. Ultimately, they proposed a formula for the combined fire behavior rate of the spread of surface and crown fires.
R s u r f a c e = I R ξ 1 + ϕ w + ϕ s ρ b ε   φ i g
Rsurface: surface fire rate of spread (m·min−1); IR: fire reaction intensity (kW·m−2); ξ: heat transfer coefficient; Φw: wind speed adjustment coefficient; Φs: slope adjustment coefficient; ρb: fuel density (kg·m−3); ε: heating coefficient; φig: the heat required to ignite a unit mass of fuel (kJ·kg−1).
R a c t i v e = 3.34 F M E F M E o I R ξ 1 + ϕ w + ϕ s ρ b ε Q i g F M 10
Ractive: active crown fire rate of spread (m·min−1); FME: fuel moisture content; FME0 = 0.0007383 (when needle moisture content = 100%).
R f i n a l = R s u r f a c e + C F B R a c t i v e R s u r f a c e
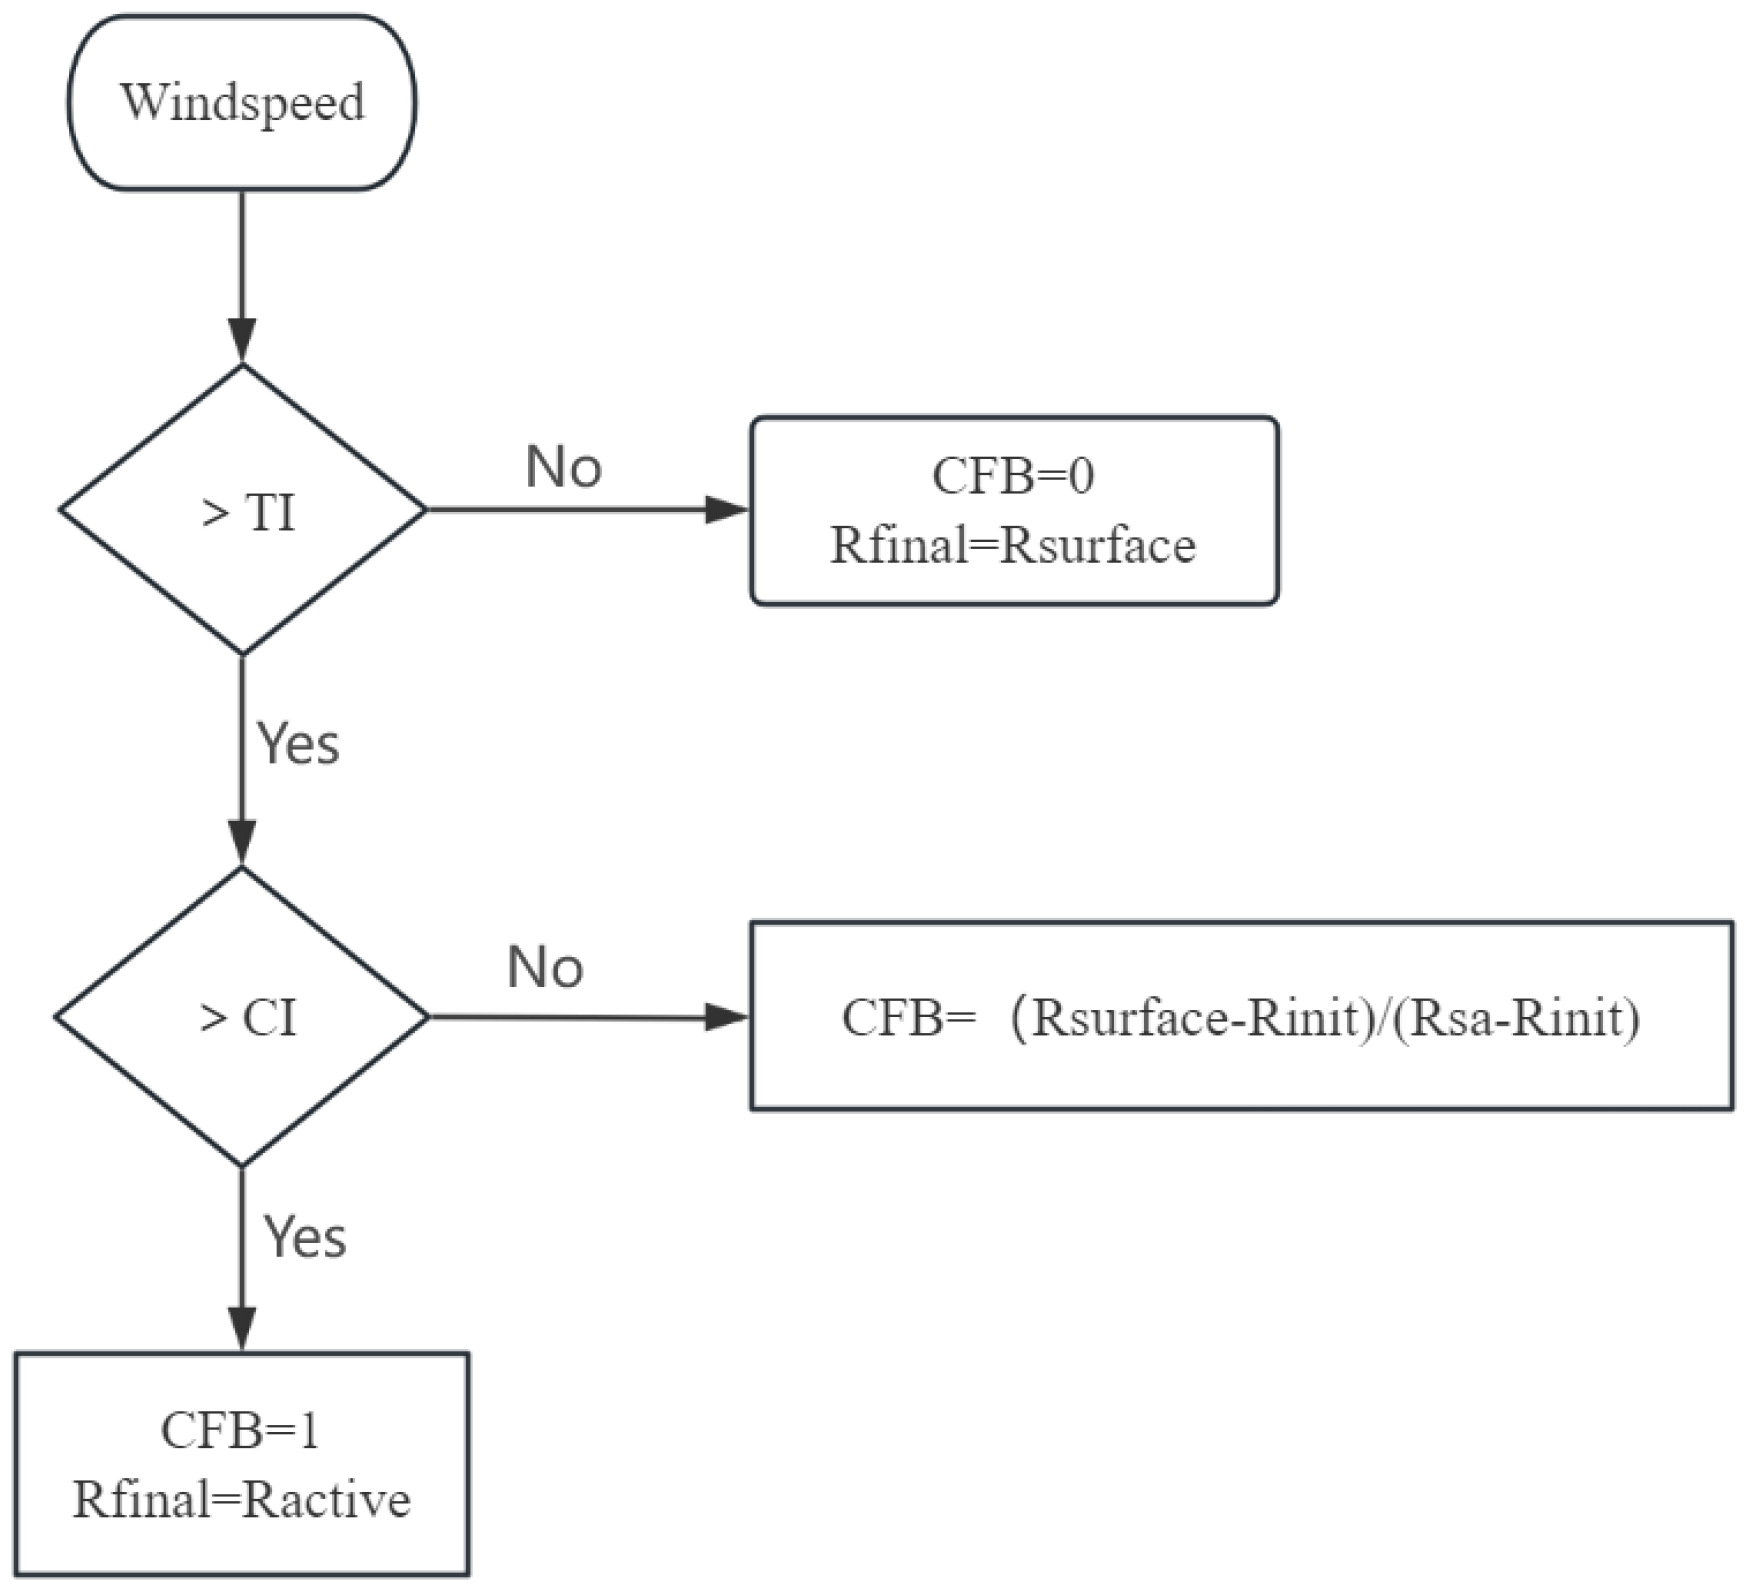
Rfinal: comprehensive fire rate of spread (m·min−1); CFB: crown fire behavior, ranging from 0 to 1, indicating the spectrum from a surface fire to an active crown fire (Figure 2).
Scott and others [18], in combination with Byram’s formula for fireline intensity, proposed a formula for calculating the final fireline intensity that integrates both the surface fire and crown fire.
I f i n a l = H P A s u r f a c e + W c a n o p y H c a n o p y C F B R f i n a l 60
Ifinal: the final fireline intensity (kW·m−1); HPAsurface: the heat per unit area on the surface (kJ·kg−1); Wcanopy: available canopy fuel load (kg·m−2); Hcanopy: the calorific value of the canopy fuels (kJ·kg−1).
The comprehensive flame length of surface fires and crown fires was calculated using the flame length formula (Equation (15)).
L = 0.0775 I f i n a l 0.46 + C F B [ 0.060957 I f i n a l 2 3 0.0775 I f i n a l 0.46 ]
L: flame length (m).
To predict the type of crown fire that might occur in the dwarf pine stand, the torching index (TI) and the crowning index (CI) proposed by Scott and Reinhardt were used [18]. The TI refers to a wind speed of 6.1 m, which is expected to ignite a crown fire (Equation (16)). The TI is equal to the wind speed at the intersection of Rsurface and R′initiation (where Isurface > I′initiation). When the wind speed is less than TI, a surface fire will occur.
T I = 1 54.683 W R F 60 I i n i t i o t i o n ρ b ε Q i g H P A ξ I R ϕ s 1 C β β o p E 1 B
WRF: wind reduction factor; I′initiation: critical surface fireline intensity required to initiate a crown fire; ρb: fuel density (kg·m−3); ε: heating coefficient; Φs: slope adjustment factor; φig: the heat required to ignite a unit mass of fuel; HPA: heat release per unit area; ε: heating coefficient; IR: fire reaction intensity (kW·m−2); C, B, E: constants; β: fuel packing ratio; βop: optimal fuel packing ratio.
The CI refers to the wind speed at a height of 6.1 m that can sustain an active crown fire (Equation (17)). The CI is equal to the wind speed at the intersection of Ractive and Ractive. When the wind speed is greater than TI but is less than CI, a passive crown fire is expected to occur. When the wind speed is greater than CI, an active crown fire will occur.
C I = 0.0457 164.8 ε Q i g I R C B D ϕ s 1 0.001612 0.7
CBD: canopy bulk density (kg·m−3).
Building upon previous research [30] and incorporating meteorological data from the Huzhong region, we established three distinct burning scenarios (Table 1). Fire behavior simulations were conducted across 27 scenario variations, with the detailed quantification of three critical fire behavior parameters: (1) rate of spread (ROS, m·min−1), (2) fireline intensity (FLI, kW·m−1), and (3) flame length (FL, m).
We conducted a three-way ANOVA to assess the effects of four independent variables—canopy base height (CBH), slope, wind speed, and stand density—on ROS, FLI, and FL. Due to the significant multicollinearity between CBH and stand density, stand density was excluded from the final three-way ANOVA model to avoid confounding effects. SPSS 26.0 was employed to fit the regression equations for canopy fuels and calculate the fire behavior parameters using the “firebehavior” package in R 4.4.1.

3. Results

3.1. Analysis of the Vertical Distribution of Dwarf Pine Canopy Fuel

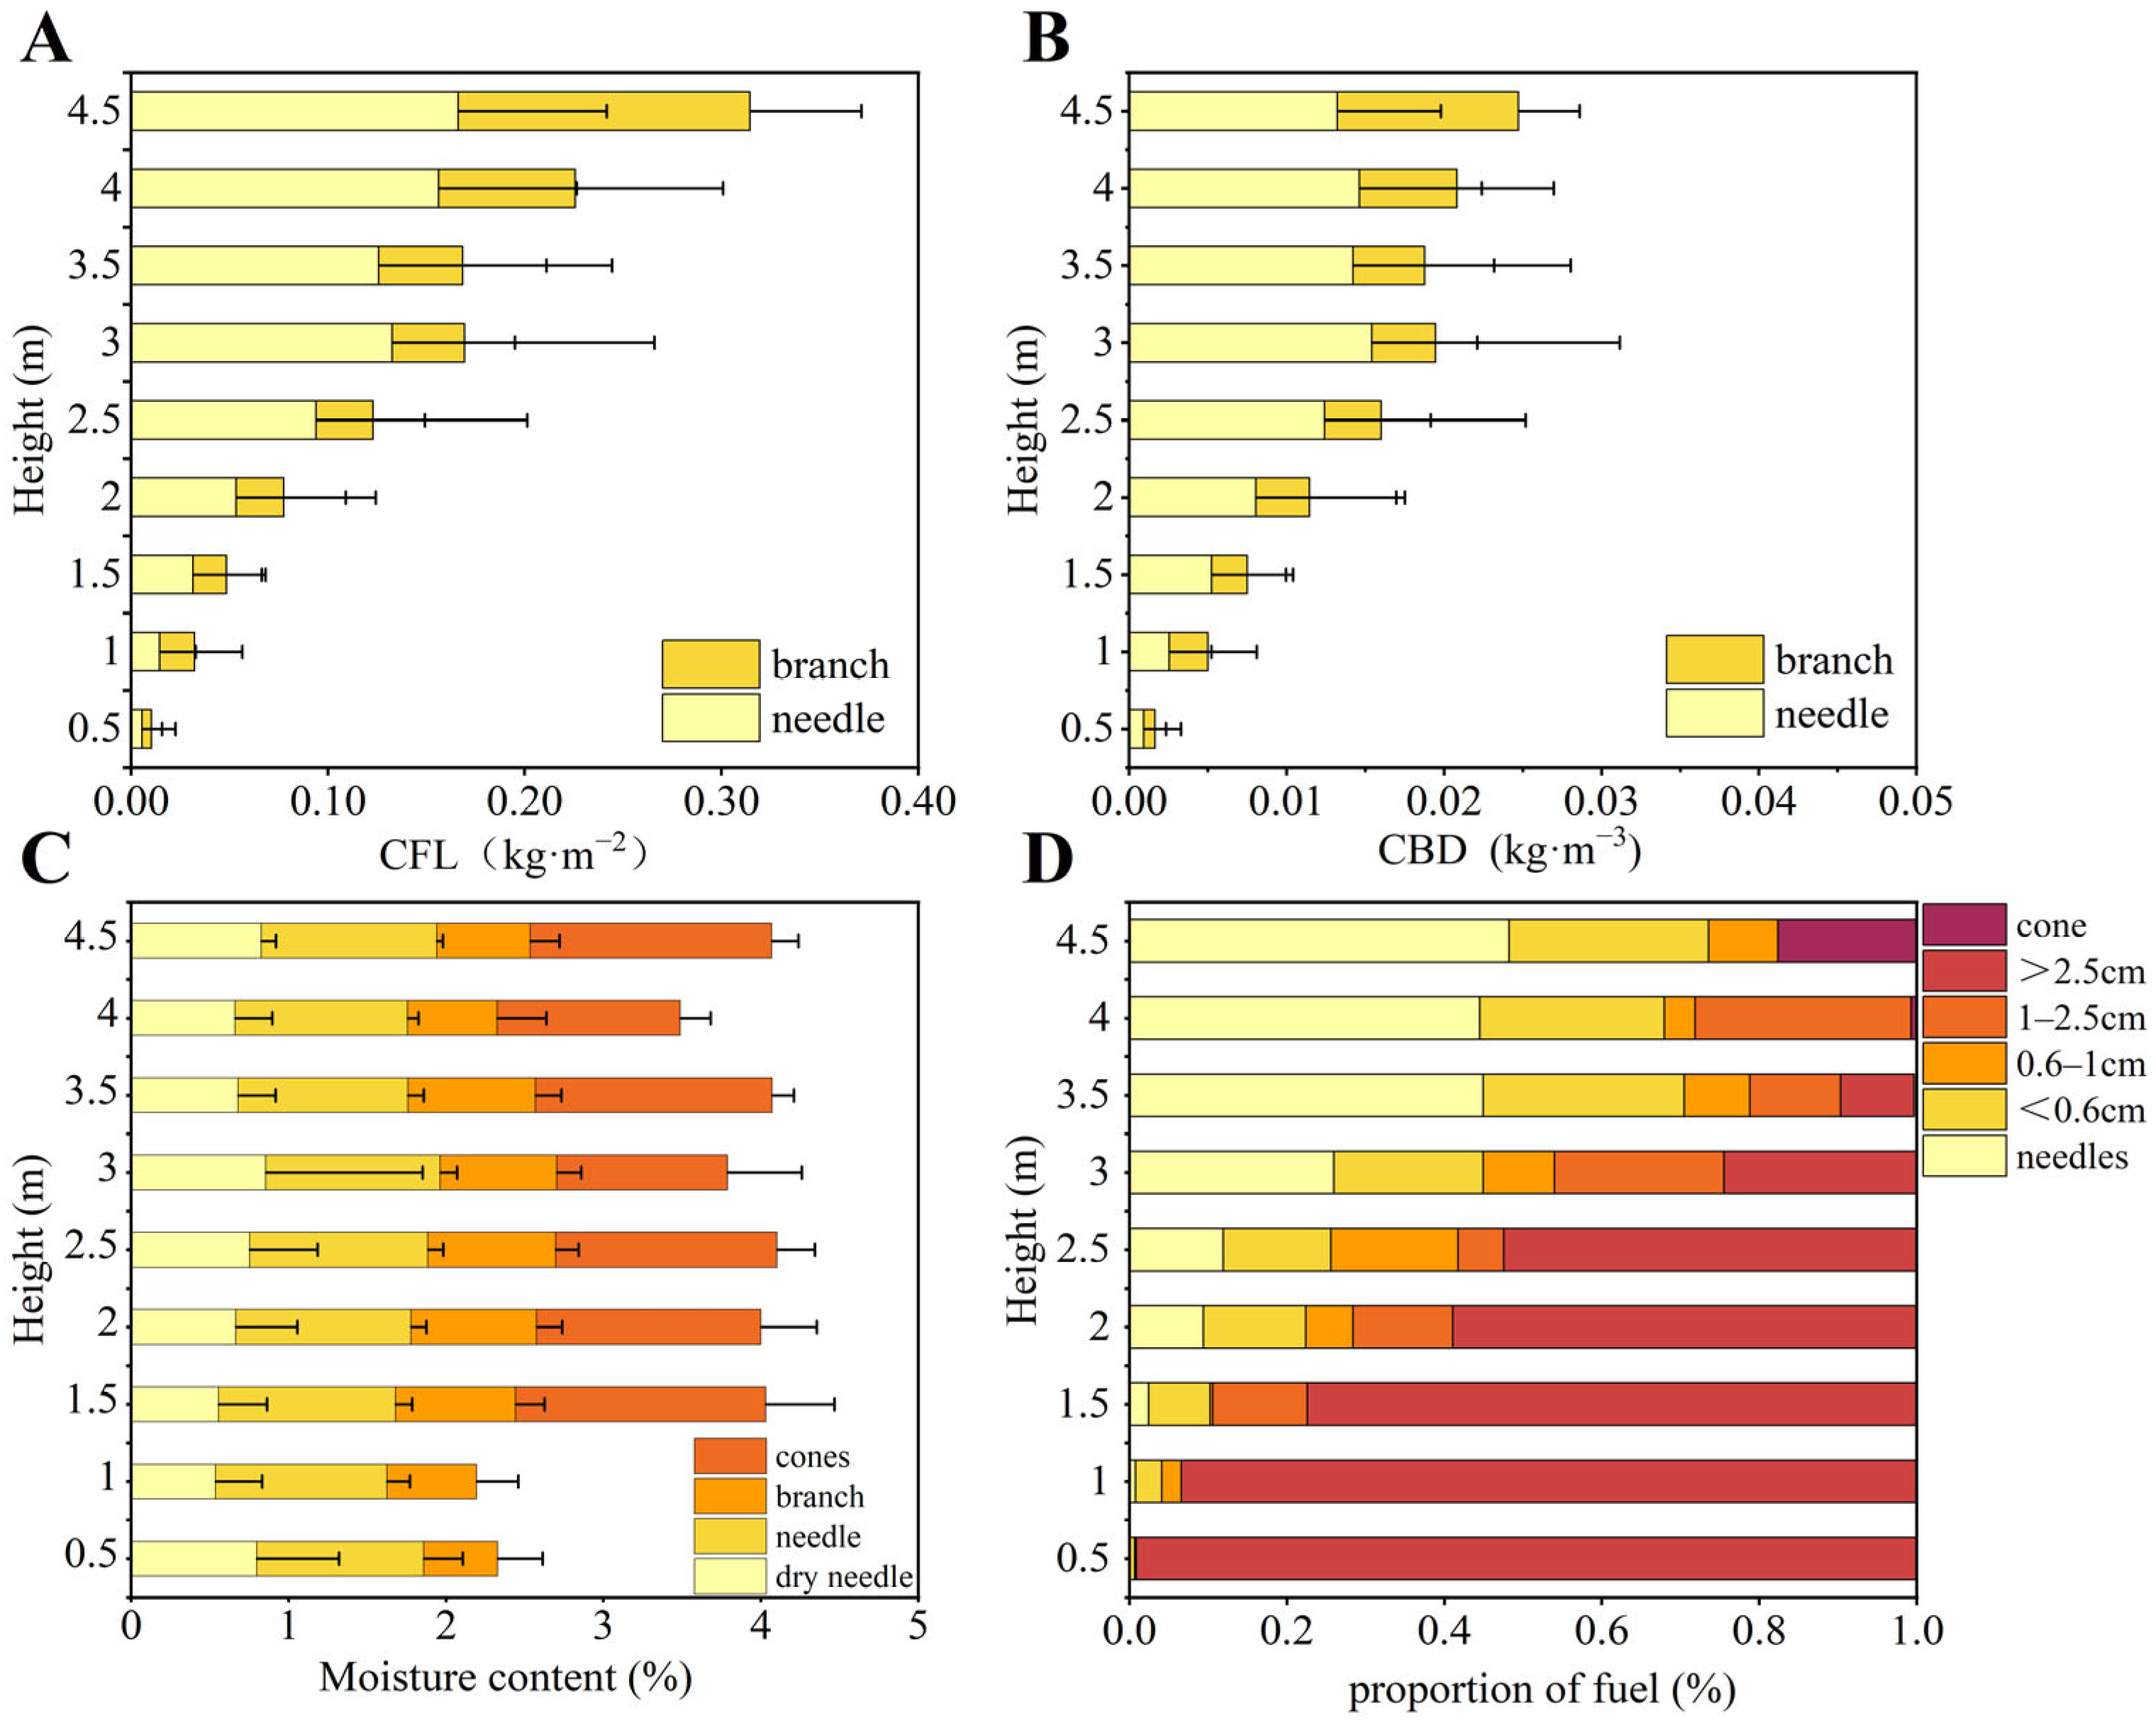
Based on the measured values of fuels in the canopy of dwarf pines, along with the density of dwarf pines within the sample plot, the vertical available canopy fuel load of the tree crown was derived using the aforementioned formula (Equation (5)). Based on the stands, the average CFL for the dwarf pine canopy was 0.36 kg·m−2, with a maximum value of 1.65 kg·m−2 and a minimum value of 0.01 kg·m−2. According to the assessment of the vertical canopy structure of individual dwarf pines, the average CFL value for each layer of the canopy is determined to be 0.13 kg·m−2. The maximum CFL of the individual dwarf pine was observed at a height of 4–4.5 m, while the minimum was recorded at 0.5 m above ground level. The distribution of CFL exhibited a general increasing trend from the bottom to the top (Figure 3A).
The CBD of the dwarf pine canopy was determined using the aforementioned formula (Equation (6)). Based on an analysis of the sample stands, the average CBD for the dwarf pine was calculated to be 0.17 kg·m−3. The overall distribution trends of CBD and CFL in dwarf pines were consistent. Both exhibited an increasing trend in CBD corresponding to the elevation of vertical height within the tree crown (Figure 3B). According to the vertical height distribution of the individual tree crowns, the average CBD value for each layer of the dwarf pine canopy was 0.01 kg·m−3. The maximum CBD value was observed at a height of 4–4.5 m, while the minimum value occurred at a height range of 0–0.5 m.
Figure 3C illustrates the vertical distribution of moisture content within the tree canopy. The moisture content in cones exhibits the highest values, ranging from 110% to 160%. The cones begin to emerge at a height of 1–1.5 m. The error bars for moisture content were relatively large at both the 1–1.5 m and 2.5–3 m intervals, indicating significant variability in moisture content among individual cones within this range. The moisture content of the needles exhibits minimal variation across the different layers and remains relatively stable overall, fluctuating within a range of 110%. The moisture content of branches is lower than that of needles and cones, exhibiting a significant variation in moisture content across different layers. The moisture content exhibits the lowest value of 47% in the 0–0.5 m layer, while it reaches a maximum of 81% in the 2–2.5 m layer. Furthermore, minimal variation can be observed among the different layers. The moisture content of dry leaves is relatively low and exhibits minimal variation with height, predominantly concentrating at 70%. The variability in dry leaf moisture content across different layers is greater than that observed in the other three types, particularly at layers of 0–0.5 m, 2–2.5 m, and 2.5–3 m. In these ranges, the dry leaf moisture content exhibits variations among the individual samples.
The distribution of various types of fuels within the vertical profile of the tree canopy indicates that the available canopy fuel load (including needles and branches with a diameter of <0.6 cm) exhibits an increasing pattern from the lower layers to the upper layers of the tree canopy. In the 0–0.5 m layer of the tree canopy, branches with a diameter of >2.5 cm constitute 99% of the total, while those below this threshold account for the remaining 1%. Notably, there are no needles present in these layers. Between 0.5 and 1 m, the needles begin to emerge. However, they constitute only 1% of the total biomass, with their contribution to the available fuel load being 4%. Starting from a height of 1–1.5 m, there is a significant increase in the proportion of needles and branches measuring <0.6 cm in diameter. Conversely, the proportion of branches exceeding 2.5 cm in diameter shows a continuous decline. In the layers between 3 and 3.5 m, the proportion of branches of >2.5 cm is reduced to only 1%, while the available fuel load constitutes as much as 70%. The proportion of available canopy fuel load is highest within the 4–4.5 m section, comprising 74% of the total. Within this segment, needles account for 48%, while branches with a diameter of <0.6 cm represent 26%. Additionally, the cones constitute a significant portion of these layers, making up 18%.

3.2. Construction of the Canopy Fuel Model for Dwarf Pines

Through a Pearson correlation analysis of the available biomass, CFL, and CBD of dwarf pines concerning various modeling factors (Table 2), it was observed that the available biomass, CFL, and CBD of the canopy exhibited positive correlations with tree height, ground diameter, crown length, crown width, and CBH. The correlation coefficients between the three modeling factors and each factor exceeded 0.48, with the correlation coefficient for tree height surpassing 0.80. This indicates that tree height is the most significant predictor of available biomass, CFL, and CBD. Due to the multitude of related factors, a stepwise selection process was employed to identify suitable modeling variables for the development of equations to estimate available canopy biomass, CFL, and CBD.
Statistical analysis revealed that while tree height demonstrated the strongest bivariate correlations with all three response variables, its predictive contribution became statistically non-significant when incorporated into the multivariate model containing other stand characteristics (Table 2). Notably, tree height demonstrated significant collinearity with both crown length and ground diameter. Consequently, tree height and CBH were ultimately excluded as modeling factors. Ground diameter, crown length, and crown width were utilized to model the available biomass of the canopy (needles and branches of a diameter of <0.6 cm) for dwarf pines. The model yielded the following results: R2 = 0.917, p < 0.001, and RMSE = 0.354. All three variables exhibited significant correlations with the available biomass (p < 0.001) (Table 3).
The CFL model for dwarf pines was developed by fitting the ground diameter, crown length, and crown width. The final model demonstrated excellent predictive performance (R2 = 0.914, p < 0.001, and RMSE = 0.360), with all three variables showing highly significant correlations with CFL (p < 0.001) (Table 3).
Similarly, the canopy bulk density (CBD) model incorporated the same predictor variables, yielding strong explanatory power (R2 = 0.865, p < 0.05, and RMSE = 0.354). Among these predictors, crown width exhibited the strongest association with CBD (p < 0.001), while ground diameter and crown length showed significant but weaker relationships (p < 0.05) (Table 3).
It can be observed from the scatter plot (Figure 4) that the predicted values derived from the equation exhibit a relatively strong correlation with the observed values of the canopy’s available biomass and CFL, at R2 = 0.715 and 0.717, respectively. In contrast, the agreement between the observed and predicted values for CBD is comparatively lower, at R2 = 0.642.
The predicted values of the canopy’s available biomass and CFL accounted for 72% of the variation in the data, whereas the CBD equation explained only 64% of the variability in the observed data. The fitting performance for the canopy’s available biomass was notably high within a range of up to 2 kg. However, deviations were noted beyond this threshold (Figure 4A). The CFL equation demonstrated high accuracy when values were below 0.6 kg·m−2, but its fitting performance deteriorated for values exceeding this limit (Figure 4B). Similarly, good fitting performance was exhibited by the CBD equation at levels below 0.2 kg·m−3; deviations occurred when measurements surpassed this value (Figure 4C).

3.3. Potential Fire Behavior of Dwarf Pines

Based on the calculations of the TI and CI values utilizing the aforementioned formulas (Equations (16) and (17)), it can be concluded that the dwarf pine is likely to experience surface fires under conditions where the CBH = 0.88 m, wind speed = 15 km·h−1, and three different slope angles (10°, 20°, and 30°) are considered. Under all other scenarios, dwarf pine forests may encounter intermittent crown fires or active crown fires.
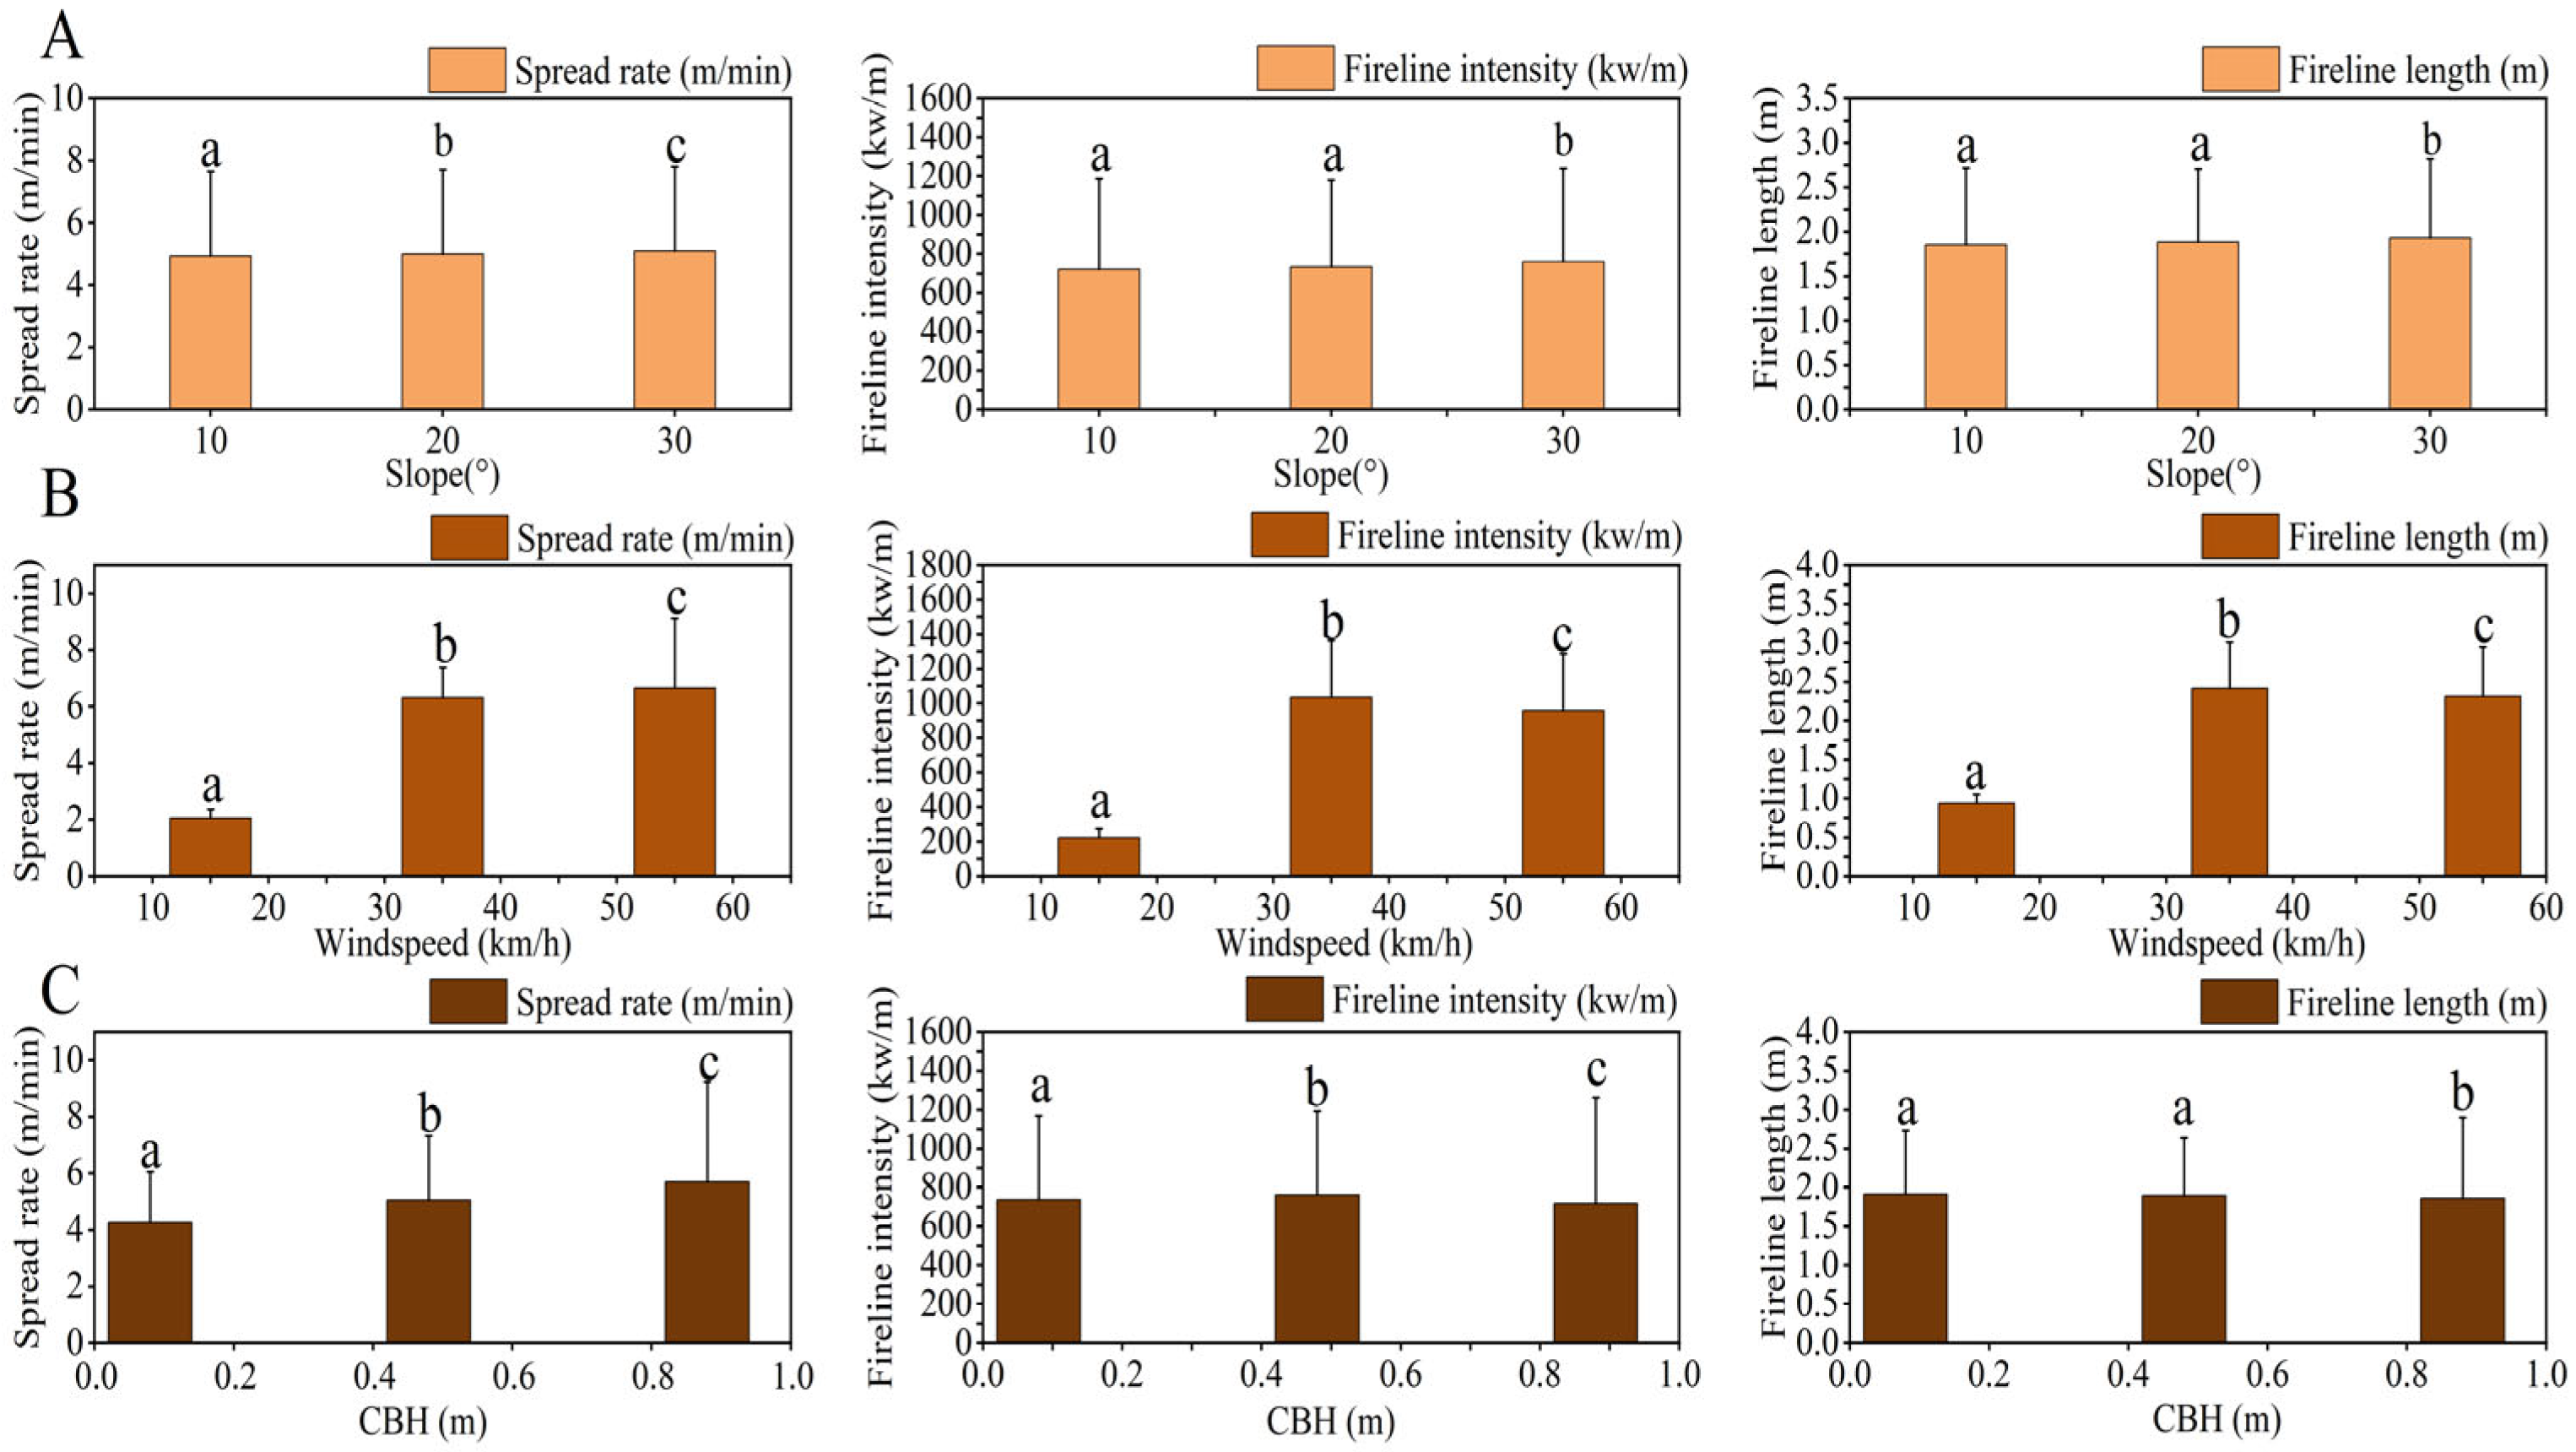
The results of the three-way ANOVA (Table 4) demonstrate that CBH, slope, and wind speed have highly significant effects on the fire’s rate of spread (p < 0.001). However, the interaction effect between slope and CBH on the fire’s rate of spread is not significant (p = 0.794). Under identical wind speeds with varying slopes of 10°, 20°, and 30°, the observed fire rates of spread in the three plots ranged from 1.7 to 1.89 m·min−1, 5.28 to 5.47 m·min−1, and 9.85 to 10.04 m·min−1, respectively (Figure 5A–C). Under consistent slope conditions, variations in wind speed and CBH significantly influenced the fire rate of spread (p < 0.001). When the slope = 10° with CBH = 0.88 m and wind speeds = 15 km·h−1, 35 km·h−1, and 55 km·h−1, the observed range for the fire rate of spread was between 1.7 and 9.85 m·min−1 (Figure 5A). Conversely, when maintaining a slope = 10° with CBH = 0.48 m while using wind speeds = 15 km·h−1, 35 km·h−1, and 55 km·h−1 resulted in an observed range for the fire’s rate of spread of between 2.33 and 22.03 m·min−1 (Figure 5B). The results from multiple comparisons of LSD (Figure 6) indicate that the effects on the fire’s rate of spread at a slope = 10° are significantly different from those at a slope = 20° (p = 0.011). Furthermore, the differences in the fire’s rate of spread between slopes = 20° and 30° are extremely significant (p < 0.001).
The variations in CBH and wind speed significantly impact fireline intensity (p < 0.001), while slope also notably influences it (p = 0.002). However, the interaction between CBH and slope with fireline intensity is non-significant (p = 0.989) (Table 4). At a wind speed = 15 km·h−1, assessing CBH = 0.88 m and 0.48 m across varying slopes resulted in fireline intensities of 149.14–168.06 kW·m−1 and 259.33–295.46 kW·m−1, respectively, showing only minor differences between them. In contrast, with CBH = 0.08 m at the same wind speed, fireline intensity ranged from 220.75 to 256.06 kW·m−1 across different slopes, indicating a downward trend compared to the scenario when CBH = 0.48 m (Figure 5B,C).
Variations in wind speed significantly influence flame length (p < 0.001). Changes in slope and CBH also notably affect flame length (p = 0.002 and 0.015). The interaction effects of CBH and the slope, as well as between the slope and wind speed, significantly impact flame length variations (p = 0.006, p = 0.003). Furthermore, the interaction effect of wind speed and CBH has an extremely significant impact on flame length (p < 0.001) (Table 4). When the slope = 10°, flame lengths range from 0.77 to 8.13 m under varying conditions of CBH and wind speed (Figure 5). The interaction between the slope and CBH does not have a statistically significant effect on flame length (p = 0.993). At a wind speed = 15 km·h−1, variations in slope and CBH yield a flame length range of 0.77–1.02 m. Similarly, the interaction between slope and wind speed does not significantly influence flame length (p = 0.201). When both slope and wind speed are varied while keeping CBH = 0.88 m, observed flame lengths range from 0.77 to 3.21 m.

4. Discussion

4.1. Characteristics of Available Canopy Fuel Distribution

The frequency of global wildfires is on the rise, leading to an increased focus on the outputs generated by fire behavior simulation systems [31]. Accurate simulation of shrubland fire behavior requires the precise quantification of canopy fuel characteristics, including their spatial distribution, load, and physical properties. This fundamental assessment serves as the basis for developing reliable fire prediction models and informing effective fire management strategies. While allometric equations provide a powerful tool for canopy fuel estimation, their predictive accuracy depends critically on species-specific calibration. Localized parameterization that accounts for regional growth patterns and morphological characteristics is essential for developing reliable fuel load predictions in diverse forest ecosystems [32,33]. Current fire behavior simulation systems lack specialized canopy fuel parameterization for multi-stemmed shrubs despite their distinct fuel architecture, which significantly influences fire dynamics [34]. They inadequately represent the unique canopy fuel characteristics of dwarf pine ecosystems. This study addresses this critical knowledge gap by: (1) conducting the first comprehensive quantification of dwarf pine canopy fuel properties, and (2) developing species-specific allometric equations for three key parameters: the canopy’s available biomass (R2 = 0.841), canopy fuel load (CFL; R2 = 0.824), and canopy bulk density (CBD; R2 = 0.726) (Table 5). Our empirically derived models significantly improve the accuracy of fuel load predictions in dwarf pine stands, particularly for a biomass < 2 kg, CFL < 0.6 kg·m−2, and CBD < 0.2 kg·m−3 (Figure 4).
The CFL and CBD of the dwarf pine exhibit a progressively increasing trend from the lower to the upper canopy. This observation aligns with findings related to lodgepole pines at the Tenderfoot site [32]. The same trend is also present in manzanita (Arctostaphylos spp.), a typical shrub species in California, USA [35]. At the base of the dwarf pine crown, a significant proportion of fuels consists of branches with diameters > 2.5 cm. This predominance among all types of fuels in the tree crown leads to a relatively small available fuel load. Consequently, this results in low values for both CFL and CBD at the lower layer of the tree crown. As the vertical height of the tree canopy increases, the proportion of needles and branches with a diameter of <0.6 cm continues to rise. Consequently, the proportion of available fuel load also experiences an upward trend, resulting in a sustained increase in both CFL and CBD. However, other studies have indicated that the maximum values of CFL and CBD in Aleppo pine canopies are situated in the central regions of the tree crowns [30]. This finding contrasts with the vertical distribution of fuel observed in the canopies of dwarf pines. The observed phenomenon may be attributed to the substantial size of the Aleppo pine. In investigations concerning the fuels that are present in the canopy, only the tree crown is considered. The proportion of available fuel load within the tree crown is significant. However, branches with a diameter of >2.5 cm constitute a relatively small fraction of the total fuels found in this region [21]. Dwarf pine is a large, clump-forming shrub species that exhibits a prostrate growth habit with a low CBH, resulting in its crown being nearly equal to its height. In the central region of the dwarf pine crown (2–2.5 m), branches of >0.6 cm in diameter constitute 74% of the total branch, whereas the available fuel load comprises only 26%. The proportion of branches of >0.6 cm in diameter within the upper and middle layers of the tree canopy is gradually declining, whereas the proportion of available fuel load is progressively increasing.
The range of CFL in the dwarf pine plot was observed to be between 0.01 and 1.65 kg·m−2, with a mean value of 0.36 kg·m−2. Similarly, the range of CBD varied from 0.01 to 0.58 kg·m−3, yielding an average of 0.17 kg·m−3. The CFL value range for Ponderosa pine is between 0.04 and 1.96 kg·m−2, with an average of 0.61 kg·m−2. The CBD range for lodgepole pine spans from 0.04 to 0.96 kg·m−3, with an average of 0.28 kg·m−3 [36]. The results thus obtained were consistently higher than those observed for the dwarf pine. This may be attributed to the fact that both Ponderosa pines and lodgepole pines are large tree species with a significant proportion of available biomass within the canopy in the sample stand, an elevated CFL, and a high value of CBD. Dwarf pine is predominantly found in high-altitude regions, exhibiting a block distribution pattern. The height of dwarf pine trees ranges from 3 to 5 m, with a small proportion of available biomass present in the tree crown, which contributes to a low CFL. Due to its creeping growth habit, dwarf pine has a low CBH, which leads to a high tree-crown length and, consequently, a reduced CFL. This combination leads to a diminished CBD. Studies have shown that the average CBD of needles and branches with a diameter of <0.63 cm in southern California was 2.43–7.63 kg·m−3 [35]. The results were significantly higher than the value for dwarf pine CBD, which is a large shrub with the characteristics of a tree in morphology, and the proportion of available fuel load is significantly lower than that of small shrubs, resulting in a small CBD value. The research indicated that the CBD value of Ponderosa multilayer stands was measured at 0.049 kg·m−3 [37]. This CBD value is lower than that of dwarf pines, as only the needles were considered to constitute the available biomass of the canopy. In this paper, the available biomass of the canopy is defined as needles and branches with a diameter of <0.6 cm. In the layer of the dwarf pine crown that ranges from 1.5 to 2 m in height, there is a gradual increase in the proportion of needles. Conversely, at the lower part of the tree crown, branches with diameters > 2.5 cm constitute a significant portion.
Stand density is a critical factor that influences canopy fuel. As stand density increases, the values of CFL and CBD exhibit a significant increase [38]. Consistent with the findings of this study, an increase in stand density is associated with a rise in the number of individual dwarf pines. Additionally, there will be an enhancement in available canopy biomass, an increase in CFL, and a corresponding rise in CBD [39]. Another potential explanation is that as stand density increases, the amount of light available within the forest becomes limited. Consequently, trees tend to prioritize the development of leaf area in the canopy and enhance the density of their fine branches to maximize photosynthetic surface area, thereby acquiring more light resources [40]. The needles and fine branches contribute to an increase in the available biomass of the canopy, thereby elevating both the CFL and CBD. As stand density rises, spatial availability within the forest becomes relatively limited, which subsequently inhibits the growth of crown length [41]. Crown length will decrease as the CFL increases, while the CBD will also experience an increase.

4.2. Assessment of Available Canopy Biomass, CFL, and CBD Equations

The predicted values of the canopy’s available biomass, CFL, and CBD consistently overestimated the measured values. On average, the predicted value of available canopy biomass was 0.232 kg higher than the observed value. The predicted value of CFL exceeded the measured value by an average of 0.242 kg·m−2, and the predicted value of CBD was 0.233 kg·m−3 greater than the measured value, at RMSE = 0.472, 0.500, and 0.472, respectively. The R2 values for the available biomass and CFL equations are relatively high. In contrast, the R2 value for the CBD equation is comparatively low (Table 5). The range of RMSE values for the unprocessed stands of four flammable canopy tree species in western North America, as determined by the CFL and CBD equations, was found to be between 0.12 and 0.31 kg·m−2 and 0.04–0.15 kg·m−3, respectively [42]. The relatively high values of RMSE and MAE reported in this study may be attributed to the extensive variability observed in canopy fuel biomass, loading, and CBD data. In selecting the dwarf pine samples, a range of ground diameters was considered, spanning from small to large specimens with a ground diameter range of 2–17 cm. This selection process resulted in considerable internal fluctuations within the available canopy biomass, CFL, and CBD data, ultimately contributing to an elevated RMSE [43].

4.3. Analysis of the Potential Fire Behavior of Dwarf Pine

The results of the fire behavior simulations conducted on the dwarf pine under various scenarios indicate a significant susceptibility to crown fires. Specifically, when the CBH = 0.88 m and wind speed = 35 km·h−1, a crown fire is likely to be initiated. The growth pattern of dwarf pine predominantly occurs close to the ground, being characterized by a low CBH and favorable vertical continuity of fuels within the forest. These factors collectively enhance the likelihood of crown fire occurrences [30]. Dwarf pine exhibits a high oil content, significant combustibility, and excellent continuity of fuels within the canopy. These characteristics substantially increase the likelihood of crown fires occurring under extreme weather conditions [44]. Reducing the CFL and increasing the CBH can significantly mitigate the risk of crown fires [45].
According to the findings from fire behavior simulations, wind speed, slope, and CBH are significant factors influencing fire behavior. However, among these variables, wind speed emerges as the most dominant factor affecting fire behavior [30,46]. As wind speed increases, significant alterations occur in the indicators of fire behavior. In forests with high stand density and low CBH, these tree crown conditions substantially lower the wind speed necessary for the initiation and propagation of crown fires. This phenomenon results in the occurrence of crown fires in dwarf pine even at moderate wind speeds. The fire behavior indicators of the dwarf pine exhibit significant differences when compared to the outcomes of international crown fire simulation experiments. The fire’s rate of spread for dwarf pine ranges from 1.7 to 22.78 m·min−1, while the fireline intensity varies between 149 and 5502 kW·m−1. Additionally, the flame length measures between 0.77 and 8.31 m. In the international canopy fire simulation experiment, the observed fire rate of spread ranged from 15 to 70 m·min−1. The fireline intensity was found to reach up to 90,000 kW·m−1, while the flame length varied between 25 and 40 m [13]. All index values from the fire behavior simulation of the dwarf pine were significantly lower than those obtained from the international crown fire simulation experiment. This discrepancy may be attributed to the selection of the 97th percentile of fire danger weather conditions for simulating potential fire behavior, which was based on the measured moisture content in the dwarf pine and the humidity levels utilized in flammability models for fire behavior research conducted in the United States. The elevated moisture content of fuels necessitated a greater amount of energy to release heat, thereby reducing the heat available for fuel and resulting in relatively lower indicators of fire behavior [47]. Another contributing factor is the low effective biomass of the dwarf pine canopy, which leads to reduced CFL and CBD values. Consequently, this results in lower fire behavior index values during simulation. Some researchers have investigated the fuel model by focusing on the dwarf pine. Their findings indicate that the fire behavior indicators are significantly higher than those reported in this study. This discrepancy can be attributed to the surface fuel thickness utilized in their research, which is set at 125 cm, compared to an average thickness of only 25 cm in the plots examined in this paper. A greater depth of surface fuel provides more fuel during a fire event, leading to increased values for CFL and CBD, as well as enhanced energy release from fuel. Consequently, these factors contribute to elevated fire behavior indicators [48]. Future research should focus on integrating these parameters into operational fire behavior models and assessing climate change impacts on fire risk dynamics.
A limitation of the study is the lack of validation of established models using real wildfire data. The practical applicability of fire risk assessment needs to be further confirmed without using wildfire data observed in the field, which will be the focus of our future work.

5. Conclusions

This study systematically investigates the canopy fuel characteristics of dwarf pine through comprehensive field measurements and modeling approaches. Both canopy fuel load (CFL) and canopy bulk density (CBD) exhibit consistent vertical gradients, showing significant increases from the lower to upper canopy strata. The basal canopy region (0–1 m) contains minimal fuel loads, while mid-canopy levels (1–2 m) demonstrate three- to five-fold increases in fuel accumulation. The exceptionally low canopy base height creates vertically continuous fuel profiles, substantially elevating crown fire risk. We developed robust allometric equations for the canopy’s available biomass, CFL, and CBD. These models provide reliable tools for fuel load estimation in fire behavior prediction systems. The combination of low CBH and dense canopy structure may result in an 85% probability of crown fire initiation at wind speeds of >6 m·s−1 and flame lengths exceeding 2.5 m under moderate fire weather conditions. These findings significantly advance our understanding of dwarf pine flammability and provide critical input for improving fire management in these ecologically important ecosystems.

Author Contributions

Conceptualization, X.H. and J.Z.; methodology, X.H., Q.W. and J.Z.; software, C.C., S.W. and X.H.; validation, H.C., Y.S. and M.W.; formal analysis, X.H., C.C., Q.W. and J.Z.; investigation, X.H., X.Z., R.C., S.W. and G.Z.; resources, J.Z.; data curation, J.Z.; writing—original draft preparation, X.H.; writing—review and editing, J.Z., C.C., H.C., Y.S. and M.W.; visualization, X.Z., R.C. and G.Z.; supervision, J.Z.; project administration, J.Z.; funding acquisition, J.Z. All authors have read and agreed to the published version of the manuscript.

Funding

This work was funded by the National Key R&D Program of China (No. 2023YFD2202004).

Institutional Review Board Statement

Not applicable.

Informed Consent Statement

Not applicable.

Data Availability Statement

The data generated and analyzed during this study are available from the corresponding author upon reasonable request.

Acknowledgments

We are grateful to the anonymous reviewers for their helpful comments and suggestions.

Conflicts of Interest

The authors declare no conflicts of interest.

References

  1. Lv, Q.C.; Chen, Z.Y.; Wu, C.Y.; Peuelas, J.; Fan, L.; Su, Y.X.; Yang, Z.Y.; Li, M.C.; Gao, B.B.; Hu, J.Q.; et al. Increasing severity of large-scale fires prolongs the recovery time of forests globally since 2001. Nat. Ecol. Evol. 2025, 9, 980–992. [Google Scholar] [CrossRef] [PubMed]
  2. Chebykina, E.; Polyakov, V.; Abakumov, E.; Petrov, A. Wildfire Effects on Cryosols in Central Yakutia Region, Russia. Atmosphere 2022, 13, 1889. [Google Scholar] [CrossRef]
  3. Han, Y.L.; Li, X.Y.; Cai, H.Y.; Liu, J.; Chen, K. The impact of wildfire on soil carbon and nitrogen storage in permafrost regions of the Greater Khingan. J. Glaciol. Geocryol. 2024, 46, 1341–1355. [Google Scholar] [CrossRef]
  4. Wang, J.; Du, Y.L.; Gao, Z.; Lv, H.Y.; Shi, L. Exploring the spatio-temporal variations and forest restoration of burned zones in the Great Xing’an Range based on MODIS time series data. Remote Sens. Nat. Resour. 2024, 36, 142–150. [Google Scholar] [CrossRef]
  5. Liu, J.X.; Li, R.; Wang, H. Analysis of the spatiotemporal dynamics of forest fires in major forest regions of China. J. Hubei Univ. (Nat. Sci. Ed.). 2024, 46, 809–819. [Google Scholar] [CrossRef]
  6. Shu, L.F.; Wang, M.Y.; Li, Z.Q.; Xiao, Y.J.; Tian, X.R. Study on the fire environment of dwarf pine forests in the Greater Khingan Mountains. Mt. Res. 2004, 22, 36–39. [Google Scholar] [CrossRef]
  7. Zhao, F.J.; Shu, L.F.; Wang, M.Y.; Tiao, X.R. Emissions of volatile organic compounds from heated needles and twigs of Pinus pumila. J. For. Res. 2011, 22, 243–248. [Google Scholar] [CrossRef]
  8. Jiang, M.X. Preliminary studies on the distribution and growth of dwarf pine in the Greater Khingan Region. Sci. Silvae Sin. 1982, 18, 203–205. [Google Scholar]
  9. Zhuang, H.X.; Liu, Q.J.; Meng, S.W.; Jia, Q.Q.; Deng, L.B. Biomass model for individual dwarf pine trees in the Mangui Area. J. Northeast. For. Univ. 2015, 43, 97–101. [Google Scholar] [CrossRef]
  10. Cruz, M.G.; Alexander, M.E.; Wakimoto, R.H. Development and testing of models for predicting crown fire rate of spread in conifer forest stands. Can. J. For. Res. 2005, 35, 1626–1639. [Google Scholar] [CrossRef]
  11. Keanea, R.E.; Burgana, R.; Wagtendonkb, J.V. Mapping wildland fuels for fire management across multiple scales: Integrating remote sensing, GIS, and biophysical modeling. Int. J. Wildland Fire 2001, 10, 301–319. [Google Scholar] [CrossRef]
  12. Cameron, H.A.; Díaz, G.M.; Beverly, J.L. Estimating canopy fuel load with hemispherical photographs: A rapid method for opportunistic fuel documentation with smartphones. Methods Ecol. Evol. 2021, 12, 2101–2108. [Google Scholar] [CrossRef]
  13. Stocks, B.J.; Alexander, M.E.; Wotton, B.M.; Stefner, C.N.; Flannigan, M.D.; Taylor, S.W.; Lavoie, N.; Mason, J.A.; Hartley, G.R.; Dalrymple, G.N.; et al. Crown fire behaviour in a northern jack pine-black spruce forest. Can. J. For. Res. 2004, 34, 1548–1560. [Google Scholar] [CrossRef]
  14. Keyes, R.C.; O’Hara, L.K. Quantifying Stand Targets for Silvicultural Prevention of Crown Fires. West. J. Appl. For. 2002, 17, 101–109. [Google Scholar] [CrossRef]
  15. Fo, E. Development and structure of the Canadian Forest Fire Behavior Prediction System; Forestry Canada, Headquarters, Fire Danger Group and Science and Sustainable Development Directorate: Ottawa, ON, Canada, 2002; p. 64.
  16. Finney, M.A. FARSITE: Fire Area Simulator-Model Development and Evaluation; Research Paper; Department of Agriculture, Forest Service, Rocky Mountain Research Station: Ogden, UT, USA, 1998. Available online: https://www.fs.usda.gov/rm/pubs/rmrs_rp004.pdf (accessed on 27 July 2025).
  17. Byram, G.M. Combustion of forest fuels. For. Fire Control. Use 1959, 61–89. [Google Scholar]
  18. Scott, J.H.; Reinhardt, E.D. Assessing Crown Fire Potential by Linking Models of Surface and Crown Fire Behavior; Research Paper; Rocky Mountain Research Station: Fort Collins, CO, USA, 2001. Available online: https://research.fs.usda.gov/treesearch/4623 (accessed on 27 July 2025).
  19. Ruiz-González, A.D.; Álvarez-González, J.G. Canopy bulk density and canopy base height equations for assessing crown fire hazard in Pinus radiata plantations. Can. J. For. Res. 2011, 41, 839–850. [Google Scholar] [CrossRef]
  20. Wang, M.J.; Sun, R.; Xiao, Z.Q. Estimation of Forest Canopy Height and Aboveground Biomass from Spaceborne LiDAR and Landsat Imageries in Maryland. Remote Sens. 2018, 10, 344. [Google Scholar] [CrossRef]
  21. Kucuk, O.; Saglam, B.; Bilgili, E. Canopy fuel characteristics and fuel load in Young Black Pine trees. Biotechnol. Biotechnol. Equip. 2007, 21, 235–240. [Google Scholar] [CrossRef][Green Version]
  22. Smith, F.W.; Keyser, T.; Shepperd, W. Estimating canopy fuels and their impact on potential fire behavior for ponderosa pine in the Black Hills, South Dakota. Environ. Sci. 2009. [Google Scholar]
  23. Smith, S.A.; Keyser, F.W.; Rebain, T.L. Estimating Canopy Bulk Density and Canopy Base Height for Interior Western US Conifer Stands. For. Sci. 2016, 62, 690–697. [Google Scholar] [CrossRef]
  24. Anne, G.; Andreu, J.I.; Blake, S.J.; Stanley, J.Z. Estimating canopy fuel characteristics for predicting crown fire potential in common forest types of the Atlantic Coastal Plain, USA. Int. J. Wildland Fire 2018, 27, 742. [Google Scholar] [CrossRef]
  25. Chang, Y.; He, S.H.; Hu, Y.M.; Bu, R.C.; Li, X.Z. Historic and current fire regimes in the Great Xing’an Mountains, northeastern China: Implications for long-term forest management. For. Ecol. Manag. 2008, 254, 445–453. [Google Scholar] [CrossRef]
  26. Keane, R.E.; Reinhardt, E.D.; Scott, J.; Gray, K.; Reardon, J. Estimating forest canopy bulk density using six indirect methods. Can. J. For. Res. 2005, 35, 724–739. [Google Scholar] [CrossRef]
  27. Zhu, Y.L.; Zhou, G.; Zhang, H.F.; Zhang, J.L.; Dilixiati, B. Study on the Calorific Value and Ash Content of European Mountain Poplar. For. Environ. Sci. 2022, 38, 79–87. [Google Scholar] [CrossRef]
  28. Willmott, C.J. Comments on the evaluation of model performance. Bull. Am. Meteorol. Soc. 1982, 63, 1309–1313. [Google Scholar] [CrossRef]
  29. Rothermel, R.C. A Mathematical Model for Predicting Fire Spread in Wildland Fuels; Research Paper; Department of Agriculture, Intermountain Forest and Range Experiment Station: Ogden, UT, USA, 1972.
  30. Mitsopoulos, I.D.; Dimitrakopoulos, A.P. Canopy fuel characteristics and potential crown fire behavior in Aleppo pine (Pinus halepensis Mill.) forests. Ann. For. Sci. 2007, 64, 287–299. [Google Scholar] [CrossRef]
  31. Chamberlain, C.P.; Meador, A.J.S.; Thode, A.E. Airborne lidar provides reliable estimates of canopy base height and canopy bulk density in southwestern ponderosa pine forests. For. Ecol. Manag. 2021, 481, 118695. [Google Scholar] [CrossRef]
  32. Reinhardt, E.; Scott, J.; Gray, K.; Keane, R. Estimating canopy fuel characteristics in five conifer stands in the western United States using tree and stand measurements. Can. J. For. Res. 2006, 36, 2262–2263. [Google Scholar] [CrossRef]
  33. Zianis, D.; Xanthopoulos, G.; Kalabokidis, K.; Kazakis, G.; Ghosn, D.; Roussou, O. Allometric equations for aboveground biomass estimation by size class for Pinus brutia Ten. Eur. J. For. Res. 2011, 130, 145–160. [Google Scholar] [CrossRef]
  34. Scott, J.H. Comparison of Crown Fire Modeling Systems Used in Three Fire Management Applications; U.S. Forest Service, Rocky Mountain Research Station: Fort Collins, CO, USA, 2006; pp. 1–25. [CrossRef]
  35. Li, J.; Mahalingam, S.; Weise, D.R. Experimental investigation of fire propagation in single live shrubs. Int. J. Wildland Fire 2016, 26, 58–70. [Google Scholar] [CrossRef]
  36. Cruz, M.G.; Alexander, M.E.; Wakimoto, R.H. Assessing canopy fuel stratum characteristics in crown fire prone fuel types of western North America. Int. J. Wildland Fire 2003, 12, 39–50. [Google Scholar] [CrossRef]
  37. Perry, D.A.; Jing, H.; Oetter, Y.D.R. Forest Structure and Fire Susceptibility in Volcanic Landscapes of the Eastern High Cascades, Oregon. Conserv. Biol. 2004, 18, 913–926. [Google Scholar] [CrossRef]
  38. Williams, C.J.; Lepage, B.A.; Vann, D.R.; Tange, T.; Ikeda, H.; Ando, M.; Kusakabe, T.; Tsuzuki, H.; Sweda, T. Structure, allometry, and biomass of plantation Metasequoia glyptostroboides in Japan. For. Ecol. Manag. 2003, 180, 287–301. [Google Scholar] [CrossRef]
  39. He, L.; Zhang, X.; Wang, X.; Ullah, H.; Liu, Y.; Duan, J. Tree Crown Affects Biomass Allocation and Its Response to Site Conditions and the Density of Platycladus orientalis Linnaeus Plantation. Forests 2023, 14, 20. [Google Scholar] [CrossRef]
  40. Li, Q.C.; Liu, Z.L.; Jin, G.Z. Impacts of stand density on tree crown structure and biomass: A global meta-analysis. Agric. For. Meteorol. 2022, 326, 109181. [Google Scholar] [CrossRef]
  41. Kholdaenko, Y.A.; Babushkina, E.A.; Belokopytova, L.V.; Zhirnova, D.F.; Koshurnikova, N.N.; Yang, B.; Vaganov, E.A. The More the Merrier or the Fewer the Better Fare? Effects of Stand Density on Tree Growth and Climatic Response in a Scots Pine Plantation. Forests 2023, 14, 915. [Google Scholar] [CrossRef]
  42. Cruz, M.G.; Alexabder, M.E. Evaluating regression model estimates of canopy fuel stratum characteristics in four crown fire-prone fuel types in western North America. Int. J. Wildland Fire 2011, 21, 168–179. [Google Scholar] [CrossRef]
  43. Hodson, T.O. Root-mean-square error (RMSE) or mean absolute error (MAE): When to use them or not. Geosci. Model. Dev. 2022, 15, 5481–5487. [Google Scholar] [CrossRef]
  44. Mitchell, R.J.; Liu, Y.Q.; O’Brien, J.J.; Elliott, K.J.; Starr, G.; Miniat, C.F.; Hiers, J.K. Future climate and fire interactions in the south-eastern region of the United States. For. Ecol. Manag. 2014, 327, 316–326. [Google Scholar] [CrossRef]
  45. Agee, J.K.; Skinner, C.N. Basic principles of forest fuel reduction treatments. For. Ecol. Manag. 2005, 211, 83–96. [Google Scholar] [CrossRef]
  46. Schoennagel, T.; Veblen, T.T.; Romme, W.H. The interaction of fire, fuels, and climate across rocky mountain forests. Bioscience 2004, 54, 661–676. [Google Scholar] [CrossRef]
  47. Wang, E.; Wan, H.X.; Simeoni, A.; Mou, C.J.; Zhang, Y.C. Experimental Study on Effects of Moisture Content and Tree Height on Crown Fire Behaviors of Live Cypress Trees. Combust. Sci. Technol. 2024, 197, 2727–2742. [Google Scholar] [CrossRef]
  48. Cai, L.Y.; He, H.S.; Wu, Z.W.; Lewis, B.L.; Liang, Y. Development of Standard Fuel Models in Boreal Forests of Northeast China through Calibration and Validation. PLoS ONE 2014, 9, e94043. [Google Scholar] [CrossRef]
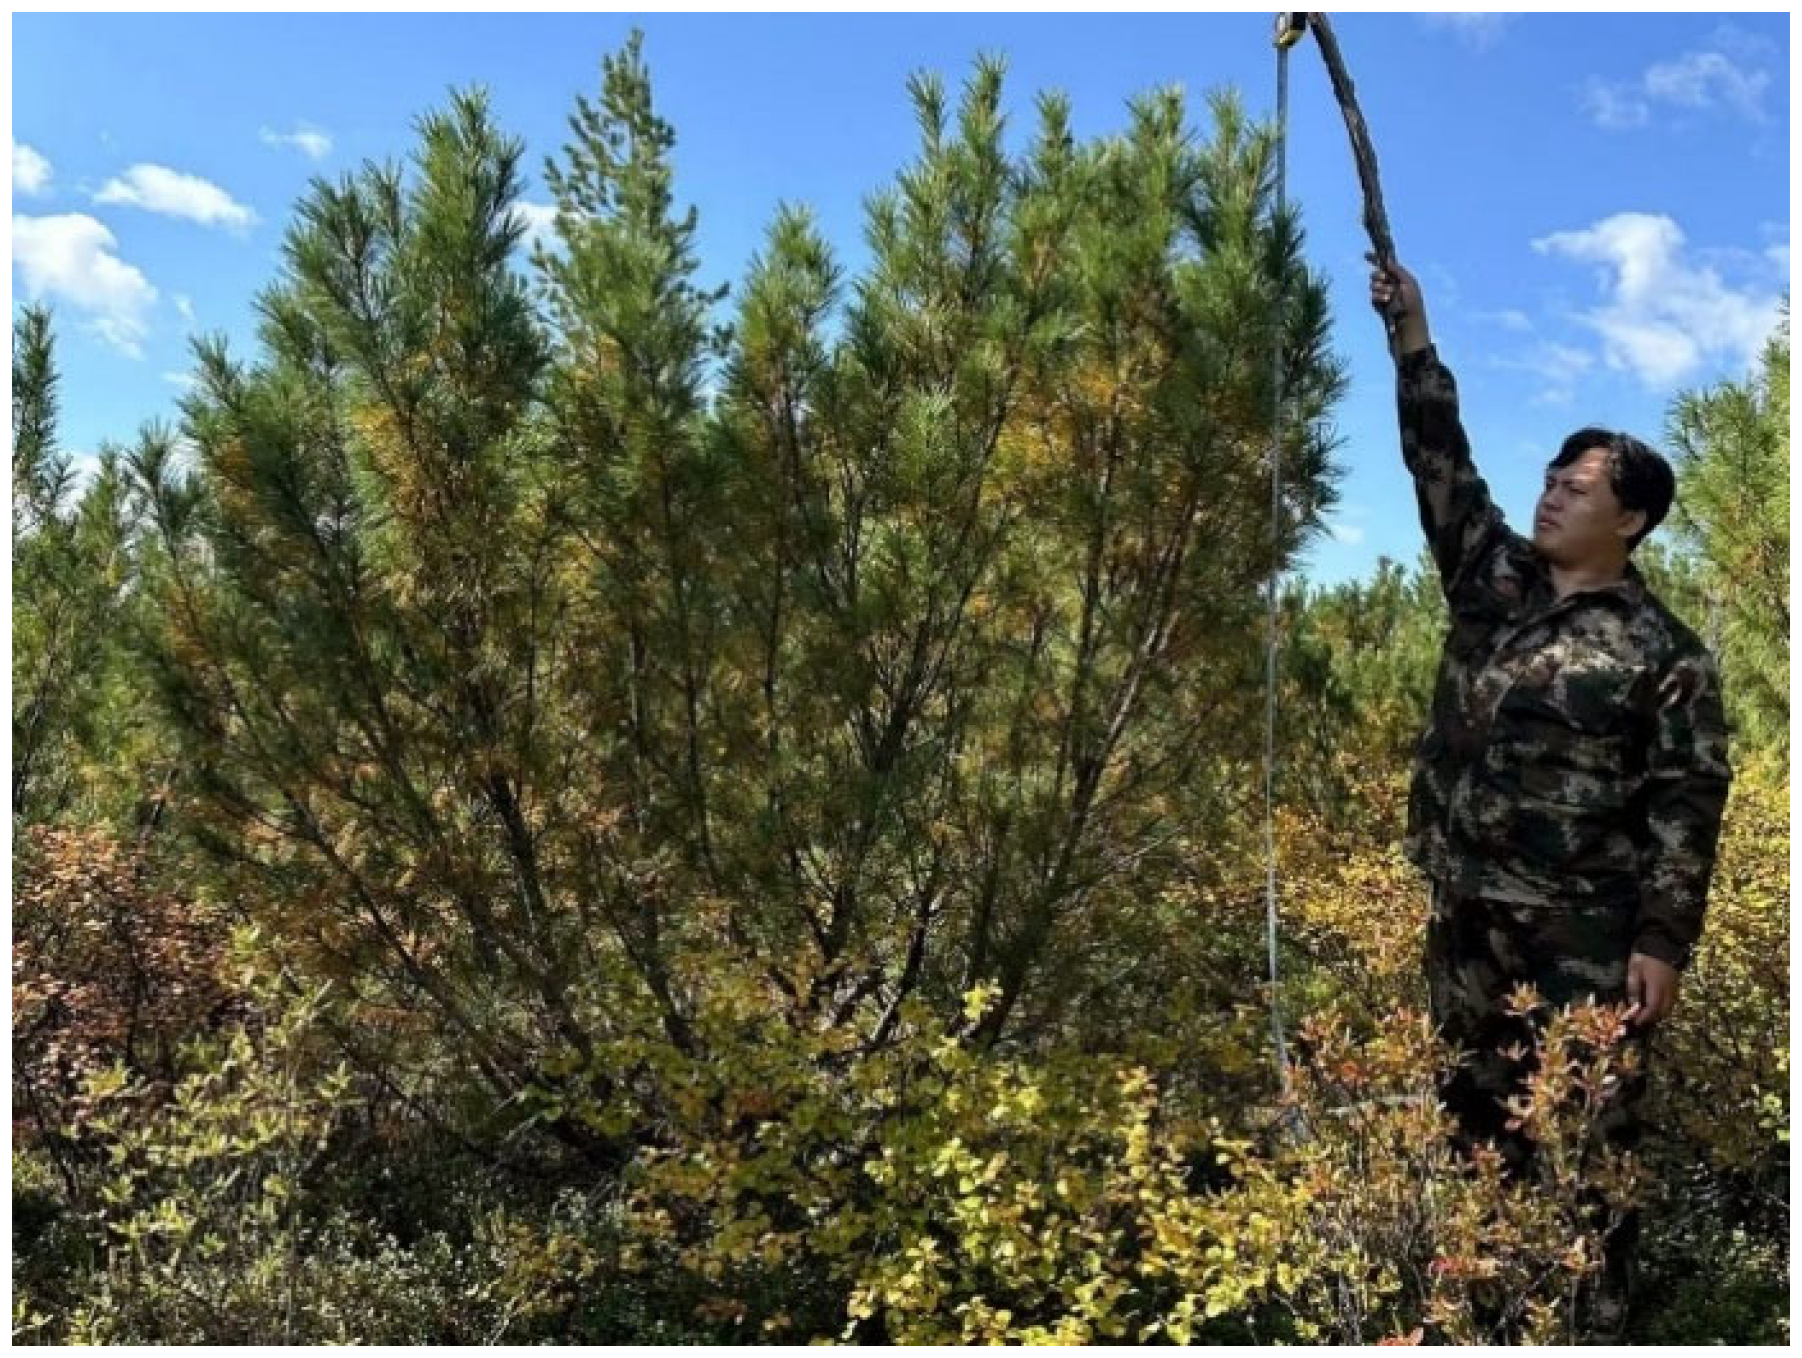
Figure 1. Morphological characteristics of a typical 2.7 m-tall dwarf pine tree.
Fire 08 00347 g001
Figure 2. CFB process judgment diagram. Rinit: critical rate of spread for crown fire initiation (m·min−1); Rsa: surface fire rate of spread when wind speed equals CI (m·min−1).
Fire 08 00347 g002
Figure 3. Vertical distribution characteristics of canopy fuels in dwarf pine forests: (A) vertical distribution of available canopy fuel load in dwarf pines; (B) vertical distribution of canopy bulk density in dwarf pines; (C) vertical distribution of canopy fuel moisture content in dwarf pines; (D) vertical proportion of canopy fuel in dwarf pines. Note: Figures (A,B) show the average values of available canopy fuel load and the canopy bulk density of individual dwarf pines.
Fire 08 00347 g003
Figure 4. Plots of the observed versus predicted values of available canopy biomass, CFL, and CBD. The solid line represents the linear model fitted to the scatter plot of data, and the broken line is the 1:1 line. (A) Comparison chart of the observed and predicted values of the canopy’s available biomass. (B) Comparison chart of observed and predicted values of canopy fuel load. (C) Comparison chart of the observed and predicted values of canopy bulk density.
Fire 08 00347 g004
Figure 5. (A) Graph of the fire’s rate of spread, fireline intensity, and fireline length under different wind speeds and slope conditions when CBH = 0.88 m and stand density = 667 trees·ha−1. (B) Graph of the fire’s rate of spread, fireline intensity, and fireline length under different wind speeds and slope conditions when CBH = 0.48 m and stand density = 1167 trees·ha−1. (C) Graph of the fire’s rate of spread, fireline intensity, and fireline length under different wind speeds and slope conditions when CBH = 0.08 m and stand density = 1667 trees·ha−1.
Fire 08 00347 g005
Figure 6. Least significant difference (LSD) post-comparison chart of slope, wind speed, and CBH effects on fire behavior. (A) The variations in the fire’s rate of spread, fireline intensity, and flame length across different slopes. (B) The variations in the fire’s rate of spread, fire line intensity, and flame length across different wind speeds. (C) The variations in the fire’s rate of spread, fire line intensity, and flame length across different values of CBH.
Fire 08 00347 g006
Table 1. Three burning scenarios generated for simulating potential fire behavior.
Three Burning ScenariosCBH (m)Stand Density (Trees·ha−1)Wind Speed (km·h−1)Sloop
(°)
Low-burning scenario0.886671510
Medium burning scenario0.4811673520
High burning scenario0.0816675530
Table 2. Correlations between available canopy biomass, CFL, and CBD and each modeling factor.
Model FactorAvailable BiomassCFLCBD
H0.804 **0.804 **0.804 **
D0.759 **0.759 **0.762 **
Wc0.704 **0.704 **0.641 **
CBH0.491 **0.491 **0.489 **
Lc0.788 **0.788 **0.789 **
** H: height (m); D: ground diameter (cm); Wc: crown width (average of north-south and east-west); CBH: crown base height (m); Lc: crown length (m).
Table 3. Estimation models for the available canopy biomass, CFL, and CBD of dwarf pines.
Dependent VariableEstimation ModelR2Adjusted R2pRMSE
Available biomasslnY1 = −2.916 + 0.58lnX1 + 1.611lnX2 + 0.866lnX30.9170.911<0.0010.354
CFLlnY2 = −3.978 + 0.57ln X1 + 1.624 lnX2 + 0.864lnX30.9140.908<0.0010.36
CBDlnY1 = −3.965 + 0.58lnX1 + 0.611lnX2 + 0.866lnX30.8650.855<0.0010.354
Y1: biomass (kg); Y2: CFL (kg·m−2); Y3: CBD (kg·m−3); X1: ground diameter (cm); X2: crown length (m); X3: crown width (m) (crown width is the average of east-west and north-south measurements). The three equations are all based on the canopy fuel data of entire clusters, where each cluster consists of three individual trees.
Table 4. Results of the three-way ANOVA for the main and interactive effects of slope, wind speed, and CBH on ROS, FLI, and FL.
Independent VariableDependent VariabledfF-Valuep-Value
SlopeROS240.455 <0.001
FLI214.417 0.002
FL215.1160.002
Wind speedROS238,494.181 <0.001
FLI28581.862<0.001
FL27263.969 <0.001
CBHROS23054.675 <0.001
FLI221.514<0.001
FL27.4800.015
Slope × CBHROS40.414 0.794
FLI40.0730.989
FL40.057 0.993
Wind speed × CBHROS48000.130<0.001
FLI42071.252 <0.001
FL41817.699<0.001
Slope × wind speedROS43.8270.050
FLI42.1890.161
FL41.916 0.201
ROS: fire rate of spread (m·min−1); FLI: fireline intensity (kW·m−1); FL: flame length (m); CBH: canopy base height (m).
Table 5. The test results of the canopy’s available biomass, CFL, and CBD equations.
Dependent VariableR2RMSEMAE
Available canopy biomass0.8410.472−0.232
CFL0.8240.500−0.242
CBD0.7260.472−0.233
Available canopy biomass: needles, branches with a diameter < 0.6 cm; CFL: canopy fuel load (kg·m−2); CBD: canopy bulk density (kg·m−3); RMSE: root mean square error; MAE: mean absolute error.
Disclaimer/Publisher’s Note: The statements, opinions and data contained in all publications are solely those of the individual author(s) and contributor(s) and not of MDPI and/or the editor(s). MDPI and/or the editor(s) disclaim responsibility for any injury to people or property resulting from any ideas, methods, instructions or products referred to in the content.