Article

All-Weather Forest Fire Automatic Monitoring and Early Warning Application Based on Multi-Source Remote Sensing Data: Case Study of Yunnan

1
Key Laboratory of Sustainable Forest Ecosystem Management of Ministry of Education, College of Forestry, Northeast Forestry University, Harbin 150040, China
2
College of Forestry, Northeast Forestry University, Harbin 150040, China
3
Department of Surveying Engineering, Heilongjiang Institute of Technology, Harbin 150040, China
*
Author to whom correspondence should be addressed.
Fire 2025, 8(9), 344; https://doi.org/10.3390/fire8090344
Submission received: 4 July 2025 / Revised: 18 August 2025 / Accepted: 26 August 2025 / Published: 27 August 2025

Abstract

Forest fires pose severe ecological, climatic, and socio-economic threats, destroying habitats and emitting greenhouse gases. Early and timely warning is particularly challenging because fires often originate from small-scale, low-temperature ignition sources. Traditional monitoring approaches primarily rely on single-source satellite imagery and empirical threshold algorithms, and most forest fire monitoring tasks remain human-driven. Existing frameworks have yet to effectively integrate multiple data sources and detection algorithms, lacking the capability to provide continuous, automated, and generalizable fire monitoring across diverse fire scenarios. To address these challenges, this study first improves multiple monitoring algorithms for forest fire detection, including a statistically enhanced automatic thresholding method; data augmentation to expand the U-Net deep learning dataset; and the application of a freeze–unfreeze transfer learning strategy to the U-Net transfer model. Multiple algorithms are systematically evaluated across varying fire scales, showing that the improved automatic threshold method achieves the best performance on GF-4 imagery with an F-score of 0.915 (95% CI: 0.8725–0.9524), while the U-Net deep learning algorithm yields the highest F-score of 0.921 (95% CI: 0.8537–0.9739) on Landsat 8 imagery. All methods demonstrate robust performance and generalizability across diverse scenarios. Second, data-driven scheduling technology is developed to automatically initiate preprocessing and fire detection tasks, significantly reducing fire discovery time. Finally, an integrated framework of multi-source remote sensing data, advanced detection algorithms, and a user-friendly visualization interface is proposed. This framework enables all-weather, fully automated forest fire monitoring and early warning, facilitating dynamic tracking of fire evolution and precise fire line localization through the cross-application of heterogeneous data sources. The framework’s effectiveness and practicality are validated through wildfire cases in two regions of Yunnan Province, offering scalable technical support for improving early detection of and rapid response to forest fires.

1. Introduction

Forest fires can cause severe ecological damage, threaten human life and property, and reduce forest stocks [1,2]. In the past decade, the total number of forest fires in China has exceeded 3500, with a total burned area of 485,000 hectares and a disaster-affected area of 193,000 hectares. Behind these alarming numbers, thick smoke billows, and many trees fall into the blazing fire, turning to ash [3]. By the end of this century, it is projected that 60% to 70% of China’s forests will face a higher risk of wildfires. In southwestern China, fire intensity is expected to increase locally, accompanied by an expansion in burned area [4].
As satellites continue to be launched globally, satellite imagery for integrated processing and disaster analysis offers advantages such as low cost, a wide monitoring range [5], less external interference, and large amounts of information [6], making it the most widely used tool for forest fire monitoring [7,8]. While many existing studies have focused on improving algorithms for fire pixel detection [9,10], they often overlook the timeliness and automation required for effective forest fire monitoring. The key to early warning and continuous monitoring of forest fires is not only the algorithm itself but also factors such as the algorithm’s initiation time, the coverage of the data, and the presentation of the results. Therefore, how to integrate remote sensing data with algorithms, and how to achieve all-weather, automated monitoring and early warning of forest fires, remains a challenge. To address this, the present study designed the following objectives:
(1)
The study aims to explore and optimize forest fire monitoring algorithms tailored to three types of multi-source remote sensing imagery—GF-4, Landsat 8, and Sentinel-2. The study aims to systematically evaluate the applicability and performance differences of the U-Net deep learning algorithm, improved automatic threshold algorithm, and traditional empirical threshold algorithm across various fire scales. Special attention is given to enhancing fire pixel detection under complex environmental conditions by incorporating statistical method and data augmentation strategies. Finally, the feasibility of deep learning approaches in the domain of forest fire monitoring is also explored.
(2)
The study aims to design and implement a data-driven scheduling technology that integrates autonomous data acquisition and automated task scheduling. By constructing an end-to-end data processing workflow covering data acquisition, preprocessing, fire detection, and visualization, the level of intelligence and response efficiency in forest fire monitoring can be significantly enhanced. The aim is to achieve a fully automated closed-loop process from data to results while supporting a priority handling mechanism for emergency events. The study further aims to provide more scientific and timely decision support for forestry management departments, promoting the transformation of forest fire monitoring from event-driven to data-driven approaches.
(3)
A framework integrating data processing, algorithms, and a visualization interface was designed to fully exploit the spatiotemporal characteristics of multi-source remote sensing data for the dynamic tracking and fine-scale detection of forest fires. Using representative forest fire events in Yunnan Province as case studies, the effectiveness and scalability of the proposed framework were validated in practical applications. The ultimate goal is to provide a generalizable and scalable technical solution for rapid fire detection and intelligent early warning of forest fires. The framework also includes a visualization interface featuring spatial querying, temporal evolution analysis, and administrative-level statistics, thereby enhancing the interpretability and practical usability of the results.

2. Related Works

2.1. Fire Detection Methods

Fatemeh Parto et al. proposed a near-real-time fire monitoring method based on spatial and temporal variations using MODIS data, which demonstrates high sensitivity to small and cold forest fires [11]. In 2023, Zhang Han et al. used Himawari-8 data and applied the weighted context method to detect fires, effectively utilizing Himawari-8′s advantages in terms of observation frequency and spectral bands and achieving a low missed detection rate [12]. Honglin Wang et al. proposed an improved model, YOLO-LFD, to address the limitations of fire detection methods using sensors such as UAVs, particularly in terms of real-time performance and detection accuracy. The proposed model aims to enhance inference speed while maintaining high detection accuracy on resource-constrained devices [13]. Hanqiu Xu et al. emphasized that accurately identifying the development process of wildfires is crucial for comprehensively understanding their extent, frequency, and ecological impacts. They utilized high-temporal-resolution MODIS imagery and nighttime light data to comprehensively track wildfire events [14].

2.2. All-Weather Automated Forest Fire Monitoring Technology

Puzhao Zhang et al. used SAR and optical image time series to improve the tracking frequency of forest fires and iteratively trained a U-Net model; however, their tracking results were represented as burned areas [15]. Cristina Vittucci et al. developed a new framework for automatically detecting burned vegetation areas using open-source satellite datasets (SAR and MS data) and cloud computing services. The framework depends on script deployment to efficiently leverage cloud platforms for automated data access, demonstrating great potential in automatic wildfire monitoring [16]. Kenneth Bonilla-Ormachea et al. proposed a low-cost forest fire monitoring system that integrates Internet of Things (IoT) technology, deep reinforcement learning, and computer vision to achieve automated wildfire monitoring over large areas [17]. Sweden’s government, via the Swedish Civil Contingencies Agency and the Swedish Meteorological and Hydrological Institute (SMHI), has developed a fully automated, end-to-end satellite-based forest fire detection system. Leveraging near-real-time VIIRS data, the system completes fire detection and delivers SOS alerts to local fire and rescue services within approximately 15 min. Replacing costly manned aerial surveillance, this automated system improves both efficiency and coverage—especially in remote areas or at night.
Although unmanned aerial vehicle (UAV) imagery provides high spatial resolution, its coverage is limited; in contrast, single-satellite data offer large-area monitoring but may miss small or short-lived fire events. Most existing studies focus primarily on improving algorithm performance, without effectively integrating multiple data sources and analytical methods. Moreover, many forest fire monitoring tasks remain human-driven, limiting their ability to provide timely alerts. These limitations highlight the need for an all-weather, automated monitoring framework based on multi-source satellite imagery. By leveraging the complementary strengths of multiple satellite sensors, such a framework can overcome coverage and revisit-frequency constraints, while high-precision detection algorithms ensure reliable and timely information for emergency response.

3. Study Area and Data

3.1. Study Area

This study conducts fire monitoring and analysis on forest fire events in Anning City and Jinning District of Yunnan Province. The locations of the study areas are shown in Figure 1, where the vector boundaries of Anning City and Jinning District are highlighted in purple and green, respectively. The figure overlays Landsat 8 imagery during the fire event for Anning City and post-fire Sentinel-2 imagery for Jinning District.
Anning City is located between 102°8′ and 102°37′ east longitude and 24°31′ and 25°6′ north latitude [18]. With an average elevation of 1800m, the terrain is high in the southeast and low in the northwest. It features three mountainous basins, while the remaining areas are composed of mountainous and semi-mountainous regions. The forest is dominated by Pinus yunnanensis Franch, a highly flammable species [19].
On 13 April 2023, at 16:21, a forest fire broke out in Guanzhuang village, Wenquan street, Anning City, Yunnan Province. After the fire occurred, an emergency response plan was activated immediately, and a frontline command was established. Relevant departments rushed to the scene to direct firefighting efforts. With the combined efforts of more than 2000 people, including forest firefighters, professional firefighting teams, and residents, the fire was fully extinguished by 18 April.
Jinning District is located in Kunming City, Yunnan Province, China, with geographical coordinates ranging from 24°23′ to 24°48′ N latitude and 102°12′ to 102°52′ E longitude. The district’s terrain belongs to the shallowly dissected mid-mountain region and faulted basin area of the central Yunnan Plateau, with elevation decreasing from south to north. The forest vegetation is dominated by semi-humid evergreen broadleaf forests.
At 16:00 on 12 April 2024, a forest fire broke out in Daheishan, Erjie Town, Jinning District. The fire site featured rugged terrain with intersecting gullies, high mountains, and dense forests. Under the combined influence of terrain and strong winds, the fire underwent multiple cycles of extinguishing, re-ignition, and extinguishing. The fire was fully extinguished by 21:00 on 15 April 2024.
Both regions feature complex terrain, abundant vegetation, and seasonal accumulation of combustible materials, resulting in high forest fire susceptibility and rapid fire spread. These environmental and topographic characteristics also pose significant challenges for real-time forest fire monitoring and emergency response.

3.2. Datasets

The GF-4 satellite orbits at an altitude of 36,000 km, with spatial resolutions of 50 m in the visible spectrum and 400 m in the middle infrared spectrum. It fills a gap in both China and the global market for high-altitude, high-resolution remote sensing satellites [20]. Owing to its unique orbital position and advanced imaging technology, each image it captures covers approximately 160,000 km2, allowing it to observe areas from low-latitude tropical islands to high-latitude polar regions. This enables comprehensive and efficient observation of China and its surrounding areas, providing critical information for rescue decision-making [21].
Landsat 8 is the eighth satellite in the U.S. Landsat program. Its sensor consists of the Operational Land Imager (OLI) and Thermal Infrared Sensor (TIRS) [22]. The OLI has nine spectral bands and can provide seasonal global land coverage at a spatial resolution of 30 m, whereas the TIRS is used to measure thermal energy and provides data in two bands [23,24]. Landsat 8 orbits the Earth in a near-polar Sun-synchronous orbit at an altitude of 705 km, with an inclination angle of 98.2°. The satellite has a repeat cycle of 16 days and can collect 550 scenes per day.
Sentinel-2 is equipped with a wide-swath, high-resolution multispectral imager comprising thirteen spectral bands [25], including four visible and near-infrared (NIR) bands at 10 m resolution [26], six red edge and shortwave infrared (SWIR) bands at 20 m resolution, and three atmospheric correction bands at 60 m resolution. The satellite has a revisit cycle of less than five days.

4. Methods

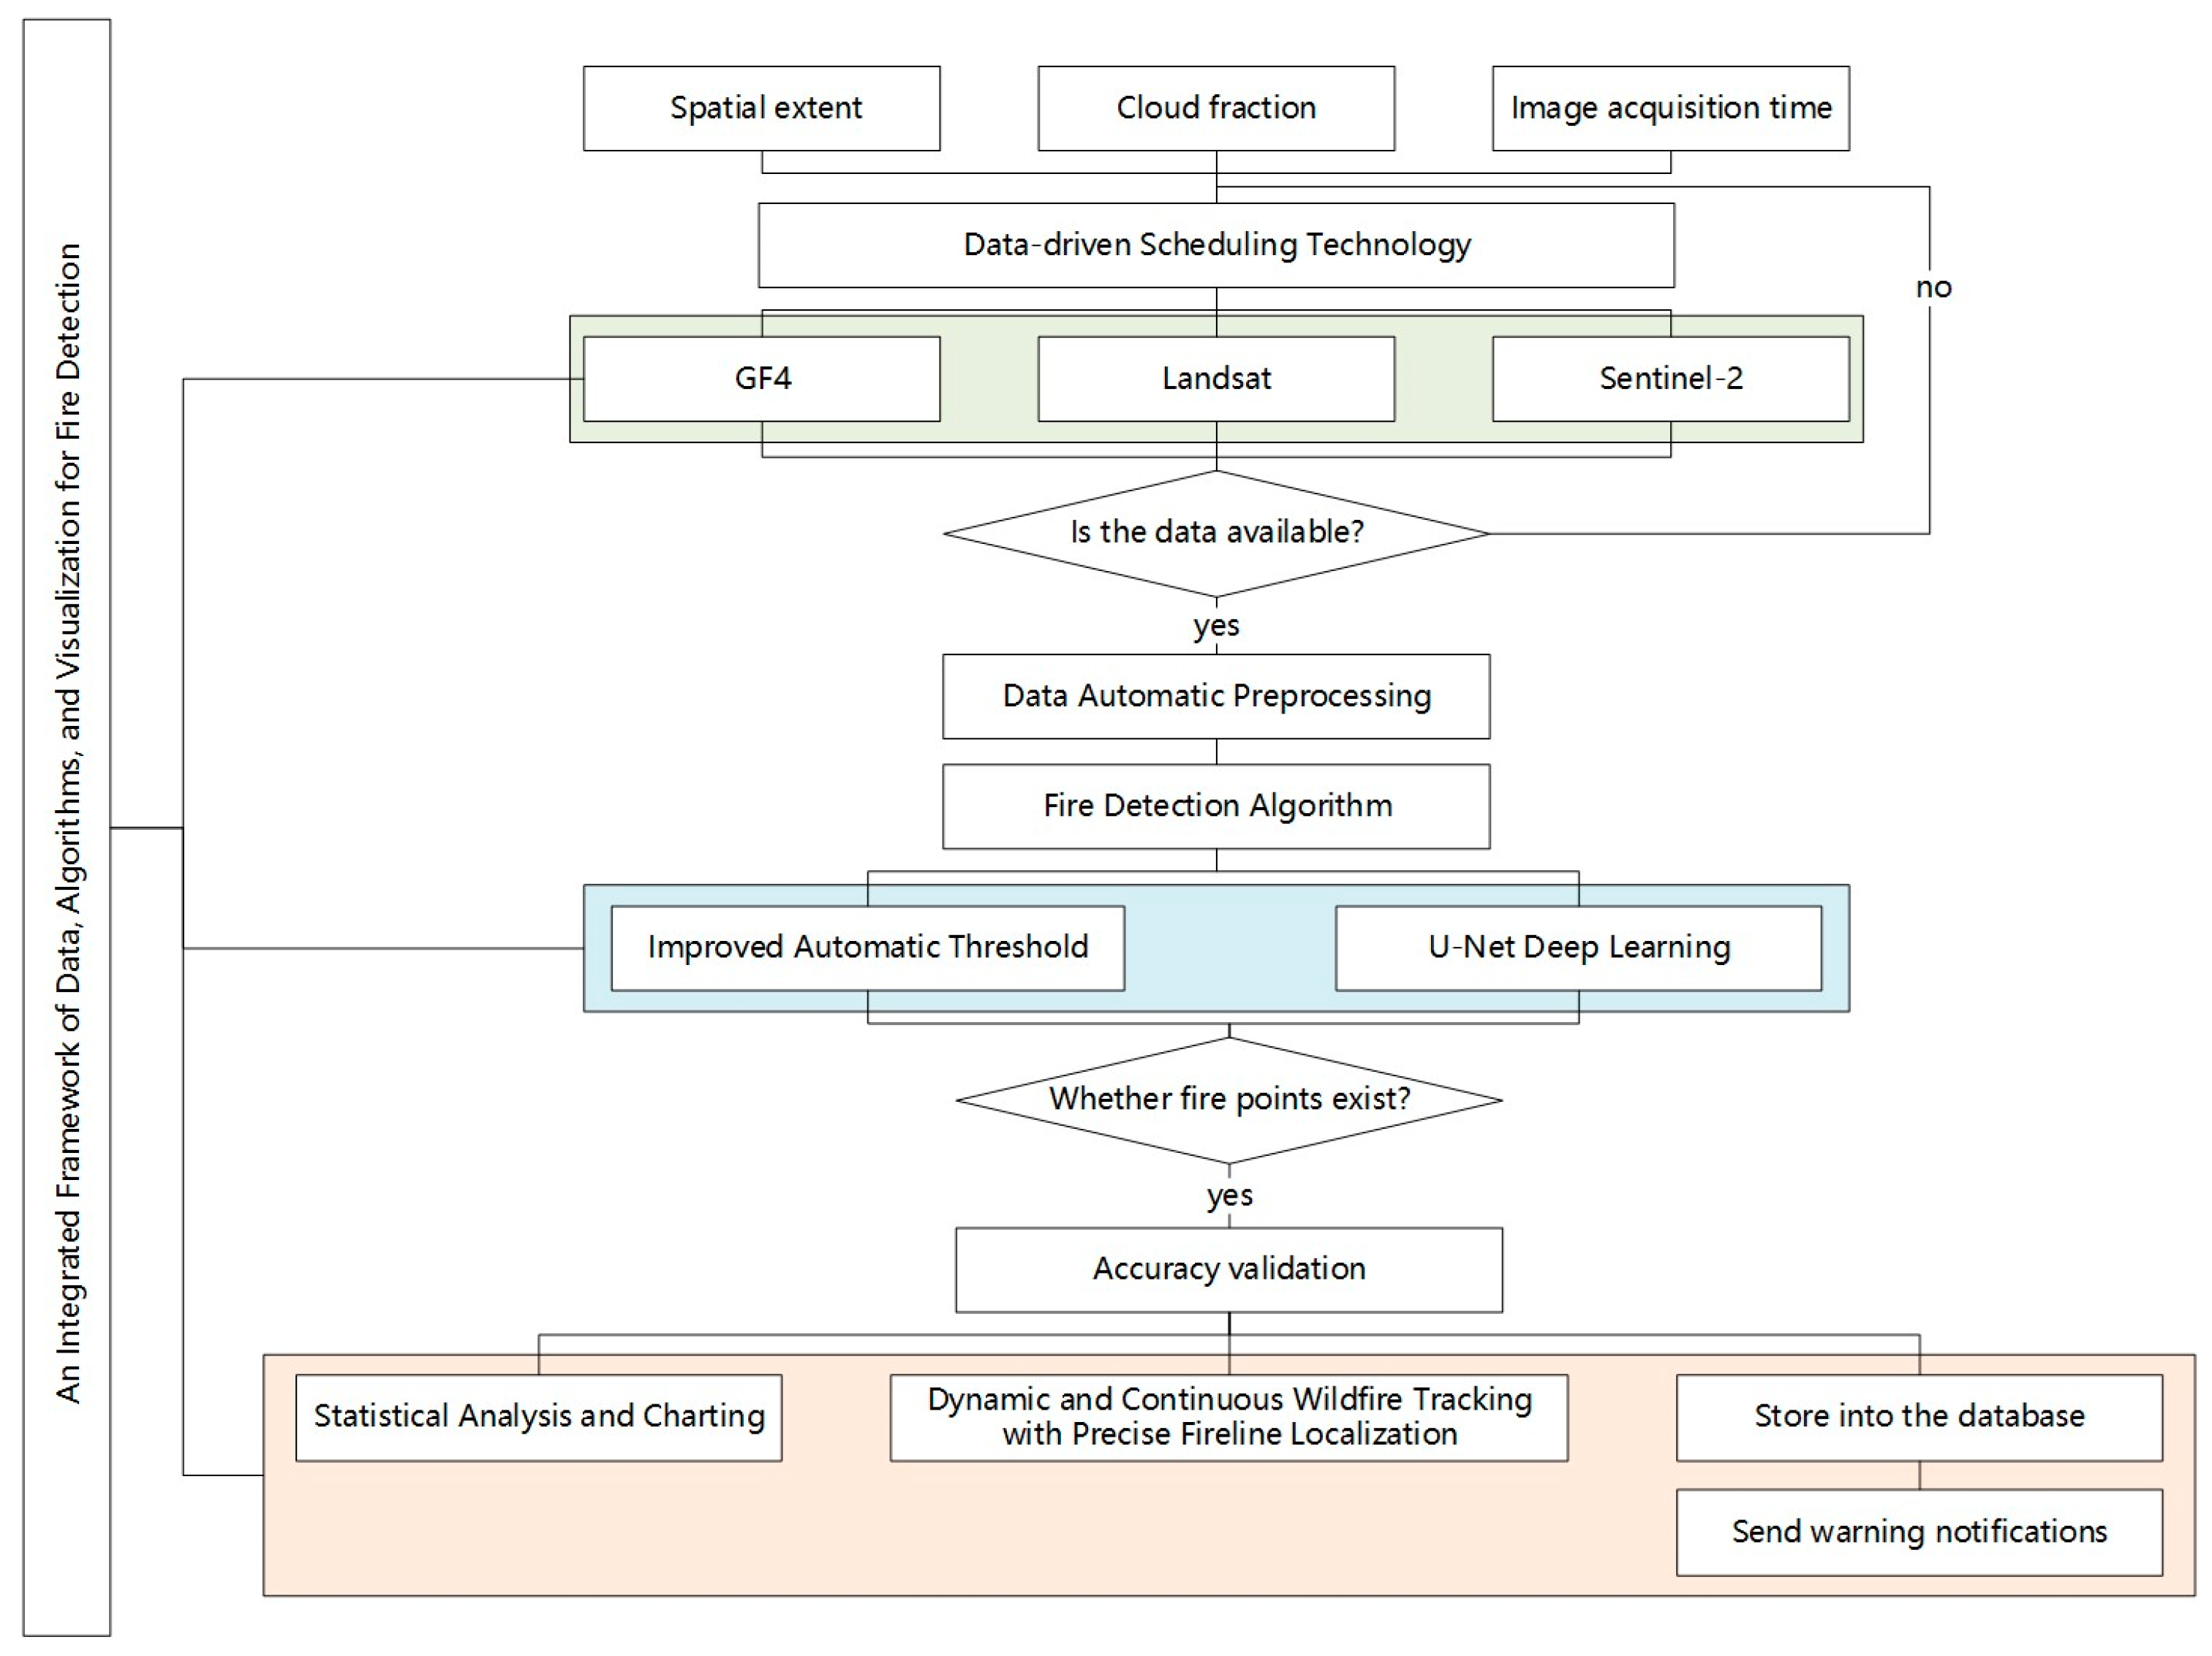
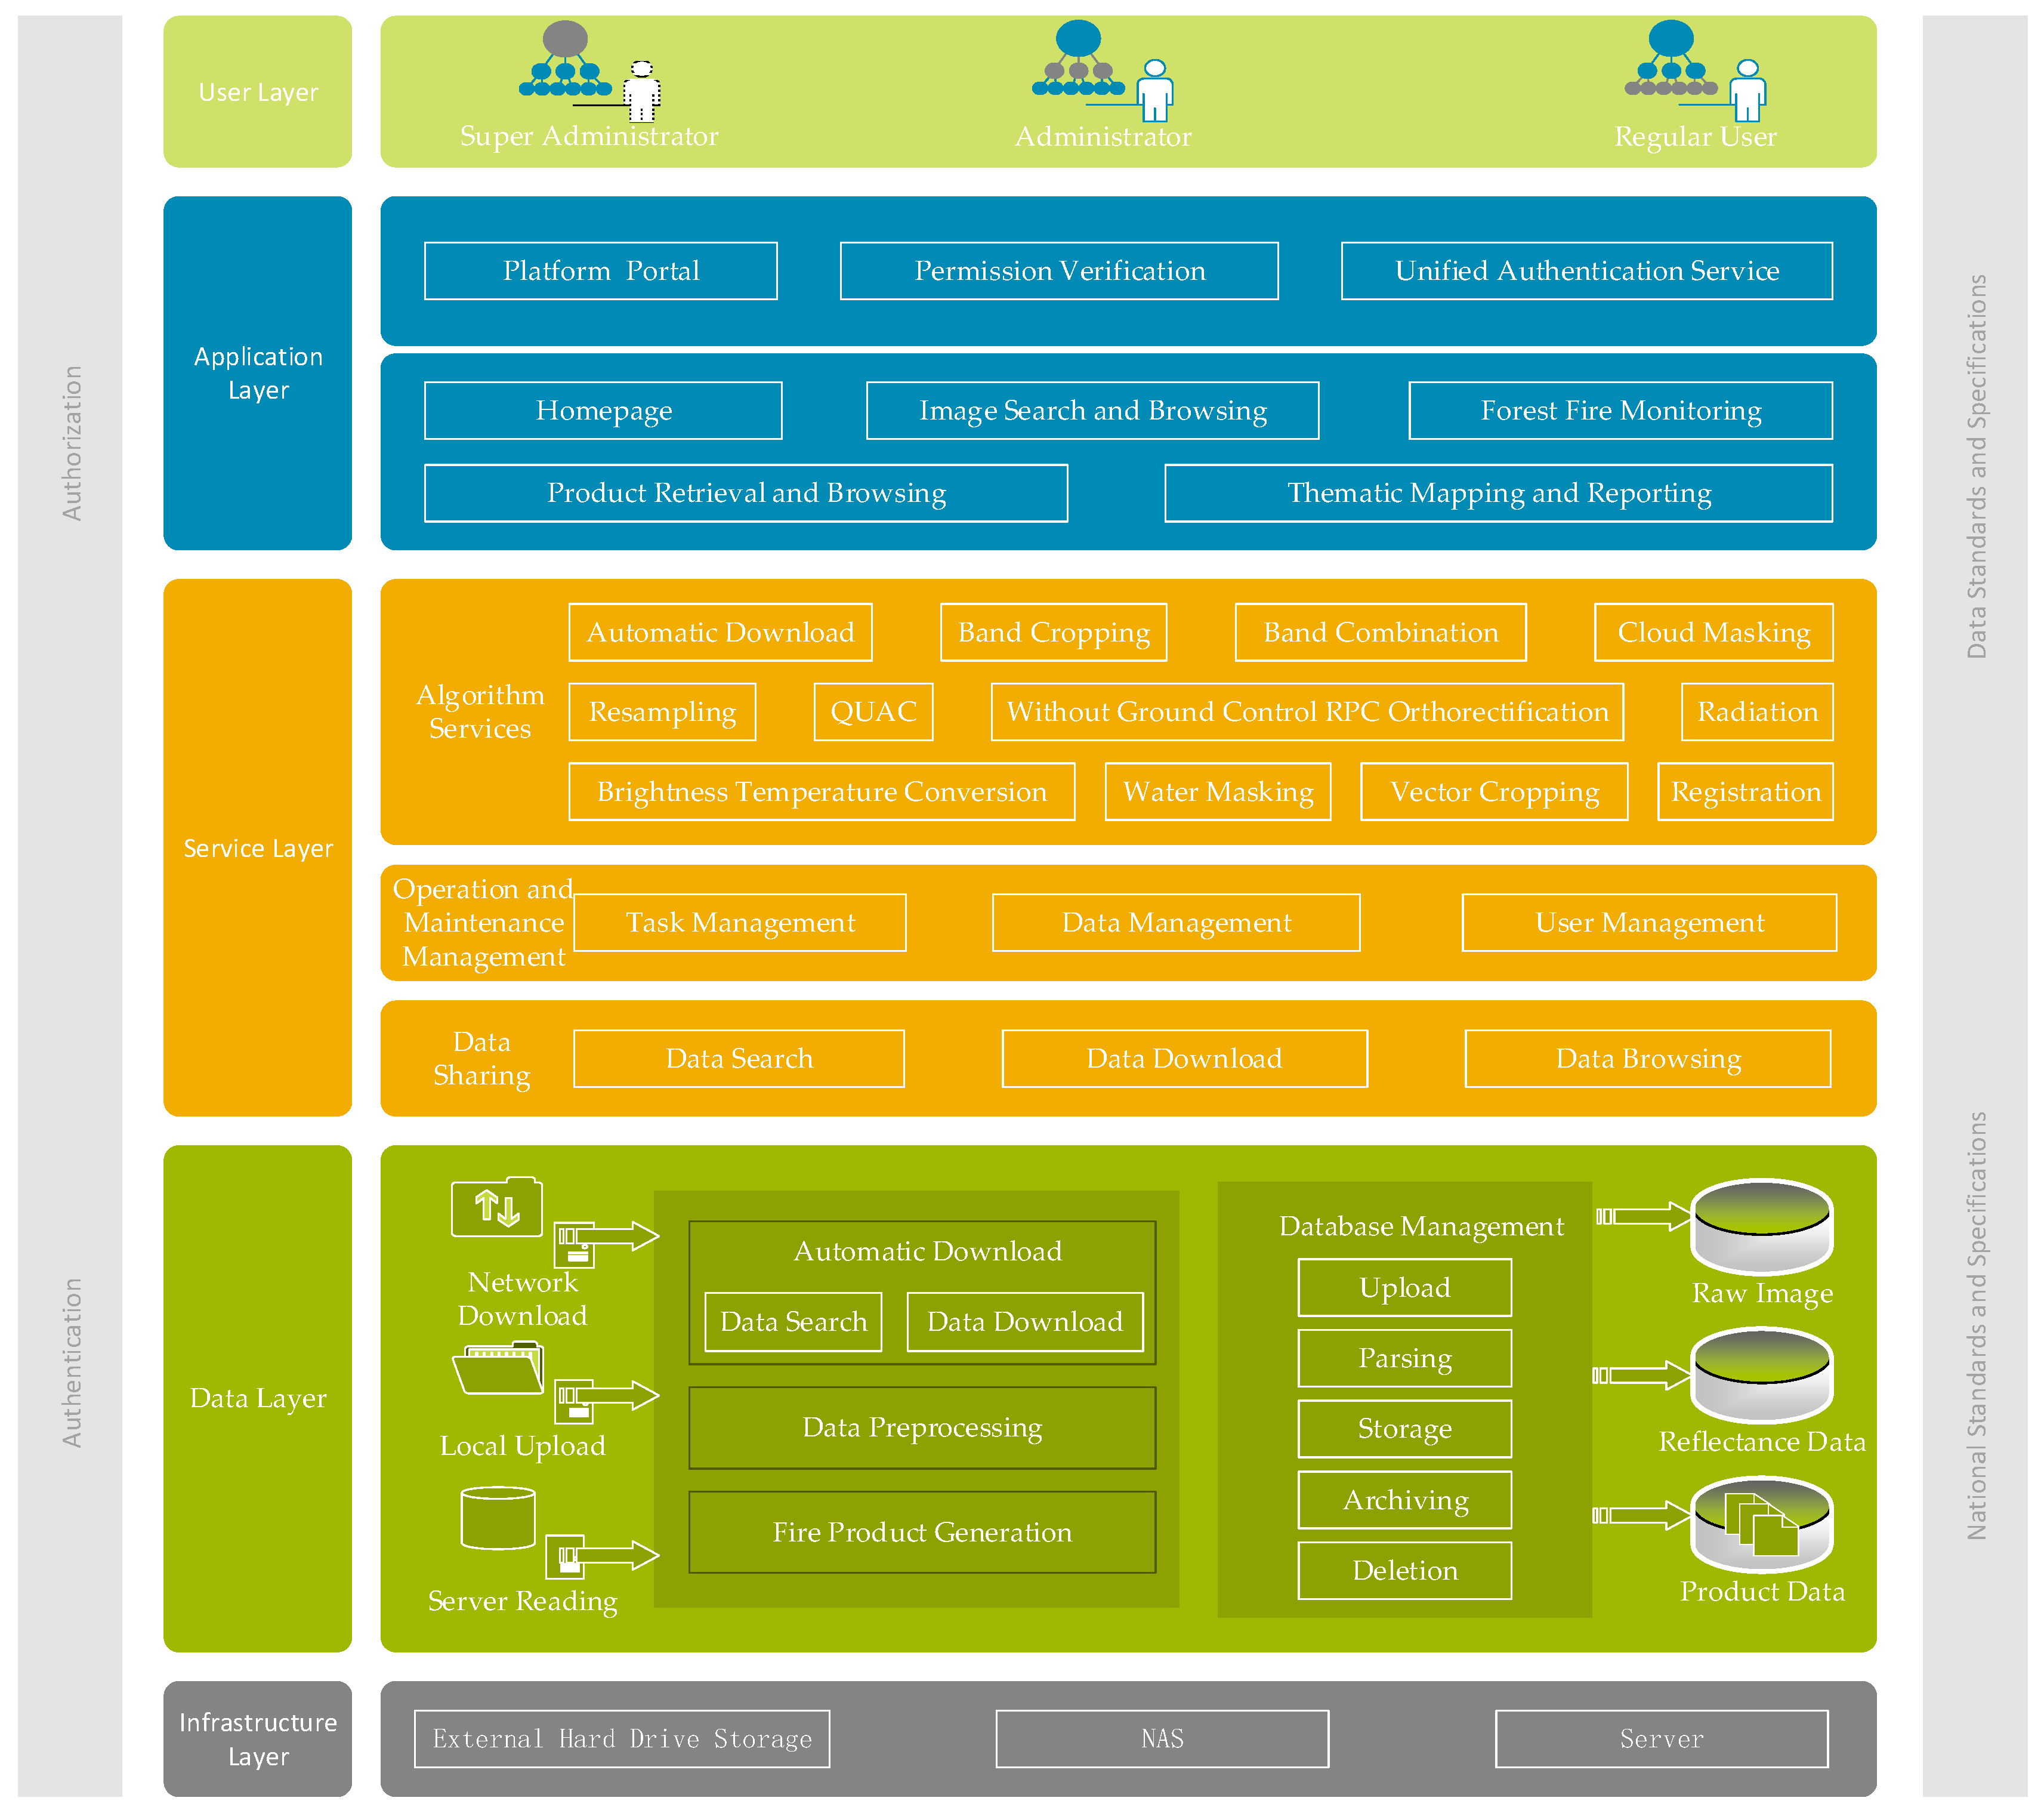
This section primarily presents the key technologies and methods employed in this study, including the data-driven scheduling technology, forest fire detection algorithms, and an integrated framework of data, algorithms, and visualization. In addition, this section introduces the automatic data preprocessing workflow and the accuracy validation methods. The overall technical framework is illustrated in Figure 2.

4.1. Data-Driven Scheduling Technology

This paper proposes a data-driven scheduling technology approach for automatic data downloading and fire pixel monitoring. It utilizes Advanced Python Scheduler 3.10.4 (APScheduler) for scheduled querying of data interfaces, performing real-time comparisons of the data status in the database, as shown in Figure 3. Data that meets predefined conditions immediately triggers the data download and fire pixel monitoring algorithms. This functionality is deployed in a distributed environment across different nodes, where tasks are executed synchronously, and remote functions are invoked via Remote Python Call 6.0.1 (RPyC) technology for execution on remote nodes.
Additionally, the paper employs a chunked download and processing technique. The principle of this technique is to create multiple parallel channels, with each channel responsible for downloading and processing a specific chunk of data. Each chunk also supports resuming from a breakpoint, enhancing the efficiency of data transfer and processing time.
Beyond the scheduled task execution described above, the framework also incorporates a task priority scheduling mechanism. When a high volume of data leads to task backlog or when fire-related information is detected in a specific region, the framework allows for setting priority levels for data scheduling tasks. This enables dynamic sorting of tasks in the queue based on priority policies, ensuring that important tasks are prioritized for execution. This paper uses GF-4 data for all-weather fire monitoring. When a fire is detected, it automatically triggers the search for Landsat 8 and Sentinel-2 data, setting the priority level of these tasks to “high.” Once the data is found, it is downloaded and processed by invoking the fire detection functions, achieving precise localization and analysis of the fire incident.

4.2. Data Automatic Preprocessing

The paper involves three types of remote sensing data: one with high-temporal-resolution imagery, GF-4 PMI, and two with high-spatial-resolution imagery, Landsat 8 and Sentinel-2. The automatic preprocessing steps for multi-source remote sensing data are as follows.
GF-4 PMI data are high-temporal-resolution imagery, containing both PMS and IRS data, so they are processed separately before band combination. The processing of PMS data includes band clipping, radiometric calibration, quick atmospheric correction, and orthorectification without control points. The processing of IRS data includes image registration and brightness temperature conversion. Finally, both datasets were processed through vector clipping, resampling, band combination, cloud masking [27], and water masking using the Normalized Difference Water Index (NDWI).
N D W I = G R E E N N I R G R E E N + N I R > T H
where GREEN is the green band; TH is the threshold, which is set to 0.1 by default.
Image registration of GF-4 PMI data is often a key step in image preprocessing, playing a decisive role in the deviation of fire point location identification. The principle of image registration processing for these data is as follows: A comparison revealed that there is a geographic offset between the PMS and IRS data. Therefore, PMS data are used as the reference image for the registration of IRS data. Since the reference image belongs to the visible light spectrum and the image to be registered belongs to the mid-infrared spectrum, the mutual information function is used to automatically generate tie points by comparing the similarity between the two images. The initial number of generated tie points is ≥512. The maximum allowed error for each tie point is set to 0.9. The tie points are sorted by the distance between the tie points and the predicted positions, from largest to smallest. The tie points with the largest error are iteratively removed until no tie points have an error greater than the specified value. Finally, image registration is performed via the tie points.
The preprocessing of Landsat 8 and Sentinel-2 imagery includes spectral band selection and compositing, as well as partitioning the images into 256 × 256 pixel patches.

4.3. Fire Detection Algorithm

4.3.1. Fire Detection Algorithm for GF-4 Data

Due to the lower spatial resolution of GF-4 data and the presence of many mixed pixels, the information from a single pixel does not adequately represent all land cover conditions. In this paper, two thresholding algorithms are used for fire point monitoring with GF-4 imagery:
  • Improved Automatic Threshold Algorithm
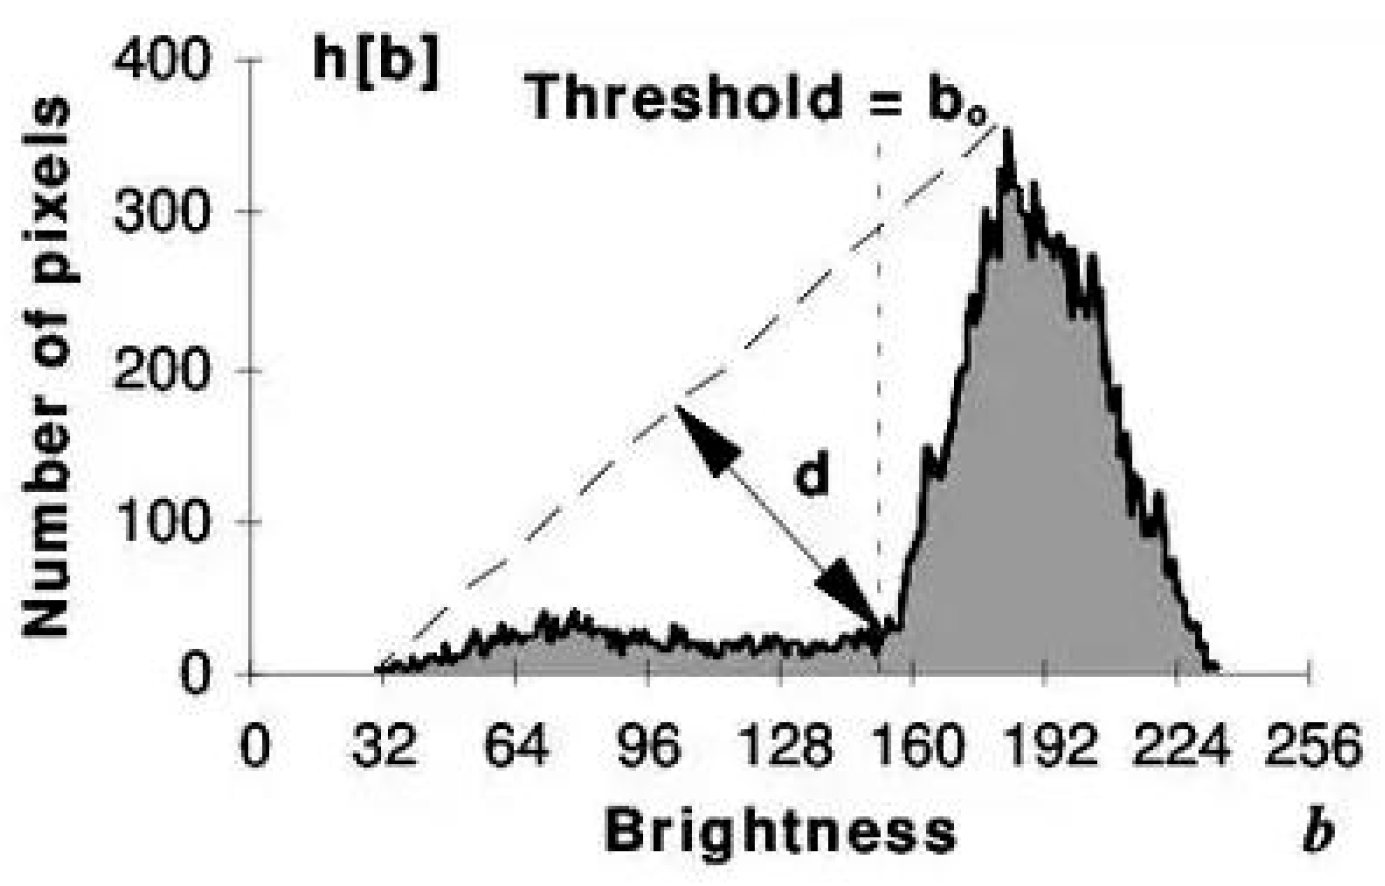
GF-4 data have high temporal resolution and include a middle infrared band, which can reflect surface temperature to some extent. First, the GF-4 PMI data are filtered using the Normalized Difference Vegetation Index (NDVI) to exclude most non-vegetated areas. Since forest fires generate characteristic thermal anomalies and fire pixel temperatures differ between day and night, IRS data are further used to identify fire pixels. Pixels with daytime and nighttime temperature values exceeding 335 and 320, respectively, are classified as definite fire pixels; otherwise, a neighborhood window calculation is applied, as shown in Equation (2). THauto refers to the automatically generated threshold using the statistical triangular threshold method. The principle is illustrated in Figure 4.
P M I : N D V I = N I R R E D N I R + R E D > 0.12   a n d I R S : T > 335   o r   ( T > max [ T H a u t o , 320 ]   a n d   T > T ¯ + 1.5 σ T )   daytime T > 320   o r   ( T > max [ T H a u t o , 305 ]   a n d   T > T ¯ + 1.5 σ T )   nighttime
where NIR is the near-infrared band; RED is the red band.
Where b: pixel value; h[b]: the number of pixels in the histogram at pixel level = b; d: the distance from a point in the histogram to the reference line, which is formed by connecting the histogram peak point and the tail endpoint; Threshold: the segmentation threshold; bo: the pixel value that is farthest from the reference line.
  • Fixed Threshold Algorithm
The fixed threshold method uses predetermined values to classify pixels, distinguishing fire pixels from the background. In this study, the empirical thresholds for GF-4 imagery vary based on acquisition time, set at 331 K and 318 K. Pixels with a data value exceeding these thresholds are identified as fire pixels, as shown in Equation (3).
T > 331   K   daytime T > 318   K   nighttime

4.3.2. Fire Detection Algorithm for Landsat 8/Sentinel-2 Data

The following algorithms were used for fire detection using Landsat 8/Sentinel-2 data:
  • U-Net Deep Learning
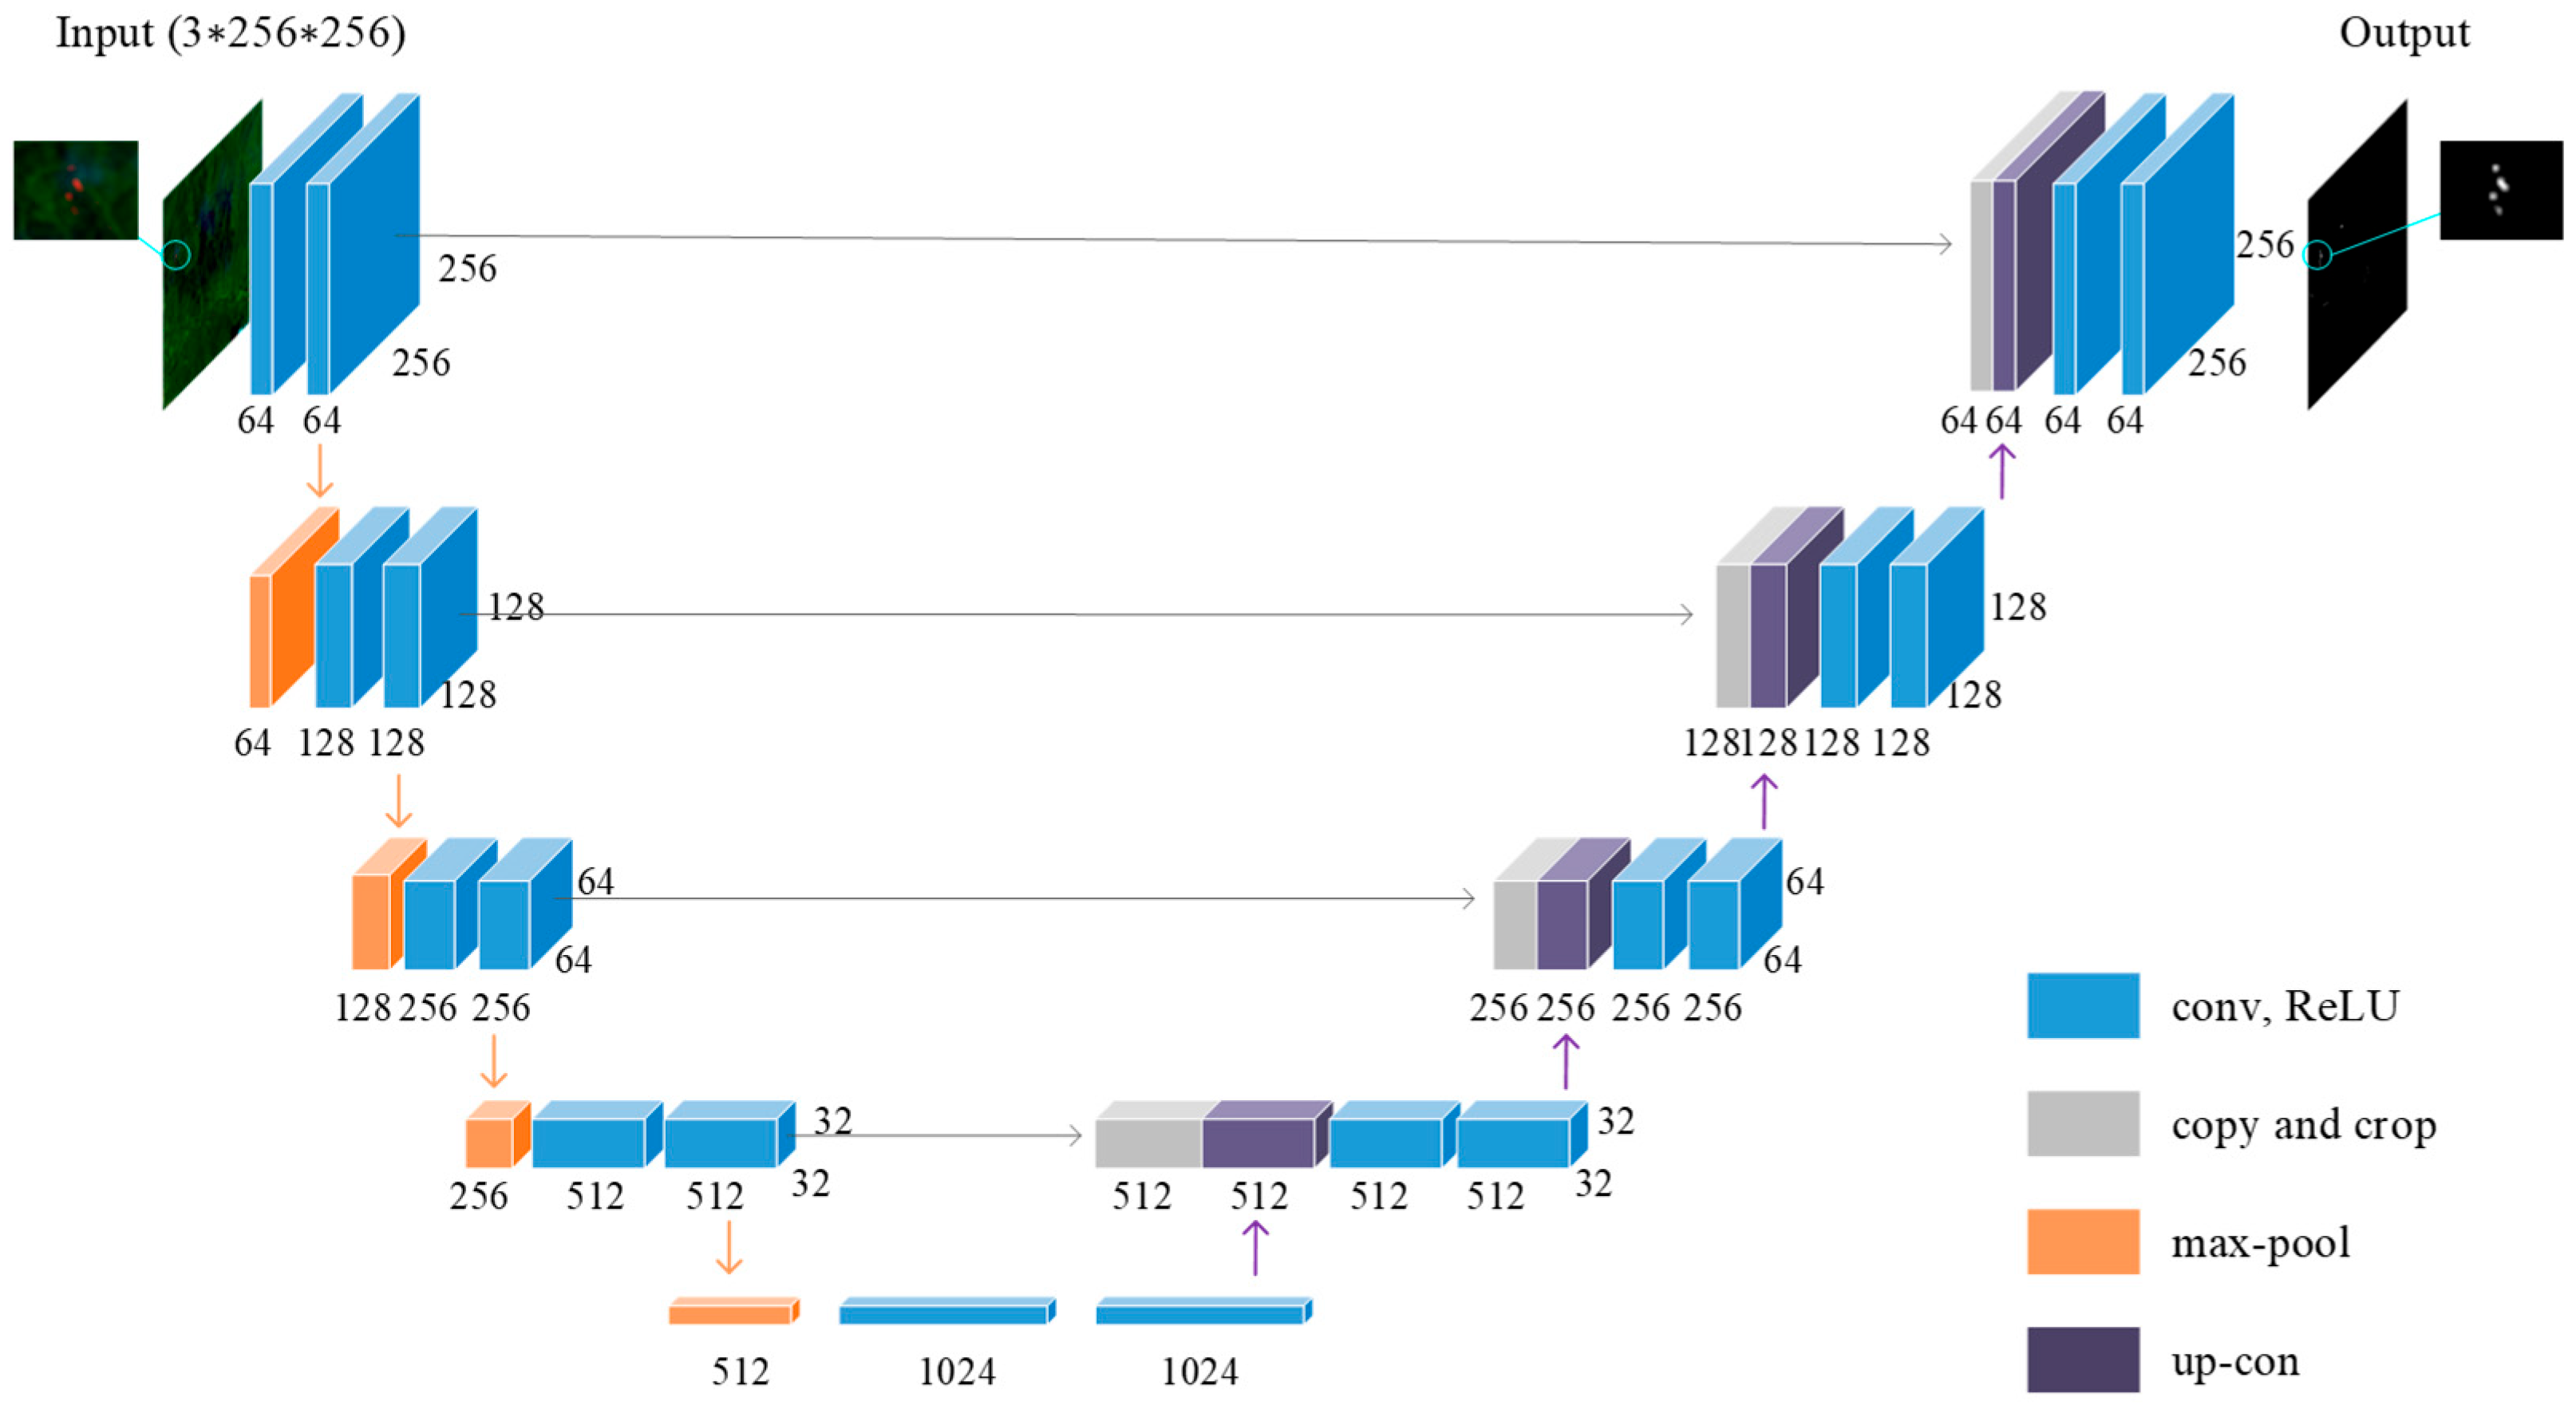
Landsat 8/9 data, offering relatively high spatial resolution, were employed in this study for forest fire monitoring using the U-Net deep learning algorithm, as shown in Figure 5. To train the U-Net model, we adopted a publicly available dataset created by Pereira et al. [28], which integrates three well-established fire detection algorithms and includes data from various regions such as the Amazon, Africa, Australia, the United States, and Asia [29,30,31]. Taking multiple factors into consideration, we selected data from the Asian region as training samples. To ensure high precision in fire identification, a strict intersection strategy was employed to generate the fire mask: only pixels simultaneously detected as fire by all three algorithms were labeled as fire pixels. During model training, data augmentation techniques such as horizontal and vertical flipping were applied to improve model generalization.
The deep learning model for Sentinel-2 data was developed through transfer learning based on a model initially trained on Landsat 8 imagery [32]. The dataset used for transfer learning was provided by Fusioka et al. [33], which also incorporates fire detection results from three well-established algorithms [29,34,35]. Unlike the original labeling strategy, in this study, a voting approach was applied to generate fire masks: a pixel is labeled with a fire label if it is identified as a fire pixel by at least two of the three algorithms. The transfer learning strategy used in this study involves freezing the weights of the encoder, retaining the pre-trained weights from Landsat 8, and re-learning new weights in the decoder.
  • Improved Automatic Threshold Algorithm
The surface temperature of forest fires is generally between 200 °C and 300 °C, with the core temperature reaching over 700 °C, corresponding to an optimal monitoring wavelength range of 2.7 μm to 5.1 μm [36]. However, most satellites are not equipped with sensors in the mid-infrared band but instead utilize SWIR sensors, which are still sensitive to high-temperature anomalies on the ground. During forest fire combustion, the reflectance in shortwave infrared band 1 (SWIR1) and shortwave infrared band 2 (SWIR2) is usually high and typically greater than that in the NIR bands. Therefore, we constructed the Normalized Burn Ratio Shortwave (NBRS) index to enhance the differences between these bands and employed a statistical triangular threshold method to automatically determine the threshold for fire pixels. Moreover, the ratio relationship between the two SWIR bands helps to filter out interference factors, such as specular reflections (glint) caused by urban building surfaces which are highly reflective at certain solar angles. As shown in Equation (4)
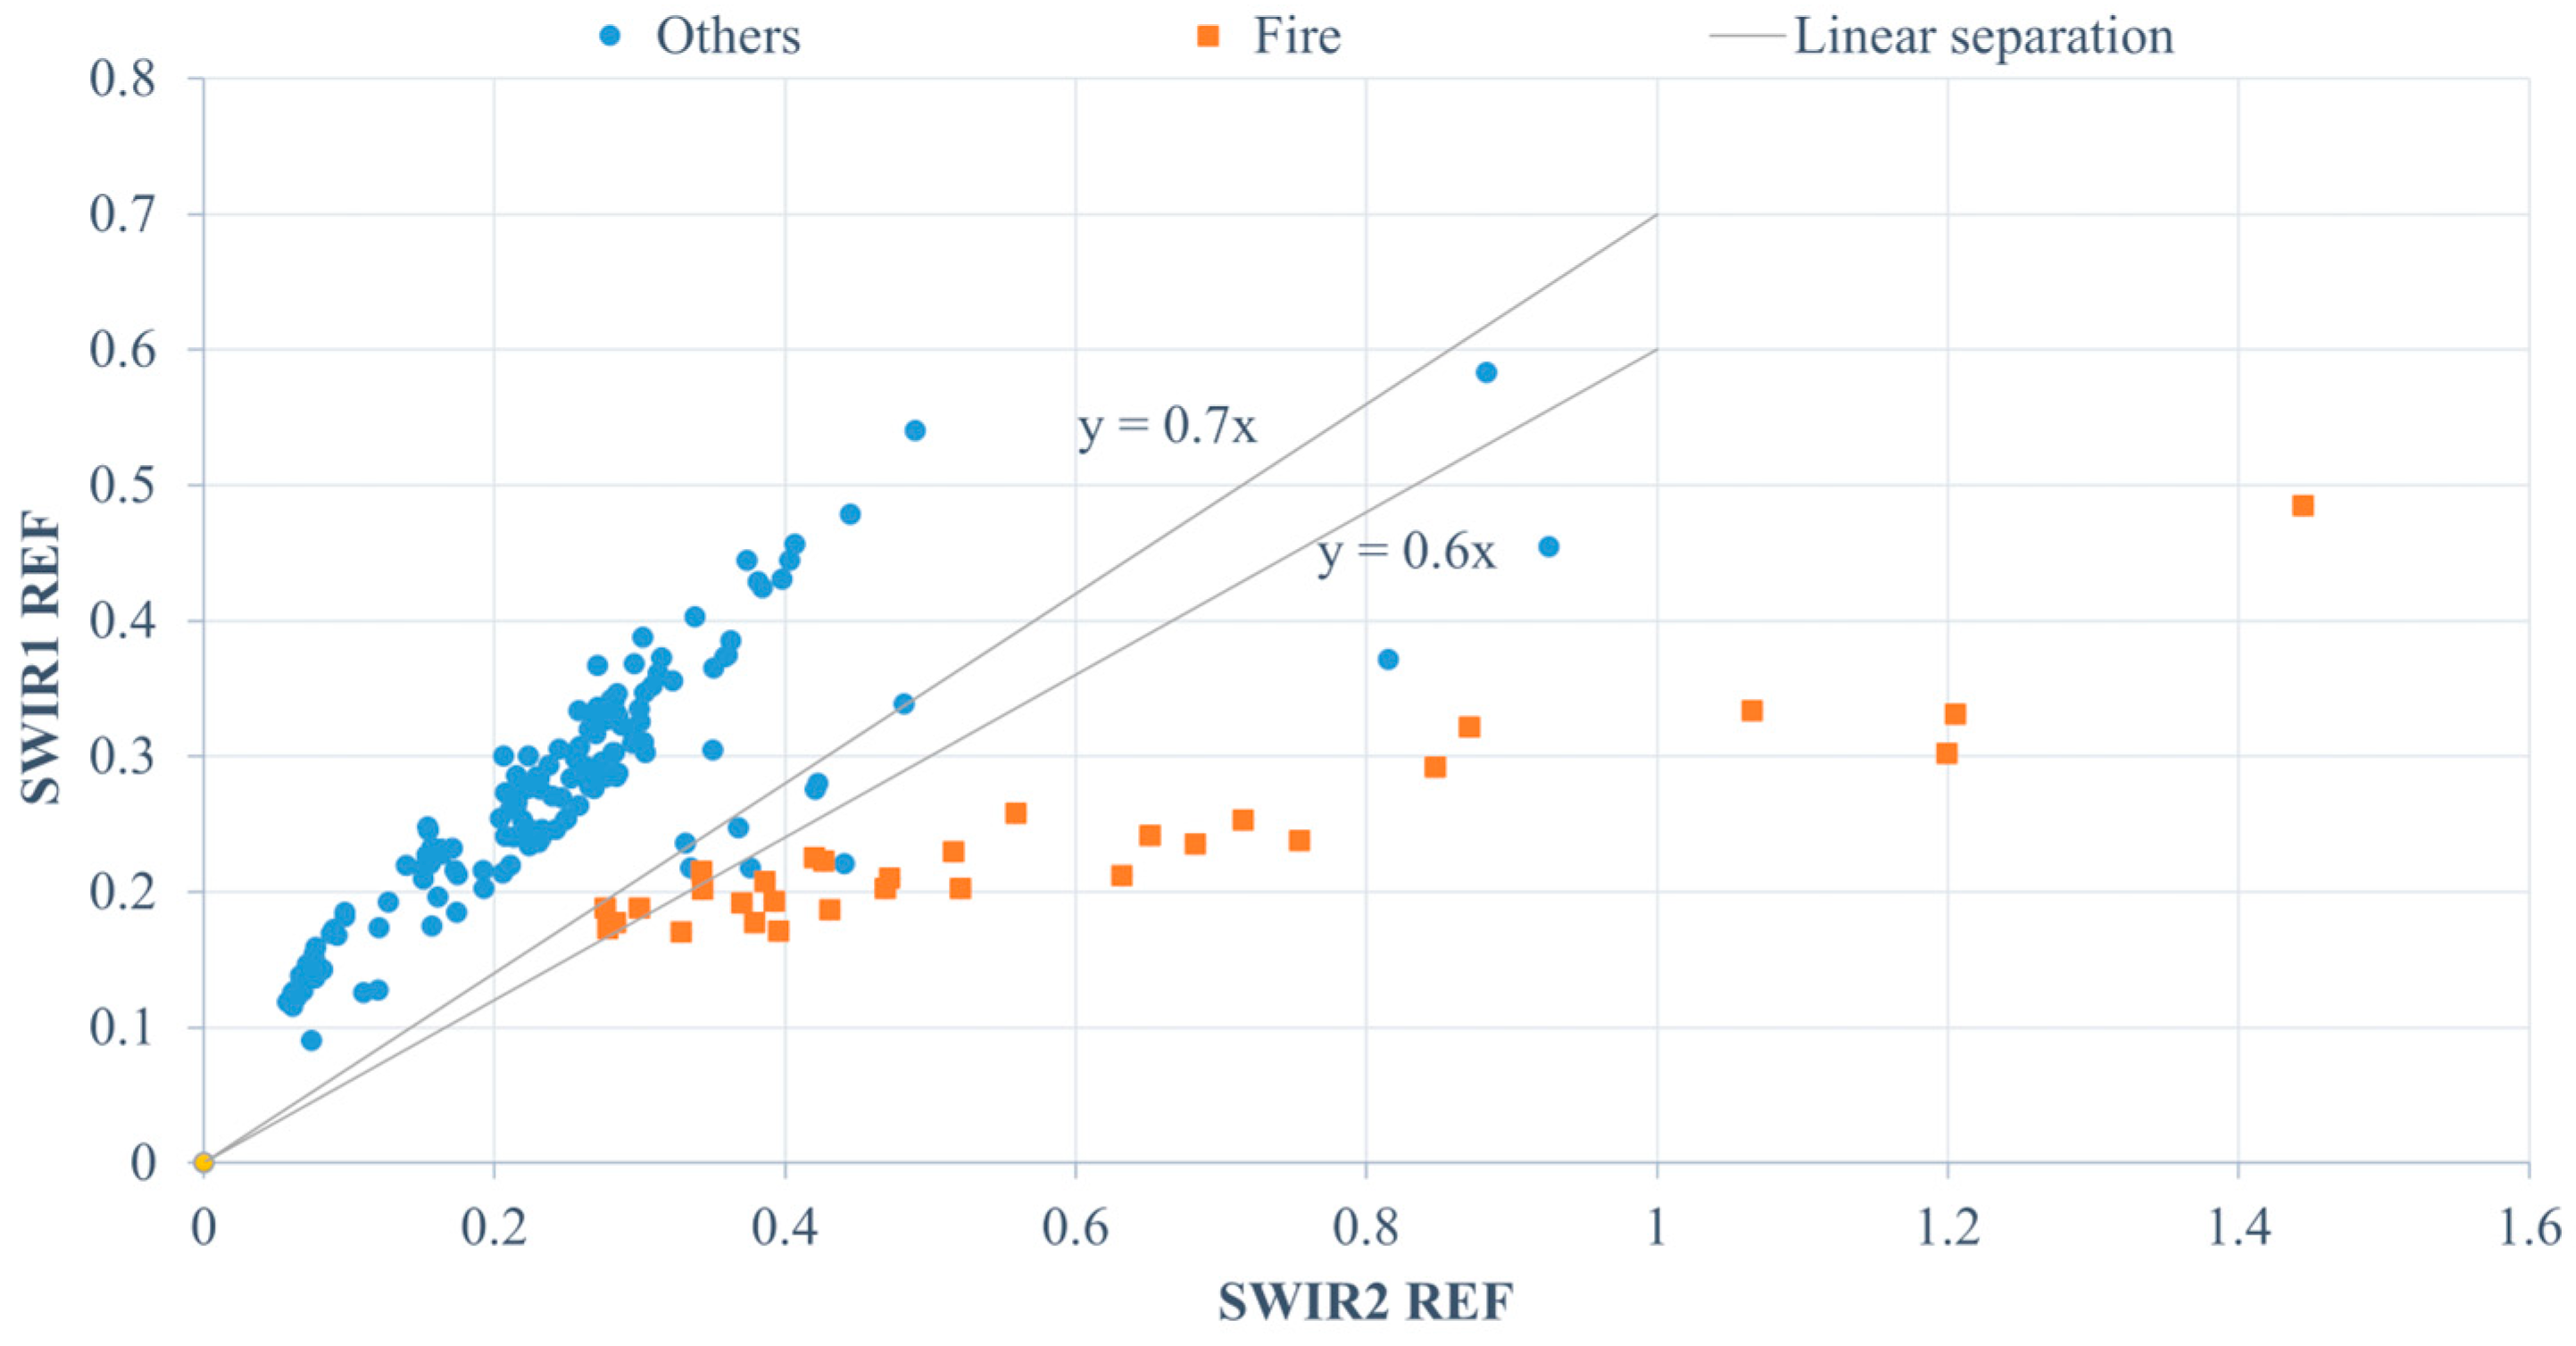
N B R S = N I R S W I R 1 S W I R 2 N I R + S W I R 1 S W I R 2 > T H a u t o S W I R 1 < β S W I R 2
where SWIR1 and SWIR2 refer to shortwave infrared bands 1 and 2, respectively. THauto represents a threshold automatically generated using a statistical approach. The coefficient β is introduced primarily to suppress the influence of urban glare and is typically set between 0.6 and 0.7 (as shown in Figure 6).

4.4. An Integrated Framework of Data, Algorithms, and Visualization for Fire Detection

A cross-application browser/server (B/S) framework is proposed in this study for all-weather and automated forest fire monitoring using multi-source remote sensing data, as shown in Figure 7. The framework consists of three layers: visualization user interface layer, data layer, and algorithm service layer. These layers communicate through standard HTTP protocols. The data download and algorithm components are developed using IDL 9.0 and Python 3.8, while the user interface is implemented using the Vue3.js framework.
The visualization interface is designed as a cross-platform, responsive web application to support real-time forest fire monitoring with an intuitive and user-friendly experience. Key features include UI prototyping, modular components, responsive DOM interaction, dynamic data binding, full-resolution image rendering, and interactive map visualization.
The data layer focuses on data storage and management. A relational PostgreSQL 13 database is used to store metadata, imagery paths, fire pixel information, and spatial geometry of vector data. This supports spatial indexing and retrieval. SQLAlchemy 1.4.25 is adopted to enable database access, including CRUD (Create/Read/Update/Delete) operations, sorting, and Object–Relational Mapping (ORM)-based data manipulation. When a task detects fire pixels, it records the relevant information (such as fire location and temperature) in the database. This data serves as the source for alert messages on the web interface and supports calling Alibaba Cloud’s SMS SDK V2.0 service to send fire event notifications to the relevant personnel.
The algorithm service layer handles both algorithm execution and task scheduling. Unlike data-driven automatic processing, this layer integrates Celery 5.1.2 for distributed task management and RabbitMQ 3.8.24 for asynchronous message queuing, as shown in Figure 8. This architecture enables non-blocking execution, decoupling task scheduling from business execution, meaning tasks can be processed in the background while users continue their work, and the results can be accessed later via the task IDs. The framework supports task retries on failure, concurrent execution, and task status monitoring, thus improving data throughput and the robustness of the processing flow. When the fire pixel monitoring algorithm is triggered by data-driven events, the fire pixel monitoring task is placed in a RabbitMQ middleware queue for processing by Celery. Multiple Celery workers continuously monitor the queue and operate independently of the scheduler.

4.5. Validation Method

The fire results identified by different monitoring algorithms vary. The monitoring results are quantitatively evaluated using commonly adopted performance indicators, namely the precision (P), recall (R), F-score (F), and Intersection over Union (IoU), as shown in Equation (5). At the pixel level, the algorithms’ detection results were compared with the validation data to calculate the 95% confidence interval (CI) of the F-score. In addition, to assess whether the differences in classification results between the two algorithms were statistically significant, the McNemar test was applied for paired comparison, and the significance level (McNemar-p) was reported. A McNemar-p of less than 0.05 was considered to indicate a significant difference.
P = t p t p + f p R = t p t p + f n F-score = 2 1 / P + 1 / R I o U = t p t p + f n + f p
where tp is the count of correctly identified fire pixels (true positives), fp is the count of non-fire pixels incorrectly labeled as fire (false positives), and fn is the count of fire pixels that were not detected (false negatives).

5. Results

5.1. Performance of Different Algorithms

5.1.1. Performance of Different Algorithms for GF-4

We applied different algorithms for fire pixel detection on GF-4 imagery and conducted accuracy evaluation and analysis using visually interpreted data as a reference. The performance of each algorithm in the Anning City area is shown in Figure 9, and that in the Jinning District area is shown in Figure 10.
As shown in Figure 9 and Figure 10, it can be observed that traditional fixed threshold methods for fire pixel detection have considerable limitations. In the case of small-scale fires, the actual brightness temperature values in the imagery often fail to reach the predefined thresholds, resulting in a large number of undetected fire pixels. The McNemar significance test also confirmed this phenomenon, indicating that in Anning City, the two algorithms exhibited a significant difference in pixel-level forest fire results (McNemar-p: 0.0078 < 0.05) in Table 1. This issue is alleviated to some extent in large-scale fires. In contrast, the improved automatic threshold method demonstrates significantly improved accuracy. In Table 2, the algorithm shows a relatively narrow confidence interval and small variation in the F-score, indicating that it performs in a stable and reliable manner for forest fire monitoring. Regardless of the scale of the forest fire, most fire pixels are accurately identified. However, some misclassified pixels appear along the fire boundaries, mainly due to the limited spatial resolution. At the fire’s edge, pixels may contain a mixture of fire and non-fire elements, leading to elevated brightness temperature values. In pseudo-color composite images, this manifests as light-red tones. However, after cross-verifying with actual pixel values and true-color imagery, it can be confirmed that these light-red areas are in fact non-fire pixels. Although such misclassifications may affect the evaluation of precision, this issue is not further discussed in this paper.
As presented in Table 1, the monitoring performance of different algorithms was compared by introducing various validation metrics. In terms of the comprehensive evaluation metrics, the F-score and IoU, the improved automatic threshold method demonstrates superior overall monitoring accuracy compared to the fixed threshold method, with maximum values of 0.915 (95% CI: 0.8725–0.9524) and 0.844, respectively. False negatives, representing the number of missed fire pixels, play a particularly crucial role in the context of small-scale fires. This often results in a significantly lower recall rate, subsequently affecting both the F-score and IoU metrics. Consequently, the fixed threshold method shows relatively poor performance in the Anning City area, providing limited reference value. In contrast, while there are still numerous misidentified pixels in the Jinning forest fire case, the overall evaluation is more favorable, with a recall rate of 0.821 and F-score and IoU values of 0.897 (95% CI: 0.8478–0.9384) and 0.813, respectively. In summary, the improved automatic thresholding method exhibits robust performance across different environmental conditions.
Although the above research demonstrates that the monitoring performance is inferior for small-scale fires compared to large-scale fires, the focus of this paper is to utilize the GF-4 imagery of high temporal resolution to dynamically track fire events through time-series images. While only a few fire pixels, typically a dozen or so, are identified in small-scale fires, there is still significant research and application value. The detailed application process is described in Section 5.2.

5.1.2. Performance of Different Algorithms for Landsat 8/Sentinel-2

This study utilizes high-spatial-resolution remote sensing data from Landsat 8 and Sentinel-2 to conduct monitoring of forest fires in the study area using the U-Net deep learning algorithm and an improved automatic threshold algorithm. The performance of each algorithm for forest fire detection in the Anning City area is shown in Figure 11. Landsat 8 data were used in this region, and the intersection of three algorithms (Schroeder et al., Murphy et al., and Kumar and Roy) was used as the validation dataset, which also served as the basis for generating masks in our deep learning dataset [29,30,31]. The performance of each algorithm in the Jinning area is shown in Figure 12. Sentinel-2 data were used in this region, and the deep learning model was transferred from the Landsat 8 model using a freeze–unfreeze strategy. The validation dataset was constructed based on a voting result from Kato and Nakamura, Murphy et al., and Liu et al. [29,34,35].
From the monitoring results of the two study areas, it is evident that all detection methods demonstrate a high degree of consistency in capturing the overall contours, locations, and quantities of fire lines. In the Anning City area, five distinct fire lines were identified at 11:34:31 on 16 April 2023, while in the Jinning forest fire on 13 April 2024, at 11:45:41, an inverted-“V”-shaped fire line was detected. The differences between the two monitoring algorithms are mainly concentrated in the central regions of fire pixels and certain parts of the fire line boundaries.
In areas with longer fire lines, the U-Net transfer model produces more continuous detection results with fewer gaps in the middle, though the corresponding outer contours tend to be more contracted. This phenomenon can be attributed to the transfer learning process: although the two data sources are similar, differences exist in the handling details. The spectral bands differ in spatial resolution; therefore, multiple batch normalization operations are required when processing Sentinel-2 data. In contrast, the improved automatic threshold method tends to generate more outward-spreading contours but exhibits partial gaps within the fire line interiors. This is due to pixel value saturation caused by excessively high fire temperatures in the SWIR2 band, resulting in pixel value folding effects. For shorter fire lines, the U-Net transfer model may overlook fire pixels with relatively darker tones, whereas the improved automatic threshold method performs better in detecting such fire pixels. As shown in Figure 12a (U-Net transfer model results) and Figure 12c (Sentinel-2 voting mask), the U-Net transfer model clearly resembles the model trained on Landsat 8 imagery, retaining the large-patch characteristics observed in Landsat 8 data and effectively filtering out small gaps.
As shown in Table 2, each method exhibits its own advantages in terms of precision and recall. The F-score, widely used in image segmentation, integrates precision and recall to provide a more comprehensive assessment of model performance. When analyzed longitudinally without considering environmental factors, the U-Net algorithm performs better, achieving a maximum F-score of 0.921 (95% CI: 0.8537–0.9739). It is worth noting that all monitoring methods identified a substantial number of fire pixels within the study areas. However, in the Jinning region, the U-Net transfer learning model generated a large number of false negatives, approximately 440 pixels—about 2.5 times that of the improved automatic threshold method—resulting in a relatively low recall rate. Consequently, its overall evaluation metric IoU is comparatively lower. The F1-score of the automatic threshold algorithm (0.903, 95% CI: 0.8932–0.9122) is markedly higher than that of the U-Net transfer model (0.836, 95% CI: 0.8228–0.8482), with no overlap between their confidence intervals. The McNemar-p value is 1.3061 × 10⁻¹⁴, indicating a significant difference (value < 0.05). This demonstrates that the automatic threshold method achieves significantly better overall performance in fire pixel detection than the U-Net transfer model in this region. In Anning City, the fire edges and surrounding areas are relatively homogeneous, and the fire perimeter is far from urban areas, resulting in low data variability. Consequently, both algorithms achieve high F-scores, with no statistically significant difference. Overall, although the transfer learning algorithm performs slightly worse than the improved automatic threshold method in this specific region, it demonstrates certain advantages in terms of model generalization and retains substantial practical value.
In conclusion, both the improved automatic threshold algorithm and the U-Net deep learning algorithm demonstrate robust performance, indicating strong adaptability and generalization capability across different geographic regions. Fundamentally, both approaches leverage the spectral characteristics of the SWIR1, SWIR2, and NIR bands to effectively distinguish fire pixels from other land cover types. By emphasizing inter-class spectral differences and suppressing irrelevant background information, the results further suggest that as long as similar spectral wavelengths are available, this methodology can be extended to multiple data sources to achieve reliable fire monitoring.

5.2. All-Weather Monitoring and Cross-Utilization of Data

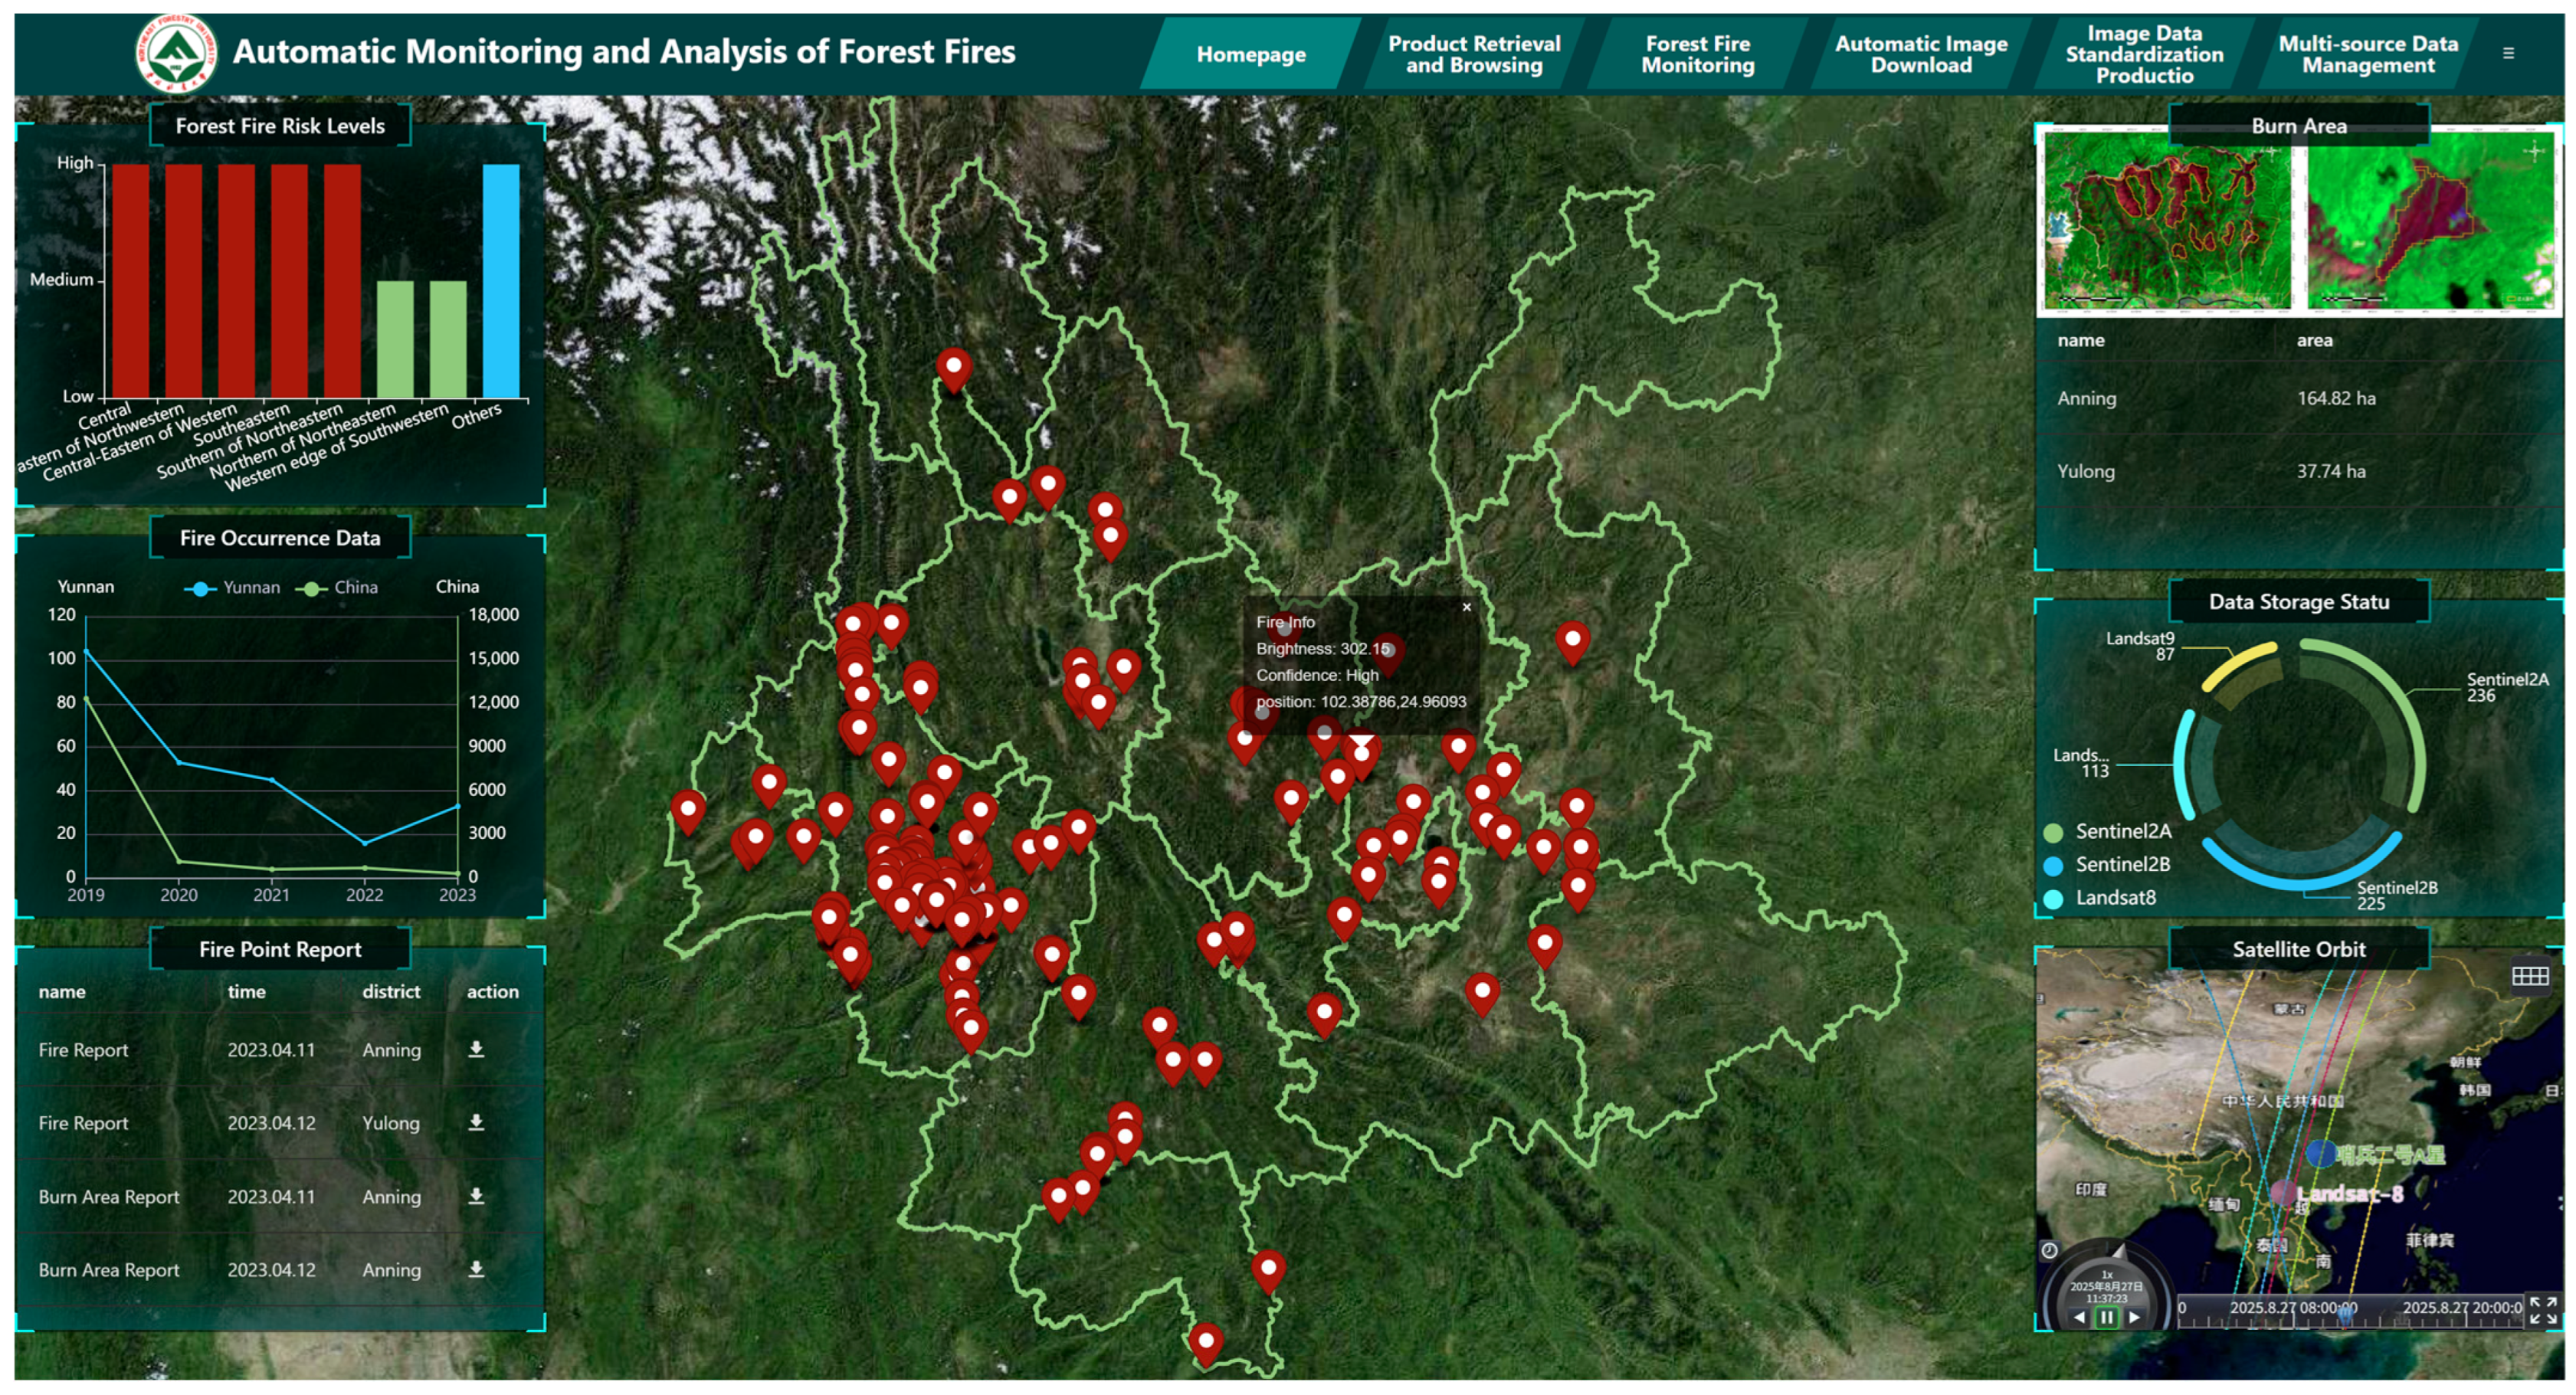
This study takes Yunnan Province as an example and employs a data-driven scheduling technology approach to autonomously explore, process, and analyze remote sensing data from the region. By cross-applying data of different scales, an all-weather automated forest fire monitoring and early warning framework is realized. The monitoring results are presented through an intuitive and user-friendly interface, which also supports statistical analysis of fire incidents, as shown in Figure 13. After the framework was put into practical operational use, statistics show that querying and downloading Sentinel-2 data takes an average of 3–8 min, Landsat 8 takes 5–15 min, and GF-4 about 5 min. The average time for data preprocessing, monitoring, storage, and analysis per scene data is 10–15 min.
In this framework, the high temporal resolution of GF-4 IRS data is utilized to achieve early fire detection and real-time dynamic monitoring of fire spread. PMS data can be incorporated to assist in estimating the extent of the burned area. Furthermore, Landsat 8 data, with their high spatial resolution, are used to accurately locate and analyze fire pixels at specific time points, thereby supporting emergency response and firefighting decision-making. In addition, post-fire Landsat 8/Sentinel-2 imagery also enables extraction and assessment of burned areas for post-disaster analysis and recovery planning.
As shown in Figure 14, the GF-4 satellite first detected a fire event on 13 April 2023, triggering an early warning in Anning City. At this point, the task priority scheduling mechanism was activated to enable prioritized retrieval and processing of imagery from the affected fire area. The high temporal resolution of GF-4 allowed for dynamic monitoring of the fire’s development, providing continuous updates on its progression.
On 14 April, the fire expanded gradually during the day and weakened at night. By 15 April, the fire further subsided, with five separate fire lines progressively shrinking. On 16 April, some fire lines were extinguished, while others intensified. Due to the spatial resolution limitations of GF-4, it was difficult to distinguish closely spaced fire lines in regions with intense and overlapping burning. At 11:00 on the same day, high-spatial-resolution Landsat 8 imagery became available and was automatically processed for fire detection. The results showed that five fire lines were still active, with the one in the upper-left area continuing to expand. On 17 April, the fire briefly intensified again. In the early morning of 18 April, a few residual fire lines were still observed, but the fire was subsequently brought under control and fully extinguished.
As shown in Figure 15, GF-4 satellite data detected a forest fire in Jinning District on 12 April 2023, initiating continuous dynamic monitoring. On 13 April, the fire area expanded and gradually spread outward. At 12:00 noon that day, high-spatial-resolution Sentinel-2 imagery became available, triggering an automated detection task. The fire line contours were clearly visible, enabling precise localization and facilitating rescue operations. On 14 April, the fire showed signs of abating in the early morning, but strong winds in the afternoon caused explosive spread of the fire, intensifying the blaze in the northwest and driving its expansion toward the southeast. By nightfall, the fire was effectively controlled. On the morning of 15 April, only sporadic fire points remained. At 13:00, the fire rekindled but was quickly extinguished by the firefighting crews. By evening, all visible flames had been completely suppressed.
Table 3 describes the structure used to store fire information in our database. It includes key attributes such as the time of occurrence, location, and administrative division, which facilitate subsequent statistical analysis and efficient querying.

6. Discussion

6.1. Perspective on Algorithms and Datasets

In the above sections, we discussed the monitoring performance of both the U-Net deep learning algorithm and the improved automatic threshold algorithm. It can be observed that, in applications involving high-spatial-resolution imagery, the U-Net model trained on a high-volume Landsat 8 dataset achieves excellent accuracy. However, in another study area, the U-Net transfer model trained on Sentinel-2 data performs worse than the improved automatic threshold algorithm. Although Landsat 8 and Sentinel-2 data have similar band compositions, there are still differences in their central wavelengths and bandwidths, and the two datasets also differ in spatial resolution. The 10 m resolution Sentinel-2 imagery is more sensitive to fire boundaries. Both factors can lead to reduced accuracy of the transfer learning model in the Anning area. To lessen the impact of band differences, a combination of original bands and spectral indices can be used as input channels. For low-spatial-resolution imagery such as GF-4, the traditional fixed threshold is often limited in applicability and cannot automatically generate thresholds. This study introduces a statistical approach to improve threshold generation, demonstrating favorable results in both forest fire cases.
Zhang et al. utilized Himawari-8 data to conduct weighted contextual fire detection (AHI_WFDA) [12]. The principle is similar to the monitoring approach employed in this study using GF-4 data, as both belong to high-temporal-resolution imagery. However, the GF-4 imagery employed here offers higher spatial resolution, providing better sensitivity to small fires and early-stage fire events. The AHI_WFDA algorithm is a type of fixed threshold method, and due to the influence of changes in the satellite zenith angle, small fires at the image edges may be omitted. Nevertheless, it achieves a low false alarm rate of only 12.3%, with omission rates of around 63%, and accuracy fluctuates significantly over time. In contrast, the proposed automatic threshold algorithm in this study missed no more than five fire pixels in all tested cases, showing superior performance. Fatemeh Parto et al. noted that most false fire pixels in the MODIS imagery exhibit nearly identical temperatures and applied masking to these pixels [11]. This allowed the detection of smaller fires at lower thresholds, thereby minimizing false alarms, achieving a minimum false alarm rate of 4.5% and an accuracy of 95.5%. In comparison, the lowest false alarm rate in this study was approximately 13.2% (fn/(tp + fn) = 14/(14 + 92)), while maintaining accuracy consistently above 96%, thus showing an advantage in terms of stability and precision. Wided Souidene Mseddi et al. proposed a novel architecture combining YOLOv5 and U-Net, where YOLOv5 is first used to locate fire regions, followed by U-Net for pixel-level fire segmentation [37]. YOLOv5 achieved a recall rate of 0.869, and U-Net reached a Dice coefficient of 92%, which is comparable to the F-score metric used in this study, where the highest value was 92.1%. In addition, the difference stems from the fact that the data source used in this study is remote sensing satellite imagery, which is inherently sensitive to fire temperatures and whose spectral bands possess distinctive characteristics. Compared with the RGB images used by Wided Souidene Mseddi et al., this offers a significant advantage. In addition, their study also addressed the confusion caused by objects resembling flames, such as sunrise and sunset. However, due to differences in satellite imaging angles, this study likewise does not produce false detections in such cases. L. Barco et al. used multi-temporal remote sensing data (MODIS, VIIRS, and Sentinel-3) and a self-supervised learning (SSL) model to achieve near-real-time fire detection. This model does not require labeled data, instead learning features directly from the data itself. The F-score on the test set averaged 63.58 ± 0.71. Although this overall metric is lower compared to the present study, the model eliminates the need for manual labeling, providing a new direction for future forest fire monitoring algorithms [38].
It is worth noting that this study only presents monitoring methods that yielded favorable results. We also attempted to directly apply a model trained on Landsat 8 imagery to Sentinel-2 data. Although the model was able to detect scattered fire line edges in large-scale fire events, significant discrepancies remained compared to the reference data. Furthermore, we tested different regions from the dataset provided by Pereira et al. [28] and found that a larger-volume dataset does not necessarily guarantee higher accuracy. The occurrence of forest fires is regionally specific. The United States and Australia, as global hotspots for forest fires, have forest fire environments that are not entirely applicable to China, where forest fires tend to be smaller in scale but occur more frequently. As a result, these datasets are not entirely suitable for application to forest fire scenarios in China. In addition, we observed that certain preprocessing steps in the handling of Landsat 8 and Sentinel-2 data—such as radiometric calibration and atmospheric correction—may actually reduce the spectral distinction between fire pixels and other land cover types. In some cases, this can lead to substantial omission errors during fire detection, particularly under complex fire conditions.
With the rapid advancement of deep learning technologies, their application in forest fire detection based on remote sensing imagery remains in its early stages. Current research in adjacent domains offers valuable insights: for instance, some studies have constructed datasets using UAV imagery and employed YOLO models for forest fire object detection [39,40], while others have focused on smoke recognition using surveillance camera images [41]. These studies provide important references for developing remote sensing fire detection algorithms. However, the construction of datasets from high-spatial-resolution satellite imagery remains challenging [42]. In the future, more attention may be directed toward polar-orbiting satellites such as MODIS, VIIRS, Himawari, and the FY series, whose time-series data provide a substantial amount of information for model training [43]. Nevertheless, we hypothesize that this may also negatively affect model generalization [44].

6.2. Perspective on Data-Driven Technology and Management

The proposed data-driven scheduling technology is primarily constrained by the production latency of remote sensing imagery. The production time varies across different data sources, and delayed image availability is a critical factor limiting the timeliness of fire monitoring. Fortunately, the integration of multiple data sources can help compensate for this drawback. Additionally, the proposed technical framework relies on extensive hardware infrastructure, which may result in significant costs, especially for large-scale implementation. Therefore, strategies for regular data archiving and storage optimization will be essential in future work. The following strategies can be developed: (1) regularly clean up historical data; (2) retain only fire product results and delete large files (raw imagery) after processing; and (3) use a Linux system to enable multi-machine disk space mounting, facilitating storage expansion. Furthermore, secure data transmission protocols are planned to be introduced to prevent unauthorized access and ensure data integrity.
D. Peterson et al. found that MODIS can detect fire areas of approximately 0.001 km2 or larger at a 1 km2 pixel scale (corresponding to about 0.1% of the pixel area covered by fire) [45]. In contrast, the GF-4 satellite offers higher spatial resolution, particularly with its visible bands at about 50 m and mid-infrared bands at 400 m resolution. In theory, this allows for detection of much smaller fire spots, making it possible to achieve early monitoring of fires on the scale of tens to hundreds of square meters. Although the monitoring accuracy is limited by the spatial resolution of the imagery, on the other hand, this also represents an advantage, as the coarser spatial resolution allows for a larger coverage area and higher monitoring frequency. Therefore, this study employs the cross-application of Sentinel-2/Landsat 8 imagery and GF-4 imagery to compensate for the limitations caused by low spatial resolution as much as possible.

6.3. Perspective on an Integrated Framework of Data, Algorithms, and Visualization for Fire Detection

This paper proposes an integrated framework of data, algorithms, and visualization for fire detection. Using forest fire cases in the Anning and Jinning Districts of Yunnan Province as examples, we demonstrate the technical workflow and implementation of an all-weather, fully automated forest fire monitoring and early warning framework. The framework leverages the cross-applicability of multi-source data and illustrates how a fully automated workflow—from data acquisition, downloading, and processing to visualization and early warning—can be effectively realized. The proposed framework enables layered visualization, spatial querying, statistical analysis, and dynamic updating of forest fire detection results. Users can intuitively explore the spatial distribution, temporal trends, and administrative division statistics of fire points on the map after each processing iteration. In addition, the framework supports a timeline-based comparison of historical data, facilitating post-disaster analysis and decision-making for forestry departments. This framework improves the interpretability and usability of monitoring outputs, lowers the operational threshold for non-expert users, and provides technical support for rapid emergency response. Future developments may incorporate mobile device compatibility, intelligent service mechanisms, and cross-departmental data integration to further enhance responsiveness and coordination in practical applications.
The proposed framework has significant practical implications. In the realm of public policy, it provides large-scale, cost-effective, and high-efficiency forest fire information to support the development of targeted fire prevention strategies. For real-time monitoring, the framework can be integrated into operational fire surveillance networks to improve the timeliness and accuracy of fire detection. It is compatible with near-real-time satellite data streams, allowing continuous updates, reducing detection latency, and enhancing the reliability of early warning information. In emergency decision-making, the framework can provide near-real-time fire maps to support rapid assessment of fire spread, prioritization of firefighting efforts, and coordination of evacuation plans for vulnerable communities. By bridging the gap between large-scale remote sensing capabilities and operational fire management needs, the proposed monitoring framework has the potential to enhance preparedness and responsiveness in forest fire management. This makes it not only a research-oriented solution but also a practical, scalable framework ready for operational deployment in forest fire prevention and management.
The proposed framework was developed and deployed on a Windows 10 system equipped with an NVIDIA GPU, AMD Ryzen AI 9 HX 370w, 1TB hard drive, and 32GB RAM. While a robust hardware infrastructure positively affects the response time of fire monitoring, it is not a decisive factor for framework operation. Tests have shown that the framework runs smoothly on Linux, Kirin OS, and cloud servers. It requires only a single deployment and supports simultaneous online operation and data sharing across multiple devices within a local area network, without the need for additional client installations. Additionally, there may be some unknown bottlenecks; for example, facing tens of thousands of concurrent requests or malicious DNS attacks could exhaust computer resources, causing increased latency or service interruptions.

7. Conclusions

This study evaluated the performance of four forest fire monitoring algorithms: the U-Net deep learning algorithm, the U-Net transfer learning algorithm, an improved automatic threshold method, and a fixed threshold method. The results show that for high-temporal-resolution GF-4 imagery, the improved automatic threshold method performs best, achieving an F-score of up to 0.915. For high-spatial-resolution Landsat 8 and Sentinel-2 imagery, the U-Net deep learning algorithm yields the best overall performance, with an F-score reaching 0.921, followed by the improved automatic threshold method (up to 0.911) and finally the U-Net transfer algorithm. Notably, the optimal algorithm varies depending on the fire scale; however, all methods consistently achieve F-scores above 0.83, demonstrating strong monitoring performance. These findings confirm the broad applicability of the improved automatic threshold algorithm and the U-Net deep learning algorithm under diverse environmental conditions.
This study also introduces several innovative and robust technologies:
(1)
Data-driven scheduling technology: The proposed technology addresses the complexity of multi-source data processing by enabling fully automated workflows—from data acquisition to fire detection and early warning—within an hour. It also supports data priority scheduling to enhance emergency responsiveness.
(2)
Integrated data–algorithm–visualization framework: Validated through real fire events in the Anning and Jinning Districts of Yunnan Province, this framework demonstrates strong performance in all-weather, real-time monitoring and rapid response. It enables dynamic fire tracking and fine-scale detection by utilizing the cross-applicability of heterogeneous data sources. Moreover, the framework incorporates asynchronous task scheduling and a robust data storage and management architecture, ensuring both efficiency and framework stability. It also features an intuitive and user-friendly visualization interface that meets user needs for disaster analysis and statistics.

Author Contributions

Conceptualization, B.G. and Q.W.; methodology, B.G. and Q.W.; software, B.G.; validation, B.G., W.J. and G.Y.; formal analysis, B.G.; investigation, G.Y.; resources, B.G. and W.J.; data curation, B.G.; writing—original draft preparation, B.G.; writing—review and editing, G.Y.; visualization, G.Y.; project administration, G.Y.; funding acquisition, G.Y. All authors have read and agreed to the published version of the manuscript.

Funding

This research was funded by the National Key Research and Development Program of China (2023YFC3006900) and the Fundamental Research Funds for the Central Universities (2572023CT01).

Institutional Review Board Statement

Not applicable.

Informed Consent Statement

Not applicable.

Data Availability Statement

The data presented in this study is available on request from the corresponding author.

Conflicts of Interest

The authors declare no conflicts of interest.

References

  1. Zhang, J.-H.; Yao, F.-M.; Liu, C.; Yang, L.-M.; Boken, V.K. Detection, Emission Estimation and Risk Prediction of Forest Fires in China Using Satellite Sensors and Simulation Models in the Past Three Decades—An Overview. Int. J. Environ. Res. Public Health 2011, 8, 3156–3178. [Google Scholar] [CrossRef]
  2. Wang, X.; Di, Z.; Li, M.; Yao, Y. Satellite-Derived Variation in Burned Area in China from 2001 to 2018 and Its Response to Climatic Factors. Remote Sens. 2021, 13, 1287. [Google Scholar] [CrossRef]
  3. Zong, X.Z.; Tian, X.R.; Yao, Q.C.; Brown, P.M. An analysis of fatalities from forest fires in China, 1951–2018. Int. J. Wildland Fire 2022, 31, 507–517. [Google Scholar] [CrossRef]
  4. Li, G.; Hai, J.; Qiu, J.; Zhang, D.; Ge, C.; Wang, H.; Wu, J. Revealing future changes in China’s forest fire under climate change. Agric. For. Meteorol. 2025, 371, 110609. [Google Scholar] [CrossRef]
  5. Chen, Y.; Morton, D.C.; Randerson, J.T. Remote sensing for wildfire monitoring: Insights into burned area, emissions, and fire dynamics. One Earth 2024, 7, 1022–1028. [Google Scholar] [CrossRef]
  6. Kong, S.; Deng, J.; Yang, L.; Liu, Y. An attention-based dual-encoding network for fire flame detection using optical remote sensing. Eng. Appl. Artif. Intell. 2024, 127, 107238. [Google Scholar] [CrossRef]
  7. Saleh, A.; Zulkifley, M.A.; Harun, H.H.; Gaudreault, F.; Davison, I.; Spraggon, M. Forest fire surveillance systems: A review of deep learning methods. Heliyon 2024, 10, e23127. [Google Scholar] [CrossRef]
  8. Payra, S.; Sharma, A.; Verma, S. Chapter 14—Application of remote sensing to study forest fires. In Atmospheric Remote Sensing; Kumar Singh, A., Tiwari, S., Eds.; Elsevier: Amsterdam, The Netherlands, 2023; pp. 239–260. [Google Scholar] [CrossRef]
  9. Bargali, H.; Pandey, A.; Bhatt, D.; Sundriyal, R.C.; Uniyal, V.P. Forest fire management, funding dynamics, and research in the burning frontier: A comprehensive review. Trees For. People 2024, 16, 100526. [Google Scholar] [CrossRef]
  10. Chowdhury, E.H.; Hassan, Q.K. Operational perspective of remote sensing-based forest fire danger forecasting systems. ISPRS J. Photogramm. Remote Sens. 2015, 104, 224–236. [Google Scholar] [CrossRef]
  11. Parto, F.; Saradjian, M.; Homayouni, S. MODIS Brightness Temperature Change-Based Forest Fire Monitoring. J. Indian Soc. Remote Sens. 2020, 48, 163–169. [Google Scholar] [CrossRef]
  12. Zhang, H.; Sun, L.; Zheng, C.; Ge, S.; Chen, J.; Li, J. A weighted contextual active fire detection algorithm based on Himawari-8 data. Int. J. Remote Sens. 2023, 44, 2400–2427. [Google Scholar] [CrossRef]
  13. Wang, H.; Zhang, Y.; Zhu, C. YOLO-LFD: A Lightweight and Fast Model for Forest Fire Detection. Comput. Mater. Contin. 2025, 82, 3399–3417. [Google Scholar] [CrossRef]
  14. Xu, H.; Chen, J.; He, G.; Lin, Z.; Bai, Y.; Ren, M.; Zhang, H.; Yin, H.; Liu, F. Immediate assessment of forest fire using a novel vegetation index and machine learning based on multi-platform, high temporal resolution remote sensing images. Int. J. Appl. Earth Obs. Geoinf. 2024, 134, 104210. [Google Scholar] [CrossRef]
  15. Zhang, P.; Ban, Y.; Nascetti, A. Learning U-Net without forgetting for near real-time wildfire monitoring by the fusion of SAR and optical time series. Remote Sens. Environ. 2021, 261, 112467. [Google Scholar] [CrossRef]
  16. Vittucci, C.; Cordari, F.; Guerriero, L.; Di Sanzo, P. Design and evaluation of a cloud-oriented procedure based on SAR and Multispectral data to detect burnt areas. Earth Sci. Inform. 2025, 18, 322. [Google Scholar] [CrossRef]
  17. Bonilla-Ormachea, K.; Cuizaga, H.; Salcedo, E.; Castro, S.; Fernandez-Testa, S.; Mamani, M. ForestProtector: An IoT Architecture Integrating Machine Vision and Deep Reinforcement Learning for Efficient Wildfire Monitoring. In Proceedings of the 2025 11th International Conference on Automation, Robotics, and Applications (ICARA), Zagreb, Croatia, 12–14 February 2025. [Google Scholar]
  18. Cui, Z.; Zhao, F.; Zhao, S.; Fei, T.; Ye, J. Research on information extraction of forest fire damage based on multispectral UAV and machine learning. J. Nat. Disasters 2024, 33, 99–108. [Google Scholar]
  19. Han, J.; Shen, Z.; Ying, L.; Li, G.; Chen, A. Early post-fire regeneration of a fire-prone subtropical mixed Yunnan pine forest in Southwest China: Effects of pre-fire vegetation, fire severity and topographic factors. For. Ecol. Manag. 2015, 356, 31–40. [Google Scholar] [CrossRef]
  20. Zhang, N.; Sun, L.; Sun, Z. GF-4 Satellite Fire Detection with an Improved Contextual Algorithm. IEEE J. Sel. Top. Appl. Earth Obs. Remote Sens. 2022, 15, 163–172. [Google Scholar] [CrossRef]
  21. Li, Q.; Cui, J.; Jiang, W.; Jiao, Q.; Gong, L.; Zhang, J.; Shen, X. Monitoring of the Fire in Muli County on March 28, 2020, based on high temporal-spatial resolution remote sensing techniques. Nat. Hazards Res. 2021, 1, 20–31. [Google Scholar] [CrossRef]
  22. Suárez-Fernández, G.E.; Martínez-Sánchez, J.; Arias, P. Assessment of vegetation indices for mapping burned areas using a deep learning method and a comprehensive forest fire dataset from Landsat collection. Adv. Space Res. 2025, 75, 1665–1685. [Google Scholar] [CrossRef]
  23. Kouachi, M.E.; Khairoun, A.; Moghli, A.; Rahmani, S.; Mouillot, F.; Baeza, M.J.; Moutahir, H. Forty-Year Fire History Reconstruction from Landsat Data in Mediterranean Ecosystems of Algeria following International Standards. Remote Sens. 2024, 16, 2500. [Google Scholar] [CrossRef]
  24. Xu, H. Change of Landsat 8 TIRS calibration parameters and its effect on land surface temperature retrieval. J. Remote Sens. 2016, 20, 229–235. [Google Scholar]
  25. Hu, C.; Zhang, X.; Xing, X.; Gao, Q. An approach to detect gas flaring sites using sentinel-2 MSI and NOAA-20 VIIRS images. Int. J. Appl. Earth Obs. Geoinf. 2023, 124, 103534. [Google Scholar] [CrossRef]
  26. Rodriguez-Jimenez, F.; Novo, A.; Hall, J.V. Influence of wildfires on the conflict (2006–2022) in eastern Ukraine using remote sensing techniques (MODIS and Sentinel-2 images). Remote Sens. Appl. Soc. Environ. 2024, 35, 101240. [Google Scholar] [CrossRef]
  27. Liu, X.; Sun, L.; Yang, Y.; Zhou, X.; Wang, Q.; Chen, T. Cloud and Cloud Shadow Detection Algorithm for Gaofen-4 Satellite Data. Acta Opt. Sin. 2019, 39, 446–457. [Google Scholar] [CrossRef]
  28. Pereira, G.H.D.; Fusioka, A.M.; Nassu, B.T.; Minetto, R. Active fire detection in Landsat-8 imagery: A large-scale dataset and a deep-learning study. Isprs J. Photogramm. Remote Sens. 2021, 178, 171–186. [Google Scholar] [CrossRef]
  29. Murphy, S.W.; de Souza, C.R.; Wright, R.; Sabatino, G.; Pabon, R.C. HOTMAP: Global hot target detection at moderate spatial resolution. Remote Sens. Environ. 2016, 177, 78–88. [Google Scholar] [CrossRef]
  30. Schroeder, W.; Oliva, P.; Giglio, L.; Quayle, B.; Lorenz, E.; Morelli, F. Active fire detection using Landsat-8/OLI data. Remote Sens. Environ. 2016, 185, 210–220. [Google Scholar] [CrossRef]
  31. Kumar, S.S.; Roy, D.P. Global operational land imager Landsat-8 reflectance-based active fire detection algorithm. Int. J. Digit. Earth 2018, 11, 154–178. [Google Scholar] [CrossRef]
  32. Yang, S.; Huang, Q.; Yu, M. Advancements in remote sensing for active fire detection: A review of datasets and methods. Sci. Total Environ. 2024, 943, 173273. [Google Scholar] [CrossRef]
  33. Fusioka, A.M.; Pereira, G.H.D.; Nassu, B.T.; Minetto, R. Active Fire Segmentation: A Transfer Learning Study From Landsat-8 to Sentinel-2. IEEE J. Sel. Top. Appl. Earth Obs. Remote Sens. 2024, 17, 14093–14108. [Google Scholar] [CrossRef]
  34. Liu, Y.; Zhi, W.; Xu, B.; Xu, W.; Wu, W. Detecting high-temperature anomalies from Sentinel-2 MSI images. Isprs J. Photogramm. Remote Sens. 2021, 177, 174–193. [Google Scholar] [CrossRef]
  35. Kato, S.; Nakamura, R. Detection of thermal anomaly using Sentinel-2A data. In Proceedings of the 37th Annual IEEE International Geoscience and Remote Sensing Symposium, IGARSS 2017, Fort Worth, TX, USA, 23–28 July 2017; pp. 831–833. [Google Scholar]
  36. Wooster, M.J.; Roberts, G.J.; Giglio, L.; Roy, D.P.; Freeborn, P.H.; Boschetti, L.; Justice, C.; Ichoku, C.; Schroeder, W.; Davies, D.; et al. Satellite remote sensing of active fires: History and current status, applications and future requirements. Remote Sens. Environ. 2021, 267, 112694. [Google Scholar] [CrossRef]
  37. Mseddi, W.S.; Ghali, R.; Jmal, M.; Attia, R. Fire Detection and Segmentation using YOLOv5 and U-NET. In Proceedings of the 2021 29th European Signal Processing Conference (EUSIPCO), Dublin, Ireland, 23–27 August 2021; pp. 741–745. [Google Scholar]
  38. Barco, L.; Urbanelli, A.; Rossi, C. Rapid Wildfire Hotspot Detection Using Self-Supervised Learning on Temporal Remote Sensing Data; IEEE: New York, NY, USA, 2024. [Google Scholar]
  39. Ramos, L.T.; Casas, E.; Romero, C.; Rivas-Echeverría, F.; Bendek, E. A study of YOLO architectures for wildfire and smoke detection in ground and aerial imagery. Results Eng. 2025, 26, 104869. [Google Scholar] [CrossRef]
  40. Feng, H.; Qiu, J.; Wen, L.; Zhang, J.; Yang, J.; Lyu, Z.; Liu, T.; Fang, K. U3UNet: An accurate and reliable segmentation model for forest fire monitoring based on UAV vision. Neural Netw. 2025, 185, 107207. [Google Scholar] [CrossRef] [PubMed]
  41. Hu, Y.; Zhan, J.; Zhou, G.; Chen, A.; Cai, W.; Guo, K.; Hu, Y.; Li, L. Fast forest fire smoke detection using MVMNet. Knowl. Based Syst. 2022, 241, 108219. [Google Scholar] [CrossRef]
  42. Safonova, A.; Ghazaryan, G.; Stiller, S.; Main-Knorn, M.; Nendel, C.; Ryo, M. Ten deep learning techniques to address small data problems with remote sensing. Int. J. Appl. Earth Obs. Geoinf. 2023, 125, 103569. [Google Scholar] [CrossRef]
  43. Zhang, H.K.; Camps-Valls, G.; Liang, S.; Tuia, D.; Pelletier, C.; Zhu, Z. Preface: Advancing deep learning for remote sensing time series data analysis. Remote Sens. Environ. 2025, 322, 114711. [Google Scholar] [CrossRef]
  44. Nie, Z.; Xu, Y.; Zhao, J.; Yuan, M. Fire classification and detection in imbalanced remote sensing images using a three-sphere model combined with YOLOv5. Appl. Soft Comput. 2025, 177, 113192. [Google Scholar] [CrossRef]
  45. Peterson, D.; Wang, J.; Ichoku, C.; Hyer, E. Sub-Pixel Fractional Area of Wildfires from MODIS Observations: Retrieval, Validation, and Potential Applications. AGU Fall Meet. 2010, 2010, A24B-02. [Google Scholar]
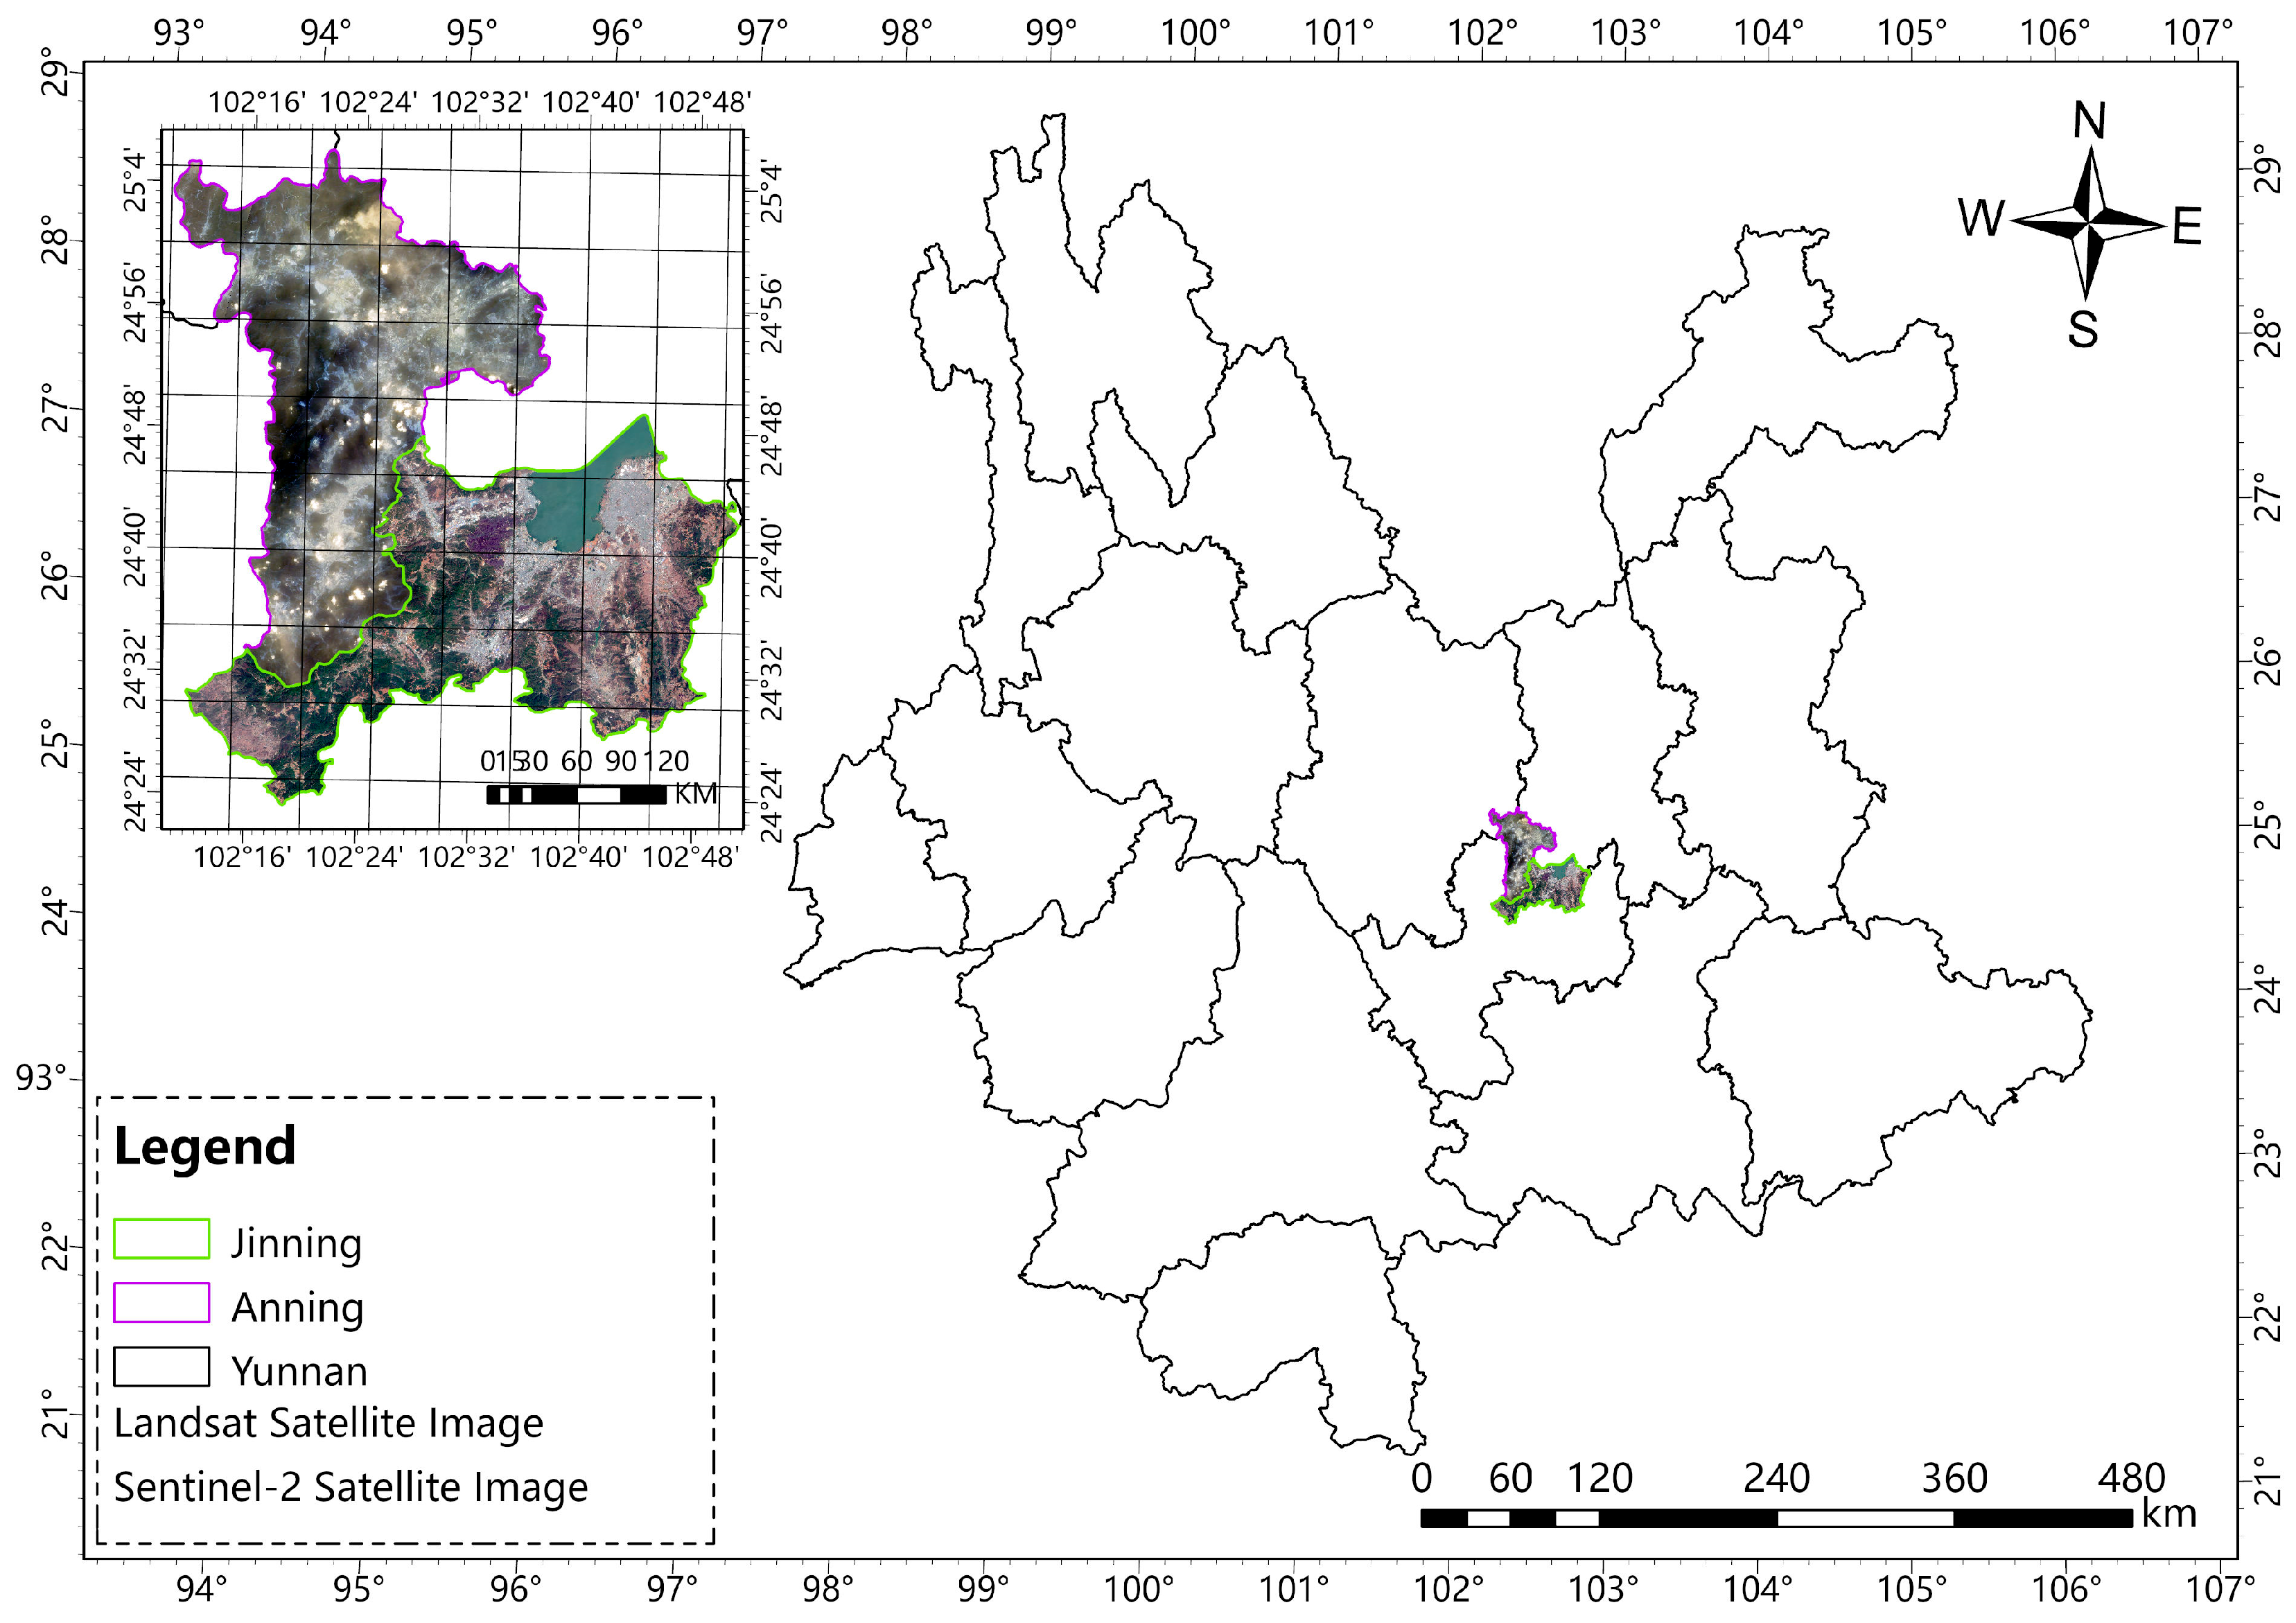
Figure 1. Location of the study area.
Fire 08 00344 g001
Figure 2. Technical approach.
Fire 08 00344 g002
Figure 3. Automatic scheduling principles.
Fire 08 00344 g003
Figure 4. Triangle threshold method principle.
Fire 08 00344 g004
Figure 5. U-Net architecture for fire detection.
Fire 08 00344 g005
Figure 6. Statistical data of fire pixels and others fire pixels in SWIR1 and SWIR2 bands.
Fire 08 00344 g006
Figure 7. An integrated framework of data, algorithms, and visualization for fire detection.
Fire 08 00344 g007
Figure 8. Celery and RabbitMQ principle.
Fire 08 00344 g008
Figure 9. Fire mask and imagery for GF-4 in Anning. (a) Improved automatic threshold; (b) Fixed threshold; (c) Manually interpreted; (d) False-color composite.
Fire 08 00344 g009
Figure 10. Fire mask and imagery for GF-4 in Jinning. (a) Improved automatic threshold; (b) Fixed threshold; (c) Manually interpreted; (d) False-color composite.
Fire 08 00344 g010
Figure 11. Fire mask and imagery for Landsat 8 in Anning. (a) U-Net; (b) Improved automatic threshold; (c) intersection mask; (d) False-color composite.
Fire 08 00344 g011
Figure 12. Fire mask and imagery for Sentinel-2 in Jinning. (a) U-Net transfer; (b) Improved automatic threshold; (c) Voting mask; (d) False-color composite.
Fire 08 00344 g012
Figure 13. Homepage interface.
Fire 08 00344 g013
Figure 14. Dynamic monitoring of Anning City via cross-application of multi-source data.
Fire 08 00344 g014
Figure 15. Dynamic monitoring of Jinning District via cross-application of multi-source Data.
Fire 08 00344 g015
Table 1. Validation performance of different algorithms for GF-4 (* indicates significance).
AreaMethodtpfnfpPRF-ScoreIoUF-Score 95% CIMcNemar-p
Anning *Improved automatic threshold124010.7500.8570.750.6667–0.97140.0078
Fixed threshold412010.2500.4000.250.1053–0.6667
JinningImproved automatic threshold921430.9680.8680.9150.8440.8725–0.95240.6072
Fixed threshold871910.9890.8210.8970.8130.8478–0.9384
Table 2. Validation performance of different algorithms for Landsat 8/Sentinel-2 (* indicates significance).
Image SensorAreaMethodtpfnfpPRF-ScoreIoUF-Score 95% CIMcNemar-p
Landsat 8AnningImproved automatic threshold41170.8540.9760.9110.8360.8421–0.96551
U-Net41160.8720.9760.9210.8540.8537–0.9739
Sentinel-2Jinning *Improved automatic threshold18231762160.8940.9120.9030.8230.8932–0.91221.3061 × 10−14
U-Net transfer15594401730.9000.7800.8360.7180.8228–0.8482
Table 3. Fire information table.
Field NameData TypeLengthNullableUniqueDescription
idString100NoYesUnique identifier
autotask_idString100NoYesAuto-download task ID
usernameString50NoNoAssociated user
jobIdInteger/NoYesJob ID
acquisition_timeDateTime/NoNoImage acquisition time
production_timeDateTime/YesNoFire detection time
confidenceString100NoNoFire confidence level
bright_dataFloat/NoNoPixel brightness (temperature) value
sensorString50YesNoSensor type
lonFloat/NoNoLongitude
latFloat/NoNoLatitude
provinceString50NoNoProvince-level administrative region
cityString50NoNoCity-level administrative region
countyString50NoNoCounty-level administrative region
Disclaimer/Publisher’s Note: The statements, opinions and data contained in all publications are solely those of the individual author(s) and contributor(s) and not of MDPI and/or the editor(s). MDPI and/or the editor(s) disclaim responsibility for any injury to people or property resulting from any ideas, methods, instructions or products referred to in the content.