Article

Experimental Study on the Law of Gas Migration in the Gob Area of a Fully Mechanized Mining Face in a High-Gas Thick Coal Seam

1
Faulty of Public Security and Emergency Management, Kunming University of Science and Technology, Kunming 650093, China
2
School of Safety Engineering, North China Institute of Science and Technology, Sanhe 065201, China
3
School of Future Cities, University of Science and Technology Beijing, Beijing 100083, China
4
School of Civil Engineering and Architecture, East China Jiaotong University, Nanchang 330013, China
5
State Key Laboratory of Geomechanics and Geotechnical Engineering Safety, Institute of Rock and Soil Mechanics, Chinese Academy of Sciences, Wuhan 430071, China
*
Author to whom correspondence should be addressed.
Fire 2025, 8(9), 339; https://doi.org/10.3390/fire8090339
Submission received: 21 June 2025 / Revised: 14 July 2025 / Accepted: 19 August 2025 / Published: 24 August 2025

Abstract

To investigate the distribution law of gas migration in the gob area of a fully mechanized mining face, the similarity principle was employed, combined with Darcy’s law for porous media seepage, to derive the similarity criteria for simulating gas migration in the gob. An experimental platform for a similar model of the gob area in a fully mechanized mining face was designed and constructed, enabling the regulation of ventilation modes, working face airflow velocity, and gas release in the gob. By adjusting the layout of the tailgate, airflow velocity of the working face, and gas release rate, experimental studies were conducted on the gas flow, gas migration, and variation of gas concentration at the upper corner under different airflow velocities in “U,” “U + I,” and “U + I” type ventilation modes. The results indicate that the ventilation mode determines the spatial variation law of airflow and gas migration in the gob; the airflow velocity of the working face governs the fluctuation degree and influence range of airflow and gas migration in the gob; and both the ventilation mode and airflow velocity affect gas accumulation at the upper corner. The “U + I” type ventilation mode is most effective in reducing gas concentration at the upper corner. Airflow velocities that are too low or too high are not conducive to gas emission at the upper corner, with the optimal control of gas concentration being achieved when the airflow velocity ranges from 1.5 to 2.5 m/s. The experimental results validate the distribution law of airflow and gas migration in the gob of a fully mechanized mining face, providing a basis for selecting ventilation process parameters for such mining operations.

1. Introduction

Coal, as a globally significant energy source, makes thick coal seam mining a crucial component of extraction operations. In China, thick coal seams (≥3.5 m) constitute a substantial proportion of coal reserves. Fully mechanized top-coal caving (FMTC) mining is widely employed for thick coal seams due to its high efficiency and productivity. However, during the FMTC mining of extra-thick coal seams in high-gas mines, large volumes of gas flow from the goaf, coupled with complex migration patterns, readily lead to gas concentration exceedances in the working face and return airway, and may even trigger major accidents such as gas explosions. As one of the primary sources of mine gas, the gas migration within the goaf is a complex process influenced by multiple factors, including geological conditions, mining parameters, ventilation methods, and gas drainage technologies. Therefore, in-depth research into the gas migration patterns within the goaf of FMTC faces in high-gas extra-thick coal seams is essential for ensuring safe and efficient coal mining.
Significant progress has been made in recent years by domestic and international scholars, utilizing field measurements, physical simulations, and numerical simulations, concerning the mechanisms of gas migration in goafs, influencing factors, and control techniques.
Gas migration in the goaf is jointly controlled by permeability distribution, overlying strata fractures, and the ventilation mode. Yuehan Wang et al. [1], through CFD modeling, found that vertical borehole drainage causes uneven oxygen distribution in the goaf, with the oxygen concentration being significantly higher on the tailgate side than on the maingate side. The airflow recirculates into the boreholes via the “high-permeability flow channel” on the tailgate side. Zongyi Qin et al. [2] indicated that gas flow in the goaf is influenced by gas emission characteristics, fracture zone height, and borehole location, with boreholes placed within the annular fracture zone exhibiting higher drainage efficiency. Jie Cao et al. [3], using UDEC-COMSOL to simulate gas migration in fracture networks, pointed out that gas flux in the fracture zone is far higher than that found in the matrix zone, providing theoretical support for optimizing drainage processes. Jun Nian et al. [4], focusing on gob side entry retaining with roof cutting, revealed the formation of an asymmetric “double equilibrium arch” fracture structure in the overburden, leading to significant gas accumulation in high-level fracture zones. Li Jia et al. [5] constructed a deformation-gas pressure–temperature-coupled experimental setup to study permeability evolution during parallel borehole drainage. They discovered that permeability near the borehole declines rapidly but recovers substantially, and a noticeable drainage superposition effect occurs at a borehole spacing of 250 mm. Karacan C. Ö. [6], analyzing data from US longwall mines, confirmed that gob gas ventholes (GGVs) effectively control gas from overlying strata fractures, with an influence radius of 330–380 m. Zunguo Zhang et al. [7], studying the 97312 fully mechanized face in Sihe Mine No. 2, found that the sealing quality of the airtight wall in the gob side retained entry directly impacts the gas concentration within it. As the porosity of the airtight wall increases, the gas concentration at the return corner gradually decreases, while the concentration within the retained entry gradually increases.
The high-intensity mining and large residual coal volume associated with FMTC in extra-thick coal seams exacerbate gas emission and accumulation risks. Pengxiang Zhao et al. [8] investigated the influence of pseudo-inclined length (PSL), noting that PSL induces airflow disorder and local gas accumulation. Effective control of upper corner gas concentration (≤0.46%) was achieved when PSL = 25 m and buried pipe depth = 20 m. Huaming An et al. [9], simulating different ventilation modes for the N2105 working face, concluded that the ventilation mode significantly affects gas seepage patterns in the goaf. U + I and U + Itype ventilation substantially reduce upper corner gas concentration. Wenlin Wang et al. [10] demonstrated through testing that gas volume fraction along the coal wall in high-gas extra-thick coal seam faces follows an asymmetric concave curve, with absolute gas emission peaking during the first weighting. Haijun Guo et al. [11], using the Taishan Mine in China as an example under ultra-thick seam FMTC conditions, found that lamprophyre fracturing during roof weighting significantly increases gas emission into the return airway and upper corner.
Seam dip angle, fault structures, and mining speed significantly alter gas migration pathways. Xiangtao Kang et al. [12] found that normal faults cause active gas circulation within the mining-induced fracture field, making gas concentration more prone to accumulation at higher fault positions. Pengxiang Zhao et al. [13] confirmed through physical simulation that an increase in the coal seam dip angle reduces the height of the “three zones,” narrowing the scope of gas migration channels. The field results showed that high-level borehole drainage efficiency reached 49.94–89.88%. Xiangjun Chen et al. [14], via field measurements and numerical simulation, determined the optimal intake air velocity (2 m/s) and advance rate (3 m/d) for the 215101 working face in Yue Nan Mine. They identified the 0–50 m region behind the face as a strong disturbance zone and the main gas source. Dapeng Wang et al. [15], taking Shaping Mine as an example, studied toxic gas migration in the goafs of upper and lower seams during close-distance coal seam group mining and proposed prevention and control technologies for gas accumulation at the return corner. Chuantian Li et al. [16] proposed a spatio-temporal evolution model of the “three zones and five regions” in the overburden during the initial mining stage, emphasizing that the fracture development zone is the key area for gas drainage.
Drainage parameter design is a core strategy for controlling goaf gas. Cheng Cheng et al. [17], using Wangjialing Mine as an example and combining physical and numerical simulation, clarified the distribution patterns of overburden fracture zone height and gas enrichment zones under mining influence. They proposed that high-level directional boreholes should be installed in the middle of the fracture zone. Kai Han et al. [18], through microseismic monitoring, determined the overburden fracture zone height in a soft coal seam to be 70–75 m and provided optimal spatial parameters for high-level boreholes accordingly. Chong Li et al. [19], when studying the 7607 working face in Wuyang Mine via field measurement and numerical simulation, found that high-level drainage roadway technology significantly mitigates gas exceedance. Lei Wang et al. [20], using Fluent simulation, proposed optimal parameters for buried pipe drainage (pipe length 30 m, diameter 0.3 m, flow rate 80 m3/min) and suggested combining high-level boreholes with upper corner drainage to reduce the concentration to below the safe threshold. Hongzhe Jia et al. [21], for a W-type ventilation face, determined the optimal placement height for high-level directional boreholes in the roof to be 25–35 m. The post-drainage gas concentration in the return airway stabilized at 0.42–0.75%. Aitao Zhou et al. [22], based on COMSOL simulation and field tests at the Buertai Mine 42201 face, proposed the following optimal parameters: pipe spacing 50–70 m and drainage negative pressure 12–18 kPa. Karacan C. Ö. [23], conducting a comprehensive study for a Pocahontas No. 3 metallurgical coal longwall mine in Virginia, USA, aimed to predict gas emissions and propose mitigation strategies. They found that extending the pre-drainage time or increasing borehole density significantly reduces ventilation and goaf gas emissions. Leilin Zhang et al. [24], optimizing buried pipe parameters for the Baode Mine 81307 face (sealed roadway spacing 100 m, suction pressure -32 kPa, pipe diameter 800 mm, flow rate 600 m3/min), reduced upper corner gas concentration to 0.38% in field trials. Zhe Li et al. [25] proposed a combined drainage technology using buried pipes and inserted pipes at the upper corner. Simulations showed this reduced the concentration from 1.2% to 0.6%, recommending a buried pipe length of 20 m.
CFD has become a key tool for studying gas flow in goafs. Janoszek Tomasz [26,27] conducted CFD simulations with field validation for Poland’s Jankowice Mine and a “short-Y-” type ventilation face, providing a basis for shearer speed control. Zhongwei Wang et al. [28,29] systematically simulated six mining scenarios, consistently finding methane concentration to be higher at the tailgate drum than that found at the maingate drum, with accumulated gas in the upper corner primarily originating from goaf emission. Mishra D.P. et al. [30] performed CFD simulations of methane layer diffusion in the tailgate of a retreating longwall face at an Indian underground mine, based on methane emission rates. The results indicated that an air velocity ≥3.0 m/s effectively reduces tailgate methane concentration. Gang Wang et al. [31] quantified goaf porosity distribution using a DEM-CFD-coupled model, identifying the most significant air leakage flow field within 0–10 m along the dip direction. Xu Zheng et al. [32] simulated gas distribution under different ventilation modes using a DEM-CFD model, proposing that 3D gas drainage technology effectively controls roadway gas accumulation. Jinzhao Liu et al. [33] established a “Z-type” ventilation DEM-CFD model, dividing the goaf into a strong air leakage zone (0–10 m) and a weak disturbance zone (45–190 m), providing a basis for seal design. Shuailong Feng et al. [34], using Fluent to simulate airflow patterns in the working face and goaf of the Chengjiao Mine 21304 test face, concluded that the leakage patterns differ significantly from those of traditional longwall mining.
Despite the progress made in gas control, high-gas thick coal seams during mining, influenced by fully mechanized top-coal caving techniques, face challenges such as long preparation times, fast advancement speeds, and high gas emissions, leading to frequent gas overruns at the working face, upper corner, and gob area. Due to the complexity of fully mechanized top-coal caving techniques, once operational parameters are set, they are difficult to change. On-site conditions are complex, and real-time monitoring of airflow and gas distribution migration is challenging, hazardous, costly, and lacks repeatability. On-site studies often focus on single ventilation modes or specific conditions, lacking systematic comparisons of gas migration patterns under multiple ventilation modes. Experimental simulation studies, by adjusting the experimental platform structure and parameters, can address the shortcomings of on-site research, providing a robust framework for systematically studying airflow and gas migration patterns in the gob area of the working face. Therefore, conducting experimental studies offers theoretical foundations and technical support for optimizing fully mechanized top-coal caving process parameters and improving gas control effectiveness.
This study utilizes similarity principles and Darcy’s law for porous media seepage to derive similarity criteria for simulating gas migration patterns in the gob area of a fully mechanized top-coal caving face. Using a specific coal mine as a prototype, a similarity model experimental platform was designed and constructed to enable adjustments to ventilation modes, working face airflow velocity, and gas emission rates in the gob area. Experimental studies were conducted on airflow movement, gas migration, and changes in gas concentration at the upper corner under the “U,” “U + L”, and “U + I” ventilation modes at different airflow velocities.

2. Materials and Methods

2.1. Similarity Principles

Using the similarity principle, similarity criteria were derived to guide the construction of an experimental platform for simulating airflow and gas migration patterns in the gob under “U,” “U + L,” and “U + I” ventilation modes, ensuring that the model results accurately reflect actual field conditions.
Under specific conditions, if the similarity model of the prototype can comprehensively reproduce the prototype’s dynamics, these conditions are referred to as similarity conditions. In the model of gas migration in the gob of a mining face, these conditions include geometric similarity, kinematic similarity, and dynamic similarity as fundamental requirements.
(1)
Geometric Similarity
Geometric similarity requires that the ratios of corresponding lengths between objects in the two systems under study are identical. These ratios are referred to as the length similarity ratio. Let δ x , δ y , and δ z represent certain length parameters in the prototype, and δ x m , δ y m , and δ z m represent the corresponding parameters in the model. The similarity ratios are defined as:
x r = δ x m δ x ,   y r = δ y m δ y ,   z r = δ z m δ z
where r denotes the ratio of a value in the model to the corresponding value in the prototype.
For strict geometric similarity, the following condition must hold:
x r = y r = z r = l r ,     l r = δ l m δ l
where l represents any arbitrary length dimension.
Consequently, the area similarity ratio A r between the two systems is:
A r = A m A = l m 2 l 2 = l r 2
The volume similarity ratio U r is:
U r = U m U = l m 3 l 3 = l r 3
Geometric similarity ensures that the experimental platform model proportionally replicates the spatial structure of the gob and working face, providing accurate geometric boundaries for simulating gas migration under “U,” “U + L,” and “U + I” ventilation modes.
(2)
Kinematic Similarity
Kinematic similarity presupposes geometric similarity. The steady-state flow vector relationships in the model and prototype flow fields must be geometrically similar, and the trajectories of unsteady flows should also be geometrically similar. In simple terms, kinematic similarity means that the motion paths at corresponding points in the model and prototype are geometrically similar, and the ratio of the time taken to traverse corresponding paths is constant. This is expressed as:
V r = V m V = c o n s t
Since V r = l r t r , it follows that the time similarity ratio t r is t r = δ t m δ t = c o n s t .
However, in a deformable model, the length similarity ratio l r varies with direction. As a result, the velocity similarity ratio also varies with the direction of flow, expressed as:
V x r = x r t r     ,   V y r = y r t r     ,   V z r = z r t r
Kinematic similarity ensures that the motion paths of airflow and gas in the experimental platform model are consistent with those in the prototype gob, facilitating the analysis of gas concentration distribution patterns under different ventilation modes.
(3)
Dynamic Similarity
Dynamic similarity requires both geometric and kinematic similarity. For two dynamically similar systems, the forces acting at corresponding points must have equal similarity ratios and act in the same direction. These forces include gravity, pressure, friction, inertial forces, elastic forces, and surface tension. The force similarity ratio is given by:
f i m f i = f V m f V   or   f i f V m = f i f V
Dynamic similarity ensures that the force characteristics (e.g., pressure, viscous forces) of airflow and gas in the model are consistent with those in the prototype gob, providing a mechanical basis for studying the impact of ventilation modes on gas migration.

2.2. Dimensional Analysis

Gas migration in the gob is influenced by the seepage characteristics of porous media and ventilation modes. Dimensional analysis quantifies similarity conditions through dimensionless numbers (e.g., Froude number, Euler number), ensuring that the experimental platform model accurately replicates the gas flow patterns under “U,” “U + L,” and “U + I” ventilation modes.
In theory, any fluid flow can be uniquely determined by the fundamental differential equations governing the flow and their corresponding boundary conditions. For two flow phenomena to be similar, their differential equations must be identical, ensuring that they adhere to the same objective laws. Additionally, to obtain a specific solution for a particular flow, the uniqueness conditions—such as internal boundary conditions, external boundary conditions, and initial conditions—must also be similar. Therefore, in fluid mechanics problems involving six forces—gravity ( F G ), pressure ( F P ), viscous force ( F V ), inertial force ( F I ), elastic force ( F E ), and surface tension ( F T )—and for satisfying dynamic similarity, five dimensionless numbers must be introduced. These are defined as follows:
(1)
Froude Number: The ratio of inertial force to gravity:
F r = F I F G = ρ V 2 l 2 ρ l 3 g = V 2 g l
(2)
Euler Number: The ratio of inertial force to the pressure (or pressure gradient) force:
E u = F I F P = ρ V 2 l 2 Δ P l 2 = ρ V 2 Δ P
(3)
Reynolds Number: The ratio of inertial force to viscous force:
R e = F I F V = ρ V 2 l 2 μ V l = ρ V l μ
(4)
Mach Number: The ratio of inertial force to elastic force:
M a = F I F E = ρ V 2 l 2 E V l 2 = ρ V 2 l 2 ρ c 2 l 2 = V c
(5)
Weber Number: The ratio of inertial force to surface tension:
W e = F I F T = ρ V 2 l 2 σ l = ρ V 2 l σ
In the equation, g   represents gravitational acceleration, m/s2; ρ denotes density, kg/m3; V indicates fluid velocity, m/s; μ is the viscosity coefficient, kg/(m·s); σ represents surface tension, N/m; c is the elastic coefficient; and l is the characteristic length, m.

2.3. Derivation of Similarity Criteria

The five dimensionless numbers— F r (Froude number), E u (Euler number), R e (Reynolds number), M e (Mach number), and W e (Weber number)—serve as the basis for determining whether two phenomena are similar and are referred to as similarity criteria or similarity conditions. Therefore, in similarity simulation studies, it is sufficient to ensure that the conditions playing a decisive role in the process satisfy the similarity principles.
The similarity criteria are derived using a two-dimensional mathematical model of gas migration in porous media. The gas flow in the gob area satisfies the extended Darcy’s law, yielding the continuity equation and momentum differential equations [35]. These equations are expressed as:
u x + v y = 0
1 δ 2 u u x + v u y = V f K u C u u + V f δ 2 u x 2 + 2 u y 2 1 ρ f P f x
1 δ 2 u v x + v u y = v f K v C u v + v f δ 2 v x 2 + 2 v y 2 1 ρ f P f y
where
C = F K ,   F = 1.75 150 δ 3 ,   K = d n 2 150 δ 3 1 δ 2
u , v : velocities in the x and y directions, respectively, in m/s;
δ: porosity of the gob area;
V f : kinematic viscosity of the fluid, in m2/s;
ρ f   : fluid density, in kg/m3;
p f : fluid pressure, in Pa;
F: inertial coefficient of the fluid in the porous medium;
K: permeability of the gob area, in m2;
d n : a defined average particle diameter, in m .
To determine the scaling ratios, the subscript m denotes the model, and r denotes the ratio of model variables and constants to their corresponding prototype values. These are defined as:
x r = Δ x m Δ x ; y r = Δ y m Δ y ; u r = Δ u m Δ u ; v r = Δ v m Δ v ;   ρ f r = ρ f m ρ f ; v f r = v f m v f ; p f r = Δ p f m Δ p f ; δ r = δ m δ
Additionally,
K r = K m K = 1 δ 2 ( 1 δ m ) 2 δ r 3 d n r 2 = 1 δ 1 2 ( 1 δ δ r ) 2 δ r 3 d n r 2 , F r = F m F = F m δ r 3
Substituting Equation (17) into Equations (13)–(15) and simplifying yields:
x r u r u m x m + y r v r v m y m = 0
δ r 2 u r 2 1 δ m 2 u m u m x m + v m u m y m = K R v f r u r v f m K m u m K r F r u r 2 F m K m u m u m + δ r x r 2 v f r u r v f m δ m 2 u m x m 2 + 2 u m y m 2 x r ρ f r p f r p f m x m ρ f m
δ r 2 x r u r 2 1 δ m 2 u m v m x m + v m u m y m = K r v f r v r v f m K m v m K r F r u r 2 F m K m u m v m + δ r x r 2 v f r v r v f m δ m 2 v m x m 2 + 2 v m y m 2 y r ρ f r p f r p f m y m ρ f m
According to the requirement that the prototype and model equations should be identical or proportional, comparing the continuity equation shows that   x r = y r ,     u r = v r , comparing the corresponding momentum and energy equations for the prototype and model, and expanding the coefficients of the diffusion terms in the energy equation. Therefore, the following proportional relationships are obtained:
δ r 2 x r u r 2 = K r v f r u r = K r F r u r 2 = δ r x r 2 v f r u r = x r ρ f r p f r
If the physical properties of the fluid and porous medium in the model and prototype are similar, and the temperature variation is small, it can be approximated that ρ f r = 1, v f r = 1. The average particle diameter ratio d n r and porosity ratio δ r are known (accurately obtainable during the experimental setup). Thus, the relationships become:
δ r 2 x r u r 2 = K r u r = K r F r u r 2 = δ r x r 2 F u R 2 = δ r x r 2 u r = x r p f r
Since achieving complete model similarity is challenging, the design of the experimental platform does not consider criteria with minor impacts. Specifically, the momentum equation neglects the diffusion term and satisfies similarity only for the Darcy and convective terms. Substituting Equation (17) into Equation (22) and simplifying yields:
δ r 2 x r u r 2 = 1 δ 1 2 1 δ δ r 2 δ r 3 d n r 2 u r = x r p f r
Given that the porosity is small and the porosity of the model is close to that of the prototype, it can be approximated that 1 δ 1 2 1 δ δ r 2 1 . Thus, Equation (23) further simplifies to:
δ r 2 x r u r 2 = δ r 3 d n r 2 u r = x r p f r
This leaves five scaling factors: x r , d n r , u r , δ r , and p f r , with only one independent relationship. Apart from the special constraint, ρ f r = 1, there are three freely selectable variables: x r , d n r , and δ r . The velocity ratio u r can then be determined from the above independent relationship. In this study, the values are chosen as x r = 1:100, d n r ≈ 1:30, and δ r ≈ 2:1, which satisfy the requirements. The experimental results confirm that the platform constructed based on the similarity principle effectively simulates the airflow patterns in the mining face under actual “U,” “U + L,” and “U + I” ventilation modes.

3. Establishment of the Similarity Model for the Working Face and Gob Area

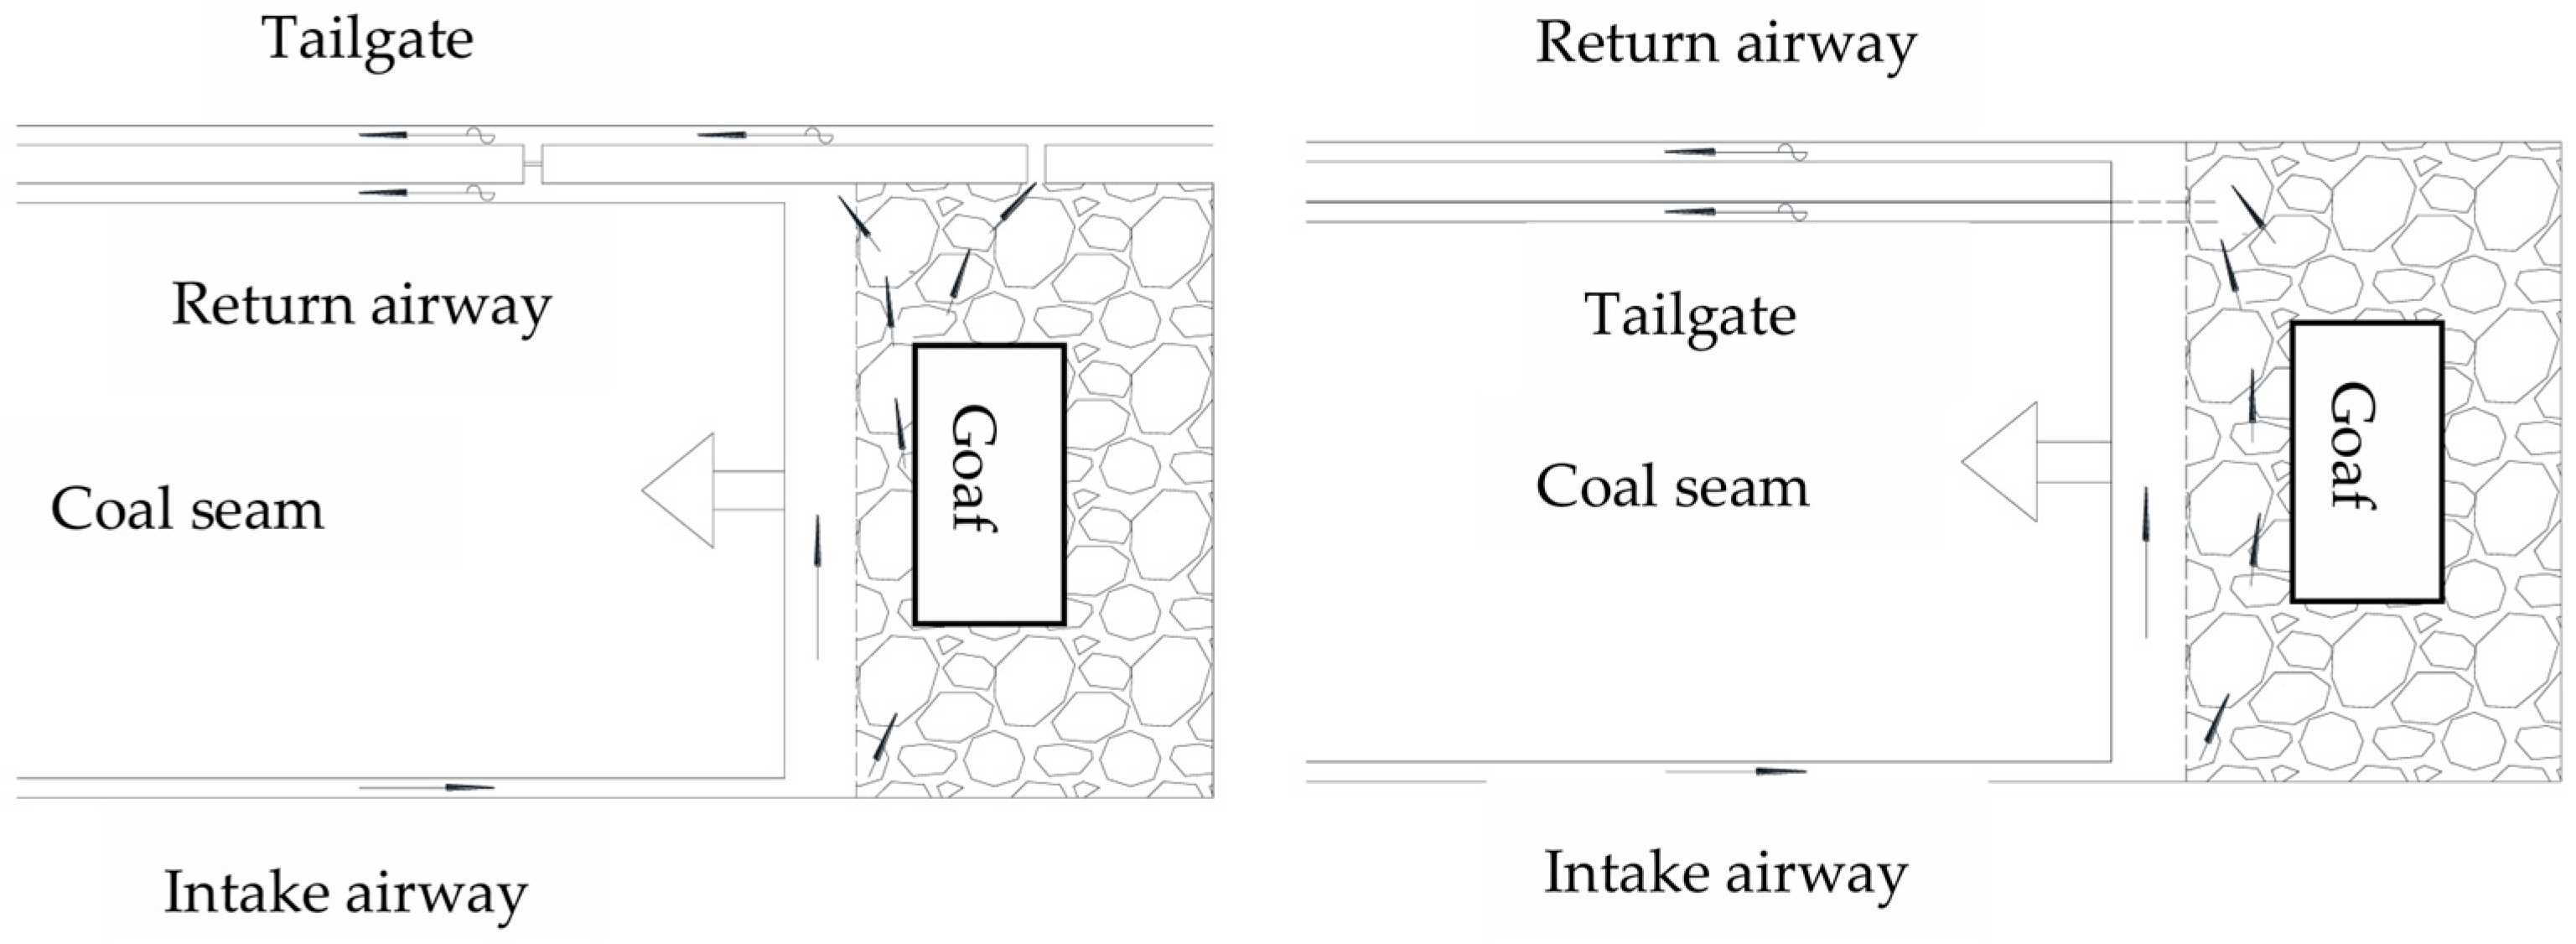
The fully mechanized top-coal caving face in high-gas thick coal seams commonly adopts the “U” or double “U” ventilation systems. To better address the issue of gas concentration exceedances at the upper corner, mines such as Chengzhuang, Sijiazhuang, and Xuandong have implemented “U + L” or “U + I” ventilation modes, achieving significant success. Both “U + L” and “U + I” ventilation modes are developed based on the “U” ventilation mode by incorporating a tailgate on the outer or inner side of the return airway, connected to the gob via a cross-cut or tailgate. Under the negative pressure in the tailgate, leakage airflow from the working face moves toward the tailgate, evacuating gas from the affected area and suppressing gas emission from the gob into the return airway corner. The “U + L” or “U + I” ventilation modes effectively mitigate gas accumulation at the upper corner. Their physical model is shown in Figure 1.
To investigate the gas migration patterns in the gob under “U + L” and “U + I” ventilation modes and optimize the process parameters of the ventilation system, this experiment takes the “U” ventilation mode as the baseline and simulates the “U + L” and “U + I” ventilation modes by incorporating the “L” and “I” tailgates, respectively.

3.1. Structure of the Experimental Platform

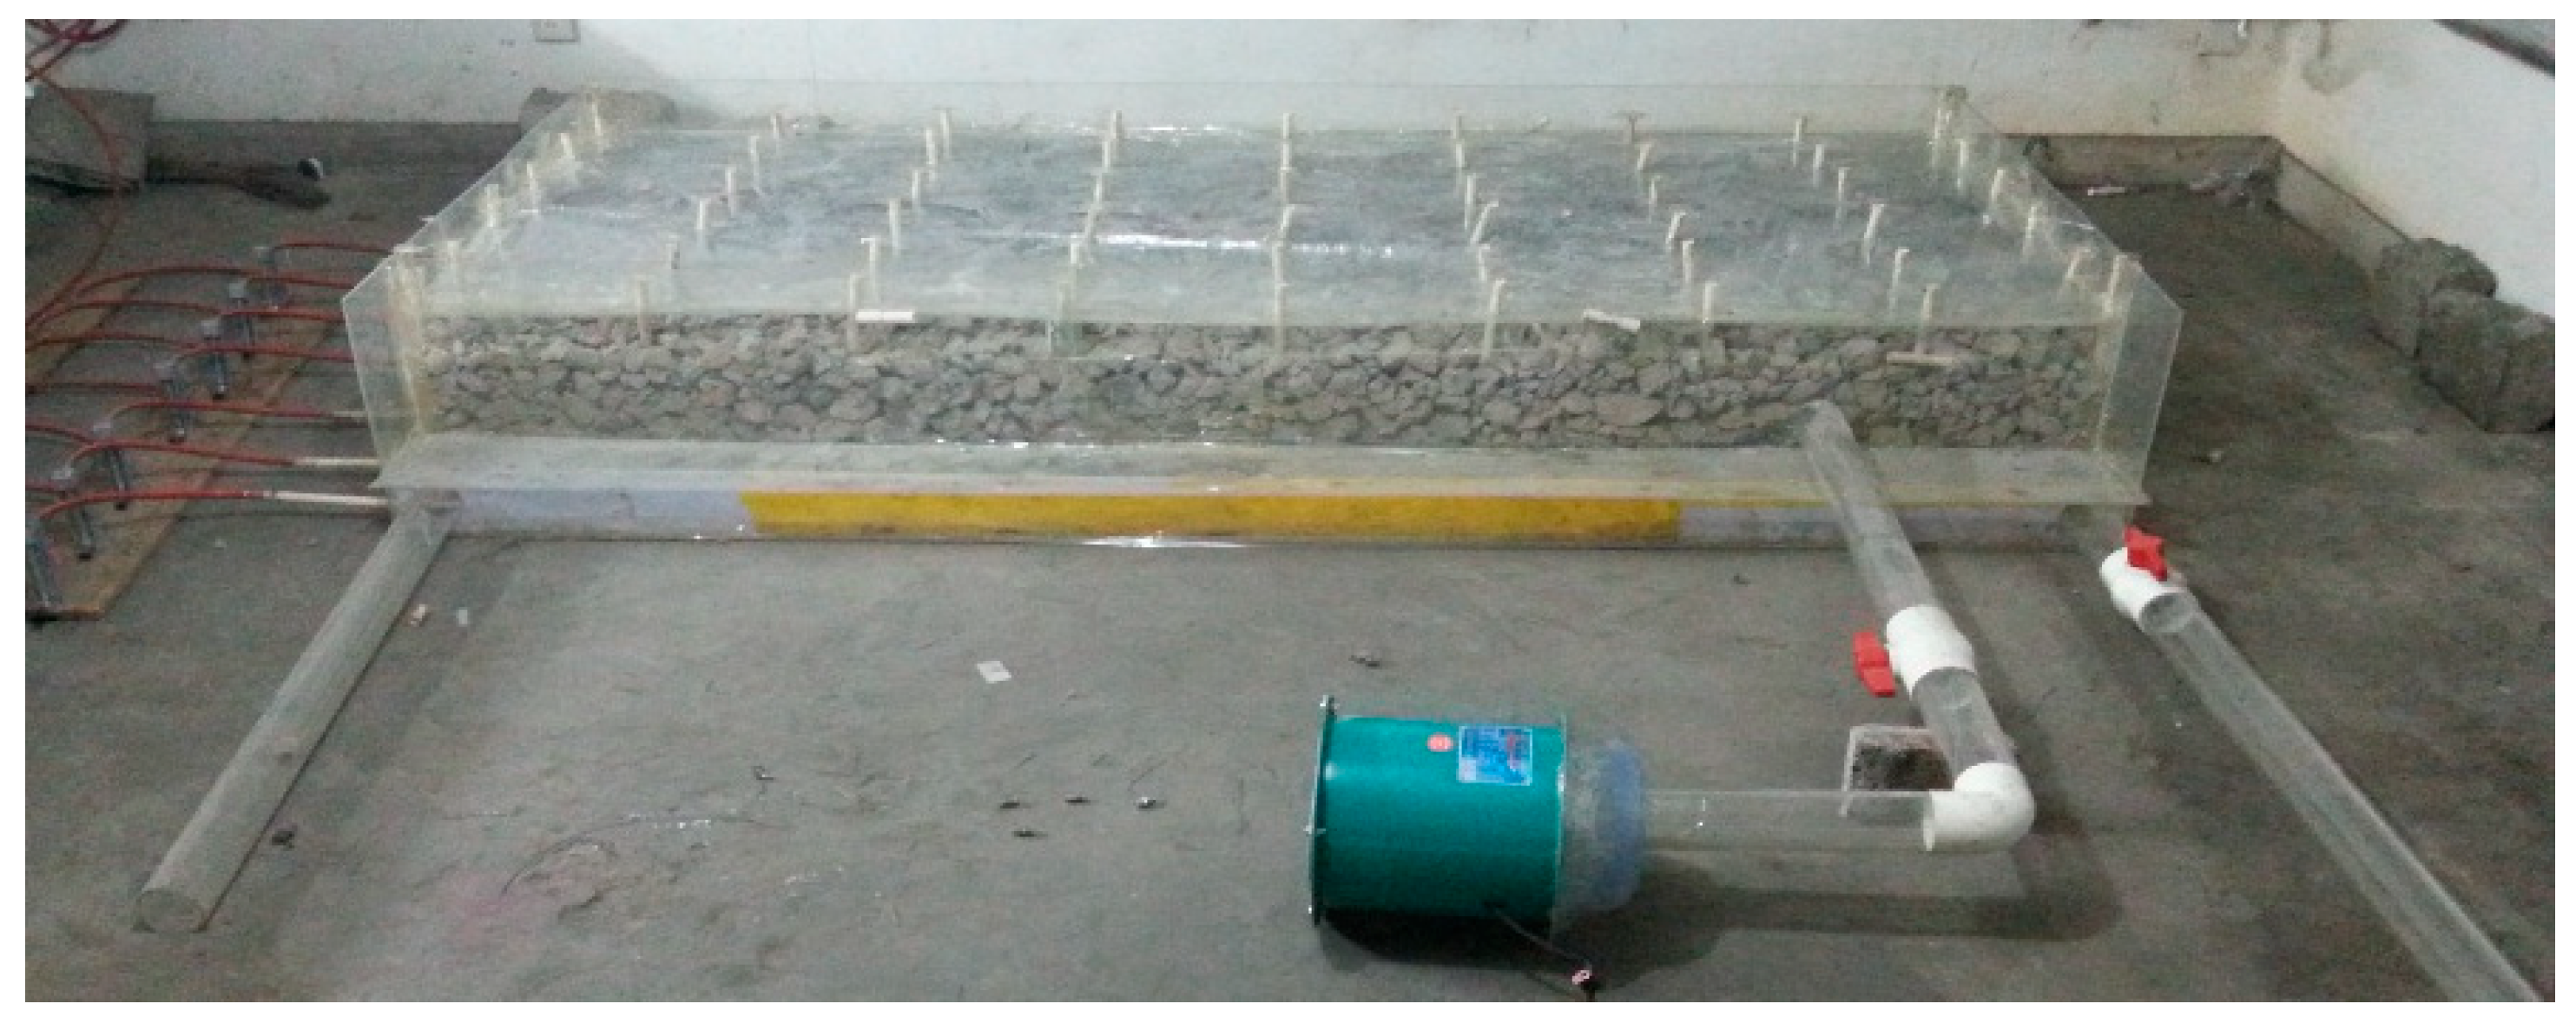
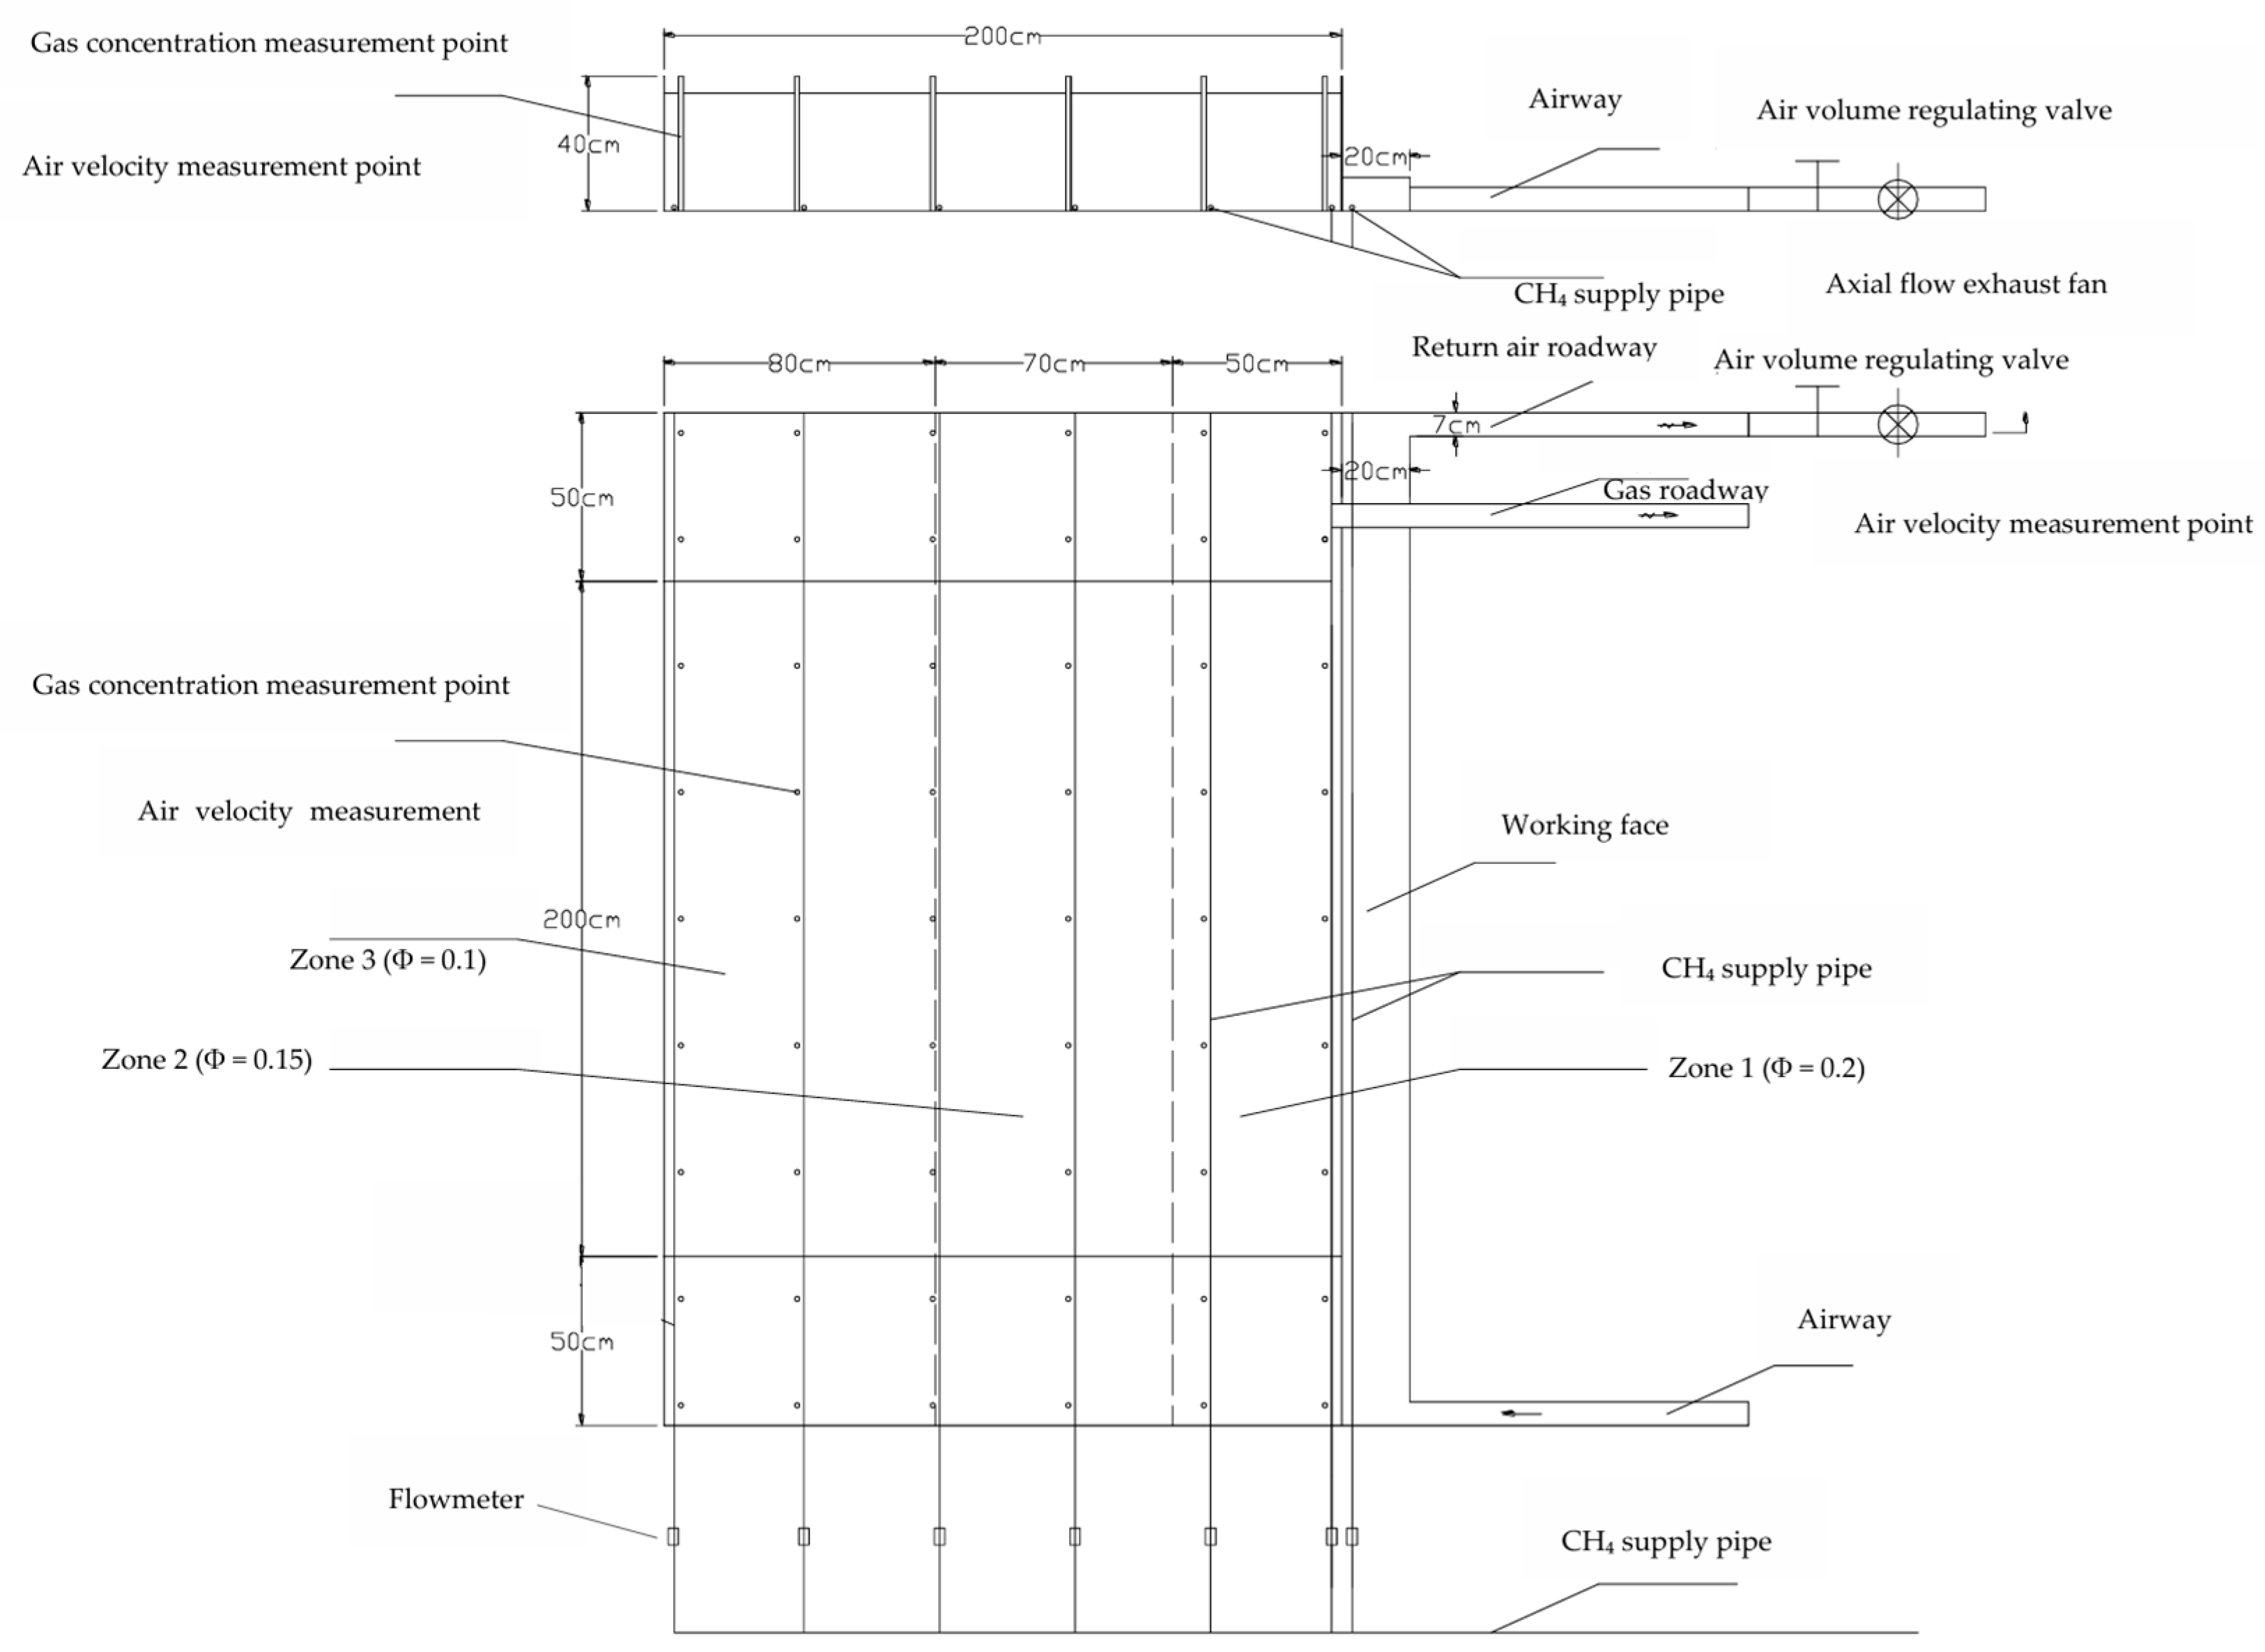
The coal seam thickness of a certain mine’s working face is 6.31 m, the working face height is 3.2 ± 0.1 m, the average top-coal thickness is 3.11 m, the inclined length of the working face cut is 285 m, the cycle progress is 0.8 m, the average air velocity in the intake airway is 2.5 m/s, and the ventilation mode is “U + I.” Using this working face as a prototype, an experimental platform model was designed based on a 1:100 scale ratio, with a working face height of 0.10 m, width of 0.2 m, length of 3 m, gob height of 0.40 m, strike length of 2 m, and dip length of 3 m, incorporating “U”, “U + L”, and “U + I” ventilation modes. The structure of the experimental platform is shown in Figure 2.

3.2. Layout of the Gob Area

The porosity of the collapsed surrounding rock in the gob area is significantly influenced by the properties of the surrounding rock, the advancement speed of the working face, and the location within the gob. The gob area exhibits a “three-zone” variation pattern along the strike direction (heat dissipation zone, oxidation zone, and suffocation zone). Specifically, the region from 0 to 25 m is the heat dissipation zone, from 25 to 115 m is the oxidation zone, and beyond 115 m is the suffocation zone. The heat dissipation zone, affected by the support of unmined coal pillars, hydraulic supports, and the shear resistance of the rock beam itself, has the highest porosity of collapsed surrounding rock, approximately 30%. The porosity in the oxidation zone gradually decreases, while in the suffocation zone, it stabilizes at around 0.1. When constructing the experimental platform, the gob area was simplified into three progressive zones based on the “three-zone” relationship, with different porosities assigned to each zone by varying the particle size of the filling material. For research convenience, the rectangular region from 0 to 50 cm along the strike direction from the working face is designated as Zone 1, the region from 50 to 120 cm as Zone 2, and the remaining area as Zone 3. The regions from 40 to 60 cm and 130 to 150 cm are considered transition zones. In this experiment, only the porosity distribution along the strike direction of the gob area was considered, while the porosity variation in the vertical direction was neglected.
The porosity size and distribution of the filling material in the experimental model must be similar to those in the actual gob area while being feasible to implement in the experimental model. According to relevant data, the average porosity of collapsed coal and rock in the gob area is approximately 30%. To achieve this in the experiment, based on the similarity criteria and considering the data collection in the experiment, this study adopts an inverse method. It first assumes an average porosity of the filling material in the gob area of 15%. Using the water immersion method, the particle sizes of the filling material corresponding to porosities of 10%, 15%, 20%, and 25% were measured. These filling materials with different particle sizes were then placed in the model according to the designated zones. The correspondence between different particle sizes and porosities is shown in Table 1.
Based on the correspondence between particle size and porosity, the particle sizes of the filling material in each zone were determined as follows: Zone 1: 0–50 mm, Zone 2: 0–30 mm, and Zone 3: 0–10 mm. The particle size distribution of the filling material and the filling model are shown in Figure 3.
Thus, a model of the gob area for a fully mechanized top-coal caving face was constructed, with a working face height of 0.10 m, a collapsed and fractured zone height in the gob of 0.40 m, a strike length along the gob of 2 m, and a dip length along the gob of 3.0 m.

4. Experimental Scheme for the Similarity Model of the Working Face and Gob Area

Due to the complex geological conditions of coal seams and significant variations in the physicochemical properties of coal, combined with diverse mining techniques, each fully mechanized top-coal caving face and its associated gob area exhibits unique process parameters and characteristics. Factors such as the intensity of air leakage at the actual working face, the amount of residual coal in the gob area, the desorbable gas content of the residual coal, and the porosity of the collapsed coal and rock in the gob area vary significantly. Consequently, it is impossible to fully replicate every detail of the production environment in a simulation experiment. Therefore, a simplified approach is adopted to simulate the distribution and migration patterns of gas in the gob area. In this experiment, a CH4 supply system is established to simulate gas in the gob area, with gas release rates adjusted via a flow control valve. Airflow generated by a fan is used to simulate ventilation at the fully mechanized top-coal caving face. Pre-installed measurement tubes within the experimental platform enable the measurement of airflow and gas under various operating conditions. The experiments include the measurement of CH4 concentration distribution and its migration patterns in the gob area of the working face, real-time monitoring of ventilation airflow in the gob area, and the control of boundary conditions such as ventilation mode, airflow velocity at the working face, and CH4 release rates in the gob area.

4.1. Auxiliary Systems of the Experimental Model

(1)
CH4 Supply System Description
In this experiment, gas is introduced into the gob area through a supply pipeline in a controlled proportion. By varying the ventilation mode and airflow velocity at the working face, the airflow movement and CH4 concentration distribution in the gob area are observed in order to study the gas migration patterns.
Given the flammable and explosive nature of CH4 gas, strict control of CH4 concentration is maintained during the experiment, with comprehensive preparations to ensure safety. Firstly, a ventilation duct is installed at the outlet of the fan to direct the airflow outdoors. Additionally, an exhaust system is implemented to promptly replace the indoor air and reduce the CH4 concentration, ensuring that the CH4 concentration in the gob area of the experimental platform remains well below the lower explosive limit. This setup, while neglecting the influence of other factors on CH4 concentration, guarantees the accuracy and precision of the measurements. The gas is stored in specialized steel cylinders, with a dedicated pressure-reducing valve and flow meter installed at the outlet to monitor flow rates in real time and stabilize the gas flow.
The experimental platform utilizes φ16 mm PVC pipes as the tracer gas supply source. To ensure uniform gas distribution and minimize simulation errors, seven PVC pipes are strategically arranged within the model as follows: one pipe is placed at the working face (designated as No. 1), one in Zone I (No. 2), one in Zone II (No. 4), two in Zone III (Nos. 6 and 7), one in the transition zone between Zones I and II (No. 3), and one in the transition zone between Zones II and III (No. 5). Each pipe is uniformly perforated with four φ2 mm holes spaced every 10 mm along its length to serve as gas supply points. To account for the varying gas desorption patterns in the gob area, flow control valves are installed on each supply pipeline, enabling precise control of gas flow activation and adjustment, with flow rates ranging from 0 to 1 L/min.
(2)
Ventilation System Description
The experimental model utilizes organic glass tubes as the intake airway, return airway, and gas drainage airway. Two axial flow fans, model SFG2-2R, manufactured by Shanghai Yulong Mechanical and Electrical Manufacturing Co., Ltd., Wenling Branch (Taizhou, China), with an airflow capacity of 1300 m3/h, serve as the power source for the model’s ventilation system.
In the experimental platform for the “U,” “U + L,” and “U + I” ventilation mining fields, the return airway or the combined return and gas drainage airway employs negative pressure ventilation to drive the airflow throughout the mining field. By controlling the ball valve at the air outlet, the airflow velocity can be continuously adjusted between 0 and 5 m/s, ensuring that the airflow velocity within the working face varies between 0 and 4 m/s. Airflow measurement is conducted using the total pressure method, with dynamic pressure measured using a micro-manometer, and the airflow velocity calculated based on the dynamic pressure–velocity relationship formula. The ventilation system and CH4 supply system are shown in Figure 4.
(3)
Airtightness of the Experimental Platform
Studying the migration patterns of gases (air or methane) within the experimental platform requires extremely high airtightness, as even minor errors in measurement parameters can affect the reliability and accuracy of the experimental results. To minimize gas leakage, the baseplate, top plate, working face, and gob area of the experimental platform model are all made of impermeable acrylic glass. These structures are sealed with sealant in addition to mechanical connections. The intake and return air ducts, as well as the tailgate duct, are made of impermeable acrylic tubes, while the gas supply pipes and measurement points are constructed using impermeable PVC pipes, with all connections to the model body properly sealed. The ventilation ducts, tailgate ducts, gas supply pipes, and other pipelines connected to the external environment are equipped with sealed valves, which serve both to control flow and ensure airtightness. The measurement points within the model are connected to the top cover plate through drilled holes, which can be covered with transparent adhesive tape. During measurements, the tape covering the side holes is removed, reducing air leakage through these holes.

4.2. Arrangement of Measurement Points

Based on the structure of the ventilation system in the gob area of the fully mechanized top-coal caving face, as well as the influence of airflow velocity on gas concentration at the working face and upper corner, and in accordance with the configuration of the similarity model, measurement points are strategically placed within the working face and gob area model. Four measurement points are selected at the working face, intake and return airways, and gas drainage airway to measure airflow velocity. Inside the gob area model, six rows of measurement points are evenly arranged along the strike direction, with nine points uniformly distributed in each row along the dip direction, resulting in a total of 54 measurement points for monitoring airflow velocity and gas concentration. The specific arrangement of these measurement points is shown in Figure 2.

4.3. Experimental Scheme

  • Experimental Conditions
The experimental platform was used to conduct a similarity simulation study on the airflow leakage and methane concentration variation patterns in the gob area of the working face under the “U,” ”U + L,” and “U + I” ventilation modes. The steps are as follows:
(1)
CH4 Supply to the Gob Area: The gob area is supplied with CH4 gas uniformly to simulate the gas accumulation in an actual gob area. The supply method involves simultaneously opening all CH4 gas supply pipelines for a unified overall supply, adhering to the similarity ratio of the gas source term in the similarity model.
(2)
CH4 Concentration Determination: Due to variations in gas occurrence conditions, coal recovery rates, mining progress, and airflow velocities across different mines, the gas concentration distribution in the gob area and the “three zones” (heat dissipation zone, oxidation zone, and suffocation zone) differs. As the purpose of this experiment is to determine the gas migration patterns at different locations within the gob area, the CH4 concentration is selected to reflect its migration patterns in the simulated space, set at 3%. In the deep gob area of actual mines, oxygen is scarce, and the voids are primarily filled with gas, potentially reaching concentrations as high as 100%, largely unaffected by the working face advance rate or airflow velocity. Therefore, the CH4 concentration in Zone 3 is used as a reference to simulate the gas concentration in the suffocation zone.
(3)
CH4 Concentration Supply and Adjustment: Under the conditions set in (1), CH4 concentration is supplied, and a methane detector is used to measure CH4 concentrations at the sampling points designed on the experimental platform. Once the concentration reaches 3%, the flow regulation devices on each supply pipeline are adjusted to ensure uniform flow rates across all pipelines. The gas release rate in the experimental model is scaled proportionally to the actual gas release rate in the gob area, simulating the continuous gas release process in the gob area.
(4)
Airflow Velocity Variation and Measurements: By adjusting the airflow regulation valve in the return airway, the airflow velocity at the working face is varied within the range of 0–4 m/s. Tests are conducted in ascending order of airflow velocity to investigate the following: (a) the temporal variation of gas concentration in each zone, (b) the variation of gas concentration with airflow velocity, and (c) the spatial variation of gas concentration from Zone 1 to Zone 3. This examines the influence of airflow at the working face on gas distribution and migration patterns in the gob area.
Since air leakage occurs in both actual mine gob areas and the experimental model, only the actual CH4 supply rate in the model is considered, neglecting the impact of air leakage in the experimental platform. In the similarity model, gas released from residual coal and surrounding rock fracture zones is simulated through supply pipelines installed at the base of the experimental platform. The experimental parameters are shown in Table 2.
The CH4 supply rates for each zone are determined according to the similarity ratio of gas release rates between the model and the prototype. By adjusting the control valves on pipelines Nos. 1, 2, and 3, the CH4 supply rate for Zone I is set at 1.5 L/min; by adjusting the control valves on pipelines Nos. 4 and 5, the CH4 supply rate for Zone II is set at 1.0 L/min; and by adjusting the control valves on pipelines Nos. 6 and 7, the CH4 supply rate for Zone III is set at 0.6 L/min. To mitigate the randomness of CH4 concentration measurements, multiple sets of experiments are conducted for comparison. The experiment is considered repeatable if the CH4 concentration errors at all measurement points do not exceed 10%.
2.
CH4 Concentration Measurement
To determine the concentration distribution and migration patterns of CH4 in the gob area of the working face, measurements of CH4 concentration variations within the gob area are conducted to simulate the gas movement process in a porous medium. The gas in the gob area is influenced by multiple factors, including the following: gas release from residual coal, gas inflow from the surrounding rock and adjacent layers, the occurrence conditions of the coal seam roof, the particle size and porosity of collapsed coal and rock, the intensity of air leakage in the gob area, and the process parameters of the working face mining operations. Accurately describing the distribution of gas sources is highly challenging due to these factors. Therefore, in this experiment, the gas source in the gob area of the working face is simplified, assuming that all gas in the gob area originates from residual coal and is supplied through the gas supply pipelines. Based on the experimental requirements, six rows of measurement points are evenly arranged along the strike direction of the gob area, with nine CH4 concentration measurement points per row. The CH4 concentration at each measurement point is detected using a methane detector, and the measurement data are recorded on site.
3.
Flow Field Measurement
Initially, the “U” ventilation mode is employed, and a ventilation experiment is conducted on the gob area model of the working face using negative pressure extraction. The airflow velocity is measured using micro-pressure differential devices installed in the return airway and gas drainage airway. The airflow velocity in the mining field is controlled by adjusting the airflow regulation valve according to pre-specified parameter values. The CH4 concentration at each measurement point is measured using a methane detector. During the ventilation process, CH4 concentrations at each measurement point are recorded at specified time intervals, and all data are documented.
4.
Boundary Conditions Measurement
Boundary conditions are critical for similarity simulation experiments, as accurate and realistic boundary conditions are fundamental to ensuring the reliability of the experimental results. In this similarity simulation experiment, the required boundary conditions include the ventilation mode of the working face, the airflow velocity at the working face, and the CH4 release rate in the gob area of the working face.
5. Similarity Experiment Results and Analysis

To thoroughly investigate the airflow distribution and methane migration patterns in the gob area of a fully mechanized top-coal caving face, we conducted experimental research on the airflow distribution in the gob area under different ventilation modes (“U,” “U + I,” and “U + L”) and various working face airflow velocities (0.5 m/s, 1.0 m/s, 1.5 m/s, 2.0 m/s, and 2.5 m/s). Additionally, the methane distribution in the gob area and upper corner was examined under these different ventilation modes and airflow velocities. The experimental results were analyzed to identify the relationships between factors contributing to excessive methane levels at the working face, providing a basis for addressing the issue of methane overrun in fully mechanized top-coal caving faces.

5.1. Analysis of Airflow Velocity Distribution in the Gob Area

5.1.1. Airflow Velocity Distribution Under Different Ventilation Modes

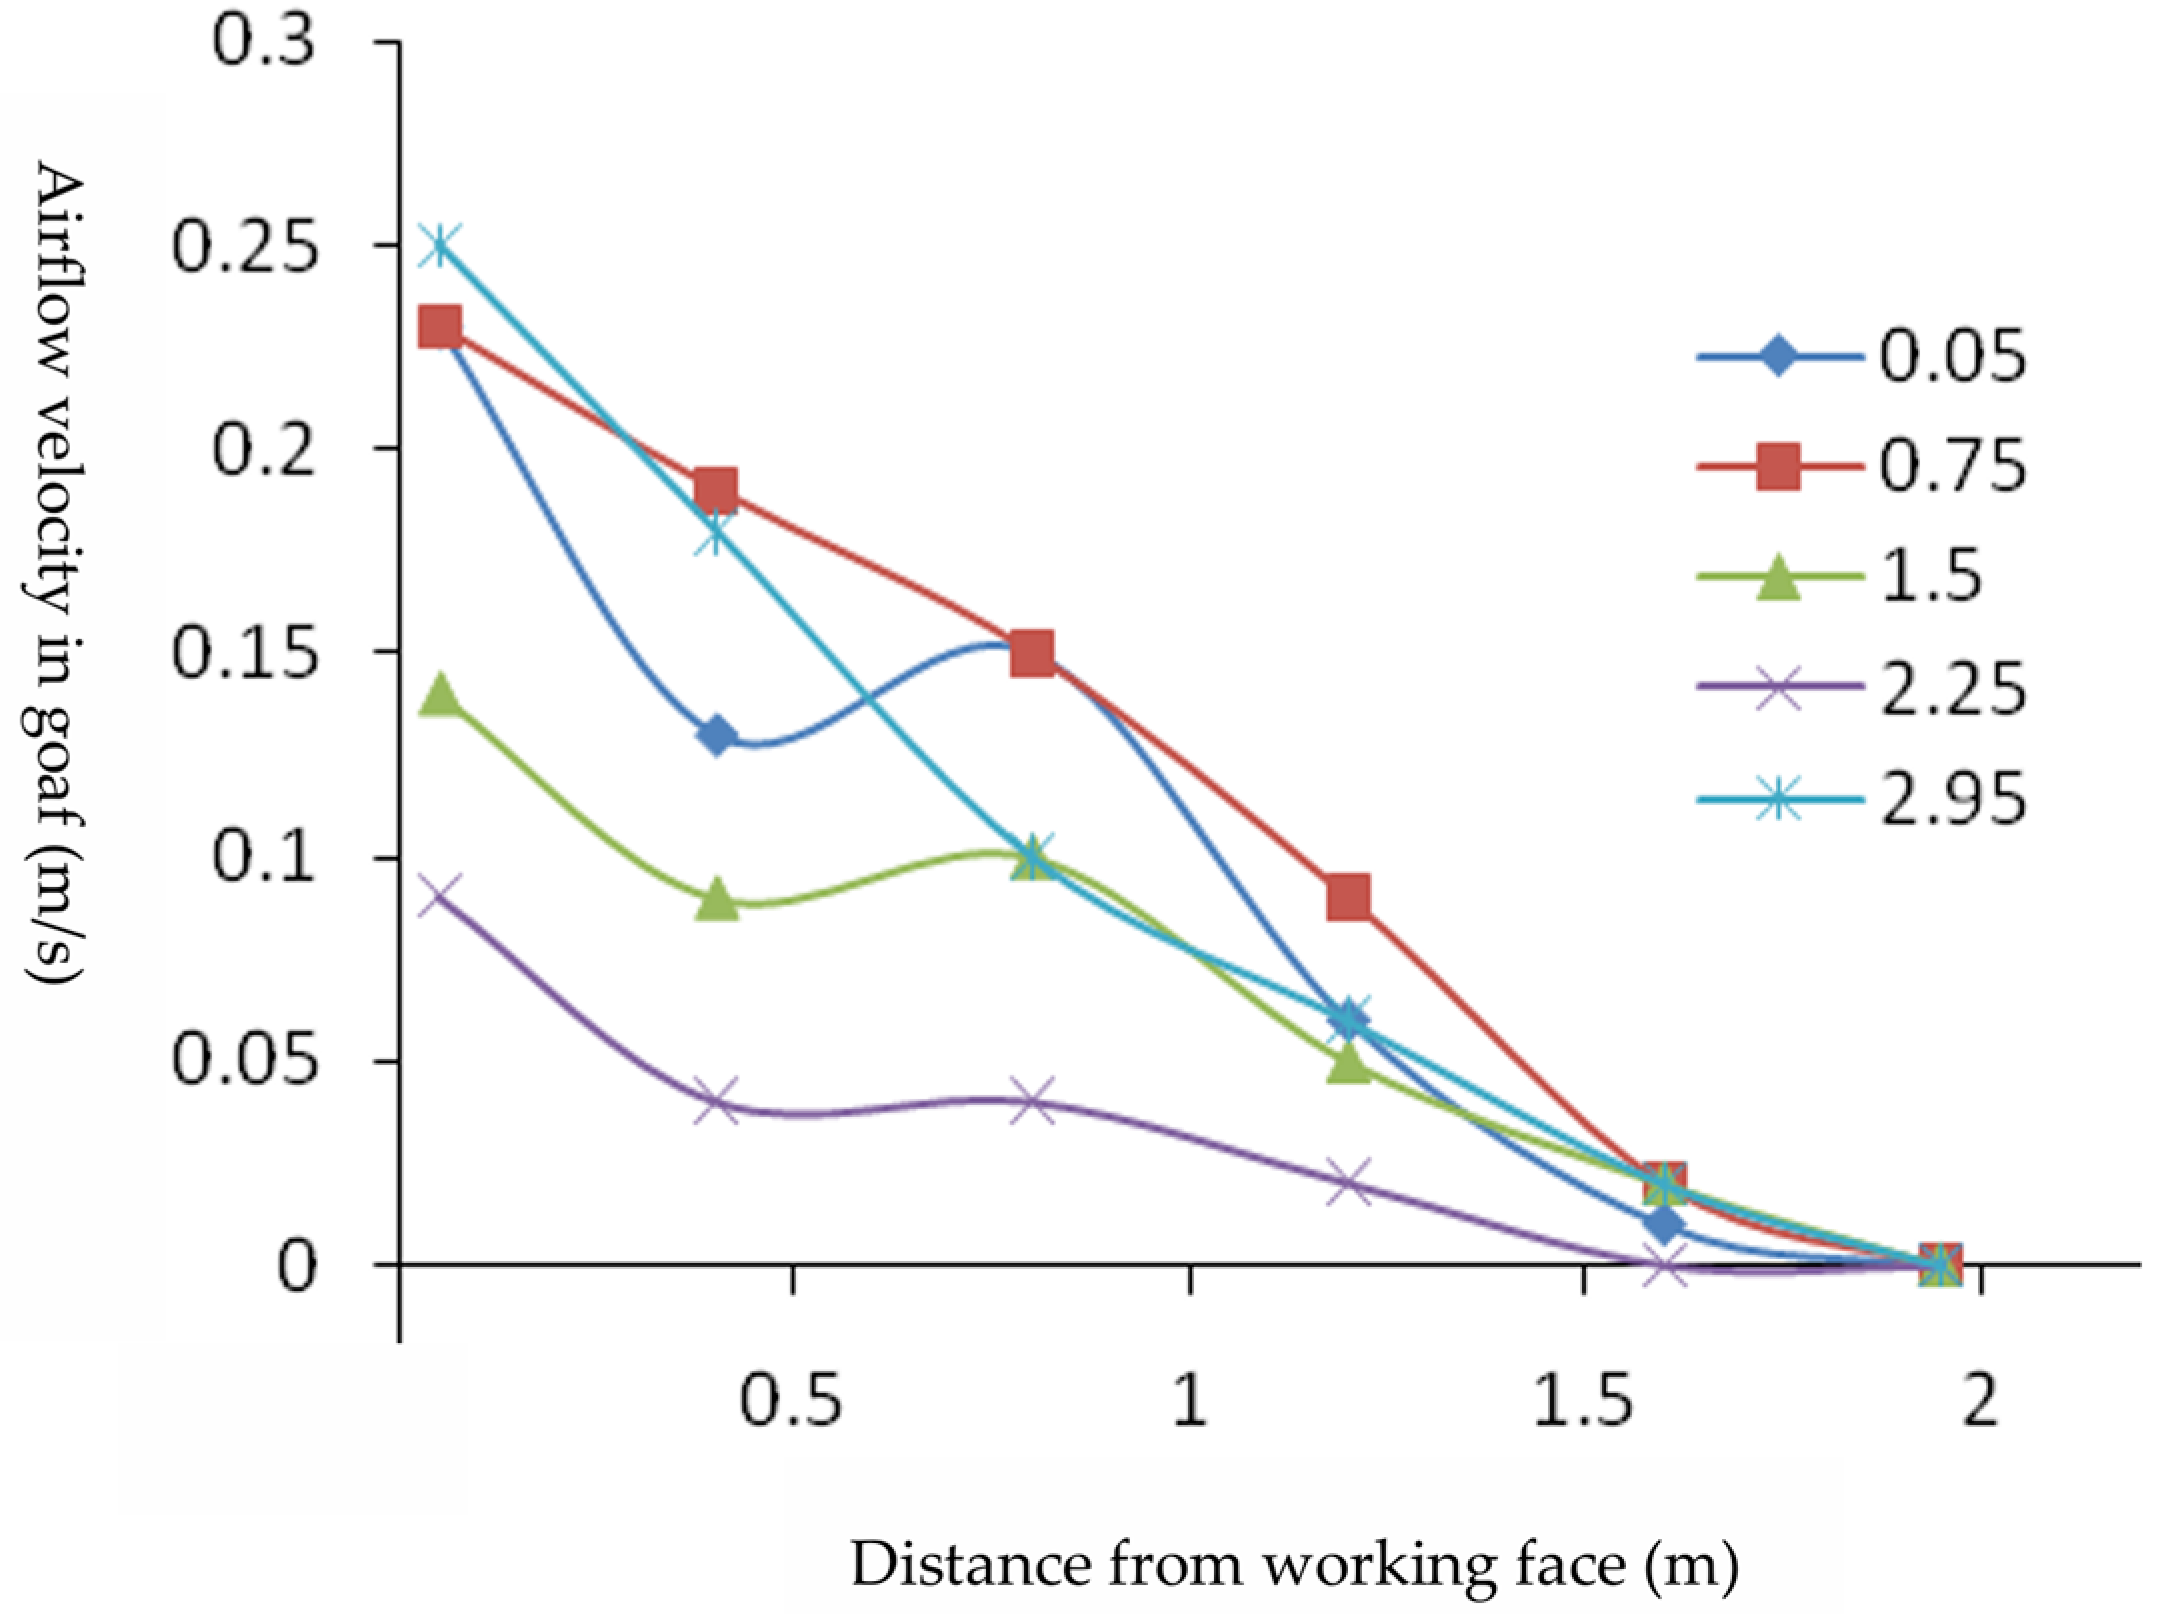
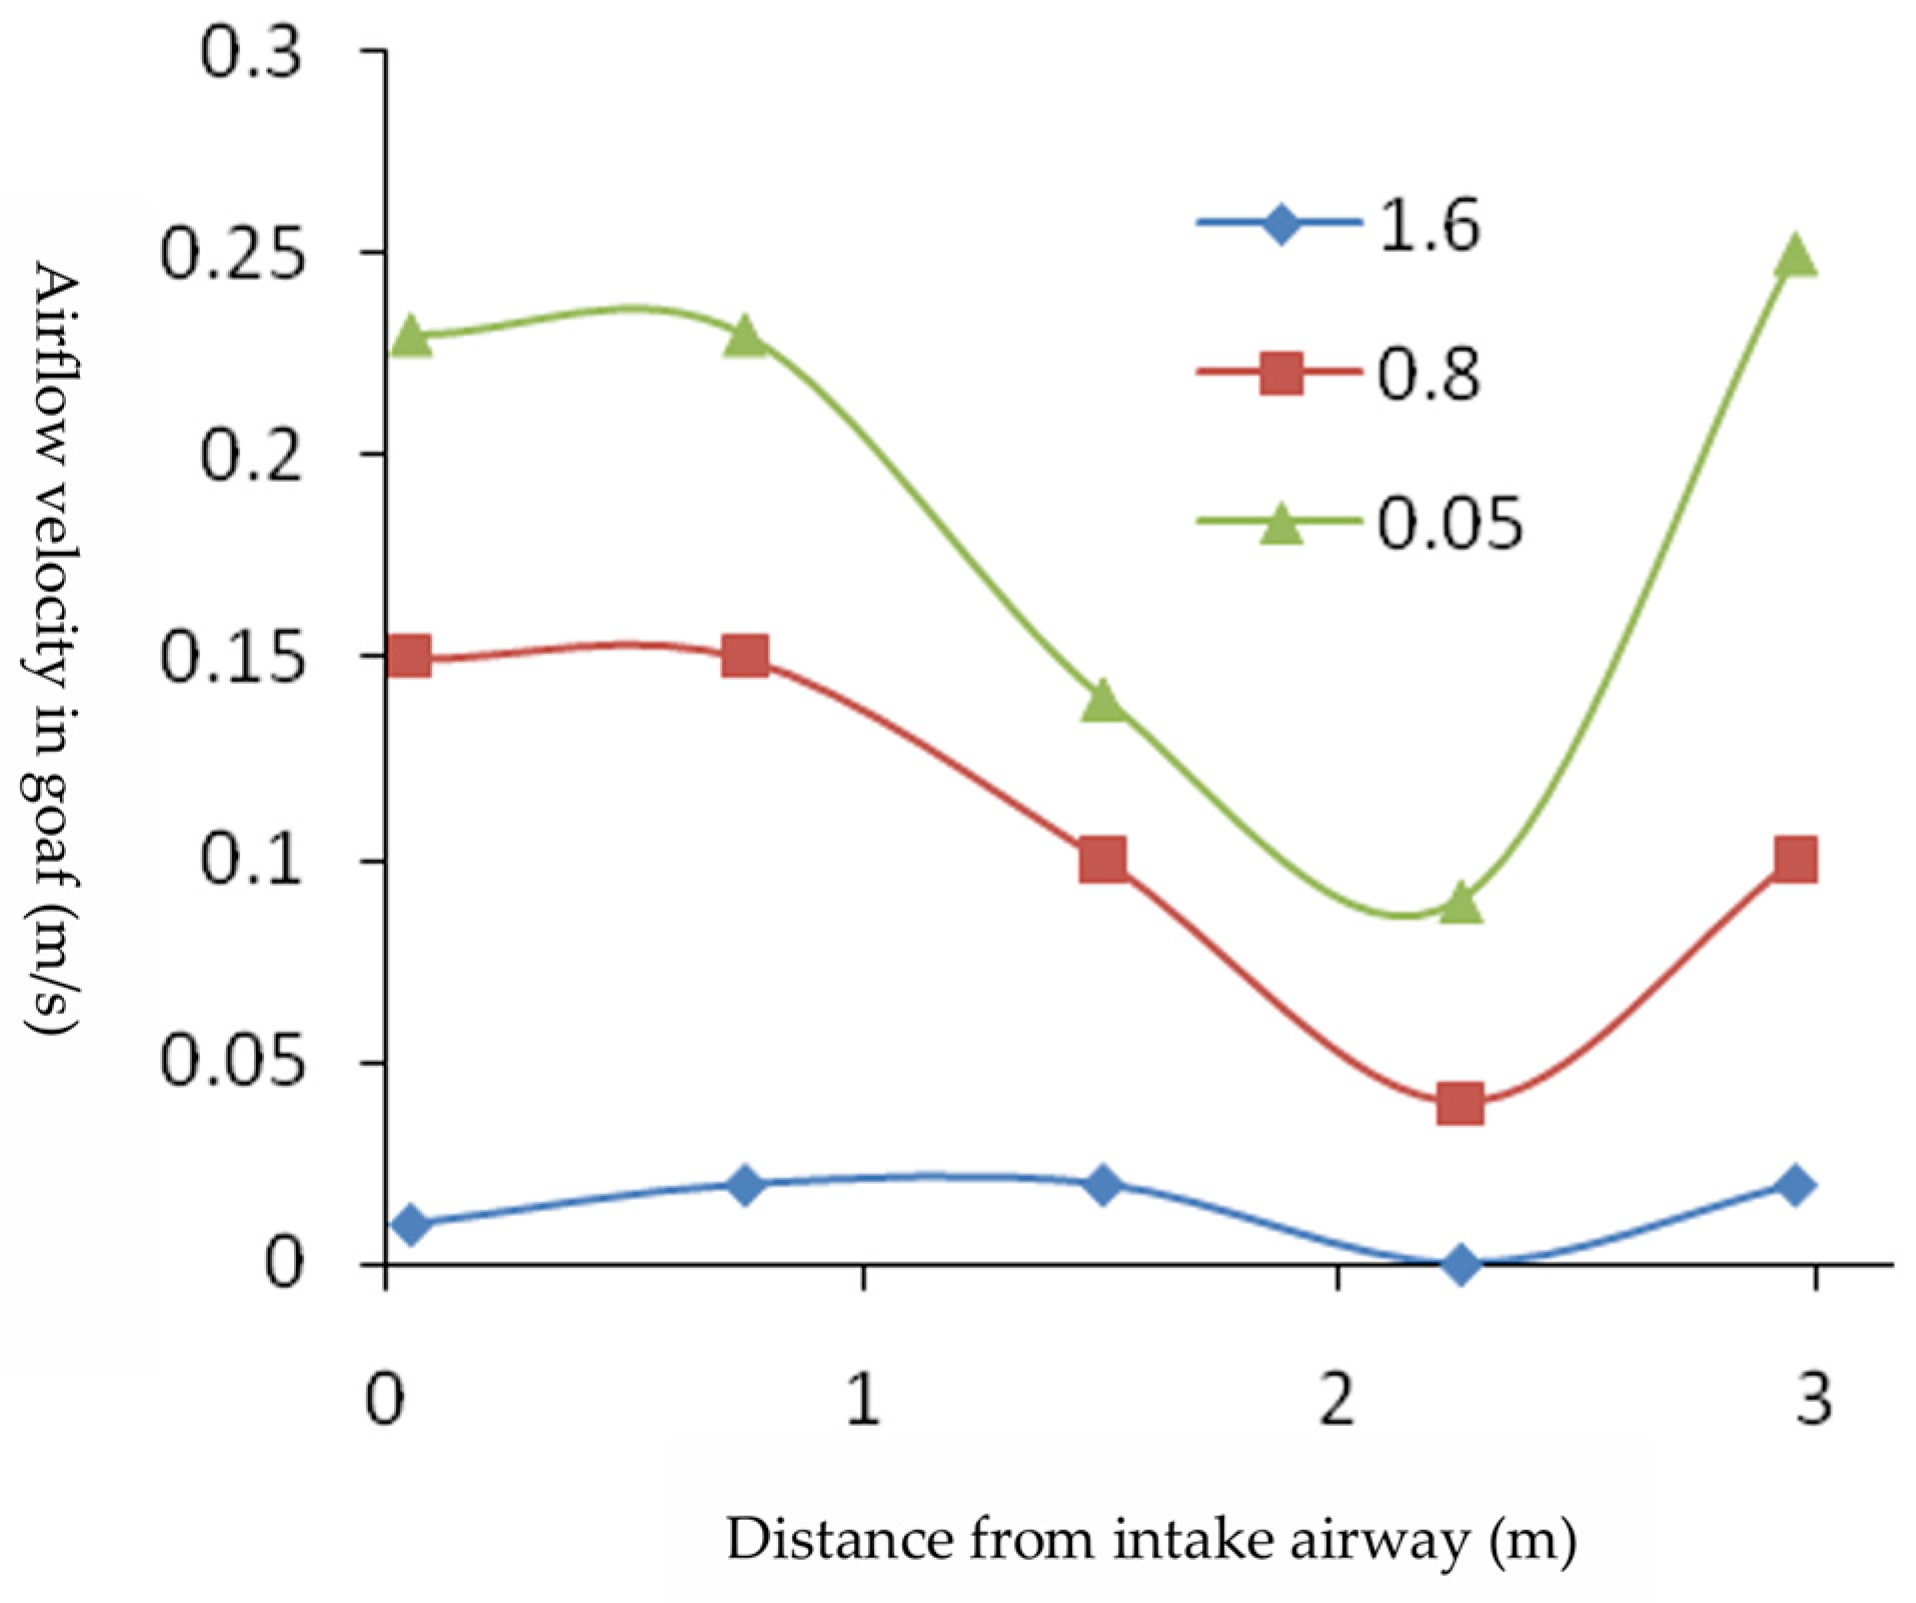
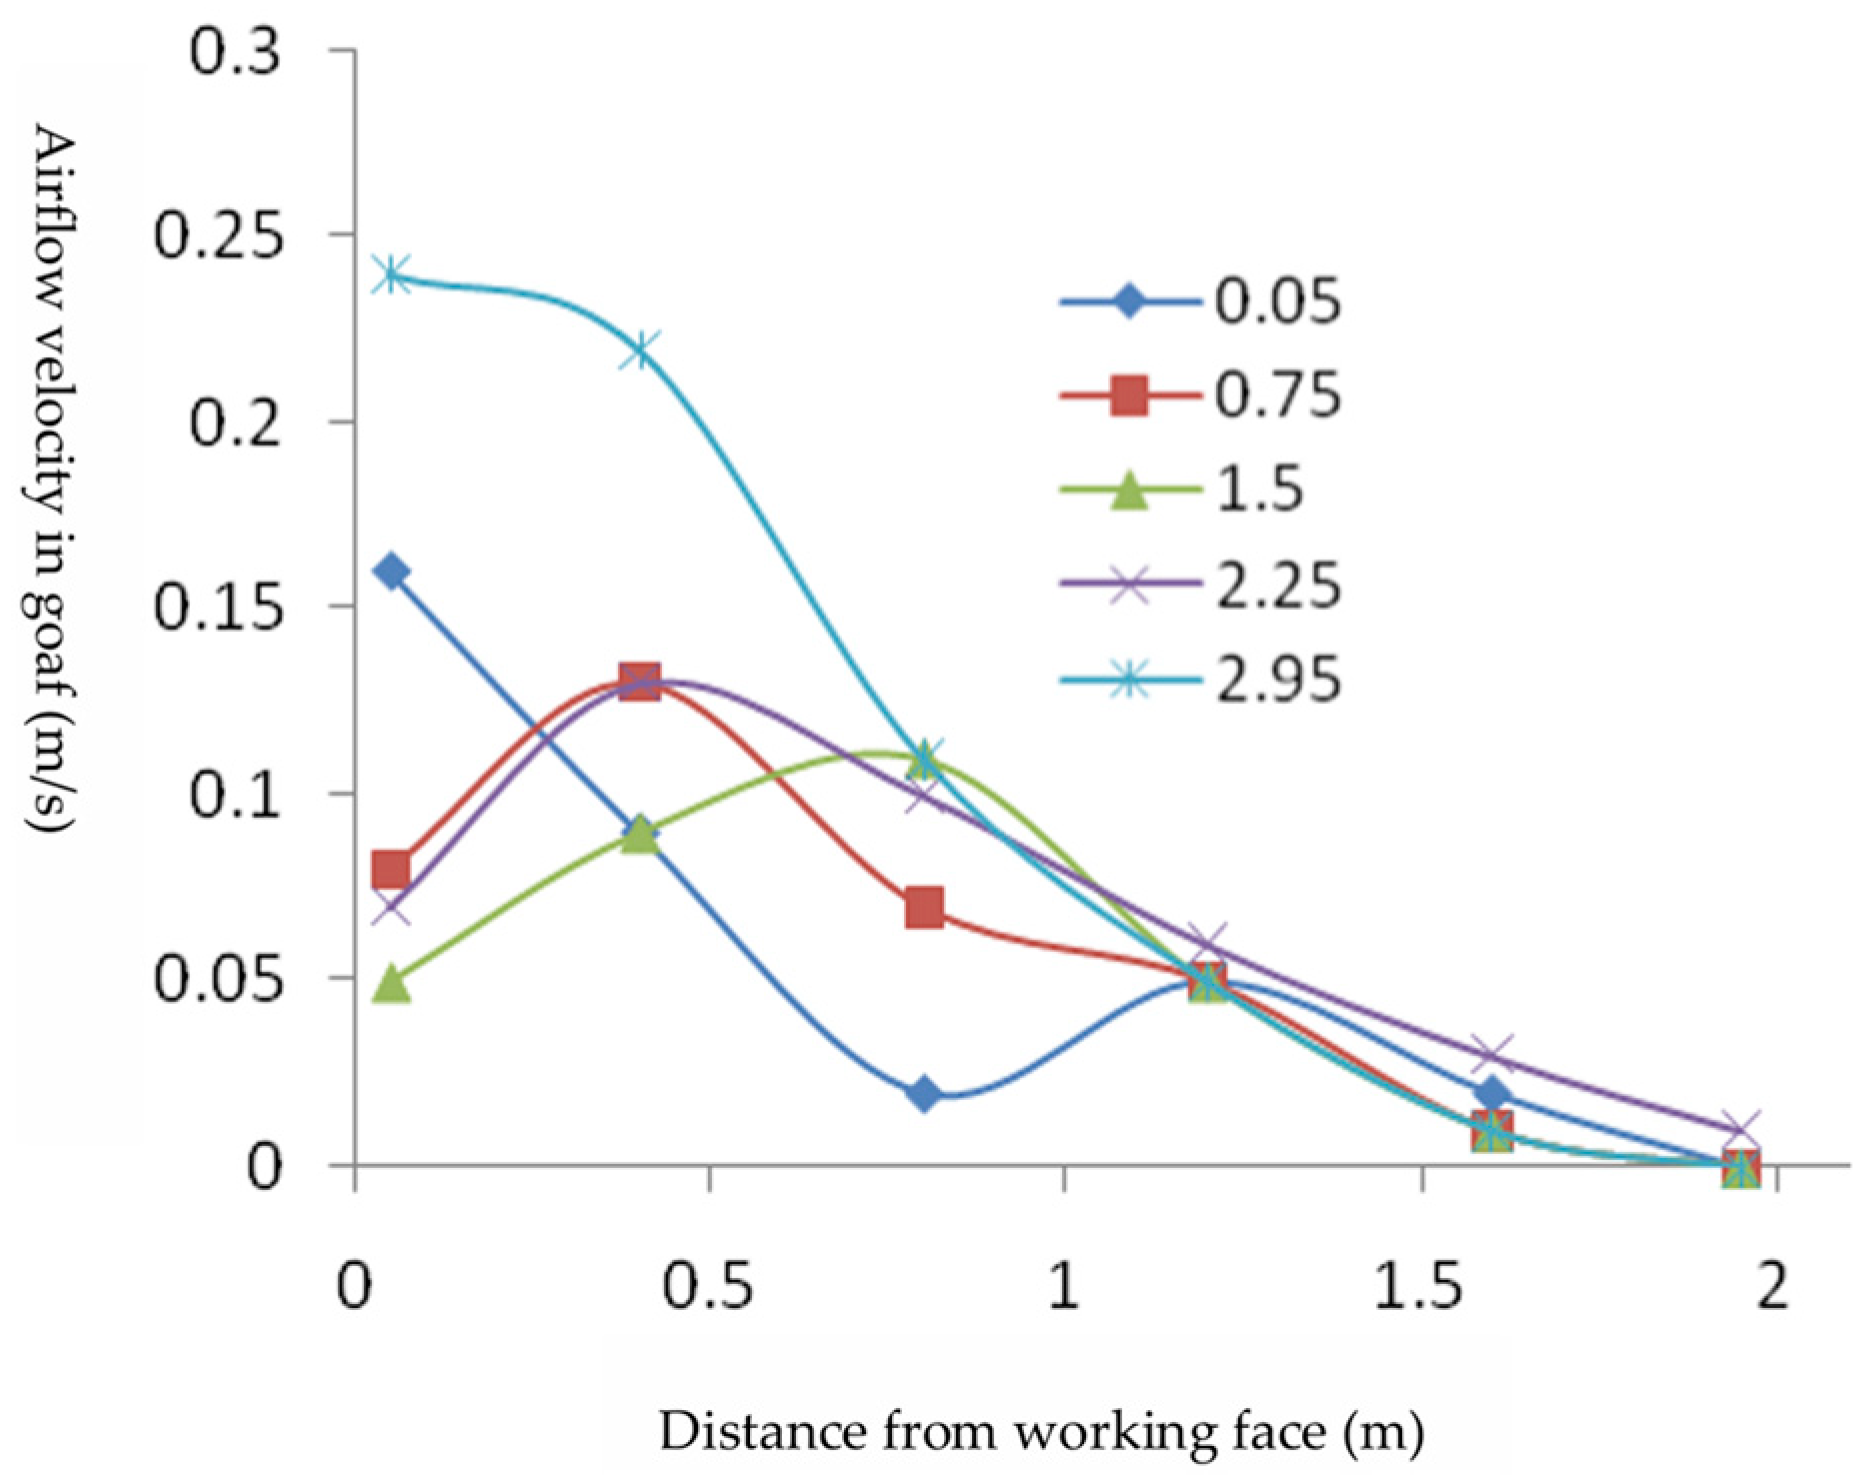
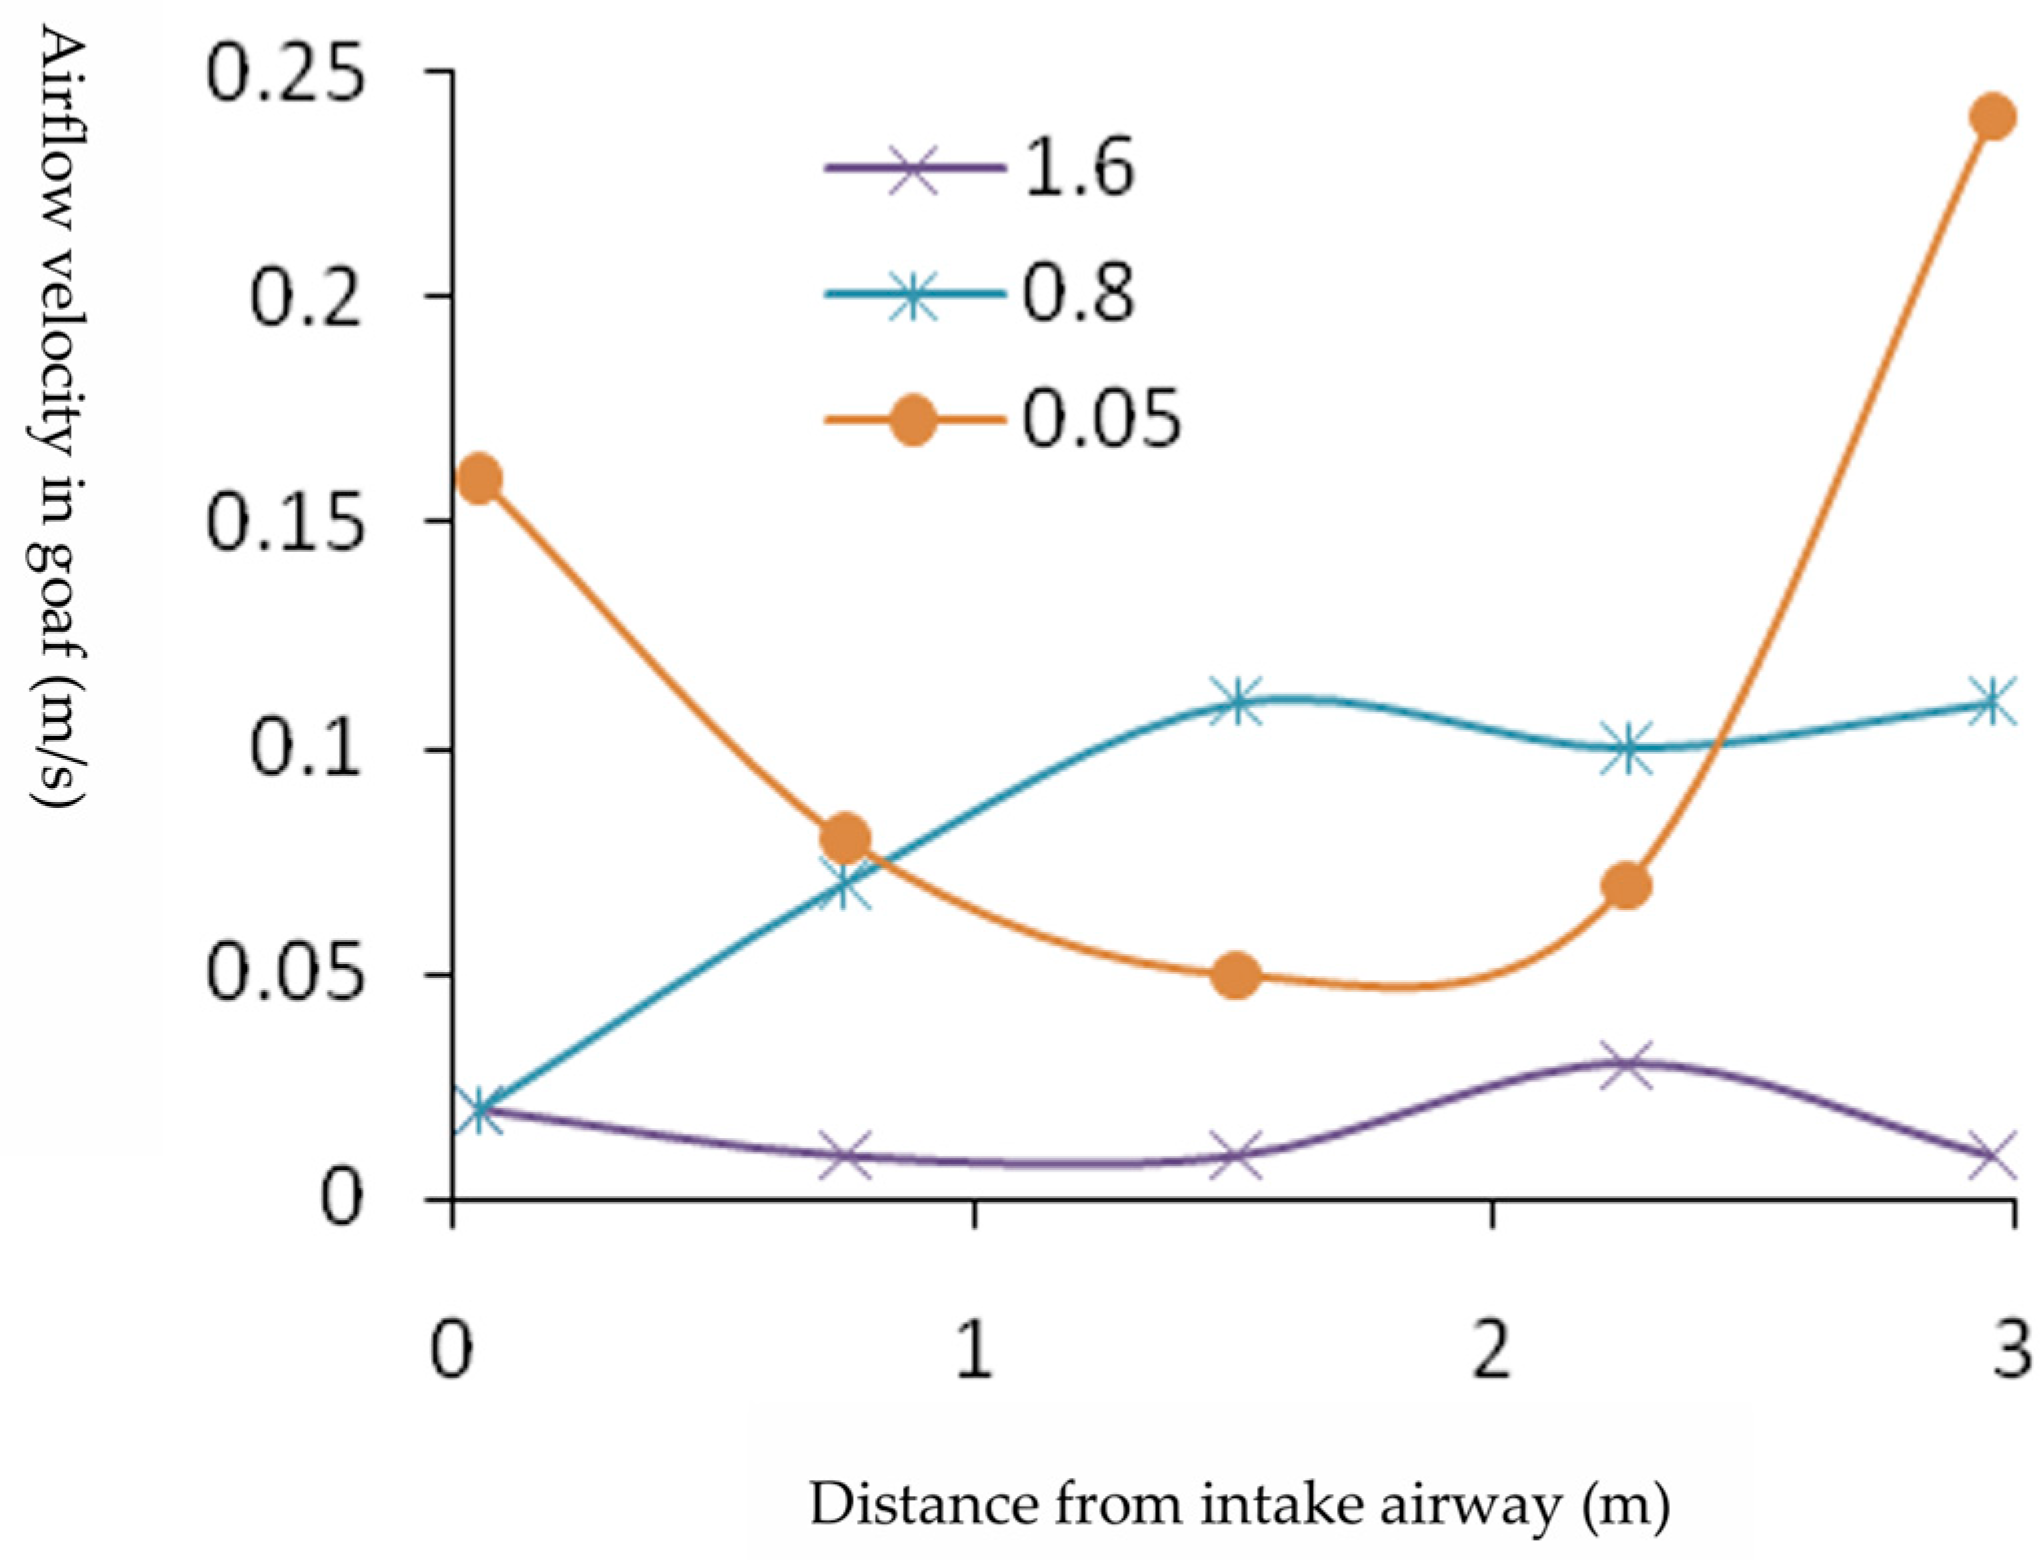
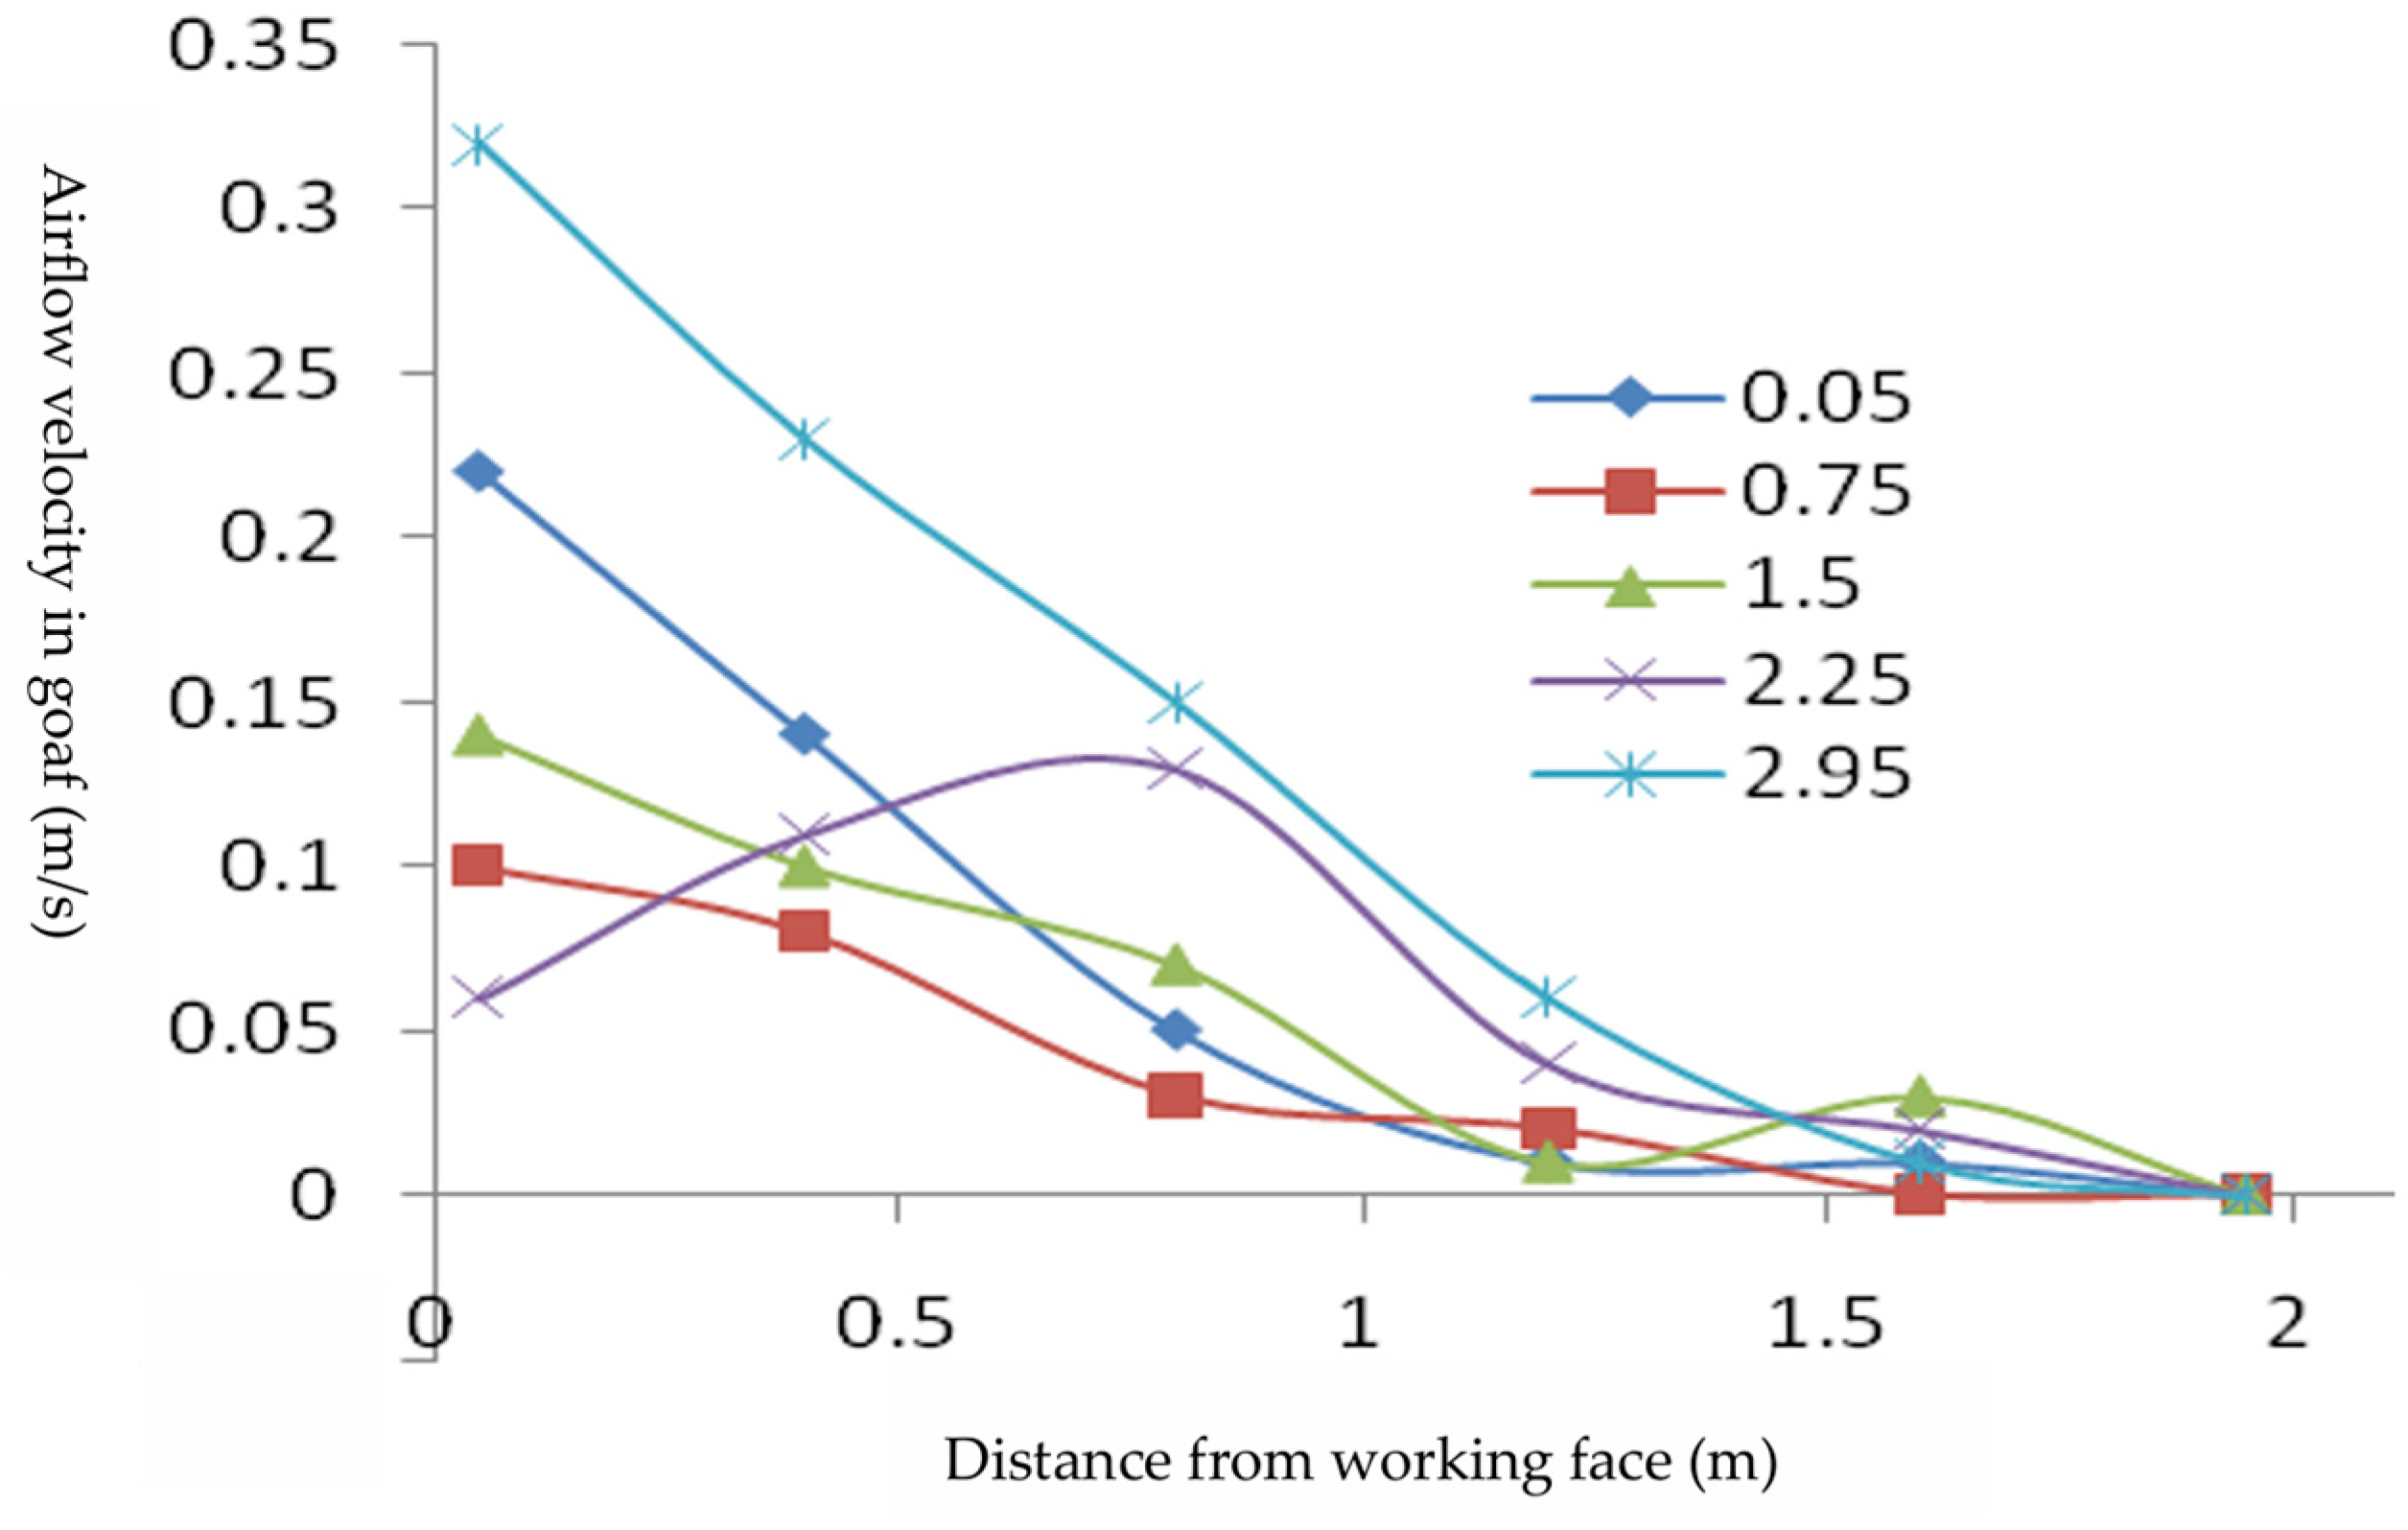
In the experiment, the airflow velocity at the working face is set to 1.5 m/s to investigate the airflow velocity distribution patterns in the gob area under “U,” ”U + L,” and “U + I” ventilation modes. A plane located 50 mm above the model base is selected as the representative plane for airflow field analysis (this applies to all subsequent analyses). Figure 5, Figure 6, Figure 7, Figure 8, Figure 9 and Figure 10 illustrate the airflow velocity distribution for “U,” ”U + L,” and “U + I” ventilation modes at cross-sections along the dip direction of the gob area at distances of 0.05 m, 0.75 m, 1.50 m, 2.25 m, and 2.95 m from the intake side, as well as along the strike direction of the gob area at distances of 0.05 m, 0.80 m, and 1.60 m from the working face.
From the comparison of Figure 5, Figure 7 and Figure 9, it can be observed that, along the strike direction of the gob area, the influence of ventilation modes on the airflow velocity distribution within the gob is generally consistent. Specifically, the ventilation mode significantly affects the heat dissipation zone, has a lesser impact on the oxidation zone, and has almost no effect on the suffocation zone. The primary reason for this is that the heat dissipation zone, influenced by the support of unmined coal pillars, hydraulic supports, and the shear resistance of the rock beam itself, exhibits the least subsidence and the highest porosity. This spatial distribution in the heat dissipation zone facilitates airflow movement. In contrast, the oxidation and suffocation zones, affected by the subsidence of overlying coal and rock, have reduced porosity, which is less conducive to gas flow. The ventilation mode has a significant impact on airflow fluctuations in the heat dissipation zone. Along the dip direction of the gob at sections 0.05 m and 2.95 m, the airflow velocity is higher, and the influence of airflow velocity extends deeper, whereas, at the 2.25 m section, the airflow velocity is lower, and the influence range is shallower under the “U + L” or “U + I” ventilation modes.
From the comparison of Figure 6, Figure 8 and Figure 10, it can be seen that the airflow in the gob area shows reduced velocity fluctuations at the 0.05 m section near the working face. Moreover, the airflow velocity noticeably increases at the junctions of the inner and outer tailgate airways with the gob area. Under the influence of the “L” and “I” components, significant airflow velocity fluctuations are also observed at the section 0.8 m from the working face, primarily occurring near the return airway side. Beyond the section 0.8 m from the working face, the influence of the working face airflow velocity is extremely weak, which aligns with the theoretical analysis and practical experience of airflow movement patterns in the suffocation zone of the gob area. This confirms the feasibility of conducting experimental studies on methane migration patterns in the gob area.

5.1.2. Airflow Velocity Distribution Under Different Airflow Velocities

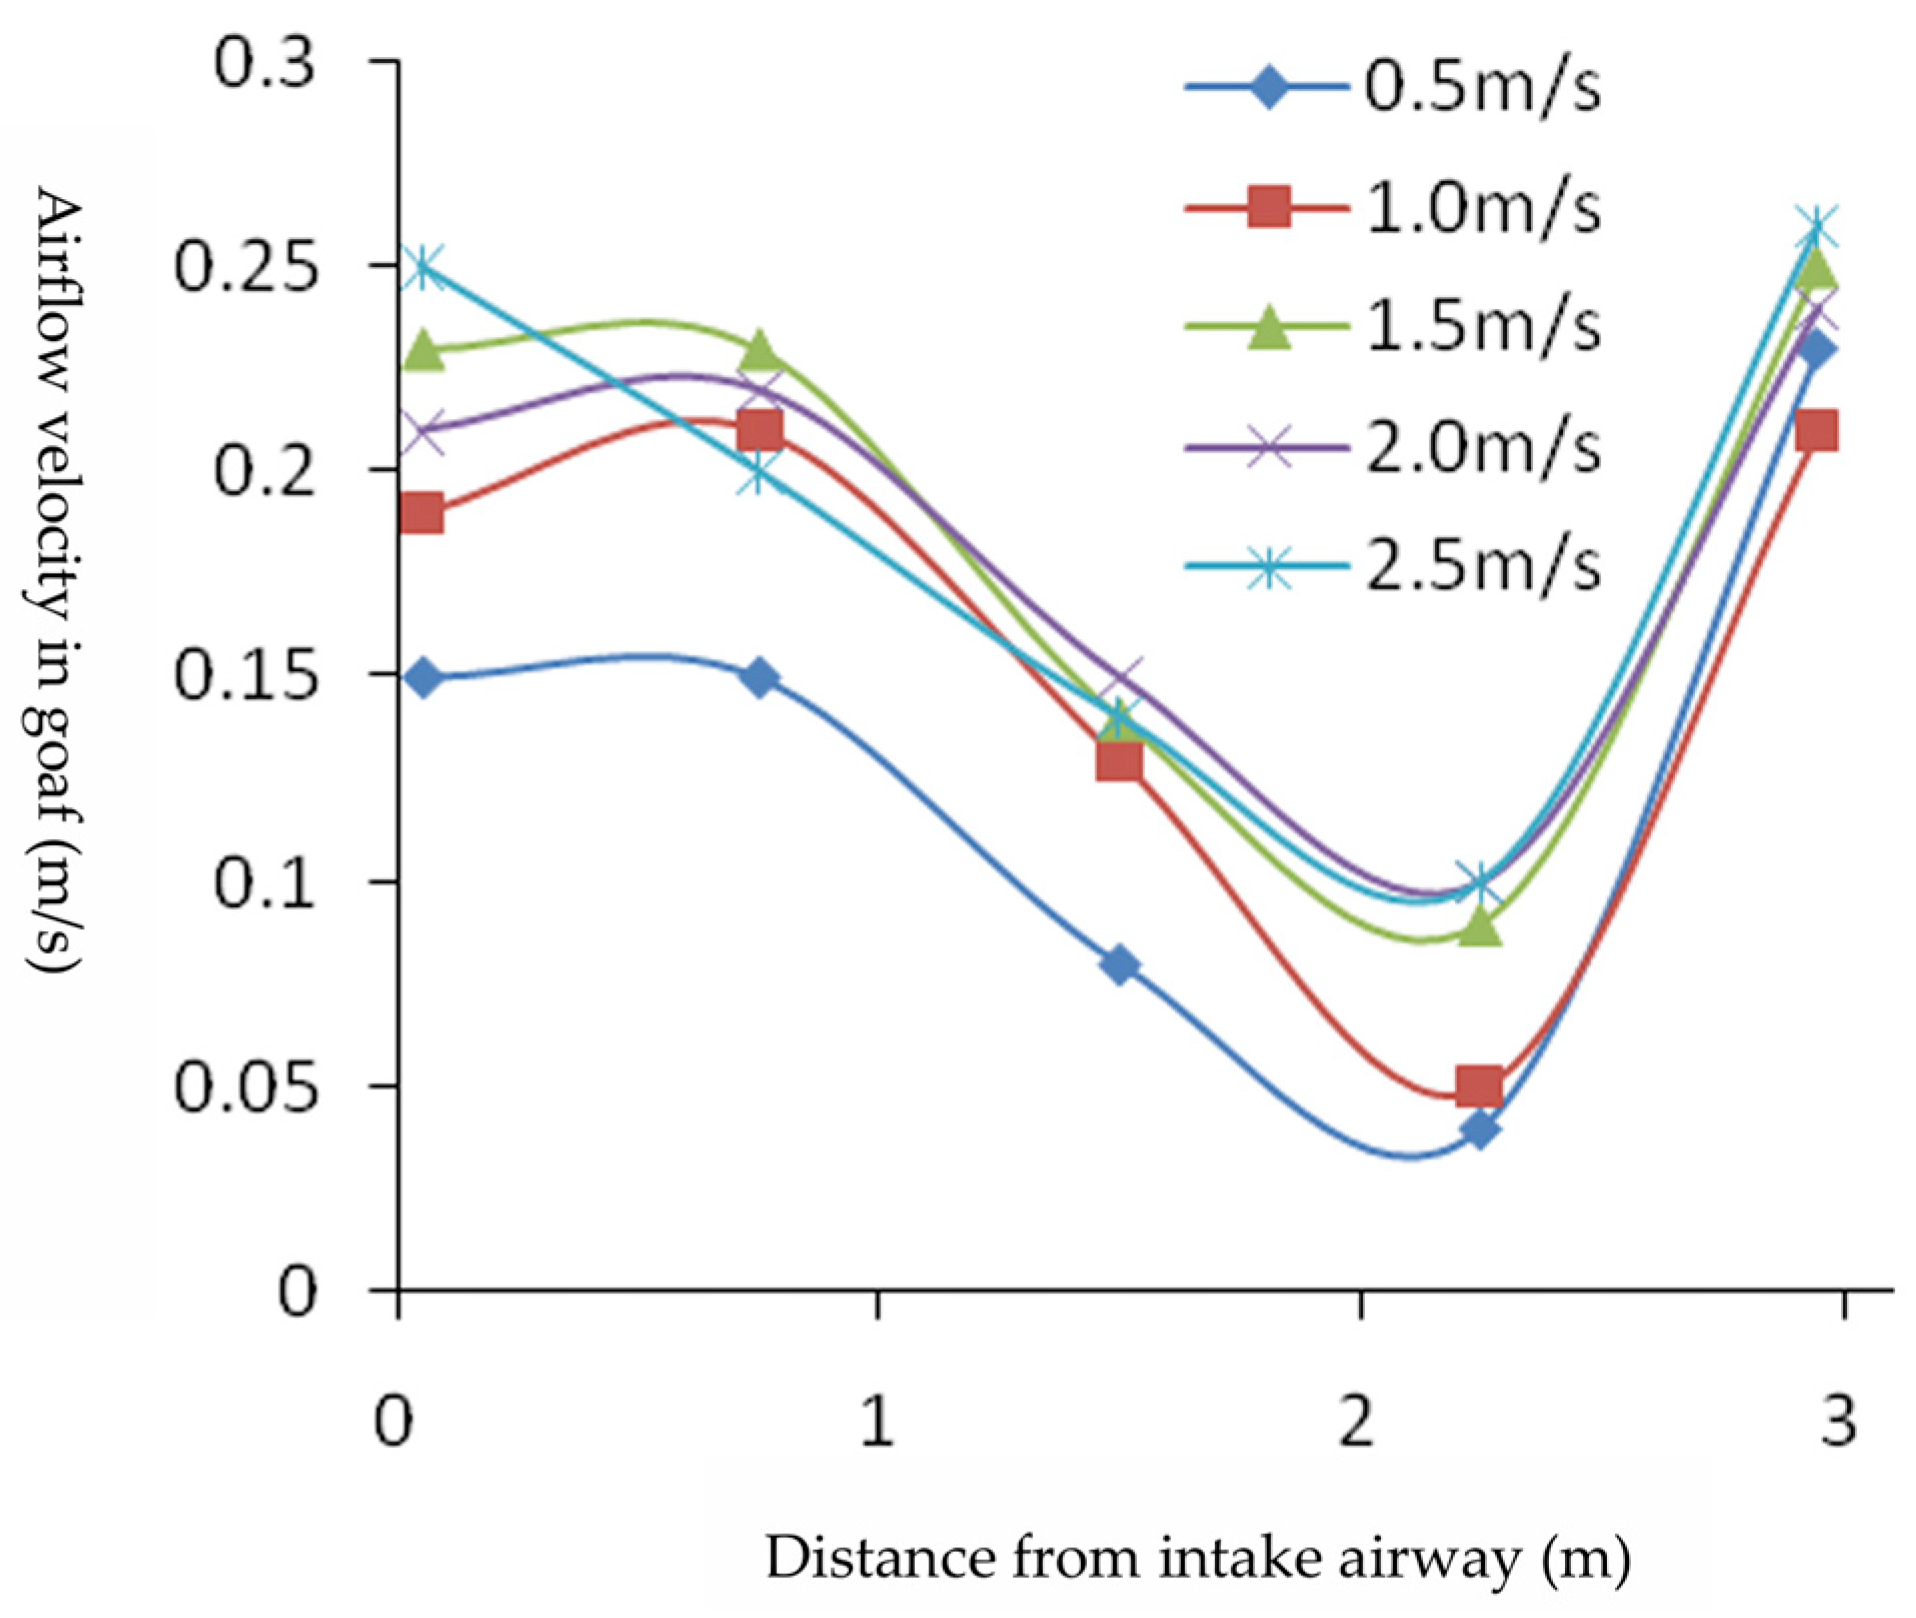
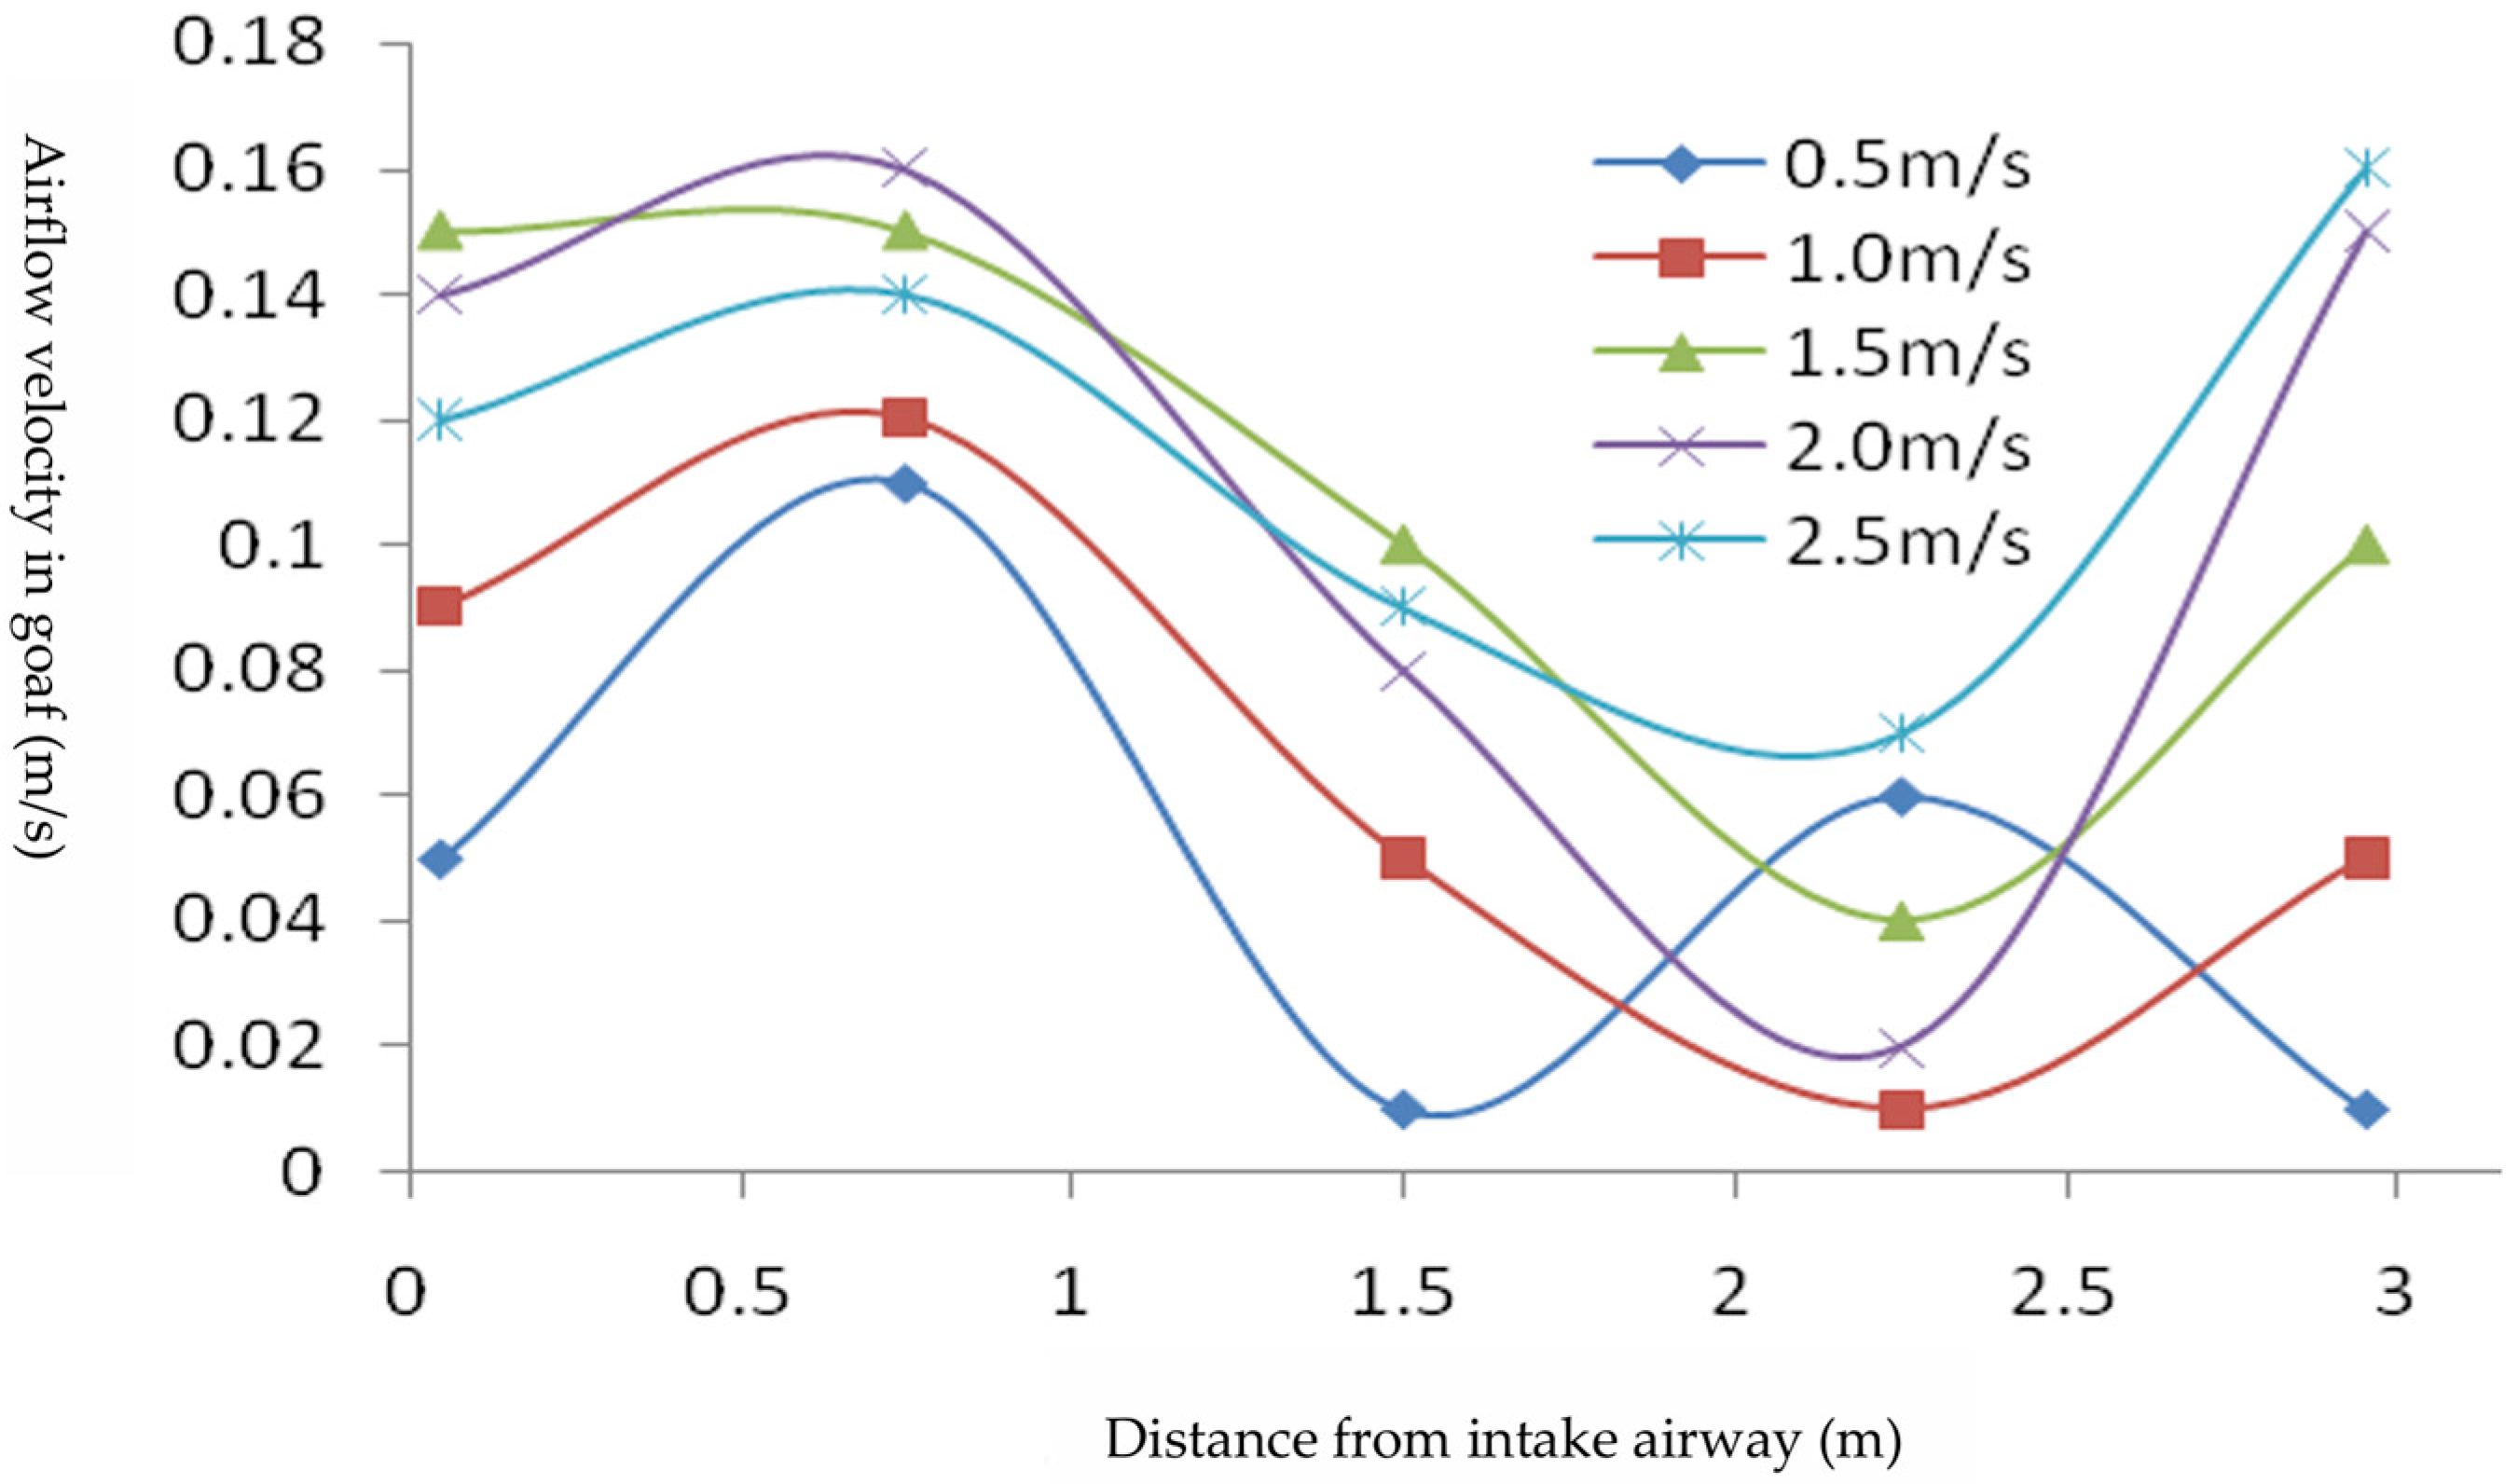
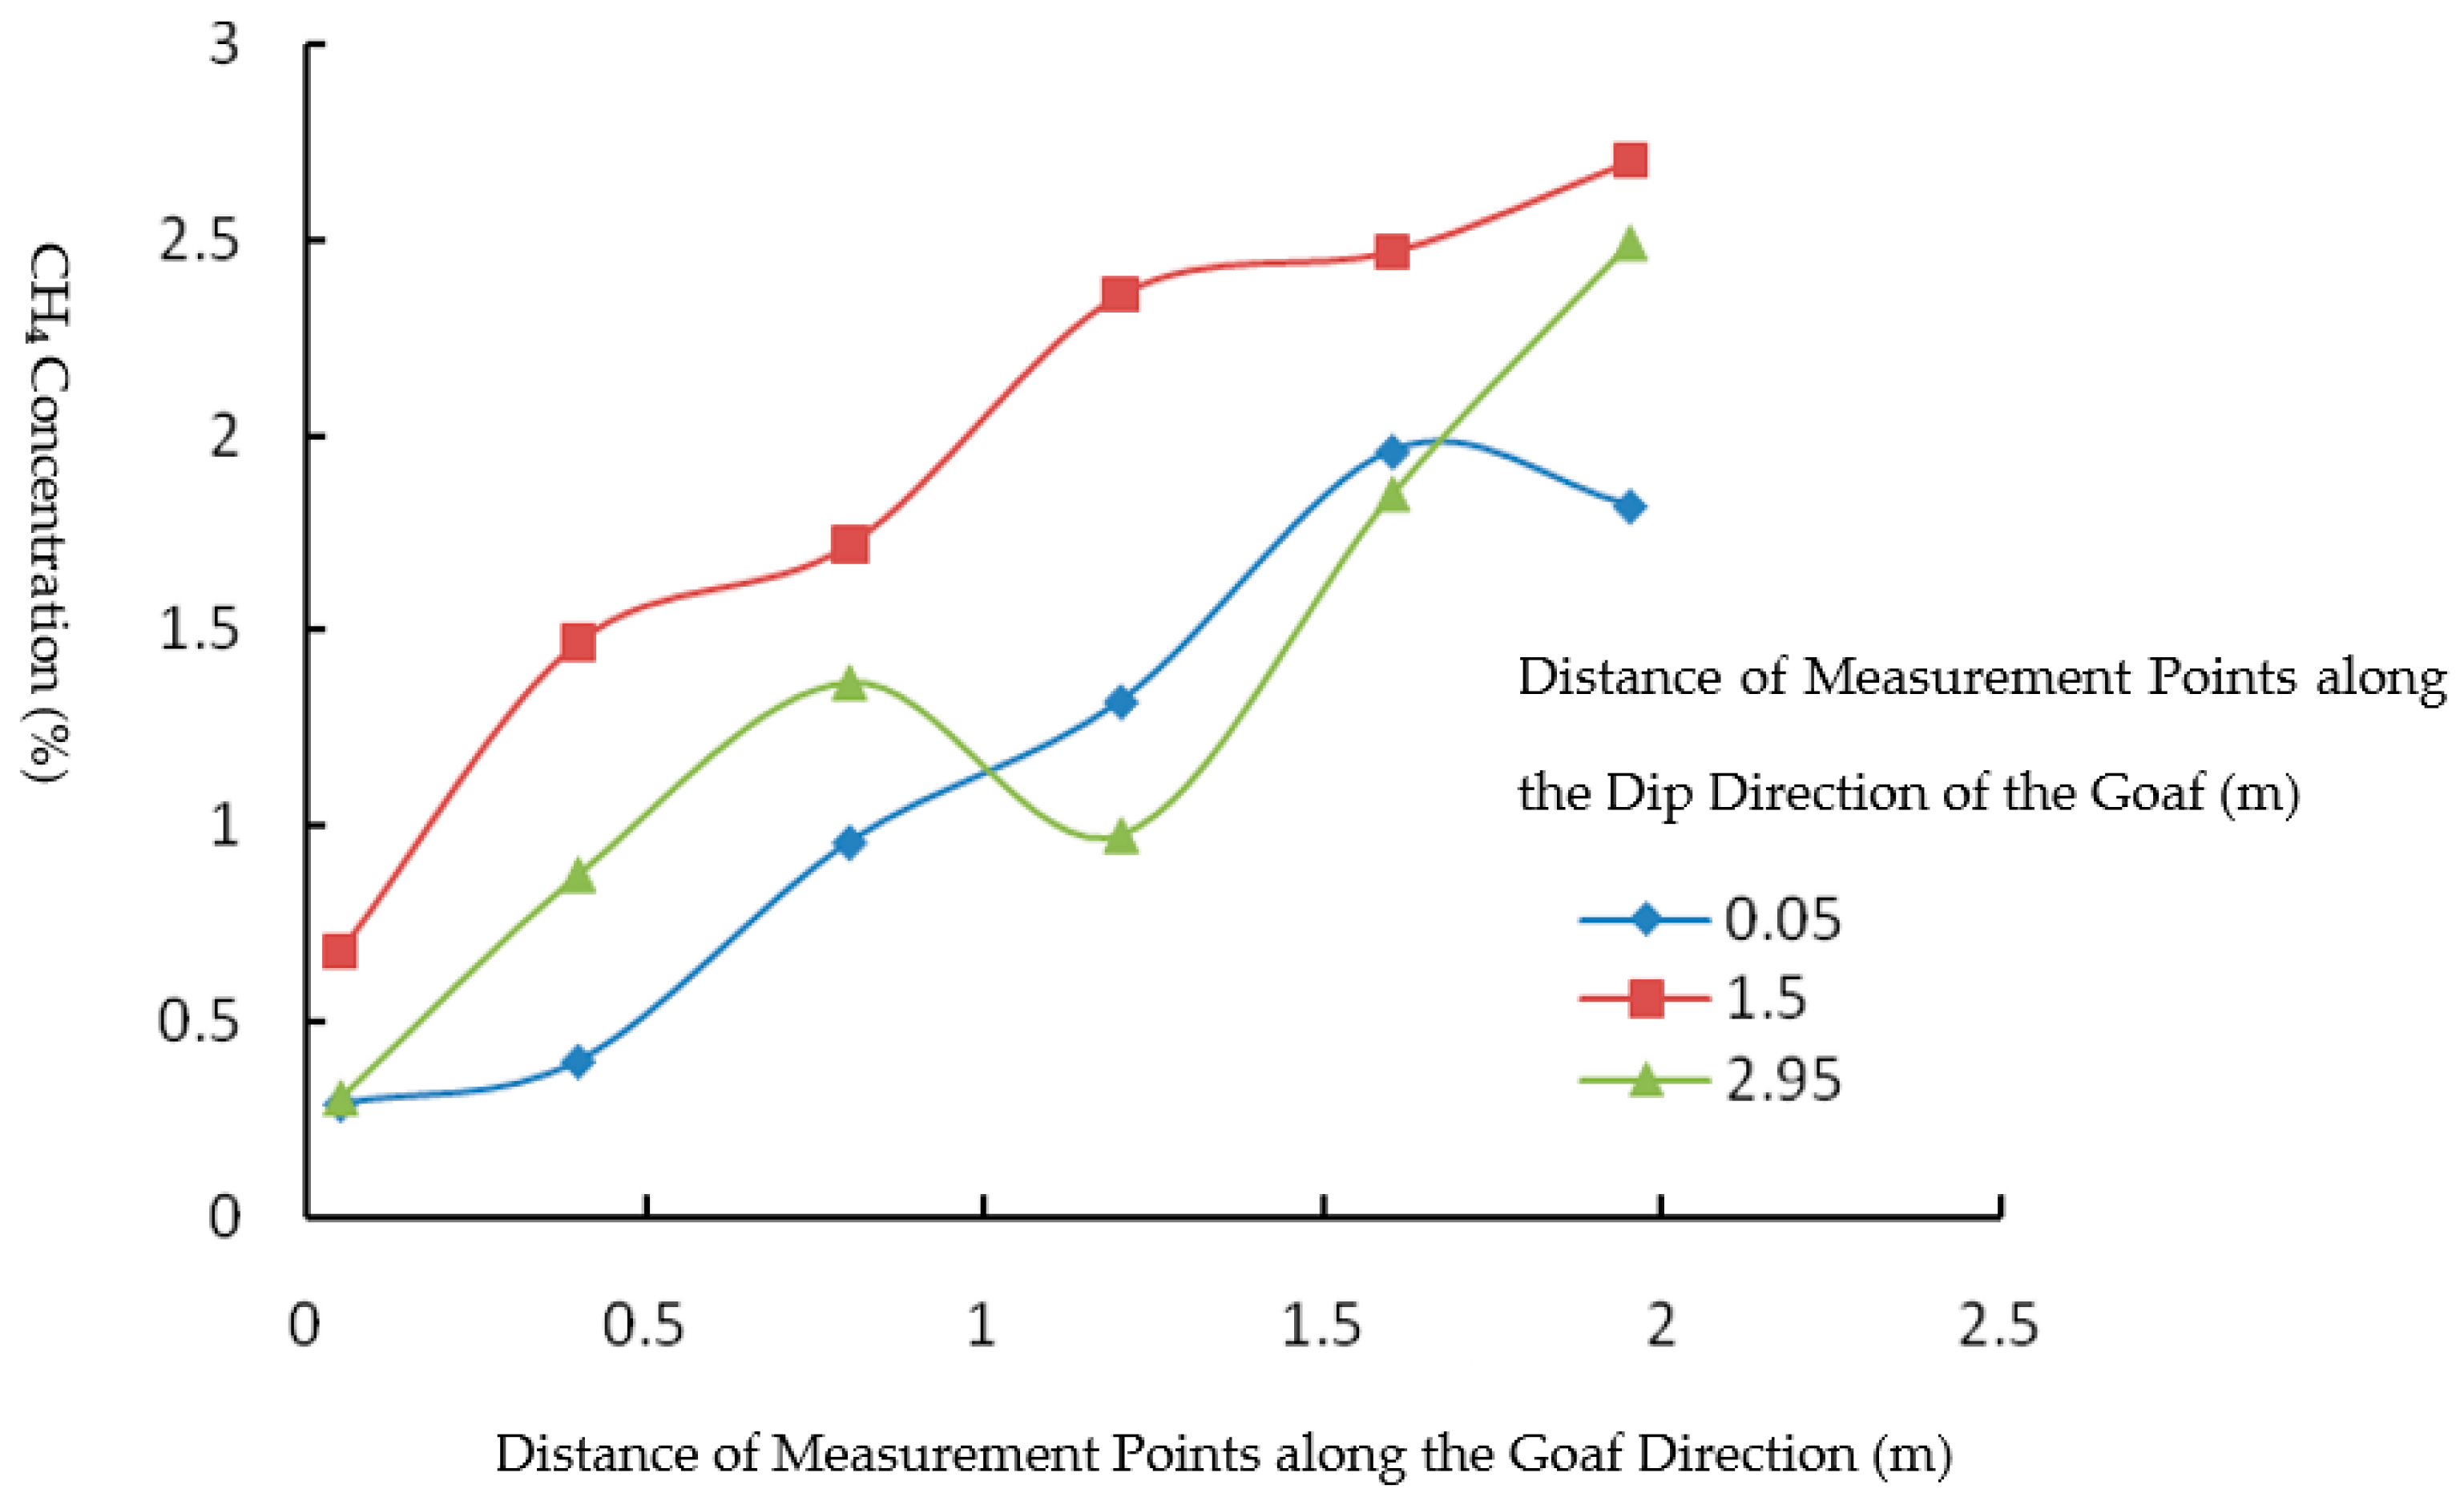
In the experiment, the “U” type ventilation mode was adopted to study the airflow velocity distribution patterns in the gob area under working face airflow velocities of 0.5 m/s, 1.0 m/s, 1.5 m/s, 2.0 m/s, and 2.5 m/s. Figure 11, Figure 12 and Figure 13 illustrate the airflow velocity distribution at sections 0.05 m and 0.8 m from the working face, along the strike direction, and at a section 1.5 m along the dip direction from the intake airway in the gob area. From the comparison of Figure 11, Figure 12 and Figure 13, it can be observed that, along the strike direction of the gob, the working face airflow velocity has a certain influence on the airflow distribution within the gob. Specifically, as the working face airflow velocity increases, the range of influence on the airflow in the heat dissipation zone expands, and the amplitude of airflow fluctuations increases. However, the influence on the airflow in the oxidation zone gradually diminishes, and there is essentially no effect on the airflow in the suffocation zone. Along the strike direction, the airflow velocity fluctuations are relatively small at the 0.05 m section near the working face, while the airflow velocity fluctuations are larger at the 0.8 m section; however, the velocity decreases significantly, with the influence nearly disappearing at 1.6 m from the working face. In the heat dissipation zone, along the dip direction of the gob, the airflow has a greater impact at the junctions of the intake and return airways with the gob area, while the influence on the intermediate areas is less pronounced.
5.2. Measured Analysis of CH4 Concentration in the Gob and Upper Corner Under Different Airflow Velocities

5.2.1. Measured Analysis of CH4 Concentration in the Gob Under Different Airflow Velocities

During the experiment, the control valves for pipelines Nos. 6 and 7 are first opened to achieve a total gas flow rate of 0.6 L/min for these pipelines. After 20 min of gas supply, the control valves for pipelines Nos. 4 and 5 are opened to achieve a total gas flow rate of 1.0 L/min for these pipelines. After 30 min of gas supply, the control valves for pipelines Nos. 1, 2, and 3 are opened to achieve a total gas flow rate of 1.5 L/min for these pipelines. When the CH4 concentration in Zone I reaches 3%, the gas concentrations in all zones are maintained at a constant level. After the CH4 concentration in all zones stabilizes at a constant level for 10 min, the exhaust fan is activated to establish the ”U” type ventilation mode for the fully mechanized top-coal caving face, with airflow velocities set at 0.5 m/s, 1.0 m/s, 1.5 m/s, 2.0 m/s, and 2.5 m/s. The migration patterns of CH4 in the gob were studied, and a plane 50 mm above the model base was selected as the representative plane for CH4 concentration analysis. In the following figures, the coordinate origin is defined as the vertical projection of the intersection line between the working face and the intake airway wall onto the plane 50 mm above the model base. The horizontal axis represents the distance from the origin along the dip (or strike) direction of the gob, and the vertical axis represents the CH4 concentration at the measurement points in the gob (this applies to all subsequent figures).
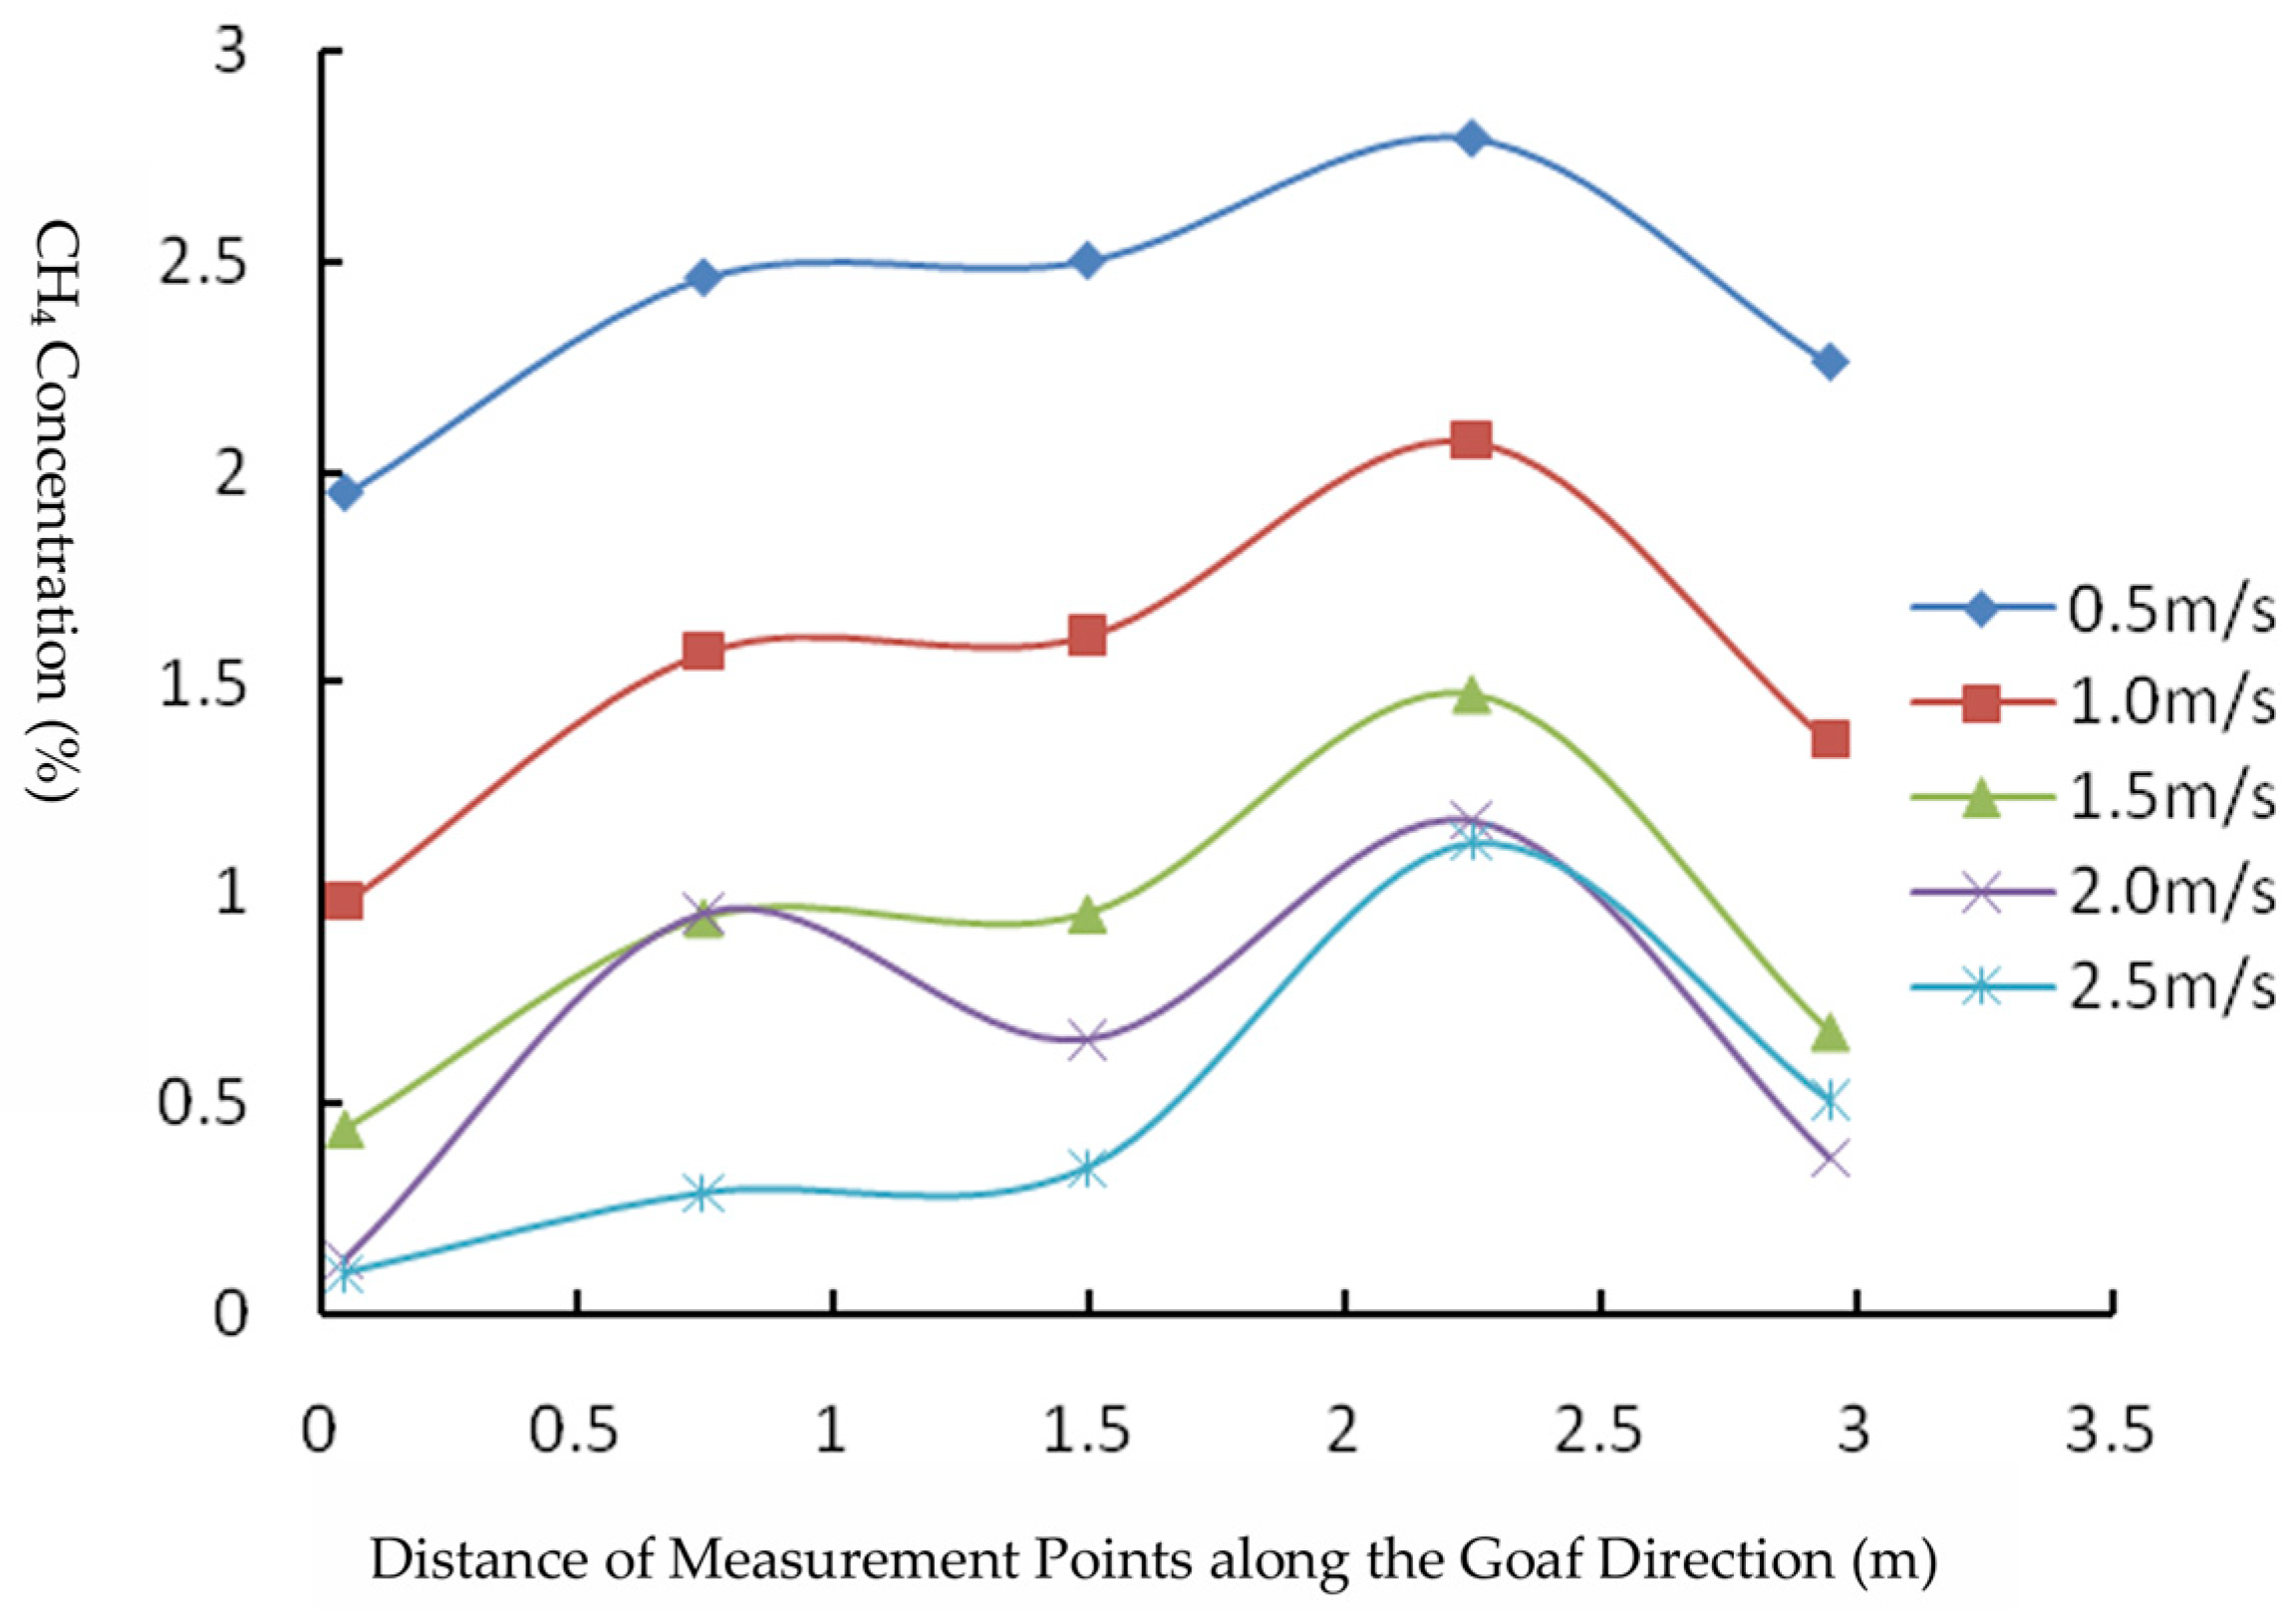
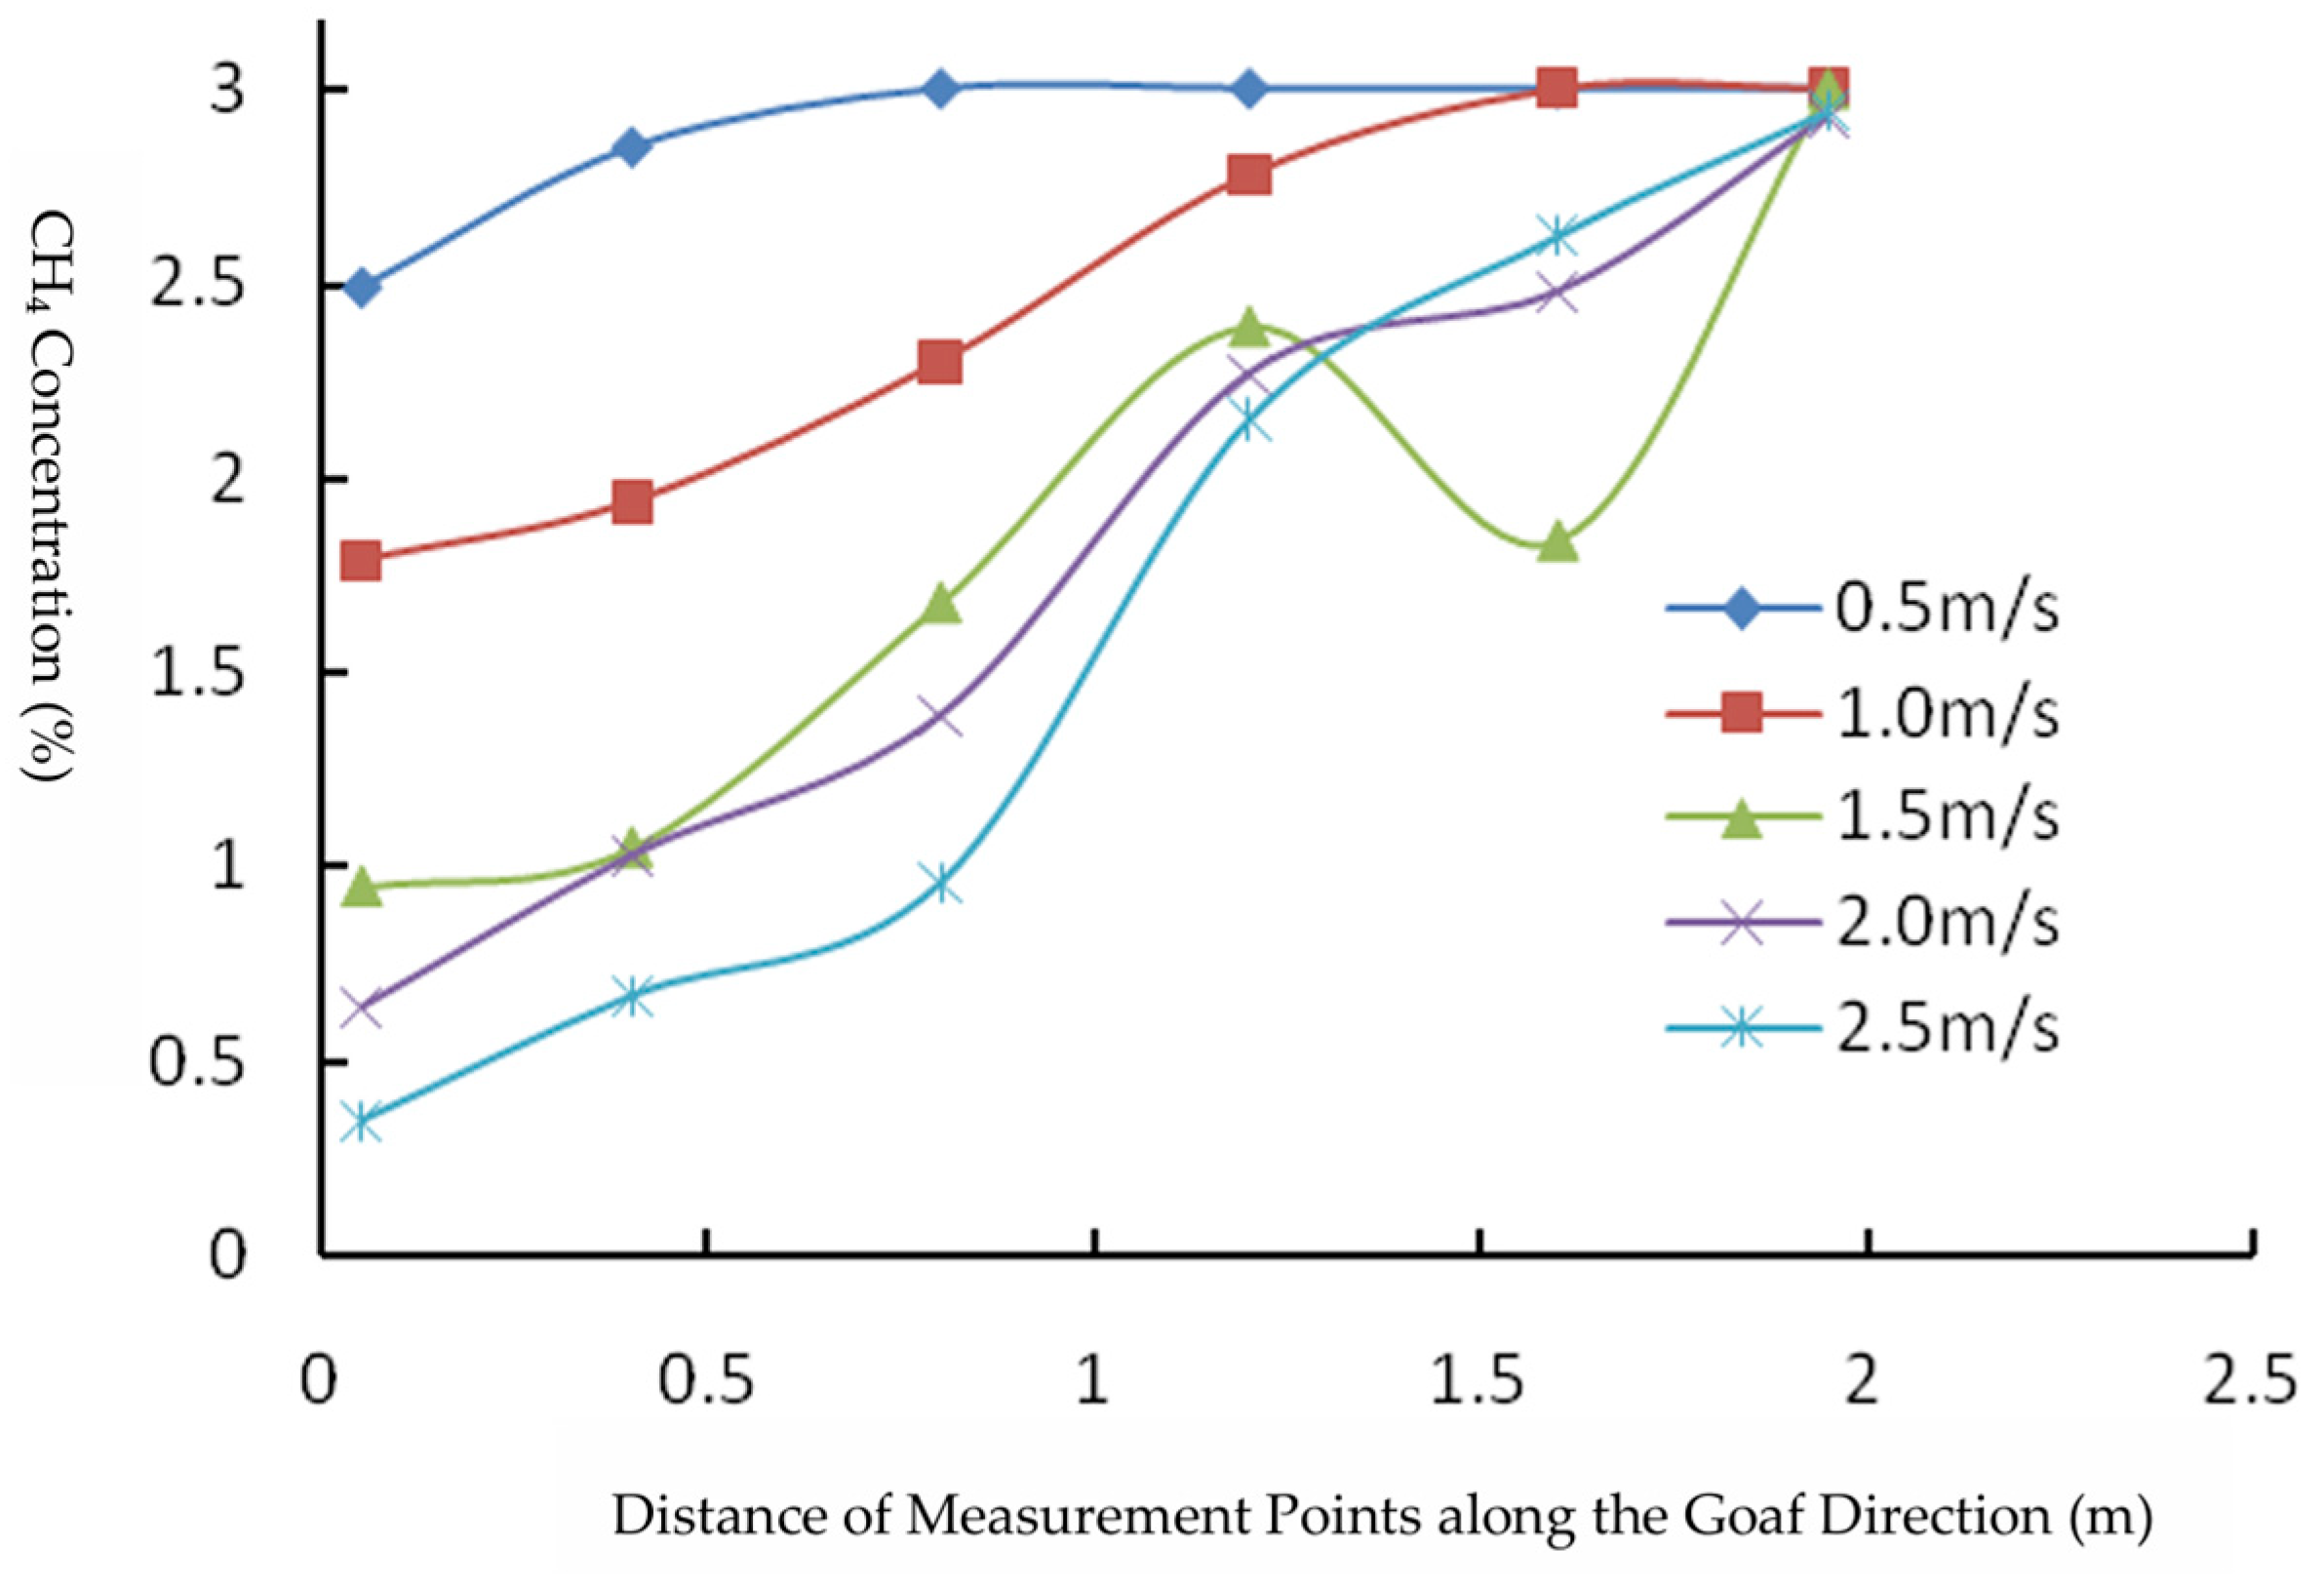
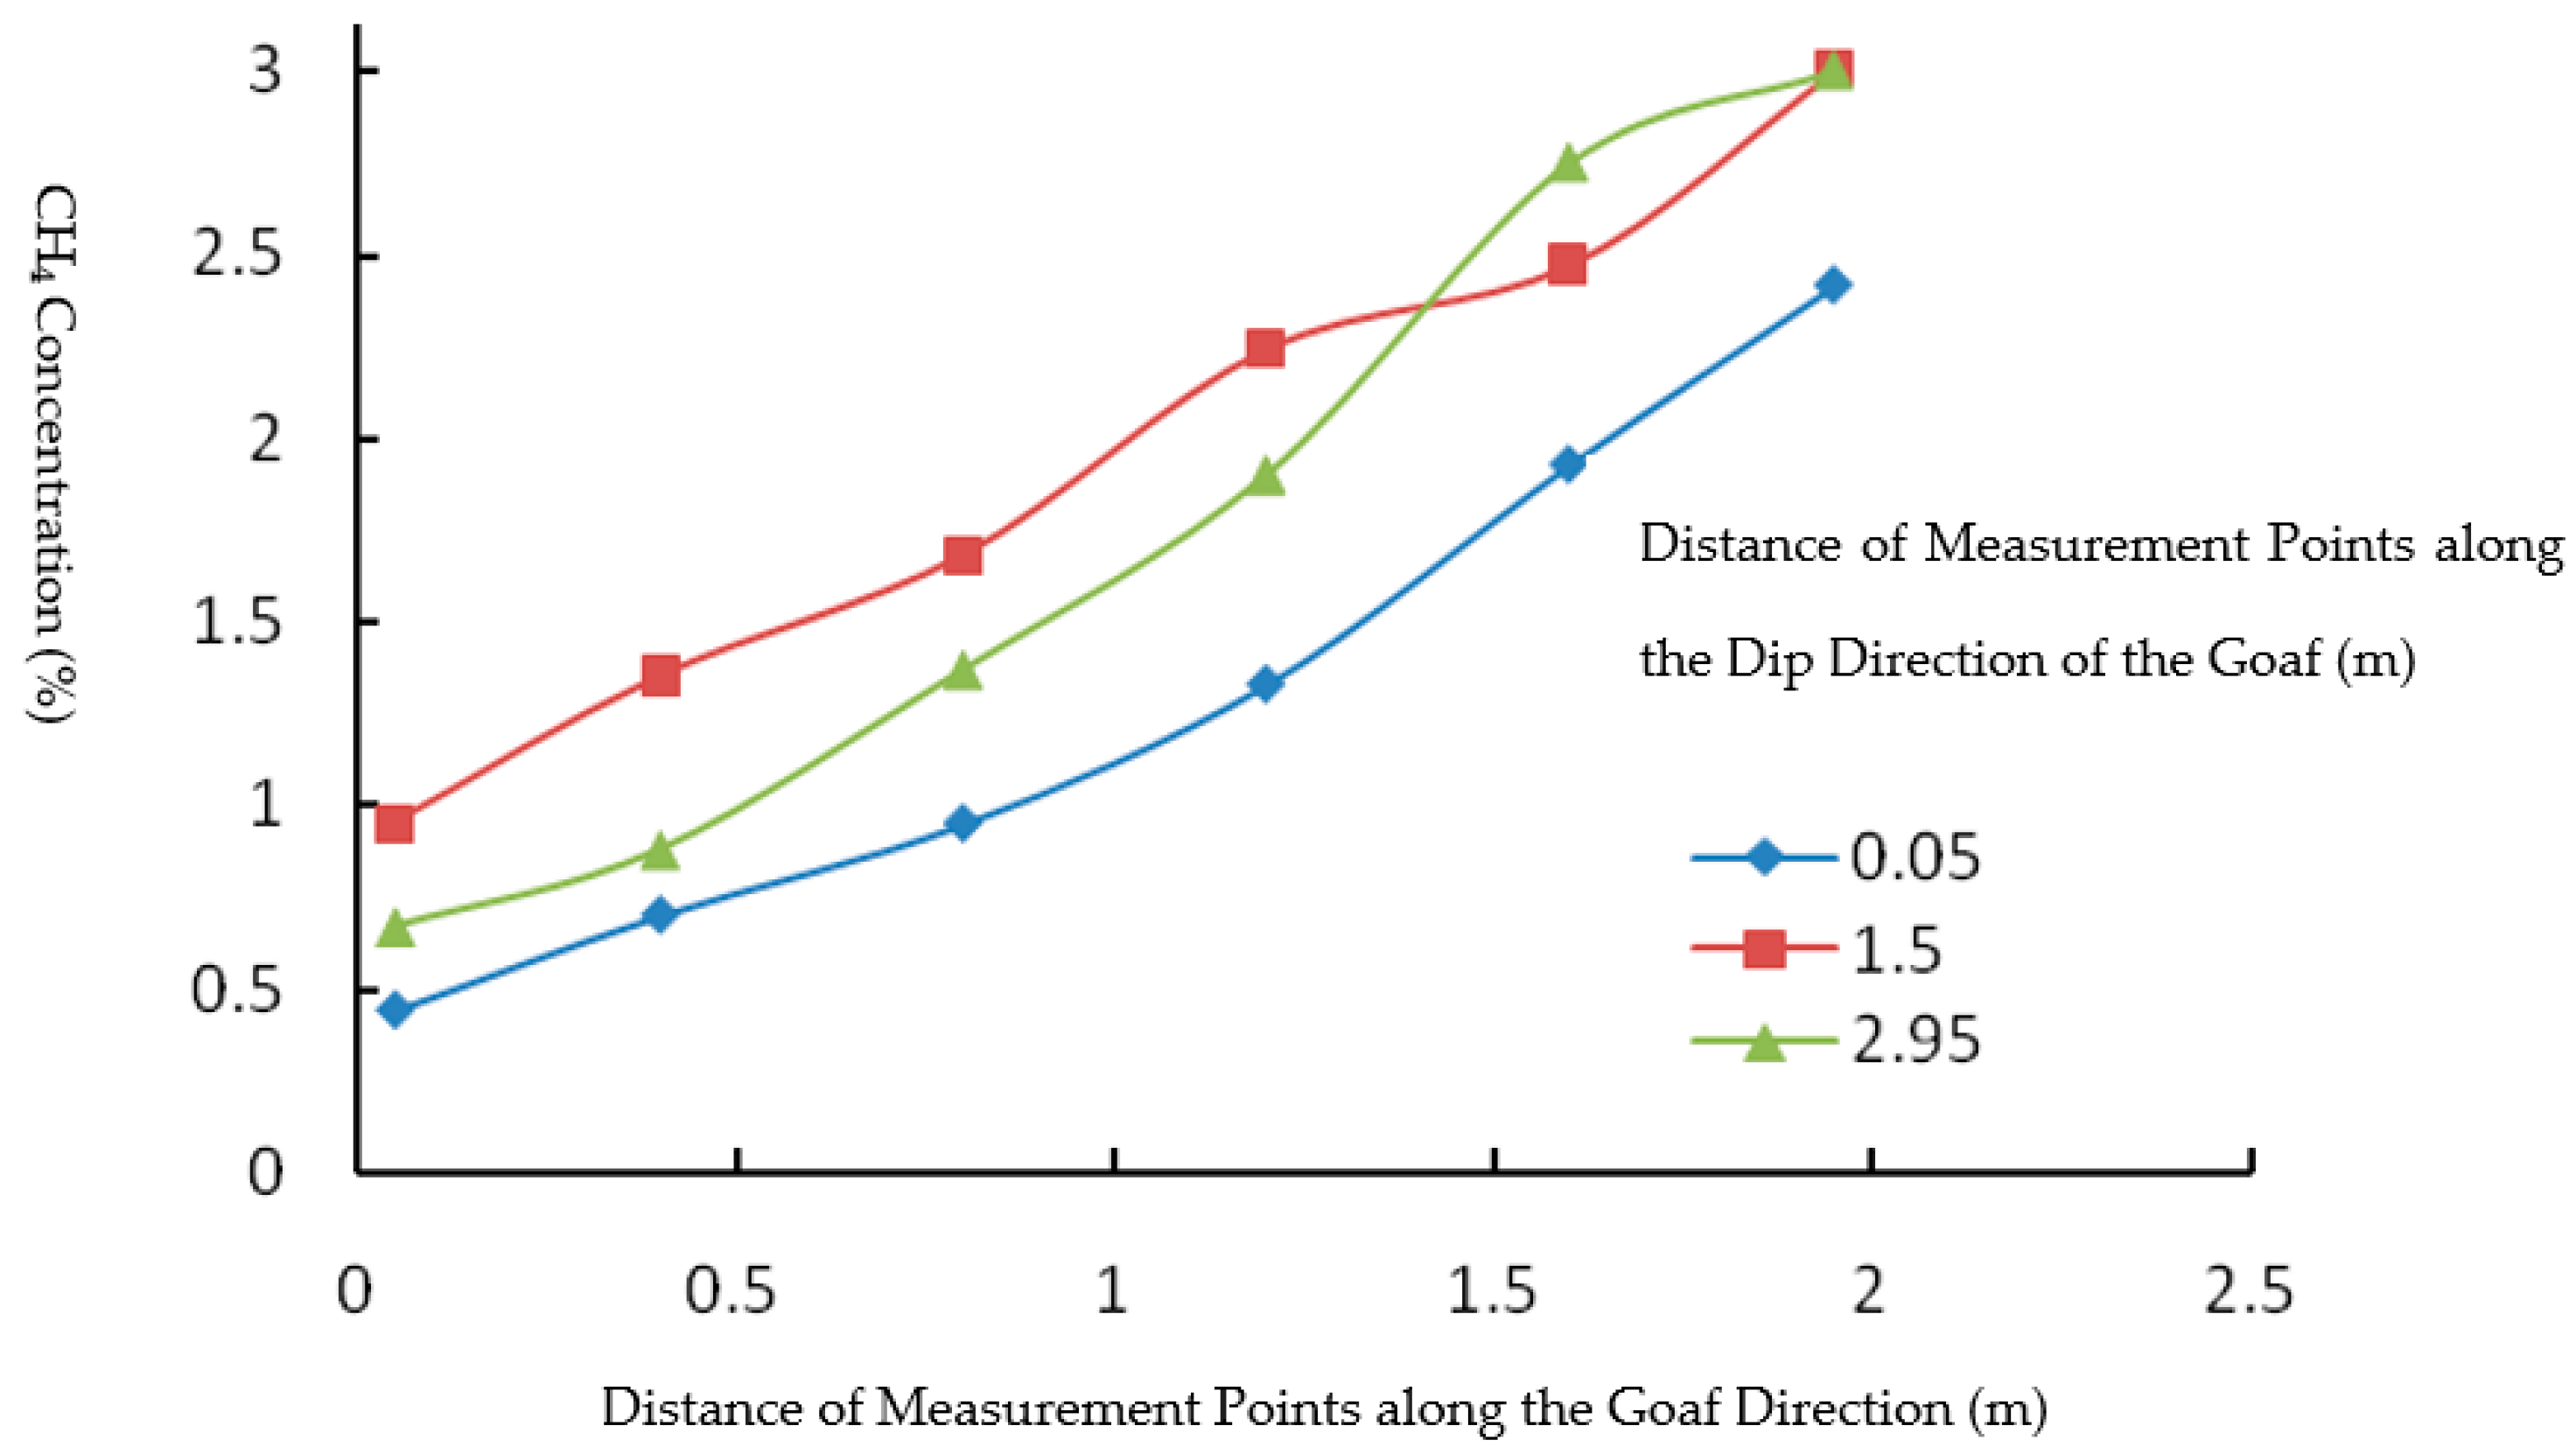
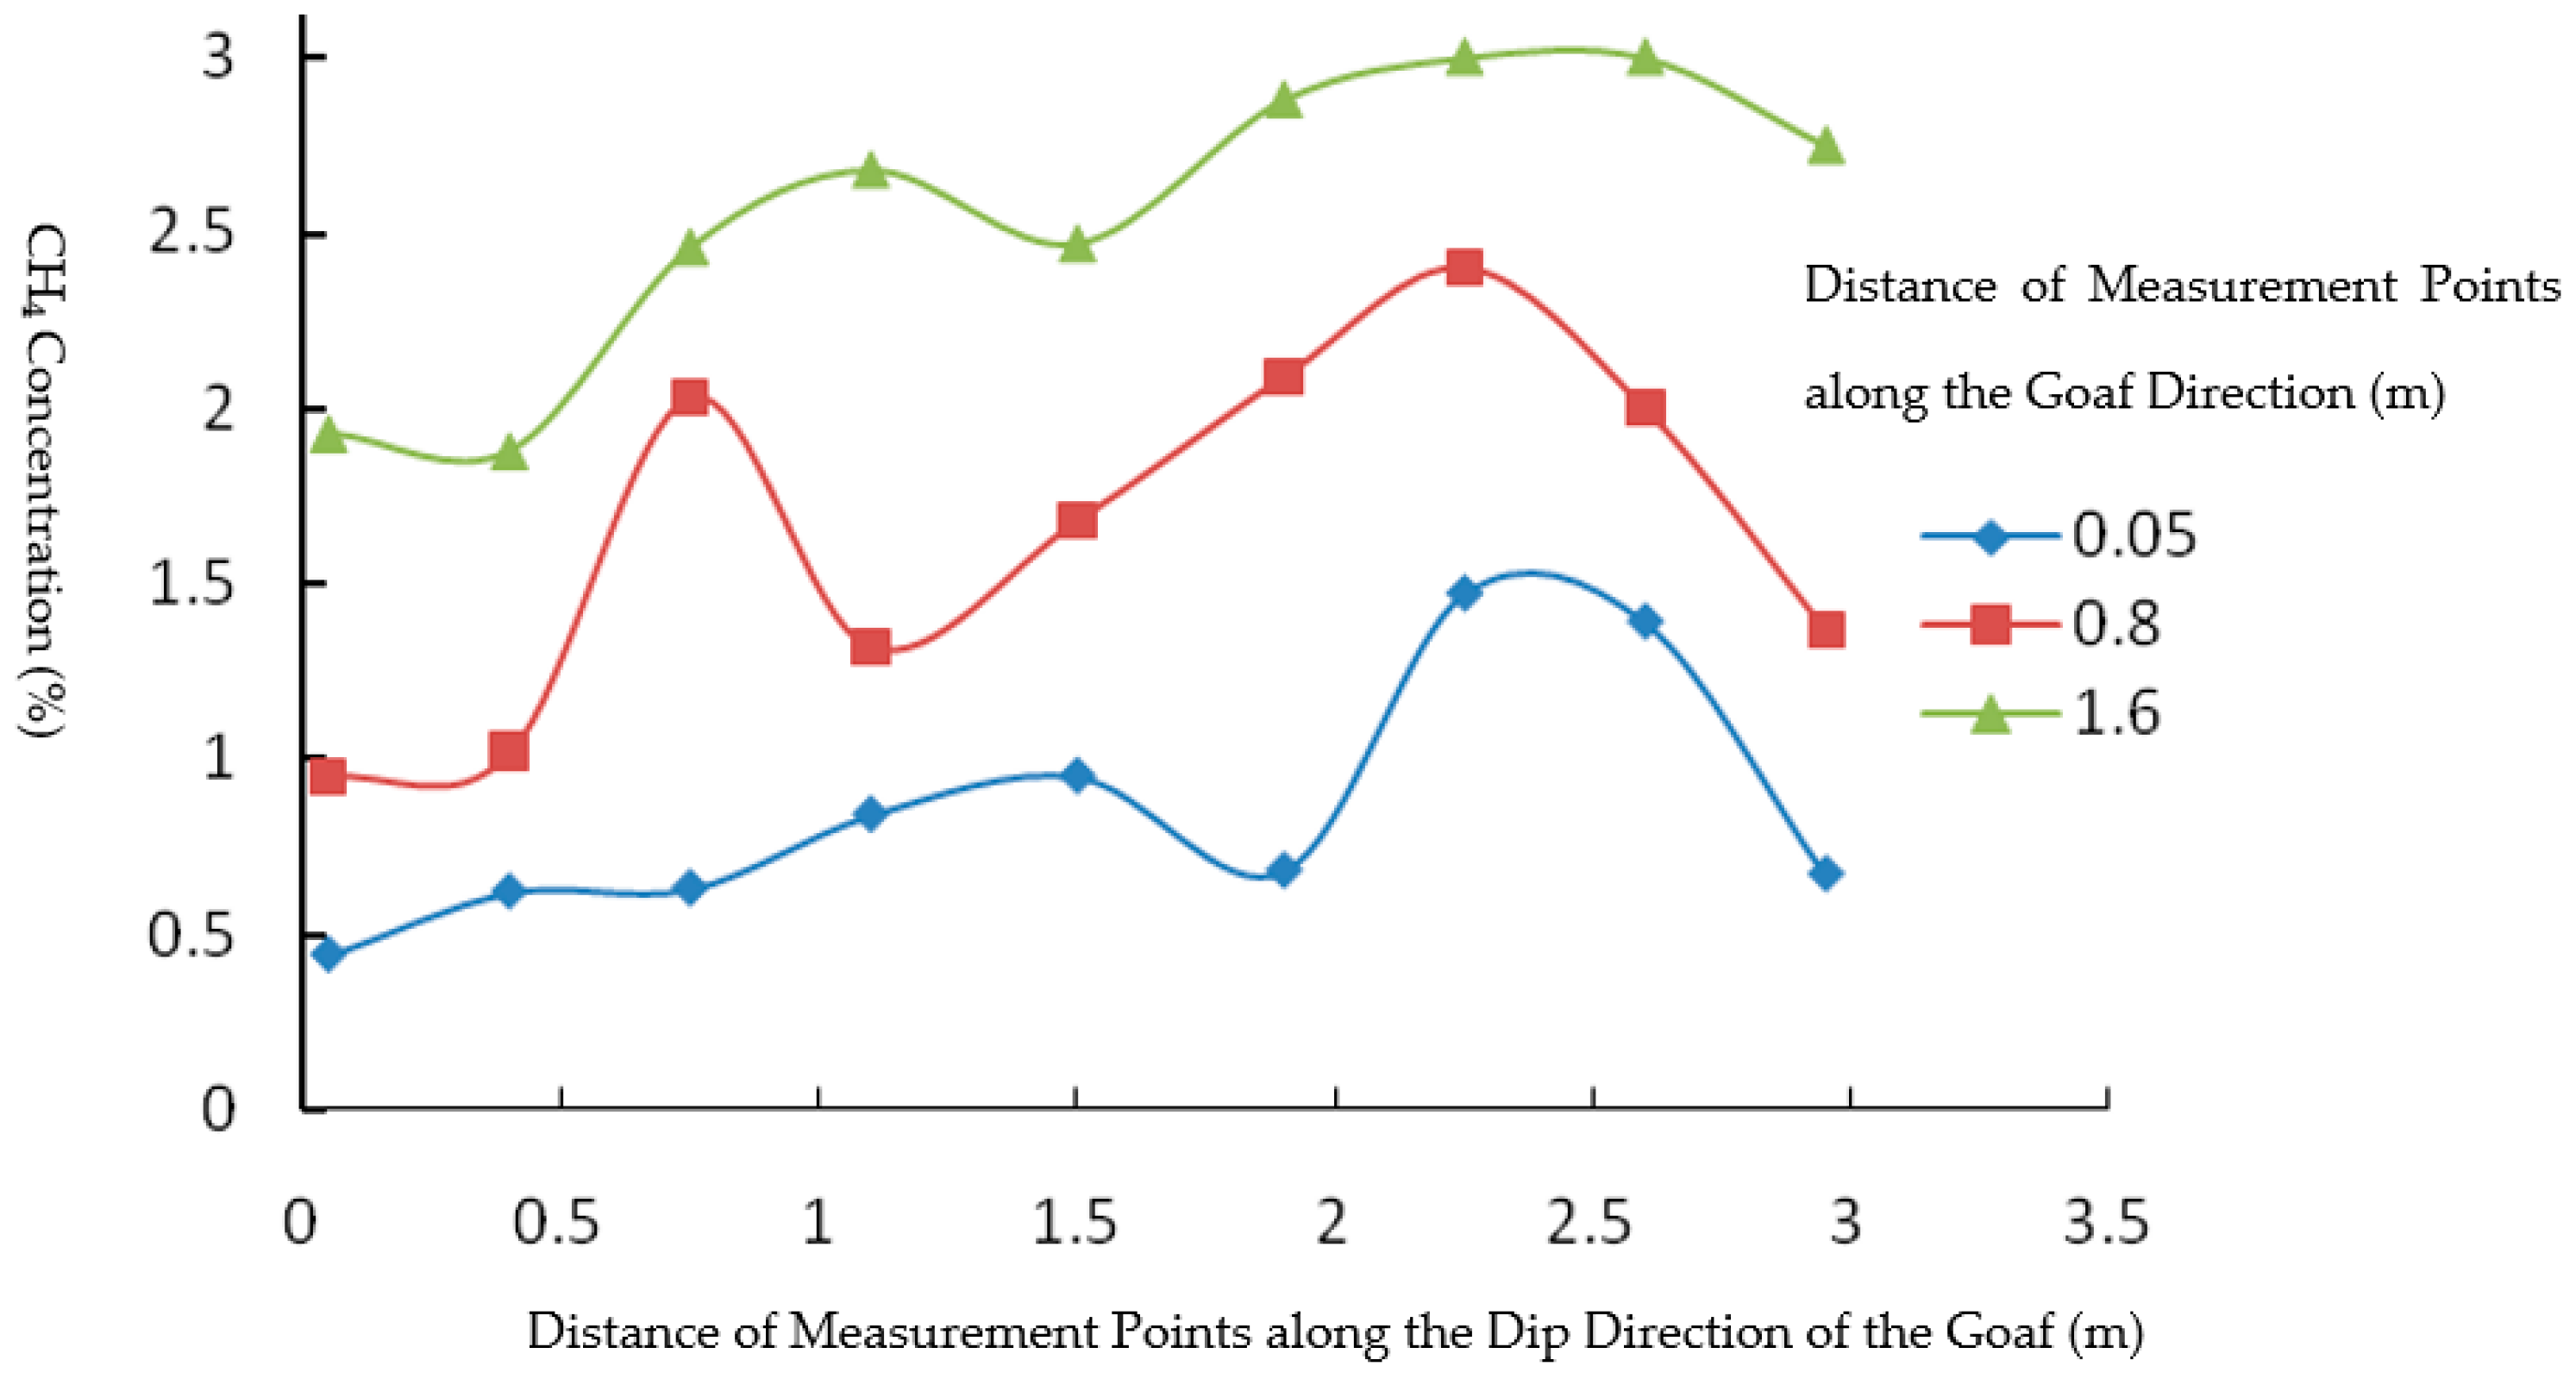
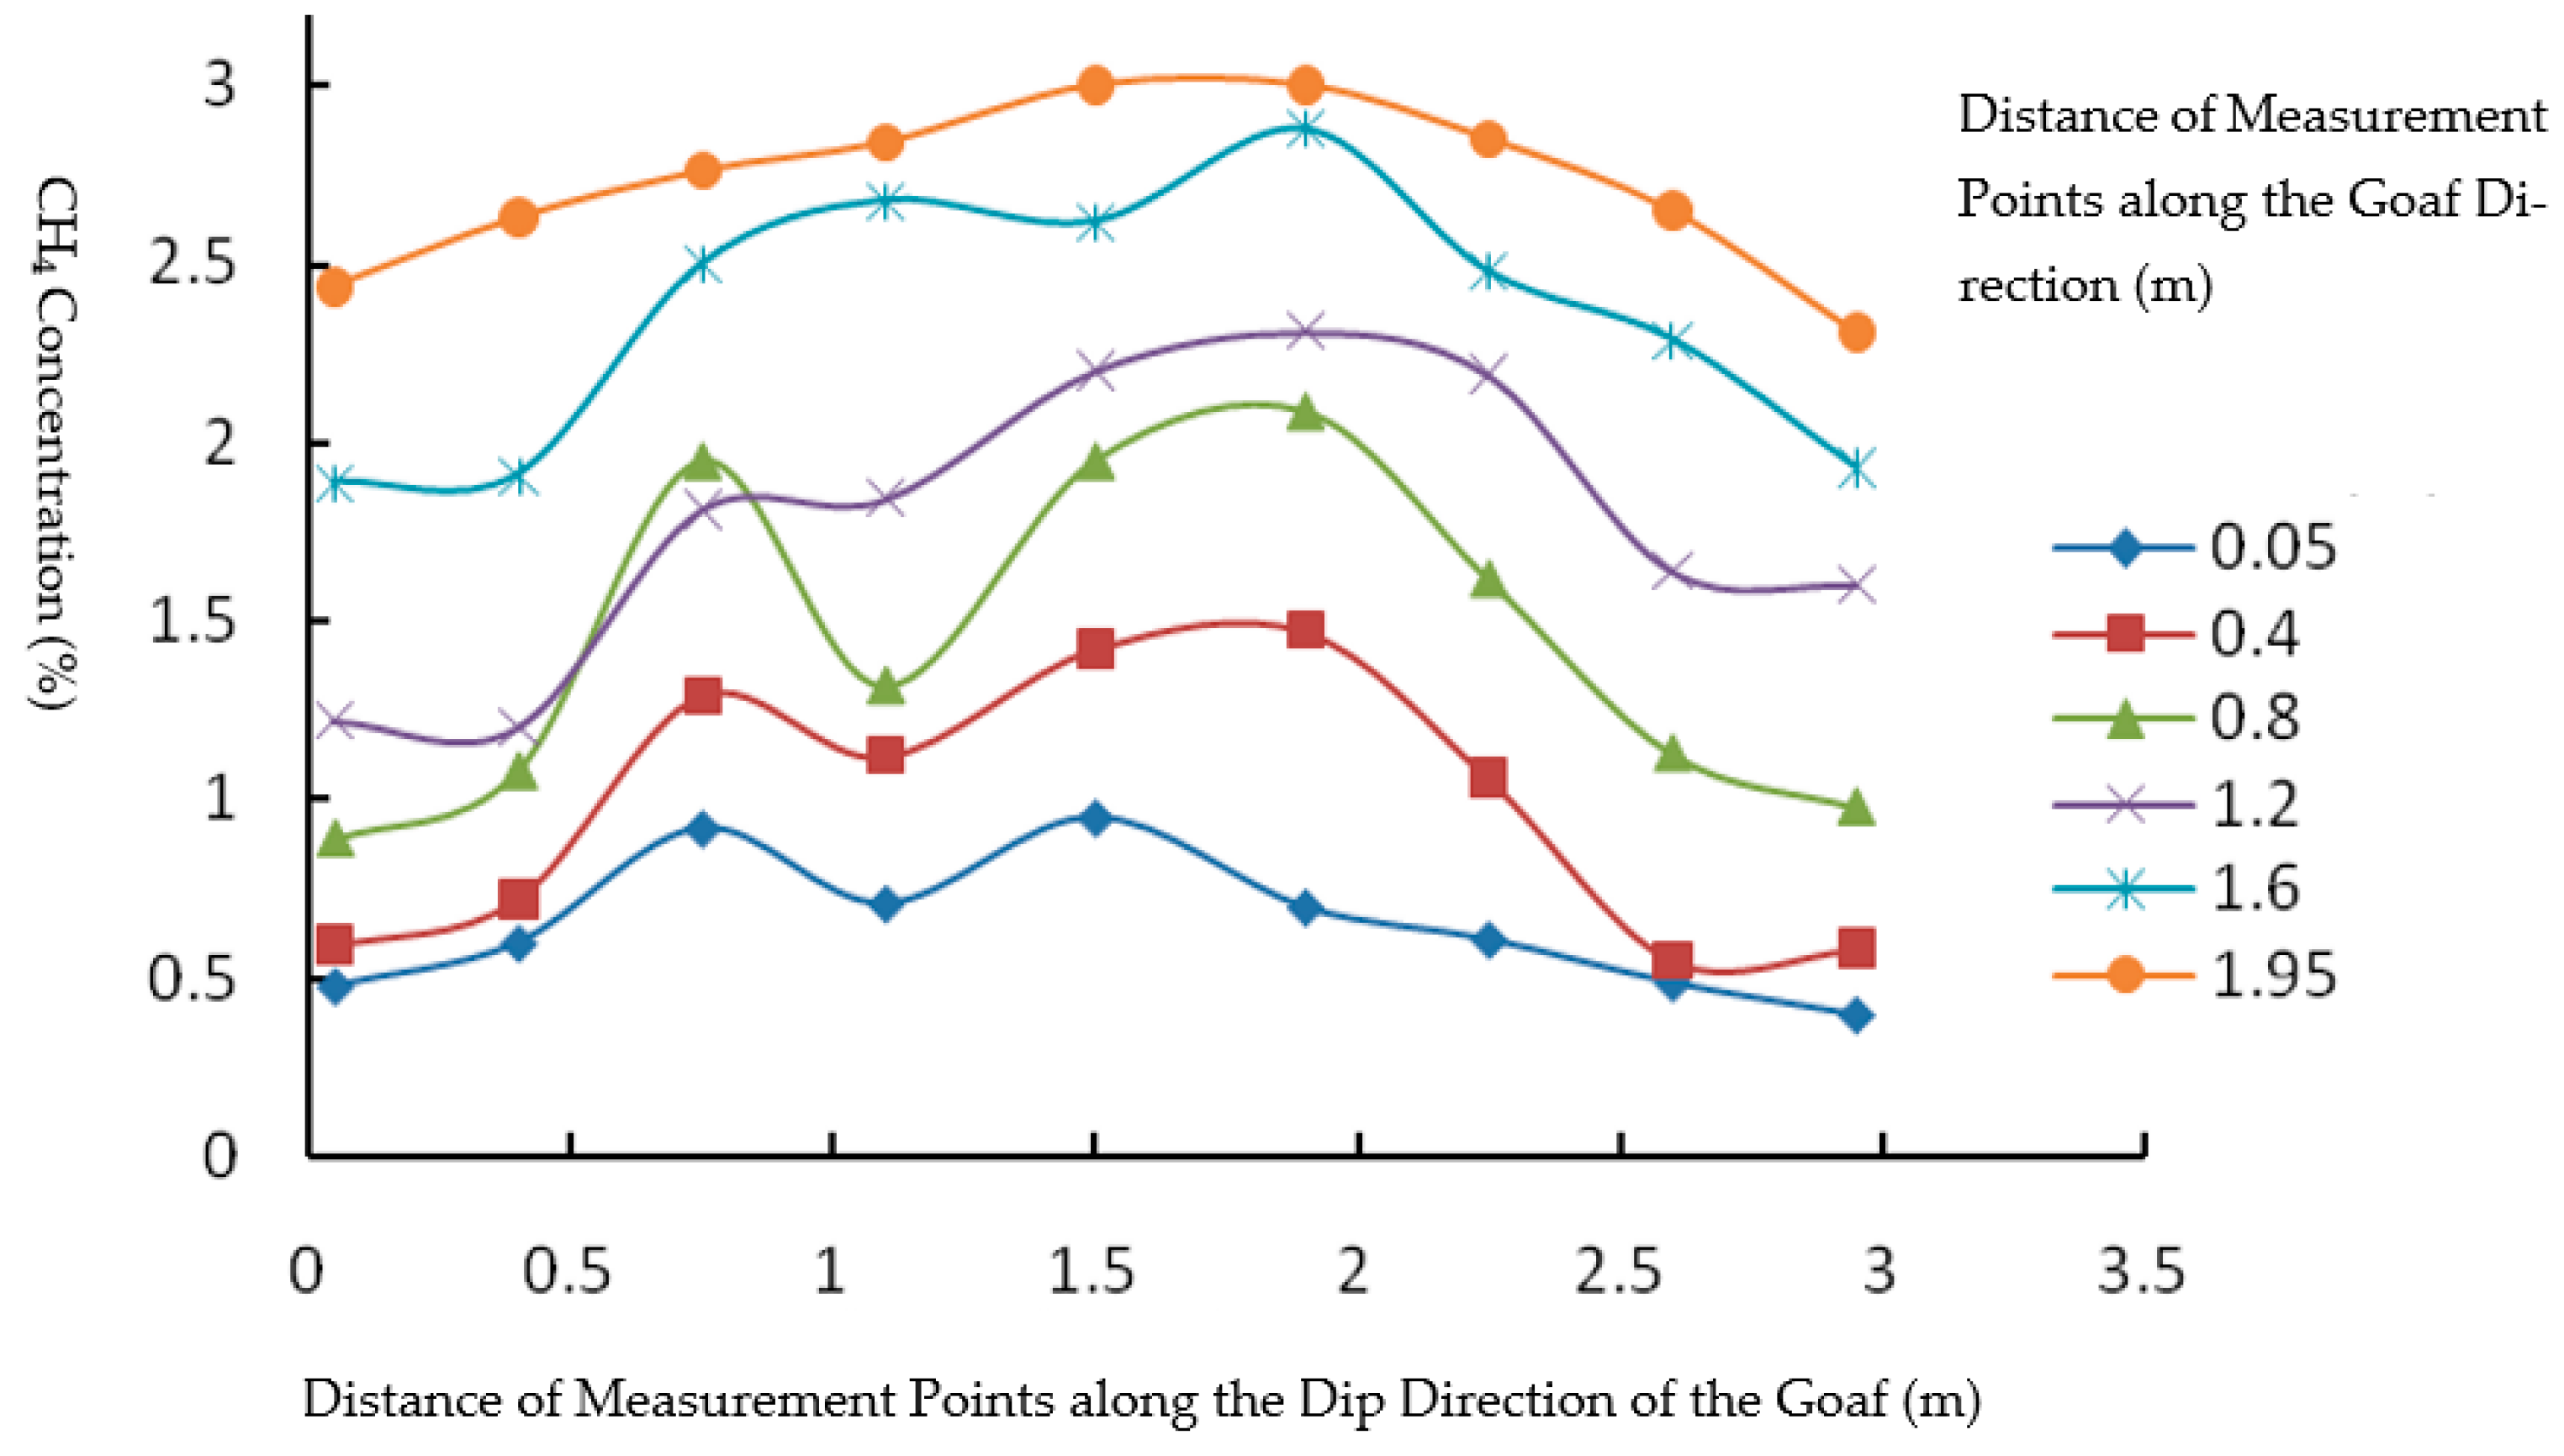
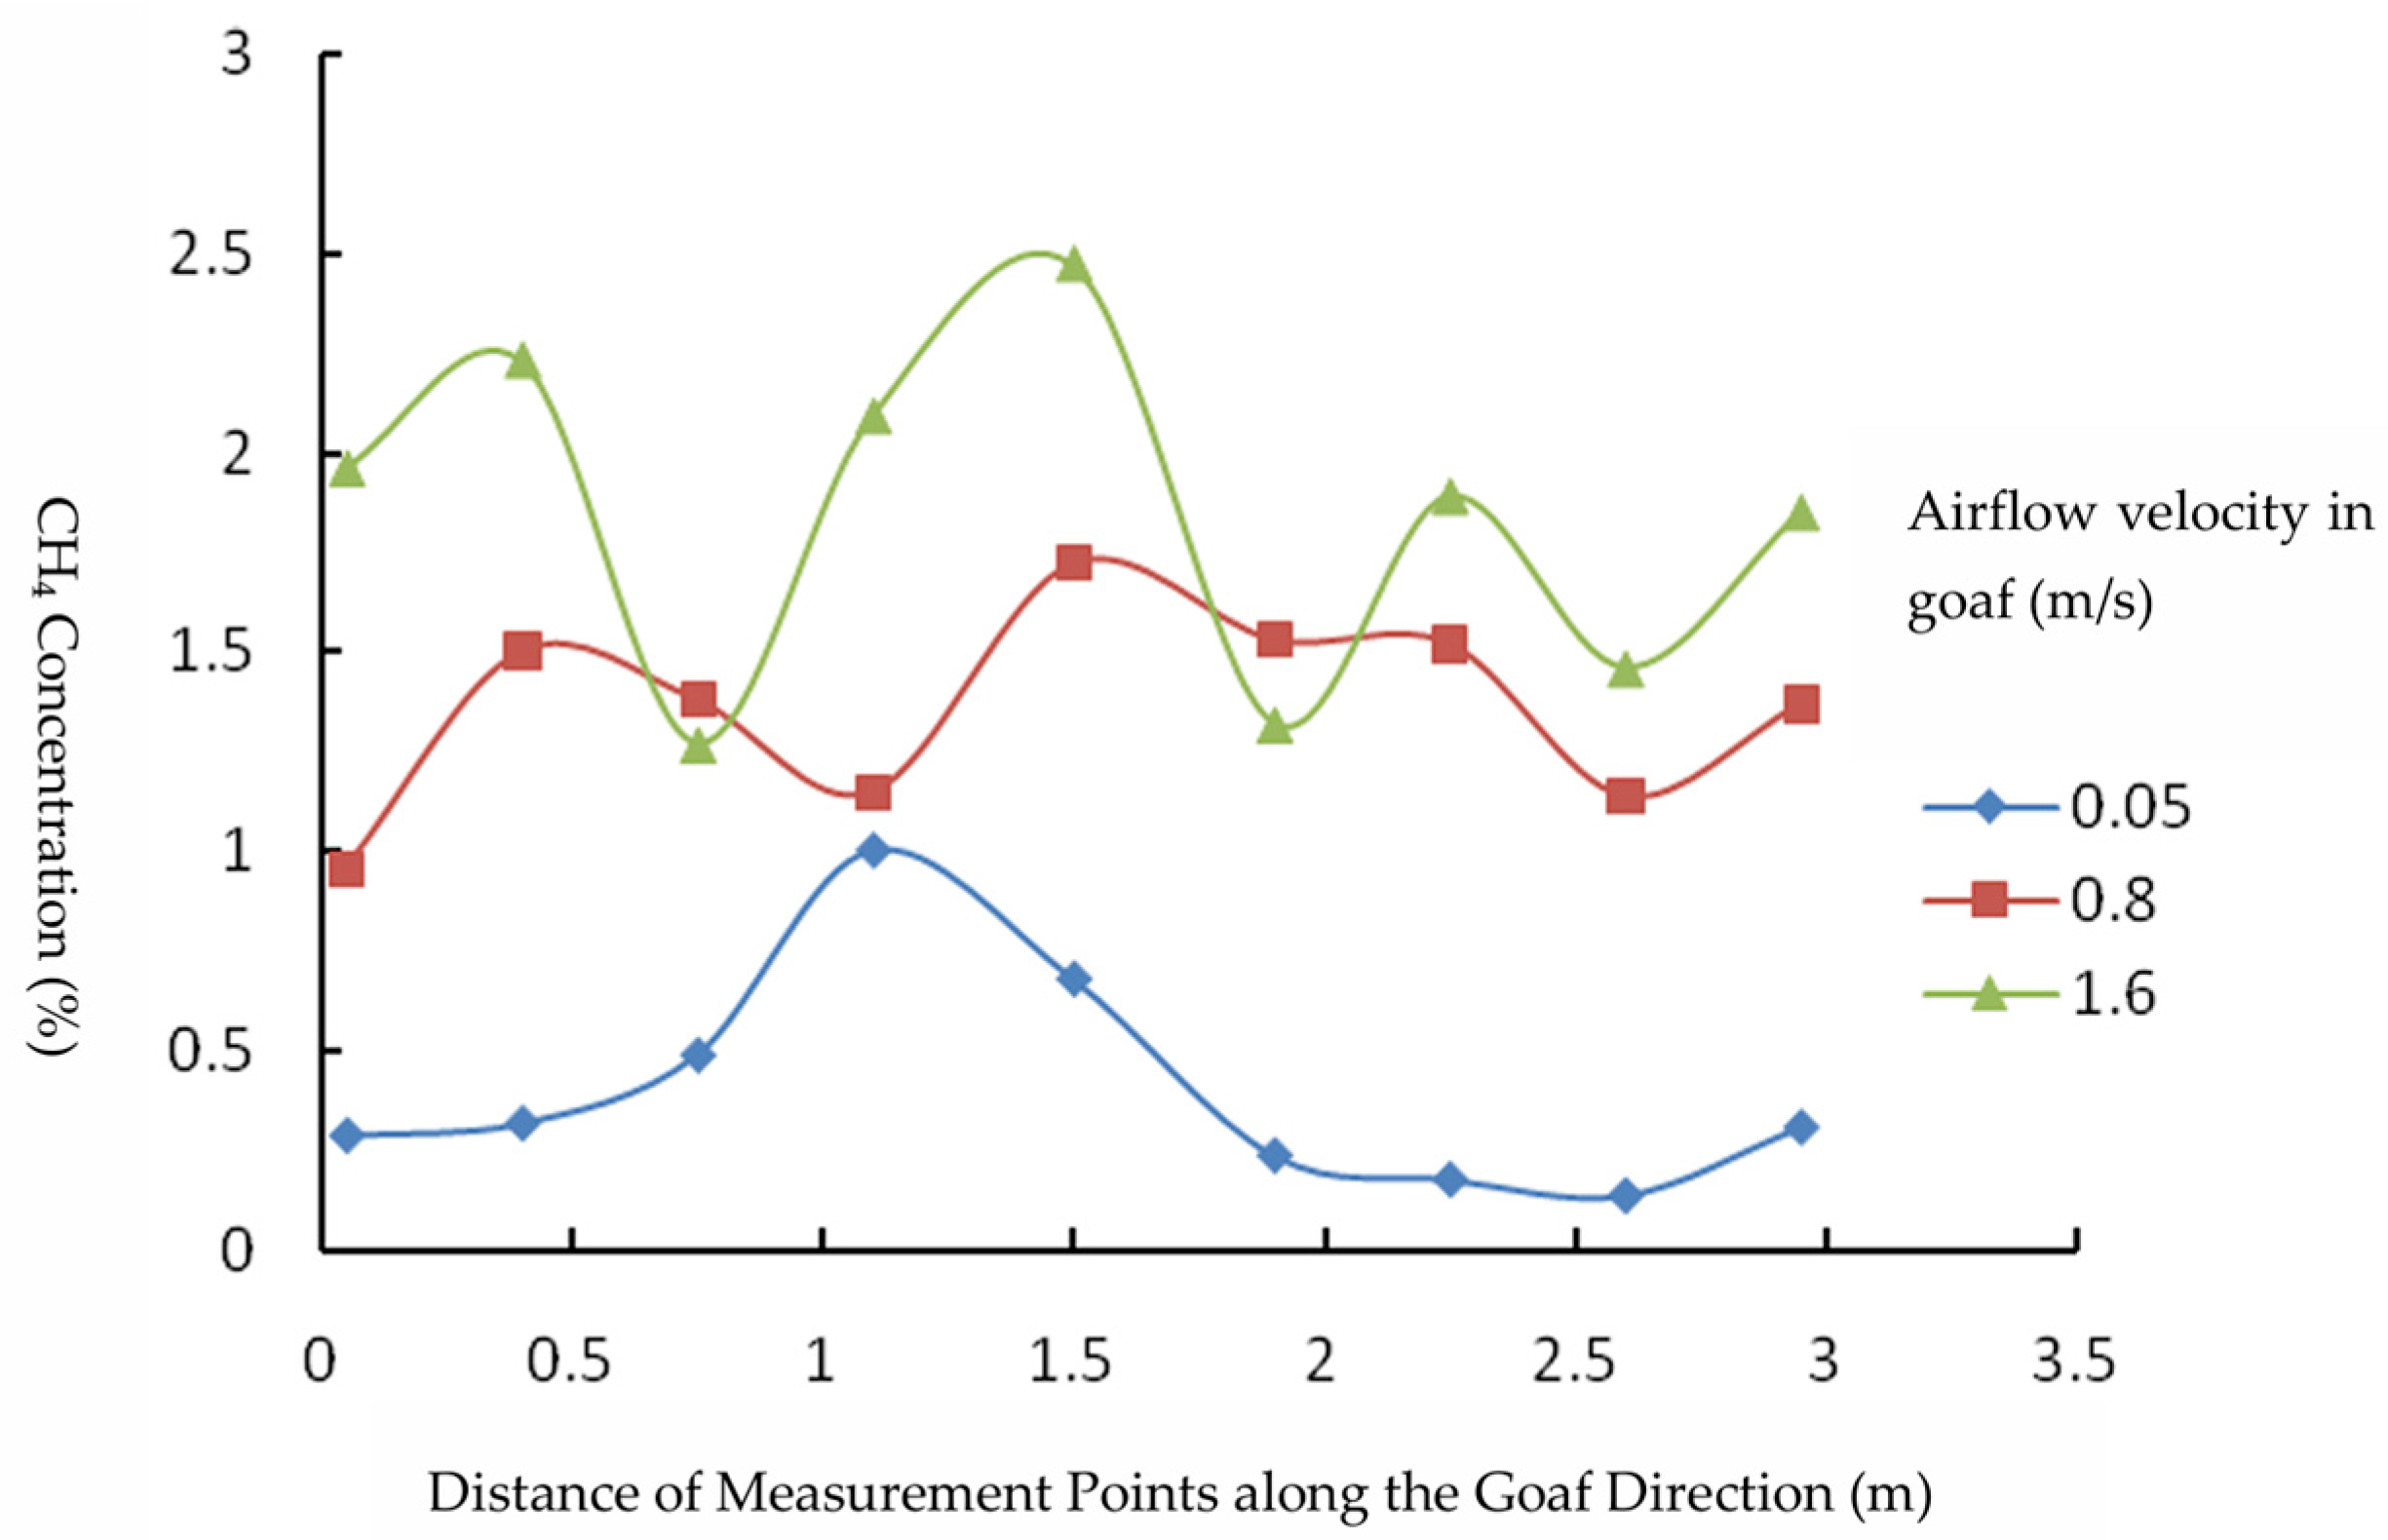
Figure 14, Figure 15 and Figure 16 show the methane concentration distribution curves at sections 0.05 m and 0.8 m from the working face along the strike direction, and at a section 1.5 m along the dip direction from the intake airway in the gob area.
From the figures, it can be observed that, along the gob’s strike direction, as the working face airflow velocity increases, the fluctuation amplitude of the CH4 concentration in the gob significantly intensifies, and the range of concentration fluctuations gradually widens, though the overall trend of concentration remains upward. The airflow velocity at the working face has a significant impact on the CH4 concentration on the intake side but a less pronounced effect on the return side. Along the gob’s dip direction, as the airflow velocity increases, the fluctuation amplitude of the CH4 concentration decreases at the 0.05 m cross-section near the working face, while it increases at the 0.8 m cross-section, with a noticeable rise in concentration. The CH4 concentration is lowest on the intake side, gradually increases, peaks at approximately 2 m from the intake side, and then gradually decreases. Along the gob’s strike direction, at a distance of 1.6 m from the working face, the CH4 concentration reaches 2.5% or higher, indicating that the working face airflow velocity has minimal influence on it. This variation pattern is generally consistent with the airflow movement patterns in the gob, confirming that the CH4 concentration changes in the gob are primarily influenced by airflow movement patterns.

5.2.2. Measured Analysis of CH4 Concentration at the Upper Corner Under Different Airflow Velocities

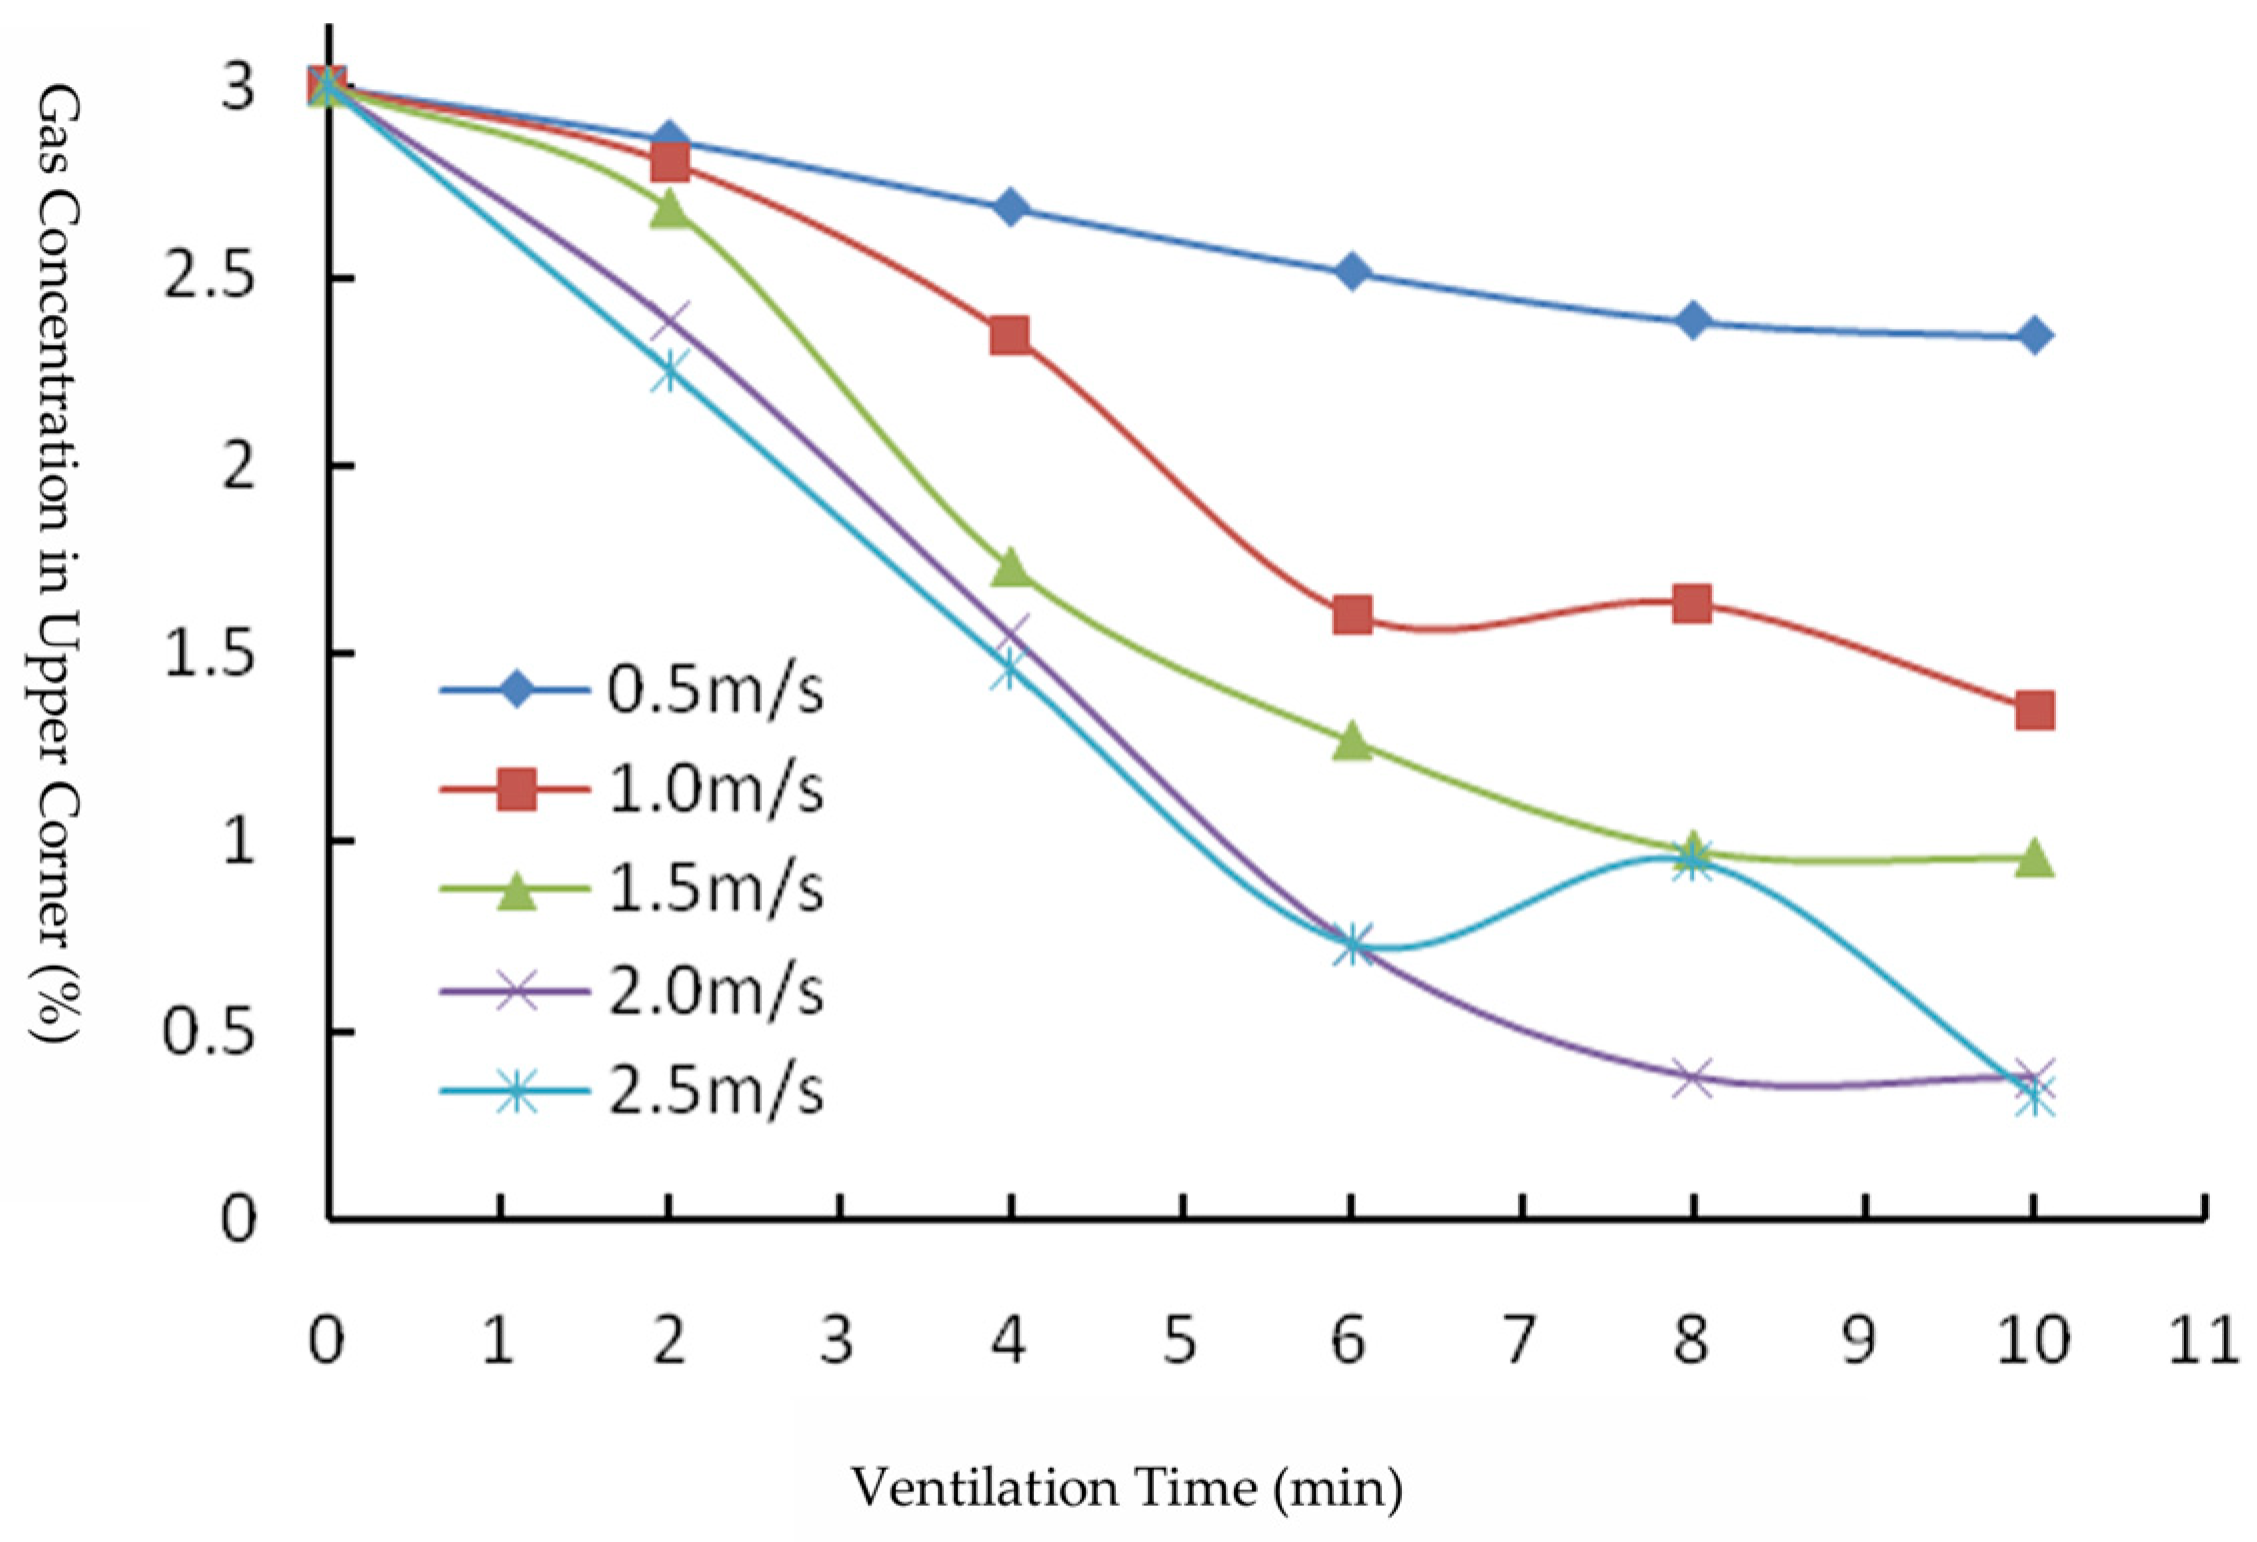
Figure 17 shows a variation curve of the CH4 concentration at the upper corner under airflow velocities of 0.5 m/s, 1.0 m/s, 1.5 m/s, 2.0 m/s, and 2.5 m/s.
As shown in the figure, under the five airflow velocity conditions, the CH4 concentration at the upper corner exhibits significant variations. At an airflow velocity of 0.5 m/s, the impact on the CH4 concentration at the upper corner is minimal, with the concentration remaining nearly constant. At airflow velocities of 1.0 m/s, 1.5 m/s, and 2.0 m/s, the variation patterns of the CH4 concentration at the upper corner are generally similar, but the concentration shows a decreasing trend as the airflow velocity increases. At an airflow velocity of 2.5 m/s, the CH4 concentration at the upper corner exhibits significant fluctuations. This is attributed to the higher airflow velocity, which tends to form vortices at the upper corner, leading to unstable CH4 concentrations and an increase in concentration.

5.3. Measured Analysis of CH4 Concentration in the Gob Under ”U” Type Ventilation

Using the gas supply system as described in Section 5.2.1, CH4 is introduced into the gob until the concentration in Zone I reaches 3%, at which point the flow control valves are adjusted to maintain a constant gas concentration in all zones. After 10 min, the exhaust fan was activated to place the fully mechanized top-coal caving face under the ”U” type ventilation mode with an airflow velocity of 1.5 m/s. The migration patterns of CH4 in the gob were studied, and a plane 50 mm above the model base was selected as the representative plane for CH4 concentration analysis. In the following figures, the coordinate origin is defined as the vertical projection of the intersection line between the working face and the intake airway wall onto the plane 50 mm above the model base. The horizontal axis represents the distance from the origin along the dip (or strike) direction of the gob, and the vertical axis represents the CH4 concentration at the measurement points in the gob (this applies to all subsequent figures).
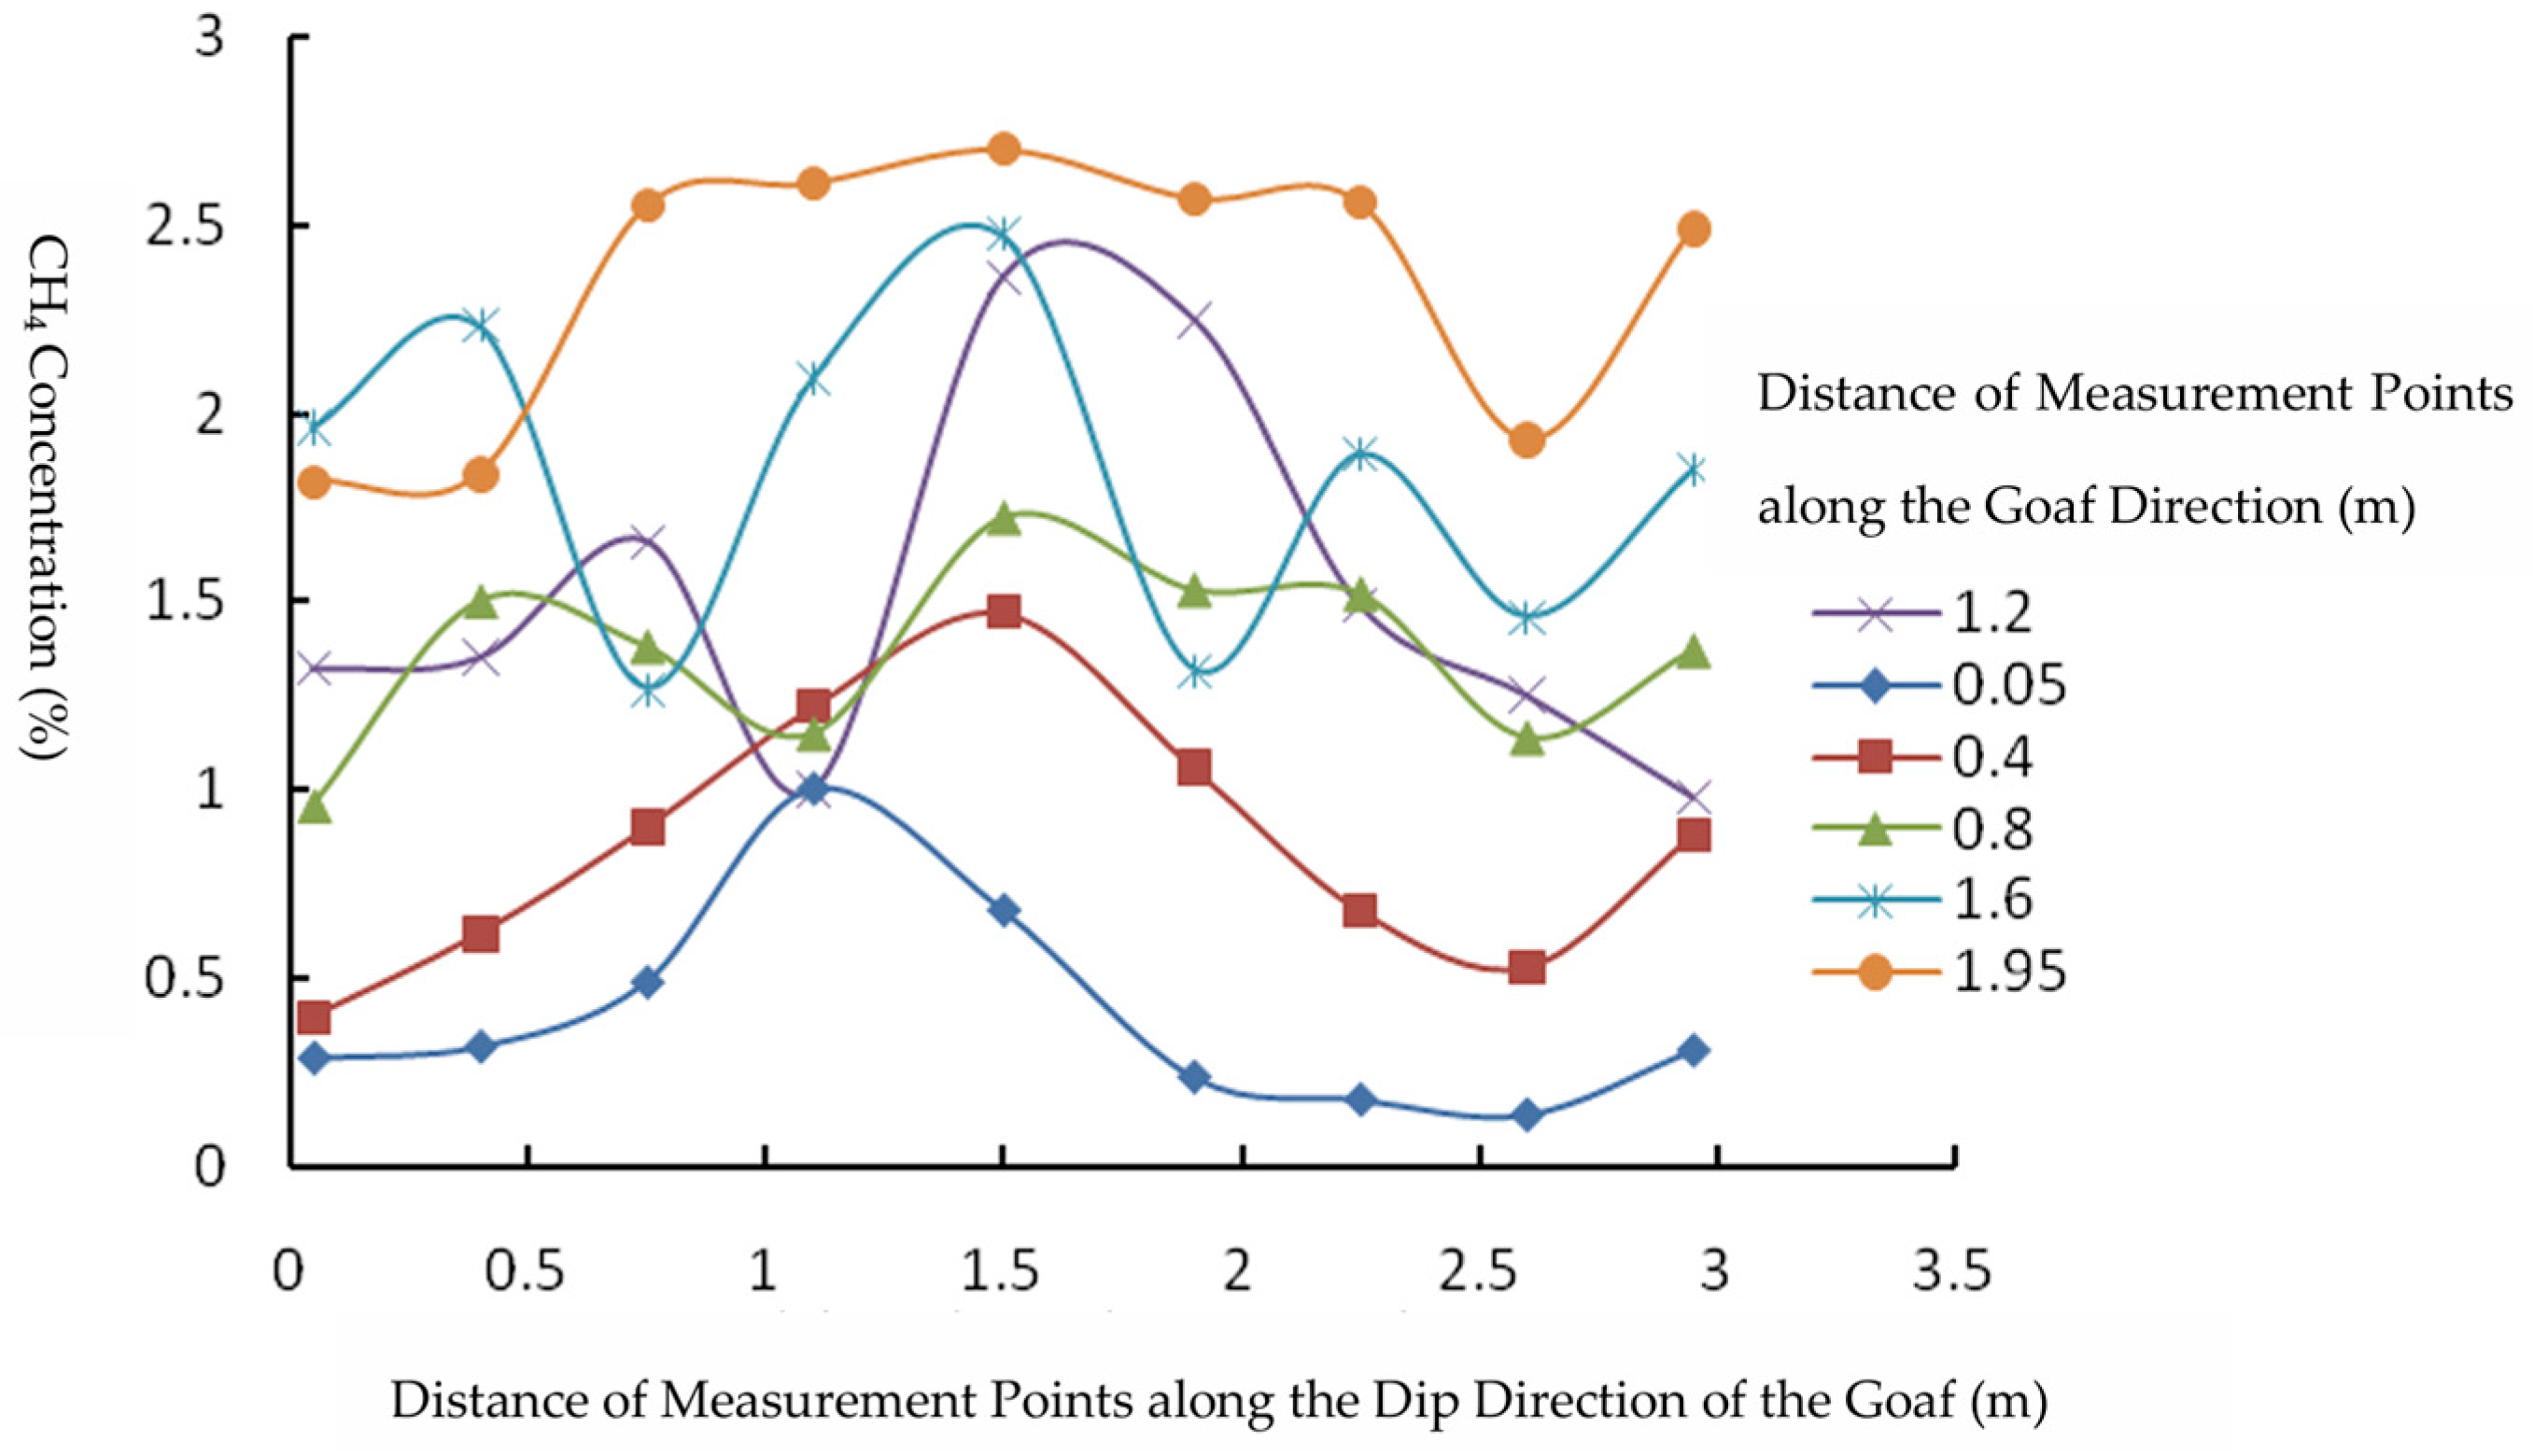
Figure 18 shows a variation curve of the CH4 concentration in the gob at the 0.05 m plane under ”U” type ventilation. As shown in Figure 18, the CH4 concentration at various measurement points in the gob follows a pattern of gradually increasing from the intake airway to the return airway. In Zones 1 and 2, the CH4 concentration variation along the working face direction exhibits a trend of first increasing and then decreasing from the intake side to the return side, with the decreasing trend occurring at a position offset toward the return side from the dip centerline. Specifically, in Zones 1 and 2, along the gob’s dip direction, a maximum CH4 concentration point appears at a position offset toward the return side from the centerline. This pattern is attributed to the negative pressure drainage method used at the working face, which creates different airflow patterns in various regions of the gob. Driven by these airflows, CH4 is carried away and discharged through the return airway. Additionally, due to the obstruction caused by the collapsed coal and rock mass in the gob, as the distance from the working face increases, the porosity decreases and seepage resistance increases. Consequently, the influence of infiltrating air on the interior of the gob diminishes, and the airflow velocity gradually decreases or even vanishes. This leads to a gradual reduction in CH4 concentration variation from Zone 1 to Zone 2 and further to Zone 3. In Zone 3, near the corners of the model on both sides, the CH4 concentration is largely unaffected. From the perspective of the gob’s strike direction (across the three zones), the highest concentration variation occurs in Zone 1, closest to the working face, while the lowest concentration variation occurs at both ends of Zone 3.
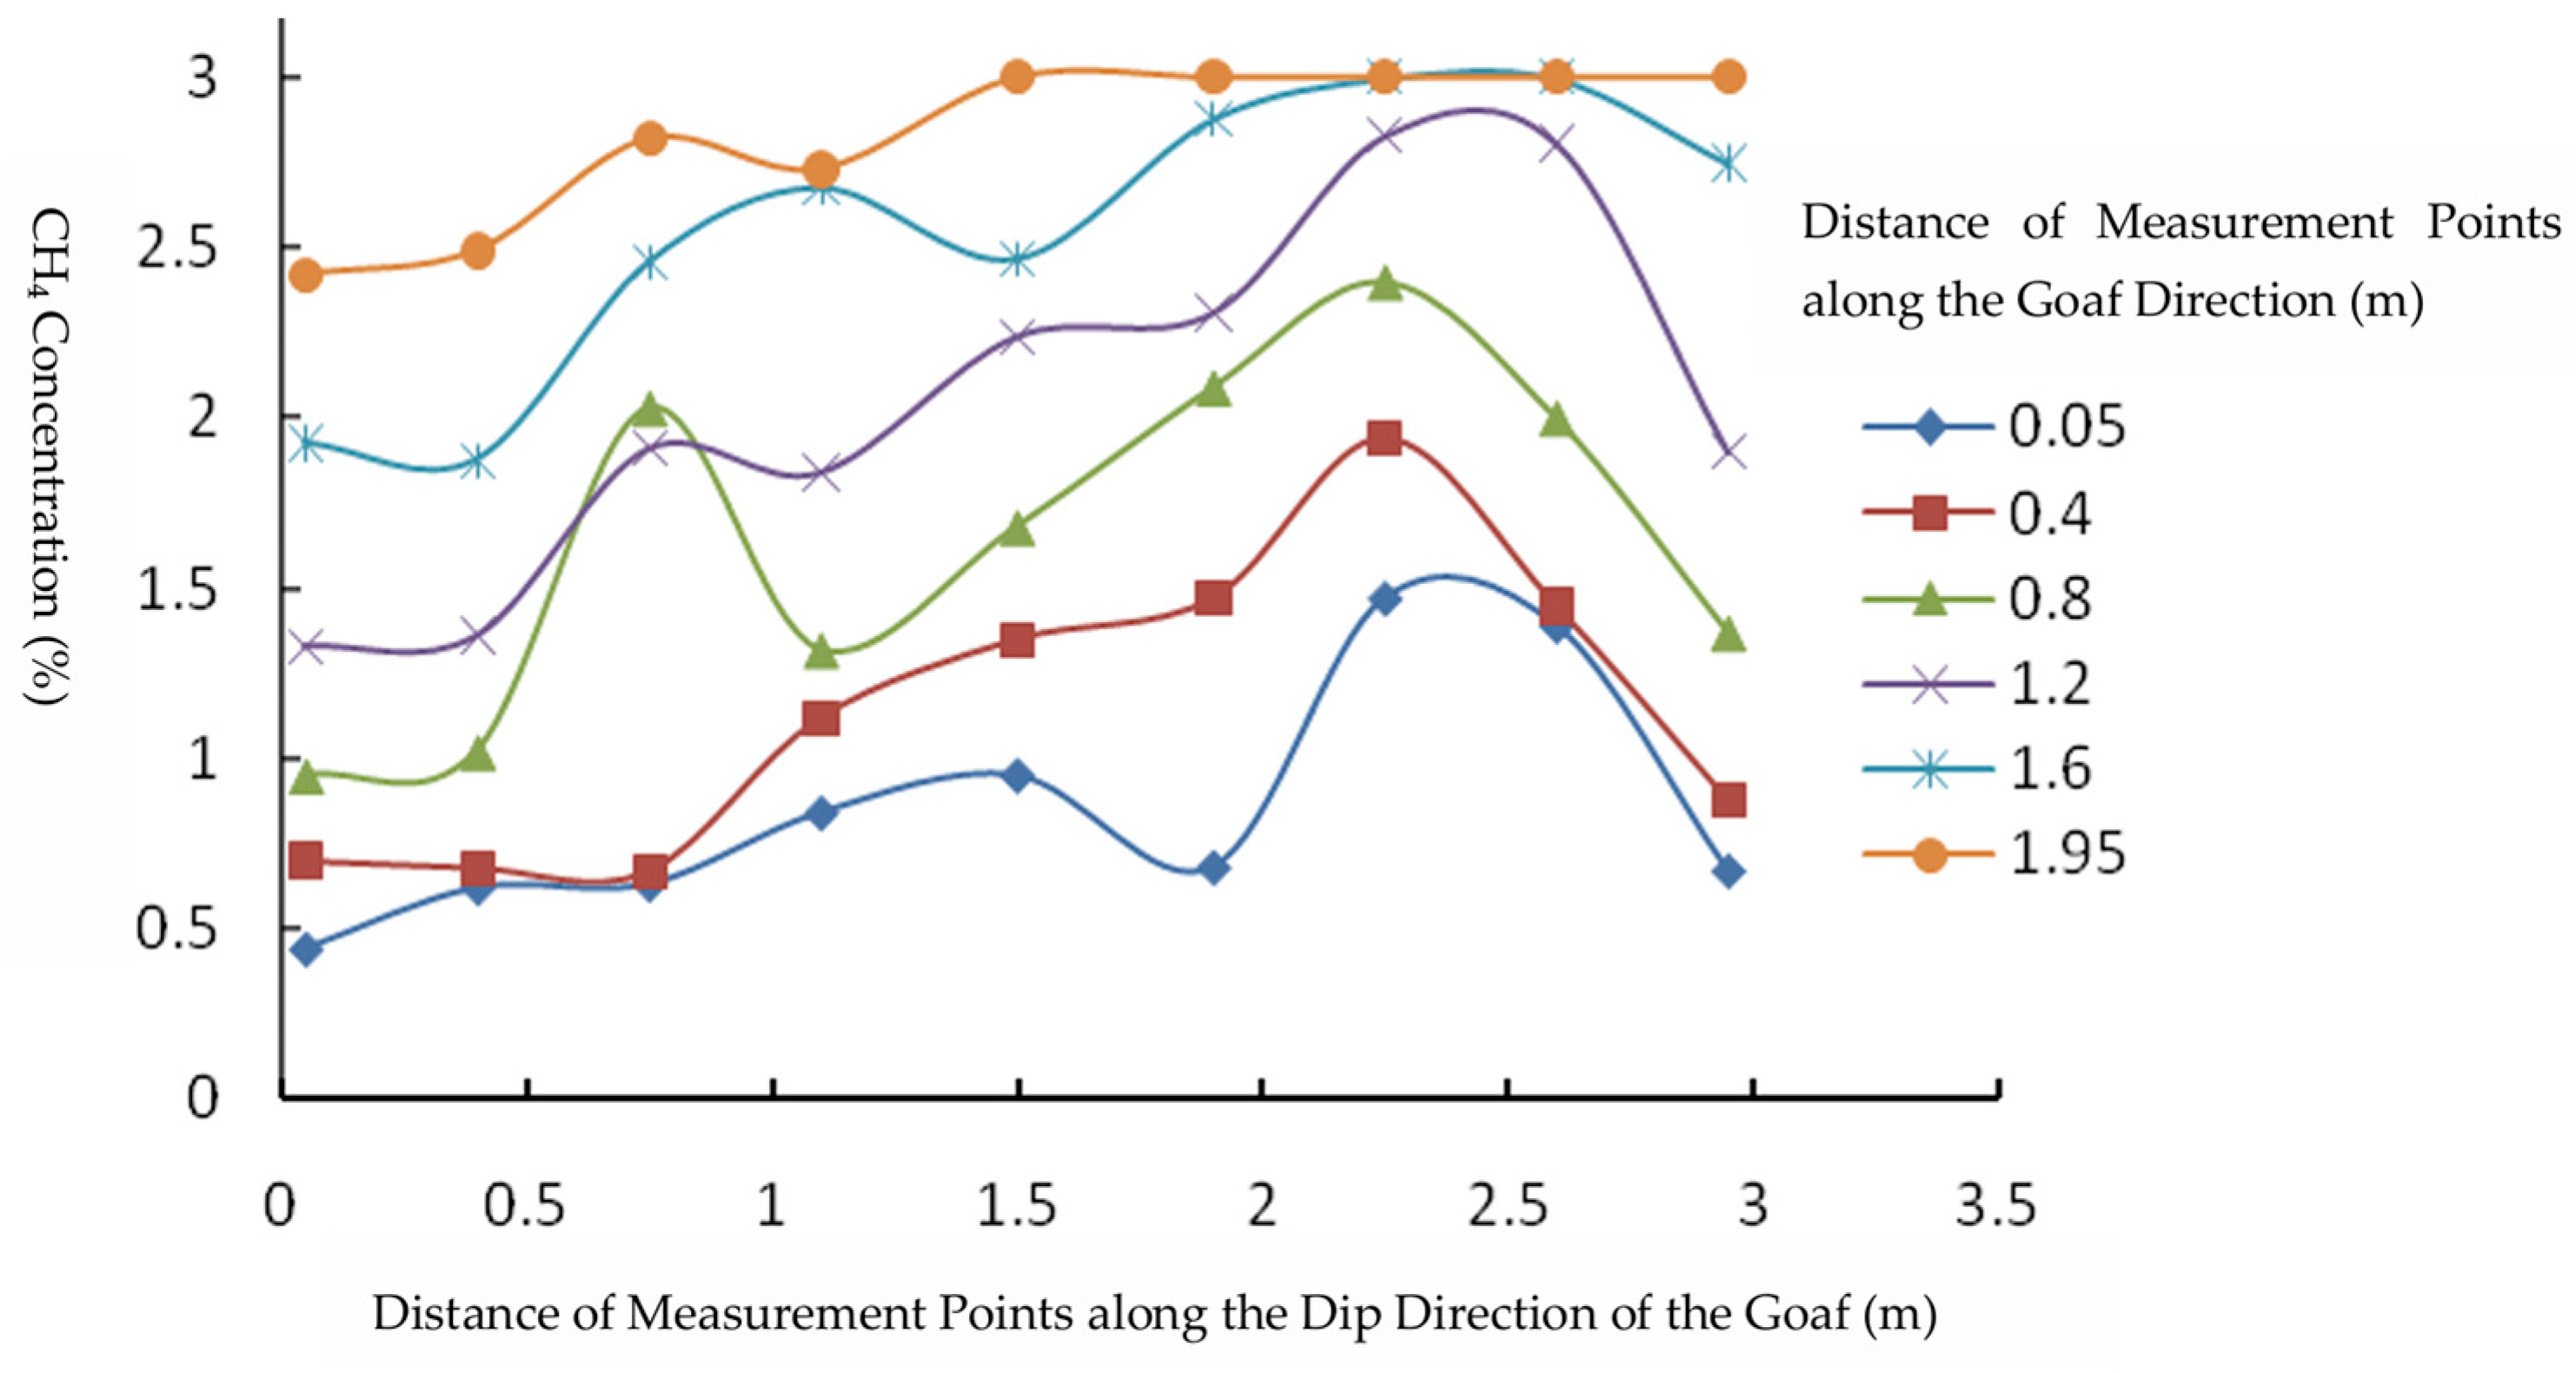
Figure 19 also indicates that, as the distance from the working face increases, the CH4 concentration at the measurement points gradually rises. This suggests that under the ventilation conditions of the working face, the influence of airflow on the gob weakens as the working face advances. It also indicates that, with the collapse of the gob’s roof, the porosity of the collapsed coal and rock mass gradually increases. As the coal and rock mass becomes more compacted, its role as a porous medium in impeding internal airflow movement becomes more pronounced.
Figure 20 shows variation curves of the CH4 concentration along the longitudinal cross-section at 0.05 m, 0.8 m, and 1.6 m from the origin in the gob’s strike direction.
As shown in Figure 20, the airflow formed within the gob diminishes in influence as the distance from the intake side increases, manifested as a general trend of gradually increasing CH4 concentration at the measurement points. During this process, significant fluctuations are observed, indicating that under the ventilation conditions of the working face, the airflow is affected by the resistance of the collapsed rock mass along the working face direction. This results in noticeable vortex phenomena in the airflow along the working face direction, reflecting the characteristic of gradually increasing CH4 concentration along the working face direction.

5.4. Measured Analysis of CH4 Concentration in the Gob Under ” U + I” Type Ventilation

As per the gas supply method specified in Section 5.2.1, CH4 is supplied to the gob area until the concentration in Zone I attains 3%, at which stage the flow control valves are fine-tuned to sustain a uniform gas concentration across all zones. After 10 min, the induced draft fan was activated to operate the fully mechanized working face under the “U + L” ventilation mode, with a working face airflow velocity of 1.5 m/s and an “L” lane airflow velocity of 0.5 m/s. The migration pattern of CH4 in the gob area was studied, with a plane 50 mm above the model base selected as the representative plane for CH4 concentration analysis. In the curve diagrams, the coordinate origin is defined as the projection of the intersection line between the working face and the intake airway wall onto the plane 50 mm above the model base, with the horizontal axis representing the distance from the origin along the dip (or strike) direction of the gob and the vertical axis representing the CH4 concentration at the measurement points in the gob area (this applies to all subsequent descriptions). Figure 21 shows the CH4 concentration variation curve in the gob area under the “U + L” ventilation mode.
From Figure 21, it can be observed that the CH4 concentration at various measurement points in the gob area follows a pattern of gradually increasing from the intake side to the return side, followed by a sharp decrease. Due to the presence of the “L” lane, the CH4 concentration at the upper and lower corners is relatively low. Additionally, under the influence of dual negative pressure, a noticeable airflow vortex forms at the upper corner, causing most of the CH4 gas to be carried away by the airflow, resulting in a rapid decrease in concentration. Along the dip direction of the gob, the CH4 concentration exhibits a pattern of first increasing and then decreasing from the intake side to the return side, with a more pronounced decline compared to that of the experimental condition. The peak concentration tends to shift, occurring at a position offset toward the return airway from the centerline of the dip direction, i.e., the maximum CH4 concentration point appears at a location offset toward the return airway along the centerline of the dip direction. This pattern is attributed to the U + L negative pressure ventilation mode adopted at the working face, which creates different airflow patterns in various regions of the gob. Driven by these airflows, near the working face, airflow vortices form, trapping CH4 in the gob area and causing fluctuations in CH4 concentration. As the distance from the working face increases, the porosity decreases due to the influence of gob resistance, and the seepage resistance increases, reducing the impact of the infiltrating air on the gob interior. Consequently, the airflow velocity gradually decreases or even disappears, leading to a gradual reduction in CH4 concentration changes from Zone 1 to Zone 2 and Zone 3. At the corners of Zone 3 near both sides of the model, the CH4 concentration remains largely unaffected. From the perspective of the strike direction of the gob (across the three zones), the highest concentration difference is observed in Zone 1, closest to the working face, while the lowest concentration changes occur at both ends of Zone 3.
Figure 22 and Figure 23 illustrate the CH4 concentration variation patterns along the strike and dip directions of the gob area under the “U + L” ventilation mode. From the comparison of Figure 22 and Figure 23, it can be seen that, as airflow forms in the gob area, its influence range decreases progressively with distance from the intake side, manifested as an overall trend of gradually increasing the CH4 concentration at various measurement points. However, during this process, noticeable fluctuations occur, indicating that under the ventilation conditions of the working face, the airflow’s effect on the gob area is influenced not only by the “L” lane, but also by the resistance of the collapsed rock mass along the working face direction. This results in a pronounced vortex phenomenon in the airflow along the working face direction, reflecting the characteristic of gradually increasing the CH4 concentration along the working face direction.

5.5. Measured Analysis of CH4 Concentration in the Gob Under “U + I” Type Ventilation

Following the gas supply protocol described in Section 5.2.1, CH4 is delivered to the gob area until Zone I achieves a concentration of 3%, after which the flow control valves are regulated to ensure a stable gas concentration throughout all zones. After 10 min, the induced draft fan was activated to operate the fully mechanized working face under the “U + I” ventilation mode, with a working face airflow velocity of 1.5 m/s and an “I” lane airflow velocity of 0.5 m/s. The migration pattern of CH4 in the gob area was studied, with a plane 50 mm above the model base selected as the representative plane for CH4 concentration analysis. In the curve diagrams, the coordinate origin is defined as the projection of the intersection line between the working face and the intake airway wall onto the plane 50 mm above the model base, with the horizontal axis representing the distance from the origin along the dip (or strike) direction of the gob and the vertical axis representing the CH4 concentration at the measurement points in the gob area (this applies to all subsequent descriptions).
Figure 24 shows the CH4 concentration variation curve in the gob area under the “U + I” ventilation mode, while Figure 25 and Figure 26 illustrate the CH4 concentration variation patterns along the strike and dip directions of the gob area under the “U + L” ventilation mode, respectively.
From the comparison of Figure 24, Figure 25 and Figure 26, it can be observed that, as the airflow forms in the gob area, its influence range decreases progressively with distance from the intake side, with the CH4 concentration at various measurement points generally showing a trend of gradual increase. However, during this process, noticeable fluctuations occur, particularly under the influence of the “I” lane, where significant variations in CH4 concentration are observed at the upper corner of the gob area. This effectively reduces the amount of CH4 seeping into the working face from the gob area. The reduction in CH4 influx into the working face not only lowers the risk of methane-related hazards, but also allows for appropriate control of the working face airflow velocity, reducing the likelihood of increased dust concentration due to secondary dust generation. This creates more favorable conditions for dust control.

5.6. Comparative Analysis of CH4 Concentration Under Different Ventilation Modes

5.6.1. Comparative Analysis of CH4 Concentration Variation in the Gob

Figure 18, Figure 19, Figure 20, Figure 21, Figure 22, Figure 23, Figure 24, Figure 25 and Figure 26 depict the planar distribution of CH4 in the gob area, as well as the distribution along the dip and strike sections under three experimental conditions. The experimental results show that the CH4 concentration at various measurement points along the dip direction of the gob area follows a pattern of initially increasing from the intake side to the return side, then decreasing, and subsequently slightly increasing again. Along the strike direction, the CH4 concentration follows a pattern of gradually increasing from Zone 1 to Zone 3, with the magnitude of change progressively decreasing, and minimal variation in CH4 concentration near the suffocation zone. This trend aligns closely with the variation patterns observed in the gob area of the working face, reflecting the temporal characteristics of roof collapse in the gob and the process of subsidence, accumulation, and compaction of the collapsed rock mass, manifested as sequential alternation and replacement among the different zones. Although the overall trend of CH4 concentration changes in the gob area is relatively similar across different ventilation modes, each mode has its distinct characteristics. The “U” ventilation mode has a significantly smaller impact on the gob area compared to the “U + L” and “U + I” modes. The “U + L” and “U + I” modes are more effective in controlling methane at the upper corner of the working face, making these ventilation modes more suitable for methane management in working faces that are relatively long or in the final stages of coal seam mining. Based on the experimental data, the adoption of “U + L” and “U + I” ventilation modes for managing methane in the gob area of the N2105 working face at Yuwu Coal Industry is an effective approach.

5.6.2. Comparative Analysis of CH4 Concentration at the Upper Corner

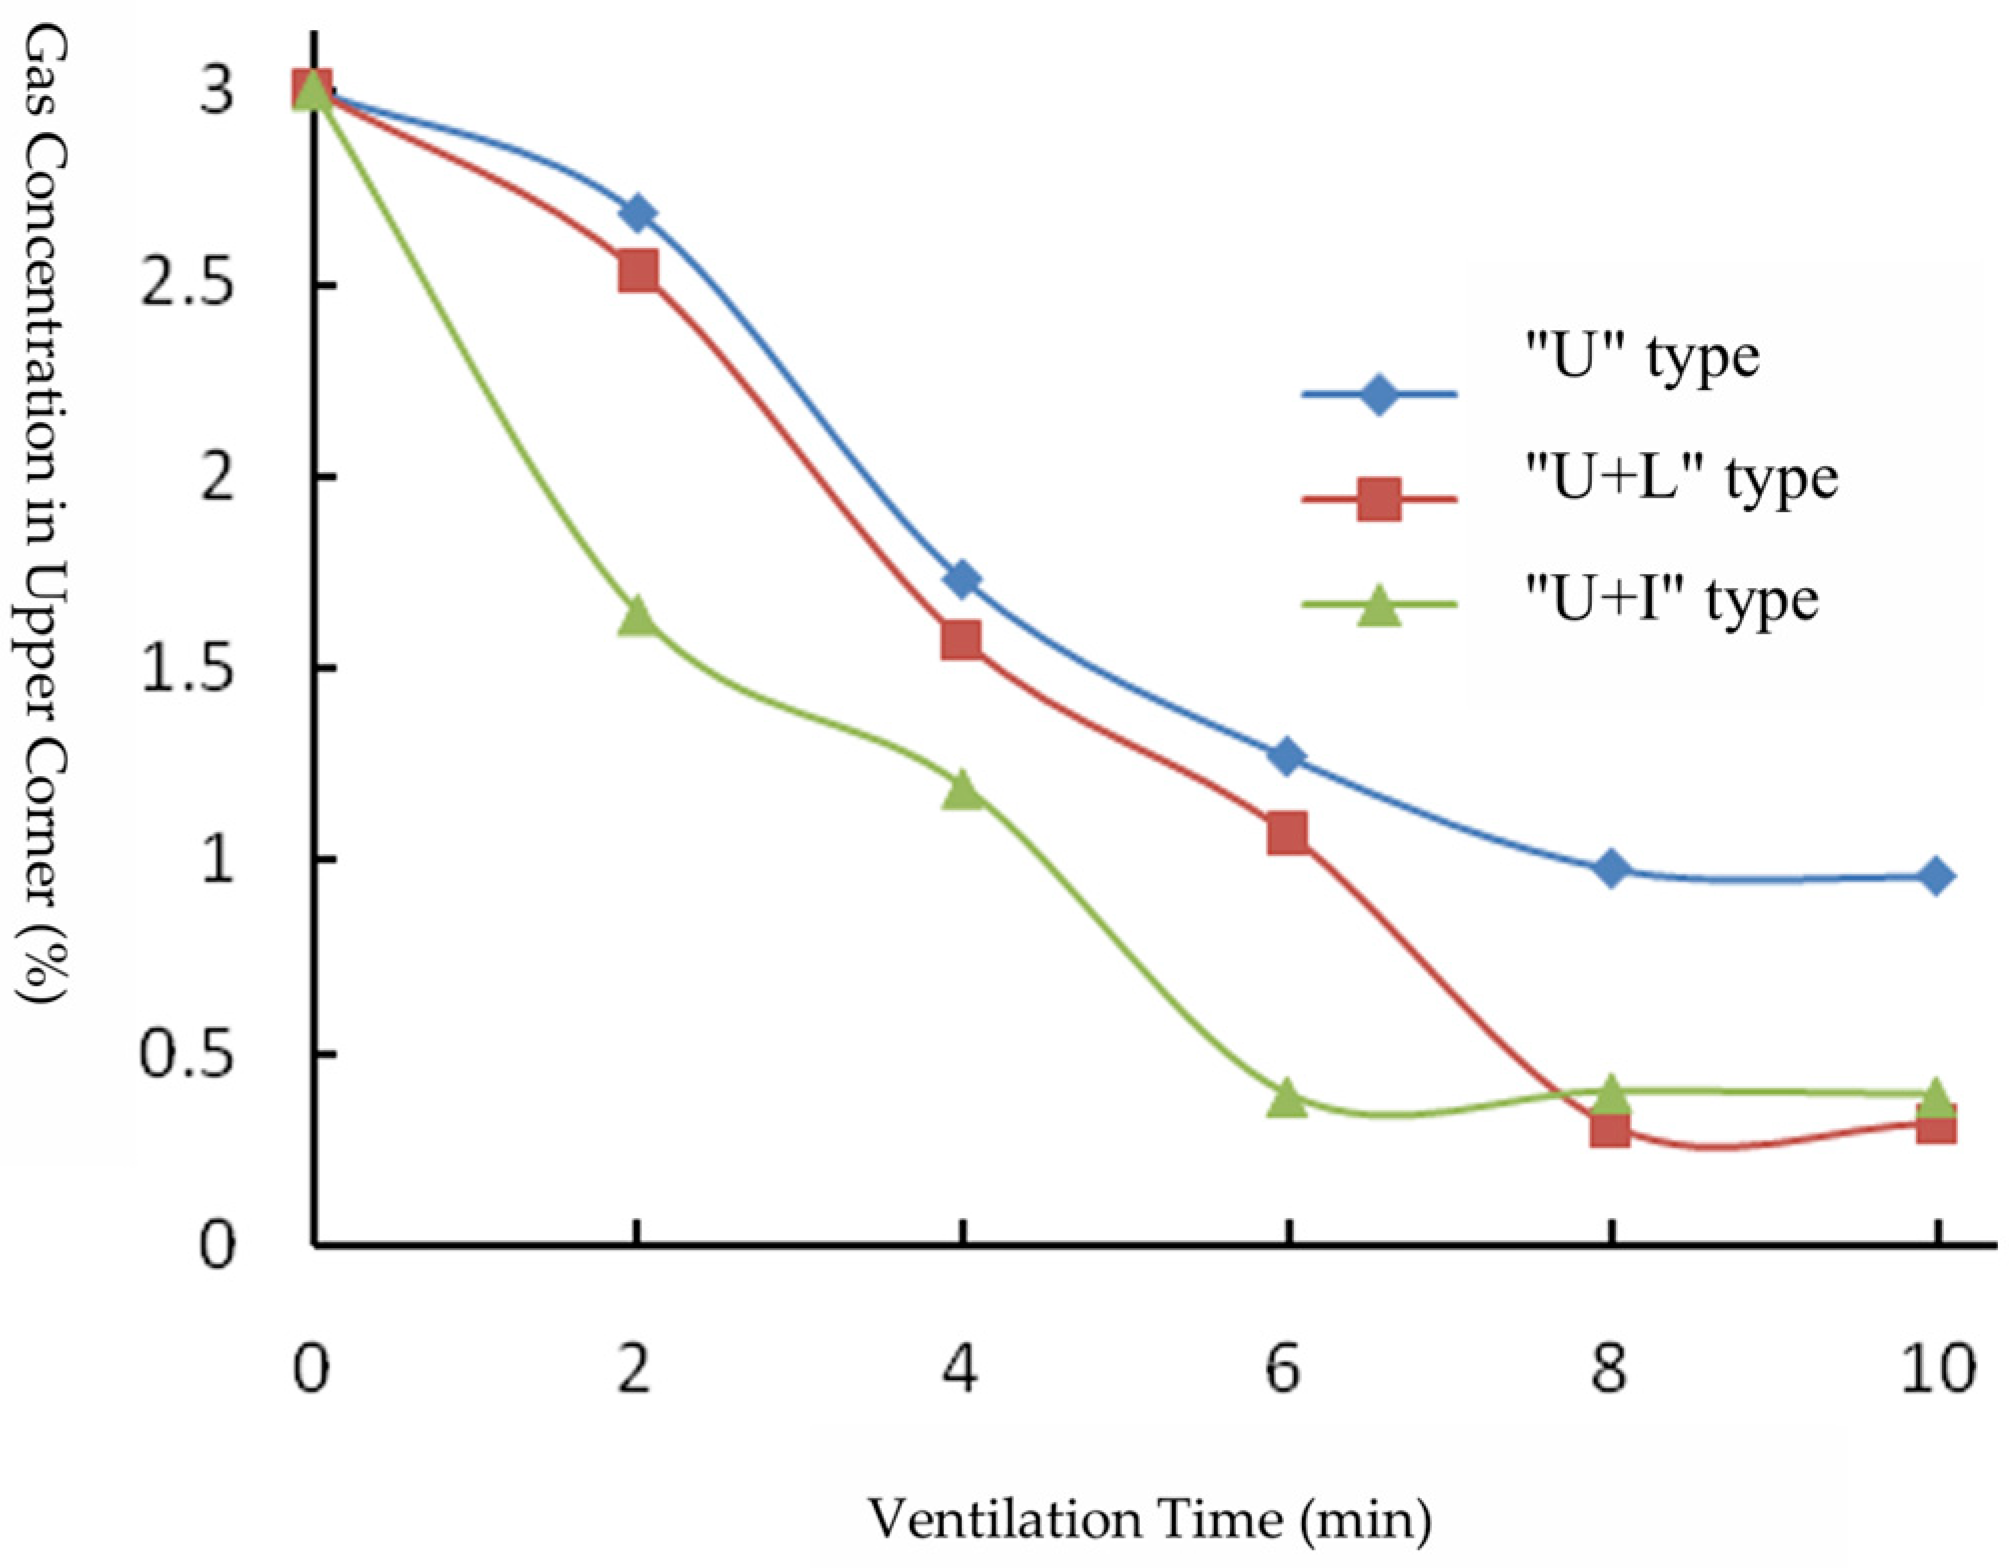
Figure 27 shows the variation curves of methane concentration at the upper corner under the “U,” “U + L,” and “U + I” ventilation modes when the working face airflow velocity is 1.5 m/s.
From Figure 27, it can be observed that the methane concentration at the upper corner significantly decreases under all three ventilation modes. In the initial stage of ventilation, the impact of the three ventilation modes on the methane concentration at the upper corner is essentially the same. However, as time progresses, the methane concentration under the “U” ventilation mode reaches equilibrium first. Under the “U + L” mode, the methane concentration decreases slowly at first, then drops sharply, and eventually reaches equilibrium. Under the “U + I” mode, the methane concentration decreases most significantly, with the time to reach equilibrium falling between that of the “U” and “U + L” modes. Comparing the three ventilation modes, both the “U + L” and “U + I” modes are more effective in reducing methane concentration at the upper corner.

6. Conclusions

This study thoroughly analyzed domestic and international literature on methane control in the gob area of fully mechanized top-coal caving faces and evaluated the feasibility of experimental research. Based on the parameters of a specific mine’s working face and the operational parameters of the mining process, a similarity model experimental platform for the gob area of a fully mechanized top-coal caving face was developed using similarity principles and proportional requirements. The experimental platform is equipped with functionalities to switch ventilation modes, adjust the airflow velocity at the working face, and regulate methane concentration in the gob area. By modifying the ventilation modes of the platform, experimental studies were conducted on the airflow velocity and methane distribution in the gob area and upper corner under the “U,” “U + L,” and “U + I” ventilation modes. Experiments were performed to investigate the airflow movement, methane migration, and methane concentration changes at the upper corner in the gob area of the working face under different airflow velocities (0.5 m/s, 1.0 m/s, 1.5 m/s, 2.0 m/s, and 2.5 m/s). Through analysis of the research results, the following conclusions were drawn:
(1)
The experimental results indicate that, in the gob area of a fully mechanized top-coal caving face, the airflow velocity gradually decreases along the strike direction, approaching zero in the suffocation zone. In the heat dissipation zone, the airflow velocity exhibits fluctuating changes along the dip direction, with the highest velocity at the intake side, gradually decreasing along the dip direction, reaching a minimum in the middle, and then slightly increasing again. This airflow velocity distribution can easily lead to methane overflow at the upper corner. If the airflow velocity is too low or the methane emission in the gob area increases, it is highly likely to cause methane overrun at the upper corner.
(2)
The methane concentration changes in the gob area are minimally affected by airflow velocity. The methane concentration gradually increases along the strike direction of the gob, reaching over 95% in the suffocation zone. Within the range influenced by the working face airflow, the methane concentration shows slight variations along the dip direction, with the lowest concentration at the intake side, peaking at the point of minimum airflow velocity, and then slightly decreasing. Beyond the range influenced by the working face airflow, the methane concentration in the gob area remains essentially constant.
(3)
The methane concentration at the upper corner of the working face is significantly influenced by the ventilation mode and the airflow velocity at the working face. Low airflow velocities can lead to methane accumulation at the upper corner, while excessively high velocities can cause methane concentration fluctuations at the upper corner. When the working face airflow velocity is between 1.5 and 2.5 m/s, the control of methane concentration at the upper corner is more effective. Compared to the “U” ventilation mode, the “U + L” and “U + I” ventilation modes are more effective in reducing methane concentration at the upper corner.
Author Contributions

Conceptualization, H.W.; methodology, H.W.; validation, H.W.; formal analysis, H.W.; investigation, H.W.; resources, H.W. and F.S.; writing—original draft preparation, H.W. and H.A.; writing—review and editing, H.W., F.S., J.S., Y.C., and H.A.; supervision, F.S.; funding acquisition, Y.C. All authors have read and agreed to the published version of the manuscript.

Funding

This research was partly funded by the Project supported by the National Key Research and Development Program of China (2024YFC2909505), the Science and Technology Project of Jiangxi Provincial Department of Transportation, grant number 2024QN011, the State Key Laboratory of Geomechanics and Geotechnical Engineering Safety, the Institute of Rock and Soil Mechanics, the Chinese Academy of Sciences, grant number SKLGGES-024013, and the Yunnan Province “Xingdian Talent Support Program” for Young Talents, project number KKXX202567014.

Institutional Review Board Statement

Not applicable.

Informed Consent Statement

Not applicable.

Data Availability Statement

Data are available from the corresponding author upon request.

Conflicts of Interest

The authors declare no conflicts of interest.

References

  1. Wang, Y.; Si, G.; Oh, J.; Belle, B. CFD modelling of longwall goaf atmosphere under vertical boreholes gas drainage. Int. J. Coal Geol. 2023, 280, 104400. [Google Scholar] [CrossRef]
  2. Qin, Z.; Yuan, L.; Guo, H.; Qu, Q. Investigation of longwall goaf gas flows and borehole drainage performance by CFD simulation. Int. J. Coal Geol. 2015, 150, 51–63. [Google Scholar] [CrossRef]
  3. Cao, J.; Li, W. Numerical simulation of gas migration into mining-induced fracture network in the goaf. Int. J. Min. Sci. Technol. 2017, 27, 681–685. [Google Scholar] [CrossRef]
  4. Nian, J.; He, C.; Zhao, B.; Lv, X.; Deng, C. Asymmetric development of overburden fracture and gas migration law for a goaf of entry formed by roof cutting. Energy Sci. Eng. 2024, 12, 4070–4089. [Google Scholar] [CrossRef]
  5. Jia, L.; Peng, S.; Xu, J.; Yan, F.; Chen, J.; Wu, B.; Chen, Y. On the evolution mechanism of permeability during gas drainage: Insights from deformation field, gas pressure field and temperature field. Process Saf. Environ. Prot. 2022, 162, 825–836. [Google Scholar] [CrossRef]
  6. Karacan, C.Ö. Analysis of gob gas venthole production performances for strata gas control in longwall mining. Int. J. Rock Mech. Min. Sci. 2015, 79, 9–18. [Google Scholar] [CrossRef]
  7. Zhang, Z.; Ma, K.; Chen, Y.; Tang, C.; Zhang, H.; Yuan, X. Influence of Sealing Wall Crack on Gas Migration in Working Face without Coal Pillar Under Gob Connectivity. Combust. Sci. Technol. 2024, 1–17. [Google Scholar] [CrossRef]
  8. Zhao, P.; An, X.; Li, S.; Kang, X.; Huang, Y.; Yang, J.; Jin, S. Study on the pseudo-slope length effect of buried pipe extraction in fully mechanized caving area on gas migration law in goaf. Sustainability 2023, 15, 6628. [Google Scholar] [CrossRef]
  9. An, H.; Gong, R.; Liang, X.; Wang, H. Numerical Simulation Study on Gas Migration Patterns in Ultra-Long Fully Mechanized Caving Face and Goaf of High Gas and Extra-Thick Coal Seams. Fire 2025, 8, 13. [Google Scholar] [CrossRef]
  10. Wang, W.; Wang, F.; Zhao, B.; Li, G. Gas Distribution Law for the Fully Mechanized Top-Coal Caving Face in a Gassy Extra-Thick Coal Seam. Adv. Civ. Eng. 2018, 2018, 3563728. [Google Scholar] [CrossRef]
  11. Guo, H.; Li, X.; Cui, H.; Chen, K.; Zhang, Y. Effect of roof movement on gas flow in an extremely thick coal seam under fully mechanized sublevel caving mining conditions. Energy Sci. Eng. 2020, 8, 677–688. [Google Scholar] [CrossRef]
  12. Kang, X.; Tang, M.; Jiang, M.; Zhou, C.; Hu, J.; Ren, J.; Deng, B. Study on gas migration law of mining coal seam under the influence of normal fault. Geofluids 2022, 2022, 9726379. [Google Scholar] [CrossRef]
  13. Zhao, P.; Zhuo, R.; Li, S.; Ho, C.H.; Lin, H.; Liu, H. Research on the effect of coal seam inclination on gas migration channels at fully mechanized coal mining face. Arab. J. Geosci. 2019, 12, 597. [Google Scholar] [CrossRef]
  14. Chen, X.; Dong, X.; Wang, L.; Huang, Z.; Cui, P. Gas emergence characteristics of the upper corner on the 215101 mining working face of the Yue Nan Coal Mine. ACS Omega 2022, 7, 25663–25674. [Google Scholar] [CrossRef]
  15. Wang, D.; Zhang, P.; Zhang, Y.; Tu, S.; Wang, J.; Hao, Z. Distribution characteristic and migration mechanism of toxic gases in goafs during close-distance coal seam mining: A case study of shaping coal mine. ACS Omega 2022, 7, 7403–7413. [Google Scholar] [CrossRef]
  16. Li, C.; Wu, S.; Zheng, C.; Sun, X.; Jiang, X. Study on temporal and spatial evolution characteristics of overburden deformation and gas emission during the longwall working face initial mining phase. J. Geophys. Eng. 2022, 19, 534–549. [Google Scholar] [CrossRef]
  17. Cheng, C.; Cheng, X.; Yu, R.; Yue, W.; Liu, C. The law of fracture evolution of overlying strata and gas emission in goaf under the influence of mining. Geofluids 2021, 2021, 2752582. [Google Scholar] [CrossRef]
  18. Han, K.; Xiao, P.; Wang, J.; Zhao, B.; Shuang, H. Evolution law of overburden pressure relief gas enrichment area in fully mechanized caving face of three-soft coal seams and field application. Geoenergy Sci. Eng. 2024, 238, 212857. [Google Scholar] [CrossRef]
  19. Chong, L.; Sifeng, H.; Zhijun, X. Disastrous mechanism and concentration distribution of gas migration in fully mechanized caving stope in Wuyang coal mine. Geofluids 2021, 2021, 4366942. [Google Scholar] [CrossRef]
  20. Wang, L.; Li, J.; Fan, J.; Sun, C.; Zhang, J.; Zhang, J. Influence of Gas Extraction Process Elements on the Gas Migration Law in High-Gas Goaf Areas. ACS Omega 2025, 10, 3090–3100. [Google Scholar] [CrossRef]
  21. Jia, H.; Wang, Z.; Zhao, X.; Ma, S.; Song, Z.; Chen, J. Characterization of spatiotemporal distribution of gas in the goaf of W-type ventilated working face. Process Saf. Environ. Prot. 2024, 184, 1379–1388. [Google Scholar] [CrossRef]
  22. Zhou, A.; Xu, Z.; Wang, K.; Wang, Y.; An, J.; Shi, Z. Coal mine gas migration model establishment and gas extraction technology field application research. Fuel 2023, 349, 128650. [Google Scholar] [CrossRef]
  23. Karacan, C.Ö. Predicting methane emissions and developing reduction strategies for a Central Appalachian Basin, USA, longwall mine through analysis and modeling of geology and degasification system performance. Int. J. Coal Geol. 2023, 270, 104234. [Google Scholar] [CrossRef]
  24. Zhang, L.; Yang, M.; Luo, H. Parameter optimization and application of gas extraction technology by buried pipes in goaf of multi-roadway U type working face. Combust. Sci. Technol. 2024, 196, 820–837. [Google Scholar] [CrossRef]
  25. Li, Z.; Wang, F.; Ren, S.; Liu, G. Gas distribution mechanism in goaf during combined drainage of upper corner buried pipeline and intubation for thick coal seams. Lithosphere 2021, 2021, 8308256. [Google Scholar] [CrossRef]
  26. Janoszek, T. Numerical simulation of methane distribution at the longwall working with various stages of shearer advance. Arch. Min. Sci. 2024, 69, 353–373. [Google Scholar] [CrossRef]
  27. Janoszek, T.; Krawczyk, J. Methodology development and initial results of CFD simulations of methane distribution in the working of a longwall ventilated in a short “Y” manner. Arch. Min. Sci. 2022, 67, 3–24. [Google Scholar] [CrossRef]
  28. Wang, Z.; Ren, T.; Cheng, Y. Numerical investigations of methane flow characteristics on a longwall face Part I: Methane emission and base model results. J. Nat. Gas Sci. Eng. 2017, 43, 242–253. [Google Scholar] [CrossRef]
  29. Wang, Z.; Ren, T.; Cheng, Y. Numerical investigations of methane flow characteristics on a longwall face Part II: Parametric studies. J. Nat. Gas Sci. Eng. 2017, 43, 254–267. [Google Scholar] [CrossRef]
  30. Mishra, D.P.; Kumar, P.; Panigrahi, D.C. Dispersion of methane in tailgate of a retreating longwall mine: A computational fluid dynamics study. Environ. Earth Sci. 2016, 75, 475. [Google Scholar] [CrossRef]
  31. Wang, G.; Xu, H.; Wu, M.; Wang, Y.; Wang, R.; Zhang, X. Porosity model and air leakage flow field simulation of goaf based on DEM-CFD. Arab. J. Geosci. 2018, 11, 148. [Google Scholar] [CrossRef]
  32. Zheng, X.; Ge, S.; Liu, H.; Liu, J.; Yan, J. Research on the characteristics and control technology of gas disasters in the gob of the nonpillar working face based on the DEM-CFD coupled model. ACS Omega 2024, 9, 3758–3771. [Google Scholar] [CrossRef]
  33. Liu, J.; Chen, X.; Feng, S.; Li, X. Evolution law and application of permeability in gob without coal pillar and self-formed roadway. Energy Sci. Eng. 2022, 10, 3766–3778. [Google Scholar] [CrossRef]
  34. Feng, S.; Chen, X.; Wang, L.; Li, L.; Li, X. Air flow movement law in working face and gob with roof-cutting and pressure-releasing mining: A numerical simulation and engineering verification. ACS Omega 2023, 8, 25960–25971. [Google Scholar] [CrossRef] [PubMed]
  35. Zhang, D.M. Study on Numerical Simulation Methods for Coalbed Methane Extraction with Directional Horizontal Wells. Ph.D. Thesis, Graduate School of the Chinese Academy of Sciences, Beijing, China, 2004. [Google Scholar]
Figure 1. Schematic diagram of “U + L” (Left) and “U + I” (Right) ventilation modes.
Fire 08 00339 g001
Figure 2. Structural diagram of the similar simulation experimental platform for the gob area of a fully mechanized top-coal caving face.
Fire 08 00339 g002
Figure 3. Particle size distribution across zones of the experimental platform.
Fire 08 00339 g003
Figure 4. Model ventilation system.
Fire 08 00339 g004
Figure 5. Airflow velocity distribution along the strike direction cross-section under the “U” type ventilation mode.
Fire 08 00339 g005
Figure 6. Airflow velocity distribution along the dip direction cross-section under the “U” type ventilation mode.
Fire 08 00339 g006
Figure 7. Airflow velocity distribution along the goaf strike section under the “U + L” ventilation pattern.
Fire 08 00339 g007
Figure 8. Airflow velocity distribution along the dip direction cross-section under the “U + L” type ventilation mode.
Fire 08 00339 g008
Figure 9. Airflow velocity distribution along the strike direction cross-section under the “U + I” type ventilation mode.
Fire 08 00339 g009
Figure 10. Airflow velocity distribution along the dip direction cross-section under the “U + I” type ventilation mode.
Fire 08 00339 g010
Figure 11. Airflow velocity variation curve at the 0.05 m cross-section along the strike direction of the gob area.
Fire 08 00339 g011
Figure 12. Variation curve of airflow velocity along the 0.8 m cross-section in the strike direction of the gob.
Fire 08 00339 g012
Figure 13. Variation curve of airflow velocity along the 1.5 m cross-section in the dip direction of the gob.
Fire 08 00339 g013
Figure 14. Variation curve of the CH4 concentration along the 0.05 m cross-section in the strike direction of the gob.
Fire 08 00339 g014
Figure 15. Variation curve of the CH4 concentration along the 0.8 m cross-section in the strike direction of the gob.
Fire 08 00339 g015
Figure 16. CH4 concentration distribution curve along the 1.5 m cross-section in the dip direction of the gob.
Fire 08 00339 g016
Figure 17. Variation curve of the CH4 concentration at the upper corner under different airflow velocity conditions.
Fire 08 00339 g017
Figure 18. CH4 concentration distribution in the gob at the 0.05 m plane under ”U” type ventilation.
Fire 08 00339 g018
Figure 19. Variation curve of the CH4 concentration along the dip cross-section in the gob under “U type” ventilation.
Fire 08 00339 g019
Figure 20. Variation curve of the CH4 concentration along the strike dip cross-section in the gob under “U type” ventilation.
Fire 08 00339 g020
Figure 21. CH4 concentration distribution in the gob at the 0.05 m -lane under the “U + I” type ventilation.
Fire 08 00339 g021
Figure 22. Variation curve of the CH4 concentration along the strike direction in the gob under U + I” type ventilation.
Fire 08 00339 g022
Figure 23. Variation curve of the CH4 concentration along the dip direction in the gob under U + I” type ventilation.
Fire 08 00339 g023
Figure 24. CH4 concentration distribution in the gob at the 0.05 m plane under “U + I” type ventilation.
Fire 08 00339 g024
Figure 25. Variation curve of the CH4 concentration along the longitudinal cross-section in the gob under “U + I” type ventilation.
Fire 08 00339 g025
Figure 26. Variation curve of the CH4 concentration along the cross-section in the gob under “U + I” type ventilation.
Fire 08 00339 g026
Figure 27. Variation curve of the CH4 concentration at the upper corner under different ventilation modes.
Fire 08 00339 g027
Table 1. Particle size and porosity correspondence.
Particle Size (mm)0~600~500~400~300~200~10
Porosity (%)22.520.117.516.615.612.1
Note: In each group, the material with the upper-limit particle size constitutes more than 85% of the total material.
Table 2. Initial experimental parameters.
Initial ParameterParameter Value
Initial CH4 Concentration in the Experimental Platform (%)3
Airflow Velocity in the Return Airway (m/s)1.5
CH4 Supply Rate After Ventilation (L/min)Zone 1: 1.5, Zone 2: 1.0, Zone 3: 0.6
Ventilation Duration (min)10
Disclaimer/Publisher’s Note: The statements, opinions and data contained in all publications are solely those of the individual author(s) and contributor(s) and not of MDPI and/or the editor(s). MDPI and/or the editor(s) disclaim responsibility for any injury to people or property resulting from any ideas, methods, instructions or products referred to in the content.