Article

Impacts of COVID-19-Induced Human Mobility Changes on Global Wildfire Activity

by
Liqing Si
1,
Wei Li
1,
Mingyu Wang
1,*,
Lifu Shu
1,
Feng Chen
2,
Fengjun Zhao
1,
Pengle Cheng
3 and
Weike Li
1
1
Key Laboratory of Forest Protection of National Forestry and Grassland Administration, Ecology and Nature Conservation Institute, Chinese Academy of Forestry, National Forestry and Grassland Fire Monitoring, Early Warning and Prevention Engineering Technology Research Center, Beijing 100091, China
2
School of Ecology and Nature Conservation, Beijing Forestry University, Beijing 100083, China
3
School of Technology, Beijing Forestry University, Beijing 100083, China
*
Author to whom correspondence should be addressed.
Fire 2025, 8(7), 276; https://doi.org/10.3390/fire8070276
Submission received: 9 June 2025 / Revised: 8 July 2025 / Accepted: 10 July 2025 / Published: 12 July 2025
(This article belongs to the Special Issue Intelligent Forest Fire Prediction and Detection)

Abstract

Wildfires critically affect ecosystems, carbon cycles, and public health. COVID-19 restrictions provided a unique opportunity to study human activity’s role in wildfire regimes. This study presents a comprehensive evaluation of pandemic-induced wildfire regime changes across global fire-prone regions. Using MODIS data (2010–2022), we analyzed fire patterns during the pandemic (2020–2022) against pre-pandemic baselines. Key findings include: (a) A 22% global decline in wildfire hotspots during 2020–2022 compared to 2015–2019, with the most pronounced reduction occurring in 2022; (b) Contrasting regional trends: reduced fire activity in tropical zones versus intensified burning in boreal regions; (c) Stark national disparities, exemplified by Russia’s net increase of 59,990 hotspots versus Australia’s decrease of 60,380 in 2020; (d) Seasonal shifts characterized by December declines linked to mobility restrictions, while northern summer fires persisted due to climate-driven factors. Notably, although climatic factors predominantly govern fire regimes in northern latitudes, anthropogenic ignition sources such as agricultural burning and accidental fires substantially contribute to both fire incidence and associated emissions. The pandemic period demonstrated that while human activity restrictions reduced ignition sources in tropical regions, fire activity in boreal ecosystems during these years exhibited persistent correlations with climatic variables, reinforcing climate’s pivotal—though not exclusive—role in shaping fire regimes. This underscores the need for integrated wildfire management strategies that address both human and climatic factors through regionally tailored approaches. Future research should explore long-term shifts and adaptive management frameworks.

1. Introduction

Recent years have witnessed a surge in catastrophic forest fires globally due to increasingly extreme weather conditions, with several devastating events demonstrating their unprecedented scale and impact. The 2017 wildfire in China’s Greater Khingan Range consumed 11,500 hectares within just 24 h, while the 2020 California wildfires burned approximately 1.6 million hectares over three months—an area comparable to Beijing’s total size [1]. Most dramatically, the 2019–2020 Australian bushfires, fueled by record heat and drought, raged for four months across over 10 million hectares of forest, resulting in the death of an estimated 3 billion animals [2]. These events underscore how forest fires have escalated into one of the world’s most destructive natural disasters. The emerging pattern of concurrent major pandemics and heightened wildfire risks, as observed in recent years, presents complex new challenges for global forest fire prevention and management strategies.
A novel coronavirus capable of causing pneumonia emerged in late December 2019 [3]. This disease, caused by severe acute respiratory syndrome coronavirus 2 (SARS-CoV-2) [4,5,6] was officially designated as Coronavirus Disease 2019 (COVID-19). The rapid global spread of COVID-19 posed significant threats to public health worldwide and generated profound socioeconomic impacts [7]. The highly contagious nature of the virus [8] prompted numerous countries to implement stringent containment measures in response to the alarming infection and mortality rates. These interventions included urban lockdowns, prohibition of mass gatherings, industrial facility closures, and mobility restrictions [9,10,11]. While these measures proved effective in mitigating disease transmission and controlling outbreak severity, they simultaneously disrupted normal societal functioning and substantially altered human activity patterns [12]. The COVID-19 lockdown measures resulted in remarkable reductions in atmospheric pollutants and greenhouse gas emissions worldwide [13,14,15]. The collective pandemic response contributed to a 7% decline in global fossil fuel-related CO2 emissions in 2020 compared to 2019 levels [16]. The emission changes induced by COVID-19 containment policies may potentially influence Earth’s radiative balance and climate patterns.
The COVID-19 pandemic has significantly altered human behavioral patterns and social norms, including transformations in workplace arrangements, transportation modes, consumption habits, and trade practices [17,18]. These changes primarily resulted from various government-imposed movement restrictions implemented to mitigate viral transmission. The “stay-at-home” orders, in particular, represented an unprecedented global-scale “confinement experiment” [19], providing valuable opportunities to examine anthropogenic impacts on ecosystems through comparative data analysis, thereby informing biodiversity conservation strategies. Recent studies have utilized citizen science data from online platforms to assess pandemic-induced disturbances to regional biodiversity [20].
Regarding biodiversity impacts, scholarly opinions remain divided. While some researchers maintain an optimistic outlook [21,22], others adopt a more cautious stance [23]. Emerging evidence suggests the pandemic may have exacerbated biodiversity loss [24,25]. From a forest ecosystem perspective, Sannigrahi et al. [26] investigated wildfire-COVID-19 relationships, while Lugo-Robles et al. [27] evaluated forest cover changes during the pandemic. Notably, research on western U.S. wildfire weather risks indicates that pandemic-related aerosol reductions contributed significantly to increased fire activity, accounting for approximately 34% of observed wildfire weather risk enhancement in the southwestern United States during 2020.
Wildfires represent a significant source of atmospheric gaseous pollutants and particulate matter, exerting profound impacts on the global climate system, atmospheric environment, and ecosystems [28]. They contribute substantially to the release of greenhouse gases and carbonaceous particles, serving as a crucial driver of global climate change. Wildfire emissions have emerged as a major pollution source at both regional and global scales, with these pollutants directly influencing radiation budgets, visibility, and greenhouse effects. The unprecedented COVID-19 pandemic, representing a global health crisis of historic proportions, has not only transformed societal norms and economic activities but also significantly altered environmental dynamics, particularly wildfire patterns. While current research has primarily focused on assessing the pandemic’s impacts on atmospheric particulate matter (e.g., aerosols), air quality, and biodiversity [29,30], few studies have systematically examined regional and global wildfire hotspot variations during this period. The implementation of comprehensive containment measures—including lockdowns, travel restrictions, and behavioral modifications—has induced notable changes in wildfire regimes across diverse geographical regions [31,32]. These alterations stem from modified land-use practices, reduced anthropogenic pressures on natural ecosystems, and adjustments in resource management strategies. For instance, decreased industrial operations and transportation emissions during lockdown periods may have modified atmospheric conditions, potentially affecting wildfire ignition probabilities and propagation characteristics [33]. Furthermore, the diversion of resources toward pandemic response efforts may have influenced wildfire prevention and suppression capabilities. This study conducts a comparative analysis of wildfire hotspot distribution patterns and their temporal variations in global fire-prone regions before and after the COVID-19 outbreak, while proposing corresponding mitigation strategies based on the findings. The investigation employs multiple methodological approaches including satellite remote sensing, statistical modeling, and spatial analysis techniques to comprehensively assess pandemic-induced changes in wildfire activity.

2. Materials and Methods

2.1. Data Resource

The data 2010–2022 MODIS C61 hotspots (MODIS Collection 61 NRT Hotspot/2024.5 Active Fire Detections MCD14DL distributed from NASA FIRMS. Available online at https://earthdata.nasa.gov/firms. doi:10.5067/FIRMS/MODIS/MCD14DL.NRT.0061 (accessed on 28 October 2024)) were for this study, including attributes such as Continent, Sovereignty, Year, Month and Fires.

2.2. Research Methods

The COVID-19 period is defined as the three-year span from 2020 to 2022, while the pre-COVID-19 five-year period covers 2015–2019, and the pre-COVID-19 decade includes 2010–2019. The following eight epidemic scenarios are defined: (A) the anomaly between 2020 and the pre-COVID-19 five years; (B) the anomaly between 2020 and the pre-COVID-19 decade; (C) the anomaly between 2021 and the pre-COVID-19 five years; (D) the anomaly between 2021 and the pre-COVID-19 decade; (E) the anomaly between 2022 and the pre-COVID-19 five years; (F) the anomaly between 2022 and the pre-COVID-19 decade; (G) the anomaly between the mean of the COVID-19 period and the pre-COVID-19 five years; and (H) the anomaly between the mean of the COVID-19 period and the pre-COVID-19 decade. Origin 2024 was used to analyze and plot the distribution of hotspots in years, months, continents, and countries/administrative regions before and after the COVID-19 incidents, quantifying the changes in the number of hotspots in each country/administrative region under the eight scenarios. An El Niño (or La Niña) event is defined as the 3-month moving average of the Niño 3.4 index being > 0.5 (<−0.5) and lasting for at least 5 months. Arcis Pro 3.0 was used to analyze and plot the distribution of hotspot density in each country/administrative region under the eight scenarios.

3. Results

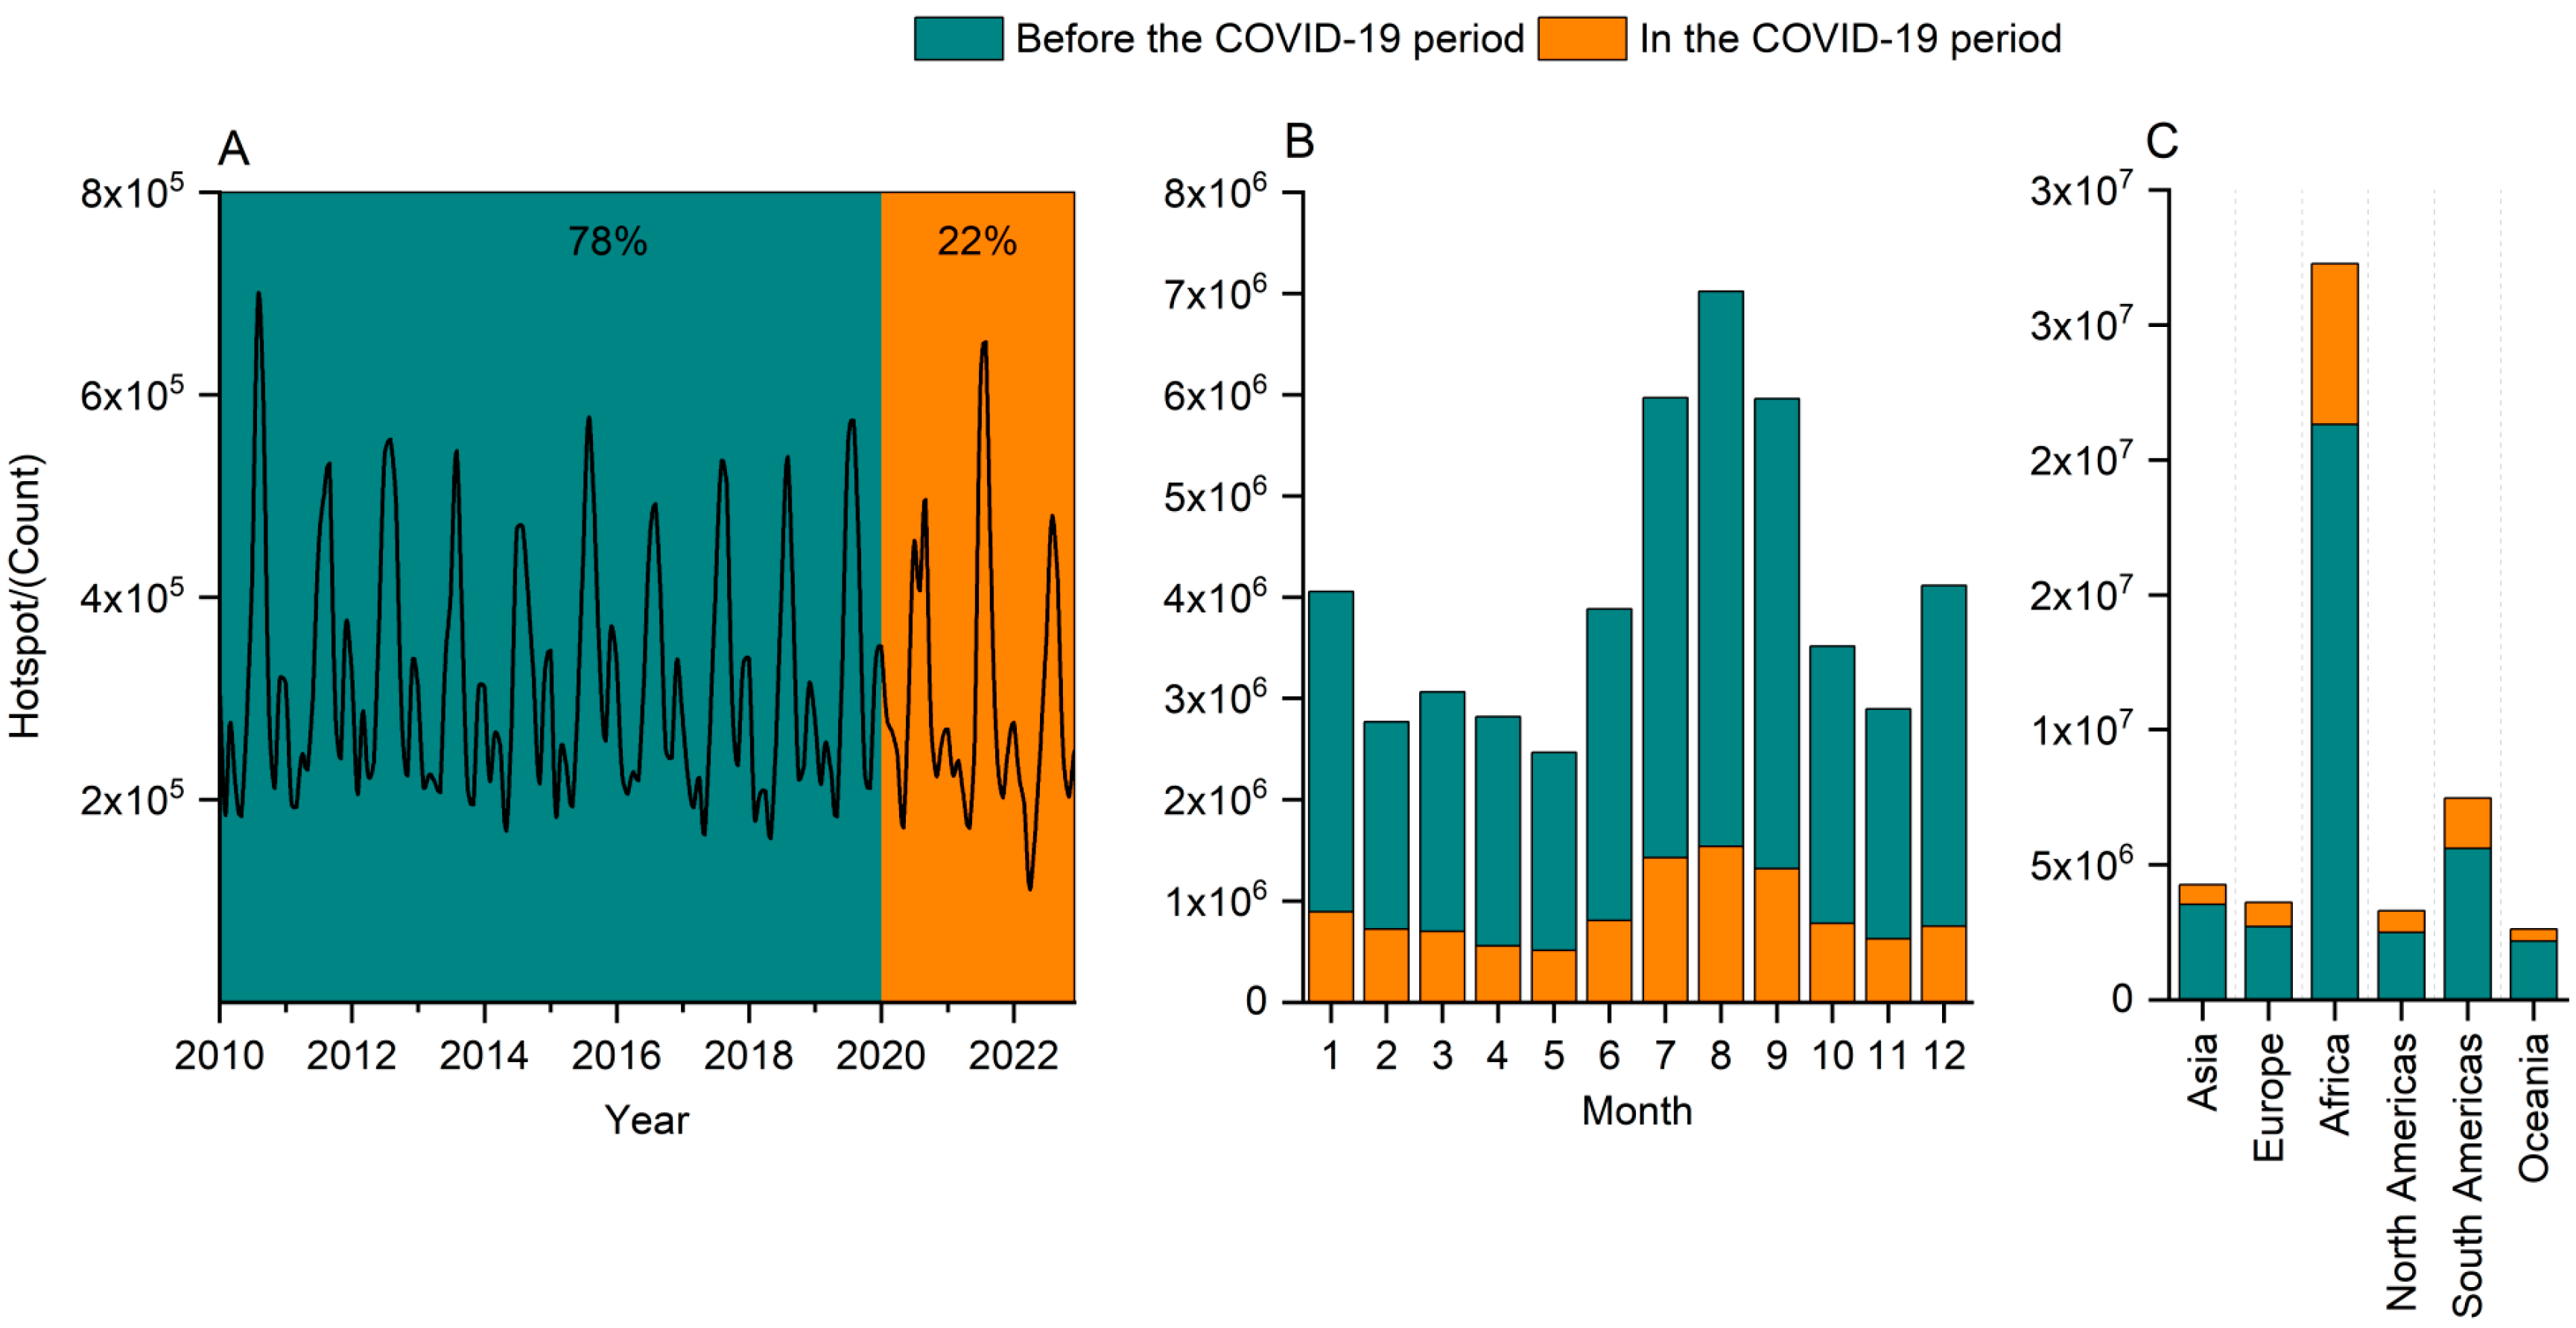
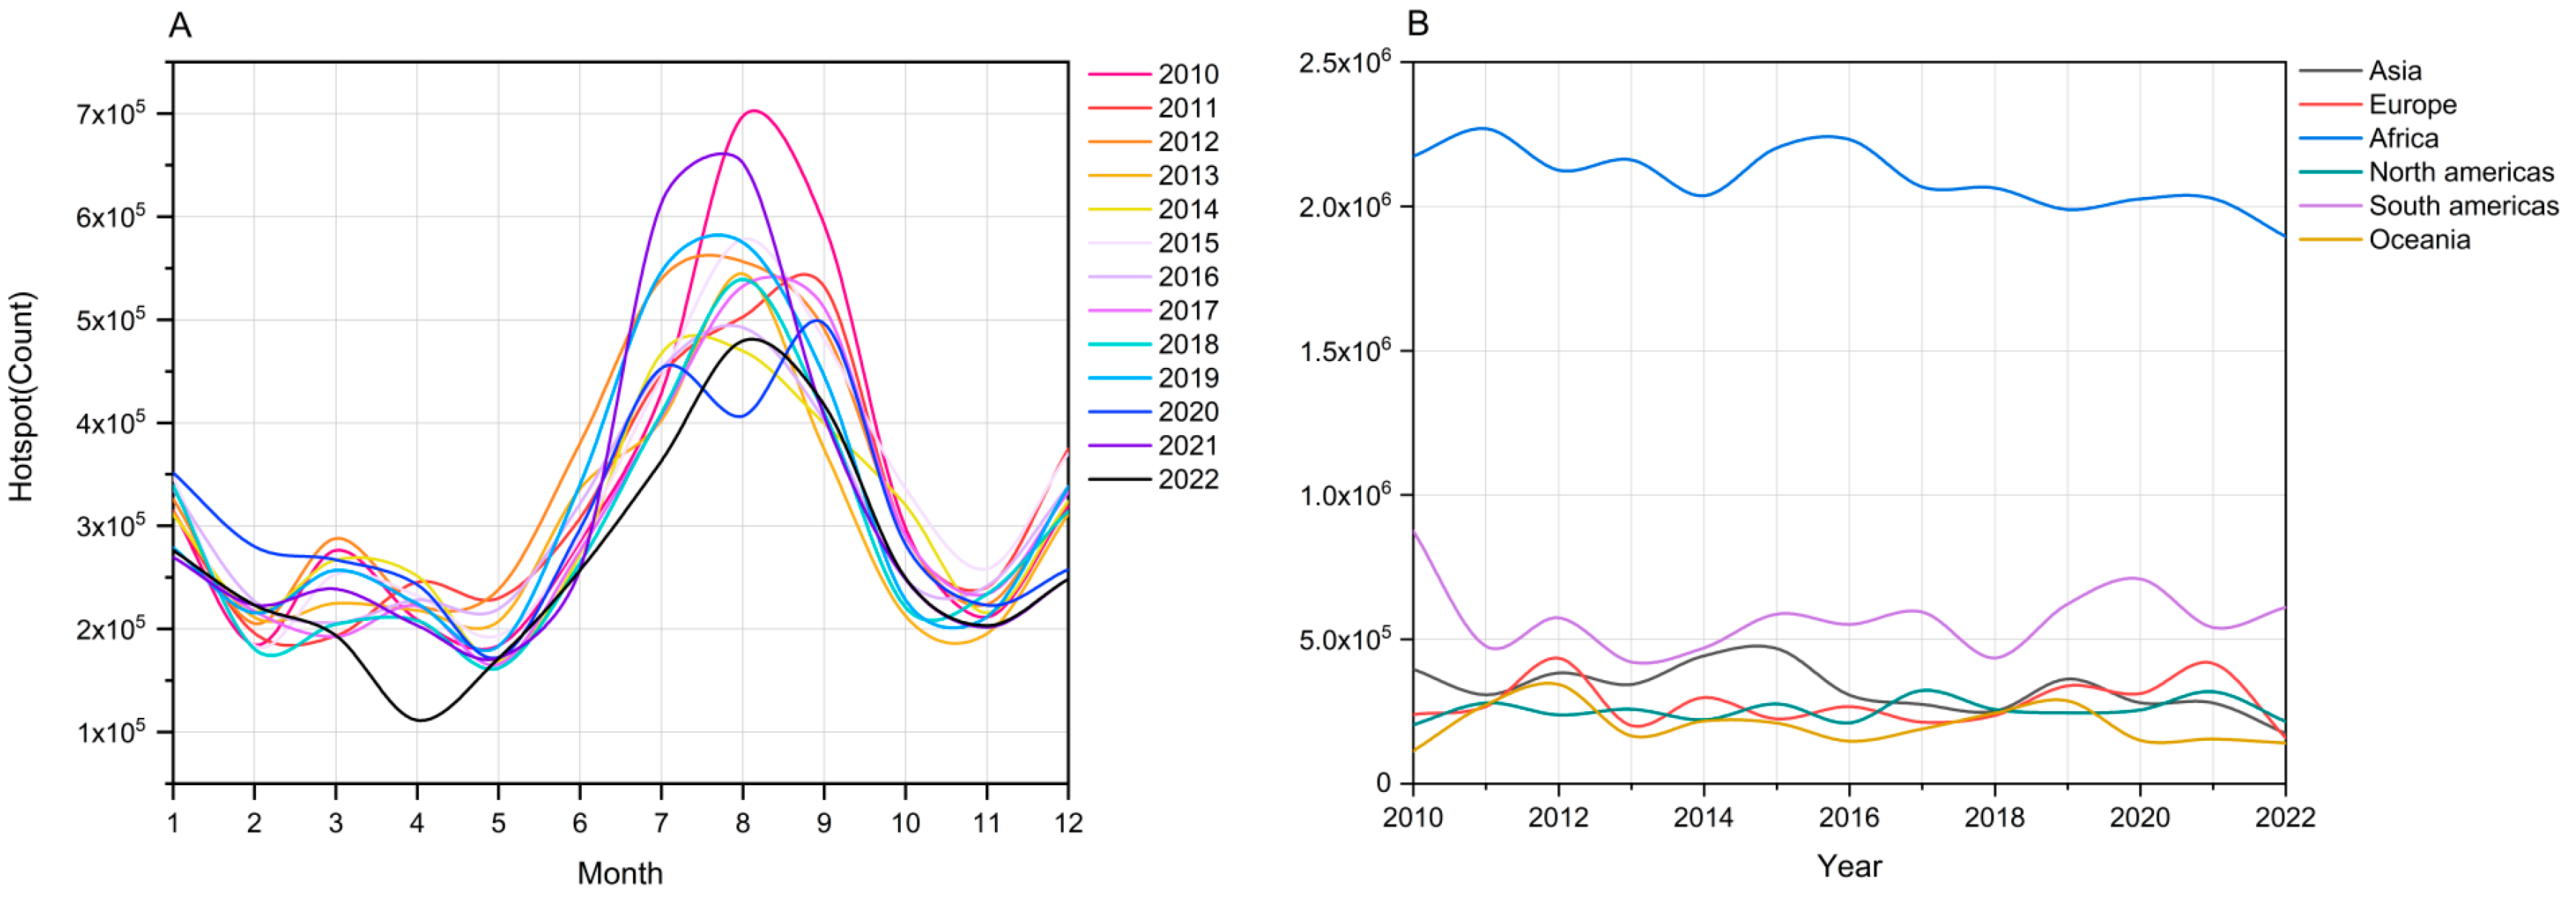
3.1. Changes in the Number of Global Hotspots Before and After the COVID-19 Incidents

From 2010 to 2022, a total of 48,534,804 wildfire hotspots were detected globally, with 10,659,471 hotspots occurring during the COVID-19 incidents (2020–2022), accounting for 22% of the total (Figure 1A). Prior to the COVID-19 incidents, the peak in hotspot activity was observed in August 2010, while the lowest point was recorded in May 2018. During the COVID-19 incidents, the peak and trough occurred in August 2021 and April 2022, respectively, representing a decrease of 6.5% and 31.2% compared to historical peak and trough levels (Figure 2A). Among the 12 months, August recorded the highest number of hotspots (7,024,757), while May had the lowest (2,467,992). During the COVID-19 incidents, the highest proportion of hotspots occurred in February (26.3%), whereas the lowest proportion was observed in December (18.3%) (Figure 1B).
Among the seven continents globally, no hotspots were detected in Antarctica (Figure 1C). Africa recorded the highest number of hotspots (56.2%), showing a declining trend during the COVID-19 incidents (Figure 2B). South America ranked second in hotspot count (15.4%), exhibiting an increasing trend during the pandemic (Figure 2B) and the highest proportion of hotspots during the COVID-19 incidents (24.9%) (Figure 1C). Oceania had the fewest hotspots (5.4%), with a declining trend during the COVID-19 incidents (Figure 2B) and the lowest proportion of hotspots during the COVID-19 incidents (16.9%) (Figure 1C).

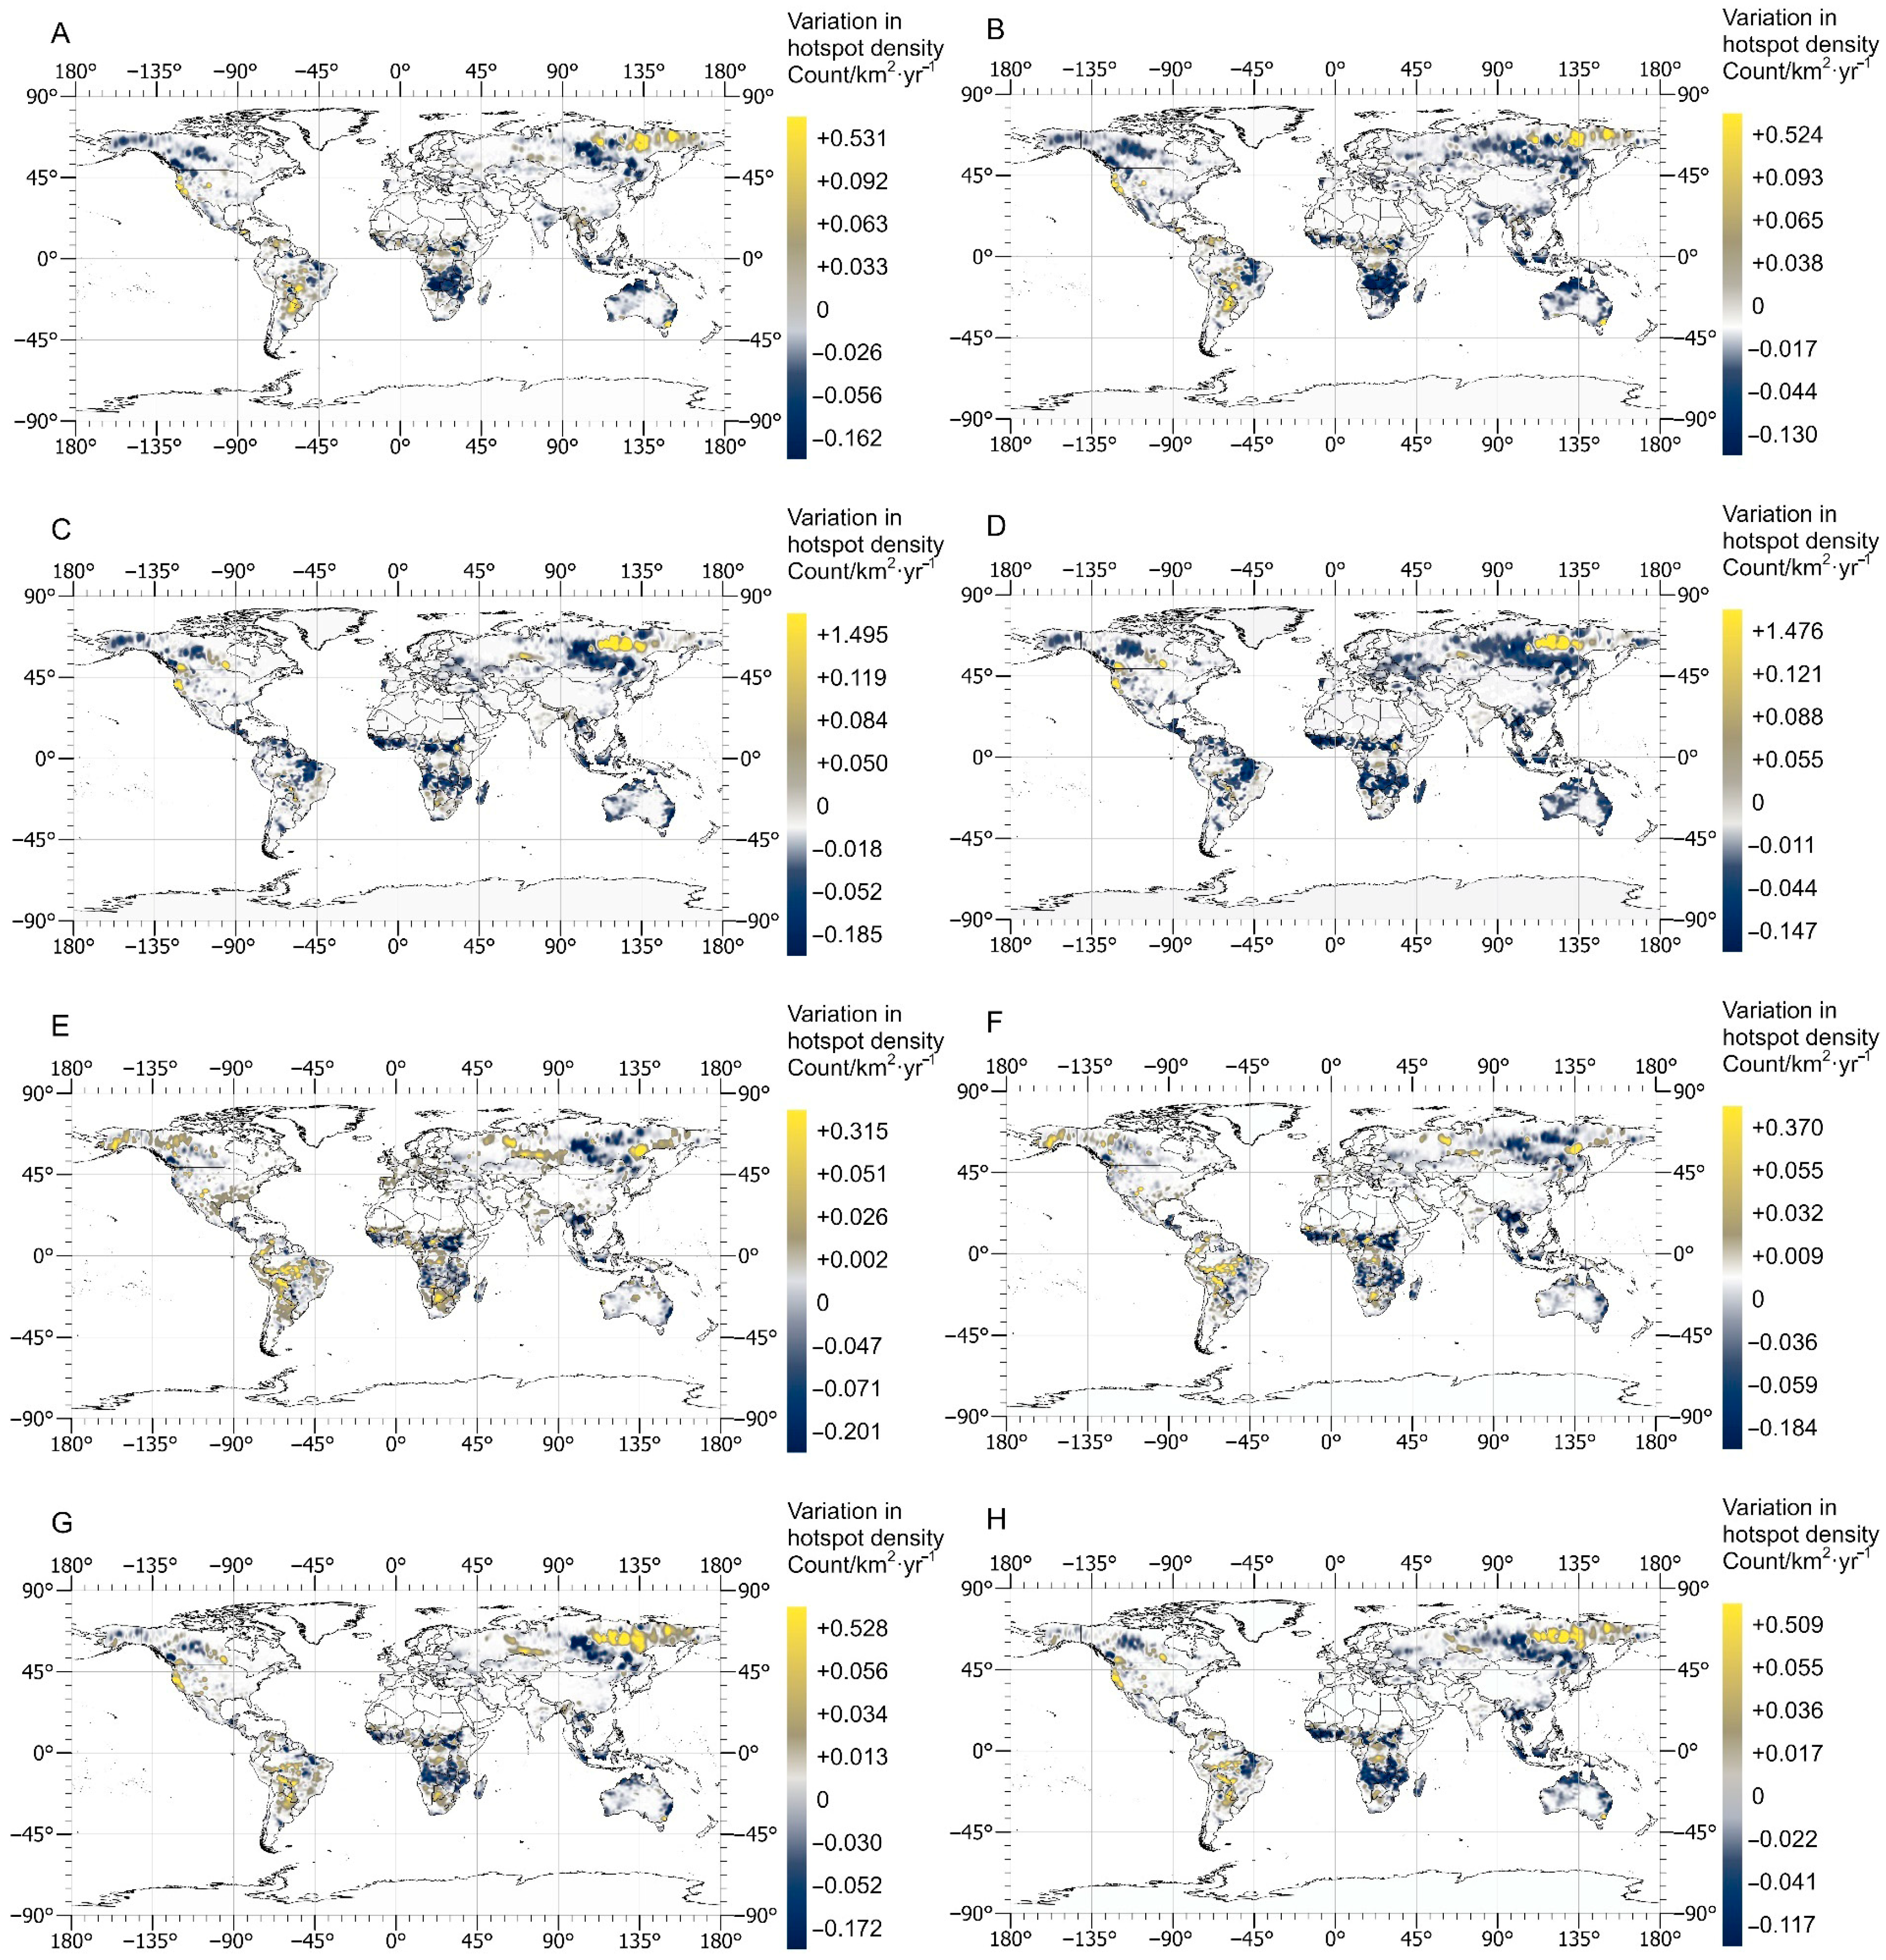
3.2. Changes in the Spatial Distribution Patterns of Global Hotspot Counts Before and After the COVID-19 Incidents

The spatial distribution pattern of hotspot density per unit area during the 5-year pre-COVID-19 incidents (2015–2019) underwent significant changes over the 3-year COVID-19 incidents. Compared to 2015–2019, hotspots increased notably in 2020 along the western coast of the United States, the Far East, central South America, and northeastern Australia, while they decreased significantly in central and western Canada, South Africa, Southeast Asia, northern Australia, central Russia, and the China–Russia border regions (Figure 3A). By 2021, the areas experiencing hotspot reductions expanded further, including Central Africa, South Africa, Australia, and South America, with only a few hotspot-dense regions remaining in central Russia, the western coast of the United States, and the U.S.–Canada border areas (Figure 3C). Although 2022 recorded the lowest number of global hotspots, the regions with increased hotspots became more widespread, particularly in North America, South America, Central and Southern Africa, and Europe (Figure 3E). Overall, the average hotspot changes from 2020 to 2022, compared to 2015–2019, were reflected in hotspot-dense regions such as the Far East, Central and Southern Africa, South America, and the western coast of the United States, as well as hotspot-sparse regions like Australia, Canada, Southeast Asia, Central Africa, and Southern Africa (Figure 3G). Extending the comparison to the 10-year pre-COVID-19 incidents (2010–2019) revealed that, compared to the 5-year pre-COVID-19 incidents (2015–2019), hotspot-dense regions contracted further, and hotspot-sparse regions expanded more widely, indicating a more pronounced effect of the pandemic in reducing hotspot numbers. However, no significant alterations were observed in the overall distribution pattern (Figure 3B,D,F,H).

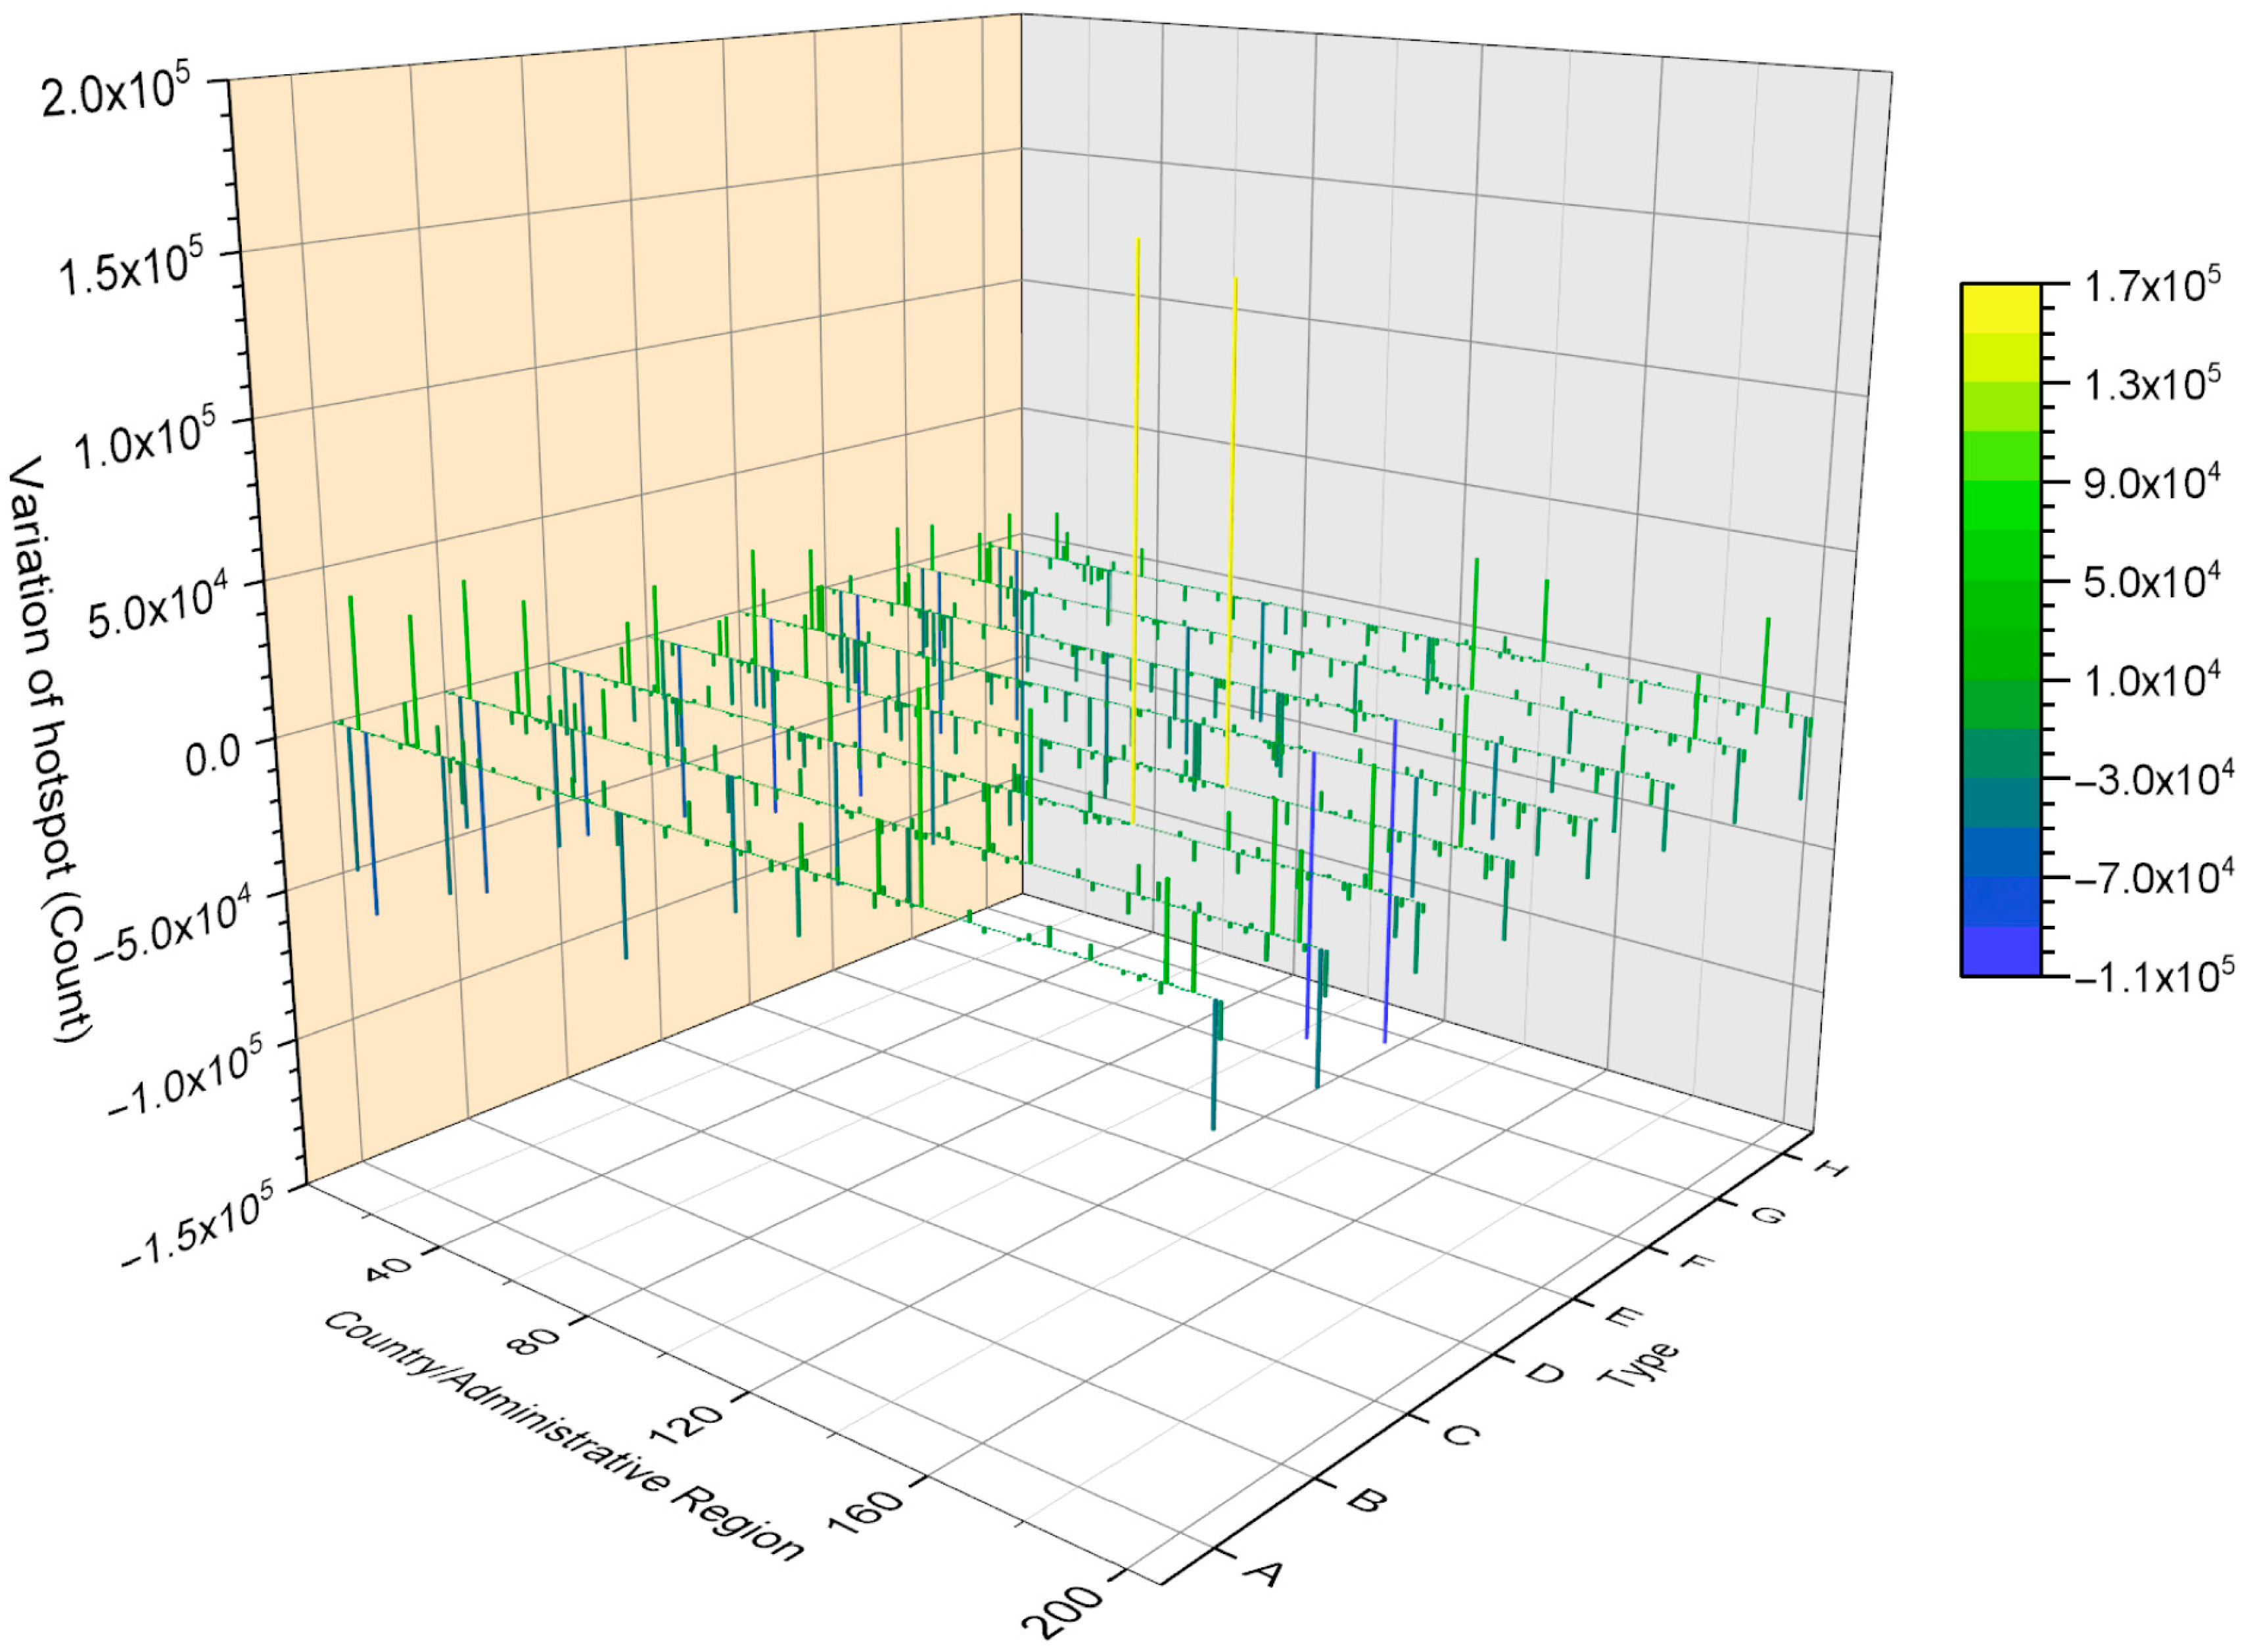
3.3. Comparison of Hotspot Changes Across Countries/Administrative Regions Globally Before and After the COVID-19 Incidents

In 2020, our analysis revealed significant spatial heterogeneity in hotspot changes across 206 countries/administrative regions compared to the pre-pandemic period (2015–2019) (Figure 4A,B). Notably, 94 regions exhibited positive hotspot changes (>0) (Figure 5A), including eight regions with substantial increases exceeding 10,000 hotspots, where Russia demonstrated the most pronounced increase (59,990) (Figure 4A). Conversely, 91 regions showed negative hotspot changes (<0) (Figure 5A), with nine regions experiencing decreases greater than 10,000, among which Australia showed the most significant reduction (−60,380). Twenty-one regions maintained stable hotspot levels without observable changes (Figure 4A).
Extending our temporal analysis to the decade preceding the pandemic revealed dynamic spatial-temporal patterns. The comparative analysis showed that 80 regions maintained positive hotspot changes, while 107 regions exhibited negative changes (Figure 5B). Notably, the number of regions with changes exceeding 10,000 hotspots decreased by one, with Myanmar showing a substantial reduction from 13,333 to 3329 hotspots. The number of regions with unchanged hotspot status decreased by two.
The extended temporal analysis demonstrated an overall reduction in hotspot changes compared to the five-year pre-pandemic baseline. For instance, Russia’s hotspot increase diminished from 59,990 to 44,209 (26.3% reduction), while Australia’s negative change intensified from −60,380 to −65,274 (8.7% increase). Remarkable spatial reversals were observed in several regions, including Botswana (transitioning from 1067 to −6201) and the Central African Republic (shifting from −4514 to 5165) (Figure 4B). This substantial interannual variability in hotspot distribution across the study period (2010–2019) highlights the dynamic nature of spatial-temporal patterns in these regions. The complete statistical breakdown of country/administrative region data is presented in Table S1.
The 2021 analysis revealed significant shifts in hotspot distribution patterns compared to both 2020 and pre-pandemic baselines. When compared to the five-year pre-pandemic average (2015–2019), the number of regions exhibiting positive hotspot changes (>0) decreased to 74, while those showing negative changes (<0) increased to 110 (Figure 5A,C). Extending the comparison to the ten-year pre-pandemic baseline (2010–2019) showed more pronounced changes, with positive-change regions decreasing to 63 and negative-change regions increasing to 123 (Figure 5B,D).
Spatial heterogeneity remained evident, with Russia maintaining an exceptionally high hotspot count of 166,294, 4.6 times greater than the second-ranking region (Figure 4C). Australia continued to show the lowest hotspot numbers, consistent with its 2020 pattern (Figure 4C,D). Remarkable spatial reversals were observed in several regions: Canada transitioned from −44,298 to 35,950 hotspots (Figure 4A,C), while Brazil shifted from 37,792 to −16,394 (Figure 4B,D). These substantial interannual variations highlight significant temporal dynamics in hotspot distribution patterns between 2020 and 2021.
The year 2022 marked the lowest hotspot activity during the three-year pandemic period. Comparative analysis against the five-year pre-pandemic average revealed that 62 regions exhibited positive hotspot changes (>0), while 121 regions showed negative changes (<0) (Figure 5E). Notably, only four regions demonstrated substantial changes exceeding 10,000 hotspots, with Bolivia showing the maximum increase (28,413) and Russia exhibiting the most significant decrease (−94,102.8) (Figure 4E).
Extending the comparison to the ten-year pre-pandemic baseline (2010–2019) showed more pronounced changes: positive-change regions decreased to 51, while negative-change regions increased to 134 (Figure 5F). The number of regions with changes exceeding 10,000 hotspots reduced to two, maintaining Bolivia as the highest-positive-change region (28,203) and Russia as the lowest-negative-change region (−109,883.6) (Figure 4F).
Comparative analysis revealed distinct spatial patterns in hotspot changes across different temporal scenarios. When compared to the five-year pre-pandemic average, 84 regions exhibited positive hotspot changes (>0) with a mean value of 2078, while 100 regions showed negative changes (<0) averaging −3553. Twenty-two regions maintained stable hotspot levels without observable changes (Figure 4G and Figure 5G). Extending the comparison to the ten-year pre-pandemic baseline showed that positive-change regions decreased to 70 (average value: 2171), negative-change regions increased to 118 (average value: −3274), and there were no changes in 18 countries/administrative regions (Figure 4H). Spatial heterogeneity was evident, with Russia demonstrating the most substantial hotspot changes and Australia showing the least variation.
A comprehensive analysis of all eight scenarios revealed consistent patterns: in seven out of eight scenarios (excluding scenario a), regions with negative hotspot change rates significantly outnumbered those with positive changes. The most pronounced disparity occurred in scenario F. Across all scenarios, the majority of regions (countries/administrative regions) exhibited hotspot change rates within the −20% to 20% range (Figure 5).

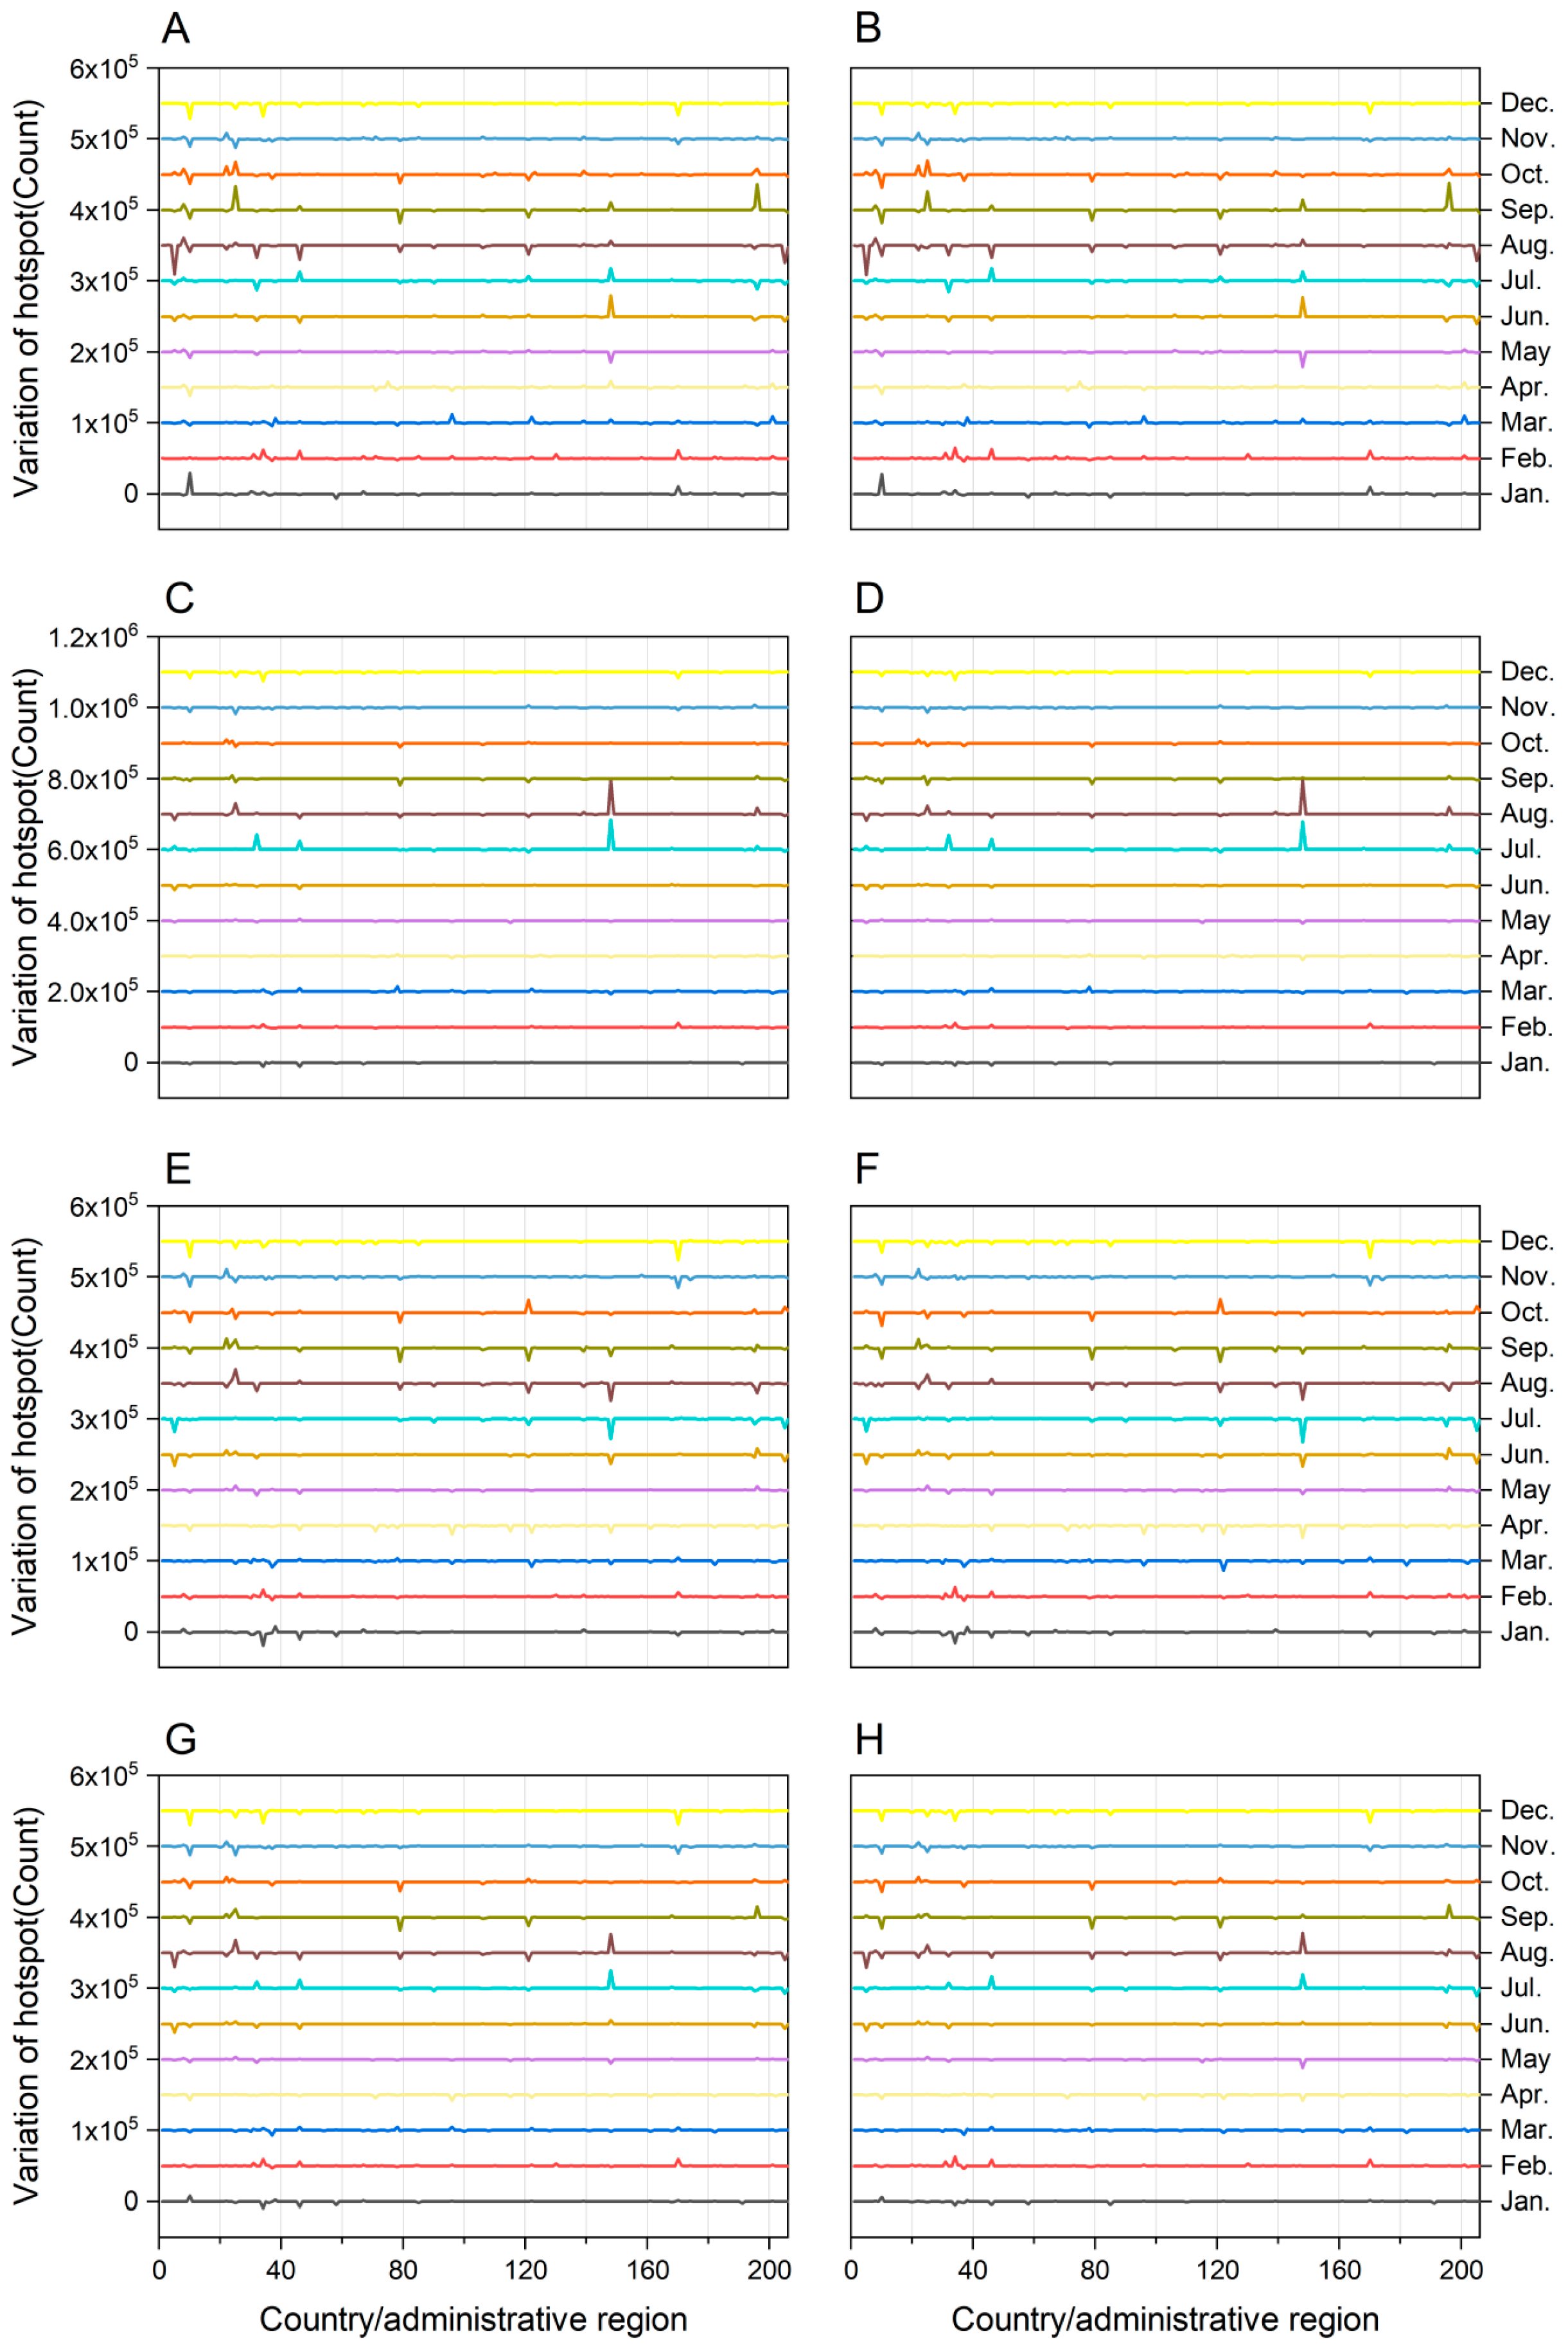
3.4. Comparison of Monthly Hotspot Changes Across Countries/Administrative Regions Globally Before and After the COVID-19 Incidents

The monthly hotspot changes across countries/administrative regions under different scenarios were adjusted with a Y-offset to facilitate comparisons of inter-monthly variations (Figure 6). In 2020, an increasing trend in hotspot changes was observed in February and March, though the magnitude was relatively small. Significant hotspot variations were concentrated in August, September, and October (Figure 6A,B). In 2021, the extremes occurred in July and August (Figure 6C,D). In 2022, most months exhibited a declining trend in hotspots (Figure 6E,F). Overall, during the three years of the COVID-19 incidents, December showed a pronounced decline in global hotspots, while April displayed the least noticeable changes in hotspot patterns. Within the same month, variations in hotspot changes across countries/administrative regions were influenced by factors such as population, climate, and pandemic policies. For instance, in densely populated and hot regions like South Africa and Southeast Asia, frequent anthropogenic fire sources significantly decreased due to restricted human activities during the pandemic. However, in areas where pandemic policies failed to effectively limit human activities, the decline in hotspots was less pronounced, and in some cases, an increasing trend was observed. Across different months, the trends in monthly hotspot changes also varied by country/administrative region. Some regions exhibited small and consistent monthly variations (all >0 or all <0), while others showed large and inconsistent monthly variations. This indicates that even within the same country/administrative region, the impact of the COVID-19 incidents on hotspot numbers exhibited seasonal variations.
During the pandemic period, while no El Niño event was recorded, the persistent climatic anomalies associated with the 2019 El Niño event (Figure 7), coupled with Arctic amplification effects, likely intensified the high-temperature drought conditions in the Russian Far East. This phenomenon may explain the enhanced wildfire activity observed across Russia in 2020. These findings imply that even during non-strong El Niño years, prolonged climate warming can substantially increase wildfire risks in high-latitude regions through the amplification of fuel dryness. A notable transition occurred from late 2020 to early 2021 with the development of a strong La Niña event, which exhibited remarkable temporal synchronization with a significant reduction in wildfire incidents throughout Australia. Subsequently, during July–August 2021, the Nino 3.4 index demonstrated a substantial rebound, concurrent with a dramatic increase in wildfire hotspots across Canada and Siberia compared to the corresponding period in 2020. This temporal correspondence strongly suggests that summer wildfire patterns in the Northern Hemisphere are predominantly governed by climatic drivers rather than anthropogenic ignition sources.
The ENSO phenomenon exerted a significant influence on fire activity patterns across Southeast Asia and Western Asia. The 2019–2020 El Niño event induced characteristic drought conditions in Southeast Asia (Figure 7), leading to a marked increase in fire hotspots during 2020 compared to the five-year average: Myanmar (31%), Laos (27%), and Thailand (33%). Conversely, Indonesia and Malaysia experienced substantial reductions in hotspot activity (80% and 50% decreases, respectively), attributable to stringent policies restricting human activities.
The subsequent dual La Niña events (2020–2022) enhanced monsoon moisture delivery throughout Southeast Asia, resulting in a consistent interannual reduction pattern across most countries (2020 > 2021 > 2022). Notably, the cumulative effect of consecutive La Niña events produced a more pronounced decline in hotspot frequency during 2022 (range: 19–60%; mean: 40%) compared to 2021 (range: 4–56%; mean: 25%). In Western Asia, the El Niño period was associated with divergent hotspot patterns: Afghanistan (228%), Lebanon (159%), and Syria (75%) exhibited substantial increases in 2020 relative to the five-year baseline, while Armenia (−74%), Azerbaijan (−47%), and Turkey (−31%) showed significant reductions. During the La Niña phase (2020–2022), Armenia demonstrated consecutive annual increases (29% in 2021; 151% in 2022), whereas Syria (−81%, −41%), Lebanon (−13%, −81%), and Iraq (−7%, −9%) displayed consistent downward trends. This bidirectional response of fire activity to ENSO variability underscores the complex interplay between climatic forcings, anthropogenic factors (including COVID-19 restrictions), and regional geopolitical instability.

4. Discussion

The strong link between human activities and wildfire incidence was well-documented prior to the COVID-19 pandemic [34]. Historical data reveal that from 1992 to 2012, human activities directly triggered 84% of wildfires in the United States, accounting for 44% of the total burned area and exceeding the extent of lightning-induced fires by sevenfold [35]. Our analysis indicates that the observed decline in wildfire hotspots during the pandemic (2020–2022) likely resulted from reduced human ignitions due to lockdown measures, compounded in some regions by anomalous weather conditions such as La Niña-induced precipitation. Notably, August 2021 saw a 6.5% reduction in fire hotspots compared to pre-pandemic peaks, a trend attributable to both climatic variability and policy-driven delays in the high fire season [36,37]. The more pronounced 31.2% decline in April 2022 underscores the combined effects of sustained fire suppression policies and fuel management. Regional variations further highlight the interplay of anthropogenic and climatic drivers. In tropical pyromes, February peaks persisted due to continued agricultural burning—a practice resilient to pandemic restrictions—while weakened firefighting capacity allowed small ignitions to escalate [38]. Conversely, December’s low fire activity reflected reduced natural ignitions, Northern Hemisphere winter wetness, and curtailed human mobility. Critically, climate change has amplified fire risks independently of human ignition patterns. Anthropogenic warming contributed to 55% of the increased fuel aridity in the western United States forests from 1979 to 2015 [39], while in western Canada, human-induced climate forcing raised the likelihood of extreme fire weather sixfold between 2011 and 2020, prolonging fire seasons [40]. Similarly, attribution studies demonstrate that anthropogenic climate change elevated fire weather risk by over 30% during Australia’s catastrophic 2019–2020 bushfires compared to pre-industrial conditions [41]. Rising temperatures have intensified soil and vegetation moisture loss, heightening fuel flammability and enabling unprecedented events like the 2020–2021 North American megafires and Arctic Siberian burns [42,43], neither of which were suppressed by pandemic-related behavioral changes.
China pioneered large-scale containment measures, implementing strict travel restrictions as early as 23 January 2020—a policy approach subsequently adopted by India on 24 March 2020. These interventions yielded immediate atmospheric improvements, with Sharma et al. [44] documenting substantial decreases in key pollutants across India, including 43%, 31%, 10%, and 18% reductions in PM2.5, PM10, CO, and NO2 concentrations, respectively, during lockdown periods compared to baseline levels. Similar emission declines were observed following Europe’s mid-March 2020 containment measures. Paradoxically, these air quality improvements generated unexpected climatic feedbacks. The reduction in atmospheric aerosols enhanced surface warming in several regions, with the western United States experiencing particularly pronounced temperature increases coupled with decreased precipitation and relative humidity due to attenuated water vapor transport [45]. This atmospheric reorganization significantly amplified wildfire weather risk, with pandemic-related aerosol reductions explaining approximately 34% of the elevated fire danger observed across the southwestern United States in 2020. The global footprint of these changes became evident through climate modeling, which identified consistent surface temperature anomalies of 0.05–0.15 K in eastern China (January–March) and 0.04–0.07 K across Europe, the eastern United States and South Asia (March–May) during peak lockdown periods [46]. The pandemic years (2020–2022) revealed striking spatial disparities in wildfire activity, demonstrating how regional climate anomalies interacted with human interventions. The inaugural pandemic year witnessed extreme polarization, with Russia’s record 59,990 hotspot increase—fueled by unprecedented Arctic warming and permafrost degradation—contrasting sharply with Australia’s 60,380 hotspot reduction following vegetation recovery from the 2019–2020 “Black Summer” fires and La Niña enhanced precipitation [47]. By 2021, this divergence had intensified, with 74 regions showing increased fire activity against 110 exhibiting declines. Russia’s wildfire system entered a new regime, registering 166,294 hotspots—4.6 times more than the next most affected region—as persistent drought and accumulated warming overwhelmed natural variability. Canada’s dramatic reversal from a 44,298 hotspot reduction in 2020 to a 35,950 increase in 2021 highlighted the climate system’s growing dominance, with relaxed containment measures coinciding with the catastrophic “heat dome” event to create ideal fire conditions [48]. The final pandemic year (2022) marked a transitional phase where climate-driven extremes became unequivocally predominant. While 121 regions recorded reduced hotspot activity—the lowest three-year total—climate anomalies generated new fire epicenters. Russia’s 94,102 hotspot decrease during unusually wet conditions was offset by Bolivia’s 28,413 surge in agricultural fires following policy reversals, while Western Europe emerged as a novel wildfire hotspot as drought conditions ignited destructive fires across France and Spain. This progression from policy-mediated fire suppression to climate-driven fire amplification reflects a shift in global fire regimes. Long-term analysis (2010–2022) contextualizes these pandemic-era patterns within broader Earth system trends. Successful fire reduction in Southeast Asia and Canada demonstrates how targeted interventions like Indonesia’s peatland restoration can synergize with favorable climate cycles to enhance resilience [49]. Conversely, Russia’s extreme interannual variability—with hotspot counts fluctuating by over 250,000—provides a stark indicator of Arctic amplification, where warming rates triple global averages [50]. The abrupt fire regime shifts observed in regions like Botswana, where disrupted rainfall patterns have overridden traditional human influences, underscore climate change’s capacity to rapidly reorganize ecological disturbance patterns.
The COVID-19 pandemic has significantly diverted governmental resources, with fire management budgets and personnel in many regions being reallocated to address public health emergencies, consequently diminishing wildfire prevention and suppression capacities. A notable example occurred in 2020 when California and the United States of America faced critical shortages in emergency response capabilities due to the compounded pressures of pandemic containment and unprecedented wildfire activity [51]. While reduced human activities initially suppressed certain wildfire incidents during the early stages of the pandemic, long-term analyses suggest that systemic factors—including resource constraints, economic pressures, and climate anomalies—may ultimately exacerbate fire risks [52]. Our findings reveal that regions exhibiting increased wildfire activity in 2020 (e.g., the western coastal region of the United States, the Russian Far East, and central South America) were primarily influenced by extreme weather events and anthropogenic factors [53]. Conversely, areas with reduced fire incidence (e.g., central-western Canada and Southeast Asia) likely benefited from stringent pandemic containment measures and targeted policy interventions [54,55]. This spatial heterogeneity underscores the complex interplay between climatic variability and human influence on fire regimes. By 2021, wildfire hotspots had further diminished in several regions, attributable to synergistic effects of natural climate variability—including La Niña induced precipitation anomalies—and ecological recovery processes. La Niña directly suppressed vegetation combustion conditions by enhancing precipitation in eastern Australia, thereby exerting short-term regulation on wildfires [56]. It should be noted, however, that the shortage of firefighting resources caused by the pandemic, such as delays in planned burns may have partially offset the fire-extinguishing effect of precipitation, suggesting the complex interaction between climate and human intervention [57]. Long-term (decadal-scale) analysis demonstrates that while the pandemic temporarily contracted the spatial extent of fire-prone areas and reinforced anthropogenic fire suppression effects, the global distribution of wildfire activity remained fundamentally stable. This persistence reaffirms the dominant role of climate-vegetation dynamics in shaping fire regimes. The observed pattern of “short-term perturbation, long-term stability” wherein abrupt restrictions on human mobility (e.g., COVID-19 lockdowns) transiently suppressed ignition sources without fundamentally altering climate-driven fire regimes-highlights the resilience of natural fire systems to exogenous anthropogenic shocks. This reinforces the overarching influence of climatic drivers on global wildfire behavior.
The modest increase in fire hotspots during February–March 2020 likely reflects the carryover effect of agricultural burning practices from the preceding summer season in the Southern Hemisphere [58,59]. From August to October 2020, dramatic fluctuations in Northern Hemisphere fire activity underscored the prevailing influence of climatic anomalies. This period saw two notable events: unprecedented August temperatures in Siberia that ignited widespread tundra fires [60], followed by catastrophic “super wildfires” along the western coastal of the United States in September that drove hotspot counts to their monthly peak [61]. The subsequent sharp global decline in December hotspots resulted from the combined effects of reduced natural fire sources during Northern Hemisphere winter and stringent Christmas lockdown measures, collectively producing a characteristic bimodal annual fire distribution pattern. In 2021, fire activity showed remarkable temporal concentration, with July–August accounting for the majority of hotspots as prolonged droughts in Canada and Siberia drove fire occurrence to record levels. While 2022 generally exhibited reduced hotspot activity across most months, April emerged as a distinct policy/climate transition period—occurring after the Southern Hemisphere rainy season but before Northern Hemisphere fire season onset, resulting in minimal fire activity changes. Our analysis reveals important spatial contrasts: tropical regions with dense populations showed strong fire suppression correlated with vaccination rollout timing, while climate-sensitive zones displayed complete independence from pandemic effects, responding solely to extreme weather conditions.
This study corroborates two fundamental findings from prior research on human-wildfire relationships: First, the pandemic-induced reduction in anthropogenic ignition sources strongly aligns with Balch et al. [35] estimation that 84% of wildfires are human-caused. Second, the extreme fire surges observed in Siberia and Canada validate Abatzoglou et al. [39] projection that climate warming would become the dominant driver of high-latitude wildfires, demonstrating that even abrupt anthropogenic disturbances cannot override long-term climate-driven fire trends. Contrary to expectations, our analysis reveals an unexpected decrease in wildfire activity across tropical regions during pandemic periods. More significantly, we identify a polarization effect in fire responses tied to regional policy stringency—exemplified by contrasting trends between Brazil and South Africa. Our monthly hotspot analysis provides novel insights, including the first documentation of short-term policy impacts such as the “December 2020 global fire dip.” The hotspot density algorithm employed here demonstrates greater sensitivity to anthropogenic influences than conventional burned area metrics. Furthermore, observed nonlinear transitions expose critical limitations in existing fire prediction models, highlighting the need for more dynamic modeling approaches.
Mazhar et al. [62] demonstrated that April 2020 experienced the most pronounced radiation anomalies during the COVID-19 pandemic, characterized by a 0.2% increase in Net Solar Radiation (NSR) alongside 3.45% and 4.8% decreases in Net Thermal Radiation (NTR) and Net Radiation (NR), respectively. The March–May 2020 period showed mean radiative forcing values of 1.09 Wm−2 (NSR), −2.19 Wm−2 (NTR), and −1.09 Wm−2 (NR). These changes primarily resulted from pandemic-related emission reductions that decreased atmospheric aerosol loading, enhancing surface solar irradiance and subsequent atmospheric heating [63]. This warming elevated surface temperatures while reducing relative humidity through increased saturation vapor pressure, collectively decreasing fuel moisture content in forest ecosystems and elevating fire risk. Additionally, higher ambient temperatures reduce the thermal energy required for fuel ignition, further amplifying wildfire potential. The COVID-19 emission reductions significantly influenced global fire weather conditions, emerging as a key driver of wildfire activity. Although national policy variations affected the magnitude of emission changes, even transient reductions demonstrably increased wildfire risks. Projections suggest that post-pandemic aerosol reductions may yield stronger climate responses than observed in 2020, with potential delayed effects persisting until 2050 [64]. The pandemic’s impact on wildfire regimes triggered complex environmental feedbacks with global consequences. While lockdowns temporarily reduced anthropogenic fires in tropical deforestation hotspots, concurrent climate-driven megafires released unprecedented carbon emissions—offsetting fossil fuel emission reductions. Arctic peatland fires accelerated permafrost thaw, potentially mobilizing ancient carbon stores. Altered smoke plumes disrupted precipitation patterns, with 2020–2022 wildfire aerosols potentially exacerbating droughts in vulnerable ecosystems like the Amazon [65]. These paradoxical outcomes highlight that short-term anthropogenic fire suppression cannot compensate for climate-driven wildfire intensification. Effective management requires integrated strategies addressing both ignition control and ecosystem adaptation in a warming climate.

5. Conclusions

This study systematically examines four critical aspects of wildfire regime transformations during the COVID-19 pandemic period. The analysis reveals a 22% global reduction in wildfire hotspots during 2020–2022 compared to the 2015–2019 reference period, with the most substantial decrease occurring in 2022, attributable to combined policy interventions and climatic variations. Spatial distribution patterns demonstrate contrasting trends, showing decreased fire activity in tropical deforestation regions such as Indonesia, while boreal and temperate zones including Siberia and western North America experienced intensified burning, underscoring climate change’s increasing influence on fire regimes. Cross-national comparisons reveal significant variations, with Russia exhibiting the maximum hotspot increase (+59,990 in 2020) contrasting with Australia’s substantial decrease (−60,380), highlighting the mediating role of regional policies and ecosystem characteristics. Monthly analyses further identify distinct seasonal patterns, with December showing consistent global reductions associated with mobility restrictions, whereas climate-influenced summer peaks (July–August) maintained or increased in northern latitudes. To address these complex wildfire dynamics, we propose an integrated management framework comprising three principal components. Targeted measures for human-ignition control should be implemented, informed by temporal hotspot patterns and including seasonal limitations on agricultural burning. Climate-adaptive strategies require development, focusing particularly on vulnerable high-latitude regions through enhanced boreal forest fuel management. Additionally, equity-oriented capacity building initiatives are necessary to facilitate early-detection system deployment in developing nations. The creation of an international wildfire management collaboration platform could substantially improve knowledge transfer and implementation of effective pandemic-era intervention strategies. Future investigations should focus on three priority research directions to advance wildfire dynamic understanding. Longitudinal evaluations are required to establish whether observed hotspot reductions constitute temporary variations or enduring fire regime modifications. Detailed analyses should examine how regional governance mechanisms, especially the comparative efficacy of federal versus local wildfire policies, influenced pandemic-related fire patterns. Furthermore, sophisticated fire modeling frameworks need development to incorporate both climatic variability and anthropogenic disturbances. Resolving these research gaps will demand integration of high-resolution satellite monitoring with terrestrial socioeconomic data, a methodological advancement crucial for formulating effective wildfire management approaches in the context of escalating global environmental complexities.

Supplementary Materials

The following supporting information can be downloaded at: https://www.mdpi.com/article/10.3390/fire8070276/s1, Table S1: Hotspot distribution by country/administrative region and ID.

Author Contributions

Conceptualization, M.W.; methodology, M.W. and L.S. (Liqing Si); software, W.L. (Wei Li); validation, W.L. (Wei Li) and W.L. (Weike Li); formal analysis, W.L. (Wei Li); investigation, W.L. (Weike Li) and F.Z.; resources, F.C. and P.C.; data curation, W.L. (Wei Li); writing—original draft preparation, L.S. (Liqing Si); writing—review and editing, L.S. (Liqing Si); visualization, W.L. (Wei Li); supervision, M.W.; project administration, L.S. (Lifu Shu); funding acquisition, L.S. (Lifu Shu). All authors have read and agreed to the published version of the manuscript.

Funding

This research was funded by National Key R&D Program of China, grant number [2023YFD2202005] and [2023YFD2202001]. And The APC was funded by [2023YFD2202005].

Institutional Review Board Statement

Not applicable.

Informed Consent Statement

Not applicable.

Data Availability Statement

Data can be made available by contacting the first author and corresponding author. The data used to generate the results of the paper is available and it is sourced from https://earthdata.nasa.gov/earth-observation-data/ (accessed on 28 October 2024).

Conflicts of Interest

The authors declare no conflicts of interest.

References

  1. Lou, H.; Cai, H.; Fu, R.; Guo, C.; Fan, B.; Hu, H.; Zhang, J.; Sun, L. Effects of wildfire disturbance on forest soil microbes and colonization of ericoid mycorrhizal fungi in northern China. Environ. Res. 2023, 231, 13. [Google Scholar] [CrossRef]
  2. Ahmed, I.; Ledger, K. Lessons from the 2019/2020 ‘Black Summer Bushfires’ in Australia. Int. J. Disaster Risk Reduct. 2023, 96, 103947. [Google Scholar] [CrossRef]
  3. Wu, J.T.; Leung, K.; Leung, G.M. Nowcasting and forecasting the potential domestic and international spread of the 2019-nCoV outbreak originating in Wuhan, China: A modelling study. Lancet 2020, 395, 689–697. [Google Scholar] [CrossRef] [PubMed]
  4. Islam, S.M.D.-U.; Bodrud-Doza, M.; Khan, R.M.; Haque, M.A.; Mamun, M.A. Exploring COVID-19 stress and its factors in Bangladesh: A perception-based study. Heliyon 2020, 6, e04399. [Google Scholar] [CrossRef] [PubMed]
  5. Wang, Z.; Mu, J.; Yang, M.; Yu, X. Reexamining the mechanisms of East Asian summer monsoon changes in response to Non–East Asian anthropogenic aerosol forcing. J. Clim. 2020, 33, 2929–2944. [Google Scholar] [CrossRef]
  6. Razzaq, A.; Sharif, A.; Aziz, N.; Irfan, M.; Jermsittiparsert, K. Asymmetric link between environmental pollution and COVID-19 in the top ten affected states of US: A novel estimations from quantile-onquantile approach. Environ. Res. 2020, 191, 110–189. [Google Scholar] [CrossRef]
  7. Zhou, D.; Dai, S.M.; Tong, Q. COVID-19: A recommendation to examine the effect of hydroxychloroquine in preventing infection and progression. J. Antimicrob. Chemother. 2020, 75, 1667–1670. [Google Scholar] [CrossRef]
  8. Li, L.; Li, Q.; Huang, L.; Wang, Q.; Zhu, A.; Xu, J.; Liu, Z.; Li, H.; Shi, L.; Li, R.; et al. Air quality changes during the COVID-19 lockdown over the Yangtze River Delta Region: An insight into the impact of human activity pattern changes on air pollution variation. Sci. Total Environ. 2020, 732, 139282. [Google Scholar] [CrossRef]
  9. Du, Z.; Xu, X.K.; Wang, L.; Fox, S.J.; Cowling, B.J.; Galvani, A.P.; Meyers, L.A. Effects of proactive social distancing on COVID-19 outbreaks in 58 cities, China. Emerg. Infect. Dis. 2020, 26, 2267–2269. [Google Scholar] [CrossRef]
  10. Somani, M.; Srivastava, A.N.; Gummadivalli, S.K.; Sharma, A. Indirect implications of COVID-19 towards sustainable environment: An investigation in Indian context. Bioresour. Technol. Rep. 2020, 11, 100491. [Google Scholar] [CrossRef]
  11. Tobías, A. Evaluation of the lockdowns for the SARS-CoV-2 epidemic in Italy and Spain after one month follow up. Sci. Total Environ. 2020, 725, 138539. [Google Scholar] [CrossRef] [PubMed]
  12. Klemeš, J.J.; Fan, Y.V.; Tan, R.R.; Jiang, P. Minimising the present and future plastic waste, energy and environmental footprints related to COVID-19. Renew. Sustain. Energy Rev. 2020, 127, 109883. [Google Scholar] [CrossRef]
  13. Forster, P.M.; Forster, H.I.; Evans, M.J.; Gidden, M.J.; Jones, C.D.; Keller, C.A.; Lamboll, R.D.; Quéré CLe Rogelj, J.; Rosen, D.; Schleussner, C.; et al. Current and future global climate impacts resulting from COVID-19. Nat. Clim. Chang. 2020, 10, 913–919. [Google Scholar] [CrossRef]
  14. Le Quéré, C.; Jackson, R.B.; Jones, M.W.; Smith, A.J.P.; Abernethy, S.; Andrew, R.M.; De-Gol, A.J.; Willis, D.R.; Shan, Y.; Canadell, J.G.; et al. Temporary reduction in daily global CO2 emissions during the COVID-19 forced confinement. Nat. Clim. Chang. 2020, 10, 647–653. [Google Scholar] [CrossRef]
  15. Jones, C.D.; Hickman, J.E.; Rumbold, S.T.; Walton, J.; Ziehn, T. The climate response to emissions reductions due to COVID-19: Initial results from CovidMIP. Geophys. Res. Lett. 2021, 48, e2020GL091883. [Google Scholar] [CrossRef]
  16. Usman, M.; Husnain, M.; Riaz, A.; Riaz, A.; Ali, Y. Climate change during the COVID-19 outbreak: Scoping future perspectives. Environ. Sci. Pollut. Res. 2021, 28, 49302–49313. [Google Scholar] [CrossRef]
  17. Askitas, N.; Tatsiramos, K.; Verheyden, B. Lockdown strategies, mobility patterns and COVID-19. Covid Econ. 2020, 23, 263–302. [Google Scholar]
  18. Baldwin, R.; Tomiura, E. Thinking ahead about the trade impact of COVID-19. Econ. Time COVID-19 2020, 59, 59–71. [Google Scholar]
  19. Bates, A.E.; Primack, R.B.; Moraga, P.; Duarte, C.M. COVID-19 pandemic and associated lockdown as a “Global Human Confinement Experiment” to investigate biodiversity conservation. Biol. Conserv. 2020, 248, 108665. [Google Scholar] [CrossRef]
  20. Sánchez-Clavijo, L.M.; Martínez-Callejas, S.J.; Acevedo-Charry, O.; Diaz-Pulido, A.; Ochoa-Quintero, J.M. Differential reporting of biodiversity in two citizen science platforms during COVID-19 lockdown in colombia. Biol. Conserv. 2021, 256, 109077. [Google Scholar] [CrossRef]
  21. Sills, J.; Pearson, R.M.; Sievers, M.; McClure, E.C.; Turschwell, M.P.; Connolly, R.M. COVID-19 recovery can benefit biodiversity. Science 2020, 368, 838–839. [Google Scholar]
  22. Zambrano-Monserrate, M.A.; Ruano, M.A.; Sanchez-Alcalde, L. Indirect effects of COVID-19 on the environment. Sci. Total Environ. 2020, 728, 138813. [Google Scholar] [CrossRef]
  23. Corlett, R.T.; Primack, R.B.; Devictor, V.; Maas, B.; Goswami, V.R.; Bates, A.E.; Koh, L.; Regan, T.J.; Loyola, R.; Pakeman, R.J.; et al. Impacts of the coronavirus pandemic on biodiversity conservation. Biol. Conserv. 2020, 246, 108571. [Google Scholar] [CrossRef] [PubMed]
  24. Pinder, A.C.; Raghavan, R.; Britton, J.R.; Cooke, S.J. COVID⁃19 and biodiversity: The paradox of cleaner rivers and elevated extinction risk to iconic fish species. Aquat. Conserv. 2020, 30, 1061–1062. [Google Scholar] [CrossRef]
  25. Rahman, M.S.; Alam, M.A.; Salekin, S.; Belal, M.A.; Rahman, M.S. The COVID-19 pandemic: A threat to forest and wildlife conservation in Bangladesh? Trees For. People 2021, 5, 100119. [Google Scholar] [CrossRef]
  26. Sannigrahi, S.; Pilla, F.; Maiti, A.; Bar, S.; Bhatt, S.; kaparwan, A.; Zhang, Q.; Keesstra, S.; Cerda, A. Examining the status of forest fire emission in 2020 and its connection to COVID-19 incidents in West Coast regions of the United States. Environ. Res. 2022, 210, 112818. [Google Scholar] [CrossRef] [PubMed]
  27. Lugo-Robles, R.; Garges, E.; Olsen, C.; Brett-Major, D.M. Identifying nontraditional epidemic disease risk factors associated with major health events from world health organization and world bank open data. Am. J. Trop. Med. Hyg. 2021, 105, 896–902. [Google Scholar] [CrossRef]
  28. Fang, T.; Hwang, B.C.H.; Kapur, S.; Hopstock, K.S.; Wei, J.; Nguyen, V.; Nizkorodov, S.A.; Shiraiwa, M. Wildfire particulate matter as a source of environmentally persistent free radicals and reactive oxygen species. Environ. Sci. Atmos. 2023, 3, 14. [Google Scholar] [CrossRef]
  29. Zhou, M.; Hu, T.; Zhang, W.; Wang, Q.; Kong, L.; Zhou, M.; Rao, P.; Peng, W.; Chen, X.; Song, X. COVID-19 pandemic: Impacts on air quality and economy before, during and after lockdown in China in 2020. Environ. Technol. 2023, 44, 3063–3073. [Google Scholar] [CrossRef]
  30. Lawler, O.K.; Allan, H.L.; Baxter, P.W.J.; Castagnino, R.; Tor, M.C.; Dann, L.E. The COVID-19 pandemic is intricately linked to biodiversity loss and ecosystem health. Lancet. Planet. Health 2021, 5, e840–e850. [Google Scholar] [CrossRef]
  31. Poulter, B.; Freeborn, P.H.; Jolly, W.M.; Varner, J.M. Covid-19 lockdowns drive decline in active fires in southeastern United States. Proc. Natl. Acad. Sci. U.S.A. 2021, 118, e2105666118. [Google Scholar] [CrossRef] [PubMed]
  32. Eklund, J.; Jones, J.P.G.; Räsänen, M.; Geldmann, J.; Jokinen, A.; Pellegrini, A.; Rakotobe, D.; Sarobidy, R.O.; Toivonen, T.; Balmford, A. Elevated fires during COVID-19 lockdown and the vulnerability of protected areas. Nat. Sustain. 2022, 5, 603–609. [Google Scholar] [CrossRef]
  33. Zhang, Z.; Song, G.; Zhang, L.; Zhai, Z.; He, W.; Yin, H.; Yu, L. Impact of lockdown policies on urban traffic conditions and carbon dioxide emissions based on an emission model on the link level in hour granularity. J. Clean. Prod. 2024, 437, 140426. [Google Scholar] [CrossRef]
  34. Kountouris, Y. Human activity, daylight saving time and wildfire occurrence. Sci. Total Environ. 2020, 727, 138044. [Google Scholar] [CrossRef] [PubMed]
  35. Balch, J.K.; Bradley, B.A.; Abatzoglou, J.T.; Nagy, R.C.; Fusco, E.J.; Mahood, A.L. Human-started wildfires expand the fire niche across the United States. Proc. Natl. Acad. Sci. USA 2017, 114, 2946–2951. [Google Scholar] [CrossRef]
  36. Hamilton, R.; Penny, D.; Hall, T.L. Forest, fire & monsoon: Investigating the long-term threshold dynamics of south-east Asia’s seasonally dry tropical forests. Quat. Sci. Rev. 2020, 238, 106334. [Google Scholar]
  37. Gonzalez-Mathiesen, C.; Ruane, S.; March, A. Integrating wildfire risk management and spatial planning—A historical review of two Australian planning systems. Int. J. Disaster Risk Reduct. 2020, 53, 101984. [Google Scholar] [CrossRef]
  38. Carrasco-Escaff, T.; Garreaud, R.; Bozkurt, D.; Jacques-Coper, M.; Pauchard, A. The key role of extreme weather and climate change in the occurrence of exceptional fire seasons in south-central Chile. Weather Clim. Extrem. 2024, 45, 100716. [Google Scholar] [CrossRef]
  39. Abatzoglou, J.T.; Williams, A.P. Impact of anthropogenic climate change on wildfire across western US forests. Proc. Natl. Acad. Sci. USA 2016, 113, 11770–11775. [Google Scholar] [CrossRef]
  40. Kirchmeier-Young, M.C.; Zwiers, F.W.; Gillett, N.P.; Cannon, A.J. Attributing extreme fire risk in Western Canada to human emissions. Clim. Chang. 2017, 144, 365–379. [Google Scholar] [CrossRef]
  41. Van Oldenborgh, G.J.; Krikken, F.; Lewis, S.; Lewis, S.; Leach, N.J.; Lehner, F.; Saunders, K.R.; van Weele, M.; Haustein, K.; Li, S.; et al. Attribution of the Australian bushfire risk to anthropogenic climate change. Nat. Hazards Earth Syst. Sci. 2021, 21, 941–960. [Google Scholar] [CrossRef]
  42. Jain, P.; Sharma, A.R.; Acuna, D.C.; Abatzoglou, J.T.; Flannigan, M. Record-breaking fire weather in north America in 2021 was initiated by the pacific northwest heat dome. Commun. Earth Environ. 2024, 5, 202. [Google Scholar] [CrossRef]
  43. Kharuk, V.I.; Dvinskaya, M.L.; Im, S.T.; Golyukov, A.S.; Smith, K.T. Wildfires in the Siberian Arctic. Fire 2022, 5, 106. [Google Scholar] [CrossRef]
  44. Sharma, S.; Zhang, M.; Anshika, S.; Gao, J.; Zhang, H.; Kota, S.H. Effect of restricted emissions during COVID-19 on air quality in India. Sci. Total Environ. 2020, 728, 138878. [Google Scholar] [CrossRef] [PubMed]
  45. Ren, L.; Yang, Y.; Wang, H.; Wang, P.; Yue, X.; Liao, H. Widespread wildfires over the western United States in 2020 linked to emissions reductions during COVID-19. Geophys. Res. Lett. 2022, 49, e2022GL099308. [Google Scholar] [CrossRef]
  46. Yang, Y.; Ren, L.; Li, H.; Wang, H.; Wang, P.; Chen, L.; Yue, X.; Liao, H. Fast climate responses to aerosol emission reductions during the COVID-19 pandemic. Geophys. Res. Lett. 2020, 47, e2020GL089788. [Google Scholar] [CrossRef]
  47. Henderson, K.; Chakrabortty, R.K. A machine learning predictive model for bushfire ignition and severity: The Study of Australian black summer bushfires. Decision Analytics Journal. 2025, 14, 100529. [Google Scholar] [CrossRef]
  48. Patel, L.; Conlon, K.; Sorensen, C.; Kathryn, C.; McEachin, S.; Nadeau, K.; Kakkad, K.; Kizer, K.W. Climate Change and Extreme Heat Events: How Health Systems Should Prepare. NEJM Catal. Innov. Care Deliv. 2022, 3, CAT-21. [Google Scholar] [CrossRef]
  49. Lupascu, M.; Taillardat, P.; Sasmito, S.D.; Agus, F.; Mudiyarso, D.; Ramchunder, S.J.; Tata, H.L.; Taylor, D. Climate-smart peatland management and the potential for synergies between food security and climate change objectives in Indonesia. Glob. Environ. Chang. 2023, 82, 102731. [Google Scholar] [CrossRef]
  50. Rantanen, M.; Karpechko, A.Y.; Lipponen, A.; Nordling, K.; Hyvärinen, O.; Ruosteenoja, K.; Vihma, T.; Laaksonen, A. The Arctic has warmed nearly four times faster than the globe since 1979. Commun. Earth Environ. 2022, 3, 168. [Google Scholar] [CrossRef]
  51. Alexander, M.; Unruh, L.; Koval, A.; Belanger, W. United States response to the COVID-19 pandemic, January–November 2020. Health Econ. Policy Law 2022, 17, 62–75. [Google Scholar] [CrossRef] [PubMed]
  52. Xiong, Q.; Luo, X.; Liang, P.; Xiao, Y.; Xiao, Q.; Sun, H.; Pan, K.; Wang, L.; Li, L.; Pang, X. Fire from policy, human interventions, or biophysical factors? Temporal-spatial patterns of forest fire in southwestern China. For. Ecol. Manag. 2022, 474, 118381. [Google Scholar] [CrossRef]
  53. Russell, E.N.; Loikith, P.C.; Ajibade, I.; Done, J.M.; Lower, C. The meteorology and impacts of the September 2020 Western United States extreme weather event. Weather Clim. Extrem. 2024, 43, 100647. [Google Scholar] [CrossRef]
  54. Vadrevu, K.; Eaturu, A.; Casadaban, E.; Lasko, K.; Schroeder, W.; Biswas, S.; Giglio, L.; Justice, C. Spatial variations in vegetation fires and emissions in South and Southeast Asia during COVID-19 and pre-pandemic. Sci. Rep. 2022, 12, 18233. [Google Scholar] [CrossRef]
  55. Allin, S.; Fitzpatrick, T.; Marchildon, G.P.; Quesnel-Vallée, A. The federal government and Canada’s COVID-19 responses: From ‘we’re ready, we’re prepared’ to ‘fires are burning’. Health Econ. Policy Law 2022, 17, 76–94. [Google Scholar] [CrossRef]
  56. Liang, S.; Ziegler, A.D.; Li, L.Z.X.; Jie Wu Wang, D.; Zeng, Z. Interplay of greening and ENSO on biosphere-atmosphere processes in Australia. Geosci. Lett. 2022, 9, 43. [Google Scholar] [CrossRef]
  57. Wells, E.M.; Beval, E.; Kay, S.; Small, M.J.; Wong-Parodi, G. Quantifying wildland fire resources deployed during the compound threat of COVID-19. Sci. Rep. 2024, 14, 20039. [Google Scholar] [CrossRef]
  58. Chen, A.; Yang, L.; Kang, H.; Gao, Y.; Xie, Z. Southern hemisphere fire history since the late glacial, reconstructed from an Antarctic sediment core. Quat. Sci. Rev. 2022, 276, 107300. [Google Scholar] [CrossRef]
  59. Liu, P.; Kaplan, J.O.; Mickley, L.J.; Li, Y.; Chellman, N.J.; Arienzo, M.M.; Kodros, J.K.; Pierce, J.R.; Sigl, M.; McConnell, J.R. Improved estimates of preindustrial biomass burning reduce the magnitude of aerosol climate forcing in the Southern Hemisphere. Sci. Adv. 2021, 7, eabc1379. [Google Scholar] [CrossRef]
  60. Ciavarella, A.; Cotterill, D.; Stott, P.; Kew, S.; Philip, S.; Oldenborgh, G.J.; Skålevåg, A.; Lorenz, P.; Robin, Y.; Otto, F.; et al. Prolonged Siberian heat of 2020 almost impossible without human influence. Clim. Chang. 2021, 166, 9. [Google Scholar] [CrossRef]
  61. Abatzoglou, J.T.; Rupp, D.E.; O’Neill, L.W.; Sadegh, M. Compound Extremes Drive the Western Oregon Wildfires of September 2020. Geophys. Res. Lett. 2021, 48, e2021GL092520. [Google Scholar] [CrossRef]
  62. Mazhar, U.; Jin, S.; Bilal, M.; Ali, M.A.; Khan, R. Reduction of surface radiative forcing observed from remote sensing data during global COVID-19 lockdown. Atmos. Res. 2021, 261, 105729. [Google Scholar] [CrossRef] [PubMed]
  63. Van Heerwaarden, C.C.; Mol, W.B.; Veerman, M.A.; Benedict, I.; Heusinkveld, B.G.; Knap, W.H.; Kazadzis, S.; Kouremeti, N.; Fiedler, S. Record high solar irradiance in Western Europe during first COVID-19 lockdown largely due to unusual weather. Commun. Earth Environ. 2021, 2, 37. [Google Scholar] [CrossRef]
  64. Fiedler, S.; Wyser, K.; Rogelj, J.; van Noije, T. Radiative effects of reduced aerosol emissions during the COVID-19 pandemic and the future recovery. Atmos. Res. 2021, 264, 105866. [Google Scholar] [CrossRef]
  65. Nobrega, T.F.; Correia, A.L. Particulate and Gas Emissions from Wildfires in the Southern Amazon, from 2020 to 2022, from GOES-16 Fire Radiative Power Retrievals. ACS EST Air 2025, 2, 736–745. [Google Scholar] [CrossRef]
Figure 1. Annual global hotspot counts before and during the COVID-19 incidents from 2010 to 2022 (A), monthly distribution of hotspot proportions (B), and the distribution of hotspot counts across the seven continents globally (C).
Fire 08 00276 g001
Figure 2. Monthly trends in hotspot counts before and during the COVID-19 incidents from 2010 to 2022 (A) and annual trends in hotspot counts across the seven continents globally from 2010 to 2022 (B).
Fire 08 00276 g002
Figure 3. Variation in hotspot density during COVID-19 (Anomalies compared to the 5-year pre-pandemic period, (A): 2020, (C): 2021, (E): 2022, (G): 3-year pandemic average; anomalies compared to the 10-year pre-pandemic period, (B): 2020, (D): 2021, (F): 2022, (H): 3-year pandemic average).
Fire 08 00276 g003
Figure 4. Illustrates the spatial and temporal variations in wildfire occurrences across different countries under eight distinct pandemic scenarios. (Anomalies compared to the 5-year pre-pandemic period, (A): 2020, (C): 2021, (E): 2022, (G): 3-year pandemic average; anomalies compared to the 10-year pre-pandemic period, (B): 2020, (D): 2021, (F): 2022, (H): 3-year pandemic average).
Fire 08 00276 g004
Figure 5. Presents the global distribution of wildfire hotspot change rates across countries under eight distinct pandemic scenarios (anomalies compared to the 5-year pre-pandemic period, (A): 2020, (C): 2021, (E): 2022, (G): 3-year pandemic average; anomalies compared to the 10-year pre-pandemic period, (B): 2020, (D): 2021, (F): 2022, (H): 3-year pandemic average).
Fire 08 00276 g005
Figure 6. Monthly comparison of hot spot changes in different countries/administrative regions (Anomalies compared to the 5-year pre-pandemic period, (A): 2020, (C): 2021, (E): 2022, (G): 3-year pandemic average; anomalies compared to the 10-year pre-pandemic period, (B): 2020, (D): 2021, (F): 2022, (H): 3-year pandemic average).
Fire 08 00276 g006
Figure 7. Monthly dynamic of Nino 3.4 index (3-month moving average).
Fire 08 00276 g007
Disclaimer/Publisher’s Note: The statements, opinions and data contained in all publications are solely those of the individual author(s) and contributor(s) and not of MDPI and/or the editor(s). MDPI and/or the editor(s) disclaim responsibility for any injury to people or property resulting from any ideas, methods, instructions or products referred to in the content.

