Article

Daily-Scale Fire Risk Assessment for Eastern Mongolian Grasslands by Integrating Multi-Source Remote Sensing and Machine Learning

1
Department of Geography, School of Art and Sciences, National University of Mongolia, Ulaanbaatar 14200, Mongolia
2
Institute of Grassland Research, Chinese Academy of Agricultural Sciences, Hohhot 010022, China
3
Arxan Forest and Grassland Disaster Prevention and Mitigation Field Scientific Observation and Research Station of Inner Mongolia Autonomous Region, Arxan 137400, China
4
College of Geographic Science, Inner Mongolia Normal University, Hohhot 010022, China
5
School of Agroecology, Mongolian University of Life Sciences, Ulaanbaatar 17024, Mongolia
*
Authors to whom correspondence should be addressed.
Fire 2025, 8(7), 273; https://doi.org/10.3390/fire8070273
Submission received: 16 June 2025 / Revised: 4 July 2025 / Accepted: 7 July 2025 / Published: 11 July 2025

Abstract

Frequent wildfires in the eastern grasslands of Mongolia pose significant threats to the ecological environment and pastoral livelihoods, creating an urgent need for high-temporal-resolution and high-precision fire prediction. To address this, this study established a daily-scale grassland fire risk assessment framework integrating multi-source remote sensing data to enhance predictive capabilities in eastern Mongolia. Utilizing fire point data from eastern Mongolia (2012–2022), we fused multiple feature variables and developed and optimized three models: random forest (RF), XGBoost, and deep neural network (DNN). Model performance was enhanced using Bayesian hyperparameter optimization via Optuna. Results indicate that the Bayesian-optimized XGBoost model achieved the best generalization performance, with an overall accuracy of 92.3%. Shapley additive explanations (SHAP) interpretability analysis revealed that daily-scale meteorological factors—daily average relative humidity, daily average wind speed, daily maximum temperature—and the normalized difference vegetation index (NDVI) were consistently among the top four contributing variables across all three models, identifying them as key drivers of fire occurrence. Spatiotemporal validation using historical fire data from 2023 demonstrated that fire points recorded on 8 April and 1 May 2023 fell within areas predicted to have “extremely high” fire risk probability on those respective days. Moreover, points A (117.36° E, 46.70° N) and B (116.34° E, 49.57° N) exhibited the highest number of days classified as “high” or “extremely high” risk during the April/May and September/October periods, consistent with actual fire occurrences. In summary, the integration of multi-source data fusion and Bayesian-optimized machine learning has enabled the first high-precision daily-scale wildfire risk prediction for the eastern Mongolian grasslands, thus providing a scientific foundation and decision-making support for wildfire prevention and control in the region.

1. Introduction

Grasslands, as critical global ecosystems [1], serve as vital reservoirs of biodiversity and essential support for human livelihoods. However, they are also significantly impacted by frequent wildfires, a primary disturbance factor [2]. Importantly, these fires exhibit a dual role in maintaining and disrupting ecological balance, necessitating in-depth research and scientific countermeasures [3]. Driven by climate warming and extreme weather events [4,5], grassland wildfires in eastern Mongolia have become increasingly frequent [6,7,8,9,10]. Between 2012 and 2022, The total cumulative burned area in this region reached 131,740 km2, accounting for 58.61% of the national total (NASA Fire Information for Resource Management System; FIRMS: https://firms.modaps.eosdis.nasa.gov, accessed on 26 December 2024). Notably, current research focuses on the spatiotemporal distribution patterns of grassland fires, risk modeling, and identifying driving factors, with a growing demand for high-temporal-resolution and high-precision prediction, particularly in arid and semiarid grasslands like eastern Mongolia [7,8,9]. Therefore, enhancing the accuracy of grassland fire prediction is crucial for enabling early warning systems, dynamic risk assessment, and scientifically informed prevention and control decisions, thereby effectively mitigating the ecological and economic losses caused by wildfires [11].
Research on constructing and applying grassland fire risk prediction models is broadly categorized into three methodological approaches: traditional regression models, classical machine learning (ML) methods, and integrated learning/deep learning combined with explainability analysis. The first category comprises conventional regression models, primarily statistical methods like logistic regression [12,13]. These models typically assume a linear or logarithmic relationship between fire occurrence probability and driving factors. For instance, early studies utilized meteorological, topographic, and vegetation variables within logistic regression frameworks to generate risk probability maps, selecting variables based on coefficient significance for model optimization. However, conventional regression models cannot capture complex nonlinear relationships between variables and struggle to handle multidimensional heterogeneous data [12,13]. Consequently, they are poorly suited to the dynamic daily-scale prediction demands driven by complex and variable mechanisms across spatiotemporal scales in the Mongolian grasslands.
The second category encompasses classical ML methods, represented by algorithms such as random forest (RF), support vector machine (SVM), gradient boosting machine (GBM), and XGBoost [14,15]. These methods learn patterns from historical fire data to capture nonlinear relationships between fire occurrence and multiple contributing factors, making them suitable for high-dimensional variable modeling. For example, a study in the Nainital region employed various methods, including AdaBoost, GBM, XGBoost, RF, and deep neural networks (DNN), to assess forest fire susceptibility, in which they found XGBoost performed best (area under the curve (AUC) = 0.94). The study also incorporated Shapley additive explanations (SHAP) analysis to identify key environmental drivers like annual rainfall and evapotranspiration, providing valuable insights for fire prevention strategies. Nevertheless, these methods rely heavily on empirical knowledge for feature selection and parameter tuning. Their inherent “black box” nature limits explainability, hindering their utility in policy formulation and regional management, especially in the ecologically complex Mongolian grasslands [16,17].
The third and most recent frontier involves integrated learning, DNNs, and explainable artificial intelligence (XAI) techniques [18,19]. This approach synthesizes the strengths of multiple models, achieving high prediction accuracy while elucidating underlying driving mechanisms through XAI. For instance, research in Turkey’s Mediterranean region combined ensemble models (LightGBM, GBM, XGBoost) with XAI methods like SHAP to develop a forest fire susceptibility mapping framework. Results indicated that LightGBM achieved the highest accuracy (AUC = 0.934), with soil moisture, Palmer drought severity index (PDSI), and land surface temperature (LST) identified as key drivers [20]. In Guangdong Province, China, a study employed convolutional neural networks for modeling, demonstrating superior performance (AUC = 0.962) compared to traditional ML methods (e.g., RF, SVM) amidst complex geography and seasonal variations, significantly enhancing assessment accuracy and spatial expressiveness [21]. However, these advanced methods incur high computational costs, possess complex model architectures, and strongly depend on large volumes of high-quality training data. Their stringent data requirements make it difficult to directly transfer to data-scarce regions with high spatiotemporal heterogeneity, such as eastern Mongolia. This is particularly true for daily-scale dynamic modeling, where methodological adaptability and data uncertainty remain significant challenges.
Grassland wildfire ignition results from the nonlinear interaction of natural factors (e.g., meteorology, topography, vegetation) and human activities [20,22,23,24]. This multifactorial characteristic is particularly pronounced in arid and semiarid ecosystems. Specifically, drought and high temperatures directly increase flammability by reducing vegetation moisture content [25], terrain influences wind patterns and fire spread paths [26], and human activities often significantly perturb natural systems by altering land cover or introducing ignition sources [27]. While extensive research has focused on forest fire drivers and prediction models [19,24,28], dynamic indices such as the vegetation condition index (VCI), temperature condition index (TCI), and water condition index (WCI) have been integrated with static factors including terrain features and lightning density to establish comprehensive fire risk assessment models [29]. The causal mechanisms of grassland fires differ markedly. Grassland fires are more strongly influenced by meteorological fluctuations, grass vegetation structure, and pastoral activities, exhibiting greater spatiotemporal heterogeneity and regional dependence [30]. However, most studies treat the Mongolian Plateau as a single unit, often overlooking regional variations in fire-driving mechanisms. Notably, this oversight undermines the practical utility of prediction models for local adaptation [7,8,9,10]. Furthermore, existing models frequently rely on single methodologies or fixed parameters, lacking systematic comparison of multi-model performance and adaptive optimization mechanisms based on regional data structures. Consequently, research on predicting grassland fire occurrence probability exhibits shortcomings in addressing regional heterogeneity, effectively fusing multi-source data factors, and implementing robust model optimization strategies, particularly concerning comprehensive analysis for eastern Mongolia’s arid and semiarid grasslands. These limitations directly compromise the models’ generalizability and effectiveness in supporting fire prevention decision making. Previous studies on fire risk assessment have demonstrated that both random forest (RF) and XGBoost exhibit superior stability and predictive accuracy [24,31]. These established machine learning approaches were therefore selected as primary methodologies for this study. While neural network architectures—particularly convolutional neural networks (CNNs)—have been widely employed in fire probability prediction, the application of deep neural networks (DNNs) remains relatively unexplored in this domain. To address this research gap and provide comparative insights, we incorporate DNN as an additional approach in our methodological framework. Building upon conventional regional-scale models, this study introduces three key methodological innovations: first, a daily temporal resolution specifically designed to capture rapid weather fluctuations in steppe ecosystems; second, an Optuna-driven multi-model optimization framework that effectively addresses local environmental heterogeneity; and third, quantitative SHAP explanations that elucidate real-time interactions among fire drivers. Collectively, these advances establish a robust foundation for high-precision risk zoning and dynamic fire management.
The subsequent sections of this paper are structured as follows: Chapter 2 (Materials and Methods) systematically details the study area, data sources, and preprocessing procedures, and comprehensively describes the model construction and optimization methodologies. Chapter 3 (Results) presents the research findings across four key aspects: the spatiotemporal patterns of wildfires, comparative model performance, driver factor interpretation, and case validation. Chapter 4 (Discussion) provides an in-depth analysis of model performance differences, the heterogeneity of driving mechanisms, and study limitations. Chapter 5 (Conclusion) summarizes the study’s innovations and practical significance. Through the closed-loop framework (data fusion → model optimization → spatiotemporal validation → decision support) illustrated in the research technical roadmap (Figure 1), this study fully realizes the scientific workflow from theoretical modeling to applied validation. This framework provides a valuable methodological reference for grassland wildfire risk management.

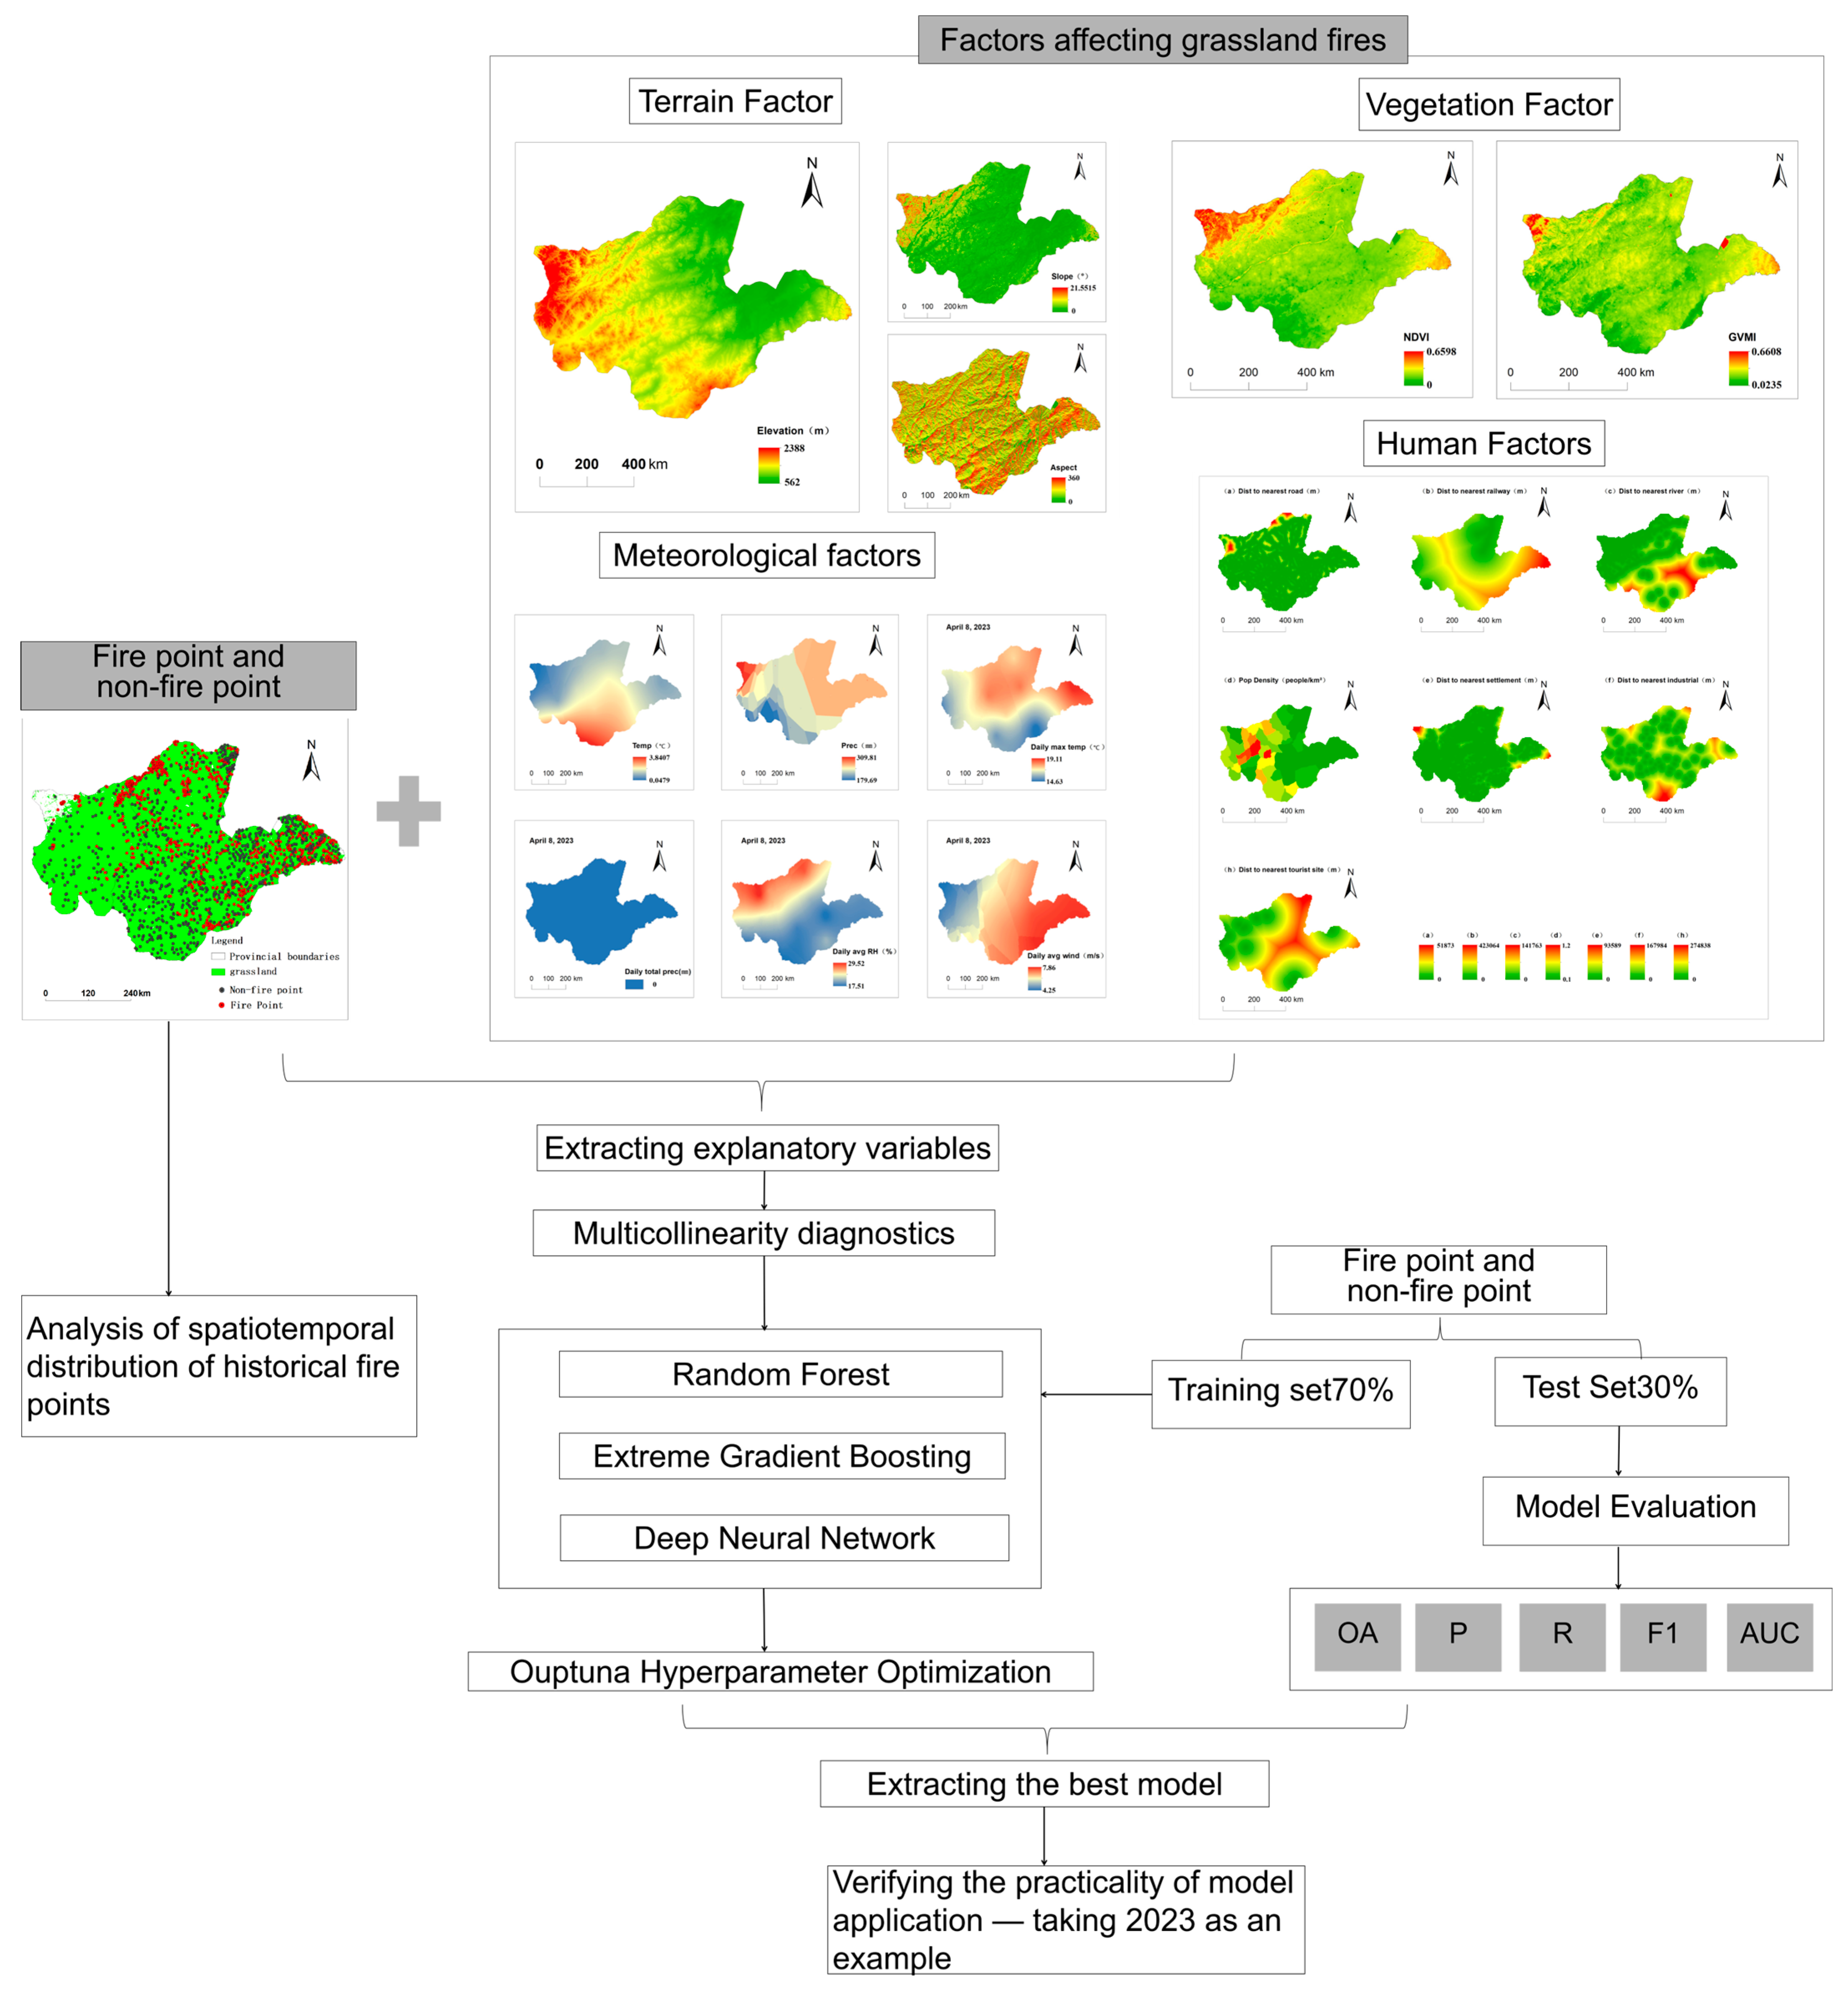
2. Materials and Methods
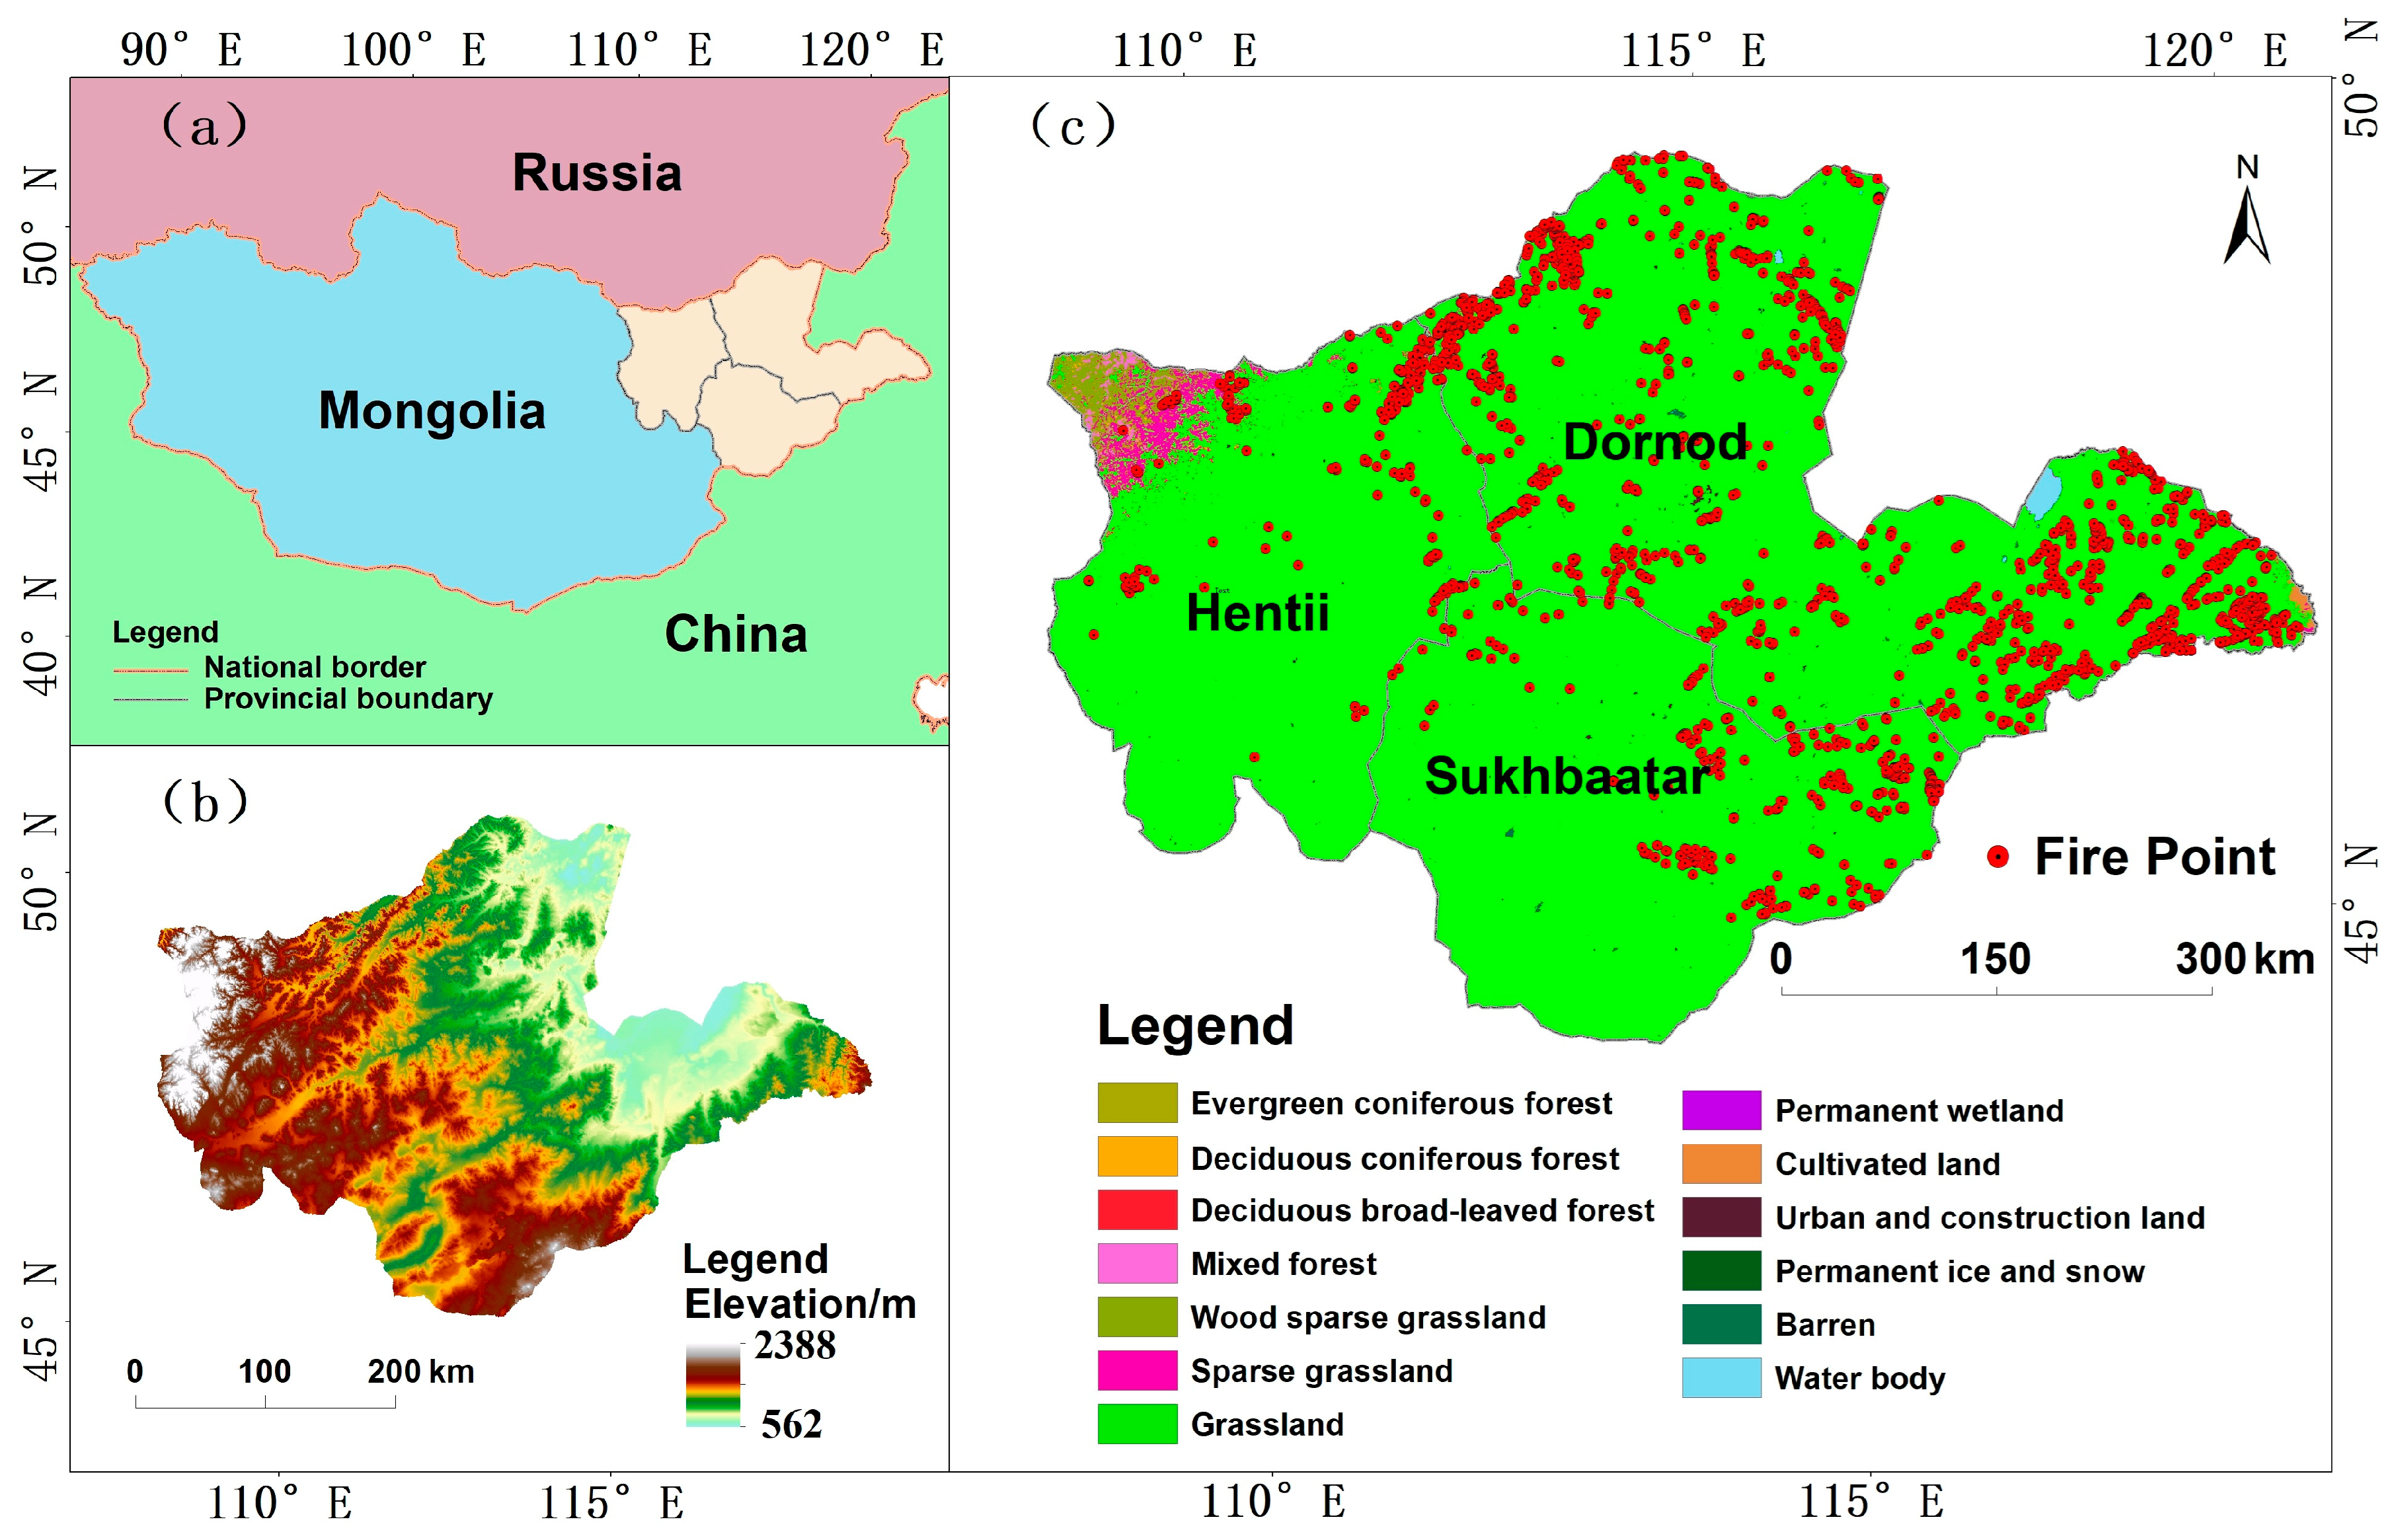
2.1. Study Area

This study focuses on eastern Mongolia (encompassing Dornod, Hentii, and Sukhbaatar provinces), a region characterized by high grassland fire risk. Bordered by China’s Inner Mongolia Autonomous Region to the east and south, and Russia to the north (rectangular extent: 44.7° N–50.3° N, 108.4° E–119.9° E; see Figure 2), the study area spans approximately 286,000 km2, representing 17.8% of Mongolia’s total land area (www.icc.mn, accessed on 20 December 2024). Grasslands dominate the landscape, covering 97% of the region and forming a significant component of the Eurasian Temperate Steppe biogeographic realm. The three eastern provinces of Mongolia form a continuous transition gradient encompassing typical steppe, meadow steppe, and desert steppe. This region supports diverse grassland vegetation with abundant fire-prone plant communities, particularly the highly flammable “Stipa krylovii” steppe formations during spring—corresponding to areas of frequent fire ignition. According to NASA FIRMS data (2012–2022), these provinces accounted for 58.61% of Mongolia’s total burned area, with wildfire activity demonstrating high-frequency characteristics. Thus, they constitute a representative model system for grassland fire occurrence probability research. The climate is characterized as a continental temperate steppe type. Winters are prolonged and severe, while summers are brief with significant diurnal temperature variations. Mean annual precipitation ranges between 200 and 300 mm, predominantly from June to August. The spring (March–May) and autumn (September–October) seasons are typically dry and windy, coinciding with peak fire occurrence periods. Topographically, the region features gently undulating hill terrain with an average elevation of approximately 1010 m. Local topography includes intermixed mountain ranges and shallow depressions, where pronounced wind channels facilitate rapid fire spread, creating natural pathways for wildfire propagation.

2.2. Research Data

2.2.1. Grassland Fire Data

This study utilized VIIRS VNP14IMGT active fire data obtained from NASA’s Fire Information for Resource Management System (FIRMS) (https://firms.modaps.eosdis.nasa.gov/, accessed on 26 December 2024). We integrated multidimensional observational data for eastern Mongolia spanning 2012–2023, including core parameters such as fire point geographic coordinates (longitude and latitude), fire radiative power (FRP; represented by the “brightness” field), and detection confidence level (“confidence”). The original data possess a spatial resolution of 375 m, with each marker corresponding to the center location of the sensor pixel.
Fire point data preprocessing was conducted within the ArcGIS platform, beginning with projecting the dataset into an appropriate coordinate system. Subsequently, spatial filtering was applied by overlaying fire points with an eastern Mongolia land use/land cover (LULC) map, where non-grassland fire points (e.g., those occurring in forests, croplands, settlements) were systematically excluded using spatial intersect analysis. Further quality control involved removing fire detections with a confidence level below 30% and anomalous brightness values to enhance data reliability. Finally, sample generation proceeded: A set of 2000 representative historical fire points was extracted using stratified random sampling. A circular buffer with a 1000 m radius was generated for each selected fire point, and non-fire-point locations were generated within the extended area outside these fire buffers. Crucially, non-fire points were generated at a 1:1 ratio relative to the fire points, and to maintain temporal consistency, the occurrence time for each non-fire point was randomly assigned based on the annual probability distribution observed in the corresponding fire point dataset.

2.2.2. Grassland Fire-Influencing Factors

This study selected key factors influencing grassland fire occurrence. These were categorized into four major groups: meteorological, anthropogenic, vegetation, and topographic characteristics. A total of 18 initial variables were considered; their detailed descriptions are provided in Table 1.
  • Meteorological Factors:
Meteorological factors constitute critical determinants of grassland fire occurrence. Temperature, humidity, precipitation, and wind speed directly or indirectly influence fire ignition probability. Specifically, arid environments exhibit significantly higher flammability than humid conditions [32]. Precipitation and air temperature modulate vegetation growth dynamics and fuel load accumulation, while wind speed critically governs fire spread behavior [21]. Daily meteorological data for 2012–2023—including relative humidity, daily maximum temperature, daily mean temperature, daily cumulative precipitation, and daily mean wind speed—were sourced from the Environmental Meteorology Data Service Platform (www.eiadata.com, accessed on 20 December 2024), derived explicitly from the Mongolia Surface Climate Daily Value Dataset. Furthermore, the annual mean temperature and annual cumulative precipitation were computed from daily records.
Spatial processing involved two sequential steps: first, ordinary Kriging interpolation (500 m resolution) generated continuous raster surfaces for each meteorological variable; then, ArcGIS Spatial Analyst tools extracted variable values to all fire-point and non-fire-point locations.
  • Anthropogenic Factors:
Population density serves as a proxy for human activity intensity within a region. Distances to the nearest road, railway, river, tourist site, industrial/mining area, and settlement also reflect anthropogenic influence [33]. Higher human activity intensity increases the potential for ignition sources (e.g., domestic fires, smoking, campfires, mining, and energy development activities), thereby elevating fire probability [33]. Consequently, this study incorporated population density and distances to the nearest road, railway, river, tourist site, industrial/mining area, and settlement as explanatory variables. Data were obtained from the Mongolian Remote Sensing Data Sharing platform (www.icc.mn, accessed on 20 December 2024) and the Mongolian Statistical Yearbook (www.1212.mn, accessed on 20 December 2024). Euclidean distance analysis (cell size: 500 m) within ArcGIS Spatial Analyst created raster layers representing proximity to these human activity features. Values were then extracted to the fire and non-fire-point locations.
  • Vegetation Factors:
The presence of combustible fuel is essential for fire ignition. The normalized difference vegetation index (NDVI) reflects vegetation status and fuel load. Vegetation moisture content is a key condition for flammability; the global vegetation moisture index (GVMI) provides direct information on canopy-level vegetation water content, indicating the moisture status of live fuels [34]. The GVMI employs a ratio structure combining SWIR and NIR bands (Equation (2)), exhibiting enhanced sensitivity to liquid water absorption peaks in the SWIR spectrum (1640–2130 nm) compared to indices like NDWI [35]. Thus, NDVI and GVMI represent fuel load and moisture conditions, respectively.
NDVI was sourced from the MOD13A1 product (The data comes from NASA, the U.S. space agency.)via Google Earth Engine (GEE) with a spatial resolution of 500 m and a temporal resolution of 16 days. GVMI was sourced from the MOD09A1 product (The data comes from NASA, the U.S. space agency.) via GEE with a spatial resolution of 500 m and a temporal resolution of 8 days.
Processing within GEE proceeded as follows: the eastern Mongolia boundary was loaded, and the MOD13A1 and MOD09A1 datasets were filtered by time (2012–2022). Next, functions were defined to calculate annual mean NDVI and GVMI, and finally, the annual mean rasters (resolution: 500 m) were composited. Values were subsequently extracted from fire and non-fire points using ArcGIS.
The NDVI calculation is as follows:
N D V I = ( N I R R ) ( N I R + R )
In Equation (1), NIR represents the reflectivity of the near-infrared band, while R represents the reflectivity of the red band.
The GVMI calculation is as follows:
G V M I = ( N I R + 0.1 ) ( S W I R + 0.02 ) ( N I R + 0.1 ) + ( S W I R + 0.02 )
In Equation (2), NIR is the reflectivity of band 2 of the MODIS surface reflectivity product MOD09A1, and SWIR is the reflectivity of band 6.
  • Topographic Factors:
Topography significantly influences both the initiation and spread of grassland fires [19]. For example, vegetation type varies with elevation, affecting combustion characteristics. Steeper slopes generally experience more intense fire behavior due to preheating and accelerated upward spread. Aspect influences the amount of solar radiation received, indirectly affecting fuel moisture and fire potential. Topographic data were derived from the Shuttle Radar Topography Mission Global 3 arc-second (SRTM GL3) product (Version 3), accessed via the USGS EarthExplorer platform (https://earthexplorer.usgs.gov). This 90 m resolution digital elevation model (DEMs) provides seamless coverage of the Mongolian Plateau. Slope (degrees) and aspect (degrees) rasters were calculated from the DEM using ArcGIS Spatial Analyst. These rasters were resampled to 500 m resolution to match other datasets, and values were extracted to fire and non-fire point locations. Aspect angles were categorized according to standard directional classes (see Table 2 for classification scheme).

2.3. Research Methods

2.3.1. Multicollinearity Diagnosis Among Explanatory Variables

Strong multicollinearity among explanatory variables can lead to distorted estimates in regression models and increased variance of parameter estimates, resulting in unstable model outcomes [34]. The variance inflation factor (VIF) is a widely used metric for assessing multicollinearity. We performed multicollinearity diagnostics for all explanatory variables using SPSS27.0 software. VIF thresholds were interpreted as follows: 2 < VIF < 5: mild multicollinearity; 5 < VIF < 10: moderate multicollinearity; VIF > 10: serious multicollinearity. As shown in Figure 3, the VIF values for all explanatory variables were below 5. Consequently, no significant multicollinearity was detected among the predictor variables included in this study.

2.3.2. Grassland Fire Trend Analysis

Spatiotemporal trend analysis enables the identification of high-incidence areas and periods for grassland wildfires [7,36]. We implemented the analytical workflow through the following sequence: First, the study area was partitioned into a uniform grid system using ArcGIS’s Create Fishnet tool. Subsequently, historical fire points (2012–2022) were aggregated to each grid cell, with fire density calculated as points per unit area. Following aggregation, spatial statistics tools in ArcGIS quantified fire distribution characteristics (e.g., clustering, dispersion patterns). Finally, temporal analysis was conducted in two components: interannual variability was assessed by analyzing annual fire frequency trends, while seasonal patterns were quantified by characterizing monthly fire occurrence distributions.

2.3.3. Model Construction Method

RF is an ensemble learning algorithm renowned for its robustness and generalization capabilities, widely applied to classification and regression tasks. It aggregates predictions from multiple decision trees to form a superior ensemble classifier [37]. Each decision tree is built using a bootstrapped training data sample during construction. An optimal split point is determined from a randomly selected subset of features at every node within a tree. This recursive partitioning continues until the termination criteria are met. The final prediction is determined by majority voting across all trees in the forest [38].
XGBoost (extreme gradient boosting) is an advanced gradient boosting framework that iteratively constructs an ensemble of weak learners (decision trees) to form a strong predictive model. It enhances traditional gradient boosting by incorporating regularization techniques (L1/L2) and computational optimizations, effectively mitigating overfitting while improving training efficiency [39,40]. The algorithm operates sequentially: in each iteration, a new decision tree is trained to predict the residual errors of the current ensemble. The negative gradient direction of the loss function guides the tree construction via gradient descent. Notably, this process continues until predefined stopping criteria are met (e.g., maximum iterations or error convergence threshold). Predictions from all base learners are then combined through weighted summation to yield the final output [39].
DNNs represent a core deep learning architecture, leveraging hierarchical nonlinear transformations to model complex patterns and functional relationships [41]. Inspired by biological neural systems, DNNs comprise an input layer, multiple hidden layers for feature abstraction, and an output layer for prediction. The model operates through forward propagation, where input data is transformed layerwise via activation functions [42]. Learning is achieved via backpropagation with gradient descent, which minimizes the prediction error by iteratively adjusting synaptic weights. This differentiable computational graph enables robust nonlinear mapping, while visualization of weight matrices provides insights for model interpretability [42].
To enhance model performance, hyperparameter optimization was performed using the Optuna framework3.0.0 [43], employing the tree-structured Parzen estimator (TPE) sampling algorithm [44]. The optimization objective was to maximize the five-fold cross-validated AUC score on the validation set [45]. The TPE sampler underwent 100 trials, including 20 initial random explorations to avoid local optima [46]. Early stopping was implemented during training, reverting to the best weights if the validation AUC improvement was less than 0.001 for 10 consecutive epochs [47]. RF Search Space [38,48,49,50,51]: Ensemble Control: “n_estimators” (50–800, step = 50), “max_samples” (0.7–0.9). Tree Complexity: “max_depth” (10–30), “min_samples_split” (20–60). Randomization: “max_features” ([“sqrt”, 0.3, 0.5]), “min_samples_leaf” (10–30). XGBoost Search Space [39,51,52,53,54]: Tree Structure: “max_depth” (3–10), “min_child_weight” (1–10). Regularization & Randomization: “subsample” (0.6–1.0), “colsample_bytree” (0.6–1.0), “reg_alpha” (0–10), “reg_lambda” (0–10). Learning Policy: “learning_rate” (0.01–0.3), “gamma” (0–5). DNN Search Space [55,56,57]: Architecture: hidden layers, units per layer. Regularization: L2 weight decay (1 × 10⁻⁶–1 × 10⁻³), dropout rate (0.2–0.6). Optimizer: type ([“Adam”, “SGD”, “RMSprop”]). For SGD: “momentum” (0.8–0.99).

2.3.4. Model Evaluation Methods

The performance evaluation of the fire occurrence probability prediction model requires systematically examining key metrics derived from the confusion matrix. This is crucial for analyzing the model’s predictive efficacy and practical utility [20]. This study employs a confusion matrix framework based on the four fundamental elements: true positives (TP), true negatives (TN), false positives (FP), and false negatives (FN). Five evaluation metrics—overall accuracy, precision, recall, F1 score, and the AUC—are calculated to assess model performance comprehensively [18,24], as detailed in Table 3.
Accuracy reflects the model’s overall classification capability, representing the proportion of correctly predicted samples among the total samples. Precision measures the reliability of positive predictions, indicating the model’s ability to minimize false alarms (FP). Recall (sensitivity) quantifies the model’s coverage of actual positive samples, directly impacting the risk of missed fire detections (FN). Furthermore, the F1 score, calculated as the harmonic mean of precision and recall, provides a balanced assessment suitable for scenarios with class imbalance.
Area under the receiver opperating characteristic curve evaluates the model’s discriminative power across varying classification thresholds by analyzing the dynamic relationship between the true positive rate (TPR) and false positive rate (FPR) [21]. The integrated AUC value (ranging from 0.5 to 1.0) globally assesses the model’s ranking ability, with higher values indicating superior capability in distinguishing between positive and negative samples. Notably, AUC’s inherent insensitivity to class distribution makes it particularly advantageous in fire risk prediction contexts, where positive and negative samples are often imbalanced, effectively mitigating the limitations of single-threshold evaluations [20].

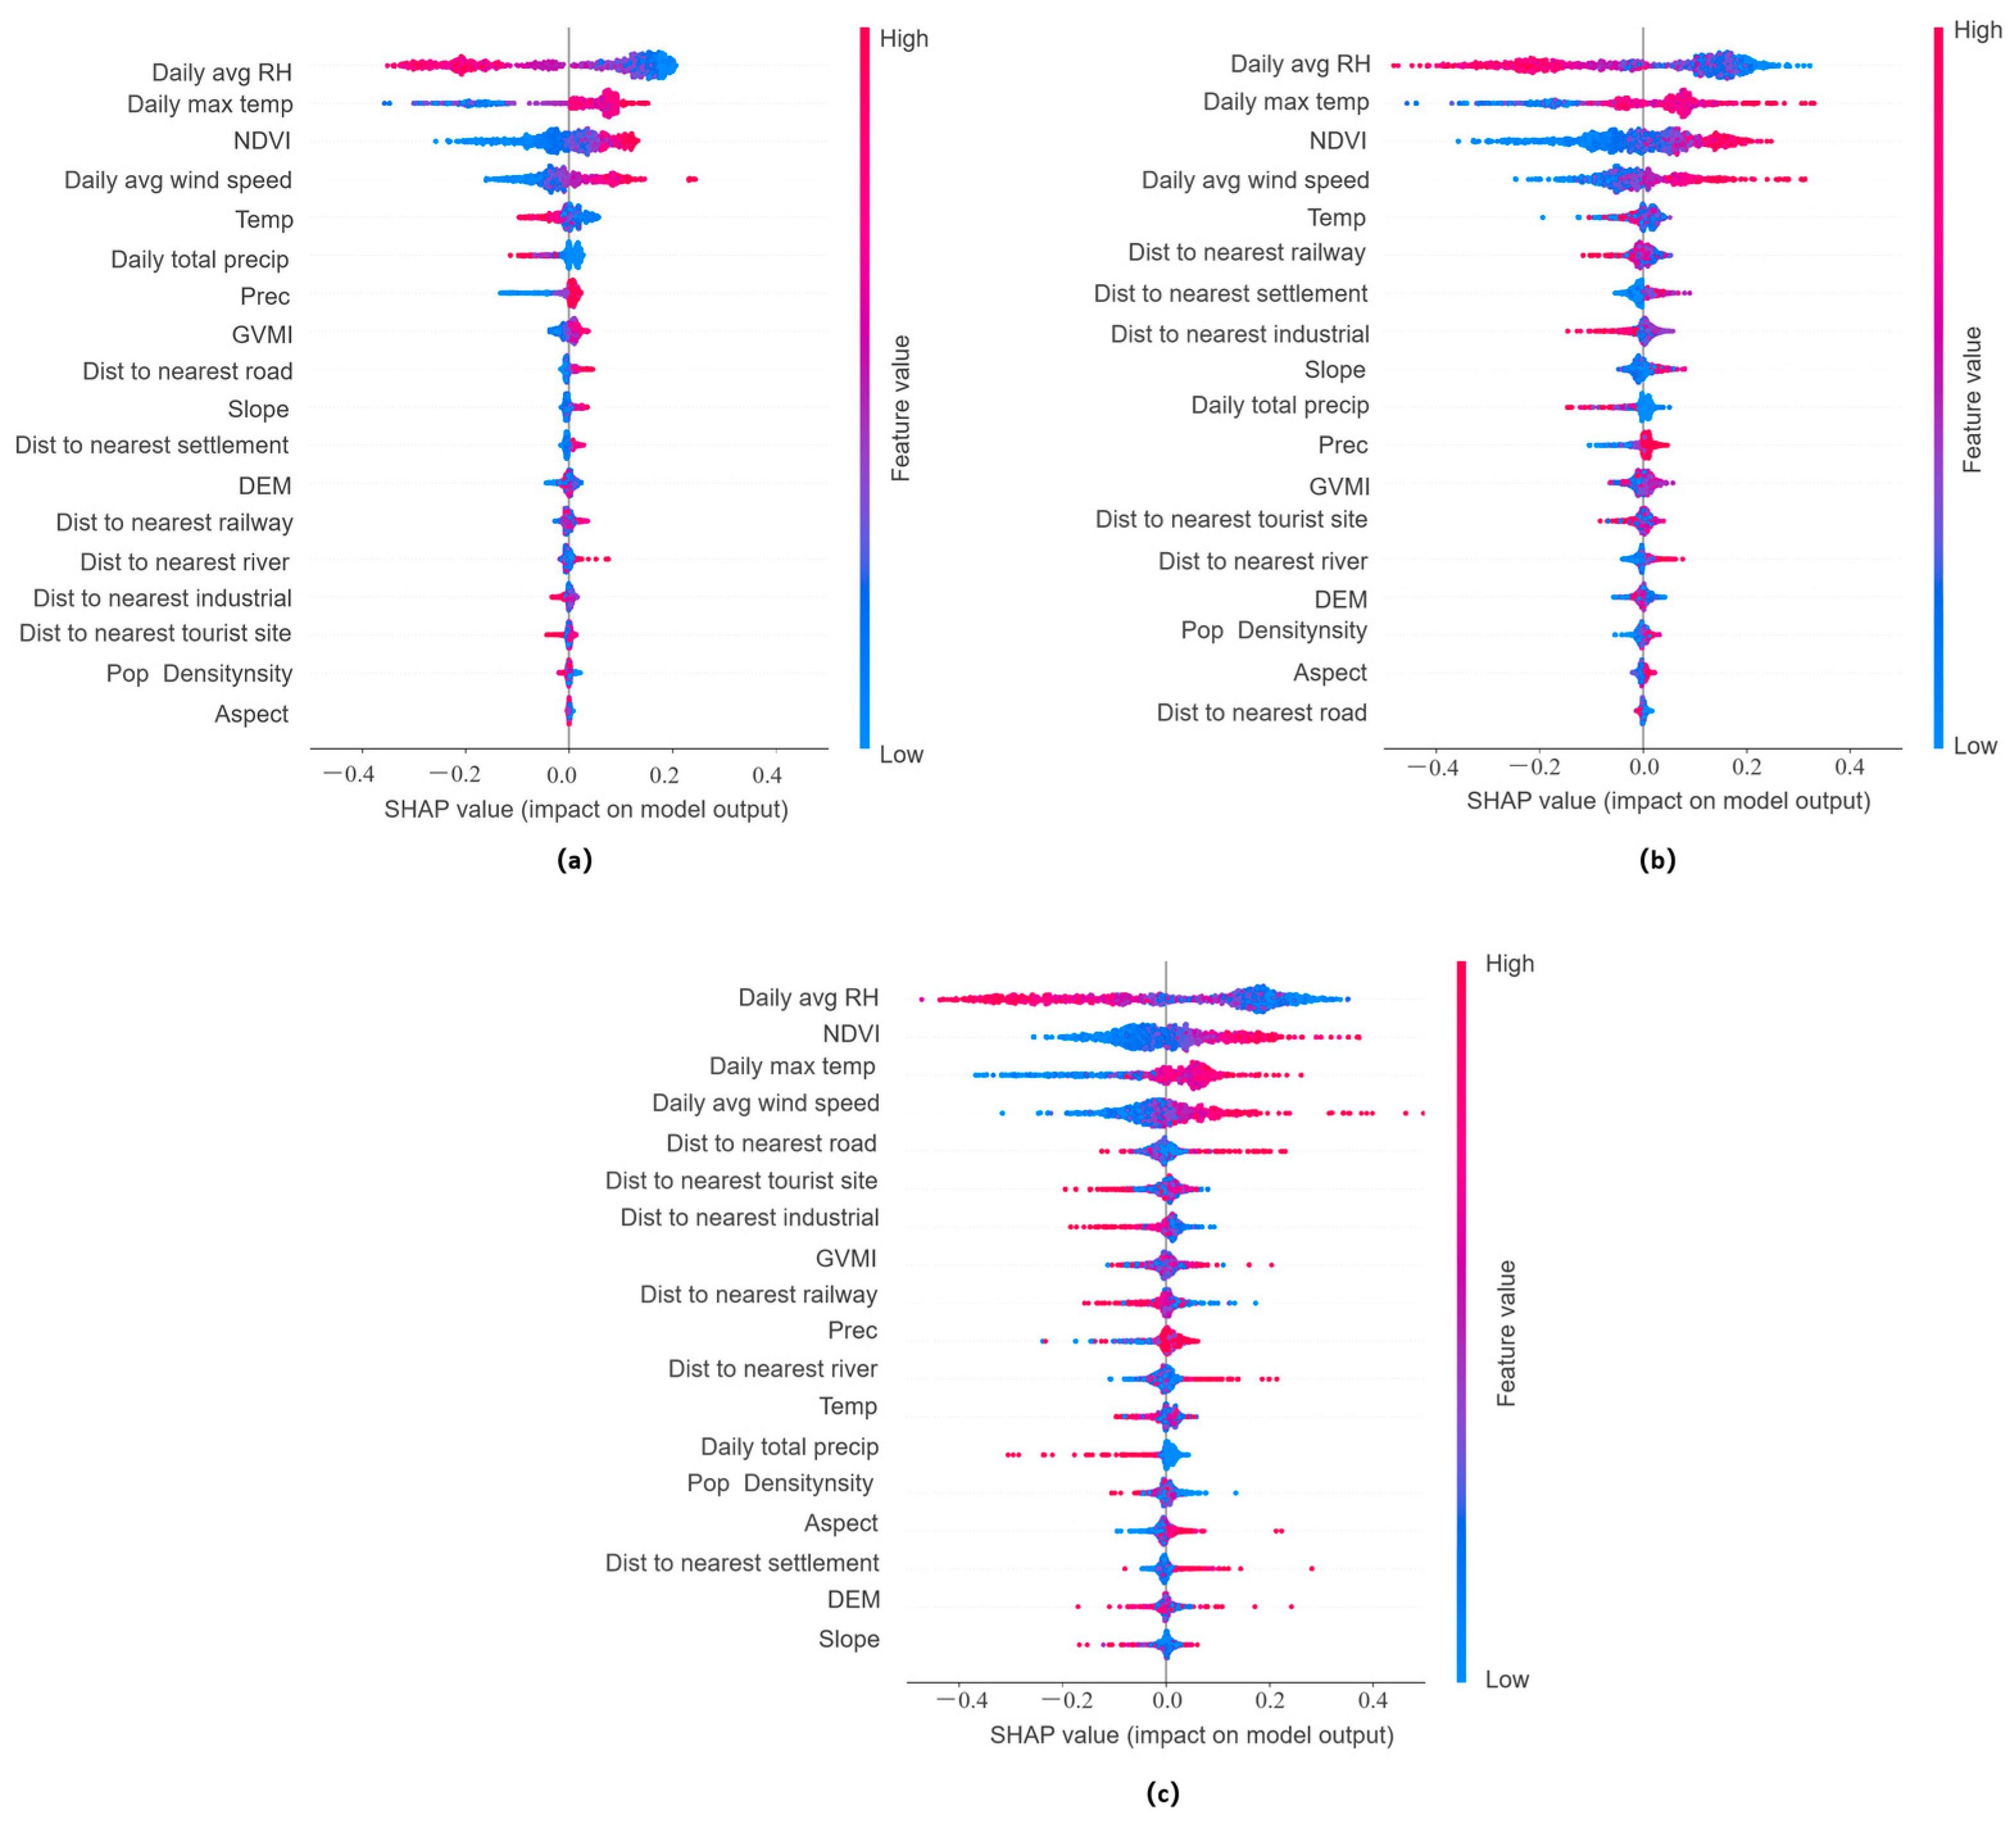
2.3.5. Interpretability Analysis

This study employs SHAP (Shapley additive explanations) to enhance model interpretability and evaluate predictions generated by the RF, XGBoost, and DNN models. Grounded in cooperative game theory and Shapley values [16], SHAP quantifies the marginal contribution of each feature to the model output, providing both global and local interpretability [17]. SHAP values were computed for each model type for the grassland fire occurrence probability prediction task. This enabled a unified assessment of the directionality and magnitude of influence exerted by various environmental features on the predictions. The analysis integrates SHAP visualization techniques to further elucidate key driving factors: beeswarm plots illustrate the nonlinear relationships between feature values and SHAP values while revealing sample density distributions. Mean absolute SHAP value plots rank features by impact magnitude, identifying their relative importance levels [20]. This approach effectively addresses the black-box nature of complex models (e.g., DNN) and provides a quantitative basis for comparing feature explanation consistency across different algorithms [58].

3. Results

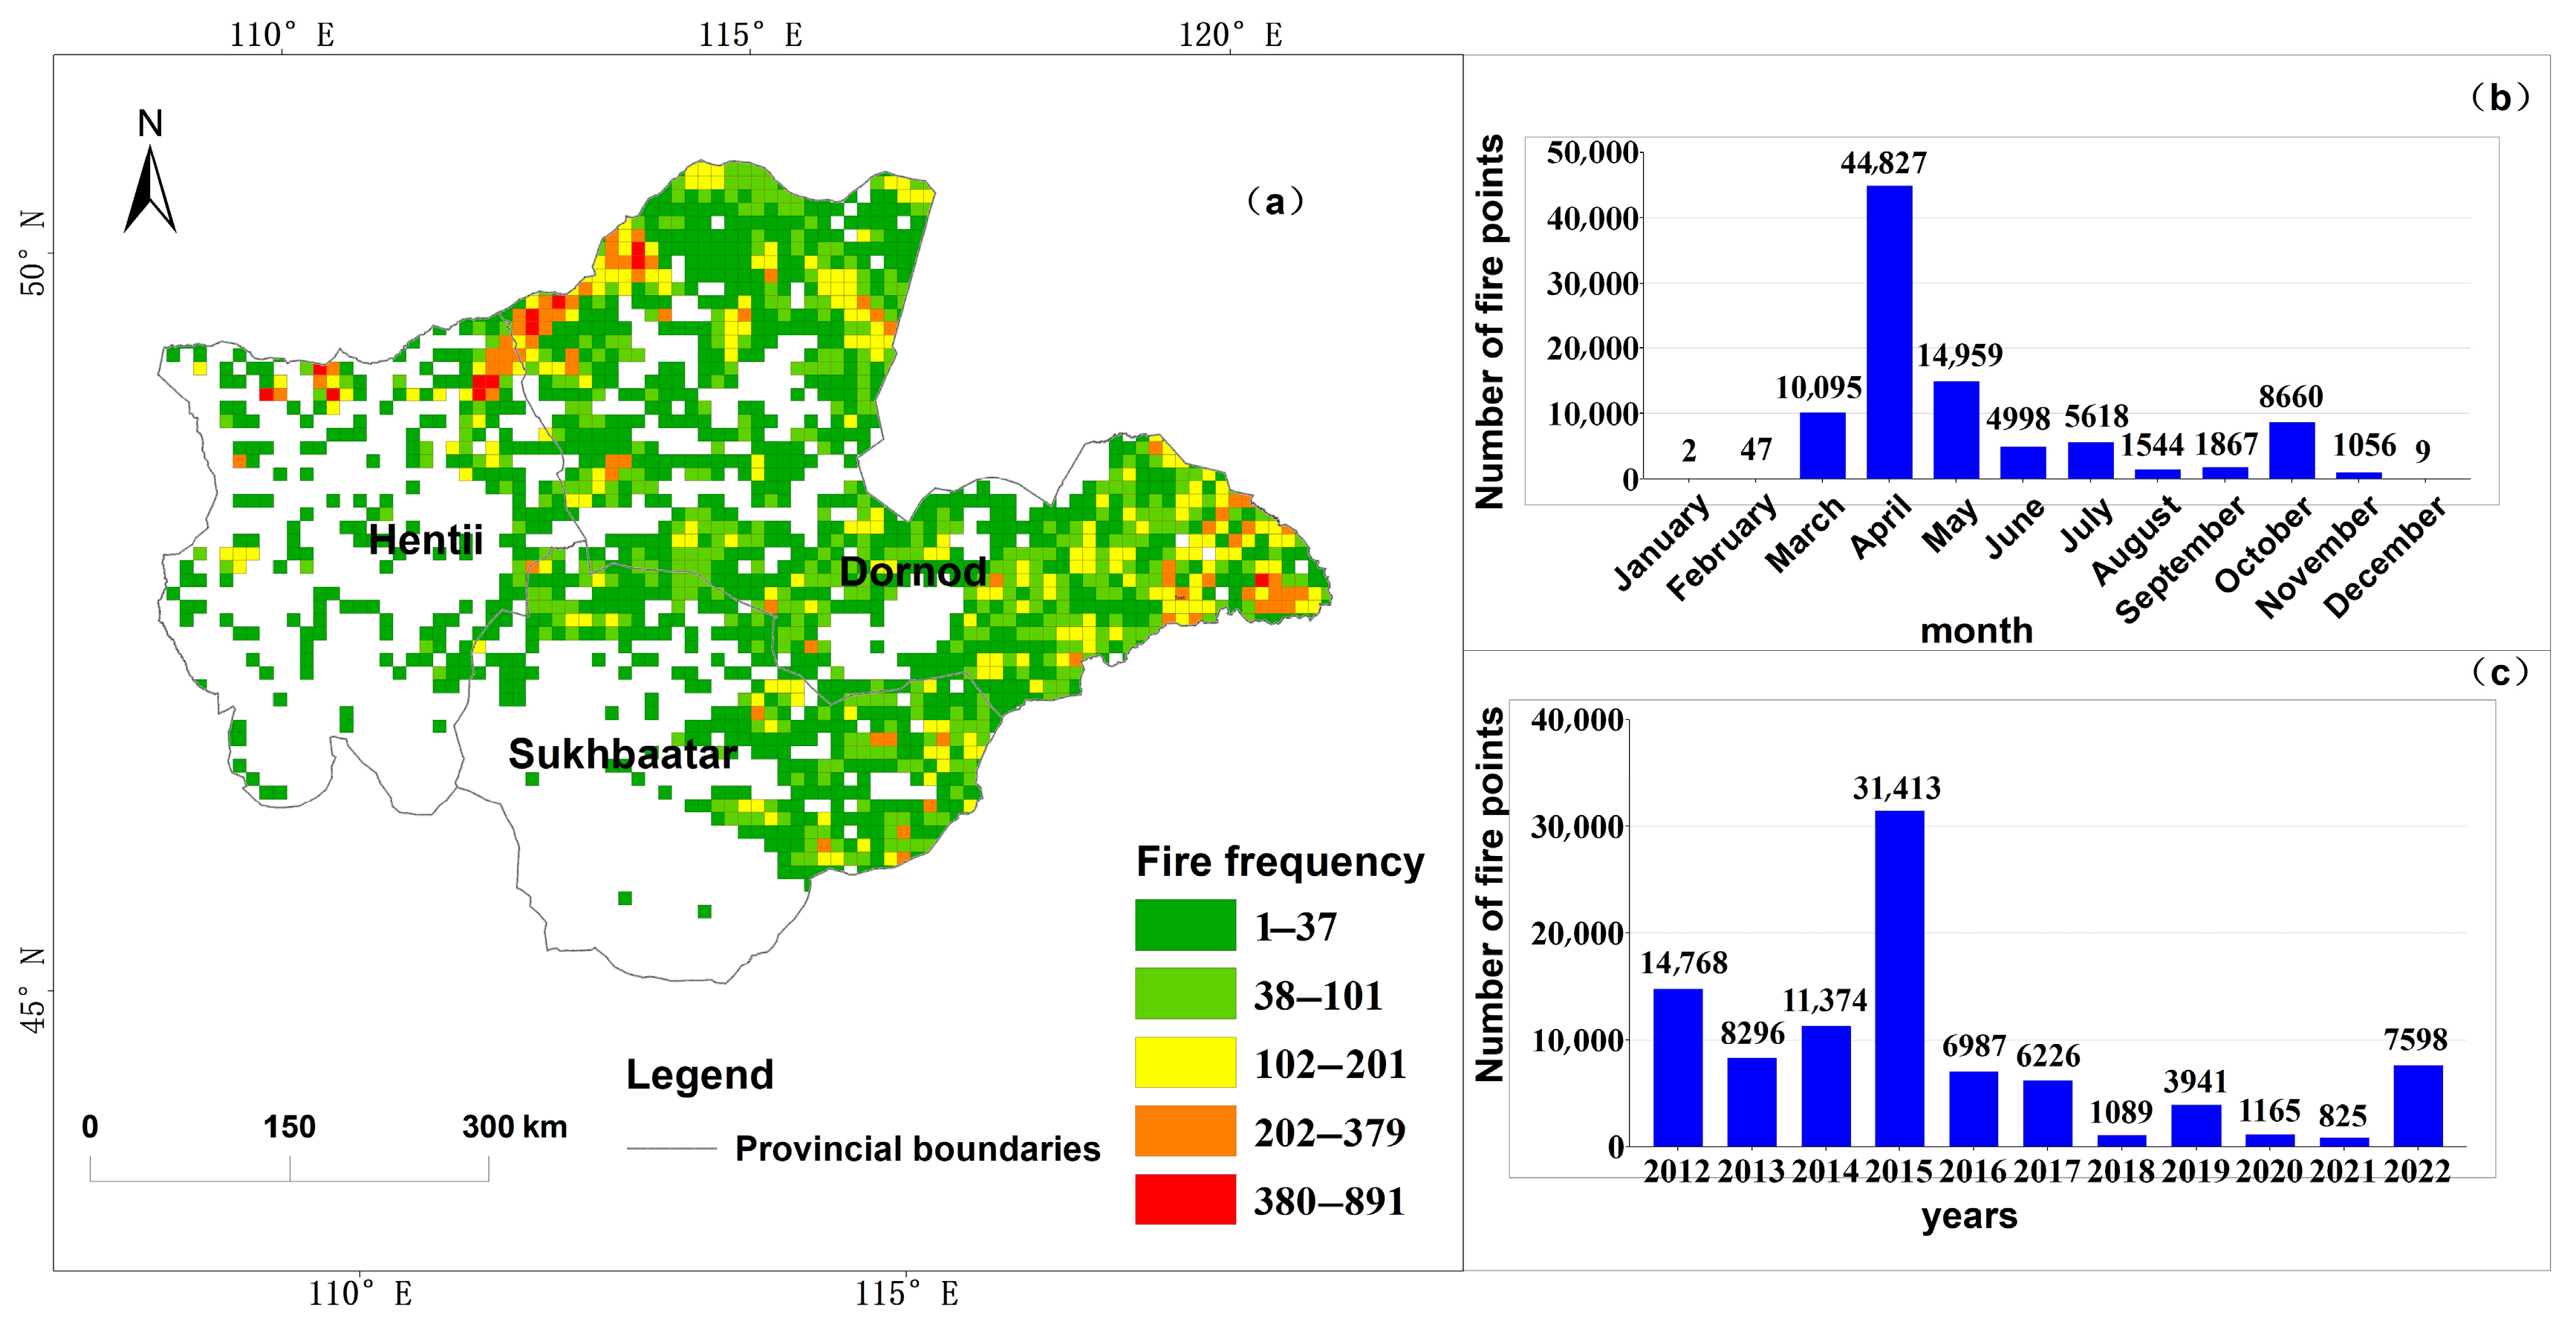
3.1. Spatiotemporal Distribution Patterns of Fire Occurrence

Spatial Distribution: As illustrated in Figure 4, fire incidents exhibited a distinct spatial gradient, with frequency decreasing progressively from the northeast to the southwest regions. Specifically, the northwestern and eastern sectors of Dornod Province demonstrated the highest fire frequency. This spatial pattern aligns with the distribution of vegetation coverage, as these areas exhibit higher multi-year mean NDVI values, indicating greater fuel availability.
Interannual Variability (2012–2022): The annual fire incidents fluctuated downward over the study period. The peak occurred in 2015, with 31,413 fire incidents recorded.
Seasonal Variability: Fire occurrence exhibited strong seasonality, concentrated primarily in March, April, May, and October. April represented the peak fire month. This seasonal pattern correlates strongly with meteorological conditions characteristic of spring: rapid temperature increase, elevated wind speeds, and reduced air humidity, collectively contributing to significantly heightened fire risk. During summer, abundant precipitation led to lower fire incidence. Fire activity increased again in autumn due to drier atmospheric conditions. Furthermore, the elevated latitude of eastern Mongolia results in substantial winter snow cover, which effectively suppresses fire ignition by covering dead fuels.

3.2. Model Fitting and Evaluation

Based on the multicollinearity diagnostic results, all explanatory variables exhibited VIF values below 5, indicating the absence of significant multicollinearity issues. Consequently, 18 explanatory variables were retained for model construction using RF, XGBoost, and DNN algorithms.
The modeling workflow proceeded as follows: First, the spatial point dataset in Shapefile format was loaded using the “geopandas” library to extract the feature matrix and label vector. Subsequently, a stratified random sampling strategy (“stratify = y“) was applied to partition the data into training (70%) and testing (30%) sets, ensuring consistent class distribution across subsets [59]. To eliminate scale differences and mitigate data leakage risks [60], Z-score standardization (μ = 0, σ = 1) was performed on the training set; the test set was then transformed using the mean and standard deviation derived from the training set.
Tailored to each algorithm’s characteristics, a randomized hyperparameter search was conducted over 100 iterations. During each iteration, the mean AUC score, computed via stratified five-fold cross-validation, served as the primary performance metric [45]. The optimization process yielded the following optimal parameter configurations (detailed in Table 4): RF achieved an AUC of 0.9697, XGBoost attained 0.9775, and DNN reached 0.9682.
Using the identified optimal hyperparameters, predictive models for grassland fire occurrence probability in eastern Mongolia were constructed for each algorithm. Model performance was rigorously evaluated on the independent test set. The results (summarized in Table 5 and Figure 5) demonstrate that XGBoost exhibited superior performance across all metrics. It achieved an overall accuracy (OA) of 0.923, notably outperforming DNN (0.915) and RF (0.902) by margins of 0.8% and 2.1%, respectively. Further analysis using the F1-score, a measure of classification capability, confirmed XGBoost’s advantage with a score of 0.925, surpassing DNN (0.915) and RF (0.905). Receiver operating characteristic (ROC) curve analysis validated these findings, with XGBoost achieving the highest AUC value of 0.984, significantly exceeding the AUCs of DNN (0.966) and RF (0.972). Therefore, these results indicate that XGBoost demonstrates markedly superior performance for this classification task. While DNN and RF exhibit strong discriminative capabilities, their performance remains comparatively lower.
This study employed the SHAP interpretability framework to assess the contribution of 18 fire-influencing factors quantitatively, elucidating the decision-making mechanisms of the RF, XGBoost, and DNN models. Notably, this approach enhances the interpretability of predictions and delineates each variable’s positive or negative directional influence on grassland fire occurrence in eastern Mongolia.
SHAP beeswarm plots (Figure 6) provide sample-level visualizations of feature effects:
The x-axis (SHAP value) indicates the magnitude and direction of a feature’s influence on predicted fire probability (positive values denote increased risk). The y-axis ranks features by their global importance (descending order).
Point color corresponds to feature value magnitude (blue: low, red: high). Analysis revealed consistent identification of key predictors across all three models: daily mean relative humidity, daily maximum temperature, daily mean wind speed, and NDVI. Specifically, high daily mean relative humidity exhibited a significant negative association with fire probability. High daily maximum temperature, daily mean wind speed, and NDVI showed positive associations with fire risk. Annual cumulative precipitation positively affected fire occurrence, whereas daily precipitation showed a negative effect. Annual mean temperature negatively correlated with fire probability, suggesting that higher average temperatures may reduce fire risk.
Among spatial proximity factors, greater distances to settlements, roads, and rivers correlated positively with fire probability. Proximity to industrial/mining land and tourist areas was significantly associated with increased fire risk. The directional effects of GVMI, population density, distance to nearest railway, DEM, slope, and aspect were context dependent, varying dynamically based on feature interactions and environmental contexts.
To systematically interpret model prediction mechanisms, mean absolute SHAP value plots were analyzed (Figure 7). These bar charts quantify the global contribution strength of each feature. While beeswarm plots emphasize sample-level directional effects and SHAP value distributions, bar charts visualize the overall contribution magnitude of each feature to the model output via the mean absolute SHAP value (x-axis).
Features are ranked in descending order based on their average impact on predictions. Analysis confirmed that daily mean relative humidity, maximum temperature, daily mean wind speed, and NDVI consistently demonstrated dominant importance across RF, XGBoost, and DNN models, exhibiting higher mean contribution values than other factors. This cross-model consensus robustly validates the critical role of these environmental drivers in grassland fire risk prediction.

3.3. Practical Applicability of the Model

To validate the applicability of the optimized XGBoost model for grassland wildfire risk assessment in eastern Mongolia, we selected two representative case studies: 8 April 2023 and 1 May 2023. Environmental drivers for each date were input into the model, generating spatial probability distribution maps of fire occurrence, which were compared against actual fire incident data recorded on the respective dates.
Regarding spatial risk distribution (as illustrated in Figure 8 and Figure 9), both dates exhibited the highest predicted fire probability in the northern regions of the study area, with comparatively lower risk in the south. Furthermore, predicted probabilities were categorized into five distinct risk levels: extremely high (0.8–1.0), high (0.6–0.8), moderate (0.4–0.6), low (0.2–0.4), and extremely low (0.0–0.2). This five-level classification scheme was adopted to provide a clear and interpretable gradation of risk severity for practical wildfire management applications, while ensuring sufficient resolution to distinguish critical high-risk zones from lower-risk areas.
Area coverage analysis showed that on 8 April 2023, extremely high risk covered 66% of the area, followed by high (7%), moderate (5%), low (7%), and extremely low (15%); similarly, on 1 May 2023, coverage was extremely high (71%), high (6%), moderate (4%), low (4%), and extremely low (15%).
Critically, all recorded fire incidents on both dates occurred within areas classified as extremely high risk, demonstrating strong spatial concordance between predictions and observations. Additionally, temporal risk validation was conducted for two randomly selected ignition points: Point A (117.36° E, 46.70° N) and Point B (116.34° E, 49.57° N). This analysis indicated that the model predicted significantly higher numbers of high-risk days during April, May, September, and October for both locations. Moreover, this temporal pattern aligns with established knowledge of grassland fire seasonality on the Mongolian Plateau, further corroborating the model’s predictive reliability.

4. Discussion

4.1. Model Performance Comparison and Algorithm Selection

This study developed daily-scale grassland fire prediction models for eastern Mongolia using XGBoost, DNN, and RF algorithms integrated with Optuna hyperparameter optimization. Experimental results demonstrated XGBoost’s superior overall performance (test set AUC = 0.984), followed by RF (AUC = 0.972), with DNN exhibiting comparatively weaker predictive capability (AUC = 0.966).
This finding aligns with prior research, and the implementations by Li et al. [24] (XGBoost AUC = 0.953; RF AUC = 0.942) and Shmuel et al. [31] (XGBoost AUC = 0.97; RF AUC = 0.92) collectively demonstrate XGBoost’s consistent advantage over RF in fire prediction tasks. However, direct comparisons with DNN-based studies remain limited due to sparse research.
The enhanced model performance stems from multiple methodological refinements. First, the adoption of the Optuna framework with tree-structured Parzen estimator (TPE) sampling enabled more efficient hyperparameter optimization through 100 trials (including 20 initial random explorations) compared to conventional grid search approaches. Moreover, the implementation of daily-scale meteorological data (2012–2022) provided superior temporal resolution for capturing fire dynamics relative to monthly datasets, thereby improving the precision of predictor–fire relationships. Furthermore, the strategic selection of a focused study area ensured environmental homogeneity, which facilitated both accurate characterization of regional fire regimes and optimal feature selection tailored to local conditions.

4.2. Drivers of Grassland Fire Occurrence

SHAP analysis identified daily mean relative humidity, maximum temperature, and daily mean wind speed as dominant drivers of grassland fires in eastern Mongolia, consistent with findings from Chang et al. [34]. Critically, their synergistic effects govern fire regimes: low humidity accelerates fuel desiccation and lowers ignition thresholds, while extreme temperatures directly elevate fire danger indices, and spring winds amplify fire spread potential [61].
Precipitation exhibited nuanced relationships. Specifically, daily precipitation showed limited influence, potentially due to infrequent rain events, whereas annual precipitation demonstrated indirect effects—enhanced vegetation growth increases fuel biomass accumulation, thereby elevating fire risk [62]. Similarly, the annual mean temperature displayed a weak direct correlation but revealed an ecological pathway whereby sustained warming may suppress vegetation growth through drought stress, ultimately reducing fuel availability [61].
Regarding vegetation indices, NDVI (fuel load proxy) showed a significant contribution, with high-NDVI areas forming “fuel-environment” synergies that amplify fire risk during dry periods [21,63]. Conversely, GVMI exhibited lower impact, potentially due to limited vegetation diversity and moisture variation.
Topographic factors contributed minimally, reflecting homogeneous terrain with limited elevational variation that weakens spatial constraints on fire behavior [21,34].
Anthropogenic factors showed limited influence, primarily due to extremely low population density. This was further compounded by proxy variables (e.g., infrastructure distance) inadequately capturing ignition sources like agricultural fires and mining activities. Nevertheless, human activities remain critical latent risk factors requiring targeted management.
Insights regarding the 2015 fire anomaly: This study observed a significant peak in grassland fire frequency during 2015 (31,413 incidents), substantially exceeding levels in other years of the study period (2012–2022). This anomaly suggests that synergistic interactions between exceptional climatic conditions and human activities may trigger unpredictable fire risk thresholds. Future research should prioritize: investigating meteorological attribution mechanisms by integrating historical climate reanalysis data to quantify amplification effects of extreme 2015 weather events—including prolonged droughts, anomalous heatwaves, and intense wind episodes—on fuel aridity and fire danger ratings; examining coupled human-activity influences through high-resolution land-use change datasets to analyze spatial clustering patterns of anthropogenic ignition sources during anomalous years; and enhancing model adaptability by utilizing such extreme years as independent validation sets to test model generalizability during rare events, while developing dynamic thresholding mechanisms to improve early-warning system robustness.

4.3. Limitations and Future Directions

While the Optuna-optimized XGBoost model demonstrates excellent performance in eastern Mongolia (test AUC = 0.984, spatiotemporal validation accuracy = 92.3%), its cross-regional generalizability remains constrained by dependencies on region-specific environmental drivers and low population density contexts. Primary limitations arise from inadequate characterization of anthropogenic factors alongside sensitivity to microclimatic variations: existing proxy variables (e.g., distance to infrastructure) effectively capture sparse pastoral fire sources yet fail to represent intensive activities such as crop residue burning or mining, thereby necessitating integration of real-time ignition data including thermal anomaly hotspots. Moreover, while optimized for diurnal meteorological fluctuations (humidity, wind, temperature) in arid/semi-arid grasslands, the model requires downscaled climate data or localized calibration of risk thresholds when transferred to microclimate-complex regions like coastal or mountainous areas.
To enhance transferability, we propose implementing regional SHAP-guided retraining for feature reweighting—such as increasing GVMI weight in moisture-sensitive zones—complemented by incorporating high-resolution anthropogenic data layers (e.g., land use databases and ignition point inventories), further enhanced through establishing regionally validated probability thresholds including adjusted “extreme risk” criteria in forested areas. Future work will validate the framework’s adaptability across the Mongolian Plateau while evaluating transfer learning strategies to reduce retraining costs in heterogeneous regions.
While daily-scale meteorological data (2012–2022) demonstrated significant performance improvements over monthly resolution in our study, we acknowledge its limitations in capturing abrupt fire risk factors such as sudden wind shifts, temperature spikes, or ignition events. To address this, we propose enhancing monitoring capabilities through the integration of real-time or higher-temporal-resolution data streams. This could involve incorporating high-frequency observations from geostationary satellites (e.g., GOES or Himawari) to track dynamic changes in vegetation moisture and thermal anomalies, while complementing these with IoT weather stations and radar data for finer-scale microclimate characterization. Furthermore, developing hybrid frameworks that combine daily-scale predictive models with nowcasting techniques presents a promising research direction.

5. Conclusions

This study developed a novel daily-scale grassland fire risk assessment framework for eastern Mongolia by integrating multisource remote sensing data and machine learning, addressing critical gaps in existing regional fire prediction models. The key scientific contributions are as follows:
  • Methodological Innovation:
First high-temporal-resolution model: This study is the first to achieve daily-scale fire risk prediction for Mongolian grasslands, capturing rapid meteorological fluctuations (e.g., humidity, wind speed) that drive fire ignition.
Advanced optimization: Introduced an Optuna-driven Bayesian hyperparameter optimization framework to enhance model adaptability, with XGBoost achieving 92.3% accuracy—surpassing RF and DNN by 2.1% and 0.8%, respectively.
2.
Interpretability and Driver Analysis:
SHAP-based mechanistic insights: Identified four dominant drivers—daily mean relative humidity (negative correlation), daily maximum temperature (positive), wind speed (positive), and NDVI (fuel load proxy)—providing quantitative explanations for fire occurrence.
Cross-model consistency: Demonstrated robustness across RF, XGBoost, and DNN, validating the ecological relevance of these factors.
3.
Practical Validation:
Spatiotemporal accuracy: Validated predictions against 2023 fire events, with 100% of observed ignitions occurring in predicted “extremely high” risk zones.
Seasonal alignment: Confirmed peak risk periods (April–May and September–October) at ignition hotspots (e.g., Points A and B), aligning with historical fire regimes.
Impact: The study provides actionable insights for wildfire prevention, ecological conservation, and pastoral livelihood protection in Mongolia, while contributing methodologically to the field of dynamic fire risk assessment.

Author Contributions

R.N.: conceptualization, methodology, investigation, writing—first draft. B.G.: project management and supervision. W.D.: supervision, funding acquisition, writing—review and editing. Q.M.: formal analysis, software, visualization. N.T.: verification, resource. B.V., Y.S., S.B. and Y.B.: data sorting, surveying, writing—commenting and editing. All authors have read and agreed to the published version of the manuscript.

Funding

This study has been supported by multiple funding projects, including the Mongolian Science and Technology Foundation (CHN-2024/08), the Mongolian National University (NUM) fund to support the implementation of projects in this field (P2023-4592 and P2024-4857); the Inner Mongolia Autonomous Region Science and Technology Plan (2024KJHZ0002, 2022YFSH0027); and the Inner Mongolia “Science and Technology Promotion” Action Key Project (2020ZD0028).

Data Availability Statement

Fire point data in eastern Mongolia can be downloaded from NASA Fire Information Resource Management System (FIRMS) (https://firms.modaps.eosdis.nasa.gov/download/ (accessed on 26 December 2024)). The analytical code for this study was implemented in Python 3.9.21 and has been made publicly available in a GitHub repository (https://github.com/15705000508/Fire-Risk-Assessment-Code, accessed 9 July 2025) to facilitate verification and reuse by the research community.

Acknowledgments

We are grateful for the support of the Arshan Forest and Grassland Disaster Prevention and Mitigation Field Scientific Observation and Research Station of the Inner Mongolia Autonomous Region.

Conflicts of Interest

The authors declare no conflicts of interest.

References

  1. Petermann, J.S.; Buzhdygan, O.Y. Grassland biodiversity. Curr. Biol. 2021, 31, R1195–R1201. [Google Scholar] [CrossRef] [PubMed]
  2. Archibald, S.; Lehmann, C.E.; Gomez-Dans, J.L.; Bradstock, R.A. Defining pyromes and global syndromes of fire regimes. Proc. Natl. Acad. Sci. USA 2013, 110, 6442–6447. [Google Scholar] [CrossRef]
  3. Jones, M.W.; Abatzoglou, J.T.; Veraverbeke, S.; Andela, N.; Lasslop, G.; Forkel, M.; Smith, A.J.; Burton, C.; Betts, R.A.; van der Werf, G.R. Global and regional trends and drivers of fire under climate change. Rev. Geophys. 2022, 60, e2020RG000726. [Google Scholar] [CrossRef]
  4. Nandintsetseg, B.; Boldgiv, B.; Chang, J.; Ciais, P.; Davaanyam, E.; Batbold, A.; Bat-Oyun, T.; Stenseth, N.C. Risk and vulnerability of Mongolian grasslands under climate change. Environ. Res. Lett. 2021, 16, 034035. [Google Scholar] [CrossRef]
  5. Cai, Q.; Chen, W.; Chen, S.; Xie, S.-P.; Piao, J.; Ma, T.; Lan, X. Recent pronounced warming on the Mongolian Plateau boosted by internal climate variability. Nat. Geosci. 2024, 17, 181–188. [Google Scholar] [CrossRef]
  6. Fuhlendorf, S.D.; Engle, D.M.; Kerby, J.; Hamilton, R. Pyric herbivory: Rewilding landscapes through the recoupling of fire and grazing. Conserv. Biol. 2009, 23, 588–598. [Google Scholar] [CrossRef]
  7. Bao, Y.; Shinoda, M.; Yi, K.; Fu, X.; Sun, L.; Nasanbat, E.; Li, N.; Xiang, H.; Yang, Y.; DavdaiJavzmaa, B.; et al. Satellite-Based Analysis of Spatiotemporal Wildfire Pattern in the Mongolian Plateau. Remote Sens. 2023, 15, 190. [Google Scholar] [CrossRef]
  8. Chao, L.; Bao, Y.; Zhang, J.; Bao, Y.; Mei, L.; Cha, E. Effects of Vegetation Belt Movement on Wildfire in the Mongolian Plateau over the Past 40 Years. Remote Sens. 2023, 15, 2341. [Google Scholar] [CrossRef]
  9. Rihan, W.; Zhao, J.; Zhang, H.; Guo, X.; Ying, H.; Deng, G.; Li, H. Wildfires on the Mongolian Plateau: Identifying Drivers and Spatial Distributions to Predict Wildfire Probability. Remote Sens. 2019, 11, 2361. [Google Scholar] [CrossRef]
  10. Chi, W.; Zhang, H.; Xu, K.; Bao, Y. Spatiotemporal patterns and trends of the Mongolian Plateau wildfires. Nat. Inn. Asia 2017, 4, 13–25. [Google Scholar]
  11. Sayad, Y.O.; Mousannif, H.; Al Moatassime, H. Predictive modeling of wildfires: A new dataset and machine learning approach. Fire Saf. J. 2019, 104, 130–146. [Google Scholar] [CrossRef]
  12. Cao, Y.; Wang, M.; Liu, K. Wildfire Susceptibility Assessment in Southern China: A Comparison of Multiple Methods. Int. J. Disaster Risk Sci. 2017, 8, 164–181. [Google Scholar] [CrossRef]
  13. Yathish, H.; Athira, K.V.; Preethi, K.; Pruthviraj, U.; Shetty, A. A Comparative Analysis of Forest Fire Risk Zone Mapping Methods with Expert Knowledge. J. Indian Soc. Remote Sens. 2019, 47, 2047–2060. [Google Scholar] [CrossRef]
  14. Wu, R.; Hong, Z.; Du, W.; Shan, Y.; Ying, H.; Wu, R.; Gantumur, B. A Generalized Spatiotemporally Weighted Boosted Regression to Predict the Occurrence of Grassland Fires in the Mongolian Plateau. Remote Sens. 2025, 17, 1485. [Google Scholar] [CrossRef]
  15. Zhang, H.; Liang, Y.; Ren, H.; Ban, Q. Comparing Grassland Fire Drivers and Models in Inner Mongolia Using Field and Remote Sensing Data. Fire 2025, 8, 93. [Google Scholar] [CrossRef]
  16. Shapley, L.S. A value for n-person games. In Contributions to the Theory of Games II.; Kuhn, H., Tucker, A., Eds.; Princeton University Press: Princeton, NJ, USA, 1953; pp. 307–317. [Google Scholar]
  17. Molnar, C. Interpretable Machine Learning; Lulu.com: Morrisville, NC, USA, 2020. [Google Scholar]
  18. Liao, B.; Zhou, T.; Liu, Y.; Li, M.; Zhang, T. Tackling the Wildfire Prediction Challenge: An Explainable Artificial Intelligence (XAI) Model Combining Extreme Gradient Boosting (XGBoost) with SHapley Additive exPlanations (SHAP) for Enhanced Interpretability and Accuracy. Forests 2025, 16, 689. [Google Scholar] [CrossRef]
  19. Liu, J.; Wang, Y.; Lu, Y.; Zhao, P.; Wang, S.; Sun, Y.; Luo, Y. Application of Remote Sensing and Explainable Artificial Intelligence (XAI) for Wildfire Occurrence Mapping in the Mountainous Region of Southwest China. Remote Sens. 2024, 16, 3602. [Google Scholar] [CrossRef]
  20. Tonbul, H. Integrating ensemble machine learning and explainable AI for enhanced forest fire susceptibility analysis and risk assessment in Türkiye’s Mediterranean region. Earth Sci. Inform. 2024, 17, 5709–5731. [Google Scholar] [CrossRef]
  21. Jiang, W.; Qiao, Y.; Zheng, X.; Zhou, J.; Jiang, J.; Meng, Q.; Su, G.; Zhong, S.; Wang, F. Wildfire risk assessment using deep learning in Guangdong Province, China. Int. J. Appl. Earth Obs. Geoinf. 2024, 128, 103750. [Google Scholar] [CrossRef]
  22. Feurdean, A.; Vasiliev, I. The contribution of fire to the late Miocene spread of grasslands in eastern Eurasia (Black Sea region). Sci. Rep. 2019, 9, 6750. [Google Scholar] [CrossRef]
  23. Millington, J.D.A.; Perkins, O.; Smith, C. Human Fire Use and Management: A Global Database of Anthropogenic Fire Impacts for Modelling. Fire 2022, 5, 87. [Google Scholar] [CrossRef]
  24. Li, Y.; Li, G.; Wang, K.; Wang, Z.; Chen, Y. Forest Fire Risk Prediction Based on Stacking Ensemble Learning for Yunnan Province of China. Fire 2023, 7, 13. [Google Scholar] [CrossRef]
  25. Flannigan, M.; Cantin, A.S.; de Groot, W.J.; Wotton, M.; Newbery, A.; Gowman, L.M. Global wildland fire season severity in the 21st century. For. Ecol. Manag. 2013, 294, 54–61. [Google Scholar] [CrossRef]
  26. Pimont, F.; Dupuy, J.L.; Linn, R.R. Coupled slope and wind effects on fire spread with influences of fire size: A numerical study using FIRETEC. Int. J. Wildland Fire 2012, 21, 828. [Google Scholar] [CrossRef]
  27. Bowman, D.M.; Balch, J.; Artaxo, P.; Bond, W.J.; Cochrane, M.A.; D’Antonio, C.M.; Defries, R.; Johnston, F.H.; Keeley, J.E.; Krawchuk, M.A.; et al. The human dimension of fire regimes on Earth. J. Biogeogr. 2011, 38, 2223–2236. [Google Scholar] [CrossRef] [PubMed]
  28. Sharma, L.K.; Gupta, R.; Fatima, N. Assessing the predictive efficacy of six machine learning algorithms for the susceptibility of Indian forests to fire. Int. J. Wildland Fire 2022, 31, 735–758. [Google Scholar] [CrossRef]
  29. Liu, W.; Wang, S.; Zhou, Y.; Wang, L.; Zhu, J.; Wang, F. Lightning-caused forest fire risk rating assessment based on case-based reasoning: A case study in DaXingAn Mountains of China. Nat. Hazards 2015, 81, 347–363. [Google Scholar] [CrossRef]
  30. Turner, D.; Lewis, M.; Ostendorf, B. Spatial indicators of fire risk in the arid and semi-arid zone of Australia. Ecol. Indic. 2011, 11, 149–167. [Google Scholar] [CrossRef]
  31. Shmuel, A.; Heifetz, E. Global Wildfire Susceptibility Mapping Based on Machine Learning Models. Forests 2022, 13, 1050. [Google Scholar] [CrossRef]
  32. Abatzoglou, J.T.; Williams, A.P.; Boschetti, L.; Zubkova, M.; Kolden, C.A. Global patterns of interannual climate–fire relationships. Glob. Change Biol. 2018, 24, 5164–5175. [Google Scholar] [CrossRef]
  33. Ye, J.; Wu, M.; Deng, Z.; Xu, S.; Zhou, R.; Clarke, K.C. Modeling the spatial patterns of human wildfire ignition in Yunnan province, China. Appl. Geogr. 2017, 89, 150–162. [Google Scholar] [CrossRef]
  34. Chang, C.; Chang, Y.; Xiong, Z.; Ping, X.; Zhang, H.; Guo, M.; Hu, Y. Predicting Grassland Fire-Occurrence Probability in Inner Mongolia Autonomous Region, China. Remote Sens. 2023, 15, 2999. [Google Scholar] [CrossRef]
  35. Ceccato, P.; Gobron, N.; Flasse, S.; Pinty, B.; Tarantola, S. Designing a spectral index to estimate vegetation water content from remote sensing data: Part 1: Theoretical approach. Remote Sens. Environ. 2002, 82, 188–197. [Google Scholar] [CrossRef]
  36. Visner, M.; Shirowzhan, S.; Pettit, C. Spatial Analysis, Interactive Visualisation and GIS-Based Dashboard for Monitoring Spatio-Temporal Changes of Hotspots of Bushfires over 100 Years in New South Wales, Australia. Buildings 2021, 11, 37. [Google Scholar] [CrossRef]
  37. Fawagreh, K.; Gaber, M.M.; Elyan, E. Random forests: From early developments to recent advancements. Syst. Sci. Control Eng. 2014, 2, 602–609. [Google Scholar] [CrossRef]
  38. Breiman, L. Random forests. Mach. Learn. 2001, 45, 5–32. [Google Scholar] [CrossRef]
  39. Chen, T.; Guestrin, C. Xgboost: A scalable tree boosting system. In Proceedings of the 22nd ACM SIGKDD International Conference on Knowledge Discovery and Data Mining, San Francisco, CA, USA, 13–17 August 2016; Association for Computing Machinery: New York, NY, USA, 2016; pp. 785–794. [Google Scholar]
  40. Bentéjac, C.; Csörgő, A.; Martínez-Muñoz, G. A comparative analysis of gradient boosting algorithms. Artif. Intell. Rev. 2021, 54, 1937–1967. [Google Scholar] [CrossRef]
  41. McIntosh, L.; Maheswaranathan, N.; Nayebi, A.; Ganguli, S.; Baccus, S. Deep learning models of the retinal response to natural scenes. In Proceedings of the 30th International Conference on Neural Information Processing Systems, Barcelona, Spain, 5–10 December 2016; Curran Associates Inc.: New York, NY, USA; Volume 29, pp. 1369–1377. [Google Scholar]
  42. LeCun, Y.; Bengio, Y.; Hinton, G. Deep learning. Nature 2015, 521, 436–444. [Google Scholar] [CrossRef]
  43. Akiba, T.; Sano, S.; Yanase, T.; Ohta, T.; Koyama, M. Optuna: A next-generation hyperparameter optimization framework. In Proceedings of the 25th ACM SIGKDD International Conference on Knowledge Discovery & Data Mining, Anchorage, AK, USA, 4–8 August 2019; Association for Computing Machinery: New York, NY, USA, 2019. [Google Scholar]
  44. Bergstra, J.; Bardenet, R.; Bengio, Y.; Kégl, B. Algorithms for hyper-parameter optimization. In Proceedings of the 25th International Conference on Neural Information Processing Systems, Granada, Spain, 12–15 December 2011; Curran Associates Inc.: New York, NY, USA, 2011; p. 24. [Google Scholar]
  45. Kohavi, R. A study of cross-validation and bootstrap for accuracy estimation and model selection. In Proceedings of the 14th International Joint Conference on Artificial Intelligence—Volume 2, Montreal, QC, Canada, 20–25 August 1995; Morgan Kaufmann Publishers Inc.: San Francisco, CA, USA, 1995. [Google Scholar]
  46. Feurer, M.; Hutter, F. Hyperparameter Optimization; Springer International Publishing: Cham, Switzerland, 2019. [Google Scholar]
  47. Prechelt, L. Early stopping—But when? In Neural Networks: Tricks of the Trade; Springer: Berlin/Heidelberg, Germany, 2002; pp. 55–69. [Google Scholar]
  48. Probst, P.; Wright, M.N.; Boulesteix, A.L. Hyperparameters and tuning strategies for random forest. Wiley Interdiscip. Rev. Data Min. Knowl. Discov. 2019, 9, e1301. [Google Scholar] [CrossRef]
  49. Bernard, S.; Heutte, L.; Adam, S. Forest-RK: A new random forest induction method. In Proceedings of the Advanced Intelligent Computing Theories and Applications. With Aspects of Artificial Intelligence: 4th International Conference on Intelligent Computing, Shanghai, China, 15–18 September 2008; Springer: Berlin/Heidelberg, Germany, 2008. [Google Scholar]
  50. Segal, M.R. Machine Learning Benchmarks and Random Forest Regression. University of California: San Francisco, CA, USA, 2004. [Google Scholar]
  51. Geurts, P.; Ernst, D.; Wehenkel, L. Extremely randomized trees. Mach. Learn. 2006, 63, 3–42. [Google Scholar] [CrossRef]
  52. Natekin, A.; Knoll, A. Gradient boosting machines, a tutorial. Front. Neurorobot. 2013, 7, 21. [Google Scholar] [CrossRef]
  53. Tyree, S.; Weinberger, K.Q.; Agrawal, K.; Paykin, J. Parallel boosted regression trees for web search ranking. In Proceedings of the 20th International Conference on World Wide Web, Hyderabad, India, 28 March–1 April 2011; Association for Computing Machinery: New York, NY, USA, 2011. [Google Scholar]
  54. Friedman, J.H. Stochastic gradient boosting. Comput. Stat. Data Anal. 2002, 38, 367–378. [Google Scholar] [CrossRef]
  55. Kingma, D.P.; Ba, J. Adam: A Method for Stochastic Optimization. arXiv 2015, arXiv:1412.6980. [Google Scholar]
  56. Srivastava, N.; Hinton, G.; Krizhevsky, A.; Sutskever, I.; Salakhutdinov, R. Dropout: A simple way to prevent neural networks from overfitting. J. Mach. Learn. Res. 2014, 15, 1929–1958. [Google Scholar]
  57. Chung, J.; Gulcehre, C.; Cho, K.; Bengio, Y. Empirical evaluation of gated recurrent neural networks on sequence modeling. arXiv 2014, arXiv:1412.3555. [Google Scholar]
  58. Roscher, R.; Bohn, B.; Duarte, M.F.; Garcke, J. Explainable machine learning for scientific insights and discoveries. IEEE Access 2020, 8, 42200–42216. [Google Scholar] [CrossRef]
  59. Brenning, A. Spatial cross-validation and bootstrap for the assessment of prediction rules in remote sensing: The R package sperrorest. In Proceedings of the 2012 IEEE International Geoscience and Remote Sensing Symposium, Munich, Germany, 22–27 July 2012; IEEE: Piscataway, NJ, USA, 2012. [Google Scholar]
  60. Cawley, G.C.; Talbot, N.L. On over-fitting in model selection and subsequent selection bias in performance evaluation. J. Mach. Learn. Res. 2010, 11, 2079–2107. [Google Scholar]
  61. Abatzoglou, J.T.; Williams, A.P.; Barbero, R. Global Emergence of Anthropogenic Climate Change in Fire Weather Indices. Geophys. Res. Lett. 2019, 46, 326–336. [Google Scholar] [CrossRef]
  62. Jolly, W.M.; Cochrane, M.A.; Freeborn, P.H.; Holden, Z.A.; Brown, T.J.; Williamson, G.J.; Bowman, D.M. Climate-induced variations in global wildfire danger from 1979 to 2013. Nat. Commun. 2015, 6, 7537. [Google Scholar] [CrossRef]
  63. Forkel, M.; Druke, M.; Thurner, M.; Dorigo, W.; Schaphoff, S.; Thonicke, K.; von Bloh, W.; Carvalhais, N. Constraining modelled global vegetation dynamics and carbon turnover using multiple satellite observations. Sci. Rep. 2019, 9, 18757. [Google Scholar] [CrossRef]
Figure 1. Research technology roadmap.
Fire 08 00273 g001
Figure 2. Eastern Mongolia research area. (a) Mongolia relative location map (b) Mongolia three eastern provinces elevation map (c) Mongolia three eastern provinces fire spot distribution map and land use type map.
Fire 08 00273 g002
Figure 3. Multicollinearity.
Fire 08 00273 g003
Figure 4. Spatial and temporal distribution diagram of fire points. (a) Spatial distribution characteristics of historical fire points in the three eastern provinces of Mongolia (b) Monthly variation characteristics of historical fire points in the three eastern provinces of Mongolia (c) Interannual variation characteristics of historical fire points in the three eastern provinces of Mongolia.
Fire 08 00273 g004
Figure 5. AUC performance of each model.
Fire 08 00273 g005
Figure 6. SHAP swarm diagram: (a) RF, (b) XGBoost, and (c) DNN.
Fire 08 00273 g006
Figure 7. SHAP mean graph: (a) RF, (b) XGBoost, and (c) DNN.
Fire 08 00273 g007
Figure 8. (a) Fire Risk Zoning Chart of the Three Eastern Provinces of Mongolia on 8 April 2023 (b) Area Percentage Chart of Fire Risk Levels (c) Fire Risk Distribution Chart at Point A in 2023.
Fire 08 00273 g008
Figure 9. (a) Fire Risk Zoning Chart of the Three Eastern Provinces of Mongolia on 1 May 2023 (b) Area Percentage Chart of Fire Risk Levels (c) Fire Risk Distribution Chart at Point B in 2023.
Fire 08 00273 g009
Table 1. Key factors influencing grassland fires.
FactorsVariablesAbbreviationUnitsSpatial Resolution
Meteorological factorsAnnual average temperatureTemp°CGenerate 500 m
grid data
Annual average annual precipitationPrecmmGenerate 500 m
grid data
Daily average relative humidityDaily Avg 1 RH%Generate 500 m
grid data
Daily total precipitationDaily total precipmmGenerate 500 m
grid data
Daily maximum temperatureDaily max temp°CGenerate 500 m
grid data
Daily average wind speedDaily Avg wind speedm/sGenerate 500 m grid data
Human FactorsDistance to the nearest settlementDist 1 to nearest settlementkm500 m
Distance to the nearest roadDist to nearest
road
km500 m
Distance to the nearest industrial areaDist to nearest industrialkm500 m
Distance to the nearest tourist siteDist to nearest tourist sitekm500 m
Distance to the nearest riverDist to nearest riverkm500 m
Distance to the nearest railwayDist to nearest railwaykm500 m
Population densityPop DensityPer/km2500 m
Vegetation FactorGlobal vegetation wetness indexGVMI-500 m
Normalized difference vegetation indexNDVI-500 m
Terrain FactorElevationDEMm500 m
Slope aspect (categorical variables)Aspect-500 m
SlopeSlope°500 m
1 Dist = distance; Avg = average.
Table 2. Slope aspect classification.
Slope AspectAspect Angle/(°)Serial Number
Gentle slope−10
North0–22.5/337.5–3601
Northeast22.5–67.52
East67.5–112.53
Southeast112.5–157.54
South157.5–202.55
Southwest202.5–247.56
West247.5–292.57
Northwest292.5–337.58
Table 3. Evaluation indicators.
Evaluation IndicatorsCalculation FormulaJudging Criteria
Accuracy ( O A ) O A = T P + T N T P + F P + T N + F N O A 0,1
The larger the value, the better the model performance.
Recall ( R ) R = T P T P + F N R 0,1
The larger the value, the better the model performance.
Precision ( P ) P = T P T P + F P P 0,1
The larger the value, the better the model performance.
F 1 -score F 1 - s c o r e = 2 × P r e c i s i o n × R e c a l l ( P r e c i s i o n + R e c a l l ) F 1 0,1
The larger the value, the better the model performance.
AUCReceiver operating characteristic curve (ROC) area under the curve A U C 0.5,1
The closer the value is to 1, the better the model performance is.
Table 4. Optimal hyperparameters of each model.
ModelHyperparameter
Name
TypeSearch ScopeOptimal Value
n_estimatorsInteger[50, 800] step size 50400
RFmax_samplesContinuous[0.7, 0.9]0.8987
max_depthInteger[10, 30]28
max_samples_splitInteger[20, 60]20
max_featuresType[“sqrt”, 0.3,
0.5]
sqrt
max_samples_leafInteger[10, 30]10
XGBoostmax_depthInteger[3, 10]9
min_child_weightInteger[1, 10]3
subsampleContinuous[0.6, 1.0]0.9097
colsample_bytreeContinuous[0.6, 1.0]0.9726
reg_alphaContinuous[0, 10]0.1137
reg_lambdaContinuous[0, 10]2.9459
Learning_rateContinuous[0.01, 0.3]0.1573
gammaContinuous[0, 5]0.3161
DNNLearning_rateContinuous[1 × 10⁻⁵, 1 × 10⁻²]0.0040
hidden_layersInteger[2, 5]4
batch_sizeInteger[128, 256, 512]256
dropout_rateContinuous[0.2, 0.6]0.2225
L2_regContinuous[1 × 10⁻⁶, 1 × 10⁻³]8.3792
neuronsInteger[128, 256, 512]512
optimizerType[“Adam”, ”SGD”,
“RMSprop”]
Adam
activationType[“relu”, ”elu”,
“tanh”]
relu
Table 5. Accuracy evaluation results.
IndicatorsRFXGBoostDNN
Accuracy0.9020.9230.915
Precision0.9050.9250.915
Recall0.9050.9200.915
F1-score0.9050.9250.915
AUC0.9720.9840.966
Disclaimer/Publisher’s Note: The statements, opinions and data contained in all publications are solely those of the individual author(s) and contributor(s) and not of MDPI and/or the editor(s). MDPI and/or the editor(s) disclaim responsibility for any injury to people or property resulting from any ideas, methods, instructions or products referred to in the content.

