1. Introduction
In recent years, China has actively and systematically promoted the development of metropolitan areas. Urban rapid rail transit plays a crucial role in connecting cities and driving the growth of central urban areas [
1]. This mode of transit is characterized by large station spacing, fully enclosed tunnels [
2,
3], and long inter-station zones that allow multiple trains to pass simultaneously. The discontinuous “tunnel–train” dual-narrow space is particularly confined, making fire smoke a significant challenge for personnel evacuation, firefighting, and rescue operations.
Previous research has made substantial progress in understanding the temperature distribution and smoke propagation characteristics of tunnel fires, with a primary focus on fire scenarios involving a single train. Xu et al. and Du et al. [
4,
5] were among the first to study train compartment fires, finding that the fire source location and train ventilation conditions significantly impact smoke propagation rates and compartment temperature distribution. Zhang et al. [
6,
7] investigated critical wind speeds in subway tunnels using numerical simulations and experiments, proposing a modified formula that accounts for train length in critical wind speed prediction. Zhang et al. [
8] further examined smoke backflow length in subway fires through numerical simulations, developing a predictive formula that considers tunnel cross-sectional area and blockage effects. Their findings revealed that the attenuation coefficient of the longitudinal temperature distribution in tunnel fires decreases as the distance between fire sources increases, leading to the establishment of a predictive model for longitudinal temperature distribution. Ren et al. [
9] investigated the smoke flow characteristics and smoke temperature changes in subway train tunnels under the conditions of two double fire sources by numerical simulation, and found that the attenuation coefficient of the longitudinal temperature distribution of smoke in tunnel fires decreases with the increase in the distance between the fire sources, and established a prediction model for the longitudinal temperature distribution. Mao et al. [
10] conducted research on subway tunnels using a 1:8 scale model test and PHOENICS software (2024 version) to analyze the temperature characteristics of flame roof jets, identifying the temporal and spatial distribution of temperature under different fuel loads. Zhai et al. [
11] used numerical simulations to investigate the maximum temperature rise of the tunnel vault under a 42–57% blockage effect, proposing a refined prediction model. Zheng et al. [
12] analyzed tunnel temperature and flow velocity distribution under various train stopping positions using numerical simulations and formulated a fire smoke evacuation strategy for metropolitan express line tunnels exceeding 20 km in length.
In contrast, research on multi-train operation scenarios in ultra-long interval tunnels remains relatively limited. Liu et al. [
13] investigated temperature distribution and critical wind pressure in a two-train fire scenario using a 1:16 scaled experimental platform. Their study considered factors such as fire source power, train and tunnel lengths, train speed, deceleration, and obstruction ratio. Based on these findings, they proposed a multi-train piston wind model and a simplified two-dimensional simulation method for moving trains. Li et al. [
14,
15] examined fire smoke control and passenger evacuation in an ultra-long tunnel under a dual-train tracking mode using numerical simulations. Their study revealed that smoke reached the rear train at 600 s and fully engulfed it by 620 s, with the smoke temperature decay following a double-exponential model.
Understanding temperature distribution and smoke propagation characteristics in multi-train fire scenarios is essential for developing effective ventilation and smoke extraction strategies. This study analyzes fire scenarios involving multiple trains in an ultra-long tunnel of a metropolitan express line, focusing on the effects of train spacing and backward spacing on temperature distribution, flow velocity, smoke backflow length, and visibility. By revealing the smoke propagation patterns in ultra-long tunnels, this research provides a critical theoretical foundation and practical guidance for enhancing tunnel safety and optimizing passenger evacuation strategies in metropolitan express line systems.
In previous studies, steady-state fire source models have been widely adopted to investigate smoke propagation and thermal environments in tunnel fires. Ji et al. [
16] conducted numerical simulations to examine the influence of different fire source aspect ratios on smoke spread and temperature fields in a tunnel, using a constant heat release rate throughout a 150-s simulation. Guo et al. [
17] employed FDS to study smoke stratification under longitudinal ventilation, also using a steady-state fire source. Zhang et al. [
18] explored the effect of smoke barrier inclination angles on smoke control performance by simulating three fire scenarios with fixed HRRs of 10 MW, 20 MW, and 50 MW to represent different fire intensities. In line with these studies, this work adopts a steady-state fire source model to facilitate the analysis of back-layering length and temperature field development in tunnel fires under various train spacing and ventilation conditions.
In contrast to typical metro tunnel fire studies that focus on single-train scenarios, ultra-long interval tunnels on metropolitan express lines often accommodate multiple trains operating in sequence. This study specifically investigates fire incidents where a leading train catches fire and a following train may or may not stop in time, resulting in varied inter-train distances. By analyzing smoke back-layering behavior under different train spacings, we aim to identify a minimum safe spacing beyond which the upstream train is no longer affected by high-temperature smoke. Additionally, given the elevated risk posed by fires located on the train roof—particularly close to the tunnel ceiling—this study considers three fire source positions: at the front, middle, and rear of the train. We further examine receding strategies under reverse ventilation to determine safe retreat distances for trailing trains. These investigations collectively provide a more comprehensive understanding of fire smoke propagation in complex multi-train scenarios and offer practical guidance for ventilation design and emergency response in ultra-long metropolitan express tunnels.
2. Numerical Model
2.1. Physical Model and Measurement Point Arrangement
The smoke flow in tunnel fires falls under the category of fluid dynamics. It is governed by the laws of conservation of mass, energy, and momentum, along with species equations, and follows the distribution laws dictated by the species conservation principle. The governing equations for smoke flow in tunnel fires are as follows [
19]:
Species Transport Equation:
Equation of State:
where
ρ is the density, kg/m
3;
t is the time, s;
g is the gravitational acceleration, m/s
2;
u is the velocity vector, m/s;
is the Laplacian operator;
p is the pressure, Pa;
f is the environmental force vector;
τij is the viscous stress tensor of a Newtonian fluid;
h is the enthalpy, J/kg;
is the volumetric heat release rate, kW/m
3;
is the heat flux vector;
Ψ is the dissipation rate;
is the molar mass of the gas, g/mol;
T is the temperature, K; and
R is the ideal gas constant.
To investigate the fire-induced smoke propagation characteristics in an ultra-long interval tunnel under train blockage scenarios, this study employed the Fire Dynamics Simulator (FDS), version 6.7.4, developed by the National Institute of Standards and Technology (NIST). FDS numerically solves the low-Mach-number, buoyancy-driven Navier–Stokes equations using the Large Eddy Simulation (LES) method, which is suitable for capturing unsteady turbulent flow, temperature fields, and smoke movement in tunnel fire scenarios. To simplify the simulation, the Boussinesq approximation is applied to account for buoyancy effects, and the flow is assumed to be incompressible with instantaneous pressure response throughout the domain. The following assumptions are made: (1) the fire source is treated as a steady heat source without flame spread; (2) chemical reactions and smoke composition changes are neglected; and (3) pressure work and thermal diffusion are ignored.
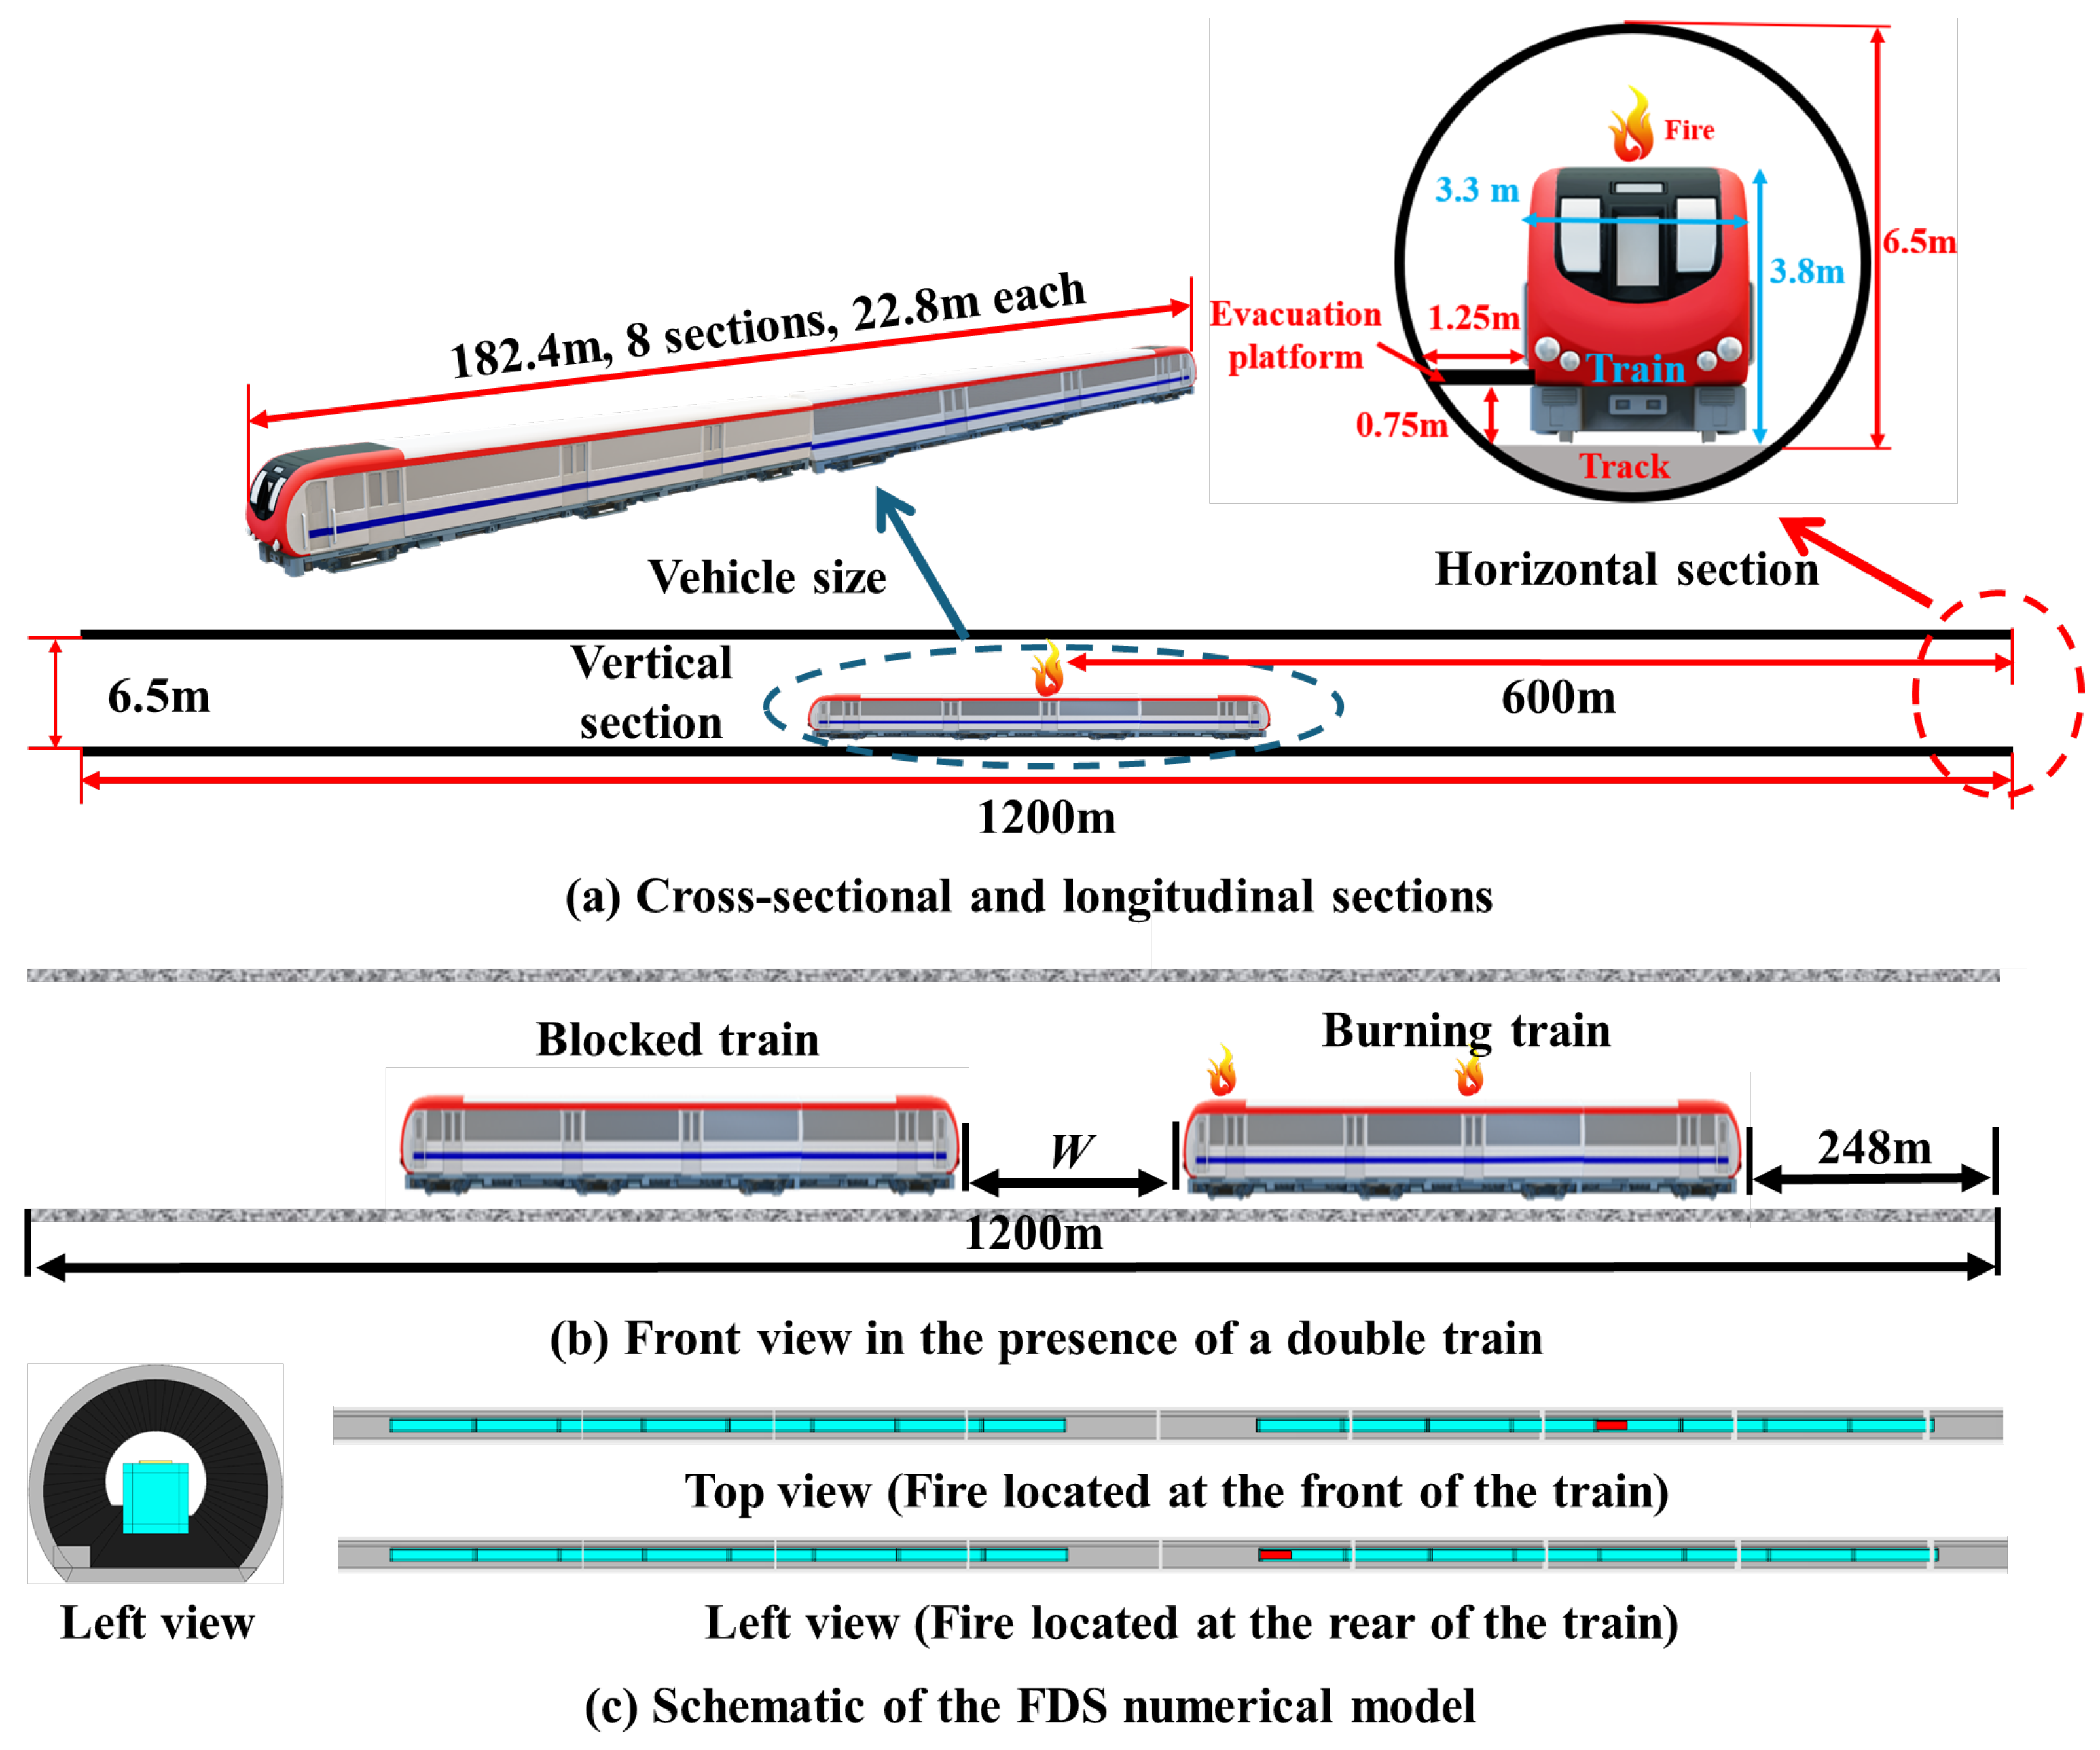
The simulation model was established based on a representative metropolitan city express line project in South China. The total length of the tunnel is 1200.00 m, with a vertical height of 6.50 m, as shown in
Figure 1. The tunnel features a circular arch cross-section, and the distance from the track level to the vault is also 6.50 m. Trains are composed of eight cars in a fixed formation, with each car measuring 22.80 m in length, 3.30 m in width, and 3.80 m in height. The inner surfaces of the tunnel, including the floor, sidewalls, and ceiling, were assumed to be constructed of concrete and defined with the built-in “CONCRETE” material in FDS. The body of each train car, including the side panels, roof, and underframe, was defined using the “STEEL” material. The tunnel portal was set as a “SUPPLY” boundary condition to impose longitudinal ventilation, while the tunnel exit was modeled as “OPEN” to allow pressure relief and free smoke outflow. The fire source was modeled with a constant heat release rate (HRR) from the start, representing a fully developed steady-state fire without a growth phase. The fire source was positioned at the top of a selected train car, representing a severe scenario where the air-conditioning unit ignites. The fire was modeled as a steady-state cuboid surface burner with an area of 2.0 m × 8.0 m, located near the tunnel ceiling. The ambient temperature was initialized at 293 K, ambient pressure was 101.32 kPa. Each simulation case was run for 400 s.
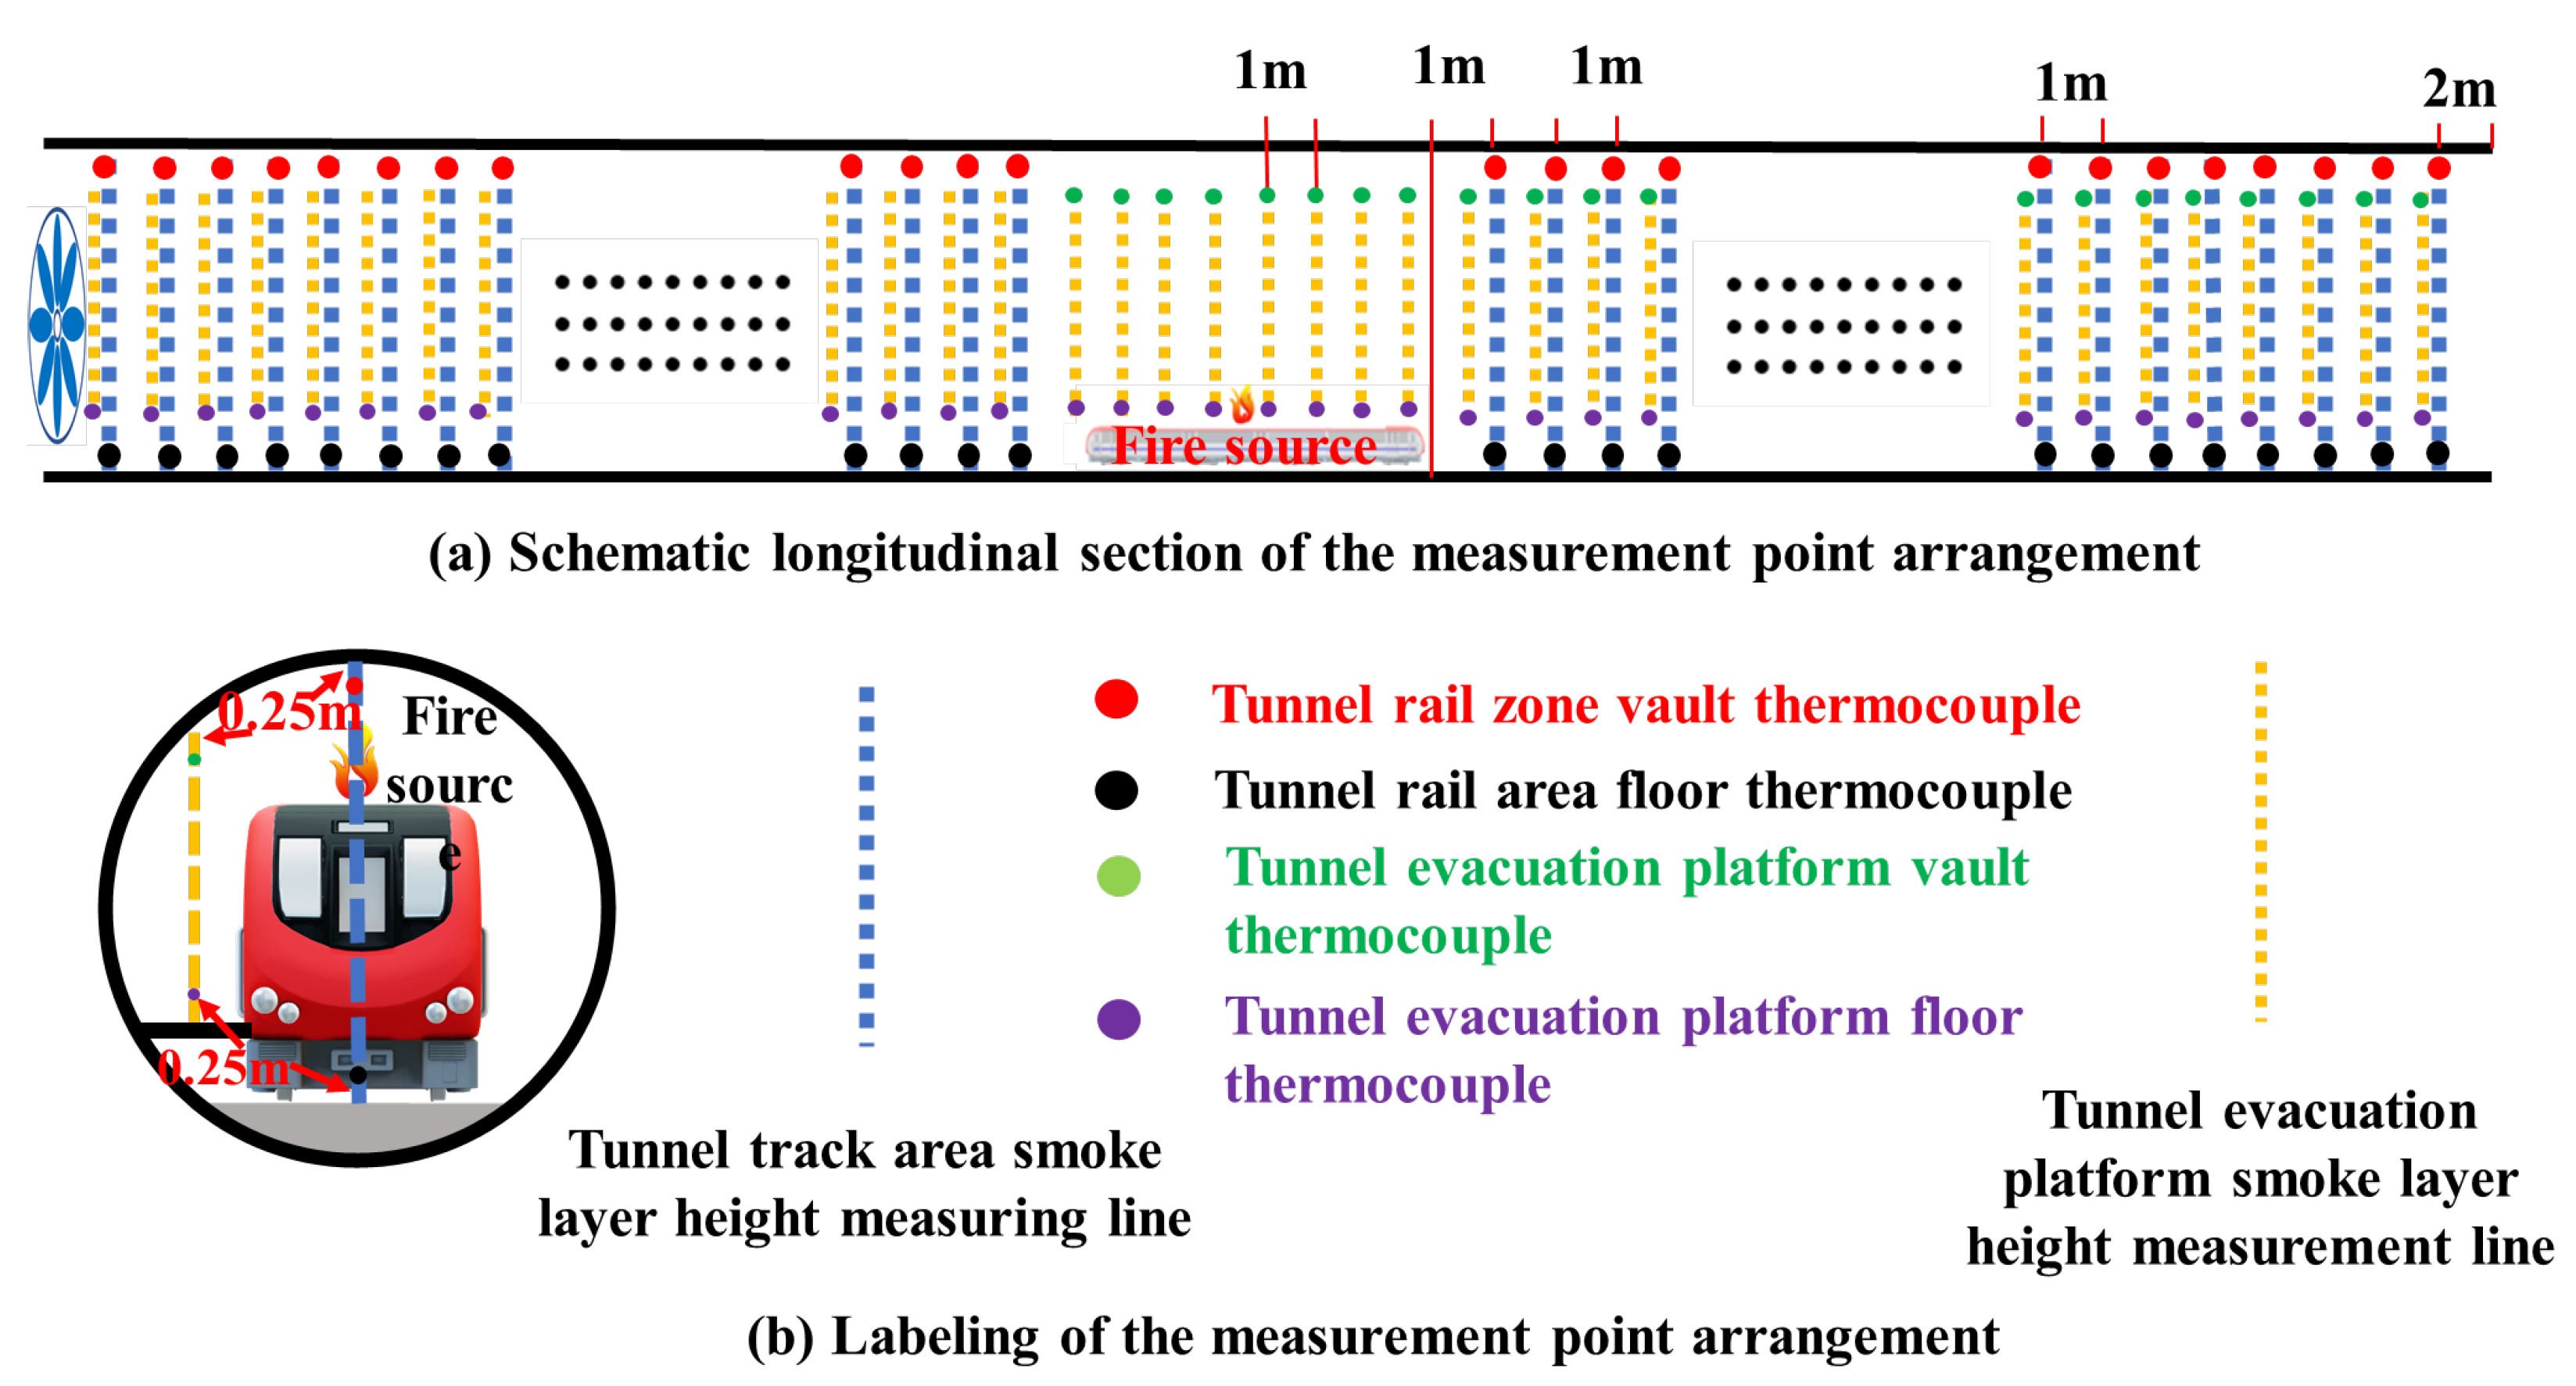
As
Figure 2 shows, to obtain temperature data near the tunnel vault and floor, thermocouples were placed 0.25 m from both the vault and floor in the tunnel rail area, as well as from the roof and floor of the evacuation platform. Additionally, to determine the height of the smoke layer and measure the average temperature of both the hot smoke layer and the cold air layer, a smoke layer height measurement line was established. All measurement points were positioned along the centerline of either the track area or the evacuation platform, with a spacing of 1.00 m between them. Furthermore, a measurement line was specifically arranged along the centerline of the evacuation platform to ensure comprehensive data collection.
The evacuation platform was included in the model primarily to reflect the typical structural features of a metro tunnel and to ensure completeness in the simulation environment. However, as the platform was located below the main smoke flow region and had limited influence on the back-layering behavior, it was not the focus of analysis in this study. For more detailed analysis concerning evacuation conditions and platform-level smoke effects, readers are referred to our previous publication [
20].
2.2. Fire Scenario and Working Condition Settings
In long-interval urban rail transit tunnels, it is common for multiple trains to operate simultaneously. When a fire breaks out on one train, the upstream train can quickly leave the affected section in the direction of travel, while the downstream blocked train must either be pushed to a safe zone or remain stationary.
Based on fire statistics, relevant studies [
21,
22,
23,
24], and vehicle structure analysis [
25], this study investigates fire scenarios where the air-conditioning unit on top of a subway train ignites due to overheating. In tunnel fire conditions, bidirectional ventilation can typically be achieved via shaft facilities or terminal stations. The ventilation direction is not necessarily aligned with the direction of train travel, allowing for flexible strategies to support passenger evacuation.
Given the considerable length of the train, three typical fire source locations are considered in this study: the front of the train (Position C), the middle (Position B), and the rear (Position A).
(1) For a fire located at the front of the train (
Figure 3a), the upstream train can quickly depart the tunnel, and smoke can be extracted effectively through the ventilation system. Since neither the burning train nor the blocked train is exposed to high-temperature smoke in this scenario, the fire hazard is relatively low. Therefore, this scenario was not included in the numerical simulations.
(2) For a fire in the middle of the train (
Figure 3b), the upstream ventilation system directs smoke toward the side with fewer evacuees, minimizing the impact on evacuation paths.
(3) For a fire located at the rear (
Figure 3c,d), forward ventilation may threaten Train No. 2 with smoke, while reverse ventilation could pose a risk to Train No. 1 due to its limited deceleration capability during emergency braking.
By analyzing the effects of different fire source locations and ventilation strategies on smoke propagation and train safety, this study offers critical insights into the design of effective operational conditions. It also provides essential guidance for the development of personnel evacuation and smoke control strategies in multi-train fire scenarios within ultra-long tunnels.
According to the “Metro Design Fire Protection Standard” (GB51298-2018) [
26], the design fire size for metro trains in China typically ranges from 7.5 MW to 10.5 MW. Based on the most unfavorable scenario, the heat release rate (HRR) was set to a constant 10.5 MW. The fire source was modeled as a steady-state point source with a rectangular surface area of 2 m × 8 m. The ignition location was set on the roof of a train car to simulate a fire originating from rooftop HVAC equipment, which poses higher risk due to its close proximity to the tunnel ceiling. The simulation focused on how different train spacings, fire source positions, and ventilation conditions affect the movement of hot smoke in multi-train scenarios within ultra-long urban express tunnels. A total of 67 operating conditions were considered, involving five train spacings, two ventilation directions, and various ventilation speeds. The detailed settings are listed in
Table 1.
The selected inter-train distances of 50 m–500 m are based on the train-following interval calculation method under CBTC (Communication-Based Train Control) systems in urban express railways. Specifically, the total length of a train is 182.4 m, the emergency braking distance is approximately 985 m, and the safe protection distance is 110 m. Taking these factors into account, a reasonable train spacing range from 50 m to 500 m was considered to cover possible emergency scenarios as well as actual operational intervals in ultra-long tunnels.
2.3. Validation of the Validity of Numerical Simulations
When conducting a mesh independence analysis, it is essential to balance the accuracy of the numerical simulation results with the computational capacity available. According to verification by the National Institute of Standards and Technology, the numerical simulation results exhibit a high degree of consistency with experimental data when the mesh size d is within the range of [
D*/16,
D*/4] [
20], where
D* represents the characteristic diameter of the fire source, typically defined by the equation shown in Equation (1).
where
is the air density, kg/m
3;
cₚ is the specific heat capacity of air, kJ/(kg·K);
is the ambient air temperature, K; and
g is the acceleration due to gravity, m/s
2.The characteristic fire diameter
D* was calculated to be 2.43, and the recommended grid size range is 0.15 m to 0.61 m. Considering the computational performance and the timeliness requirements of the simulation, a mesh size of 0.25 m × 0.25 m × 0.25 m was selected for the region of primary interest (between 700 m and 900 m along the tunnel), where the fire source is located. This mesh resolution has also been validated in a previous study [
20], in which temperature profiles at 120 m downstream of the fire source were compared under different grid sizes, showing limited sensitivity to further mesh refinement. In addition, the mesh sensitivity analysis indicates that the maximum smoke temperature above the fire source and the longitudinal wind velocity downstream of the fire are more significantly affected by grid resolution. Therefore, to ensure simulation accuracy for the key research parameters—maximum smoke temperature and back-layering length—the mesh was refined in the fire region. Specifically, the tunnel domain was divided into two mesh regions, refined region (700–900 m): 0.25 m × 0.25 m × 0.25 m, with 864,000 cells, coarser region (rest of the tunnel): 0.5 m × 0.25 m × 0.25 m, with 2,160,000 cells, total number of cells is 3,024,000. The same meshing strategy and physical model were applied consistently across all simulation cases.
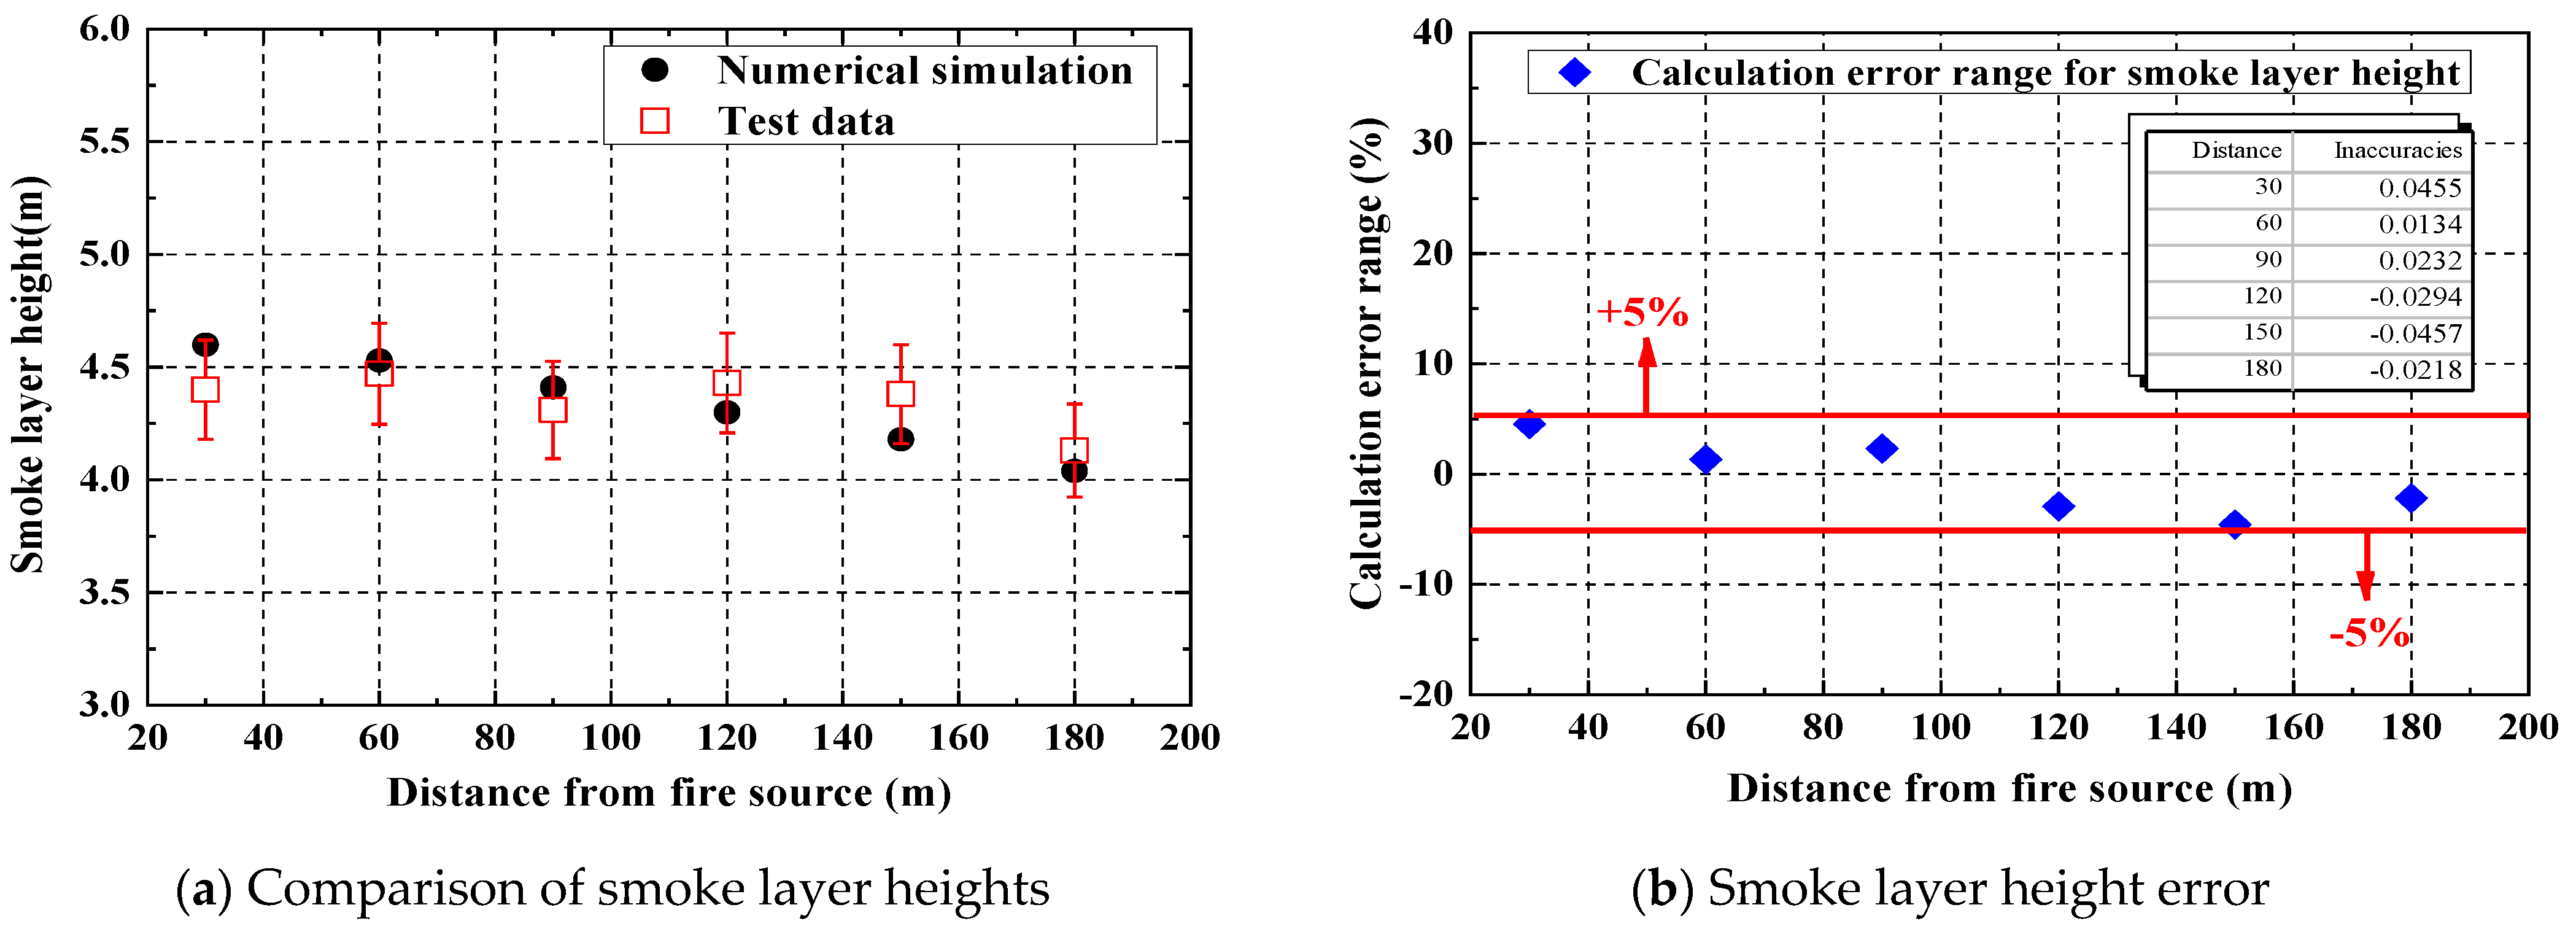
The validity of the numerical simulation was verified using a 1:15 reduced-scale physical model test platform. The height of the smoke layer under natural ventilation conditions, with a fire heat release rate of 10.5 MW, was measured and compared with the numerical simulation results.
Figure 4 presents the comparison between the simulation and experimental data, demonstrating consistent trends. Error bars in
Figure 4a represent the fluctuation range of the measured smoke layer height during the physical test. To quantify the agreement, relative errors were calculated at multiple positions downstream of the fire source using Equation (2), and are shown in
Figure 4b. These values reflect the difference between simulated and experimental smoke layer heights, with all errors remaining below 5%. This agreement verifies the reliability of the numerical simulation.
The error was calculated using Equation (2), as follows:
where
is the error value;
hₙᵤₘ is the height of the smoke layer obtained from the numerical simulation, m; and
hₑₓₚ is the height of the smoke layer obtained from the physical model test, m.
3. Discussion of Results
3.1. Train Spacing on Fire Smoke Propagation Characteristics Study
Using fire source B as a reference, a detailed study was carried out to examine the impact of train spacing on the characteristics of fire-induced smoke propagation. Under a ventilation velocity of 0.4 m/s, the temperature distribution, flow velocity distribution, and the evolution of smoke backflow length in the tunnel were systematically analyzed.
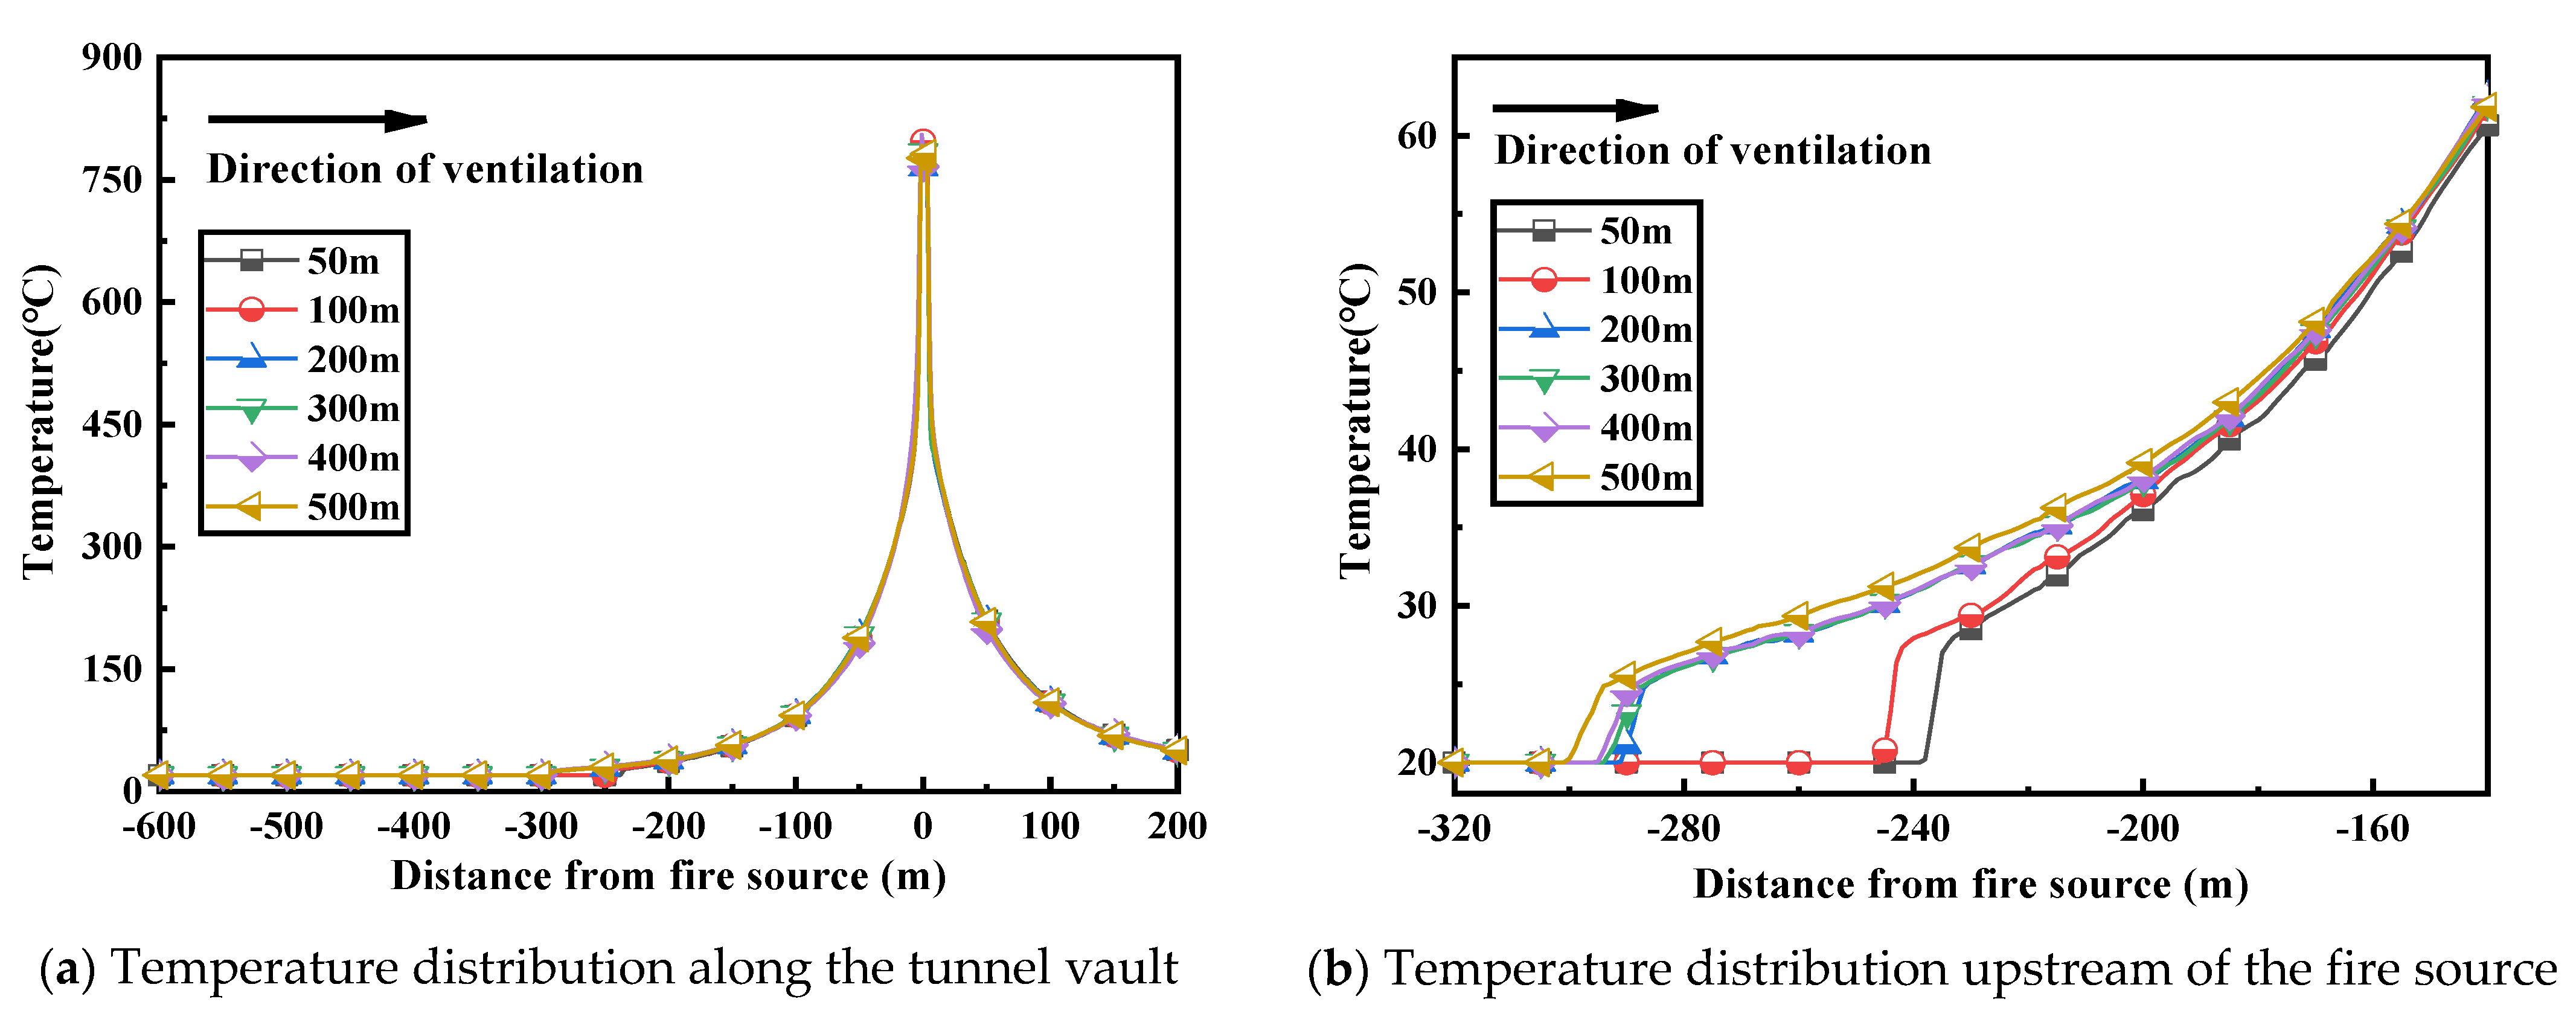
The distribution of the smoke temperature field along the tunnel vault under different train spacings is generally similar, as shown in
Figure 5a. Downstream of the fire source, the smoke temperature gradually decreases with distance, reaching approximately 50 °C at 200 m. Upstream, the temperature is influenced by longitudinal ventilation and gradually returns to ambient levels beyond 200 m, with a slower rate of decay as the distance increases. To better capture subtle differences in this transition zone, we have expanded the enlarged view to include the 20–60 °C temperature range.
Figure 5b presents an enlarged view of the upstream region from 140 m to 320 m. It can be observed that when the train spacing is less than 200 m, the temperature drops more rapidly and reaches ambient levels at approximately 250 m upstream. For spacings equal to or greater than 200 m, the temperature decreases more gradually, stabilizing around 300 m. The area beyond 320 m maintains ambient conditions, which may be attributed to the limited smoke development time in the simulation.
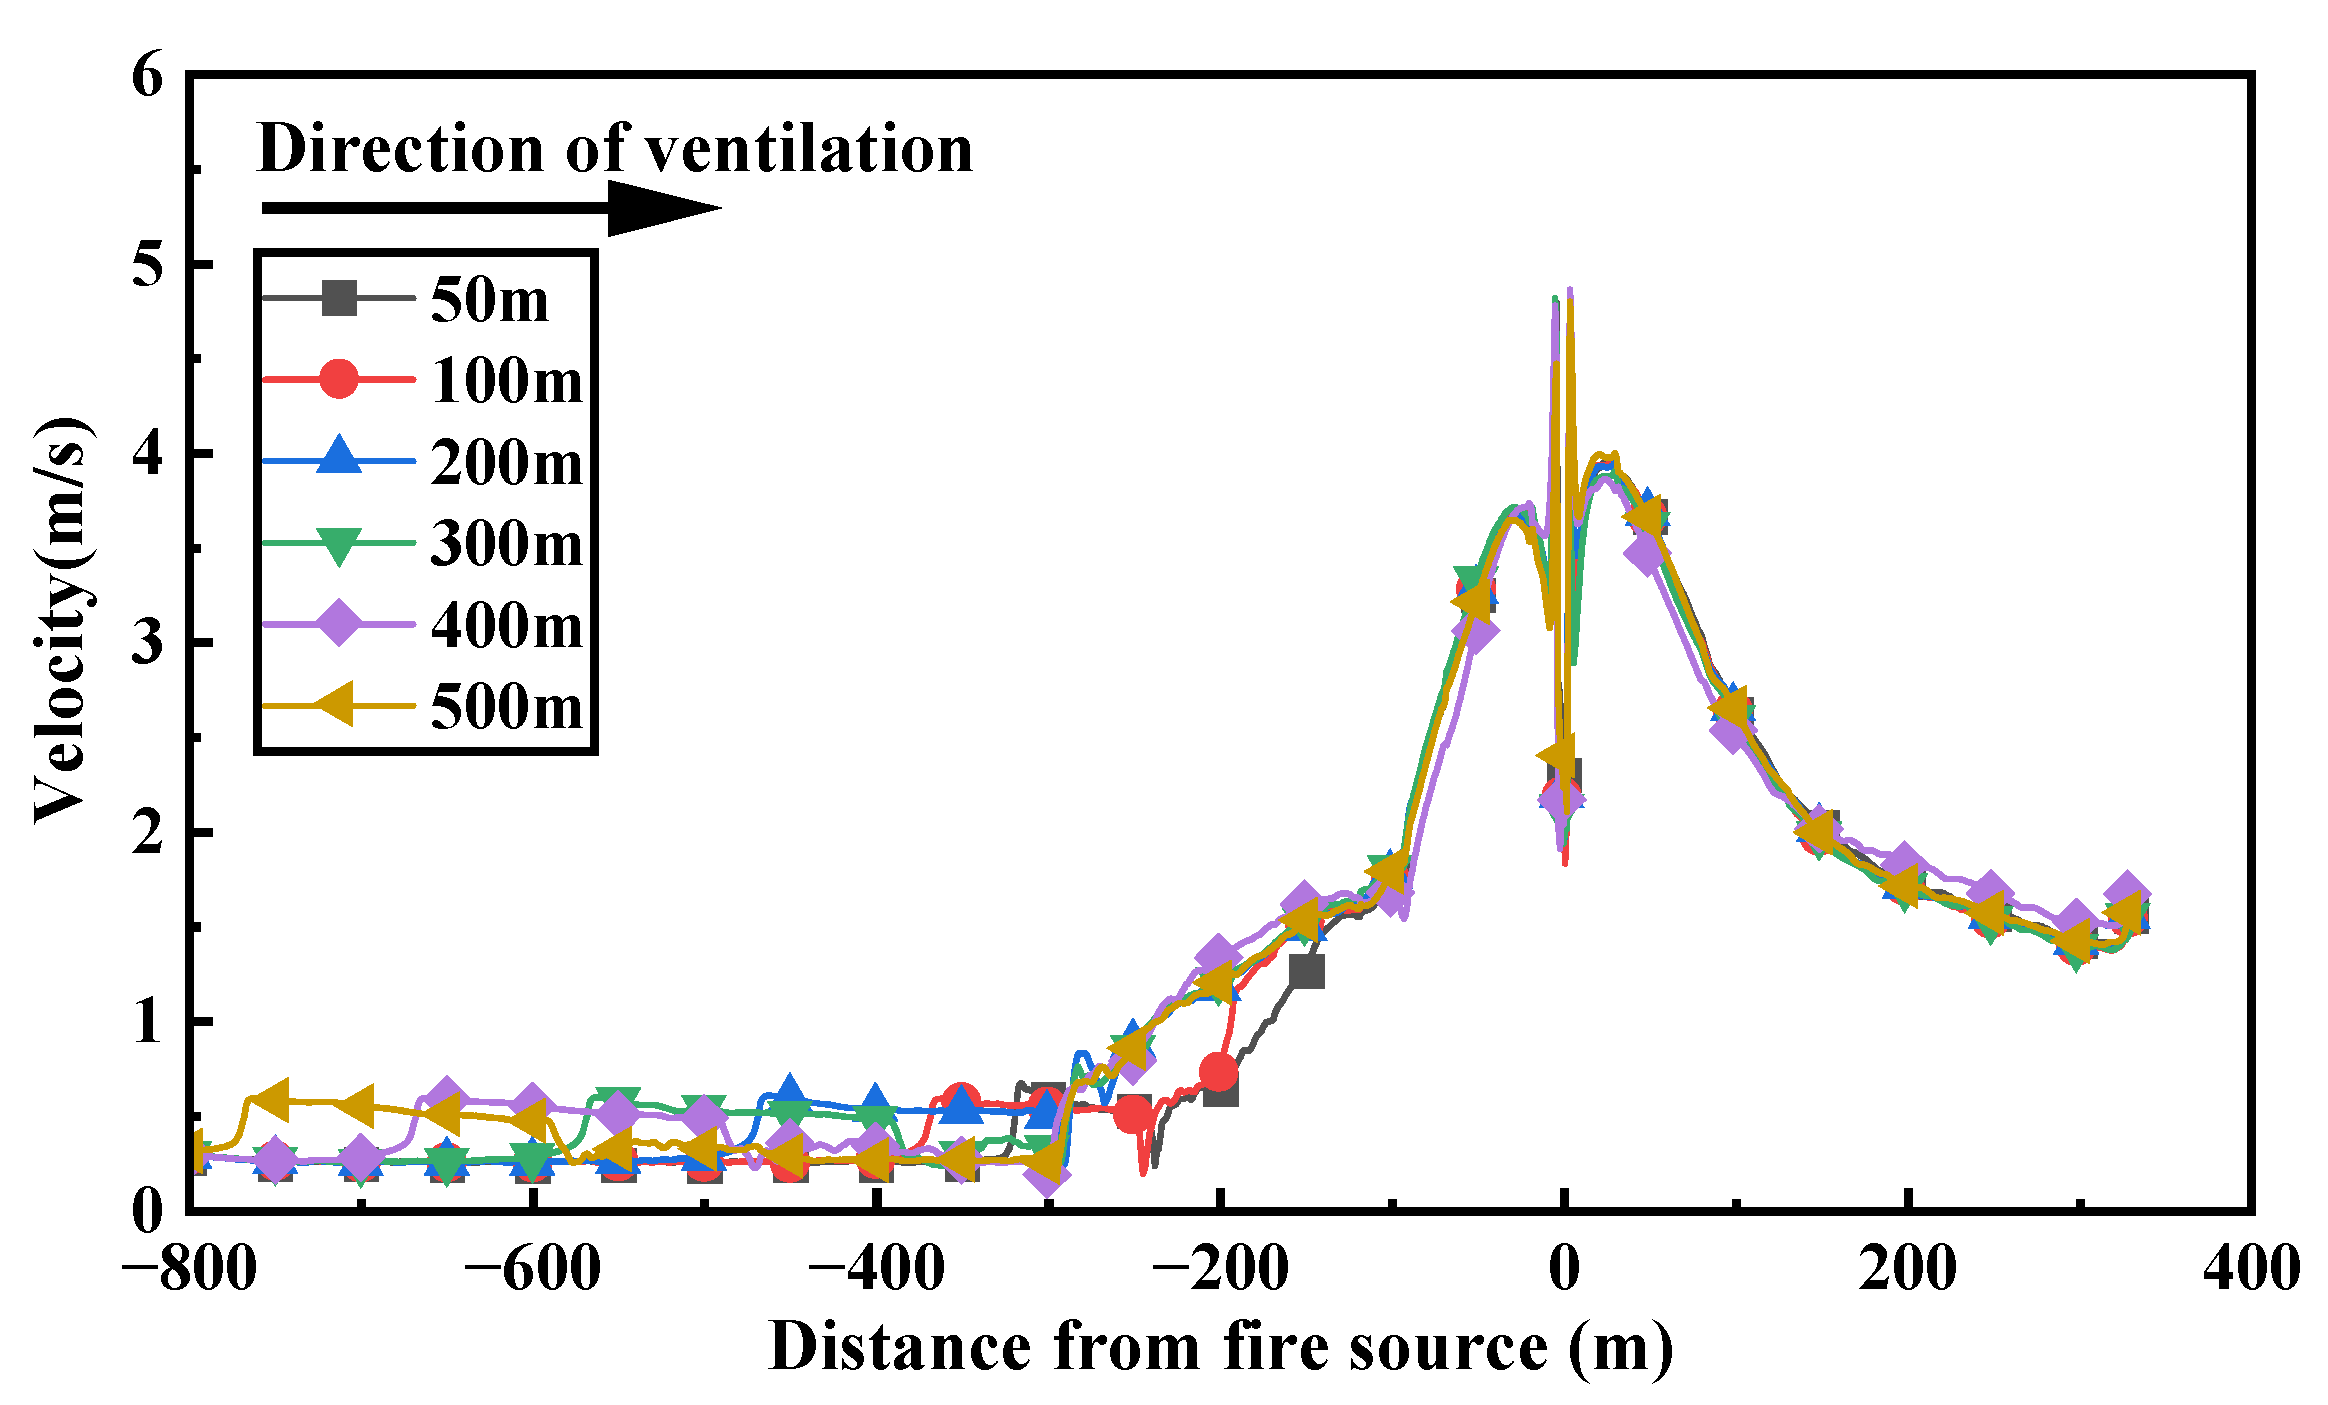
The flow velocity decreases most rapidly near the fire source. As the distance from the fire source increases, the cross-sectional area available for airflow expands, and the rate of decrease in smoke flow velocity gradually slows down, as shown in
Figure 6. Upstream of the fire source, when the longitudinal airflow passes through the carriage of Train No. 1, the flow velocity increases due to the sudden change in cross-sectional area, and a stable airflow is established between the two trains.
There are some differences in the flow velocity distribution patterns under different train spacings. Under spacings of 50 m and 100 m, the flow velocity variation trends are similar, with a faster decay due to the closer train spacing, compared to the relatively smaller changes observed within the fire train section. For spacings of 200 m to 500 m, the flow velocity trends are also similar, but the decay in the middle region between two trains is significantly greater than that within the fire train section, and the rate of flow velocity attenuation gradually slows down.
As shown in
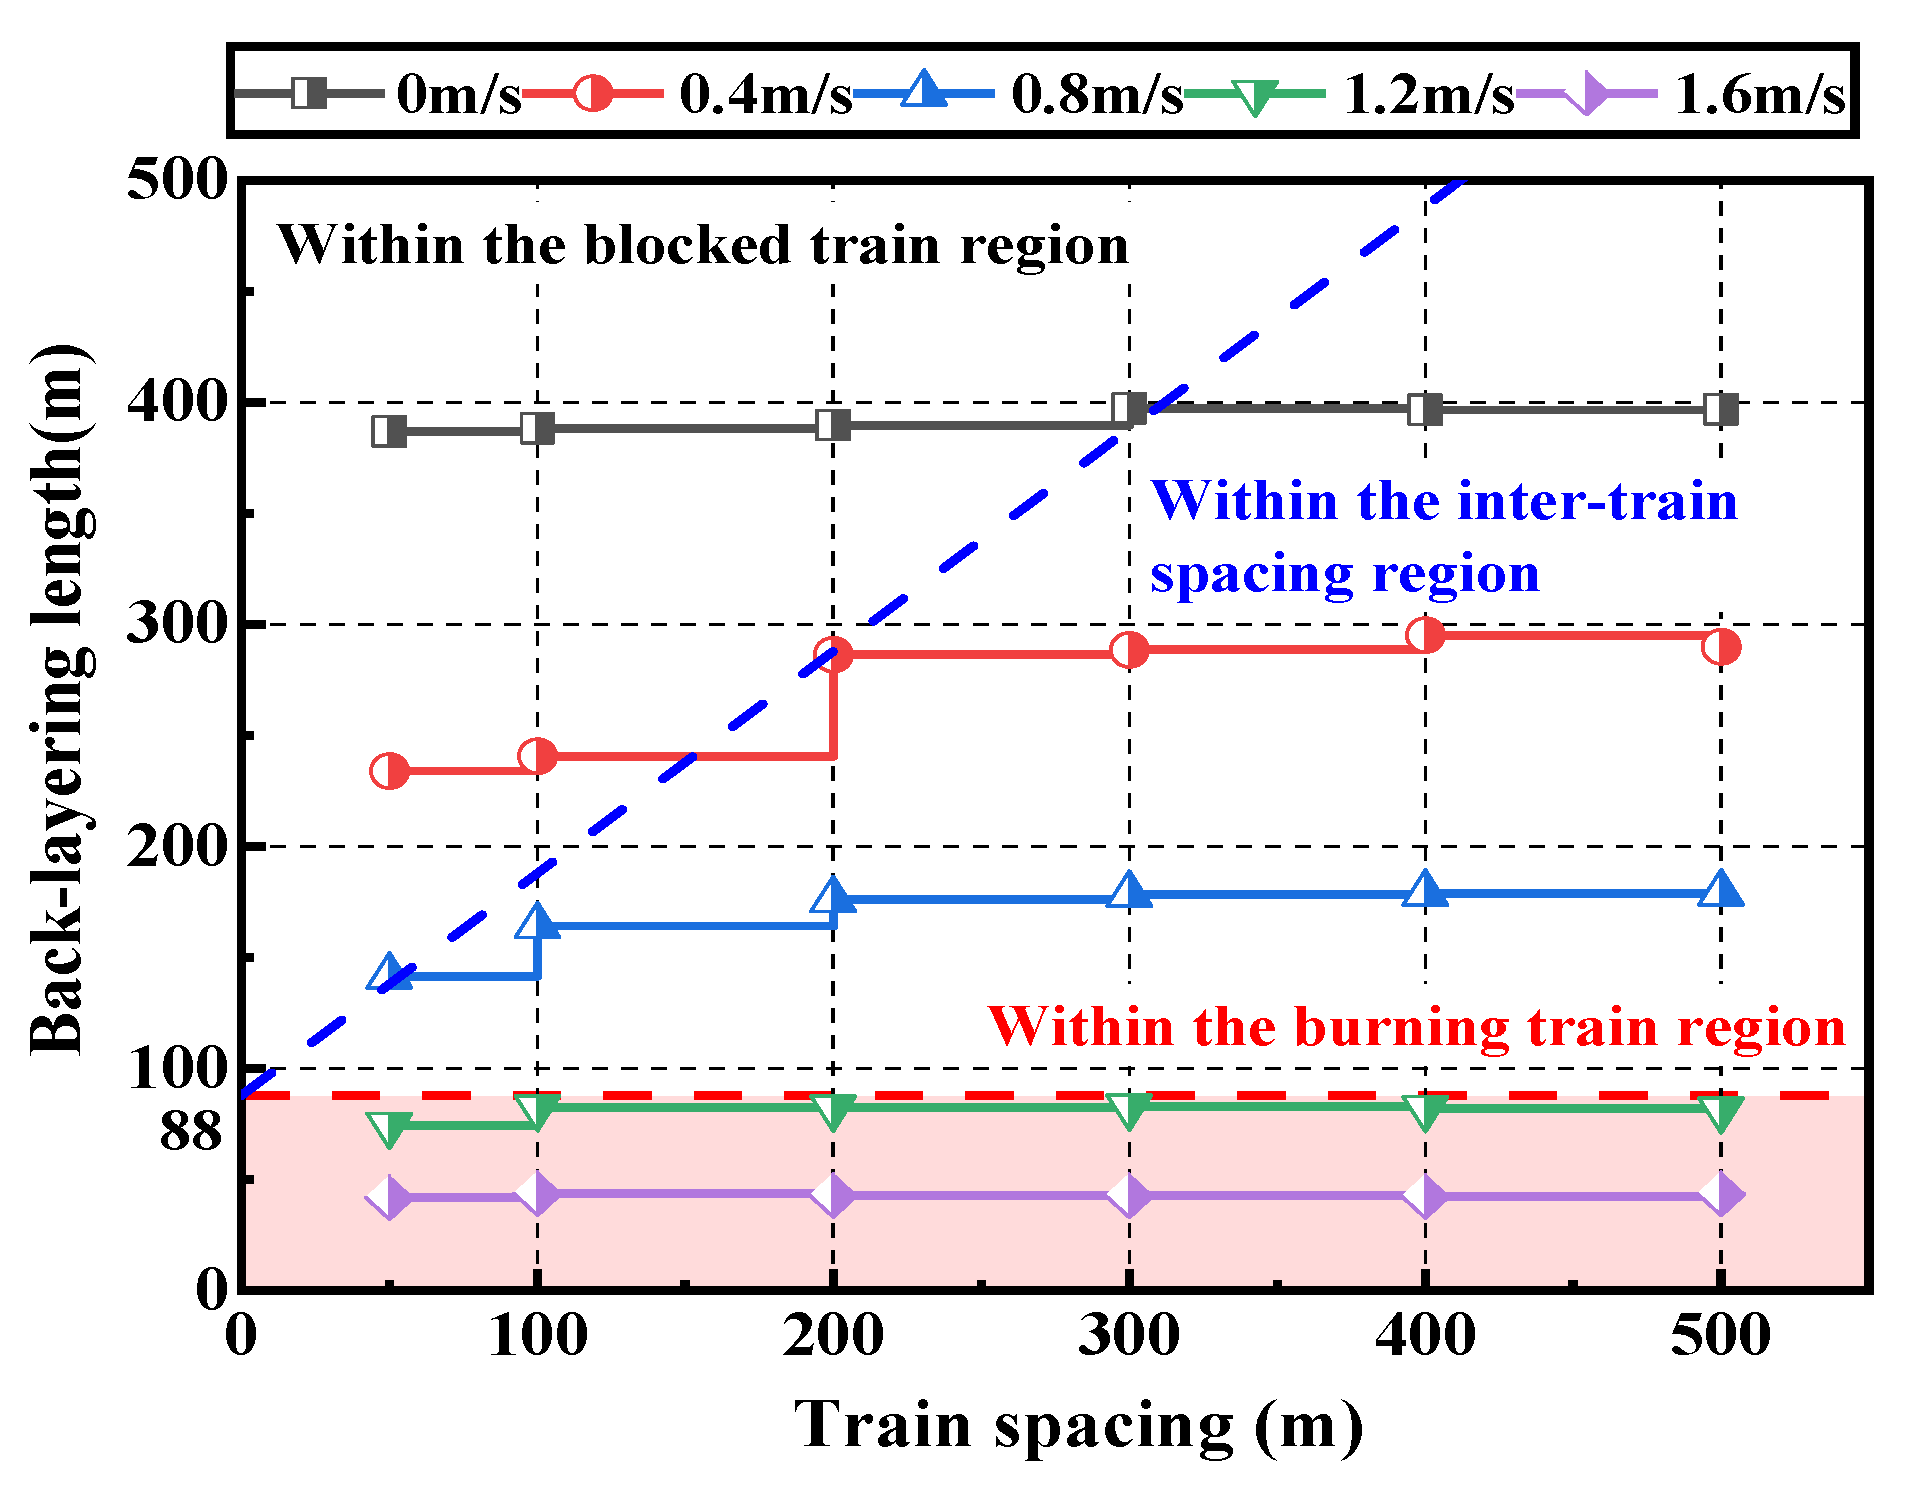
Figure 7, under natural ventilation conditions, the back-layering length was generally unaffected by train spacing. This could be attributed to the long tunnel length and the roof-level location of the fire. In the absence of external airflow, the smoke spread was not significantly influenced by the downstream blocked train.
When the longitudinal wind speed was 0.4 m/s or 0.8 m/s, the back-layering length increased noticeably as the train spacing increased from 50 m to 200 m. Beyond 200 m, it tended to stabilize. Under higher wind speeds of 1.2 m/s and 1.6 m/s, the back-layering length remained largely unaffected by train spacing, staying confined to the region above the burning train. This indicated that the influence of the blocked train on smoke spread became negligible at higher ventilation speeds.
For a fixed train spacing, the back-layering length decreased progressively with increasing longitudinal wind speed. Conversely, for a fixed wind speed, it first increased with train spacing and then plateaued, showing minimal variation once the spacing exceeded 200 m.
As illustrated in
Figure 7, when the longitudinal wind speed was greater than or equal to 1.2 m/s, the back-layering length remained within the area above the burning train, suggesting that the blocked train had little impact on the smoke spread. However, when the wind speed was lower than 1.2 m/s, the influence of train spacing became more pronounced. In these cases, shorter spacing (less than 200 m) corresponded to shorter back-layering lengths, but also increased the risk of hot smoke reaching the area above the blocked train. Therefore, to ensure the safety of the blocked train, a minimum spacing of more than 200 m is recommended.
3.2. Influence of Fire Source Location on Fire Smoke Spread Characteristics
In this study, fire source location A refers to the rear of the train, while location B corresponds to the middle of the train. Using fire source positions A and B as examples, this research examines the impact of fire source location on the characteristics of fire smoke spread. The variations in the temperature field, flow velocity distribution patterns, and changes in the smoke back-layering length within the tunnel are analyzed under a ventilation speed of 0.4 m/s.
Figure 8 showed the temperature distributions in the tunnel under a longitudinal wind speed of 0.4 m/s, with train spacings of 100 m, 300 m, and 500 m, comparing two fire source locations: A (rear of the train) and B (middle of the train). When the fire was located at position A, the maximum smoke temperature was approximately 100 °C higher than that at position B, indicating a higher fire hazard. As illustrated in the enlarged inset plots, the upstream and downstream temperature attenuation rates were slower for position A, and the back-layering length was significantly longer—by approximately 5–50 m compared to position B. Moreover, the impact of the fire source location became more evident as the train spacing increased. When the train spacing was less than 100 m, however, the influence of the fire source location on the overall temperature field was minimal and could be considered negligible. These results supported the conclusion that the fire source location became a critical factor only under larger train spacing scenarios.
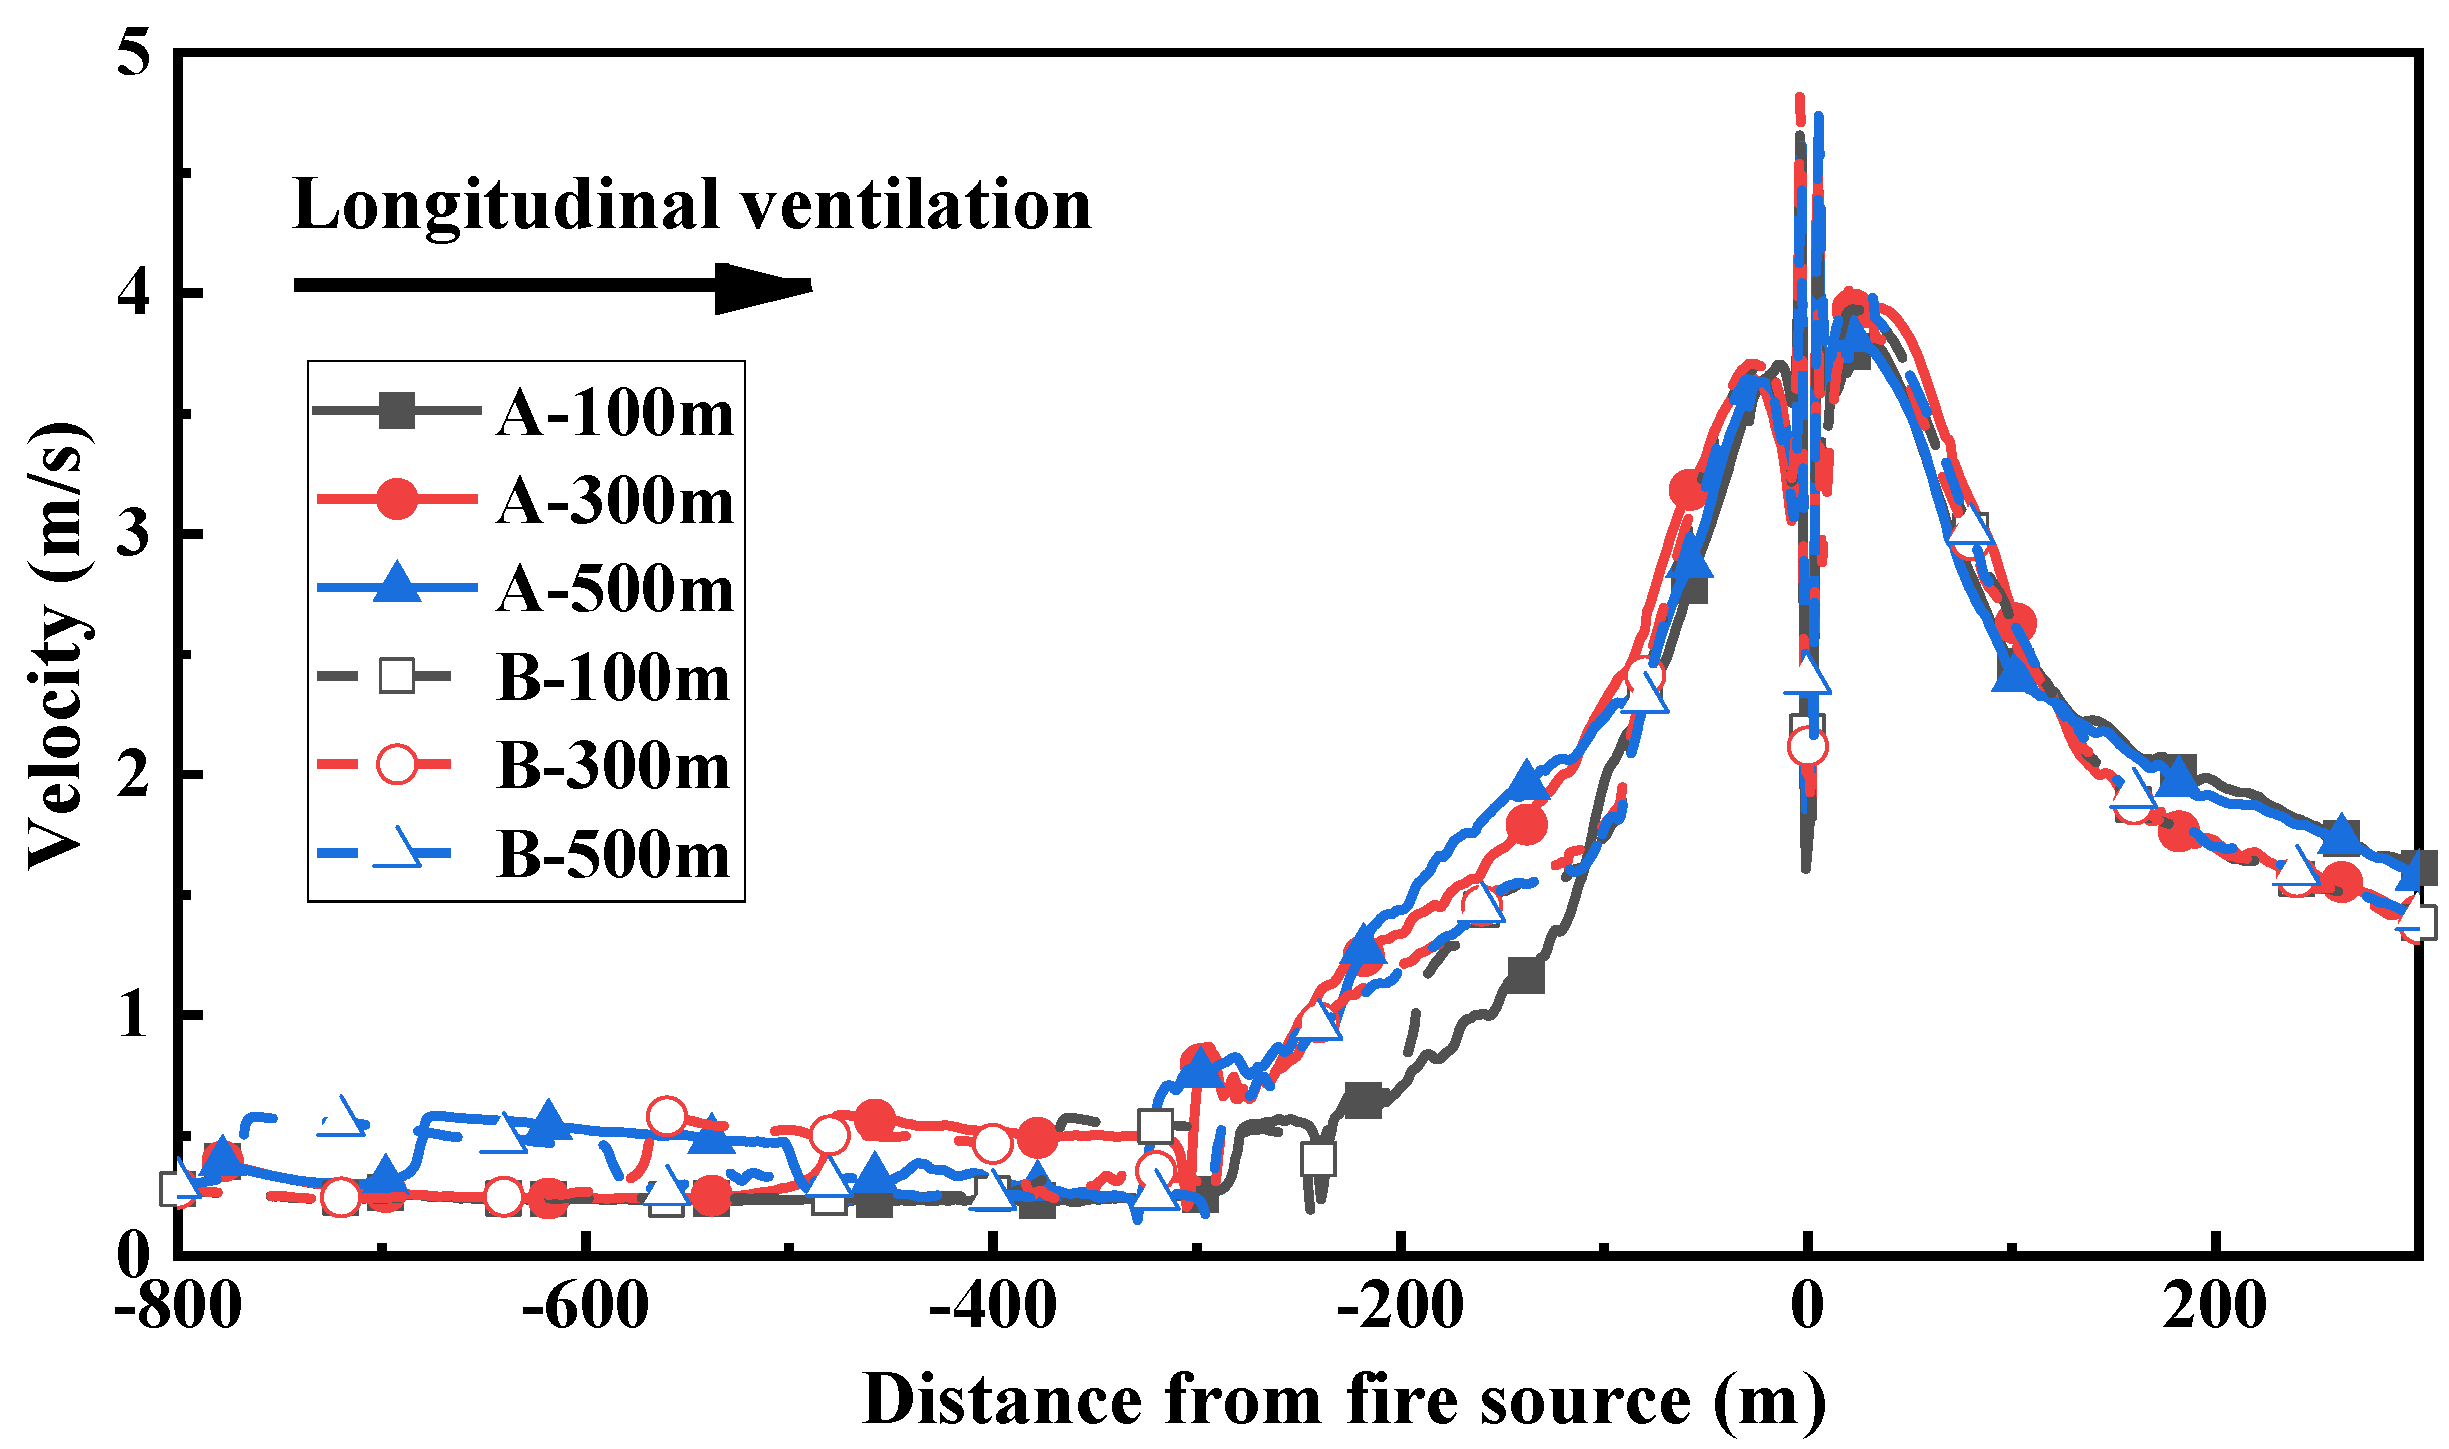
Figure 9 illustrates the distribution of the smoke velocity field in the tunnel vault for various fire source locations and train spacings of 100 m, 300 m, and 500 m. For a train spacing of 100 m, when the fire source is positioned at location A, the maximum flow velocity above the fire source is 4.66 m/s. A sharp increase in flow velocity is observed at 238 m and 288 m upstream of the fire source. At 288 m upstream, the flow velocity increases due to the reduction in tunnel cross-sectional area caused by the blockage from the vehicles. This results in a corresponding increase in flow velocity. Additionally, the smoke reflux length of 235.64 m, combined with the countercurrent flow opposing the ventilation speed, causes a sudden decrease in flow velocity. In the case of fire source location B, the maximum flow velocity reaches 4.67 m/s. Since the fire source is situated between the trains, the tunnel cross-section is constricted due to the obstruction caused by vehicles within 88 m upstream. The effect of increased ventilation speed on reducing the smoke countercurrent velocity is more pronounced. Furthermore, no obstruction occurs within the tunnel cross-section in the 100 m train spacing, and the smoke flow velocity between 97 m and 201 m upstream of the fire source shows a slower rate of attenuation.
At a train spacing of 300 m, the maximum flow velocity at fire source locations A and B is 4.5 m/s and 4.82 m/s, respectively. When the train spacing is increased to 500 m, the maximum flow velocity at fire source locations A and B becomes 4.62 m/s and 4.8 m/s, respectively. Notably, for both 300 m and 500 m train spacings, the flow velocity at fire source location B is lower than at fire source location A within the 300 m upstream distance. The flow velocity decay pattern within 120 m downstream of the fire source is similar for both fire source locations; however, beyond this point, the flow velocity at fire source location B decreases at a faster rate.
The statistics of back-layering length are shown in
Table 2, which are basically the same for different fire source positions without longitudinal ventilation. Compared with fire source position A, fire source position B has a relatively shorter back-layering length because the train obstruction and tunnel cross-section reduction have a greater effect on the increase in wind speed than the fire source’s driving force on the smoke.
As the wind speed increases to 1.6 m/s, the smoke return length for fire locations A and B shortens to 68.565 m and 42.570 m, respectively. Compared to fire location B, the smoke return length at fire location A is longer, indicating that the smoke return phenomenon is less influenced by ventilation constraints. As train spacing increases, the smoke return length at fire location A exhibits a greater change, reaching 115.085 m when the ventilation speed is 0.8 m/s. When the fire source is located at the front end of the vehicle, the effect of train spacing on smoke return becomes more pronounced.
3.3. Influence of Receding Spacing on Fire Smoke Propagation Characteristics
Taking fire source location A as an example, ventilation is applied in the reverse direction relative to the direction of travel. The distribution patterns of the temperature field, flow velocity field, and visibility in the tunnel are analyzed to investigate the impact of receding spacing on fire smoke propagation characteristics.
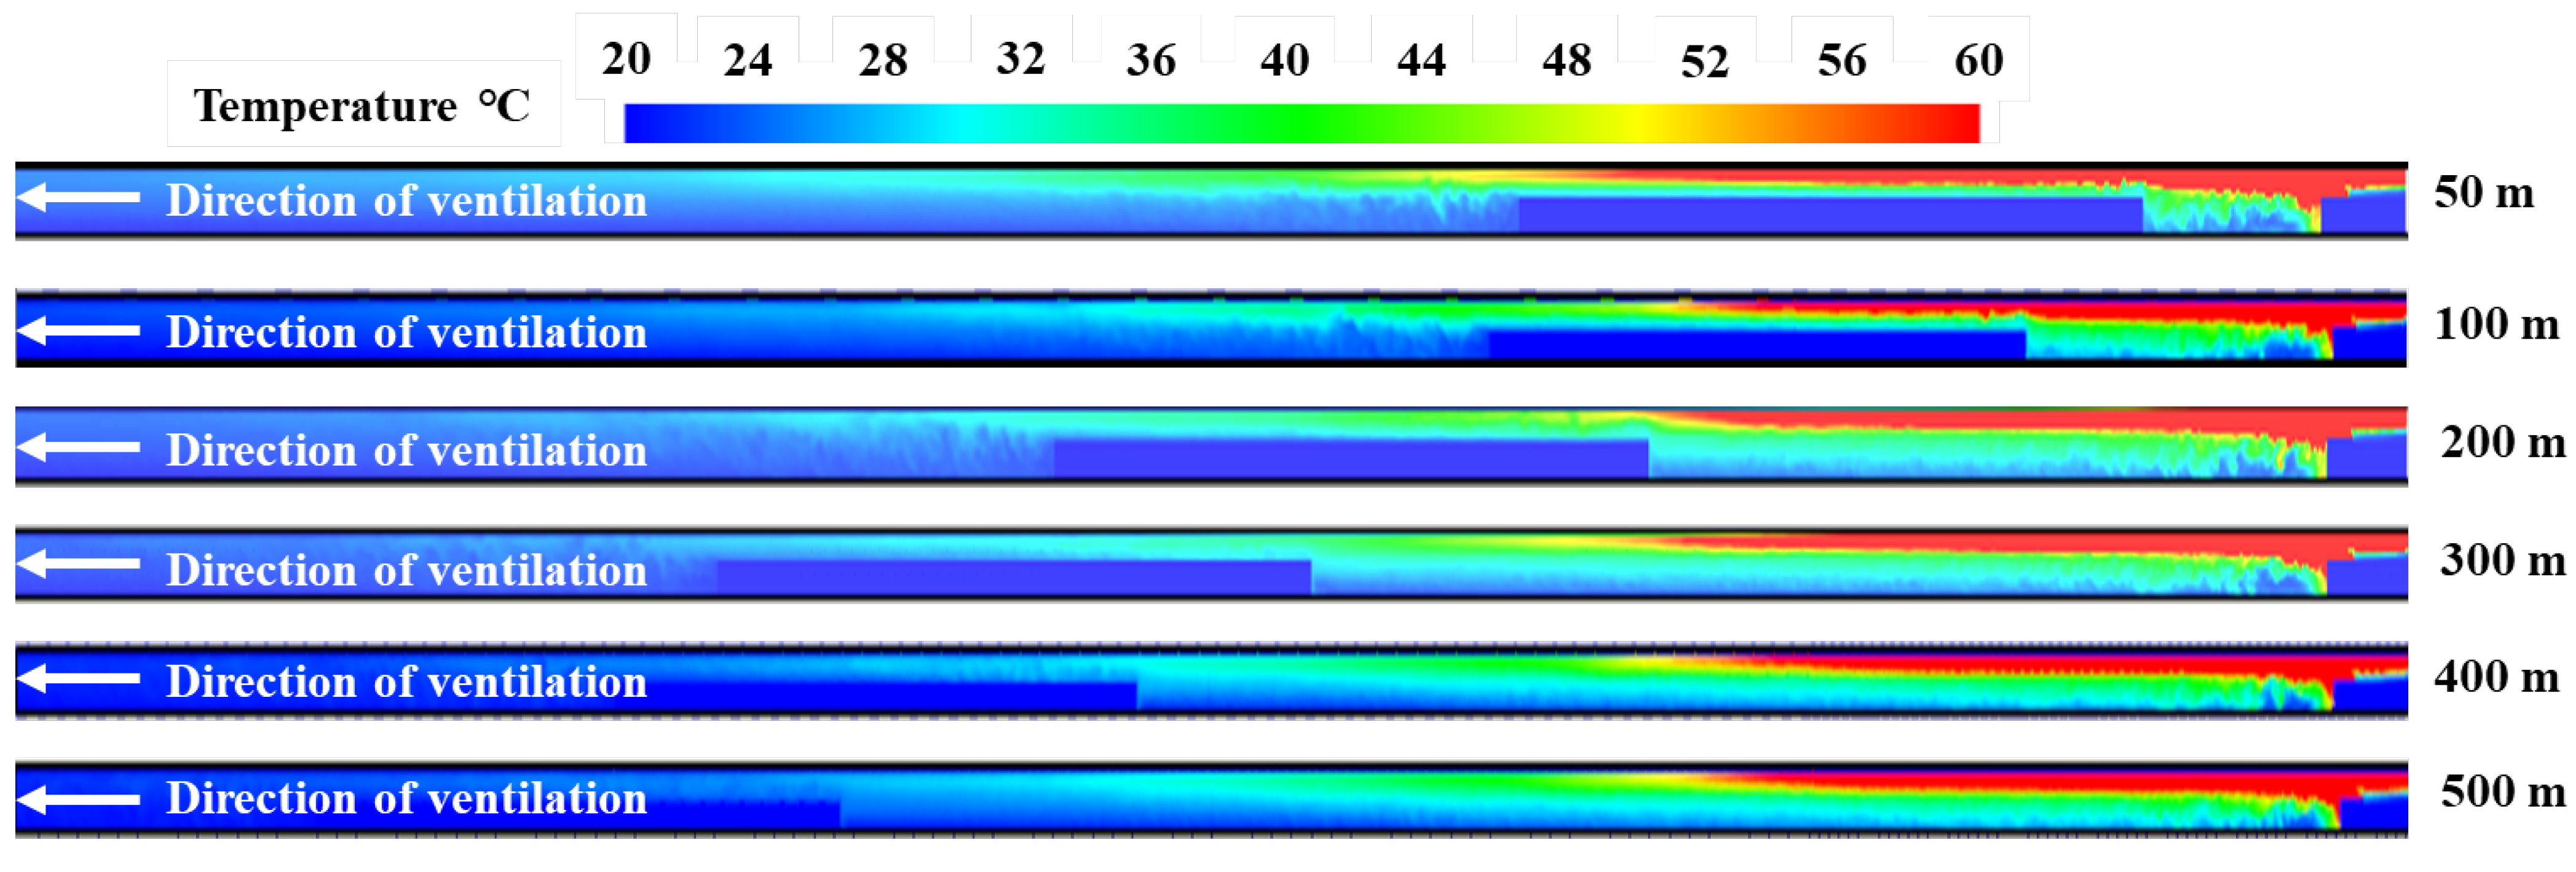
Under the influence of longitudinal ventilation, the flame and temperature fields are displaced downstream in the direction of airflow, as shown in
Figure 10. As the distance from the fire source increases, the temperature of the tunnel ceiling gradually decreases. When the receding distance reaches 50 m, the region where the tunnel ceiling temperature exceeds 60 °C is the largest, approximately 180 m downstream from the fire source. However, when the receding distance is greater than or equal to 100 m, the area with a temperature above 60 °C remains relatively stable. Due to the presence of the train’s wake flow, a low-temperature zone forms at the rear part of the burning train, which gradually diminishes as the retrogression distance of the train increases. Simultaneously, as the train spacing increases, the smoke layer between trains is more likely to be disturbed, with fresh air being entrained. The temperature stratification near the end of the receding train, downstream of the ventilation, becomes disturbed; however, this stratification gradually stabilizes after a certain distance. The extent of the disturbed temperature stratification downstream of the receding train increases with the increasing train spacing.
As shown in
Figure 11, when the train spacing was relatively small (100 m), low-temperature regions were observed near the fire-origin train and at the ground–wall corner. As the high-temperature smoke reached the blocked train, a noticeable detour flow path developed. In contrast, when the train spacing was 300 m, the influence of the blocked train on smoke propagation was significantly reduced. By the time the smoke reached the blocked train, its temperature had decreased considerably, with smoke temperatures falling below 60 °C, the smoke layer had largely stabilized, and the thickness of the smoke layer above the blocked train became thinner. These differences in smoke behavior suggest that larger train spacing can reduce thermal hazards near the blocked train, thereby providing more favorable conditions for safe passenger evacuation.
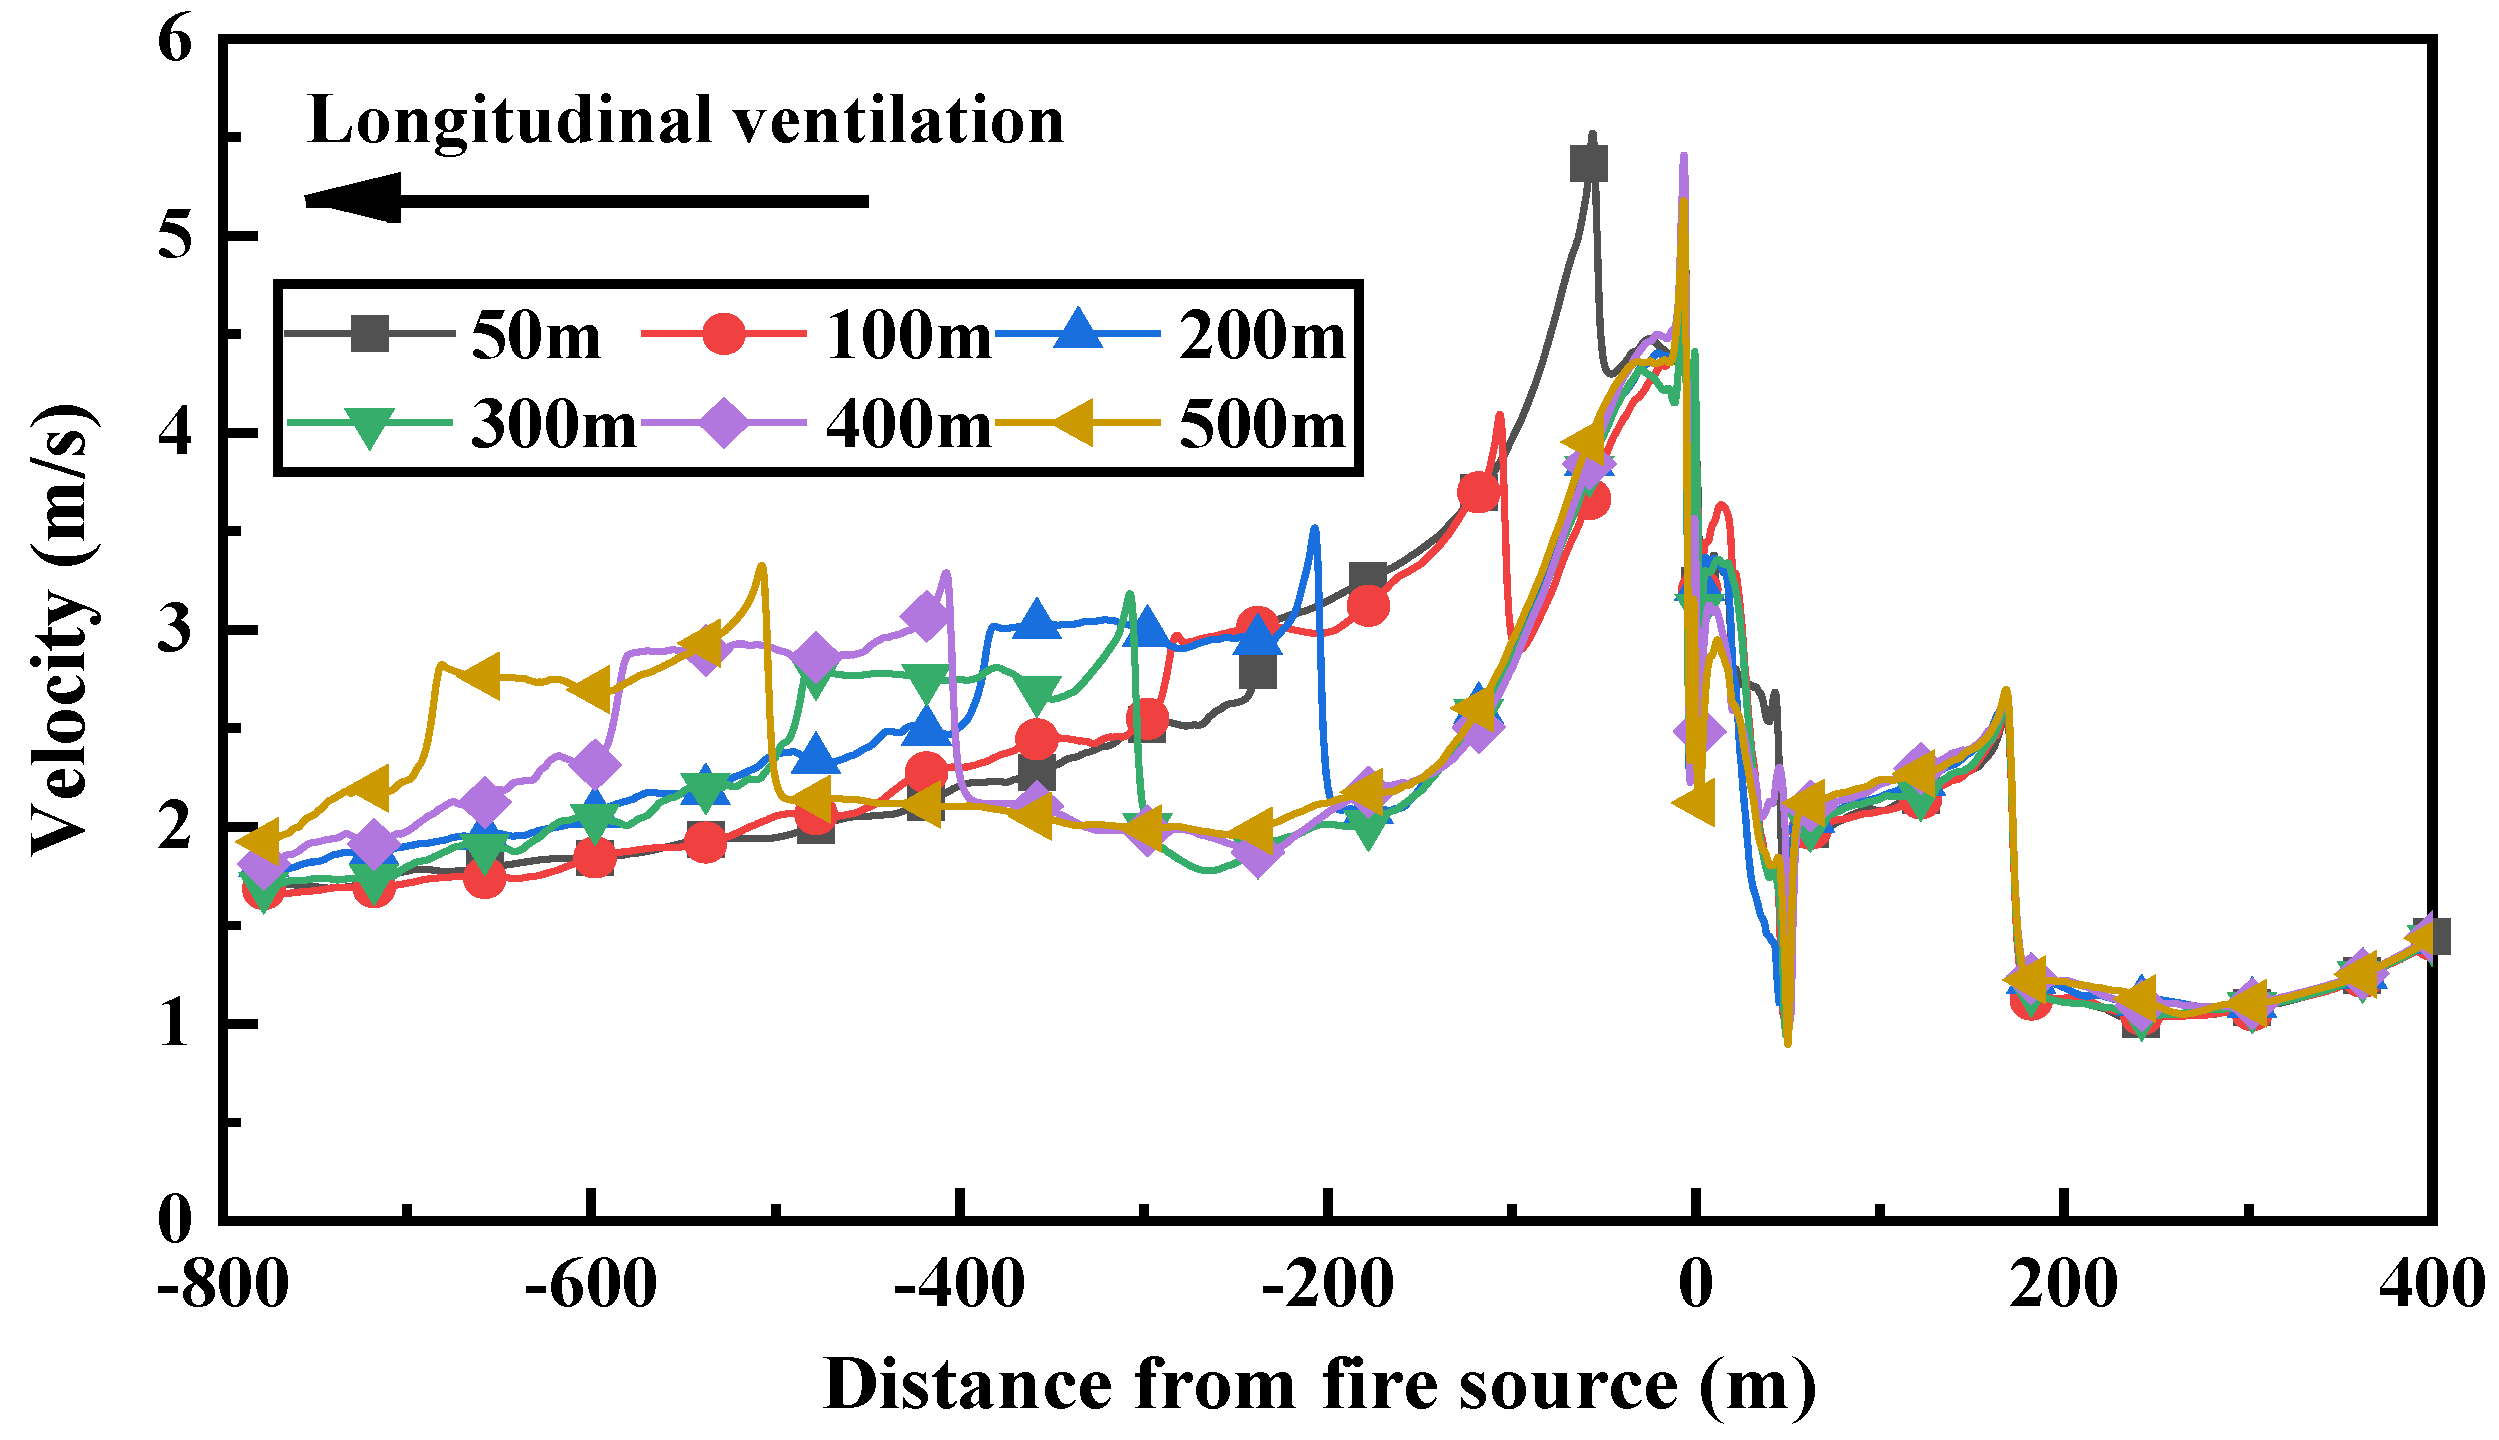
The distribution of the smoke flow velocity field at the tunnel vault upstream of the burning carriage is similar for different backward spacings, as shown in
Figure 12. As the smoke spreads to the receding carriages, the vehicle obstruction causes a sudden increase in smoke flow velocity at the tunnel vault, followed by a gradual decrease. The peak velocity reaches approximately 5.5 m/s (4 m/s, 3.5 m/s) when the receding distance is 50 m (100 m, 200 m), and around 3.3 m/s when the receding distance is between 300 m and 500 m. When the receding distance is 50 m, the smoke flow velocity above the receding carriage decreases gradually. For receding distances of 100–200 m, the decay pattern of flow velocity is similar, with the smoke flow velocity above the receding carriage initially decreasing and then stabilizing. When the receding distance is 300–500 m, the influence of the vehicle on the tunnel flow field tends to stabilize.
As shown in
Figure 13, when the receding distance is 50 m, the smoke stratification in the tunnel is well-defined, and the visibility in the lower half of the tunnel is approximately 30 m. When the receding distance reaches 100 m, the visibility of 30 m in the lower part of the tunnel decreases to around 79 m. Subsequently, about 80 m of smoke settles on the tunnel floor, after which the smoke stratification is re-established. When the receding spacing reaches 200 m, the visibility 30 m downstream of the receding vehicle further decreases to about 12 m. For receding distances greater than 300 m, there is almost no region downstream of the receding vehicle with visibility exceeding 30 m, with visibility remaining between 6 m and 15 m. The smoke stratification between the two trains remains stable, with visibility around 30 m in most areas.
