Article

Lateral Impact of Travelling Fires on Structural Elements in Large Compartments: Insights from Test 1

Belfast School of Architecture and the Built Environment, Ulster University, FireSERT Building, Shore Rd, Belfast BT37 0QB, UK
*
Author to whom correspondence should be addressed.
Fire 2025, 8(7), 244; https://doi.org/10.3390/fire8070244
Submission received: 16 April 2025 / Revised: 30 May 2025 / Accepted: 19 June 2025 / Published: 24 June 2025

Abstract

The expansion of unobstructed floor plans has resulted in large open areas, especially in modern designs. Although these new designs are appealing and esthetically attractive, they remain at a risk of large fires which may initiate at certain location(s) and make their way along to the other parts of the compartment. Such fires are called travelling fires and are not currently covered by the design codes due to lack of available research and understanding. Unlike traditional compartment fires, travelling fires may last longer and may result in compromising the structural integrity due to prolonged fire exposure. This article studies the impact of travelling fires on structures with focus on the structural elements, oriented perpendicular to the direction of fire travel. The data presented comes from Test 1, conducted by the authors as part of the TRAFIR project at Ulster University. The details provided include the recorded gas temperatures within the compartment and the temperatures recorded in the surrounding structural elements, along gridlines ② and ③. The test compartment consisted of a steel structure with a hollow core concrete roof. The structural steelwork was supplied with additional dummy columns for data acquisition purposes. The study demonstrates that structural elements located within the fuel bed are subjected to significantly higher temperatures. The gas temperature differences within and outside the fuel bed on occasions exceed 450 °C across compartment width, while the same for columns and beams were up to 350 °C and 200 °C, respectively. Such transient heating of the structure could possibly induce the load distribution within the structure and may help achieve improved global fire resistance. The findings from this study will improve our understanding of travelling fires, their impact on structures, and will open directions to study the collapse mechanisms of structures under the influence of travelling fires and will help with devising design guidance for structures exposed to travelling fires.

1. Introduction

With the evolution of architectural plan, the demand for large open spaces has been on the rise. These changes to building layouts and designs create a challenge with regard to their structural design for fire resistance. In modern building layouts, traditional fire design approaches and assumptions of a post-flashover fire with uniform and homogeneous temperatures throughout the compartment, do not stand true, as the traditional concepts are suited to smaller compartments. Accidental fires in large compartments have revealed the phenomenon of travelling fires, where the fire initiates at a point(s) and travels to the other parts within the compartment. These fires last for longer durations and may compromise structural strength and stability. Unlike the assumption of uniform temperatures in small compartments, the temperatures observed during accidental large compartment travelling fires have neither been uniform nor homogeneous [1,2,3]. Travelling fires are a localized heat source which moves non-uniformly across large compartments, resulting in varying thermal exposure. Similar observations have been made in cases of accidental car park fires across the world, as summarized in [4].
Current fire testing methods for structural elements mostly rely on standard time–temperature curves and assume uniform exposure conditions throughout the compartment. Similarly, other fire exposure conditions including the hydrocarbon fire curves and the compartment fires curves given in the Eurocode 1–2 [5] also consider uniform temperatures. Although some fire models, including the localized fire model and the advanced fire models of the Eurocode 1–2 [5], take into account non-uniform temperatures, these types are different to travelling fires. The assumption of uniform temperatures within a compartment has been questioned, leading to the execution of large-scale compartment tests to investigate fire behaviour and its effects on the surrounding structural elements. Experimental investigations on fires involving large compartments include the tests conducted by Kirby et al. [6] (compartment fire tests with non-continuous fuel and multiple ignition sources), Hidalgo et al. [7] (compartment fire tests with multiple fuel sources and multiple gas burners (12) to promote fire growth), and Wald et al. [8] and Horova et al. [9] (travelling fire tests with linear ignition source to ensure fire spread. Compartment details available in [8] and fire test details in [9]). Although these previous tests provide valuable information and data on large compartment fires, they do not fully cover all aspects of travelling fires. Furthermore, many previously conducted fire tests have promoted the development and progression of fire using external interventions including flammable materials along the fire’s fuel path or utilizing multiple ignition sources in a sequence. However, this approach does not accurately reflect a real travelling fire scenario, where fire behaviour tends to be less predictable and does not follow such controlled patterns. Although some theoretical efforts are also available [10,11], additional research is needed to develop a thorough understanding of travelling fires and their impact on the surrounding structure.
To understand travelling fires and their impact on the surrounding structure, large compartment fire tests were conducted at Ulster University by the authors. The aim of the experimental investigation was to develop a comprehensive understanding of travelling fires, focusing on how these fires behave and affect the surrounding structures, both parallel and perpendicular to the direction of fire spread. Unlike the previous tests, no external interventions were used to promote fire development, growth, and travel during TRAFIR Tests. While previous studies primarily focused on natural fire behaviour and were not specifically tailored to travelling fire phenomenon, TRAFIR tests were explicitly designed to investigate travelling fires in a controlled and systematic manner. Moreover, prior theoretical and computational studies lacked supporting experimental evidence. This testing programme was therefore intended to serve as a foundational experimental basis for validating and advancing such models. Considering the scope of this article, particular focus has been given to details related to the effects of travelling fires across the compartment’s width, perpendicular to the direction of fire travel. The details presented include the gas temperatures within the compartment and the temperatures recorded in beams and columns along gridline ② and ③ (see Figure 1). The results are crucial for advancing computational studies on structural response to travelling fires, ultimately strengthening future design codes.

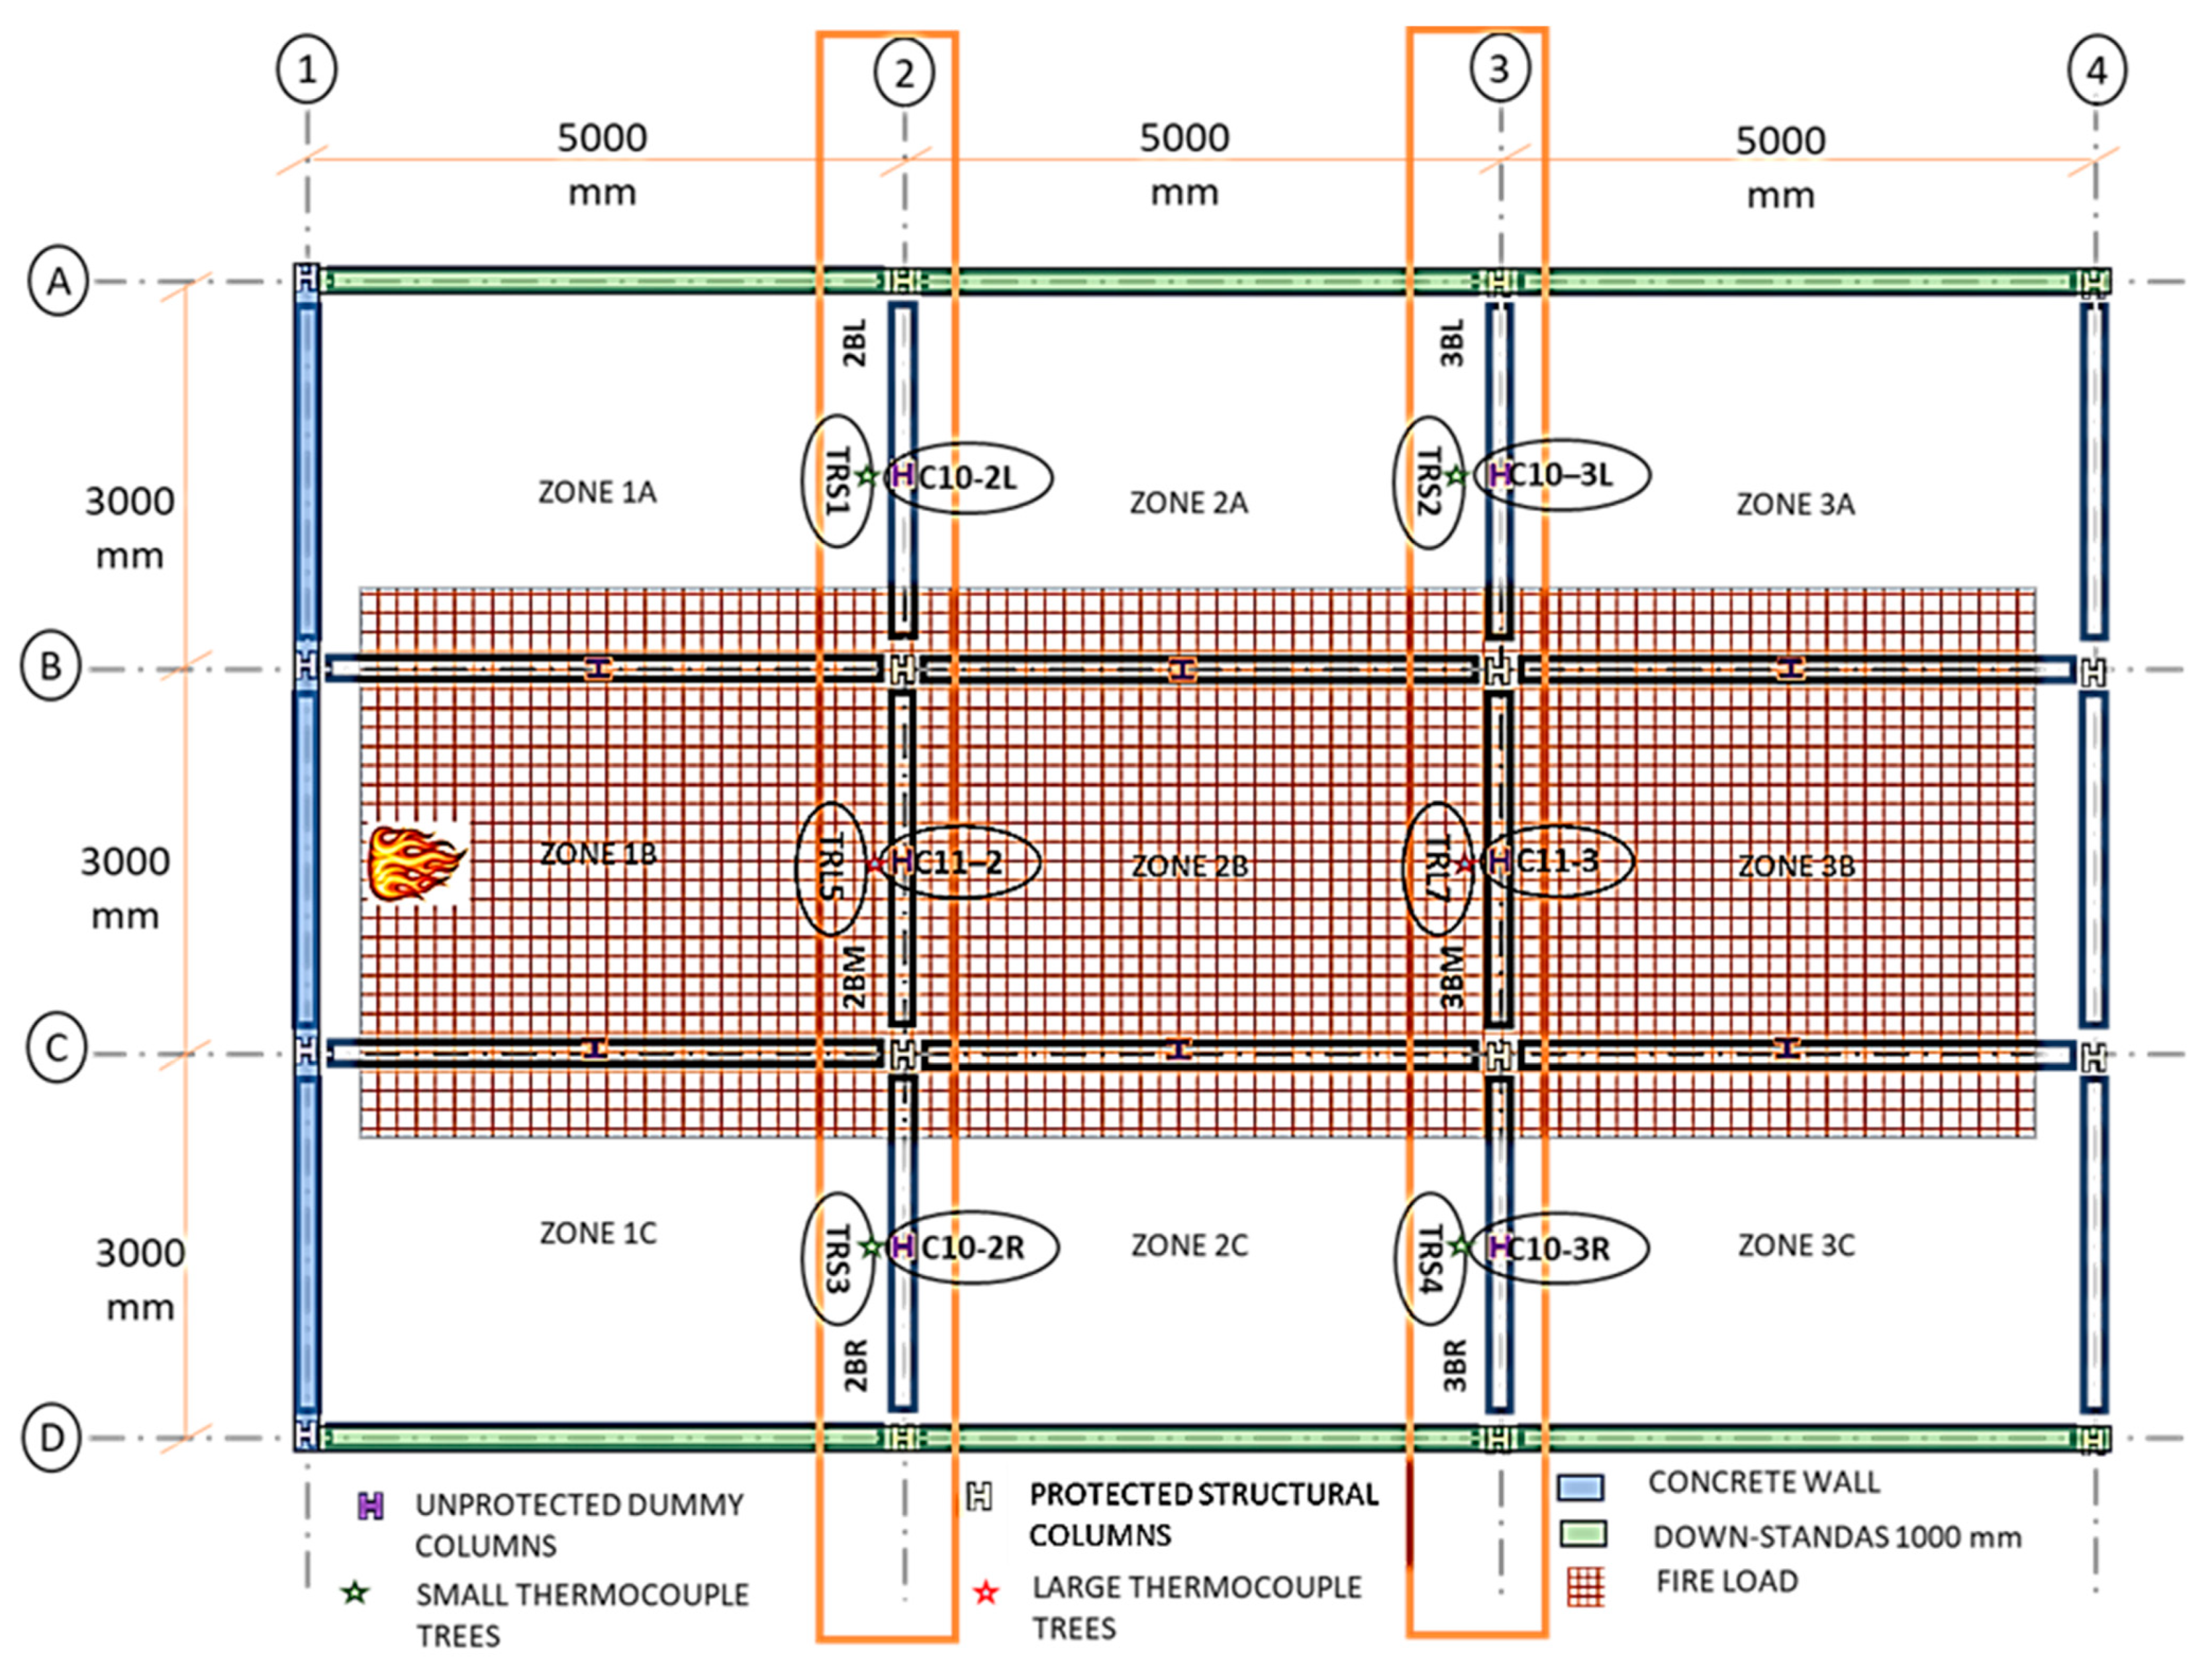
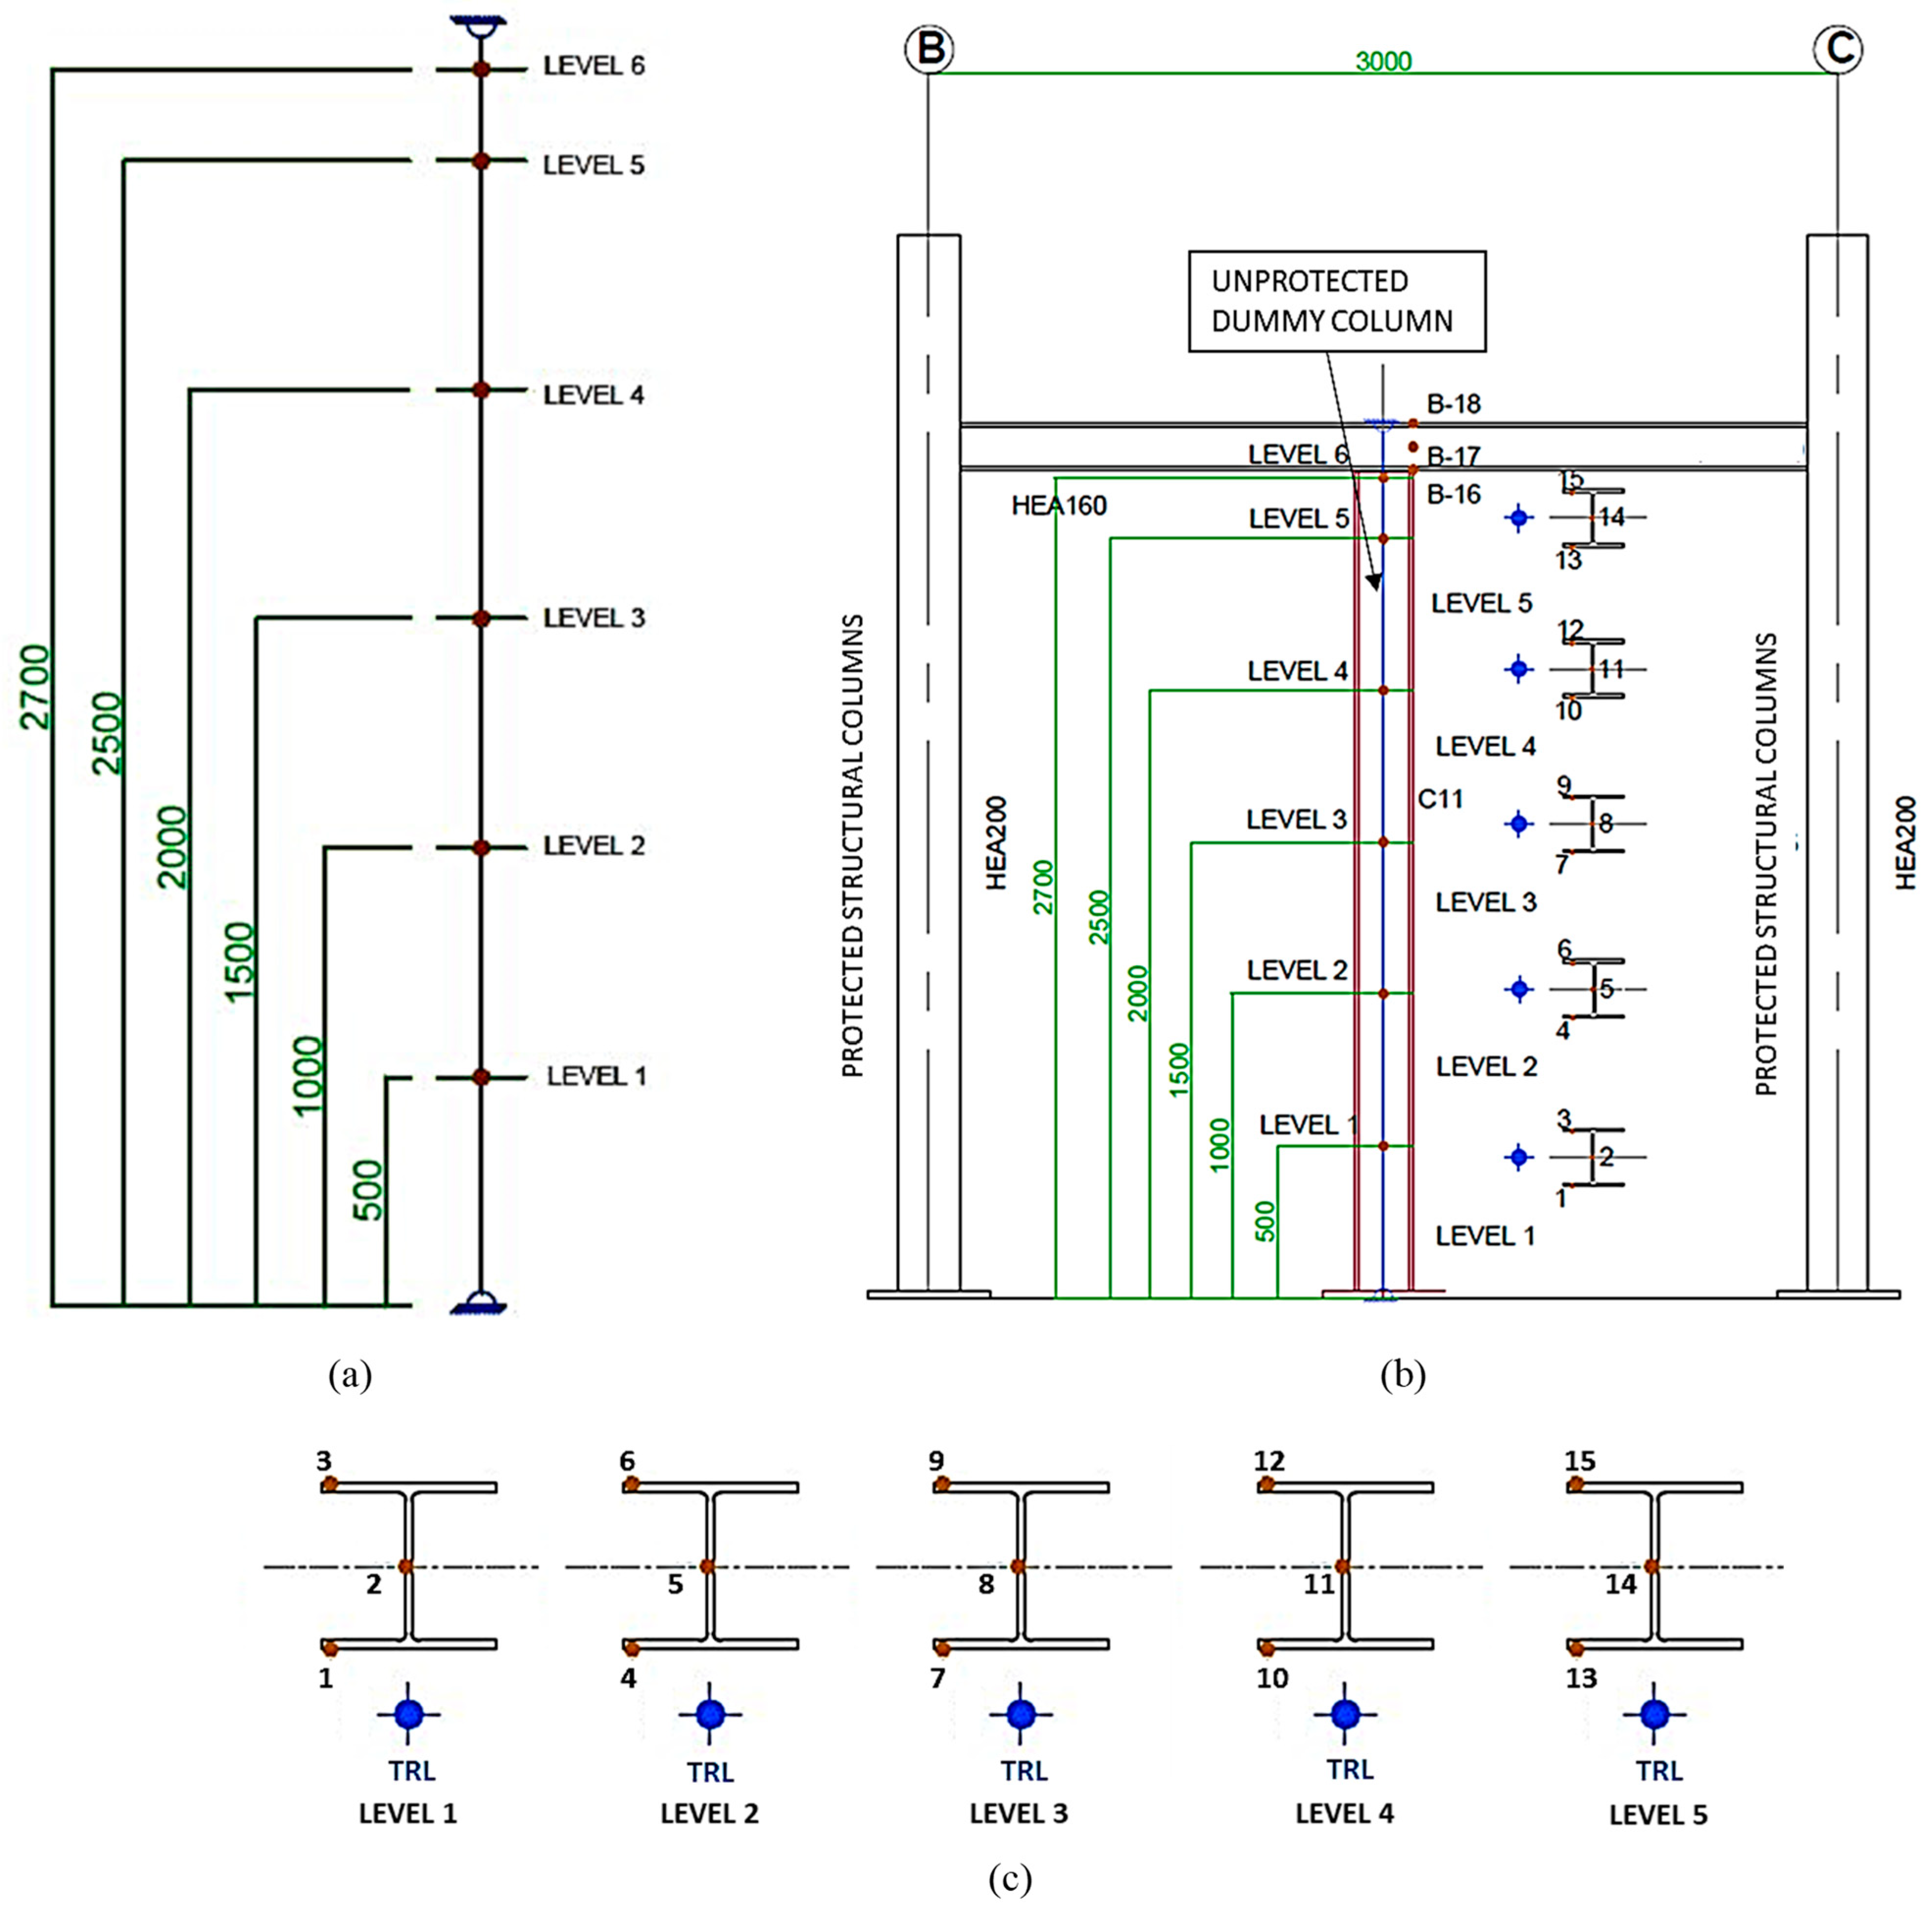
2. The Travelling Fire Tests—Test 1 Details

As part of the TRAFIR project, three large-scale compartment travelling fire tests were conducted by the authors under varying boundary conditions, as summarized in Table 1. The findings discussed here pertain to Test 1, which featured the largest opening size among the three tests. It must be noted that the opening factor in Table 1 was calculated using the method from Eurocodes, EN 1991-1-2 [5]. The conditions and compartment configuration for Test 1 represent a section of a large, open-plan office building.
The test compartment was 15.2 m long (15.0 m between the exterior gridlines ④ and ①) and 9.2 m wide (9.0 m between the exterior gridlines Ⓐ and Ⓓ), while the ceiling height was 2.9 m. The structure consisted of a steel frame with hollow-core precast concrete slabs. In addition to the protected structural columns, dummy (non-structural and unprotected) columns were also added for data acquisition purposes. Both the structural and dummy columns used in the test were hot-rolled HEA200 steel sections. In the case of Test 1, a solid concrete wall was constructed only along gridline ①, the east-facing elevation, while the elevation along gridline ④, the west-facing elevation, was clear with no construction (see Figure 1). In the case of the longer direction of the compartment, 1.0 m down-stands, consisting of 12.5 mm thick plasterboards, were provided along both gridlines Ⓐ and Ⓓ, south-facing elevation and north-facing elevation, respectively. Further details related to the test structure are given in the earlier publications by the authors [12,13].
The test compartment was representative of an office building, for which the Eurocodes (EN 1991-1-2 [5]) recommend a medium fire growth rate (tα = 300 s) with a fire load density of 511 MJ/m2. The design and arrangements for the fuel load were based on the findings from the study by Gamba et al. [14], with further details provided in [12,13]. The fuel bed was 14.0 m long and 4.2 m wide and was positioned along the central part of the test compartment as shown in Figure 1.
Keeping in view the scope of the work presented in this article, only instrumentation details related to the temperatures in the compartment have been provided. The thermocouples used were all type K-310 with a bead size measuring 1.5 mm. The gas temperatures in the compartment were monitored and recorded using thermocouple trees as well as individual thermocouples. The instrumentation arrangements were more intense along the central part of the compartment within the fuel wood area (Zone B), while instrumentation arrangements outside the fuel bed (in Zone A and Zone C) were less intense. For convenience, different zones of the compartment have been identified and labelled in Figure 1, below.
With the focus of this article being on the influence of travelling fires across the width of the compartment and perpendicular to their direction of travel, temperatures recorded in the beams and dummy columns along gridlines ② and ③ have been presented and analyzed (see Figure 1). Furthermore, the gas temperatures recorded in the compartment adjacent to the selected beams and columns have also been analyzed and presented in the article. The beams and columns addressed in this article are identified and highlighted in Figure 1. For the convenience of readers, the IDs assigned to structural elements, thermocouple trees, and individual thermocouples have been kept consistent with IDs used during the experimental campaign and in other research contributions related to TRAFIR project tests.
It is seen in Figure 1 that three unprotected dummy columns exist along each gridline. Column C11-2 along gridline ② is within the fuel bed, while columns C10-2L and C10-2R are outside the fuel bed. In the case of gridline ③, column C11-3 is in the centre within the fuel bed, while columns C10-3L and C10-3R are outside the fuel bed. Like the columns, three beams exist along both gridline ② and gridline ③. Beam 2BM is immediately above the fuel bed along gridline ②, while beams 2BR and 2BL are outside the fuel bed. In the case of gridline ③, beam 3BM is within the fuel bed, while the remaining two beams, 3BR and 3BL, are outside the fuel bed, as shown in Figure 1.
As stated before, the data acquisition arrangements were more intense along the central part (Zone B) of the compartment, within the fuel bed. The central column, C11-2, along gridline ② was provided with 15 thermocouples at 5 different levels. Three thermocouples were provided at each level with one each in the flanges and one in the web. A similar data acquisition arrangement was made for the central column, C11-3, along gridline ③. Further details of the thermocouple positioning in the central columns (C11-2 and C11-3) are shown in Figure 2b,c. Arrangements for monitoring the gas temperatures were also more intense near the central columns. Thermocouples trees, TRL5 and TRL7, were provided adjacent to columns C11-2 and C11-3, respectively. Both these thermocouple trees had 6 thermocouples with the 1 at Level 1 being 500 mm from the floor finish level, while the next 4 thermocouples were provided at 500 mm intervals. The last thermocouple at Level 6 was provided at 2700 mm from floor finish level, as shown in Figure 2a.
Instrumentation in the dummy columns outside the fuel bed (columns C10-2R, C10-2L, C10-3R and C10-3L) was relatively less intense, as temperatures were recorded only at 3 levels (Level 2, Level 4 and Level 5). Level 2 was at 1000 mm, while Level 4 and Level 5 were at 2000 mm and 2500 mm, respectively, from the floor finish level, as shown in Figure 3b. Like the centrally located columns, three thermocouples were provided at each level in these columns (see Figure 3c). Furthermore, the thermocouple trees adjacent to the columns outside the fuel bed along gridline ② were labelled as TRS1 and TRS3, while those along gridline ③ were labelled as TRS2 and TRS4. All 4 thermocouple trees outside the fuel bed were equipped with 3 thermocouples, 1 each at Level 2, Level 4, and Level 5, as presented in Figure 3a. In case of beams, 3 thermocouples were used to monitor the temperatures near their centre, as shown in Figure 3d. All the thermocouple trees adjacent to columns were within 6 cm of the columns. Further details related to instrumentation are available in [12,13].

3. Results and Discussion

3.1. Fire Development and Travel

Unlike many previous investigations on large compartment fires, a single source of ignition was used during Test 1 (and during the other two fire tests conducted in the TRAFIR project). A steel tray (approx. 30 cm long, 20 cm wide, and 8 cm deep), filled with 1.5 L of ethanol, was placed above the third layer of wood and at 0.5 m from the edge of the fuel wood adjacent to gridline ①. Such positioning of the steel tray ensured 1 m distance between the inner side of the back wall (along gridline ①) and the centre of the steel tray. The fire test was initiated by firing ethanol using a gas ignitor. The fire was allowed to develop on its own with no external interference to foster the fire growth. Detailed observations made during Test 1 (noted during the test as well as noted from video recordings and photos) are given below:
  • As the positioning of the ignition was 0.5 m within the fuel bed, the initial fire development was localized and circular spreading in all directions, as seen in Figure 4a.
  • After 6 min from ignition, the fire reached the back end of the fuel bed near gridline ①. Beyond this point, the fire spread along the breadth, towards the outer edges of the fuel wood, as well as along the length towards the front end of the compartment.
  • The fire flames touched the ceiling of the compartment after 7.5 min from ignition.
  • The fire bandwidth along the direction of travel, from gridline ① towards gridline ④, was 1.0 m after 8 min, while the same was 2.0 m after 16 min into the test.
  • After 19 min from ignition, all layers of the fuel wood were visible from the sides along gridlines Ⓐ and Ⓓ. This was due to the increase in volume of the travelling fire. It was observed that the fire bandwidth along the top layer was extended as compared to the fire bandwidth along the bottom layers.
  • After 23 min into the test, the fire expanded across the entire breadth of the fuel bed across the compartment. This means that the travelling fire breadth across the test compartment was 4.2 m after 23 min from ignition. At this point, the travelling fire bandwidth, along the compartment length, was 3.5 m.
  • The travelling fire bandwidth increased to 4 m after 28 min into the test. At this point, it was observed that the fuel wood near the source of ignition has collapsed. With the consumption of the fuel wood near the back end, the fire initiated its travel towards the front end of the compartment along the fuel bed (from gridline ① towards gridline ④). The shape of the travelling fire represented a semicircle (or a curve).
  • At 30 min, the travelling fire bandwidth was almost 3 m. However, this was reduced to around 1 m once the initial parts of the fuel wood were consumed after 32 min into the test (see Figure 4b).
  • The fire continued to travel along the fuel wood from gridline ① towards gridline ④ for the next 10 min (until the 42nd minute). During this time, the travelling fire bandwidth remained approximately 1.5 m. As the test compartment was open on three sides, the fire growth remained uniform with smoke exiting from the elevation along gridline ④, which provided an escape path for smoke as no down-stands were provided along this elevation.
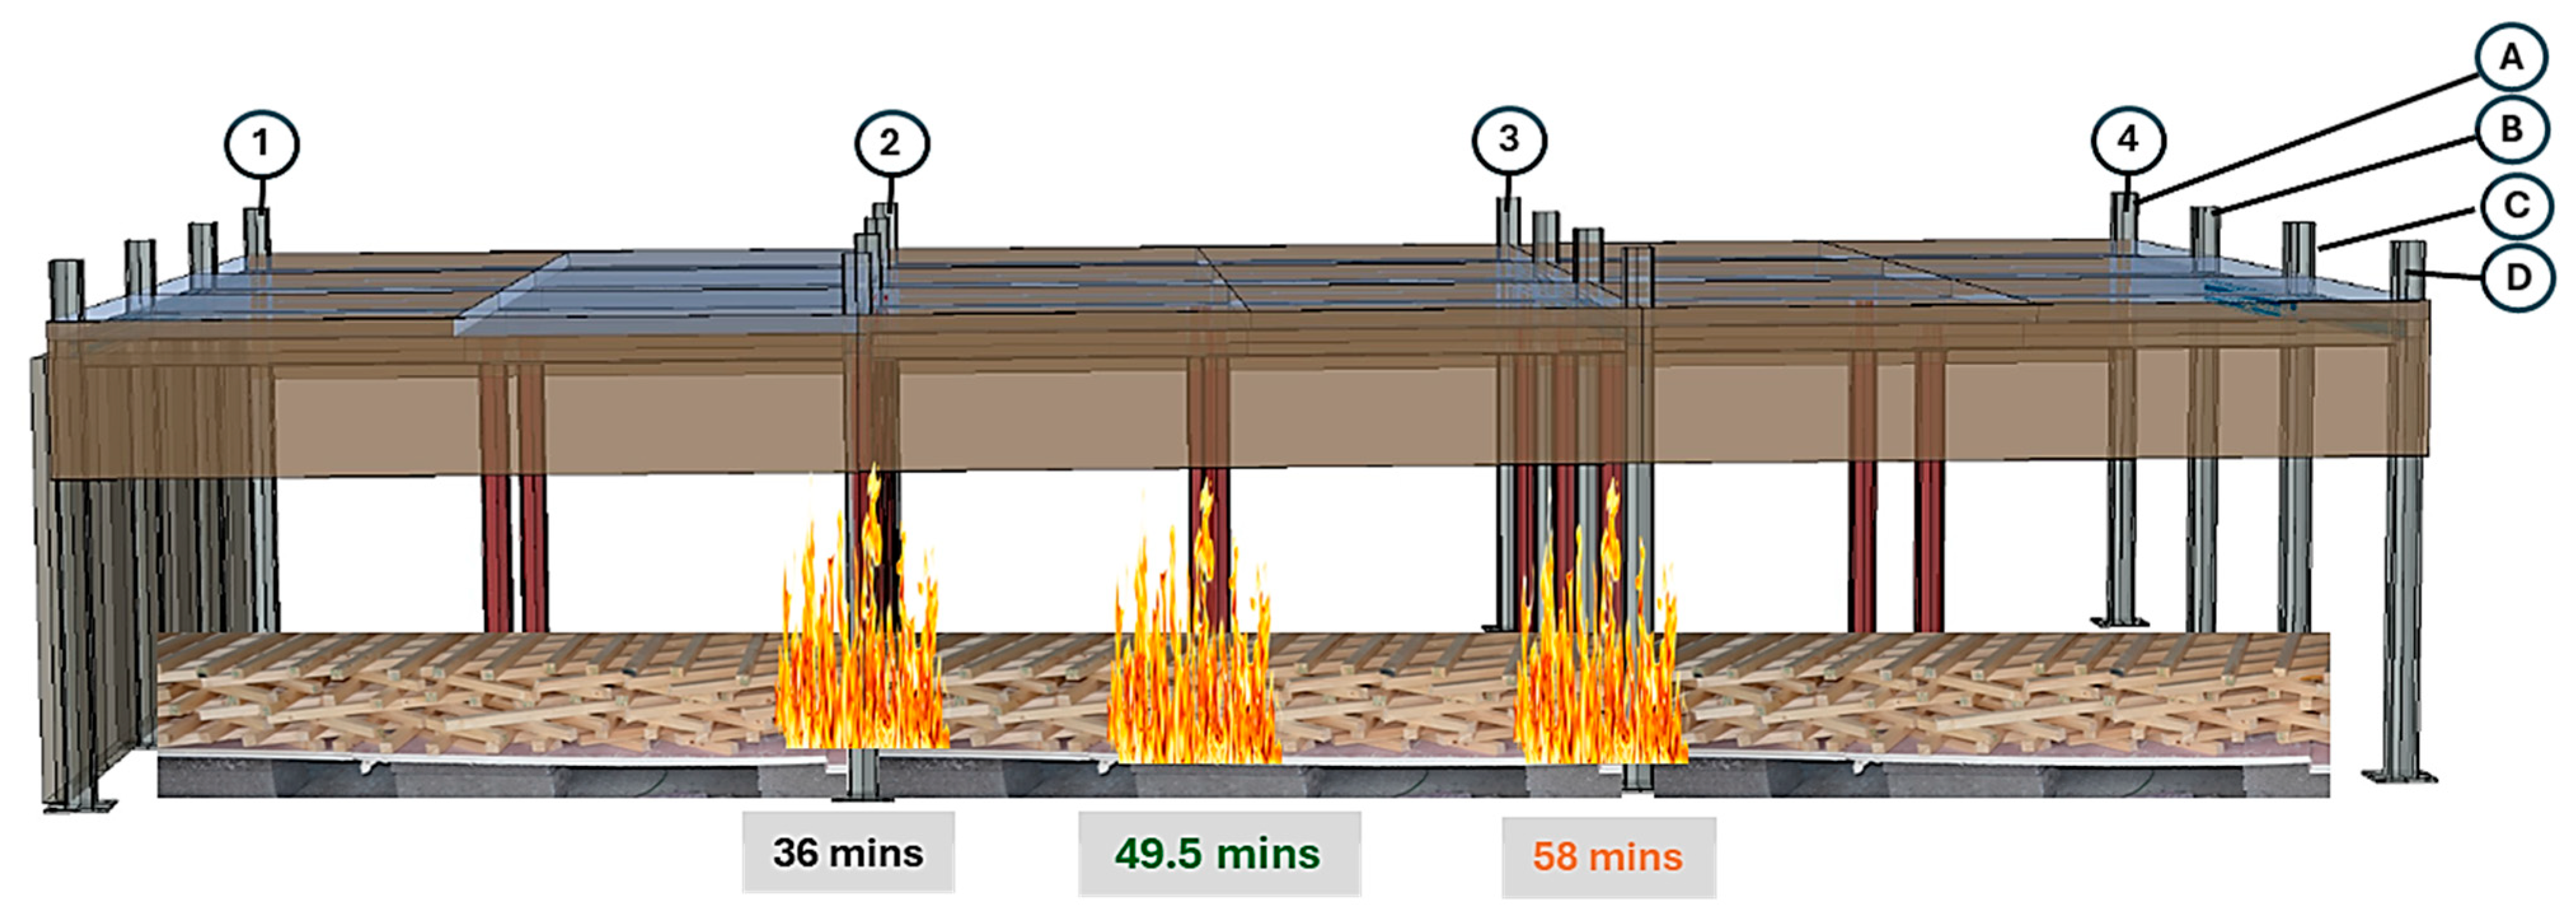
  • It was observed that the dummy column along the gridline ② (C11-2) was fully engulfed in flames and was in the centre of the travelling fire after 36 min into the test.
  • The fire continued to travel further, and its front reached the centre of the test compartment after 43 min from ignition. The travelling fire bandwidth at this point was approximately 2.5 m.
  • After 49.5 min from ignition, the centre of the travelling fire reached the middle of the test compartment (Zone 2B). At this point, the travelling fire bandwidth was approximately 3 m. As observed previously, the fire bandwidth along the top layers of fuel wood was significantly longer, approximately 2 m ahead of the burning bottom layers. It was also observed that the front of the travelling fire had reached the end of the platform provided to measure the mass-loss of fuel wood.
  • The travelling fire entered Zone 3B (the last central zone) of the test compartment after 52 min into the test.
  • The dummy column along gridline ③ (C11-3) was in the centre of the travelling fire and fully engulfed in flames after 58 min from the start of the test.
  • It was observed that the travelling fire bandwidth in Zone 3B was the longest. After 65 min, the travelling fire bandwidth was approximately 4.5 m. This reduced to 4 m with the consumption of the fuel wood after 67 min into the test and remained the same until the 69th minute.
  • The intensity of heat was higher in Zone 3B compared to that experienced in Zone 1B and Zone 2B of the compartment. It must also be noted that the intensity of heat in Zone 2B was also higher as compared to that experienced in Zone 1B.
  • With the consumption of wood, a reduction in the travelling fire bandwidth was noticed. The travelling fire bandwidth reduced to 3 m and 2 m, respectively, after 71.5 min and 73.5 min into the test.
  • After 76 min, the intensity of the fire reduced significantly as much of the fuel wood was consumed. The flame length was also reduced as only the residual fuel wood near the front end of the compartment was burning at this point.
  • The burning of the fuel wood near the front end of the test compartment continued to the 81st minute until all the fuel wood was consumed, and no flames were visible in any part of the compartment. Although the burning of the fuel wood marked the end of the travelling fire test, the heat radiation from embers were felt for much longer. The data recording was continued for a further 39 min, which provided a data set of 120 min for the travelling fire test.

3.2. Compartment Gas Temperatures

3.2.1. Compartment Gas Temperatures Along Gridline ②

Temperatures along gridline ② were recorded using three thermocouple trees: TRS1, TRL5, and TRS3. As shown in Figure 1, TRL5 was positioned within the fuel bed, while TRS1 and TRS3 were located on either side, outside the fuel bed. Since TRS1 and TRS3 were equipped with thermocouples only at Level 2, Level 4, and Level 5, the analysis focuses on these levels.
At Level 5 (Figure 5c), temperature development was similar across all three thermocouples for the first 20 min. As the travelling fire approached gridline ②, TRL5 recorded higher temperatures from the 20th to the 46th minute, followed by a gradual decrease. TRS1 and TRS3 also saw rising temperatures after 20 min, reaching 400 °C by the 30th minute. After a temporary decline from the 31st to the 40th minute, temperatures rose again, exceeding 500 °C in TRS3 after 50 min and 600 °C in TRS1 after 58 min. TRL5 maintained higher temperatures than TRS1 and TRS3 at Level 5 until around the 54th minute, after which TRS1 recorded a notable increase, possibly due to the extended fire bandwidth (4.5 m). While TRS1 continued to heat up, TRS3 showed a decline in temperature after the 48th minute, likely influenced by wind under the test’s open boundary conditions. After the 65th minute, temperatures at Level 5 declined uniformly across all three trees.
At Level 4 (Figure 5b), temperature trends closely resembled those at Level 5 but were slightly lower overall. Differences between inside and outside the fuel bed were negligible for the first 20 min. However, between the 30th and 45th minute, TRL5 recorded significantly higher temperatures at Level 4, at times more than 330 °C above those in TRS1 and TRS3. From the 45th to 65th minute, TRS1 recorded higher temperatures than TRS3, again likely due to wind influence in the open test setup.
At Level 2 (Figure 5a), temperature behaviour differed substantially. Minimal rise was observed during the first 20 min. After the 22nd minute, TRL5 showed a sharp increase, peaking above 900 °C by the 38th minute, followed by a rapid drop until the 44th minute and a slower decline thereafter. TRS1 and TRS3, positioned outside the fuel bed and closer to the floor (0.5 m), remained below 170 °C throughout the test. These low readings reflect their distance from the fire and the influence of cold air entering from outside at lower compartment levels. For a short duration, the temperature difference between TRL5 and the outer thermocouples at Level 2 exceeded 830 °C. Overall, Level 2 temperatures along gridline ② were highly variable and transient.

3.2.2. Compartment Gas Temperatures Along Gridline ③

Gridline ③ was located 9 m from the source of ignition, 5 m beyond gridline ②. As shown in Figure 1, TRL7 was the thermocouple tree within the fuel bed, while TRS2 and TRS4 were outside it. Due to its distance from the ignition source, a delay in peak temperatures was expected along this gridline.
At Level 2 (Figure 6a), a sharp temperature rise was recorded in TRL7 after 52 min, with peaks exceeding 900 °C after 58 min. These high temperatures lasted for approximately four minutes before decreasing rapidly over the next 20 min. In contrast, TRS2 and TRS4 consistently recorded temperatures below 150 °C throughout the test. Notably, while temperatures at Level 2 in TRL7 were significantly higher than those outside the fuel bed between the 50th and 80th minute (at peak, differences reached up to 750 °C), they remained uniform across all three trees during the initial 50 min and final 30 min of the test.
At Level 4 (Figure 6b), temperatures across TRL7, TRS2, and TRS4 were similar for the first 20 min. From the 20th to the 45th minute, TRL7 and TRS4 showed higher readings than TRS2, with differences between TRL7 and TRS4 staying within 100 °C. However, differences between TRL7 and TRS2 reached 200 °C, and increased significantly between the 54th and 69th minute, peaking at around 500 °C. TRL7 recorded temperatures above 900 °C during this period, while TRS2 and TRS4 stayed below 450 °C. These peaks in TRL7 were brief, followed by a sharp decline. After 70 min, temperatures at Level 4 became similar across all thermocouples.
At Level 5 (Figure 6c), temperature readings across TRL7, TRS2, and TRS4 remained similar until the 54th minute. A sharp rise was then recorded in TRL7 as the travelling fire approached, with temperatures exceeding 900 °C after 58 min, coinciding with full flame engulfment of TRL7 and the adjacent column. TRS2 and TRS4 saw minor increases but remained below 560 °C, resulting in a maximum temperature difference of around 350 °C at Level 5. This was slightly lower than the differences observed at Level 4. From the 70th minute onward, temperatures at Level 5 stabilized and became uniform across all trees.

3.3. Column Temperatures

3.3.1. Column Temperatures Along Gridline ②

As explained earlier, to monitor steel temperatures, three dummy columns were placed along gridline ②. C11-2 within the fuel bed, and C10-2R and C10-2L outside, as shown in Figure 1. The average recorded temperatures across these columns, at each level, are presented in Figure 7.
At Level 2 (Figure 7a), temperatures in C10-2R and C10-2L remained low throughout the test, not exceeding 300 °C. In contrast, C11-2 showed a sharp temperature rise after 20 min, reaching 690 °C after 41 min. At times, the temperature difference between C11-2 and the outer columns exceeded 450 °C.
At Levels 4 and 5 (Figure 7b,c), temperature differences were less pronounced. C11-2 reached a peak of 620 °C at Level 4 after 53 min, while C10-2L and C10-2R peaked at 420 °C and 350 °C, respectively. A similar trend was observed at Level 5, though temperatures were slightly lower than at Level 4. Across both levels, temperature differences between columns inside and outside the fuel bed stayed around 200 °C.
For the first 15 min, temperatures across all columns and levels were similar. Afterward, C11-2 experienced a steeper increase, particularly at lower levels, while outer columns along gridline ② saw a slower rise. In the final 45 min of the test, temperature differences at Levels 4 and 5 diminished.
Overall, temperatures in C11-2 remained significantly higher than in C10-2R and C10-2L for most of the test, reflecting its location within the fuel bed. Temperature profiles across all columns were transient and varied with elevation, regardless of their position relative to the fuel bed.

3.3.2. Column Temperatures Along Gridline ③

The temperature development in columns along gridline ③ shows a similar pattern to that observed along gridline ②, with the most significant temperature differences occurring at Level 2 compared to Levels 4 and 5. Since gridline ③ is located 5 m further from the source of ignition than gridline ②, temperatures in columns begin rising around 50 min into the test, as shown in Figure 8. In column C11-3, a rapid increase follows, reaching peak temperatures of approximately 800 °C at Level 2, 740 °C at Level 4, and 720 °C at Level 5 after 62 min.
Columns C10-3R and C10-3L recorded lower peak temperatures, approximately 310 °C at Level 2. At Level 4 and Level 5, 420 °C and 470 °C were reached after 72 min. Notably, the peaks at Levels 4 and 5 occur about 15 min after those at Level 2.
Compared to gridline ②, the peak temperatures in columns along gridline ③ are slightly higher. This may be attributed to the following reasons:
  • An increase travelling fire bandwidth near gridline ③, increasing heat exposure.
  • Prolonged exposure of structural elements to hot gases due to their location near the front end of the compartment, allowing higher temperatures to develop even before direct flame contact.
  • Similarly to the gas temperatures, the columns at Level 2 experience a sudden rise in temperature. However, this increase is less steep than that of the gas, as columns heat up slower than the surrounding air.
Overall, peak temperature differences between columns within and outside the fuel bed along gridline ③ reach approximately 500 °C at Level 2, 320 °C at Level 4, and 250 °C at Level 5, as seen in Figure 8. The difference in peak temperatures between columns inside and outside the fuel bed decreases with height, as rising hot air accumulates from the early stages of the test, heating the overall structural at upper levels. Meanwhile, the lower parts receive cooler fresh air, resulting in greater temperature differences at lower levels and reduced variation higher up. These findings highlight the transient nature of thermal exposure during travelling fires and their impact on steel structural elements.

3.4. Beam Temperatures

As stated earlier, temperature monitoring was also conducted in the steel beams. This article focuses on beams positioned perpendicular to the fire travel direction, spanning across the compartment along gridlines ② and ③. Each beam was instrumented with three thermocouples installed at mid-span, one in the top flange, one in the web, and one in the bottom flange, as previously illustrated in Figure 3d.

3.4.1. Beam Temperatures Along Gridline ②

Figure 9 presents the recorded temperatures in beams along gridline ②. Across all beams (2BR, 2BM, and 2BL), the bottom flange consistently records the highest temperatures, followed by the web, and then the top flange. This trend is expected, as the top flange is connected to the slab, which dissipates heat due to its direct exposure to the external environment. The temperature difference between the bottom flange and web is minor, while both are significantly hotter than the top flange.
The temperature rise across all sections is gradual, reflecting the steady exposure to hot gases near the ceiling. Appreciable heating begins after 8 min, once the fire is fully developed. As the travelling fire approaches gridline ②, the bottom flange and web exhibit a sharp temperature increase due to direct flame exposure, whereas the top flange heats more steadily. Peak temperatures in the top flange remain about 100–150 °C lower than those in the bottom flange and web and are sustained longer before declining post the 58th minute. In contrast, the bottom flange and web cool more rapidly after reaching peak temperatures.
While all beams show a similar temperature trend, beam 2BM (within the fuel bed) experience notably higher temperatures than beams 2BR and 2BL (outside the fuel bed). Peak temperatures in 2BM exceed 600 °C in the bottom flange and web and reach around 500 °C in the top flange. For beams 2BR and 2BL, temperatures are around 450 °C in the bottom flange, 420 °C in the web, and around 380 °C in the top flange. This results in temperature differences of about 150 °C for the bottom flange and web, and around 120 °C for the top flange between beams inside and outside the fuel bed.

3.4.2. Beam Temperatures Along Gridline ③

As shown in Figure 10, beams along gridline ③ follow the same temperature trend observed in gridline ②; the bottom flange and web record higher temperatures than the top flange. Positioned 9 m from the source of ignition (5 m further than gridline ②), these beams show a delayed temperature rise, with similar temperatures across all beams for the first 50 min, regardless of their location.
Beyond this point, beam 3BM (within the fuel bed) experiences a notable increase in temperature, with the bottom flange exceeding 700 °C, the web around 680 °C, and the top flange near 600 °C after 62 min. In contrast, beams 3BL and 3BR (outside the fuel bed) reach lower peak temperatures, approximately 500 °C (bottom flange), 480 °C (web), and 400 °C (top flange).
These results confirm that direct exposure to the travelling fire significantly affects beam temperatures, while beams outside the fuel bed remain cooler, suggesting retained structural capacity under fire loading. It is important to note that temperature differences between beams inside and outside the fuel bed are smaller than those observed in gas and columns, due to the accumulation of hot gases near the ceiling from the early stages of the test. While this raises the overall temperature of structural elements, beams within the fuel bed still experience higher temperatures.

3.5. A Comparative Study of Temperatures Recorded Along Gridline ② and Gridline ③

This section presents the influence of the travelling fire on gas temperatures and structural elements at three key time intervals: 36, 49.5, and 58 min, as illustrated in Figure 11. The analysis focuses on data recorded across the width of the compartment along gridlines ② and ③, with time points chosen based on the location of the travelling fire band. At 36 min, the fire band is centred on column C11-2 (within the fuel bed along gridline ②); at 49.5 min, it is positioned mid-span of the test compartment; and at 58 min, it coincides with column C11-3 (within the fuel bed along gridline ③).

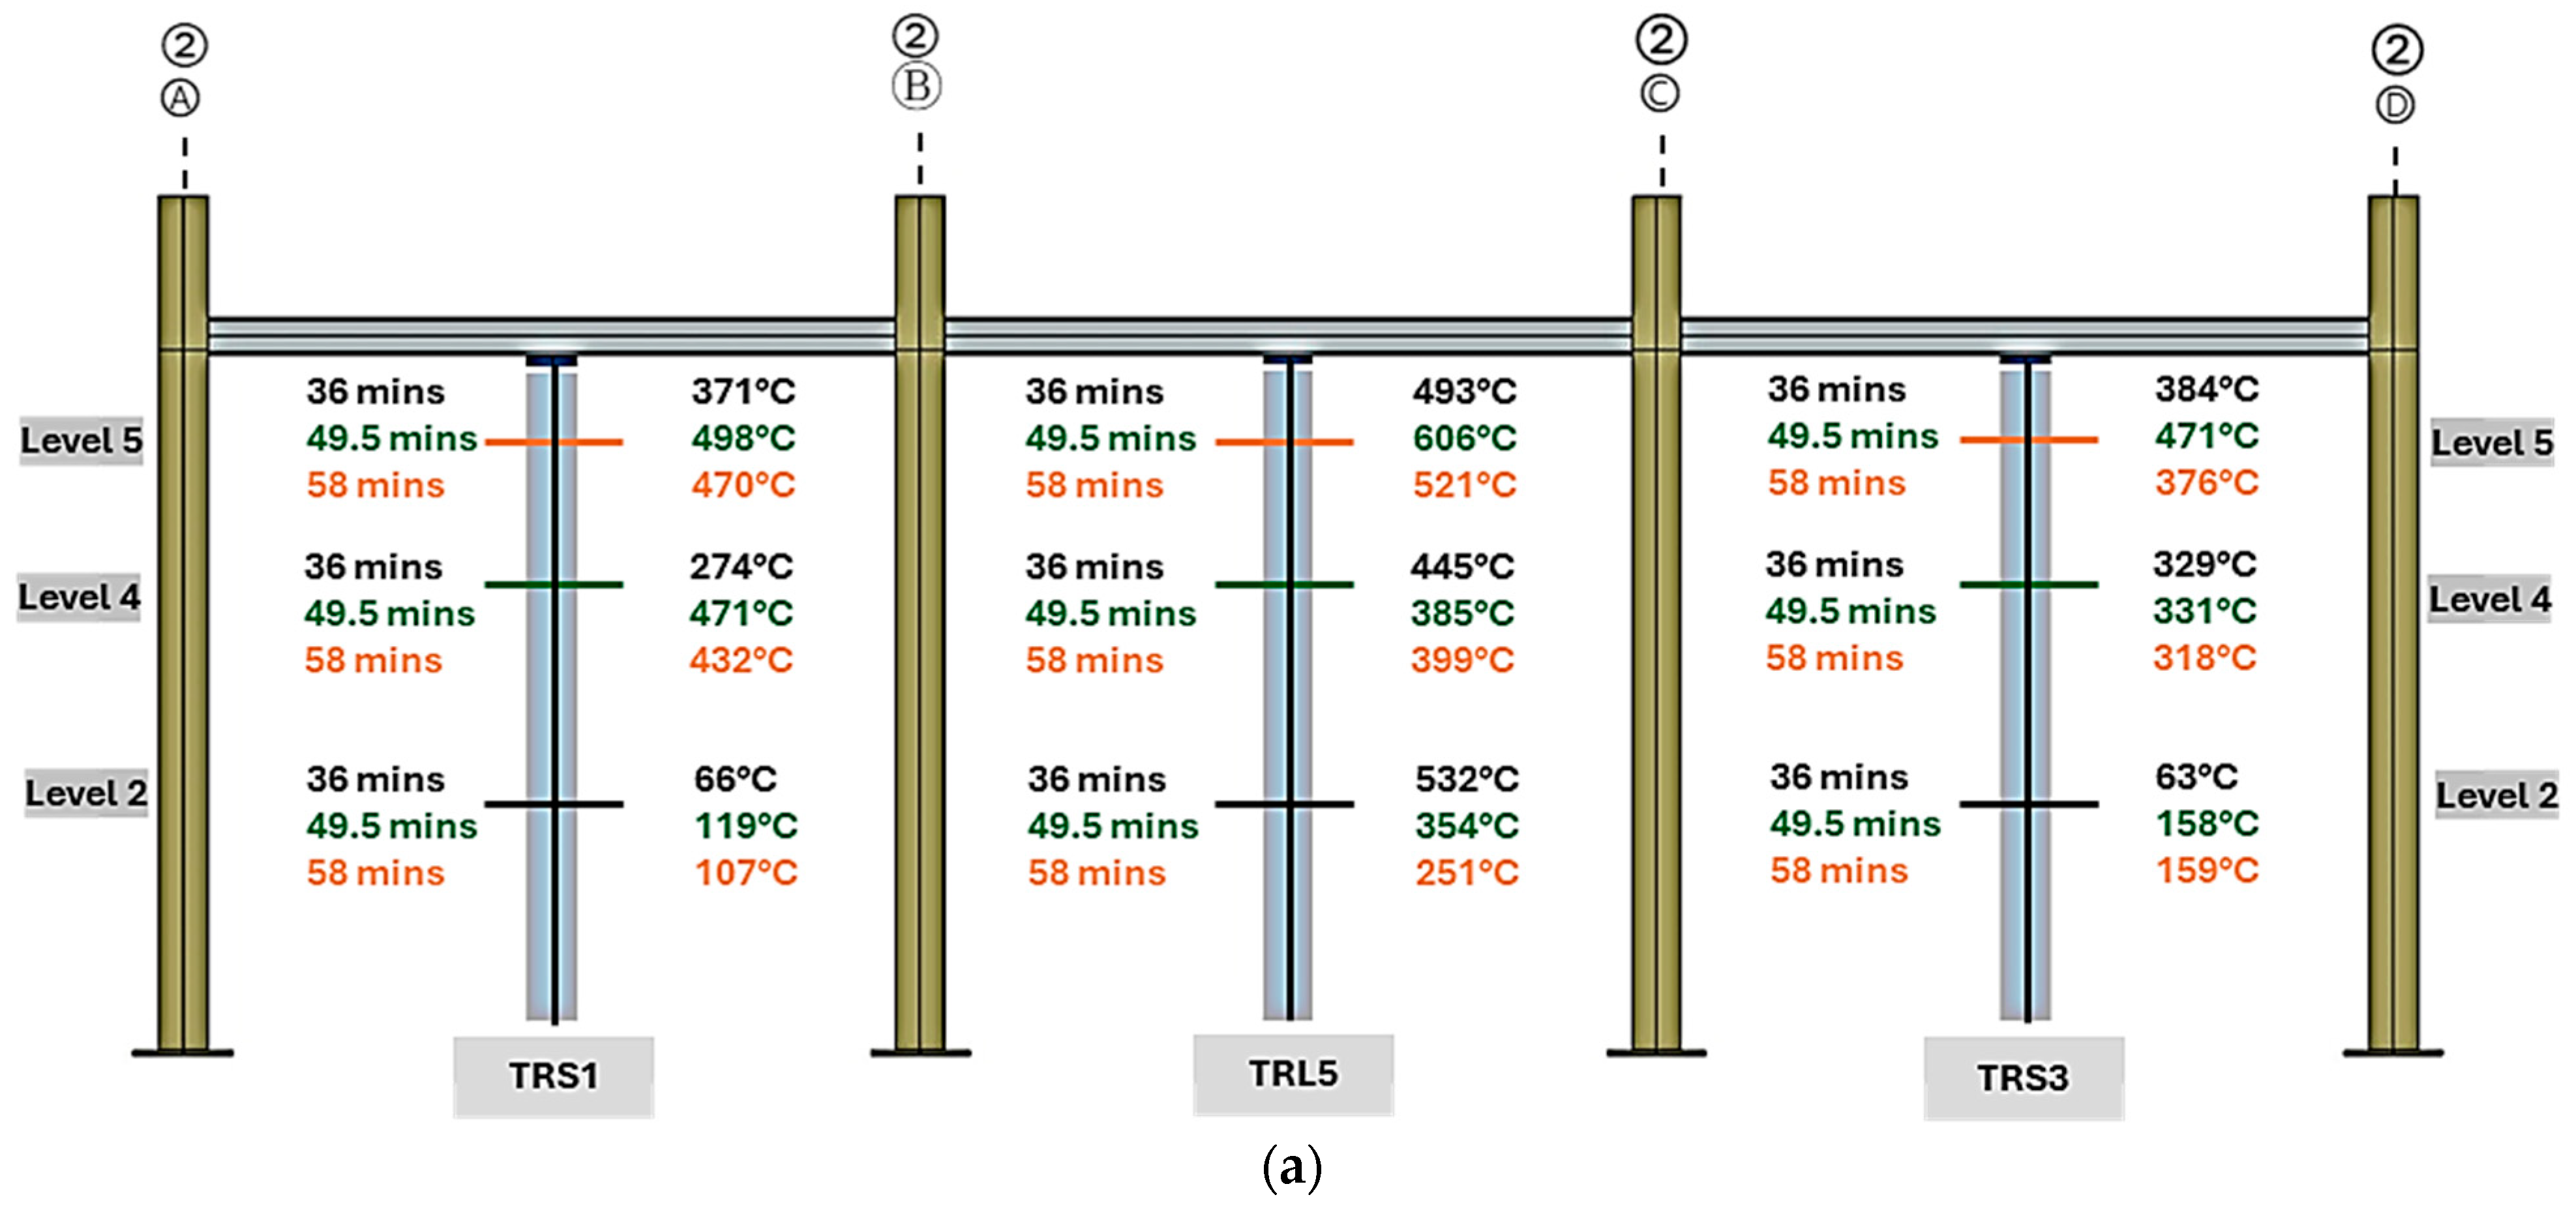
3.5.1. Comparison of Recorded Gas/Compartment Temperatures

The comparison of gas temperatures recorded in the compartment along gridlines ② and ③ for above-mentioned time intervals is presented in Figure 12. Figure 12a shows the gas temperatures along gridline ②, Figure 12b shows those along gridline ③, and Figure 12c presents the differences between corresponding thermocouple positions on the two gridlines.
At Level 2, gas temperatures along gridline ② were consistently higher than along gridline ③ in the early fire stages. At 30 min, TRL5 recorded the highest temperature, 176 °C more than TRL7. By 36 min, temperatures near TRL5 exceeded 530 °C, while near TRL7 they stayed around 25 °C, a difference of over 500 °C. Outside the fuel bed, differences between gridlines remained under 50 °C. As the fire reached the compartment centre at 49.5 min, TRL5 cooled to 354 °C, TRL7 stayed below 50 °C, and the temperature gap narrowed to 310 °C. At this stage, differences outside the fuel bed rose to about 100 °C. After 58 min, when the fire reached gridline ③, TRL7 peaked at 909 °C, while TRL5 dropped to 251 °C, a 650 °C difference. Differences outside the fuel bed stayed under 50 °C. By 120 min, temperatures across all Level 2 thermocouples had equalized. Temperature rise at this level occurred only when flames directly reached the thermocouples.
At Level 4, a similar pattern emerged. At 36 min, TRL5 reached 445 °C, while TRL7 was at 207 °C, a 240 °C difference. Outside the fuel bed, differences were smaller. By 49.5 min, TRL5 cooled and TRL7 warmed, narrowing the gap to 81 °C. Meanwhile, TRS1 reached over 470 °C, and TRS2 remained at 170 °C, a 300 °C difference. TRS3 and TRS4 stayed within 120 °C of each other. At 58 min, TRL7 peaked at 878 °C, while TRL5 remained around 400 °C, creating a 480 °C difference. Differences outside the fuel bed remained under 100 °C.
At Level 5, trends mirrored Level 4 but were more uniform. At 36 min, TRL5 was 190 °C hotter than TRL7. By 49.5 min, TRL5 hit 606 °C and TRL7 reached 344 °C, a 262 °C difference. Outside the fuel bed, temperatures ranged from 115 °C to 170 °C. At 58 min, TRL7 rose to 846 °C, 335 °C higher than TRL5. Outside the fuel bed, maximum differences were 62 °C (TRS4–TRS3) and 26 °C (TRS1–TRS2).
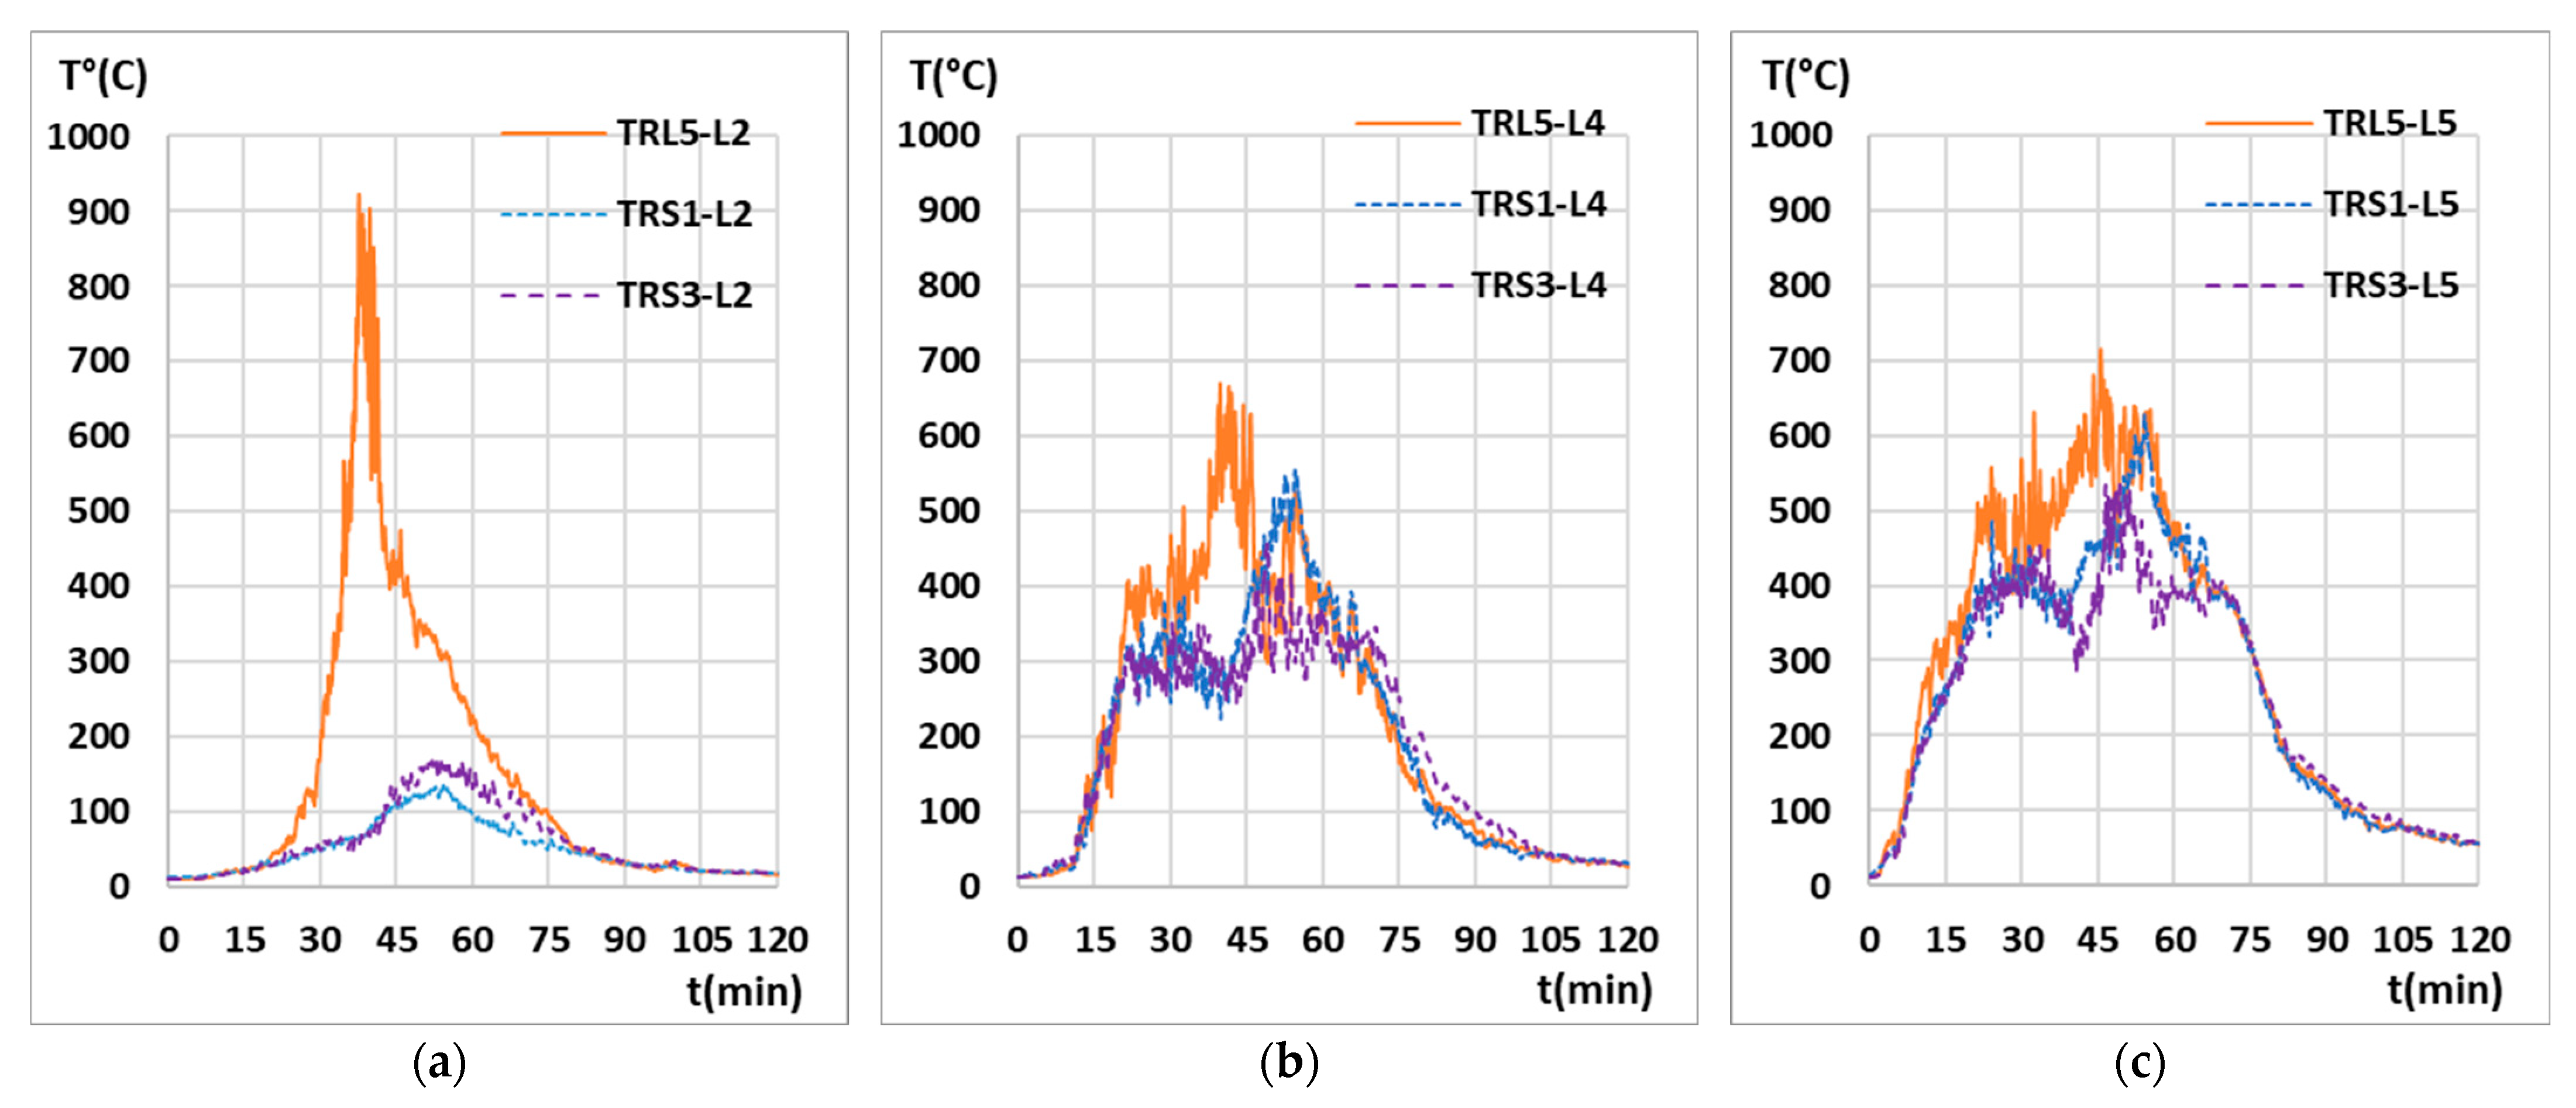
  • After 36 min, gas temperatures recorded at Level 2 along gridline ② in TRL5 are 532 °C while those recorded in TRS1 and TRS3, outside the fuel bed, are only between 63 and 66 °C, a difference of around 465 °C. As seen in Figure 12a, the difference in temperatures within and outside the fuel bed at Level 4 and Level 5 remain around 100 °C after 36 min.
  • The difference in recorded gas temperatures within and outside the fuel bed at Level 2 along gridline ② after 49.5 min has reduced to around 200 °C. The same difference at Level 4 and Level 5 is still around 100 °C.
  • After 58 min, the difference at Level 2 within and outside the fuel bed along gridline ② have reduced to around 100 °C. The same differences at upper levels (Level 4 and Level 5) along gridline ② have also reduced at this stage of the test, as seen in Figure 12a.
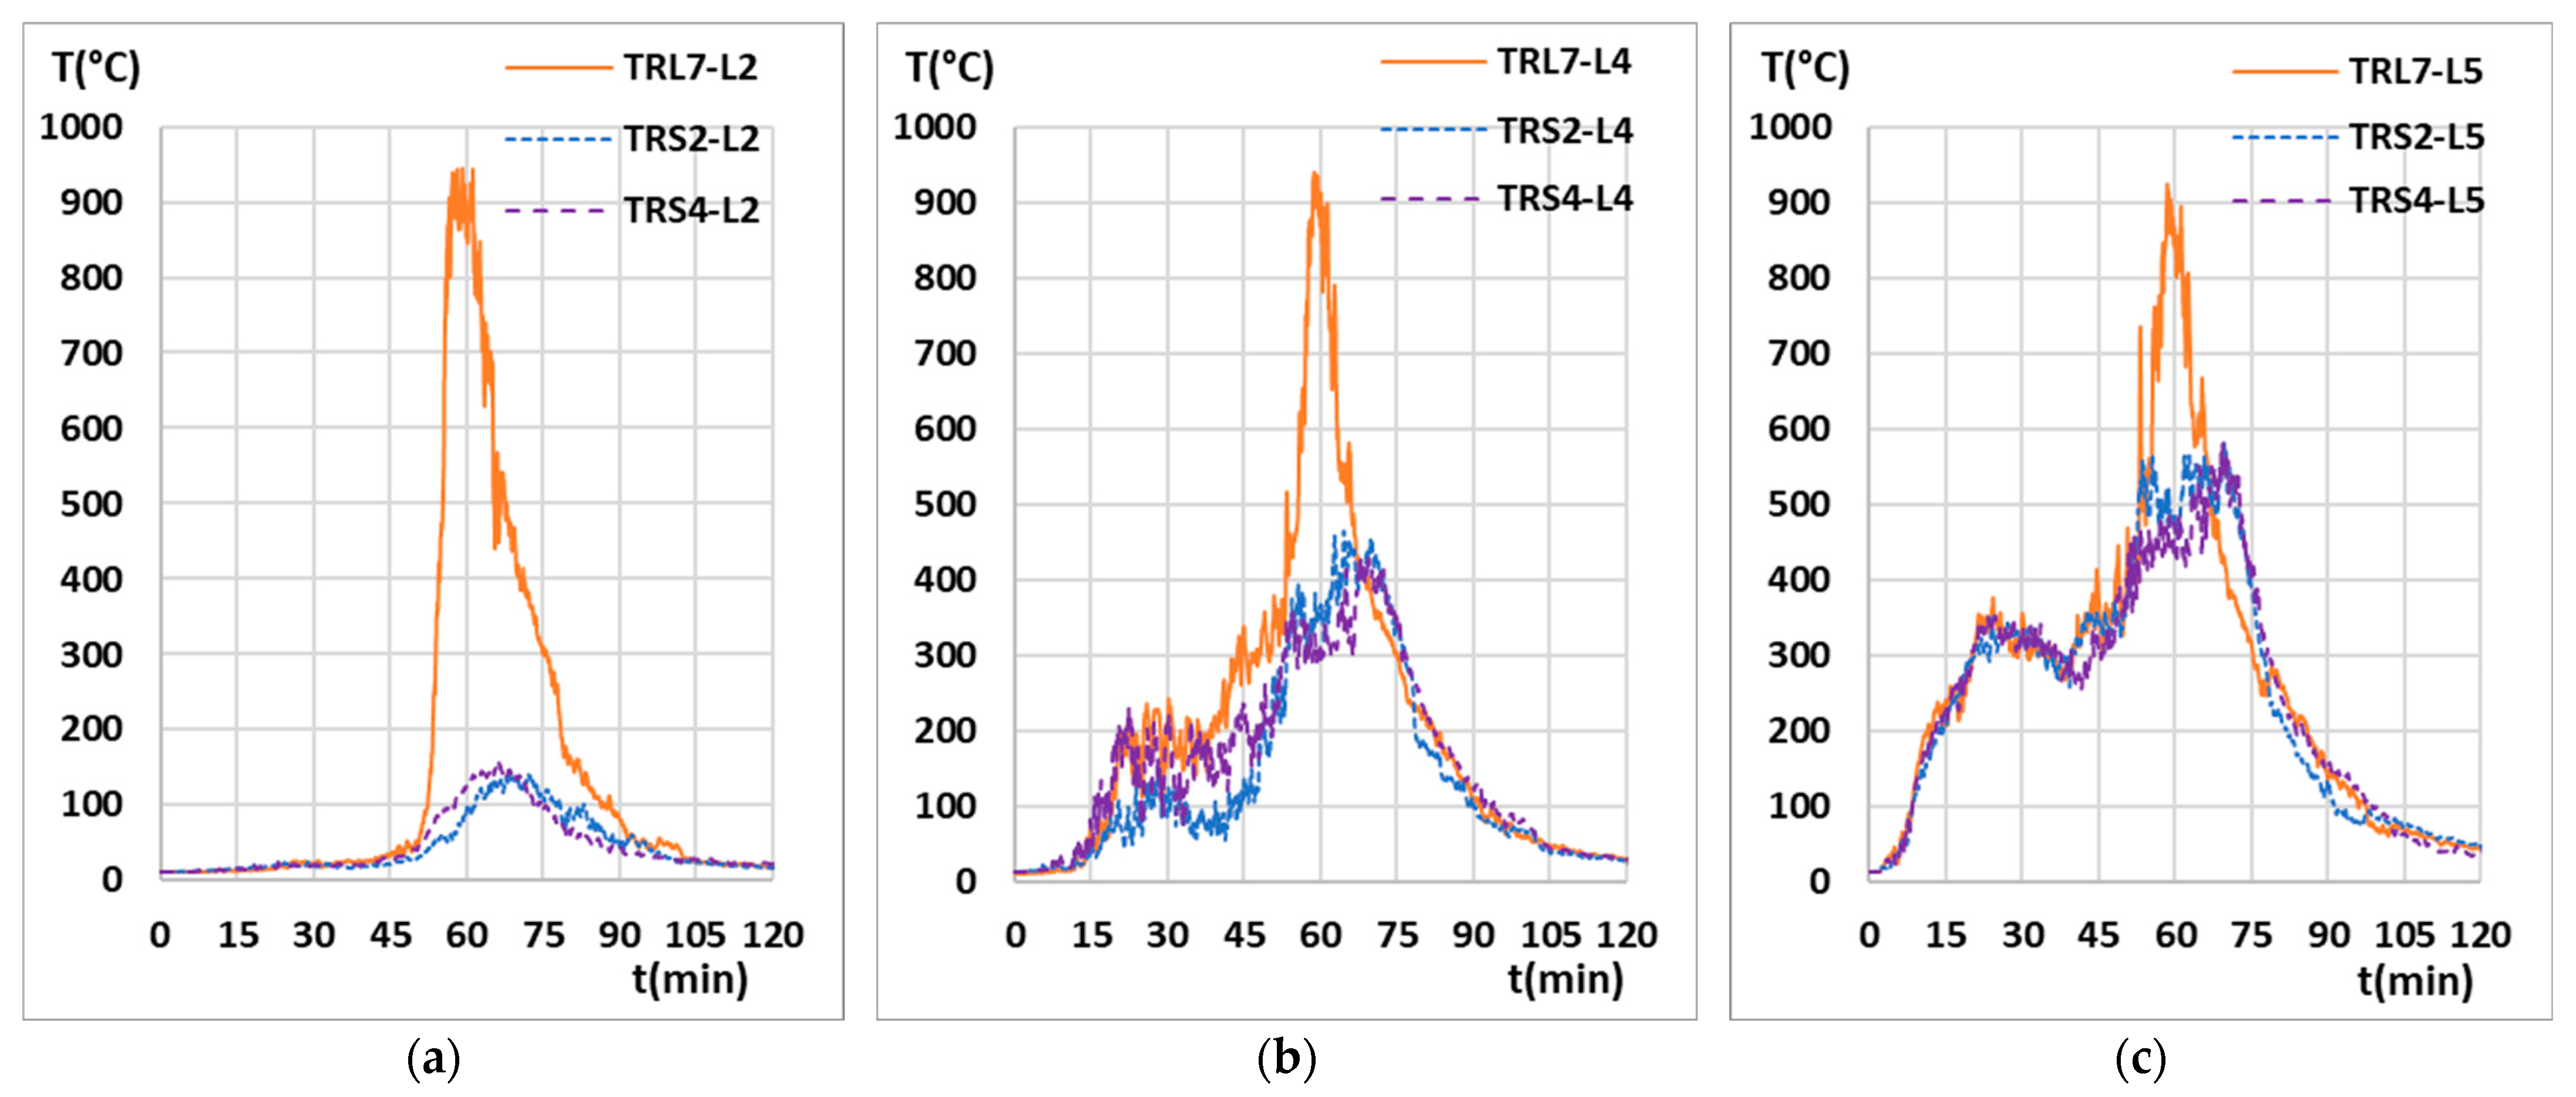
  • Temperatures differences recorded across all levels within and outside the fuel bed along gridline ③ are insignificant after 36 min into the test.
  • Temperatures differences within and outside the fuel bed along gridline ③ remain insignificant at Level 2 and Level 5 after 49.5 min. On the other hand, some differences in recorded gas temperatures are experienced at Level 4. The differences at Level 4, within and outside the fuel bed along gridline ③, are between 80 °C and 130 °C after 49.5 min.
  • With the fire band centred at gridline ③ after 58 min, the difference in gas temperatures recorded within and outside the fuel bed at Level 2 have increase to around 800 °C. The same differences at Level 4 and Level 5 after 58 min are around 500 °C and 400 °C, respectively, as seen in Figure 12b.
The above discussion shows that the recorded gas temperatures in the compartment are non-uniform and are highly dependent on the positioning of the travelling fire. This challenges the assumption of uniform temperatures within a compartment and opens directions to conduct further research to address fires in large compartments.

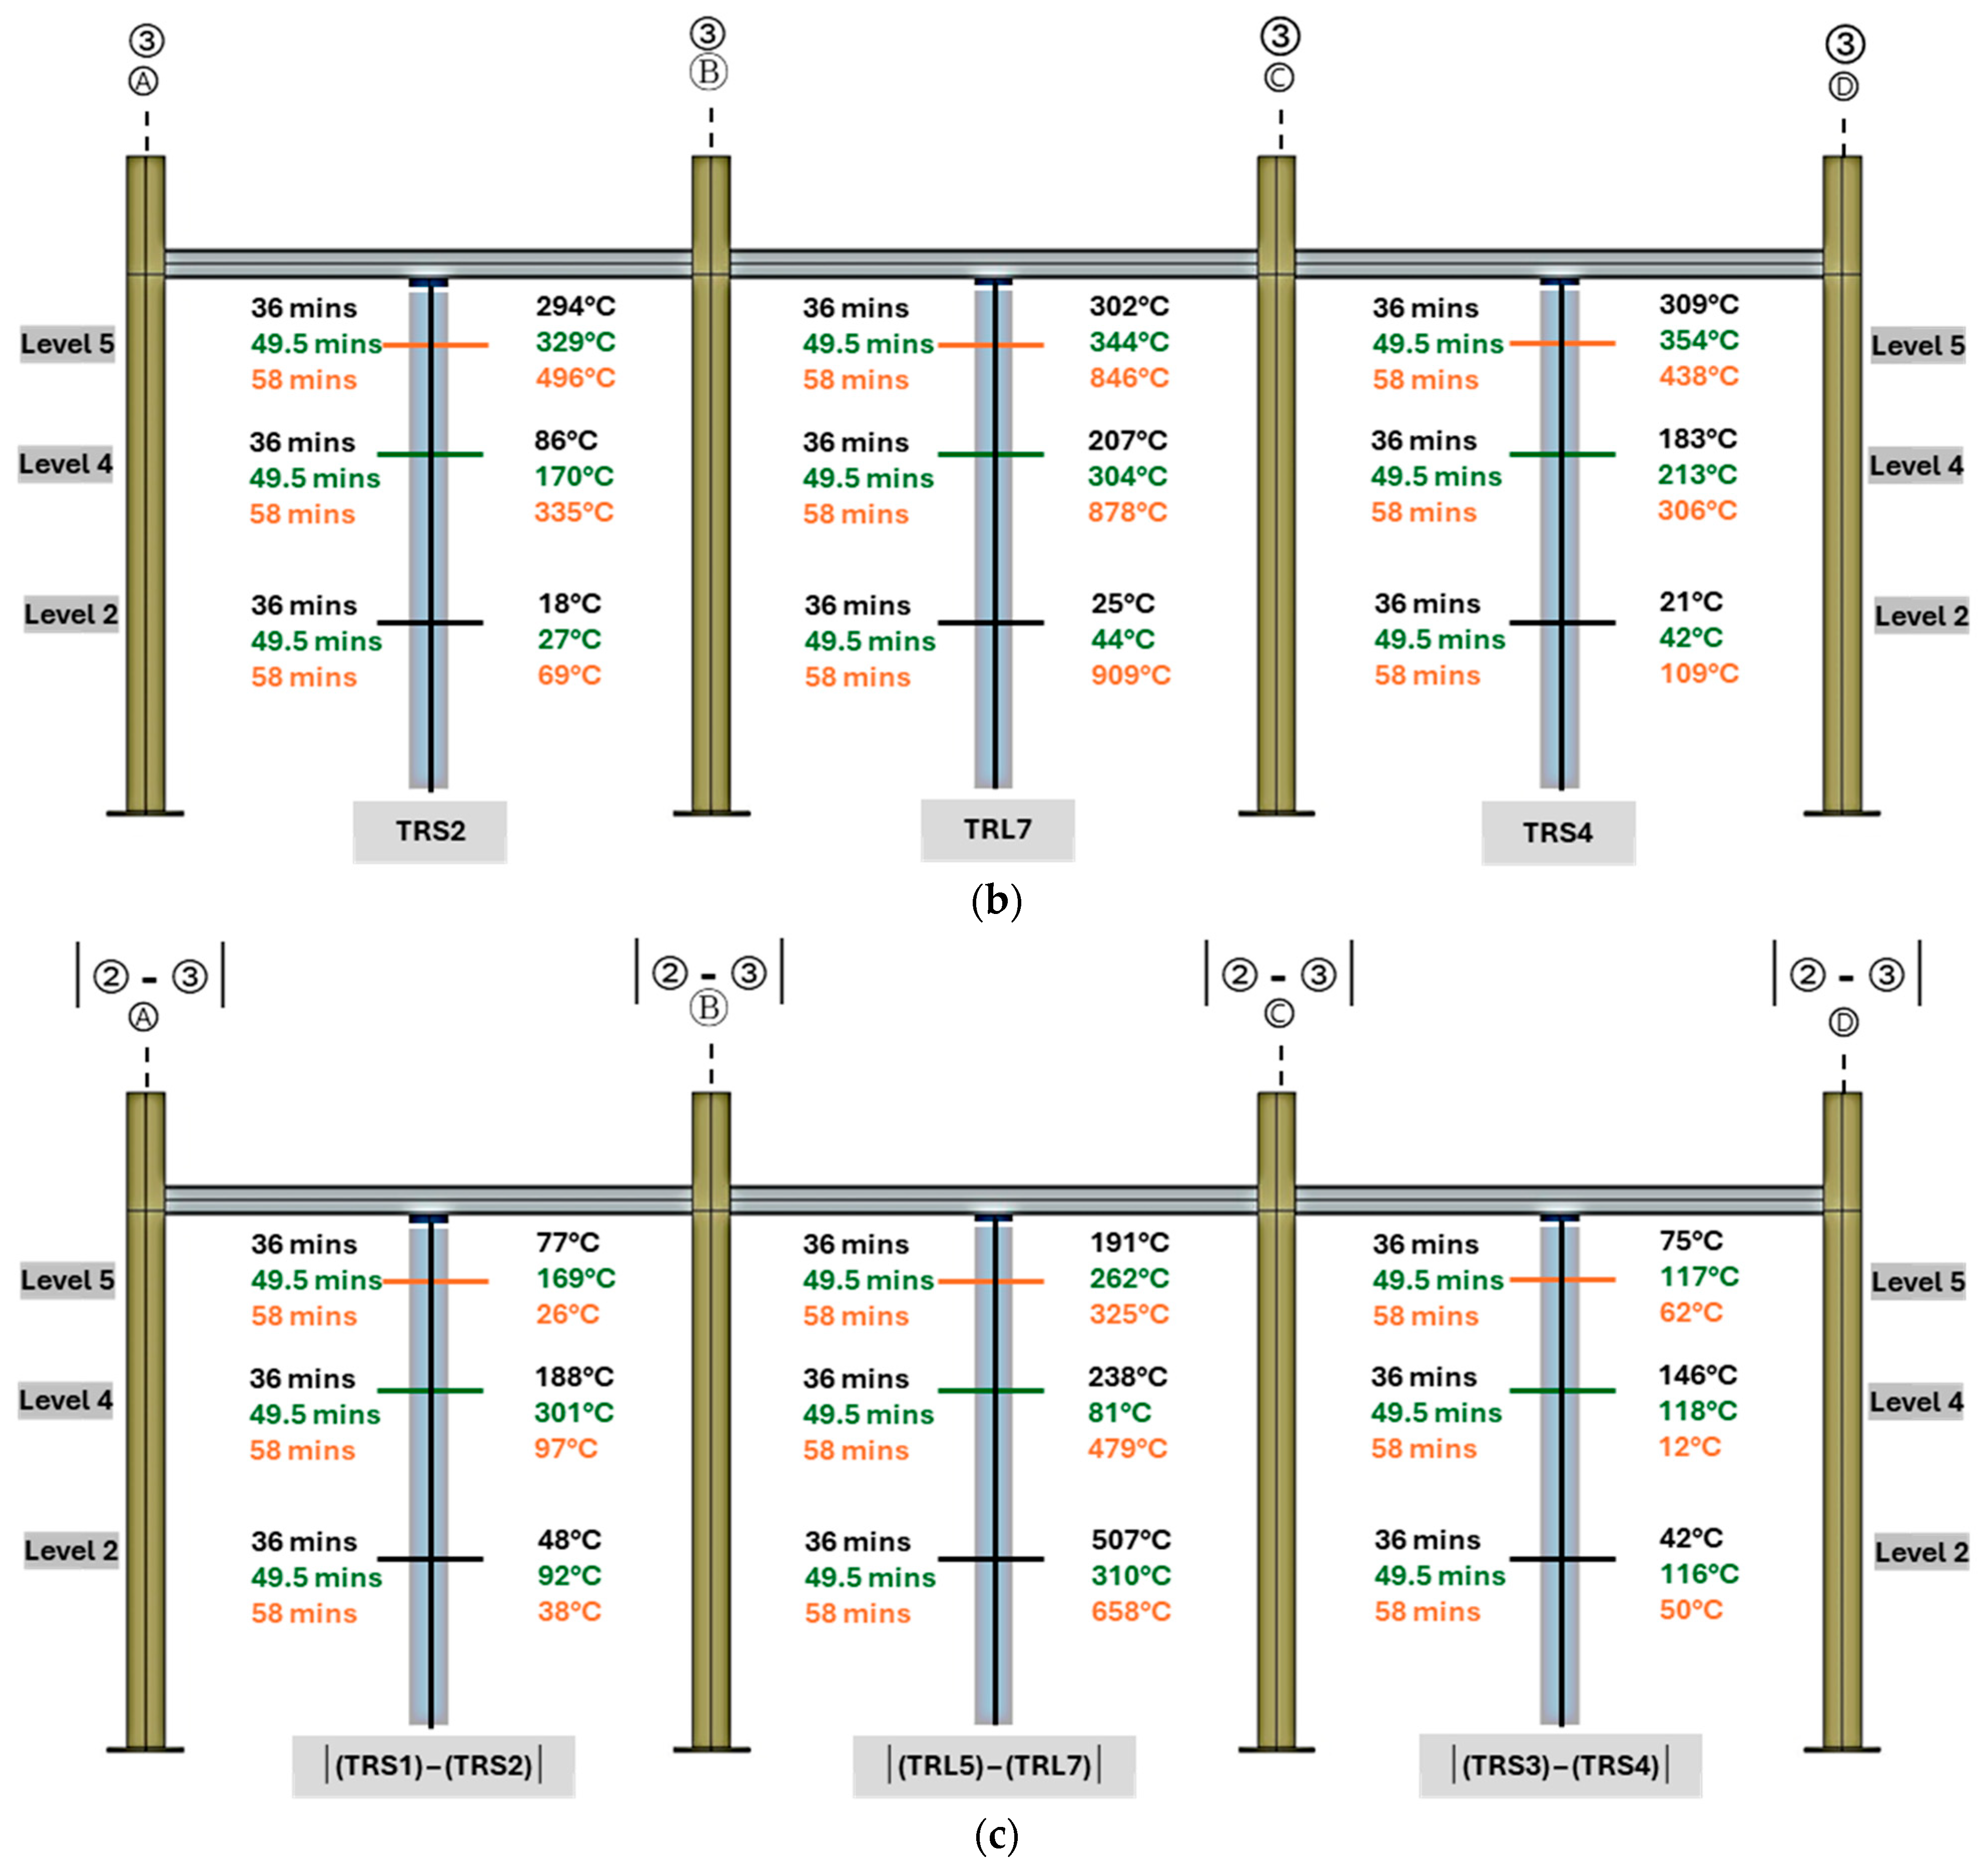
3.5.2. Comparison of Recorded Column Temperatures

A comparative analysis of the thermal data from the columns along gridlines ② and ③ at the specified time intervals is presented in Figure 13. As seen earlier in Figure 7 and Figure 8, temperatures across all columns were similar during the first 15 min, regardless of their positions. However, by 30 min, higher temperatures were recorded in columns along gridline ② while those along gridline ③ remained low.
At 36 min, with the fire centred at gridline ②, column C11-2 at Level 2 reached nearly 500 °C, while the temperatures in columns C10-2L and C10-2R (positioned outside the fuel bed along gridline ②) had only just exceeded 160 °C, a temperature difference of approximately 340 °C at Level 2. In contrast, columns along gridline ③ maintained very low temperatures, all below 50 °C. This created a temperature difference of about 440 °C at Level 2 between columns C11-2 and C11-3 (inside the fuel bed) and a difference of around 120 °C between corresponding columns outside the fuel bed.
At the upper levels, the difference in recorded temperatures between columns C11-2 and C11-3 was approximately 300 °C at Level 4 and 250 °C at Level 5. For columns positioned outside the fuel bed, the temperature differences at 36 min were around 170 °C at Level 4 and 135 °C at Level 5. As illustrated in Figure 13c, the temperature disparity between gridlines ② and ③ decreases with increasing height in the compartment.
At 49.5 min, when the travelling fire reached the centre of the test compartment, columns along gridline ② still exhibited significantly higher temperatures than those along gridline ③. This was expected, as gridline ② had been exposed to flames for a longer duration. Column C11-2 recorded temperatures exceeding 600 °C at some levels, while the corresponding column C11-3 along gridline ③ recorded only around 310 °C at Level 4, resulting in a temperature difference of roughly 360 °C. Columns outside the fuel bed along gridline ② (C10-2R and C10-2L) recorded temperatures ranging from 230 °C to 400 °C, whereas corresponding columns along gridline ③ (C10-3R, C11-3, and C10-3L) recorded lower values between 80 °C and 275 °C. These observations yield a temperature difference in the range of 125 °C to 150 °C for the outside-fuel-bed columns along the two gridlines. As shown in Figure 13, columns along gridline ② consistently recorded higher temperatures than those along gridline ③ up to this stage in the fire test.
At 58 min, as the travelling fire became centred on gridline ③, a significant rise in temperatures was recorded in column C11-3, particularly at Level 2, where values approached 600 °C. At this point, the temperatures recorded in column C11-2 along gridline ② became quite similar to those in C11-3, especially at Levels 4 and 5. However, at Level 2, C11-3 remained approximately 80 °C hotter than C11-2. For columns positioned outside the fuel bed, temperature differences were generally small, and in several cases, slightly higher temperatures continued to be recorded in columns along gridline ② compared to those along gridline ③.
Some observations regarding temperatures recorded in columns positioned within and outside the fuel bed are given below:
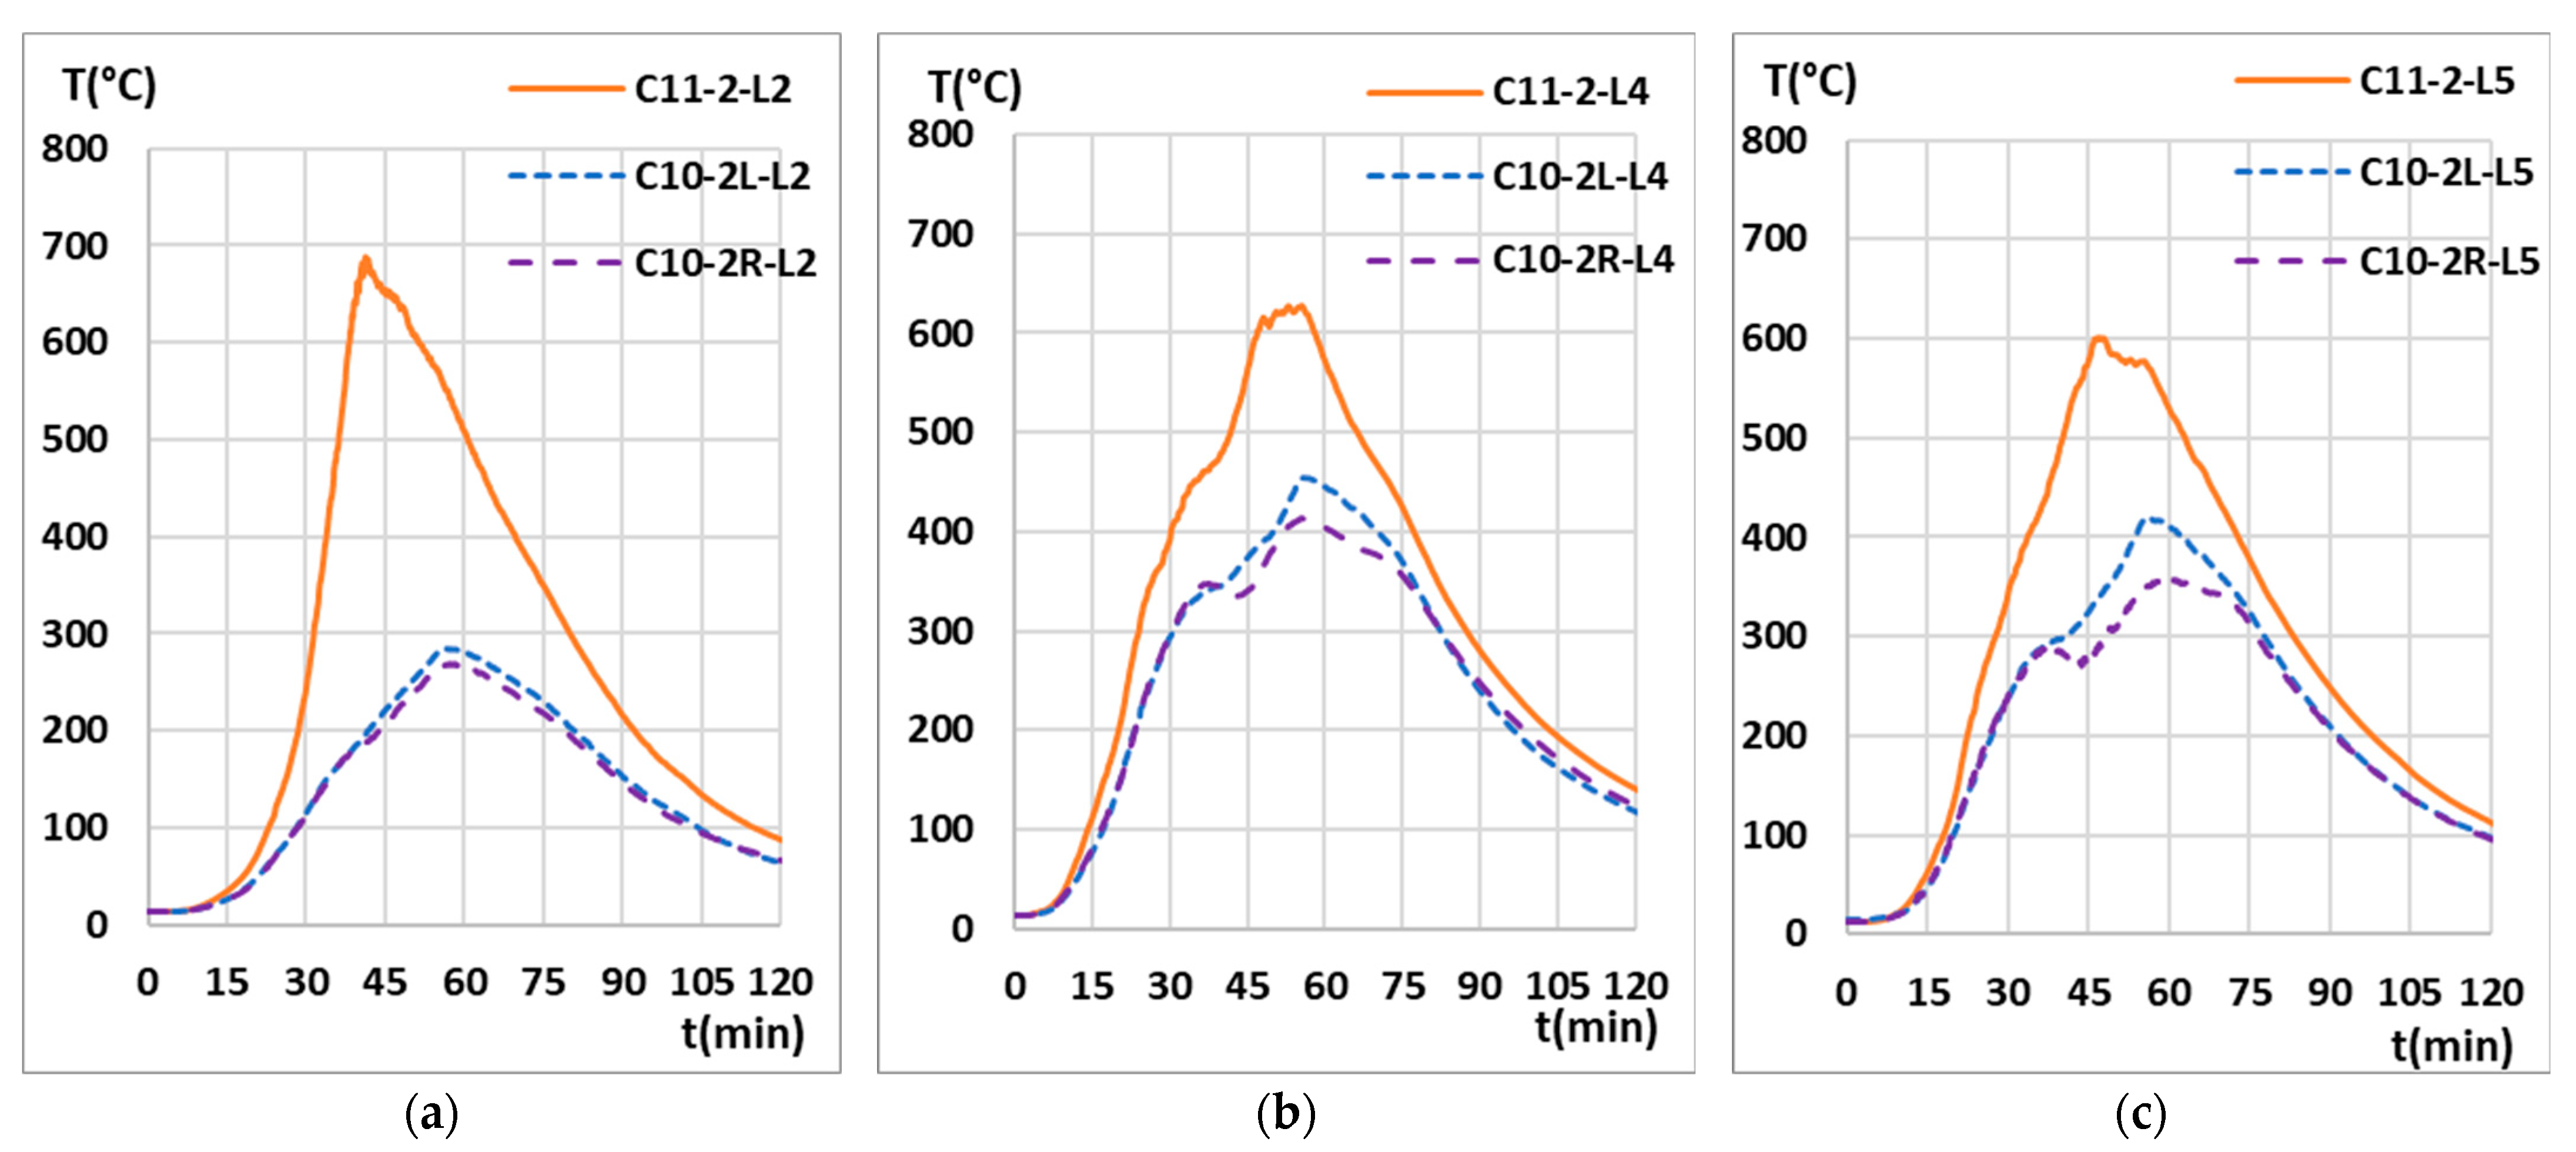
  • With the fire fully engulfing column C11-2 after 36 min, temperatures at Level 2 reach 491 °C. In contrast, temperatures in columns C10-2L and C10-2R (outside the fuel bed along gridline ②) are 164 °C, approximately 330 °C lower. At Levels 4 and 5, the temperature differences across the width of the compartment are around 150 °C and 110 °C, respectively.
  • At 49.5 min the temperatures in C11-2 (within the fuel bed) increase to 617 °C, while those in C10-2L and C10-2R remain below 250 °C. This results in a difference of over 350 °C at Level 2 along gridline ② (see Figure 13a).
  • After 58 min, a slight decrease in temperatures is observed in columns along gridline ②. C11-2 records 534 °C at Level 2, while C10-2L and C10-2R are around 280 °C, yielding a temperature difference of approximately 250 °C. At Levels 4 and 5, these differences range from 160 °C to 200 °C after 58 min, as shown in Figure 13a.
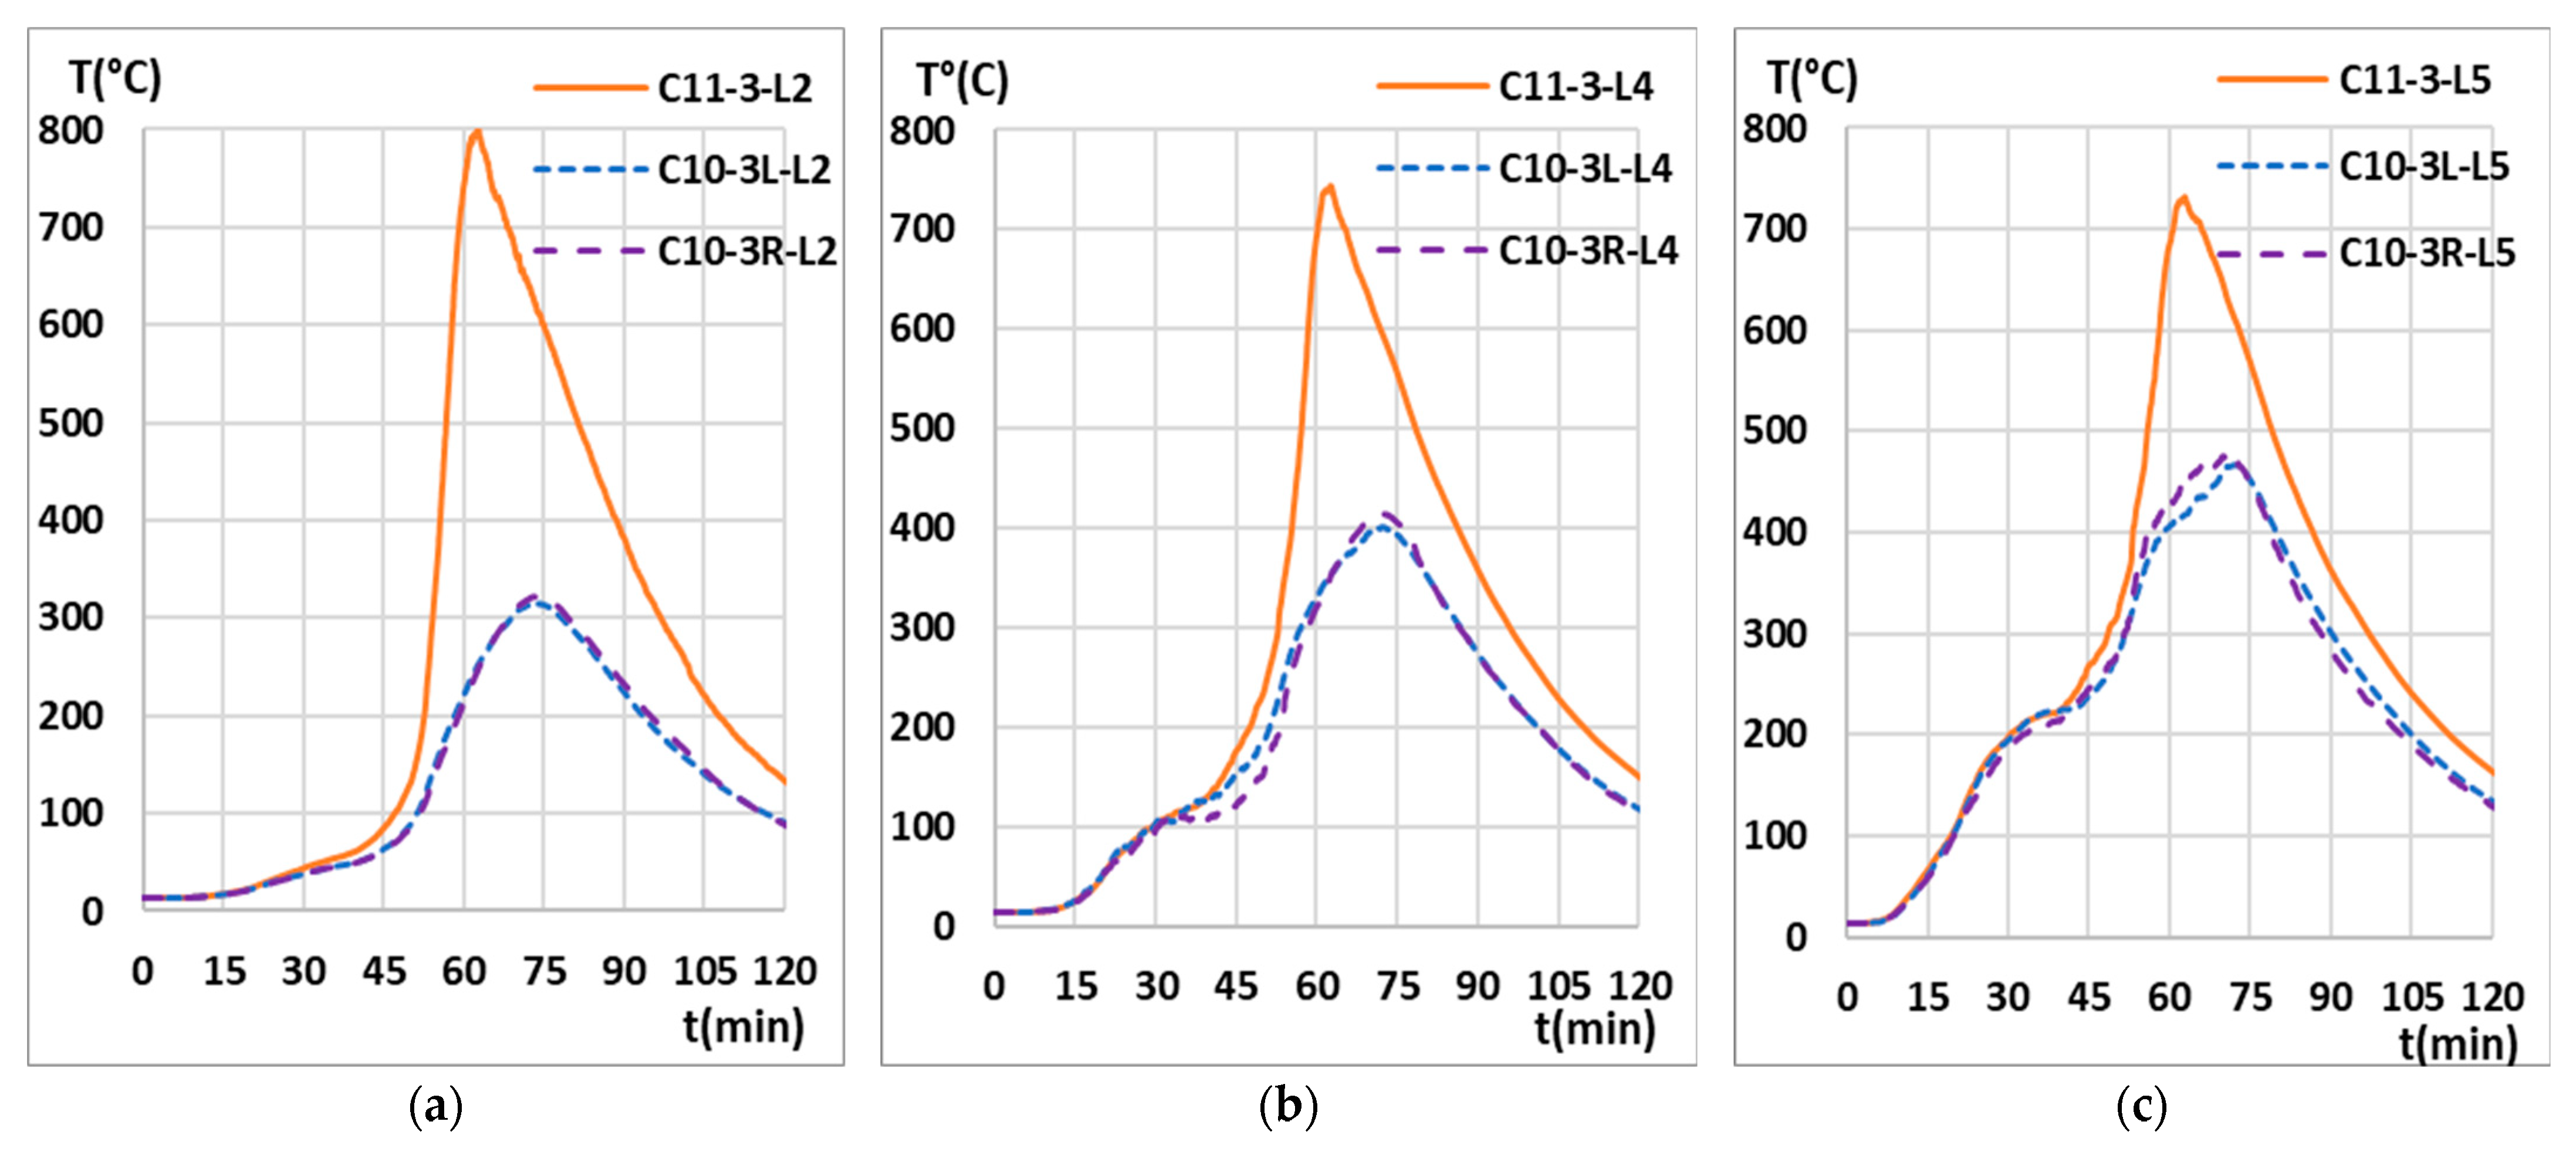
  • For columns along gridline ③, temperatures remain uniformly low across the compartment at 36 min, with higher values recorded at upper levels than at lower ones (Figure 13b).
  • By 49.5 min, a slight temperature increase is noted along gridline ③, though differences between columns within and outside the fuel bed remain small, around 80 °C at all levels (Figure 13b).
  • At 58 min, when the fire is centred along gridline ③, maximum temperatures are recorded in column C11-3, reaching 615 °C at Level 2. Temperatures in adjacent columns outside the fuel bed are around 200 °C, producing a difference of approximately 415 °C. As height increases, these differences decrease to about 250 °C at Level 4 and 170 °C at Level 5, as illustrated in Figure 13b.

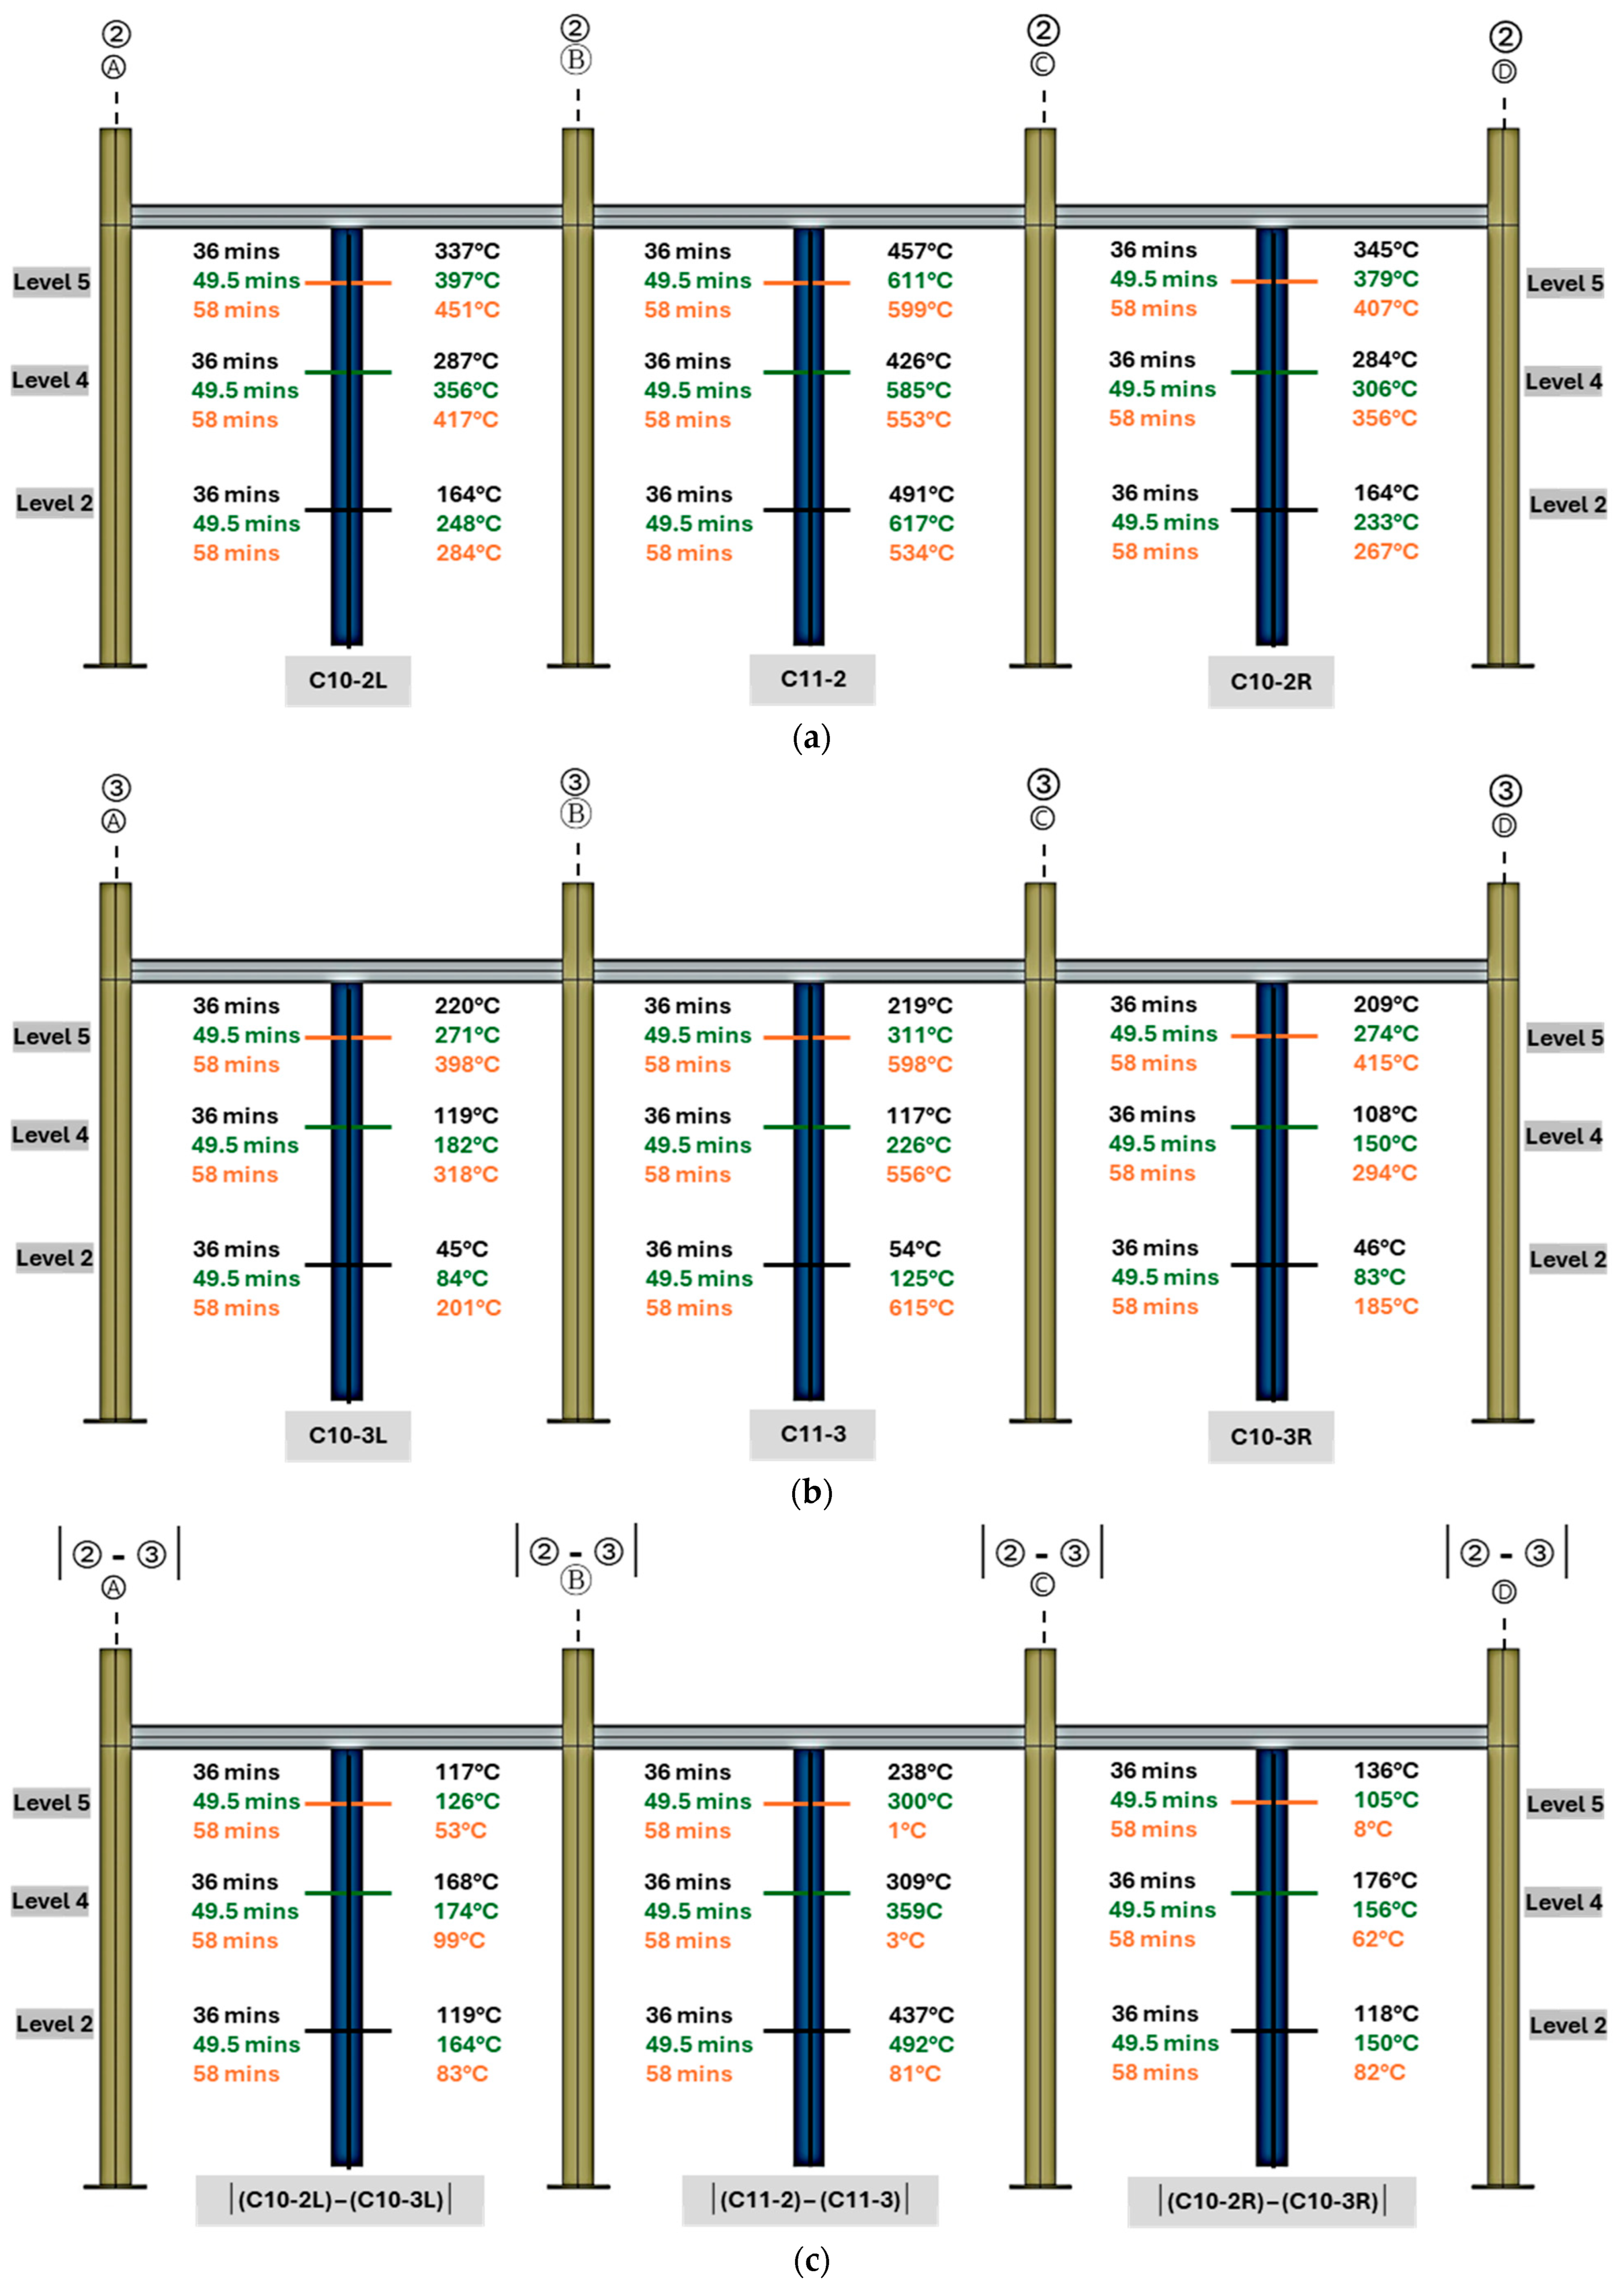
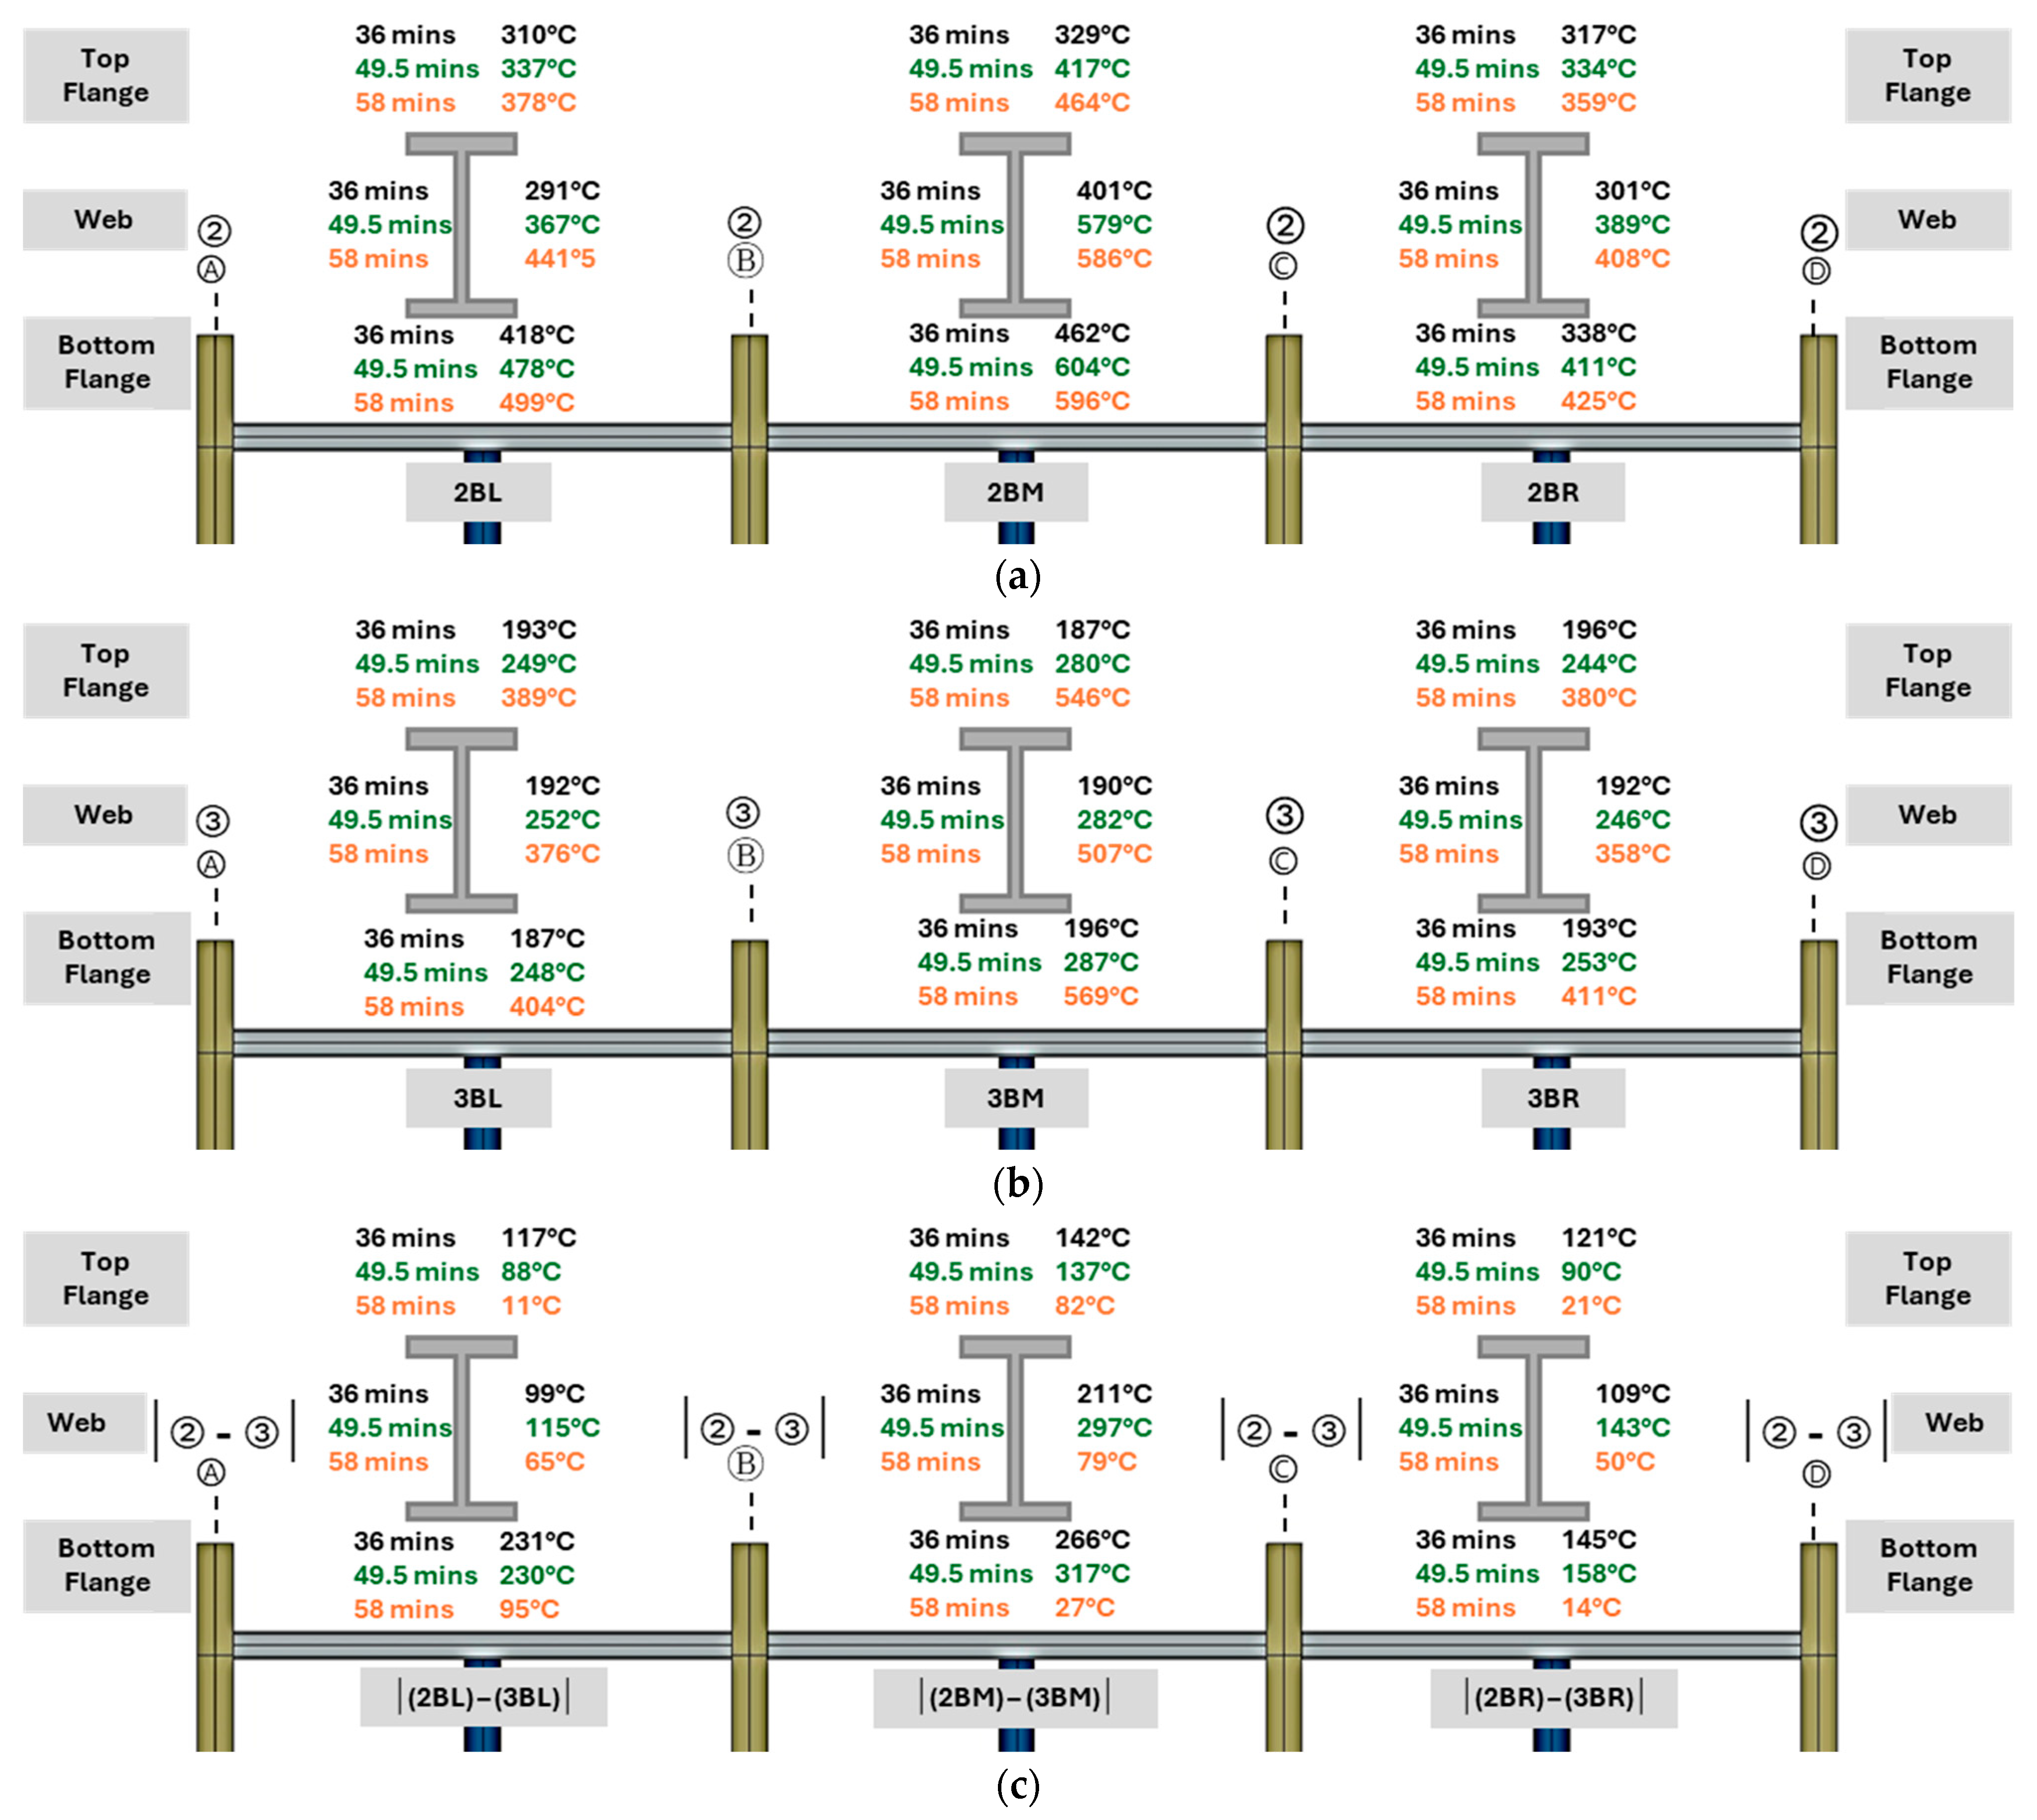
3.5.3. Comparison of Recorded Beam Temperatures

As shown earlier in Figure 9 and Figure 10, beam temperatures remained consistent across all positions for the first 15 min of the test. After 30 min, all beams began to heat up, with those along gridline ② experiencing higher temperatures than those along gridline ③. At 36 min, beams 2BL and 2BM along gridline ② recorded bottom flange temperatures exceeding 415 °C, while 2BR reached around 340 °C. In contrast, beams along gridline ③ remained below 200 °C, indicating a temperature difference of 150–250 °C between gridlines ② and ③. Similar differences were observed in the web and top flanges.
At 49.5 min, with the fire at the centre of the compartment, the bottom flange of 2BM exceeded 600 °C, while 2BL and 2BR were above 400 °C. The web and top flange of 2BM reached 579 °C and 417 °C, respectively, while corresponding parts of 2BL and 2BR were around 350 °C. Beams along gridline ③ still recorded lower temperatures (240–290 °C), resulting in differences of around 300 °C in the web and 140 °C in the top flange between 2BM and 3BM, respectively. For beams outside the fuel bed, these differences were lower for gridlines ② and ③, between 90 °C and 130 °C.
After 58 min, temperatures in beam 3BM along gridline ③ exceeded 500 °C in all sections, while 2BM along gridline ② still retained high temperatures near 600 °C. Beams outside the fuel bed along both gridlines also exceeded 400 °C, with some reaching up to 500 °C. Elevated temperatures were consistently recorded in the web and top flange of beams 3BR and 3BL, both exceeding 350 °C.
In addition to the variations in recorded temperatures between gridlines ② and ③, the temperature differences recorded in beams along each gridline, within and outside the fuel bed, are as follows:
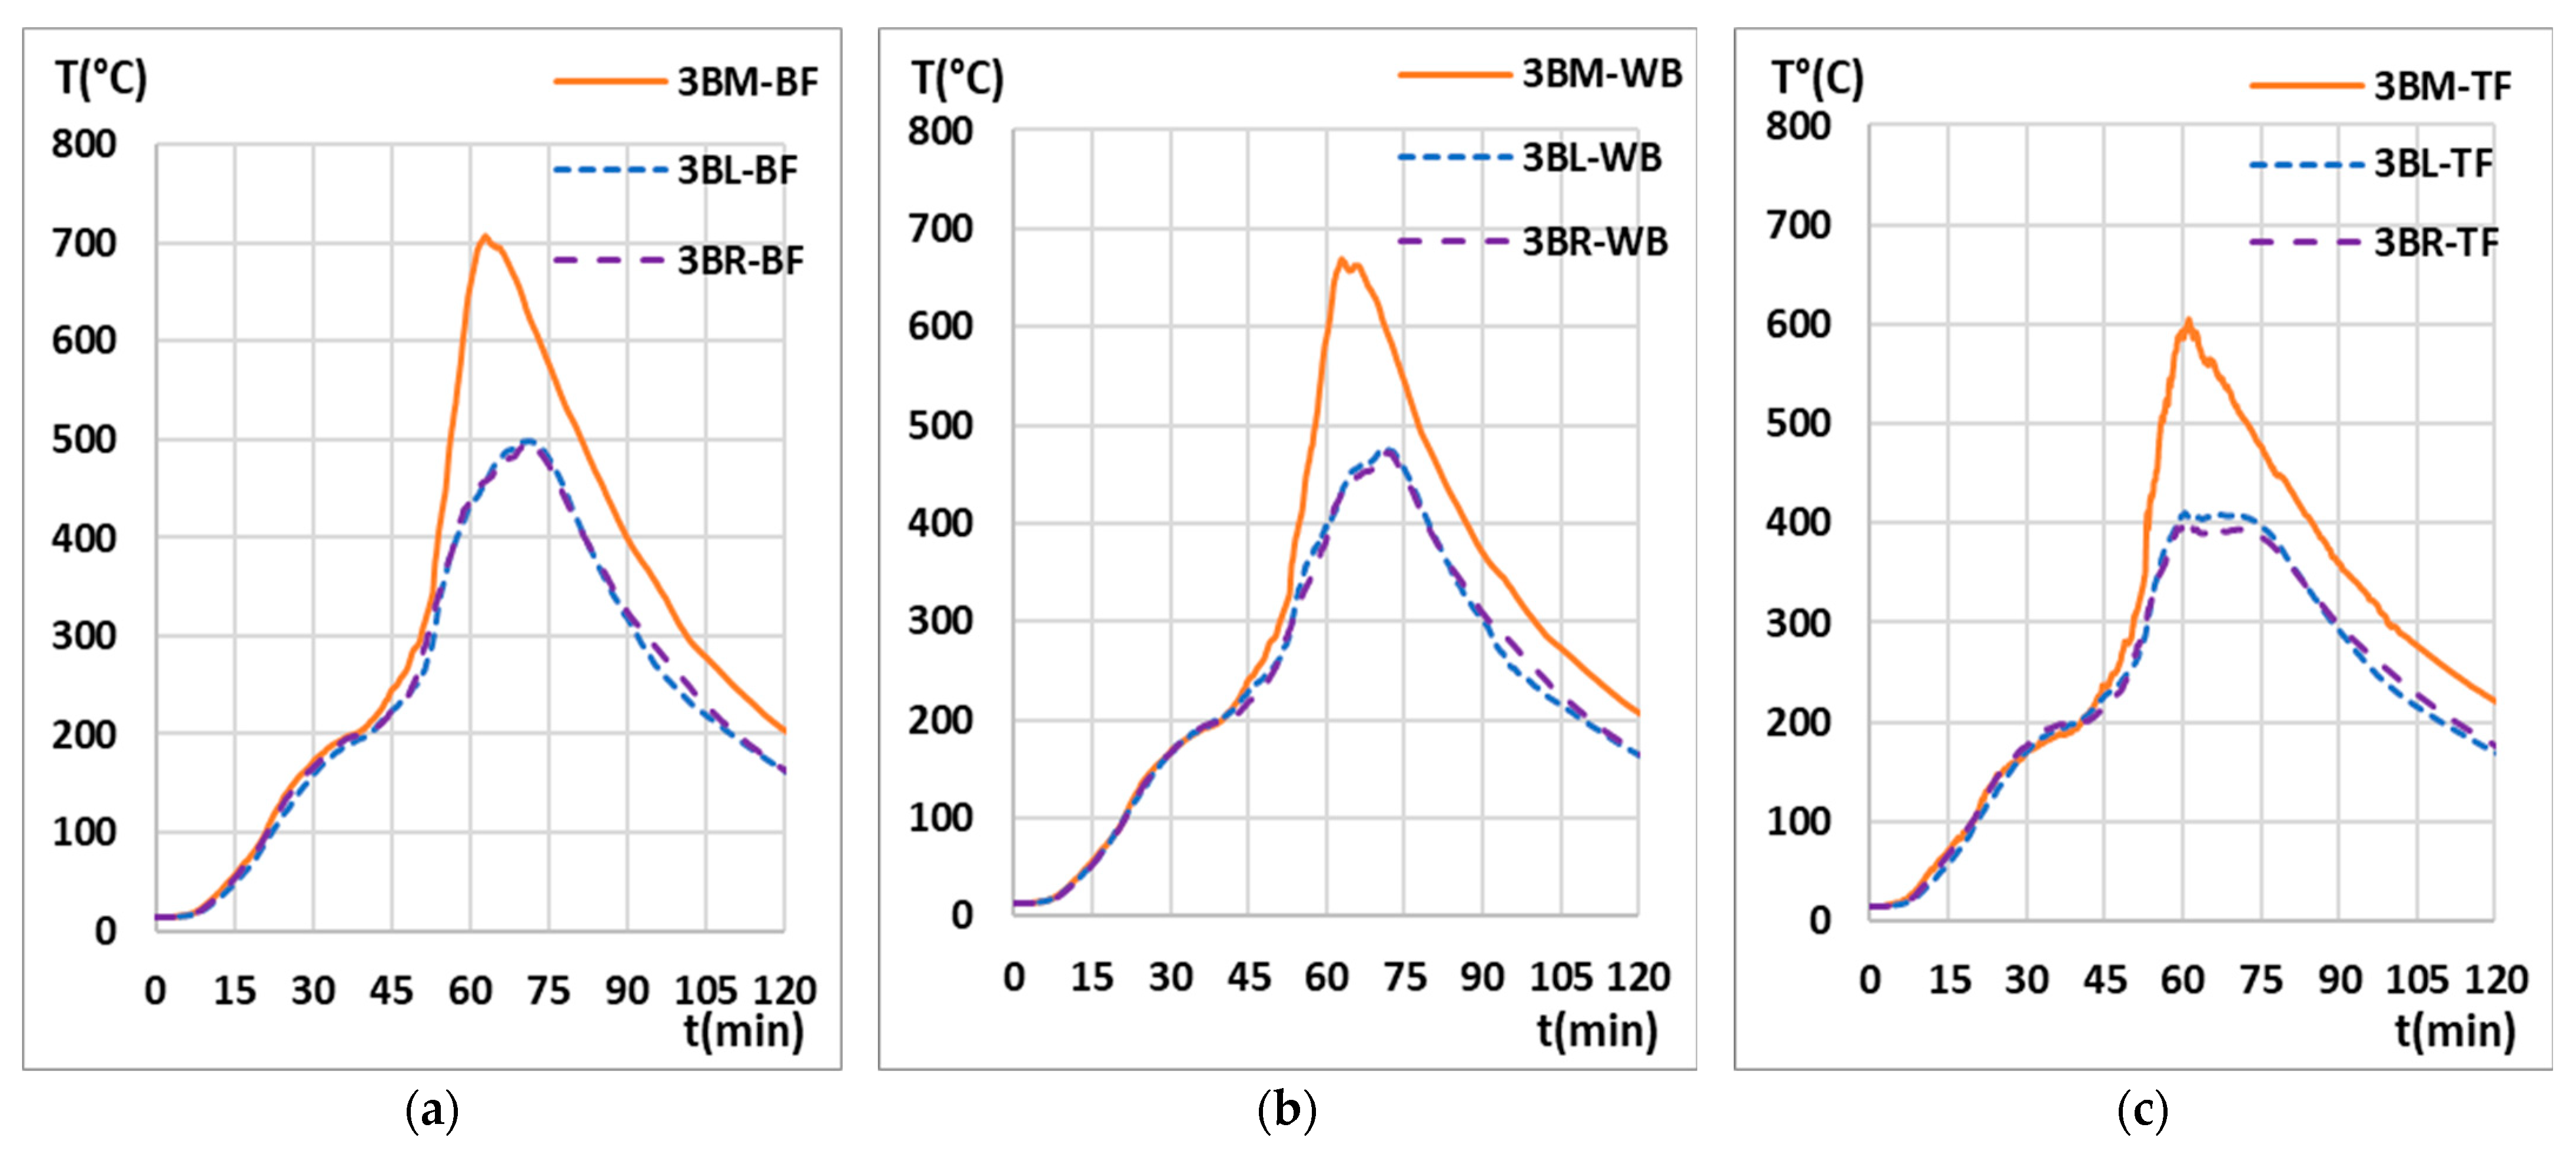
  • Unlike the gas temperatures and the temperatures recorded in columns, the differences recorded in beams within and outside the fuel bed are smaller. After 36 min, the differences recorded in the bottom flange and web are around 100 °C while those recorded in the top flange are very low across gridline ②, as seen in Figure 14a. On the other hand, temperatures recorded in beams across the gridline ③ are very similar after 36 min, as seen in Figure 14b.
  • Similarly to 36 min, temperatures differences also exist between the beams within and outside the fuel bed along gridline ② after 49.5 min. These differences are around 200 °C for the bottom flange and the web while the differences recoded in the top flange are around 90 °C (see Figure 14a). In the case of beams along gridline ③, the recoded temperature differences across the width of the compartment, within and outside the fuel bed, are insignificant, as seen in Figure 14b.
  • Interestingly, after 58 min, the temperature differences recorded within and outside the fuel bed are around 150 °C for beams along gridlines ② and ③.
The variations in recorded beam temperatures suggest that in travelling fires, some beam(s) supported by the column may lose their strength and stiffness after reaching high temperatures. On the other hand, the colder beam(s) supported by the column may still resist the external loads being away from fire. Such transient heating of the structure may induce temperature related load eccentricities in columns which will be additional to any existing load eccentricities. This phenomenon may have an influence on the global response of a structure in fire and must be investigated through future research.

4. Conclusions

The test results report variations in temperatures within the compartment (gas temperatures) across its width and highlight the influence of these variations on the surrounding structural elements (beams and columns). The main conclusions and lessons learnt are as follows:
  • During travelling fires, gas temperatures near the floor stay low, except near and within the fire band, while upper-level temperatures rise consistently even when the fire is farther away. This highlights multiple temperature zones and non-uniform, transient heating.
  • Significant temperature variations exist across the width of the compartment, especially at lower levels, where differences exceed 800 °C for Level 2. At upper levels, Levels 4 and 5, these differences are lower (150–450 °C) but are sustained for longer durations.
  • Peak gas temperatures at lower levels are short-lived and change rapidly, while upper-level peaks are more gradual and sustained, indicating transient yet intense heating at lower levels during travelling fires.
  • Structural elements follow similar trends; columns and beams within the fuel bed experience temperatures 250–350 °C higher than those outside, indicating significant thermal gradients and potential load redistribution.
  • Temperatures around the travelling fire band are significantly higher than in areas farther away; differences of over 650 °C were observed between gridlines ② and ③, demonstrating the impact of travelling fire positioning on structural heating.
  • The implications of travelling fires include inducing localized and transient thermal gradients resulting in material weakening and arbitrary load redistributions ultimately compromising the stability and bearing capacity of the structure.
The findings presented, being related to the width of the compartment and perpendicular to the direction of fire travel, will help with understating the overall impact of travelling fires in large compartments. The interaction between the cooler and hotter parts could influence the global response of structures and the future design approaches/methods. This will help further with optimizing the protection levels of steel structures. These outcomes will also be beneficial for further computational studies and will help with devising methods for the fire design of large structures. It must be noted that travelling fire exposure conditions/scenarios are not currently covered by the building codes, which highlights the importance of such investigations to safeguard buildings and its residents during such fire events.

Author Contributions

Conceptualization, N.A. and A.N.; Validation, N.A.; Formal analysis, N.A.; Investigation, N.A.; Data curation, N.A.; Writing—original draft, N.A.; Writing—review & editing, N.A. and A.N.; Visualization, N.A.; Supervision, A.N.; Project administration, A.N.; Funding acquisition, A.N. All authors have read and agreed to the published version of the manuscript.

Funding

This work was carried out in the frame of the TRAFIR project with funding from the Research Fund for Coal and Steel (grant No. 754198). The partners are ArcelorMittal, Liège University, the University of Edinburgh, RISE Research Institutes of Sweden, and the University of Ulster.

Institutional Review Board Statement

Not applicable.

Informed Consent Statement

Not applicable.

Data Availability Statement

The original contributions presented in this study are included in the article. Further inquiries can be directed to the corresponding author.

Acknowledgments

The authors wish to acknowledge the support of companies Sean Timoney & Sons Ltd., FP McCann Ltd., Saverfield Ltd., and Crossfire Ltd.

Conflicts of Interest

The authors declare no conflict of interest.

References

  1. Engelhardt, M.; Meacham, B.; Kodur, V.; Kirk, A.; Park, H.; Straalen, I.; Maljaars, J.; Weeren, K.; de Feijter, R.; Both, K. Observations from the fire and collapse of the Faculty of Architecture Building, Delft University of Technology. In Structures Congress 2013: Bridging Your Passion with Your Profession—Proceedings of the 2013 Structures Congress; American Society of Civil Engineers: Reston, VA, USA, 2013; pp. 1138–1149. [Google Scholar] [CrossRef]
  2. Fletcher, I.; Borg, A.; Hitchen, N.; Welch, S. Performance of concrete in fire: A review of the state of the art, with a case study of the Windsor Tower fire. In Proceedings of the 4th International Workshop on Structures in Fire (SiF 2006), Aveiro, Portugal, 30 May–1 June 2006; pp. 779–790. [Google Scholar]
  3. Gann, R.G.; Hamins, A.; McGrattan, K.; Nelson, H.E.; Ohlemiller, T.J.; Prasad, K.R.; Pitts, W.M. Reconstruction of the fires and thermal environment in World Trade Center Buildings 1, 2, and 7. Fire Technol. 2012, 49, 679–707. [Google Scholar] [CrossRef]
  4. Mostofi, S.; Baltaci, A.; Akbulut, Y.E.; Okur, F.Y.; Altunişik, A.C. Performance-based fire assessment of a fully automated multi-storey steel parking structure: A computational approach. Case Stud. Therm. Eng. 2024, 60, 104618. [Google Scholar] [CrossRef]
  5. European Committee for Standardization. BS EN 1991-1-2, Eurocode 1—Actions on structures—Part 1–2: General Rules—Structural Fire Design; European Committee for Standardization: Brussels, Belgium, 2009. [Google Scholar]
  6. Kirby, B.R.; Wainman, D.E.; Tomlinson, L.N.; Kay, T.R.; Peacock, B.N. Natural Fires in Large Scale Compartments. In British Steel Technical, Fire Research Station Collaborative Project Report; British Steel Technical Swinden Laboratories: Rotherham, UK, 1994. [Google Scholar]
  7. Hidalgo, J.P.; Cowlard, A.; Abecassis-Empis, C.; Maluk, C.; Majdalani, A.H.; Kahrmann, S.; Hilditch, R.; Krajcovic, M.; Torero, J.L. An experimental study of full-scale open floor plan enclosure fires. Fire Saf. J. 2017, 89, 22–40. [Google Scholar] [CrossRef]
  8. Wald, F.; Jána, T.; Horová, K. Design of Joints to Composite Columns for Improved Fire Robustness: To Demonstration Fire Tests; Česká Technika—Nakladatelství ČVUT: Prague, Czech Republic, 2011. [Google Scholar]
  9. Horová, K.; Jána, T.; Wald, F. Temperature heterogeneity during travelling fire on experimental building. Adv. Eng. Softw. 2013, 62–63, 119–130. [Google Scholar] [CrossRef]
  10. Stern-Gottfried, J.; Rein, G. Travelling fires for structural design—Part I: Literature review. Fire Saf. J. 2012, 54, 74–85. [Google Scholar] [CrossRef]
  11. Dai, X.; Welch, S.; Usmani, A. A critical review of “travelling fire” scenarios for performance-based structural engineering. Fire Saf. J. 2017, 91, 568–578. [Google Scholar] [CrossRef]
  12. Nadjai, A.; Alam, N.; Charlier, M.; Vassart, O.; Welsh, S.; Glorieux, A.; Sjostrom, J. Large scale fire test: The development of a travelling fire in open ventilation conditions and its influence on the surrounding steel structure. Fire Saf. J. 2022, 130, 103575. [Google Scholar] [CrossRef]
  13. Alam, N.; Nadjai, A.; Charlier, M.; Vassart, O.; Welsh, S.; Sjöström, J.; Dia, X.; Dai, X. Large scale travelling fire tests with open ventilation conditions and their effect on the surrounding steel structure—The second fire test. J. Constr. Steel Res. 2022, 188, 107032. [Google Scholar] [CrossRef]
  14. Gamba, A.; Charlier, M.; Franssen, J.M. Propagation tests with uniformly distributed cellulosic fire load. Fire Saf. J. 2020, 117, 103213. [Google Scholar] [CrossRef]
Figure 1. Layout showing the compartment zones, fuel bed, columns, and beams under consideration and positioning of the thermocouple trees.
Fire 08 00244 g001
Figure 2. Details of thermocouples within the fuel bed: (a) in the large thermocouple trees TRL5 and TRL7 and (b) in columns and beams at different levels. (c) A closer view of thermocouples in columns C11-2 and C11-3.
Fire 08 00244 g002
Figure 3. Details of thermocouples outside fuel bed: (a) in the large thermocouple trees and (b) in columns and beams at different levels. (c) A closer view of thermocouples in columns C10-2R, C10-2L, C10-3R, and C10-3L. (d) A closer view of thermocouples in beams.
Fire 08 00244 g003
Figure 4. Fire development and travel: (a) early fire development (6 min); (b) fully developed travelling fire (32 min).
Fire 08 00244 g004
Figure 5. Temperatures in the compartment recorded along gridline ② using TRL5, TRS1, and TRS3: (a) Level 2, (b) Level 4, and (c) Level 5.
Fire 08 00244 g005
Figure 6. Temperatures in the compartment recorded along gridline ③ using TRL7, TRS2, and TRS4: (a) Level 2, (b) Level 4, and (c) Level 5.
Fire 08 00244 g006
Figure 7. Temperatures recorded in the columns across the width of the compartment along gridline ②: (a) Level 2, (b) Level 4, and (c) Level 5.
Fire 08 00244 g007
Figure 8. Temperatures recorded in the columns across the width of the compartment along gridline ③: (a) Level 2, (b) Level 4, and (c) Level 5.
Fire 08 00244 g008
Figure 9. Temperatures recorded in the beams across the width of the compartment, along gridline ②: (a) bottom flange, (b) web, (c) top flange.
Fire 08 00244 g009
Figure 10. Temperatures recorded in the beams across the width of the compartment, along gridline ③: (a) bottom flange, (b) web, (c) top flange.
Fire 08 00244 g010
Figure 11. Positioning of the travelling fire band with respect to the selected time intervals.
Fire 08 00244 g011
Figure 12. Gas temperatures recorded after 36, 49.5, and 58 min during the test: (a) along gridline ② and (b) along gridline ③. (c) Difference between gridlines ② and ③ for respective positions.
Fire 08 00244 g012aFire 08 00244 g012b
Figure 13. Column temperatures recorded after 36, 49.5, and 58 min during the test: (a) along gridline ② and (b) along gridline ③. (c) Difference between gridlines ② and ③ for respective positions.
Fire 08 00244 g013
Figure 14. Temperatures recorded in beams after 36, 49.5, and 58 min during the test: (a) along gridline ② and (b) along gridline ③. (c) Difference between gridlines ② and ③ for respective positions.
Fire 08 00244 g014
Table 1. A brief of the travelling fire tests conducted during TRAFIR project.
Test 1Opening factor, O = 0.316 [m1/2]
Test 2Opening factor, O = 0.073 [m1/2]
Test 3Opening factor, O = 0.024 [m1/2]
Disclaimer/Publisher’s Note: The statements, opinions and data contained in all publications are solely those of the individual author(s) and contributor(s) and not of MDPI and/or the editor(s). MDPI and/or the editor(s) disclaim responsibility for any injury to people or property resulting from any ideas, methods, instructions or products referred to in the content.

