Abstract
This study explores the flame retardancy and structural behavior of silicone foam composites filled with halogen-free flame retardants, aiming to evaluate their feasibility for use in mass transportation applications. Silicone foam specimens incorporating magnesium hydroxide and expandable graphite were prepared and compared with unfilled silicone foam under both static and dynamic loading conditions. Uniaxial compression and simple shear tests were conducted to assess mechanical behavior, and a second-order Ogden model was employed to represent hyperelasticity in the finite element analysis. Fire performance was evaluated using cone calorimeter tests in accordance with ISO 5660-1. The results showed a 53.6% reduction in peak heat release rate (PHRR) and a 48.1% decrease in MARHE upon the addition of flame retardants, satisfying relevant fire safety standards. Although the addition of fillers increased the compressive stiffness and reduced rebound resilience, static comfort indices remained within acceptable ranges. These findings confirm that halogen-free filled silicone foams exhibit significantly enhanced fire retardancy while maintaining sufficient mechanical integrity and seating comfort, demonstrating their potential as eco-friendly alternatives to conventional polyurethane foams in large-scale transportation applications.
1. Introduction
Advancements in modern technology have resulted in the development of high-speed, large-scale transportation systems, such as railway vehicles, and these types of systems are serving rapidly increasing numbers of passengers. In this context, there is a need for the research into interior materials in the cabin that guarantee both passenger convenience with excellent ride comfort—particularly through the insulation of any vibrations that may occur in regular operations—and passenger safety, with high flame retardancy in the face of emergencies, such as fire. Polyurethane foam, which is currently used as a cushion material for chairs in the cabins of transportation systems, can be used to economically achieve ride comfort because it is inexpensive and has soft elasticity. However, its flame retardancy is very low, so it has low fire safety [1,2,3,4]. Therefore, the present study investigates silicone foam, which is a similar polymeric material with greater fire safety than polyurethane foam [5].
Silicone foam is a representative eco-friendly material that has excellent fire resistance as well as flame retardancy. It also has excellent compression resistance, regardless of the temperature, in addition to strength that is superior to that of general organic rubber, which is expected to lead to an increase in service life. Existing organic foams have added halogen-based flame-retardant fillers—which are controversial due to their reported harmfulness—for flame retardancy [6,7]. However, as environmental regulations around the EU, such as RoHS and WEEE, continue strengthening and spreading, there is a need for a new direction for flame retardants. The direction of this research should be to not only prevent the propagation of flames, but also to have the properties of low salt, low toxicity, eco-friendliness, and human safety [8,9]. To obtain a result in this direction, the present study enhanced the flame retardancy of silicone foam by adding an environmentally friendly flame-retardant filler, rather than a halogen-based one, to address environmental problems and provide human safety. In addition, due to the results of a cone calorimeter test confirming the flame-retardant performance of the manufactured silicone foam, it is expected to satisfy fire safety standards, as its excellent fire safety value has been recognized.
This study employed additive-type flame retardants in the fabrication of silicone foam. Two types of inorganic flame retardants were selected as fillers: (1) non-toxic compounds that suppress smoke generation, and (2) expandable agents that release water and swell at elevated temperatures to block heat and oxygen [10]. However, the addition of a flame-retardant filler to the silicone foam causes the compressive strength to increase, and the foam becomes hard, which may reduce comfort [11,12]. Therefore, mechanical performance analysis was conducted by analyzing the static and dynamic characteristics of the silicone foam.
A uniaxial compression test was performed to analyze the static properties of the silicone foam. Through this test, static comfort indices, such as hardness, Initial Hardness Factor (IHF), Modulus Irregularity Factor (MIF), Sag Factor, and Hysteresis Loss, were derived to evaluate the static comfort felt by the human body while sitting on the material [13,14,15,16,17]. These static comfort indices are the values specified in “ASTM D 3574-03” and are used to determine the static comfort of seat foam according to each compression strain range during the process of compressing silicone foam [18].
Silicone foam is a hyperelastic material; unlike elastic materials, such as metal and wood, the change in stress according to the strain rate is nonlinear in hyperelastic materials. When performing finite element analysis to analyze the static properties of hyperelastic materials, it was necessary to conduct compression and shear tests, so a simple shear test was performed, and nonlinear finite element analysis was performed using the results of these two tests [19,20,21]. The analysis models used in simulations with hyperelastic materials include the Neo–Hookean model, the Mooney–Rivlin model, the Ogden model, the Yeoh model, and the Arruda–Boyce model [22]. Briody et al. (2011, 2012) [23,24] constructed a material model through tests on soft polyurethane foam for application to wheelchair cushions and confirmed that the analysis results using the model were in good agreement with the test results. In addition, Ju et al. (2015) performed compression tests on three polyurethane foam specimens with different densities and compared the results with the analysis results using the Ogden, Mooney–Rivlin, and Neo–Hookean models, and reported that the numerical analysis model that best predicted their test results was the Ogden model [23,24,25,26]. In this study, the Ogden second-order model, which was confirmed to be more consistent with the test data when considering both compression and shear test data, was utilized. The dynamic characteristics of the seat were analyzed to consider the dynamic comfort felt by the human body due to the up-and-down movement transmitted through one’s body during driving. The impact on the human body was evaluated by measuring the vibration transmissibility and resonance frequency of the seat foam, which are the most widely used dynamic comfort evaluation measures [13,27,28].
In this study, silicone foam was prepared by adding an eco-friendly flame-retardant filler, and static and dynamic analyses were conducted to assess its utility as a cushion material for large transportation devices. To analyze the static characteristics, a static comfort index was derived, and a second-order Ogden model was used to analyze silicone foam, which is a hyperelastic material. Using the obtained compression and shear test results, a finite element analysis was performed using the commercial software Abaqus 2021. The dynamic characteristics were acquired by conducting a transmission rate test to determine the natural frequency and maximum transmission rate of the silicone foam.
To elucidate the mechanical performance of the silicone foam used in this study, a mechanical performance analysis has been conducted, and the results of this analysis will be presented as grounds for the use of this flame-retardant silicone foam as a cushion material for large-sized transportation devices from the perspective of riding comfort.
2. Materials and Methods
2.1. Materials
The silicone foam that was the target material to be analyzed in this study was manufactured and compared with the following two specimens: Specimen A, which is a silicone foam to which no flame retardant has been added, and specimen B, which is a silicone foam to which an inorganic flame retardant and an expandable flame retardant have been added. The manufacturing process for these foams is as follows: The foam manufacturing process divides the compound into A and B parts. Part A was prepared by adding Hydride-terminated polydimethylsiloxane (H-PDMS), Isocyanate, and Polyol using a silicone foam manufacturing process without adding any flame retardant. In part B, magnesium hydroxide (MDH), an inorganic flame retardant, and expandable graphite, an expandable flame retardant, were added. Magnesium hydroxide (MDH) is a non-halogen inorganic flame retardant that decomposes at approximately 330 °C and releases , which absorbs heat and suppresses the flame in case of fire. Additionally, MgO generated after decomposition forms an insulating layer, blocking the inflow of heat and oxygen. Expandable graphite is also a non-halogen flame retardant that begins to expand at 220 °C when heated, forming a porous carbon layer that blocks the inflow of heat and oxygen and acts as a mechanical barrier. MDH and expandable graphite are key additives that improve the flame retardancy of the specimen, but there is a problem that the mechanical strength of the silicone foam may be reduced if the amount added is excessive [12,29,30,31]. Thus, liquid silicone rubber, siloxane oil having a silanol group (OH-PDMS, Hydroxyl-terminated polydimethylsiloxane) at both ends, and a platinum-based catalyst were added, while a vinyl group (Vinyl-PDMS, Vinyl-terminated polydimethylsiloxane) was also added to the addition-type curing reaction to reinforce the mechanical strength of the silicone foam. And we also added a physical blowing agent () to Foam B to make it have a low specific gravity despite the addition of various additives, and manufactured it to increase the size of the micro-unit cells and make the cell wall thinner. Additionally, a platinum-based catalyst was used to induce the Si-H group reaction, and the foaming condition was 100 °C for 30 min. Accordingly, the apparent densities of Foams A and B within the same size could be matched, and therefore the A and B parts were foamed at a weight ratio of 1:1. Table 1 lists the mixing ratio of the two specimens used in this experiment, and Figure 1 shows the external shape of each specimen.

Table 1.
Specimen production mixing ratio (unit: phr).
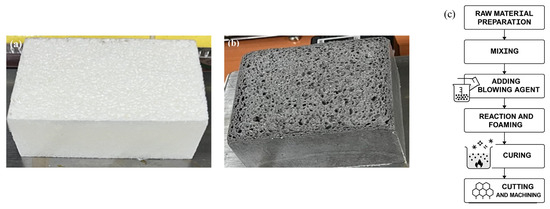
Figure 1.
Schematics of (a) Foam A, (b) Foam B, and (c) foam manufacturing process.
2.2. Flame-Retardant Characteristics
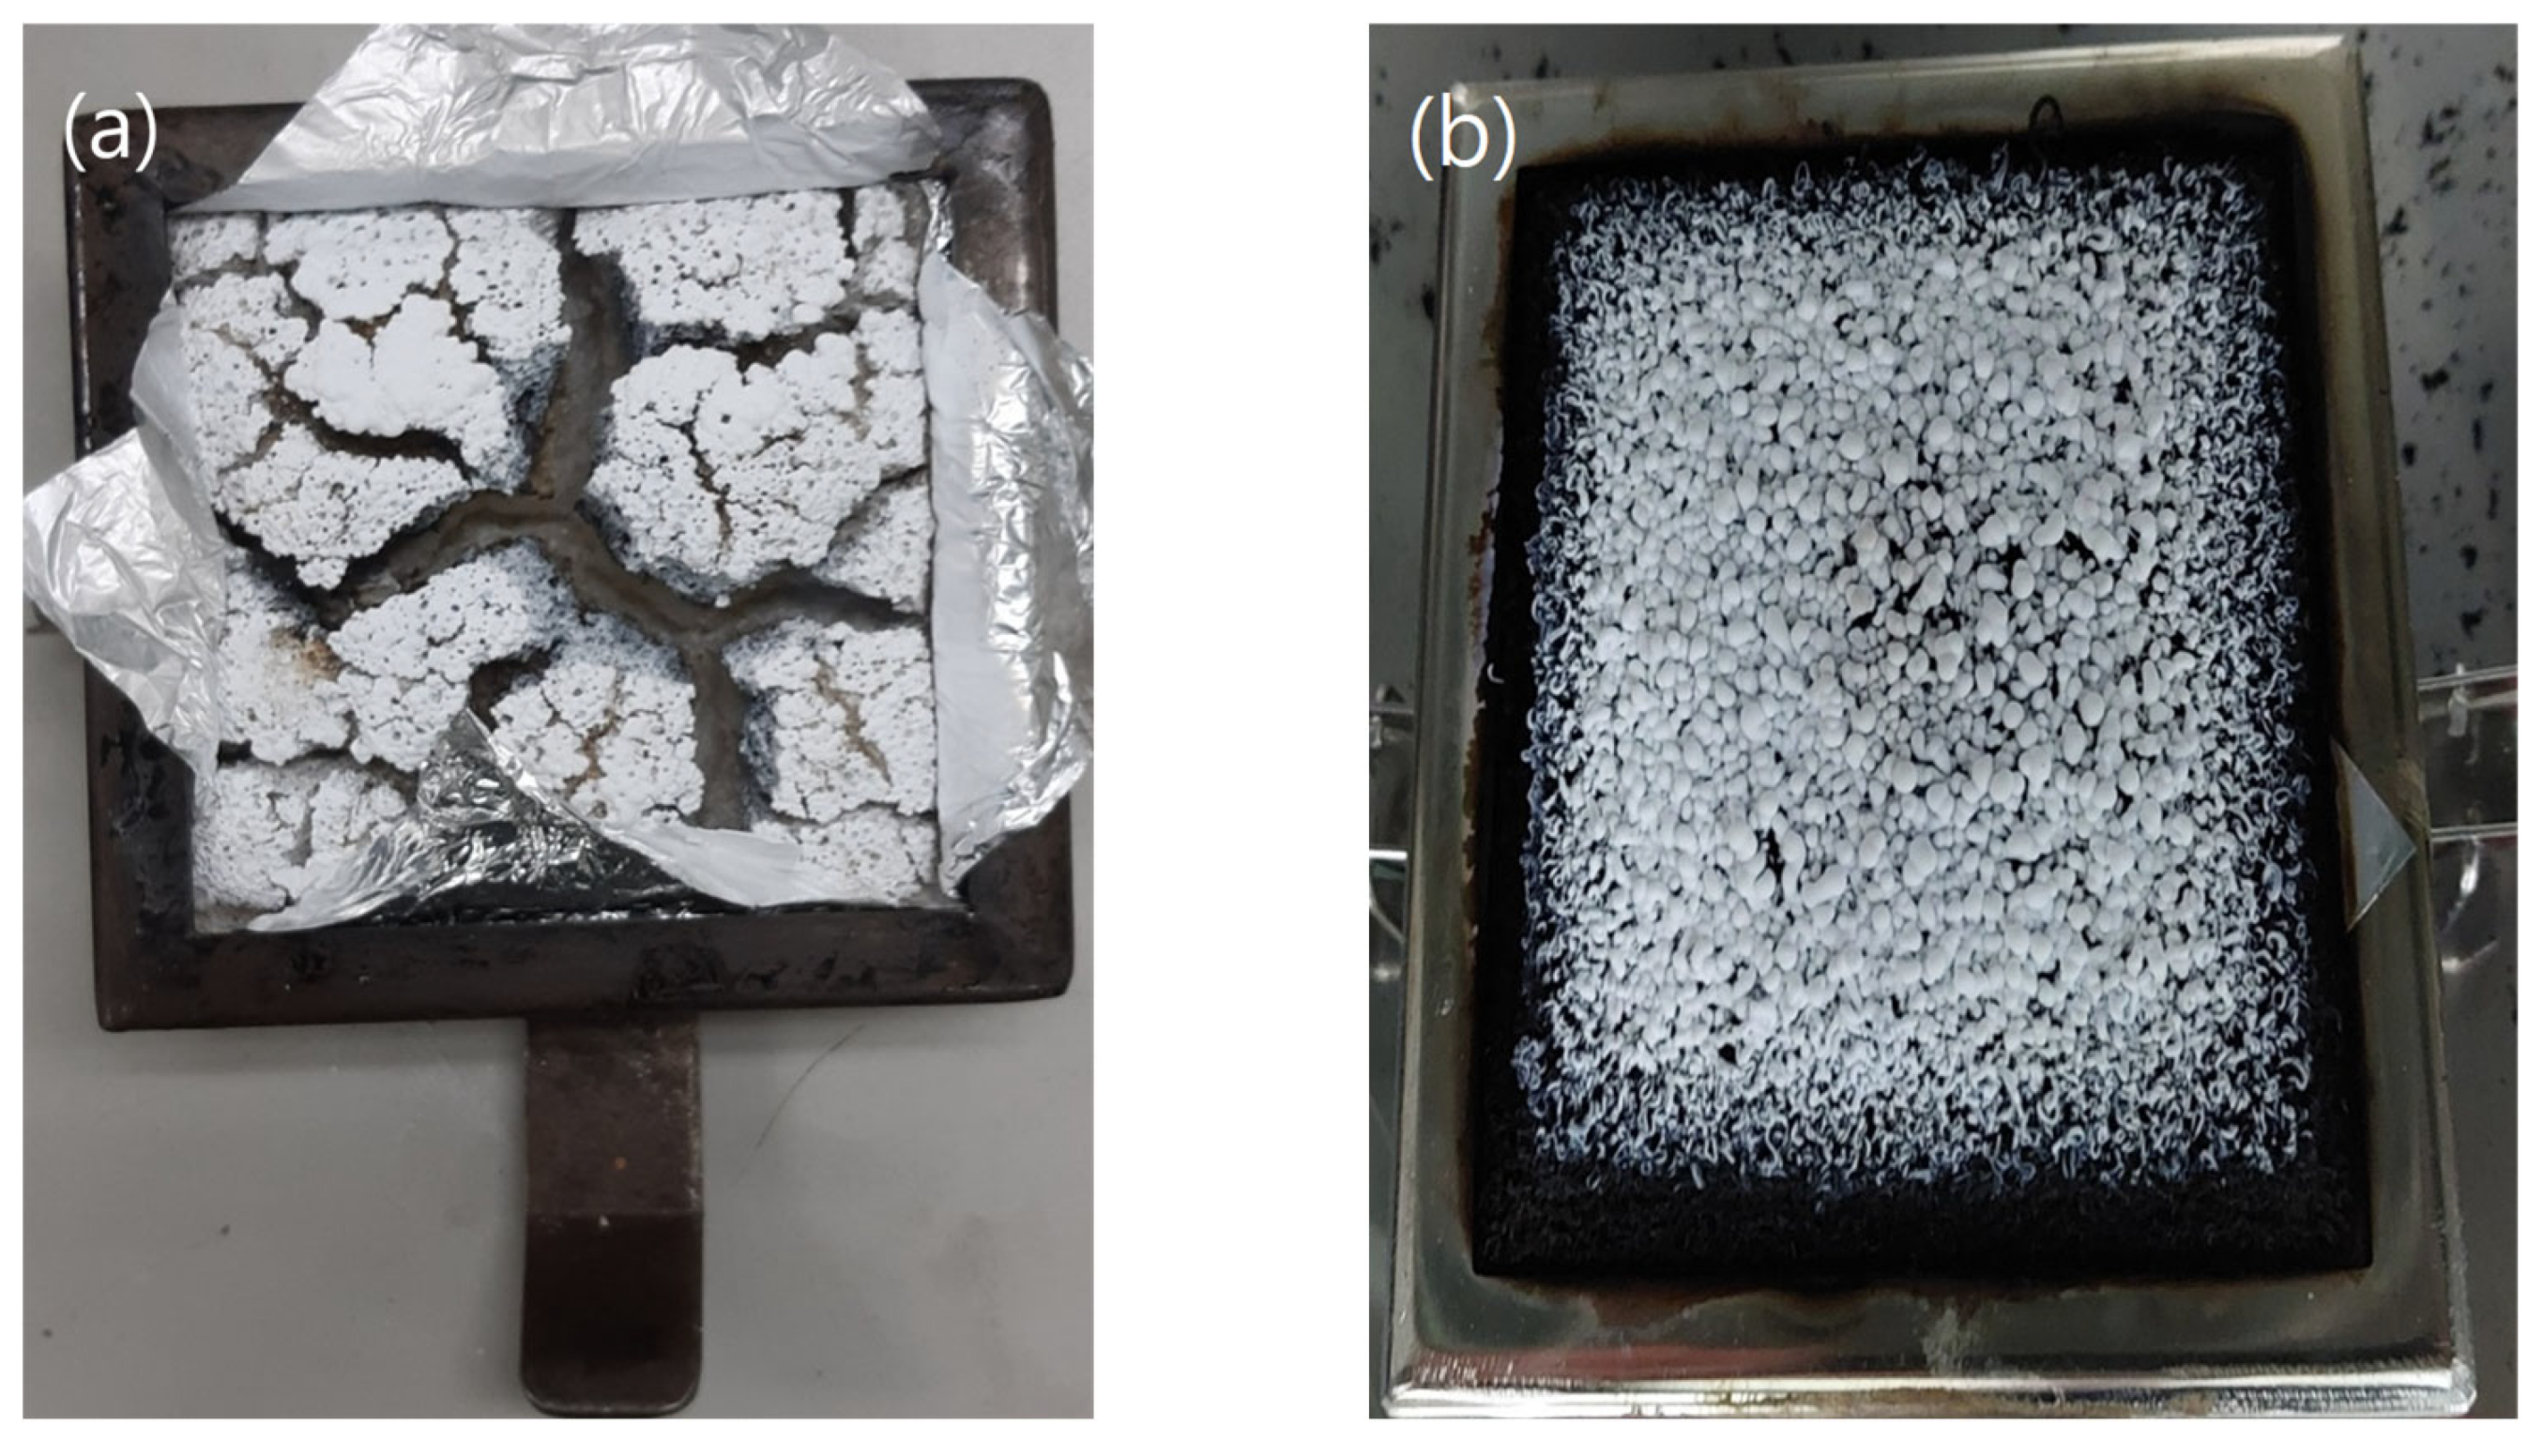
To compare and evaluate the flame-retardant properties of the silicone foam that was prepared by adding two flame retardants with those of the silicone foam that was prepared without the addition of a flame retardant, a cone calorimeter experiment was conducted to examine the two specimens. In accordance with ISO 5660-1:2015 “Heat Release Rate (HRR) (Cone Calorimeter Method) and smoke production rate (Dynamic Measurement)” [32], the calorific value was measured at 25 kW/ radiant heat using a cone calorimeter tester (FTT, Derby, UK). Figure 2 shows the shape of specimens A and B after the cone calorimeter test.
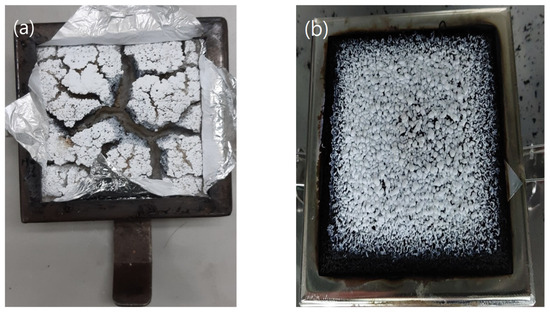
Figure 2.
Schematics of foams after cone calorimeter evaluation under a radiation intensity of : (a) Foam A and (b) Foam B.
2.3. Static Characteristics
2.3.1. Uniaxial Compression Test
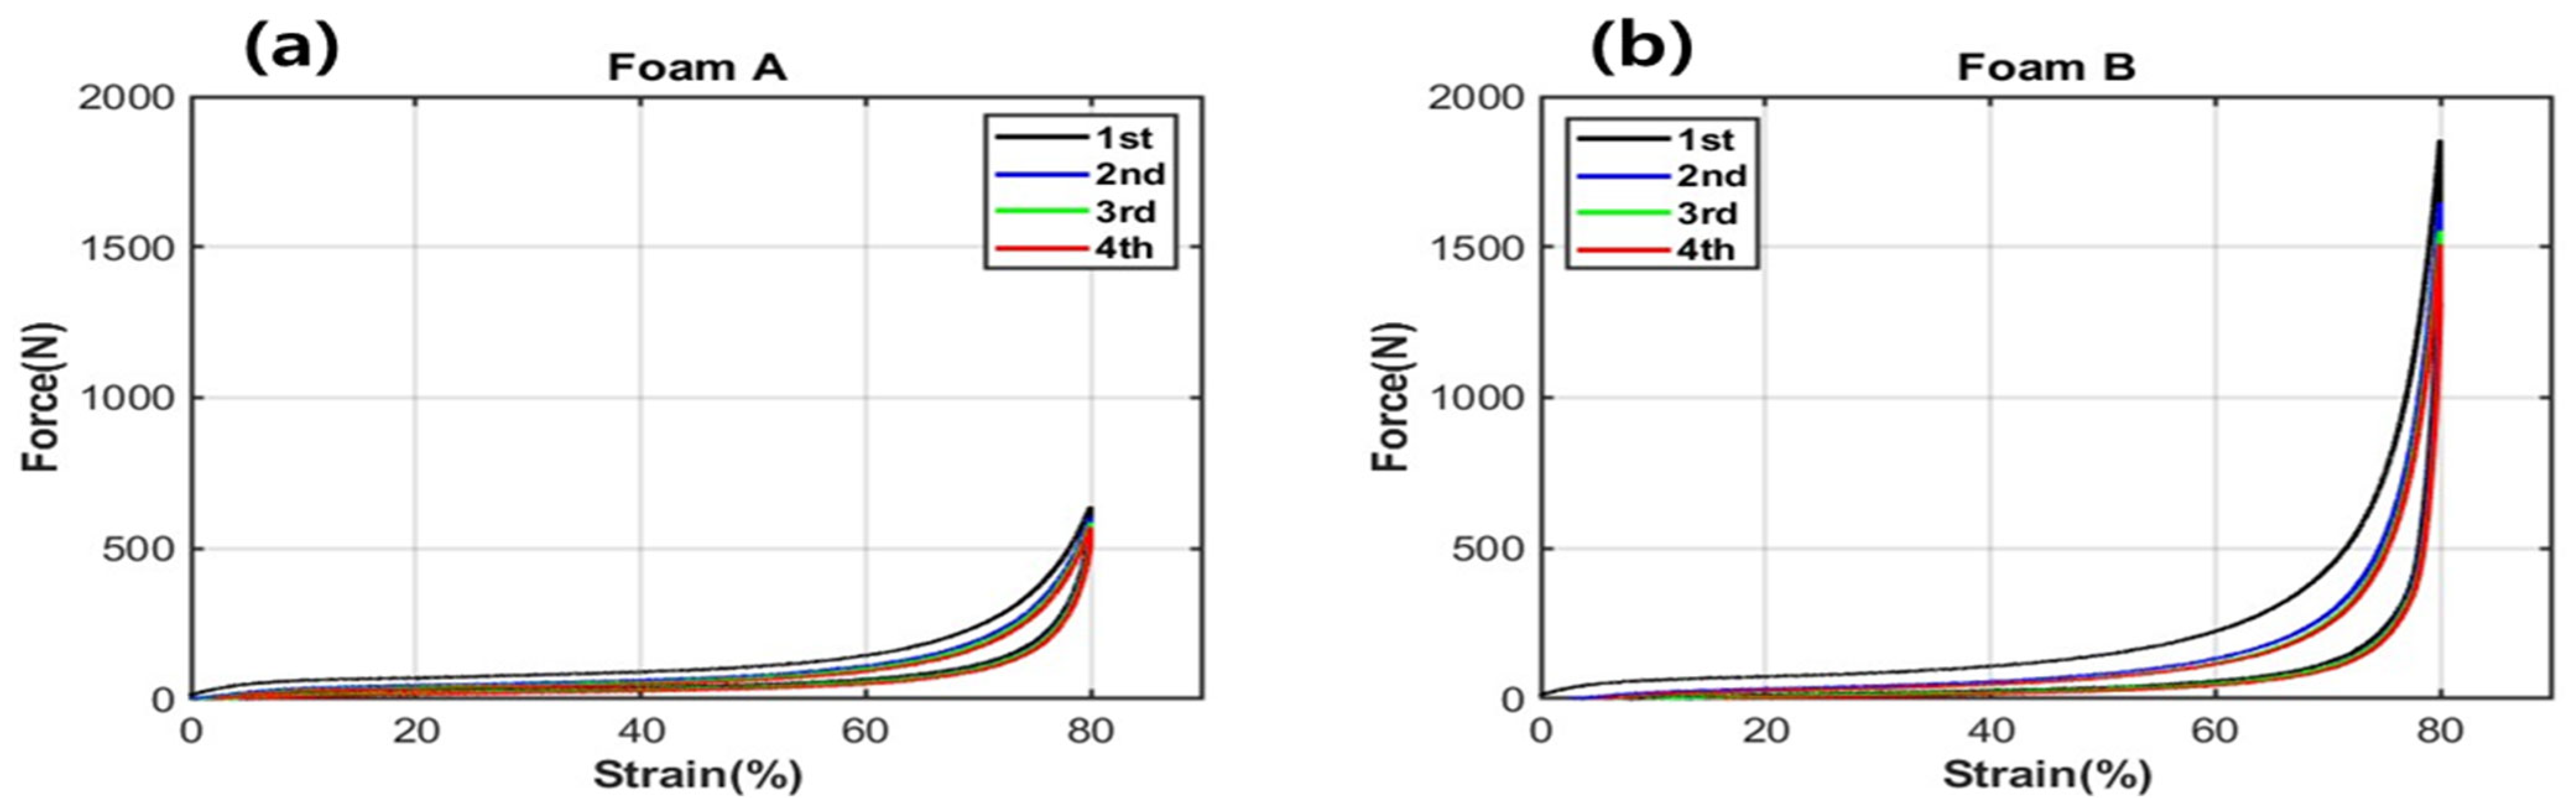
The uniaxial compression test was conducted using a universal testing machine (MTS 810, MTS Systems Corporation 14000 Technology Drive, Eden Prairie, MN 55344-2290, USA) according to KS M ISO 3386-2: 2013 “Methods for Measuring Compressive Stress-Strain Characteristics of Soft Foamed Polymer Materials” [33]. The size of specimens A and B was 100 × 100 × 50 (mm), and the test speed was 5 mm/min. At this time, to avoid the Mullins effect, which is a phenomenon wherein the polymer material is irreversibly softened when repeated displacement or load is applied, compression and load removal were repeated three times up to 80% of the specimen thickness at the same speed. The data from the fourth repetition were used.
2.3.2. Simple Shear Test
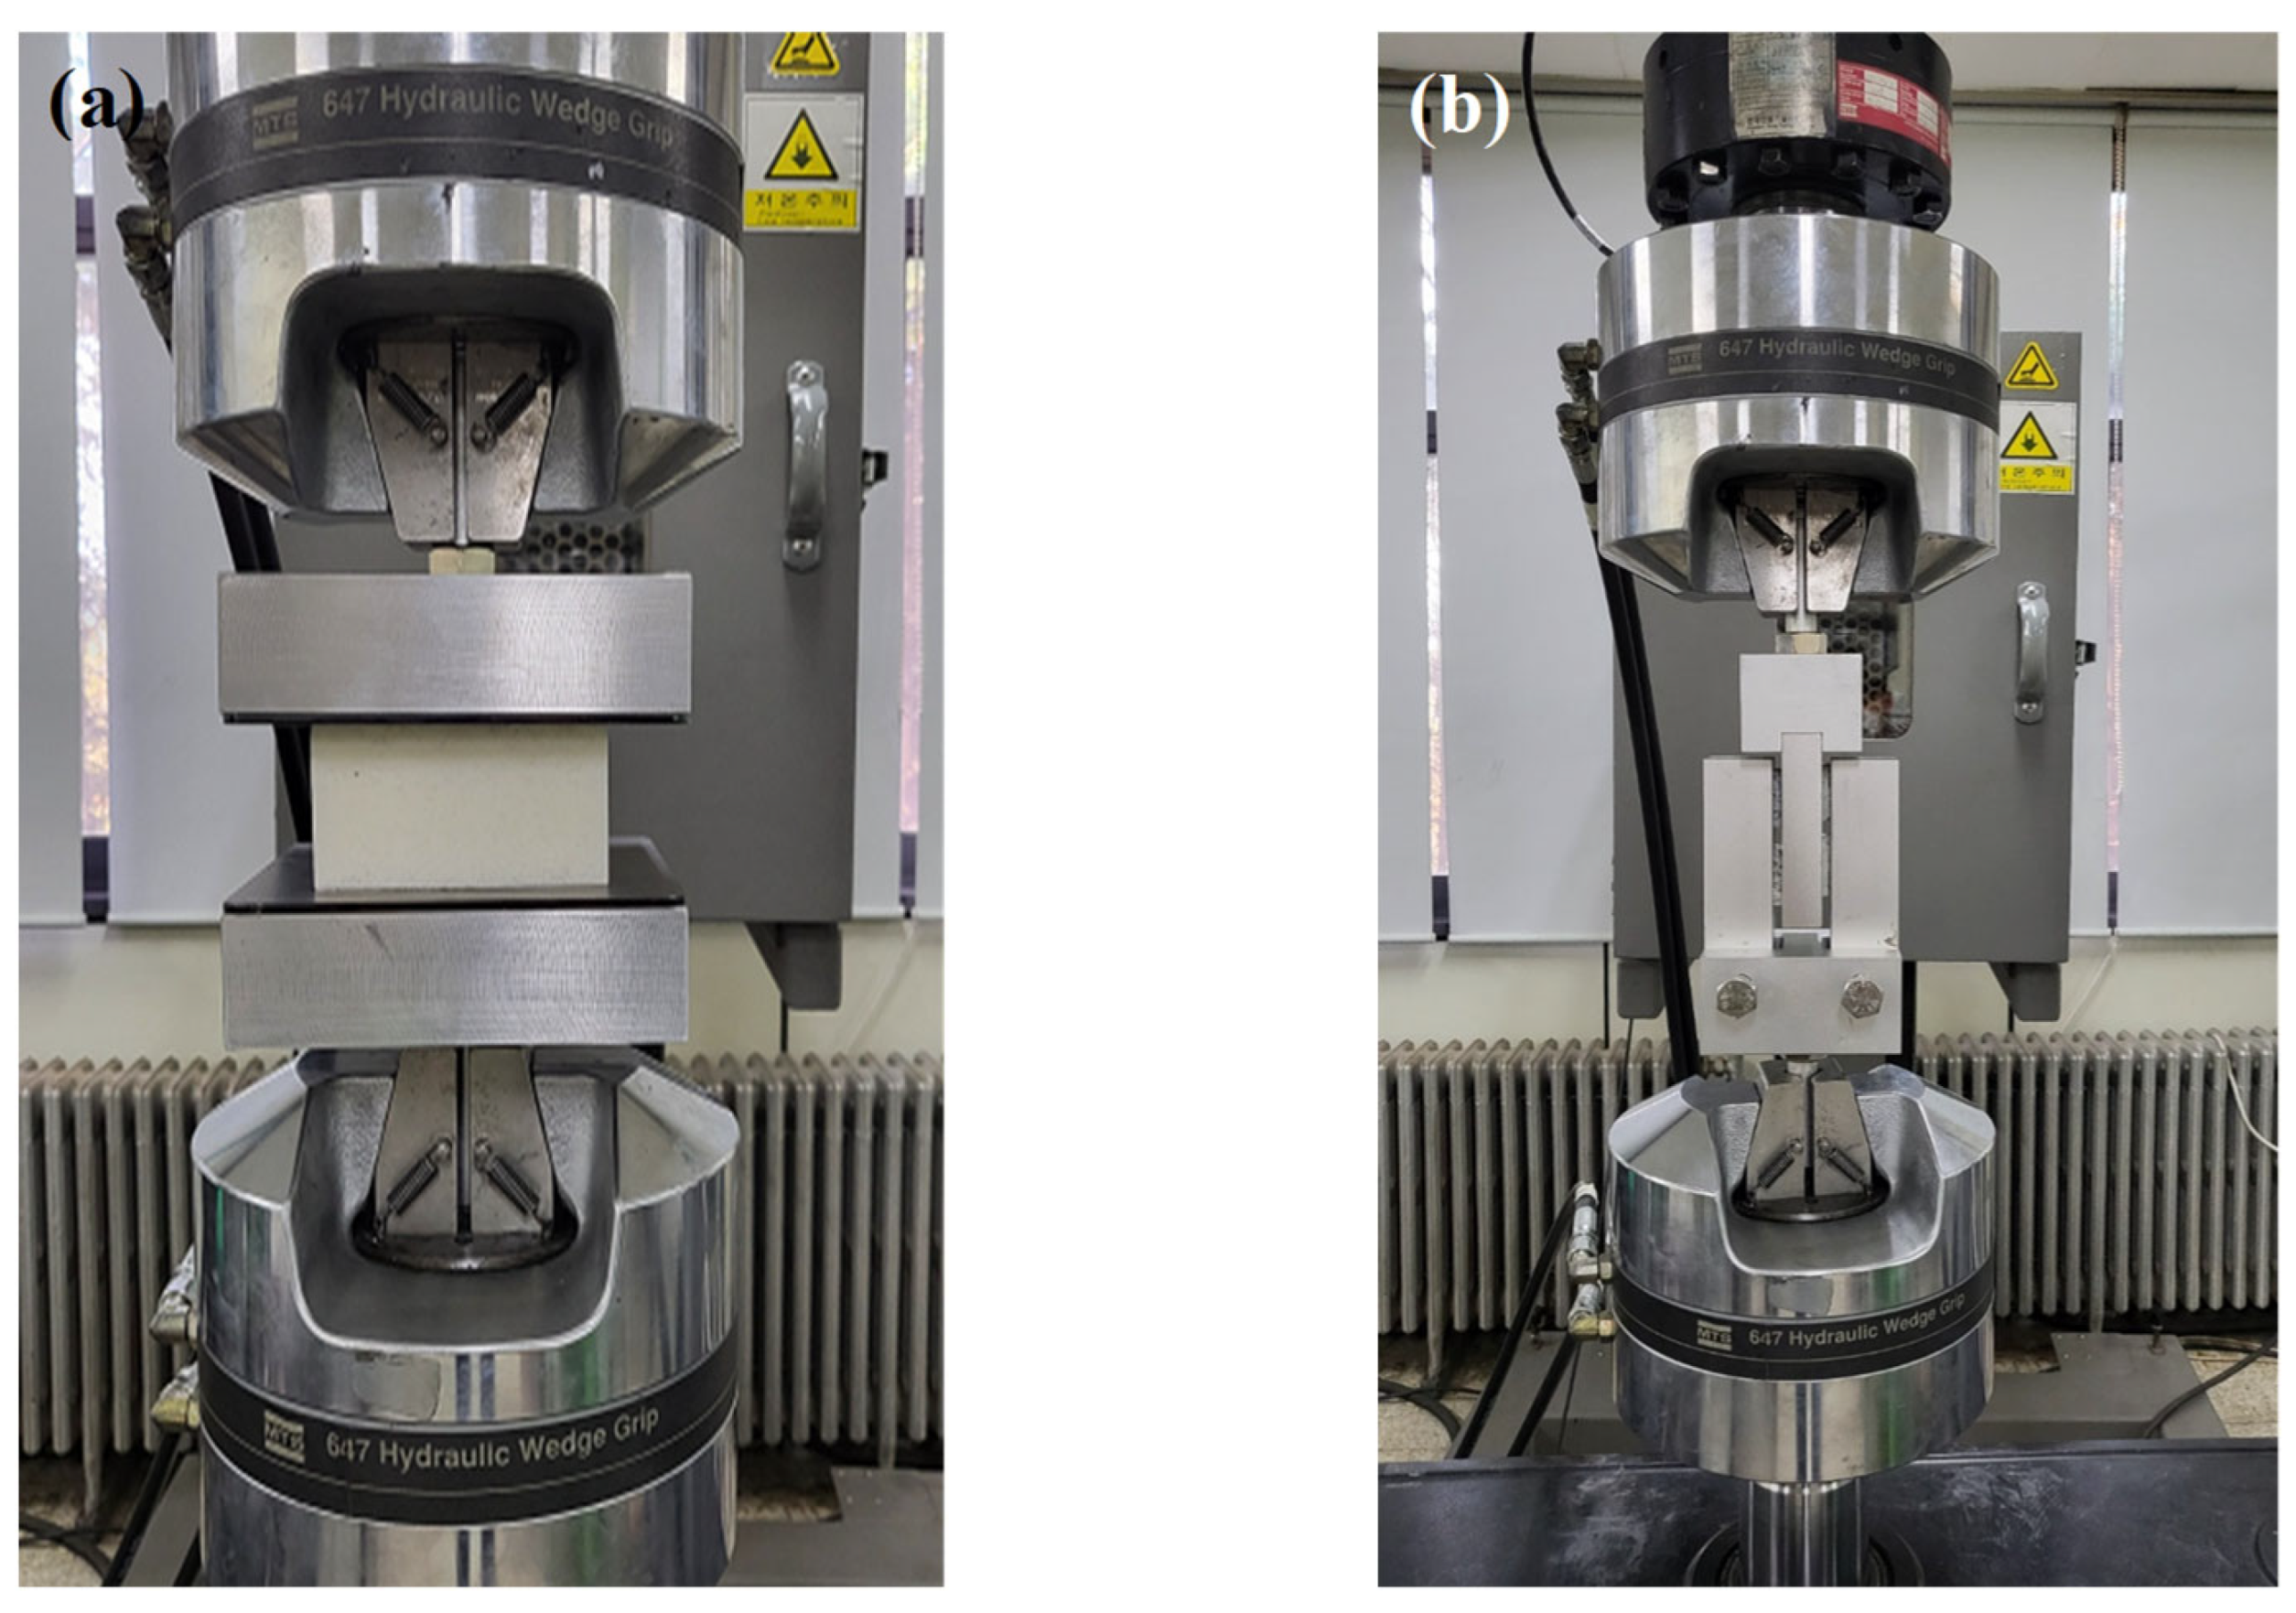
The simple shear test was conducted according to KS M ISO 1827: 2014 “Vulcanized or thermoplastic rubber—Measurement of adhesion or shear modulus to a hard plate” [34] (MTS 810). The size of specimens A and B was 30 × 25 × 5 (mm), and the test speed was 4 mm/min. To measure the maximum shear strength of the specimen, data until fracture of the specimen occurred were used. Figure 3 shows a picture depicting the setups of the uniaxial compression test and the simple shear test.

Figure 3.
Schematics of (a) uniaxial compression test; (b) simple shear test.
2.4. Dynamic Characteristics
Transmissibility Test
Dynamic characteristics, which are some of the conditions to be considered when manufacturing railway vehicle seats, are as important as static characteristics. In this study, to evaluate the dynamic characteristics of these vehicle seats, the vibration sensitivity and transmission characteristics were analyzed using a transmission rate test to obtain the natural frequency and maximum transmission rate between the vehicle and the human body.
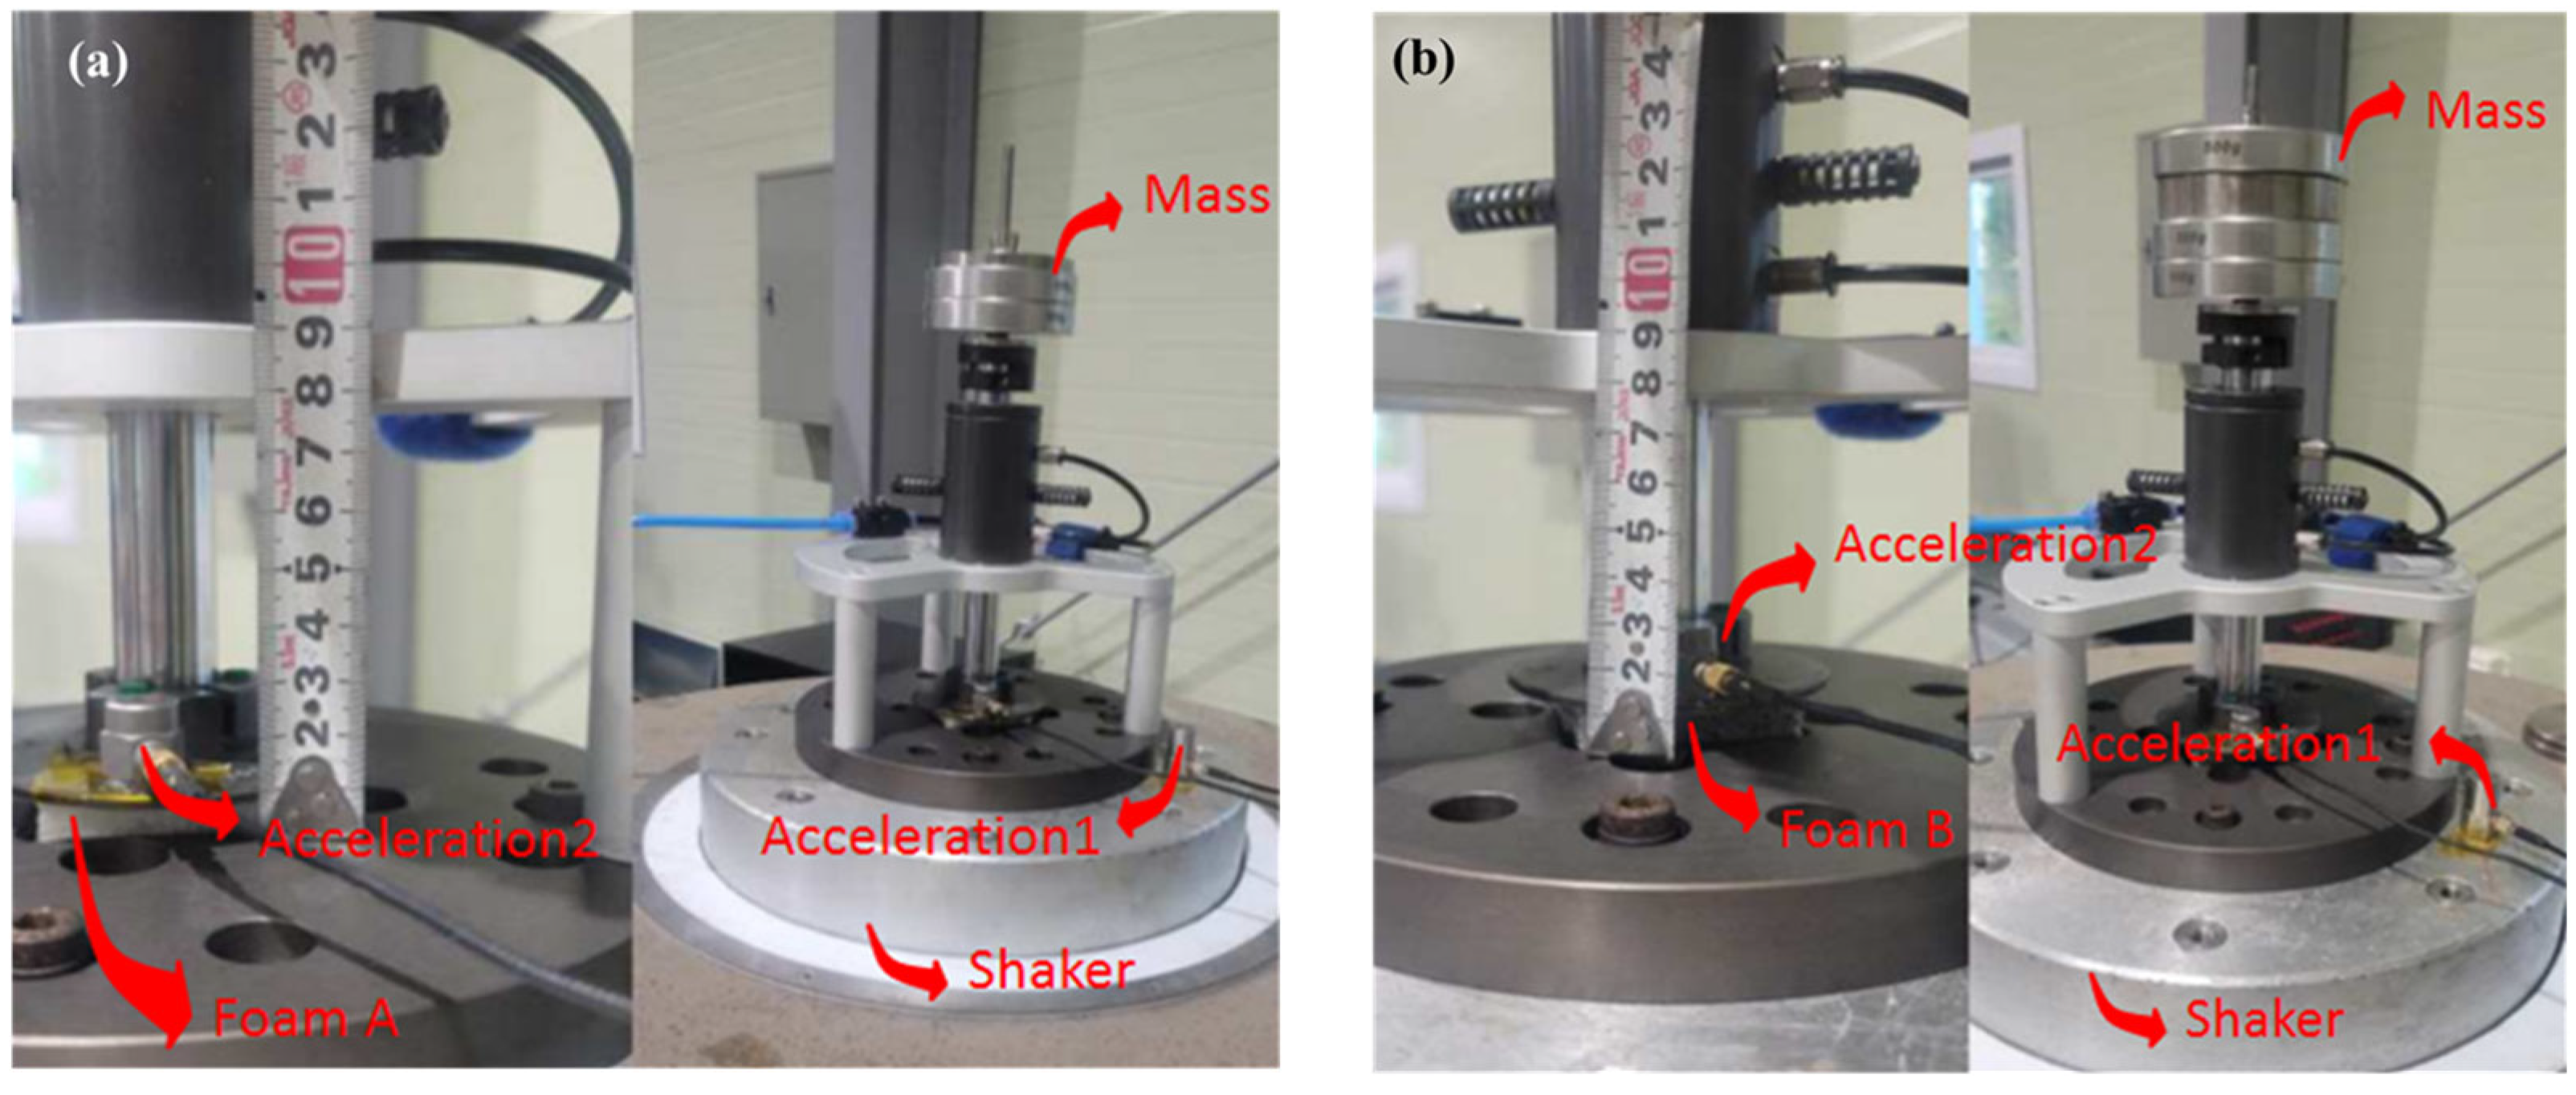
Figure 4 shows a schematic diagram of the vibration transmittance test for the dynamic evaluation of the seat. To calculate the vibration transmittance of the specimen, the vibration (Input) generated from the shaker (Shaker, G25-210N, Shinken, Tokyo, Japan) passed through the specimen (Sample), and the response (Output) transmitted was measured by an accelerometer (Accelerometer, B&K, 4513B-001, B&K Sound & Vibration Measurement A/S, Nærum, Denmark). The electromagnetic vibration tester is generally not well controlled in the region of 2 Hz or less; considering that this is the vibration of a railway vehicle, the appropriate frequency range was set to 2–40 Hz. This experiment was conducted according to the Sine Sweep method with an excitation speed of 2 octave/min and an excitation force of 0.1 g. Moreover, the size of the specimen was 50 × 50 × 25 (mm) for both A and B. Figure 5 shows the process of testing after mounting a weight on the shaft at the top of the jig to provide an appropriate load to the specimen. At this time, the values of mass used were set to 1.6 kg and 1.9 kg under the condition of pressing 40% of the specimen height in consideration of the material properties of specimens A and B, respectively.
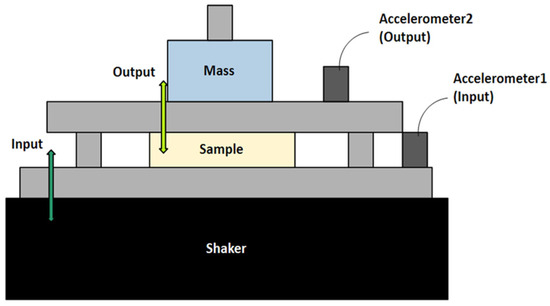
Figure 4.
Schematic diagram of the transmissibility test.

Figure 5.
Schematics of (a) installation of mass for transmissibility test of Foam A and (b) installation of mass for transmissibility test of Foam B.
3. Results and Discussion
3.1. Flame-Retardant Characteristics Results
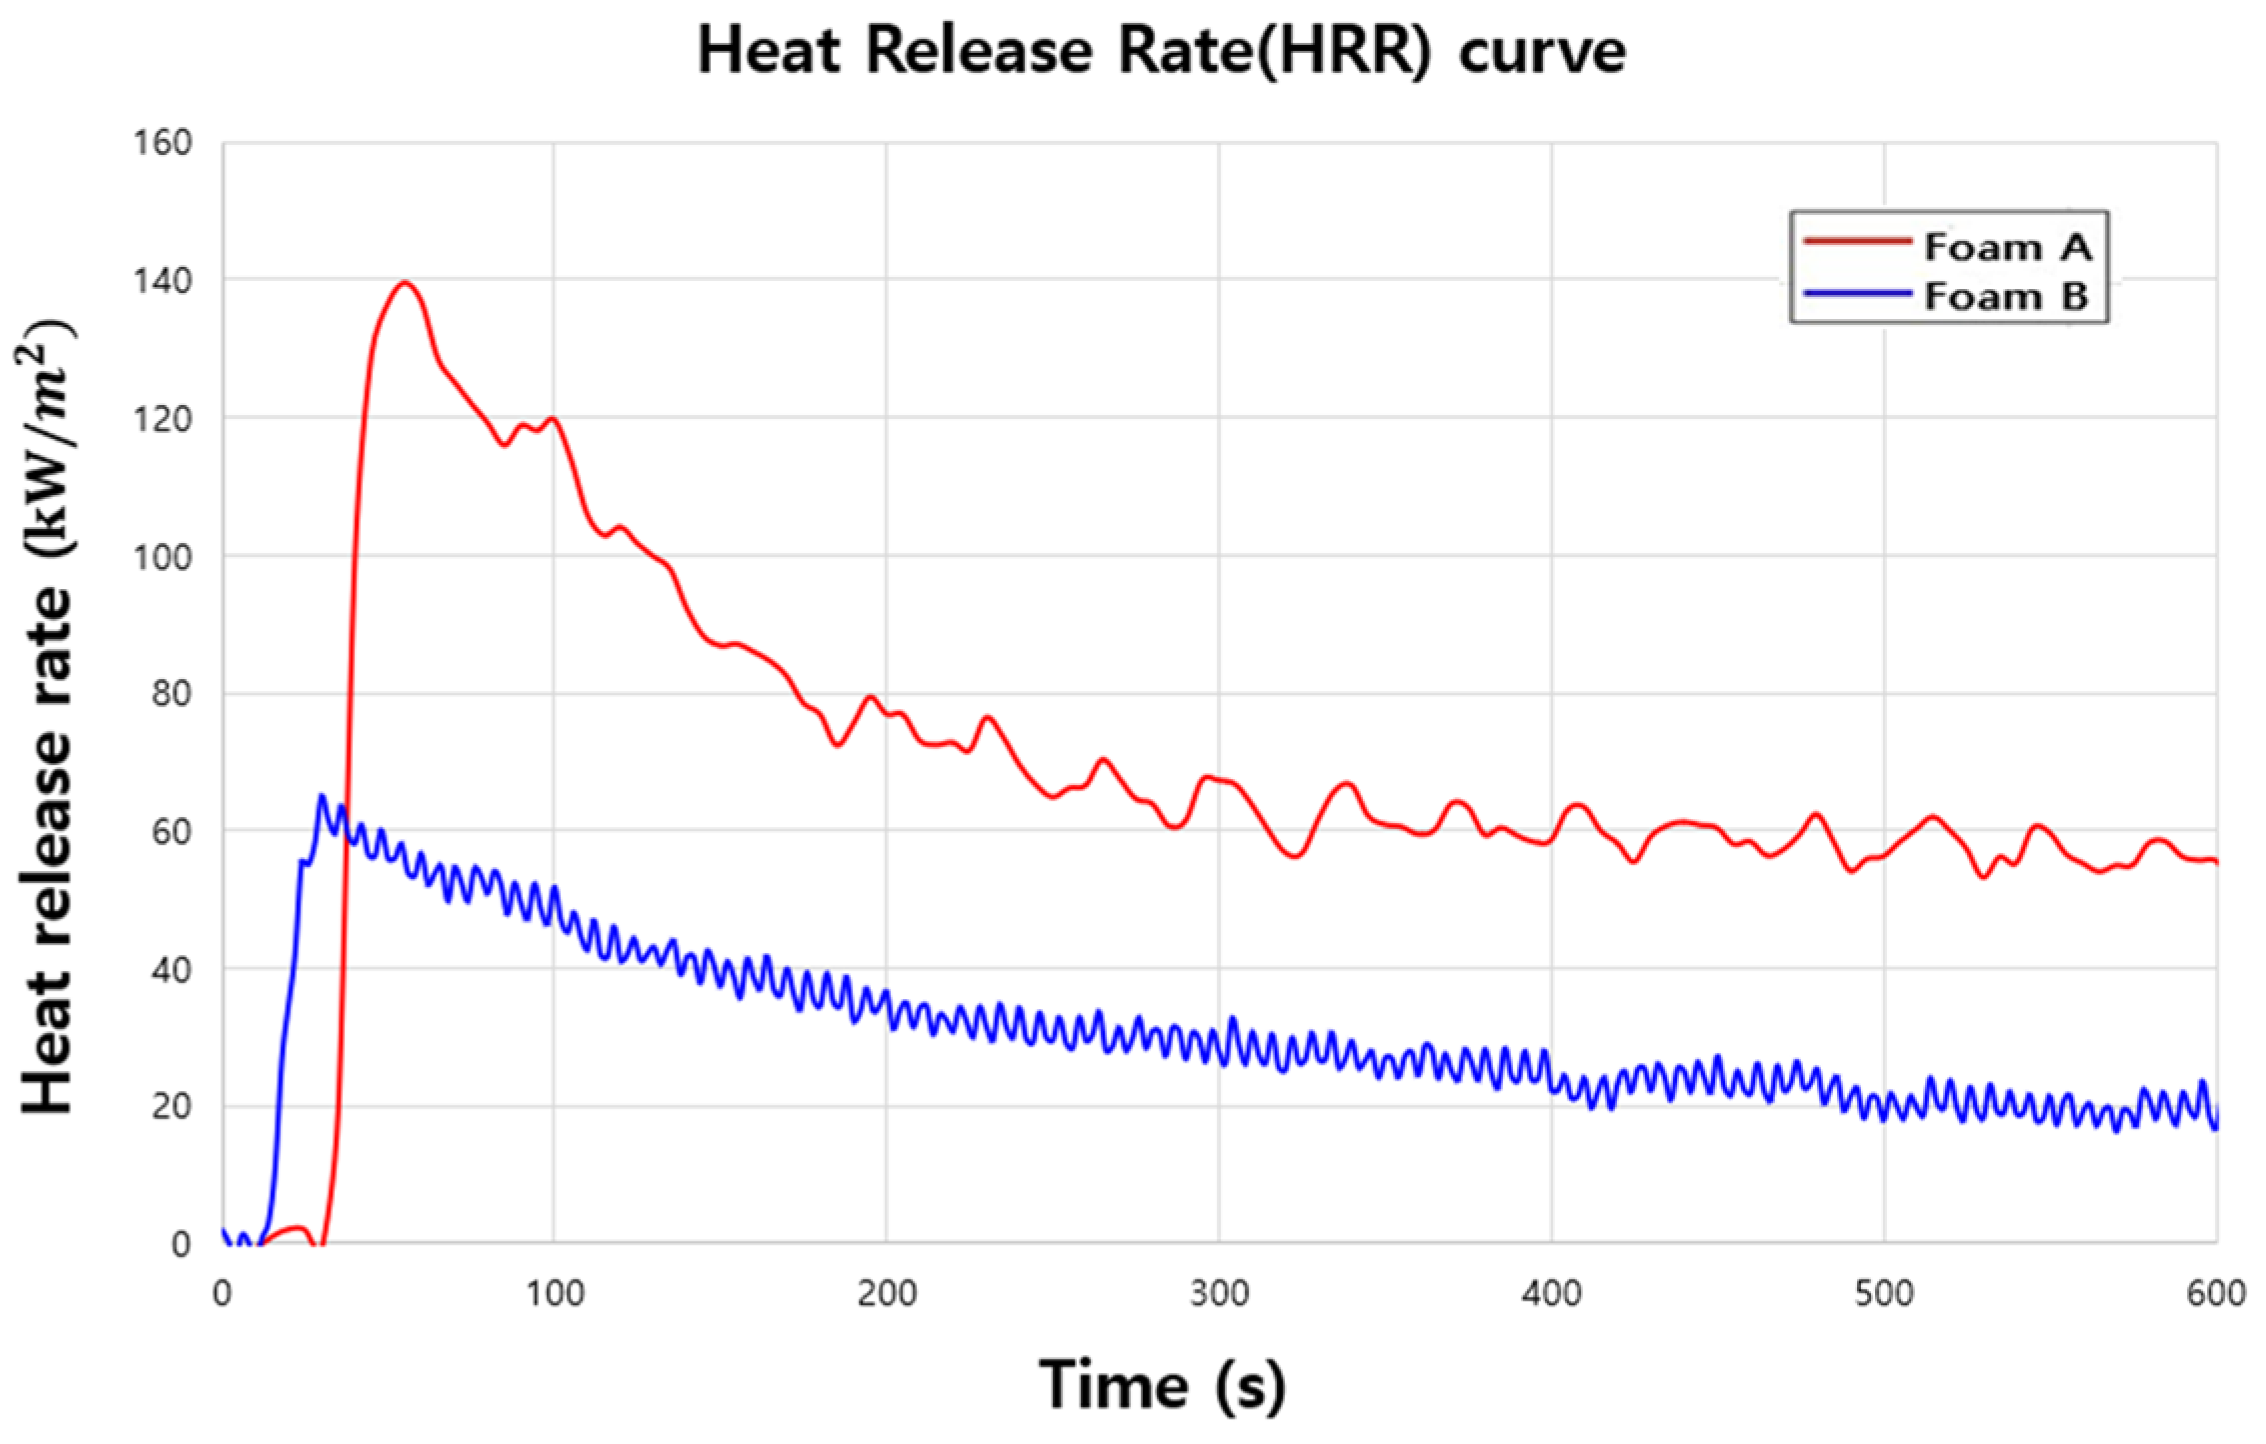
To evaluate the effect of flame retardants on combustion characteristics, the analysis began with specimen A, which did not contain any flame retardant. In specimen A, which was made without flame retardant, combustion was accelerated by the thermal decomposition of surface silicone after ignition, and the calorific value (peak HRR: 140 kW/m2) increased. Meanwhile, in specimen B, which was made with added flame retardant (expandable graphite/MDH), the char formed on the surface suppressed the burning of the specimen, while the peak HRR decreased by 53.6% to 65 kW/m2 (Figure 6).
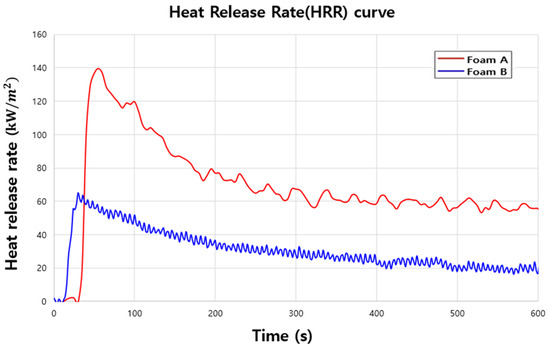
Figure 6.
Heat release rates of Foams A and B under a radiation intensity of .
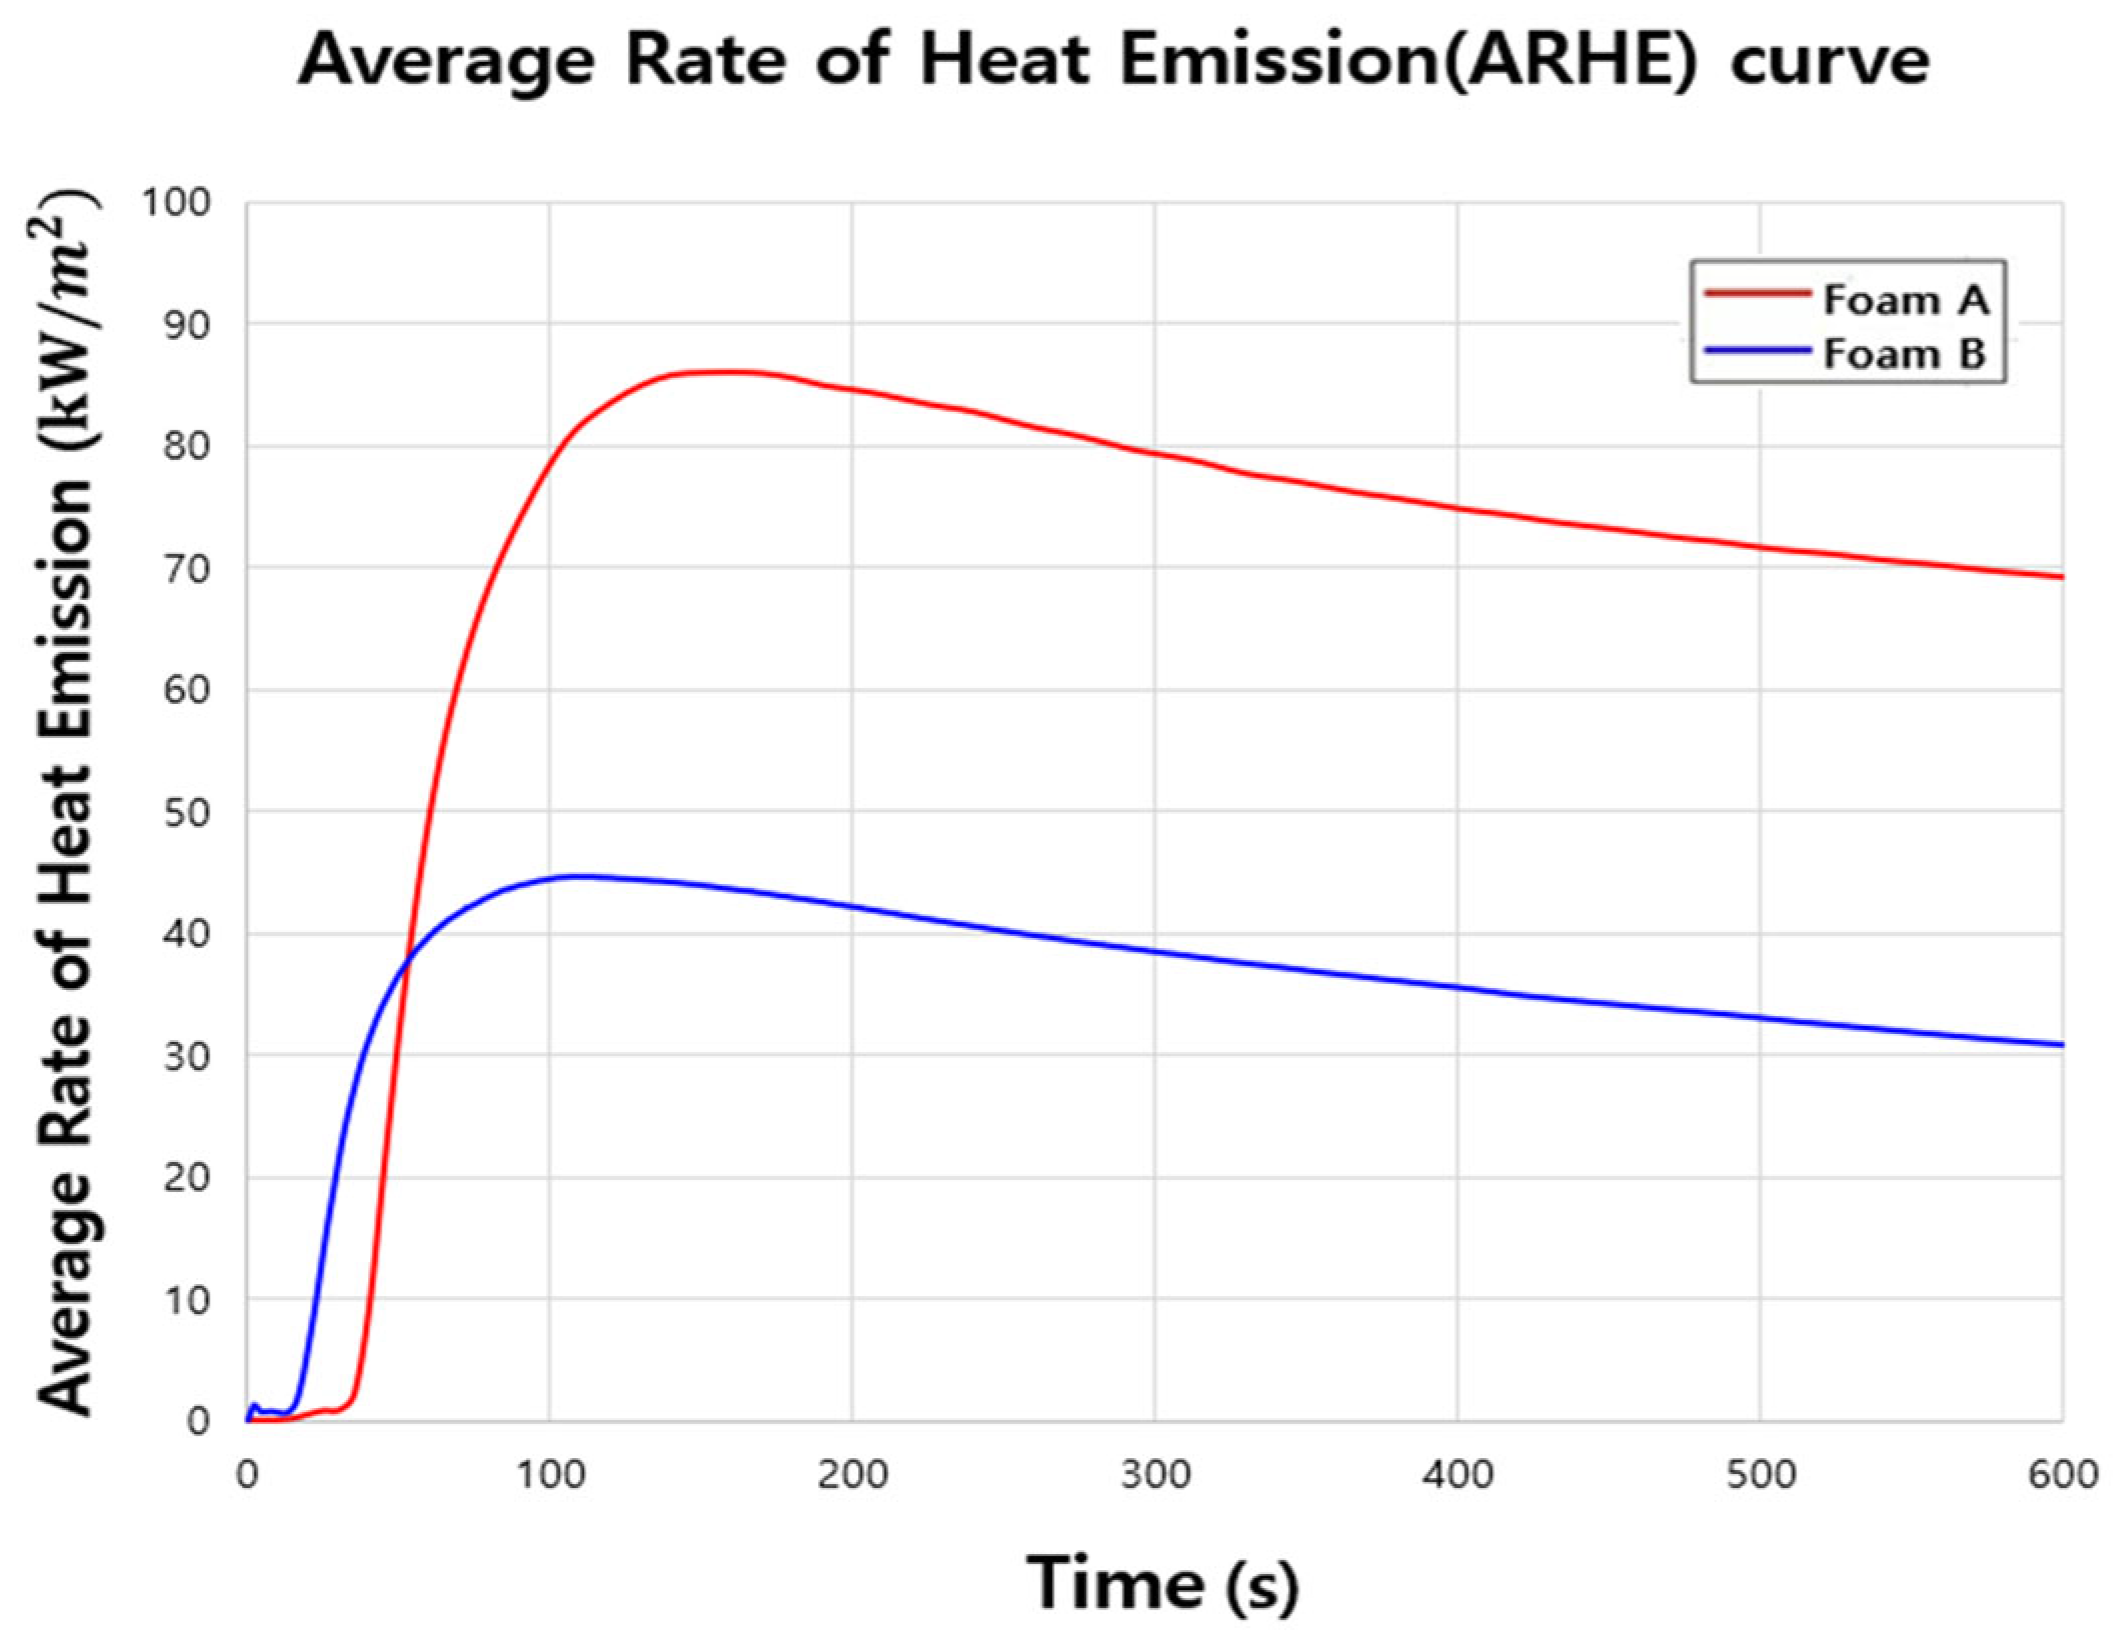
The Maximum Average Rate of Heat Emission (MARHE), which is an evaluation method for fire performance standards for materials to be used in railway vehicles as specified in “ISO 5660-1” and “EN 45545-2”, was calculated using Equation (1) from the measured time-by-time (tn) calorific value (qn) [32,35]. Figure 7 shows the result of the average heat release rate calculated from the calorific value presented in Figure 6.

Figure 7.
Average rate of heat emission from Foams A and B under a radiation intensity of .
The MARHE of specimen A was 86.1 kW/m2, which fails to satisfy the high-speed rail chair standard (hazard level [4], MAHRE 50 kW/m2 or less). Specimen B benefits from the char formation effect of the flame retardant, and its MARHE reduced from 48.1% to 44.7 kW/m2, thus confirming its suitability as a potential replacement for existing polyurethane foam.
3.2. Static Characteristics Results
3.2.1. Uniaxial Compression Test Results
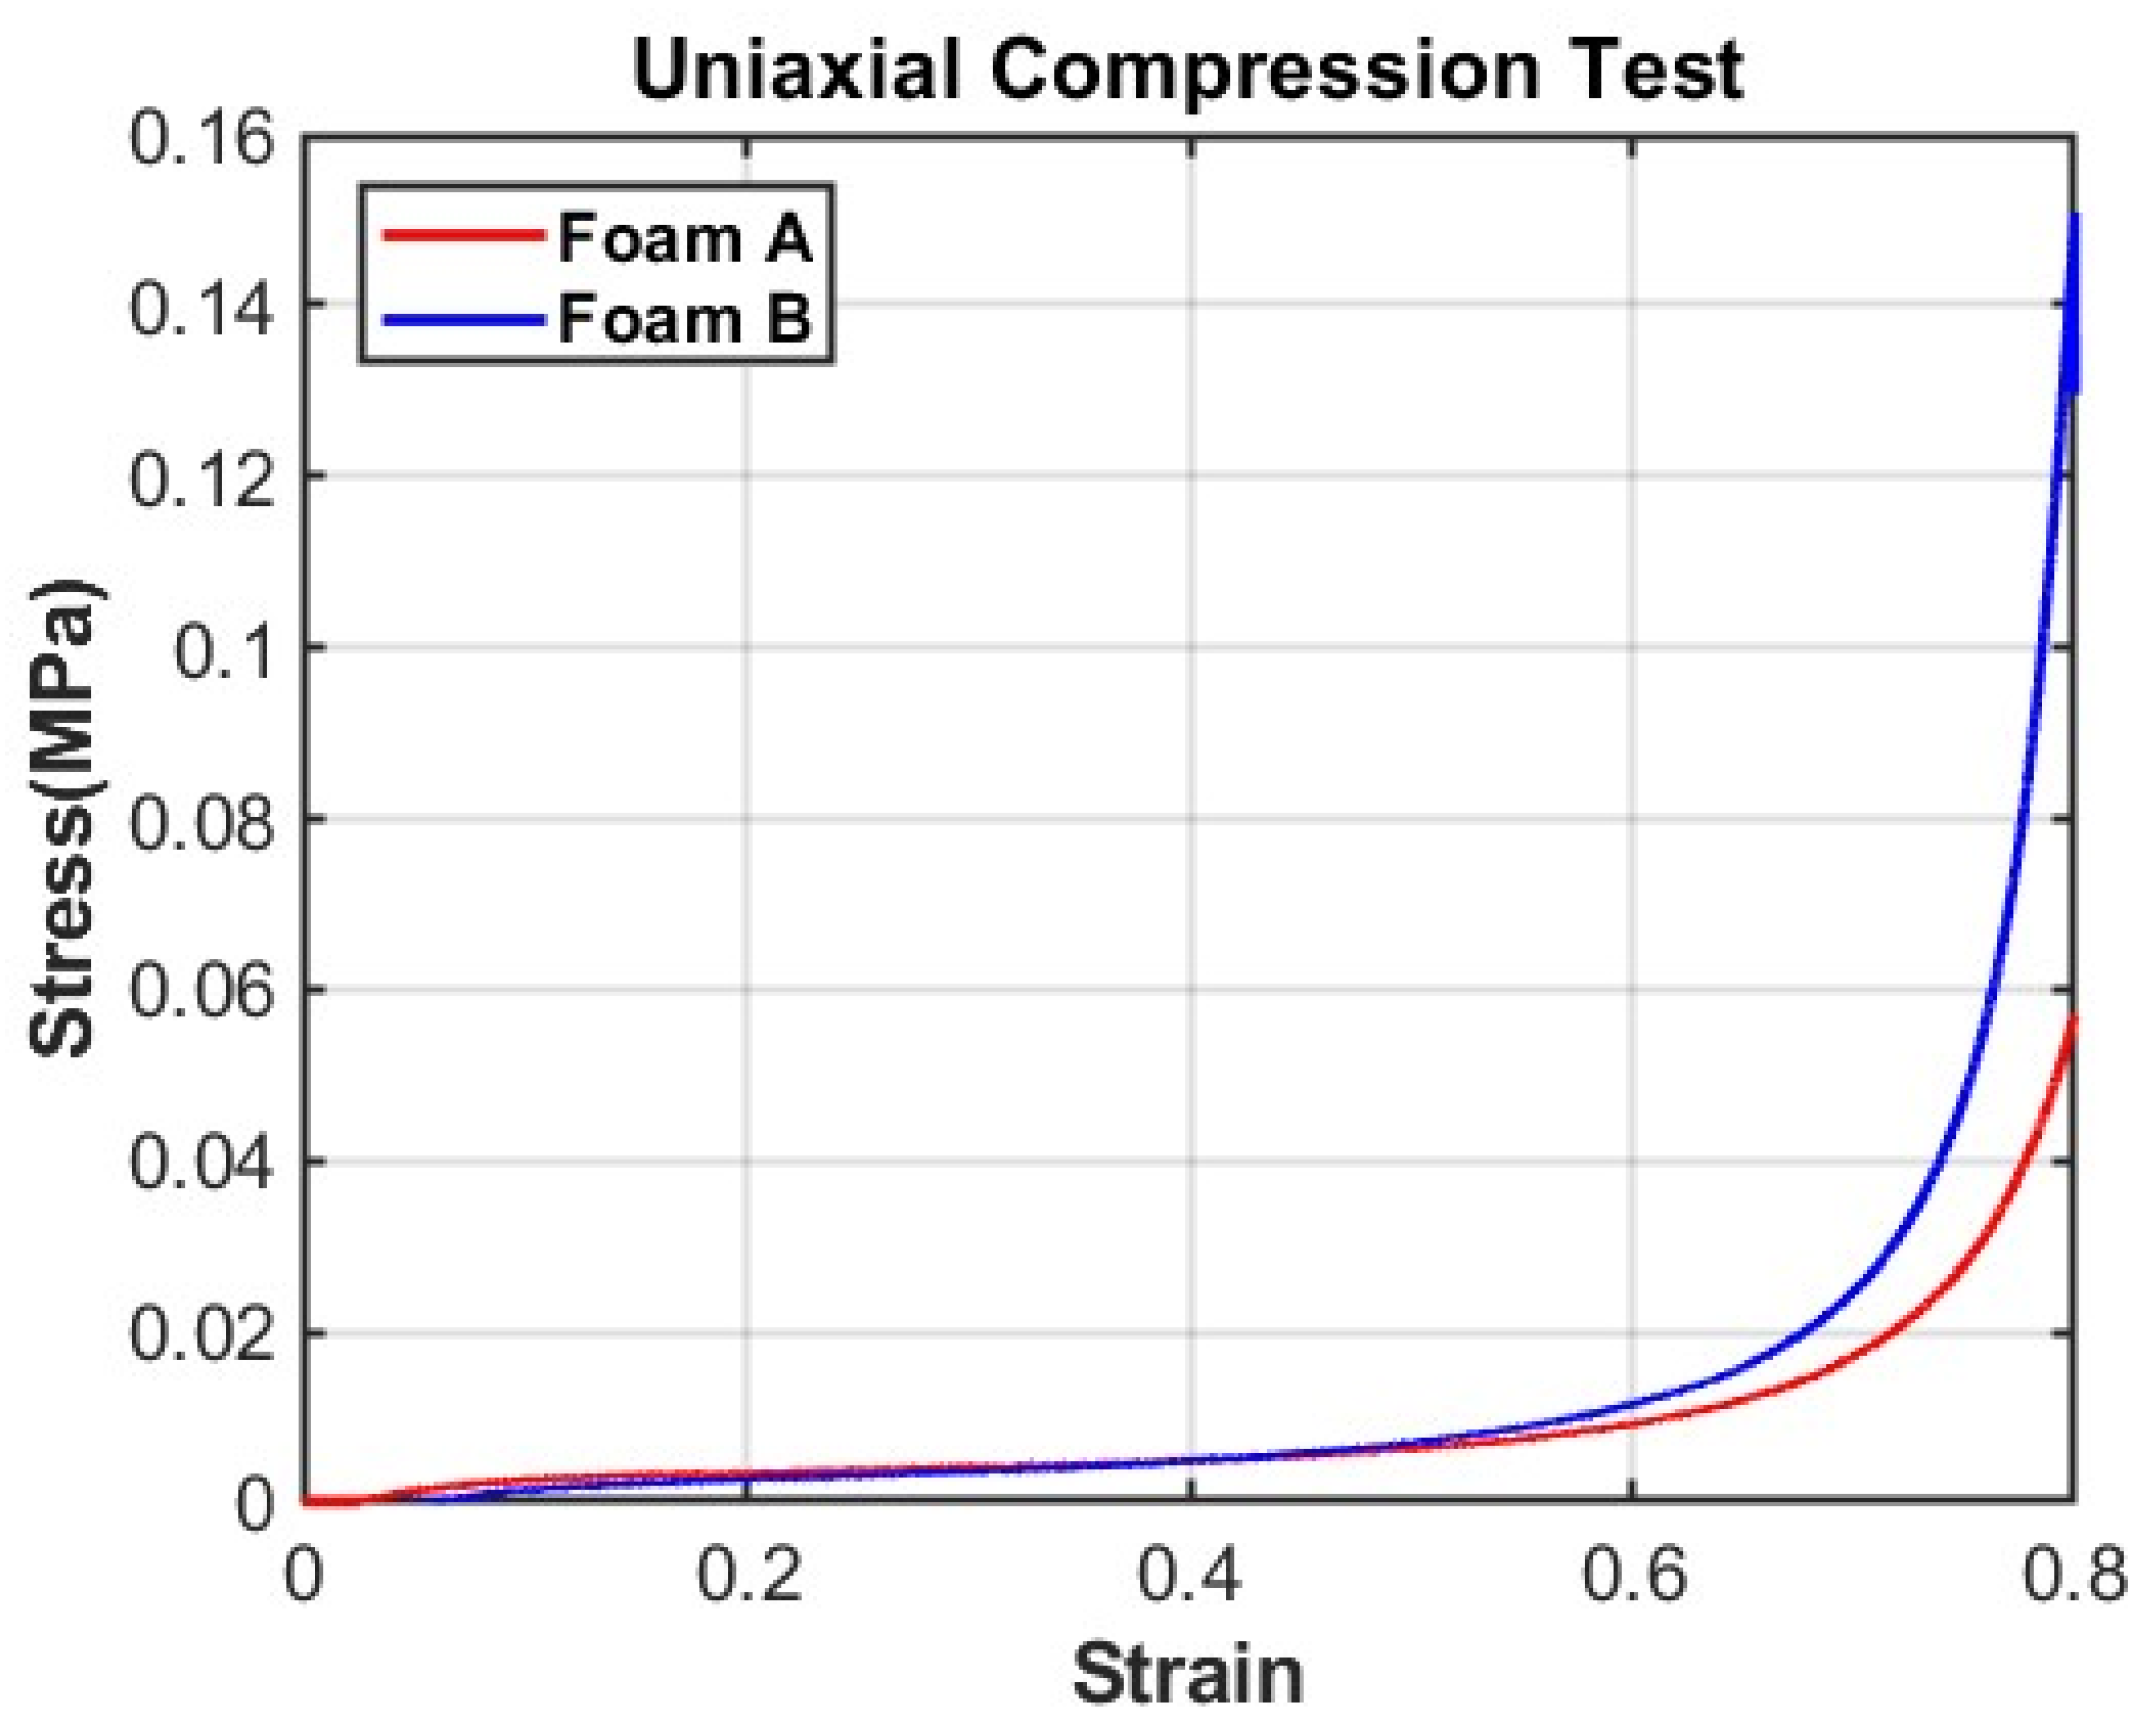
The static compression and shear behavior of specimens A and B is presented in this section, with an emphasis on the influence of inorganic filler addition on their mechanical properties. Figure 8 shows a comparison of the results of the uniaxial compression test data of specimens A and B. From the compression test, it can be seen that the size of the compressive stress at 80% strain of the specimen is about 2.5-times larger in silicone form B. It was judged that the expanded graphite that was added to specimen B, as an inorganic filler, interferes with the formation of uniform cells and thus increases the density to make the foam harder [12].

Figure 8.
Data of uniaxial compression test.
3.2.2. Static Comfort Evaluation Index
The static comfort evaluation index measures the change in force according to the amount of compression of the seat form through the Indentation Force Deflection (IFD) Test, and it aims to capture the comfort felt by the human body after sitting. The IFD Test involves measuring 80% of the material using a compression tester equipped with a disk-shaped indenter. In the present study, the uniaxial compression test corresponds to the IFD test. For specimens A and B, the vertical force and displacement during compression and the removal of force are shown in Figure 9, while Table 2 presents the static comfort evaluation index using the 4th data of specimens A and B considering the elimination of the Mullins effect. Meanwhile, Table 3 lists the static comfort evaluation index of soft and hard foam made of the polyurethane material meant to be used as a replacement in this study.

Figure 9.
Hysteresis Loop of uniaxial compression test of (a) Foam A and (b) Foam B.
Table 2.
Static comfort rating index of Foam A and B.
Table 3.
Static comfort rating index of PU foam.
In the static comfort evaluation index, hardness is an item related to softness when sat on, and it is expressed as a value of 25% IFD. It is an important factor that serves as a criterion for setting an appropriate level of value when designing a seat. Hysteresis Loss is a factor related to the restoring force of the material, and the hysteresis that occurs between the force when compression is applied and the force when the compression is removed can be derived as the area between each curve. The smaller the value, the smaller the energy loss, meaning that the material is well-restored to its original state. Comparing Table 2 and Table 3, it can be seen that the hardness and Hysteresis Loss values are different. This can be explained by the mechanical properties of polymeric foam under cyclic loading. Soft PU foams are observed to have a decrease in hardness and an increase in Hysteresis Loss due to cyclic loading, an example of which is the phenomenon in which general furniture, such as sofas or bed mattresses, with polymeric foam applied become softer as they are used [36]. In this experiment, to remove the Mullins effect, the data of the fourth time of compression—after three times of compression—were used, and in this process, the hardness of the foam decreased, and the Hysteresis Loss increased according to the same principle as the phenomenon described above that occurs in a sofa or bed mattress. In the first compression test, the hardness of Foams A and B was measured to be 77.0 N and 82.3 N, respectively, which serves as the basis for this judgment, because there is no significant difference from the hardness of the soft foam, as presented in Table 3. This can also be expressed by various indices from the compression behavior; representative indices include the IHF, MIF, and Sag Factor. The IHF is a factor that represents the change in stiffness on the surface of the seat form, and it is calculated as a value of 25% IFD/5% IFD, where higher values correspond to increased softness. The results in Table 2 confirm that sample B is softer. The MIF is a factor that indicates whether seating has been performed smoothly during the process, and it is calculated as a value of 2 × 20% IFD—40% IFD. As the MIF value approaches 0, it means that the inclination rises steadily in the deformation range from 20% to 40%, so the seat is evaluated to be smooth without causing discomfort. From Table 2, it can be seen that seating proceeds more smoothly in specimen B. In the case of the Sag Factor, it is a factor representing the support of the seat form, and it is measured at a value of 65% IFD/25% IFD, and there is a need for an appropriate level that is not excessively high or low. In general, the closer the value of the Sag Factor is to 3.0, the more appropriate it is.
From Table 2, it can be seen that the value of specimen A is closer to the appropriate level. Finally, when comparing silicone foam and polyurethane foam, there is no significant difference in the value of the static comfort evaluation index, so it is expected that silicone foam can serve as a suitable replacement for polyurethane foam, but an optimal design for the addition of flame retardants is still needed.
3.2.3. Simple Shear Test Results
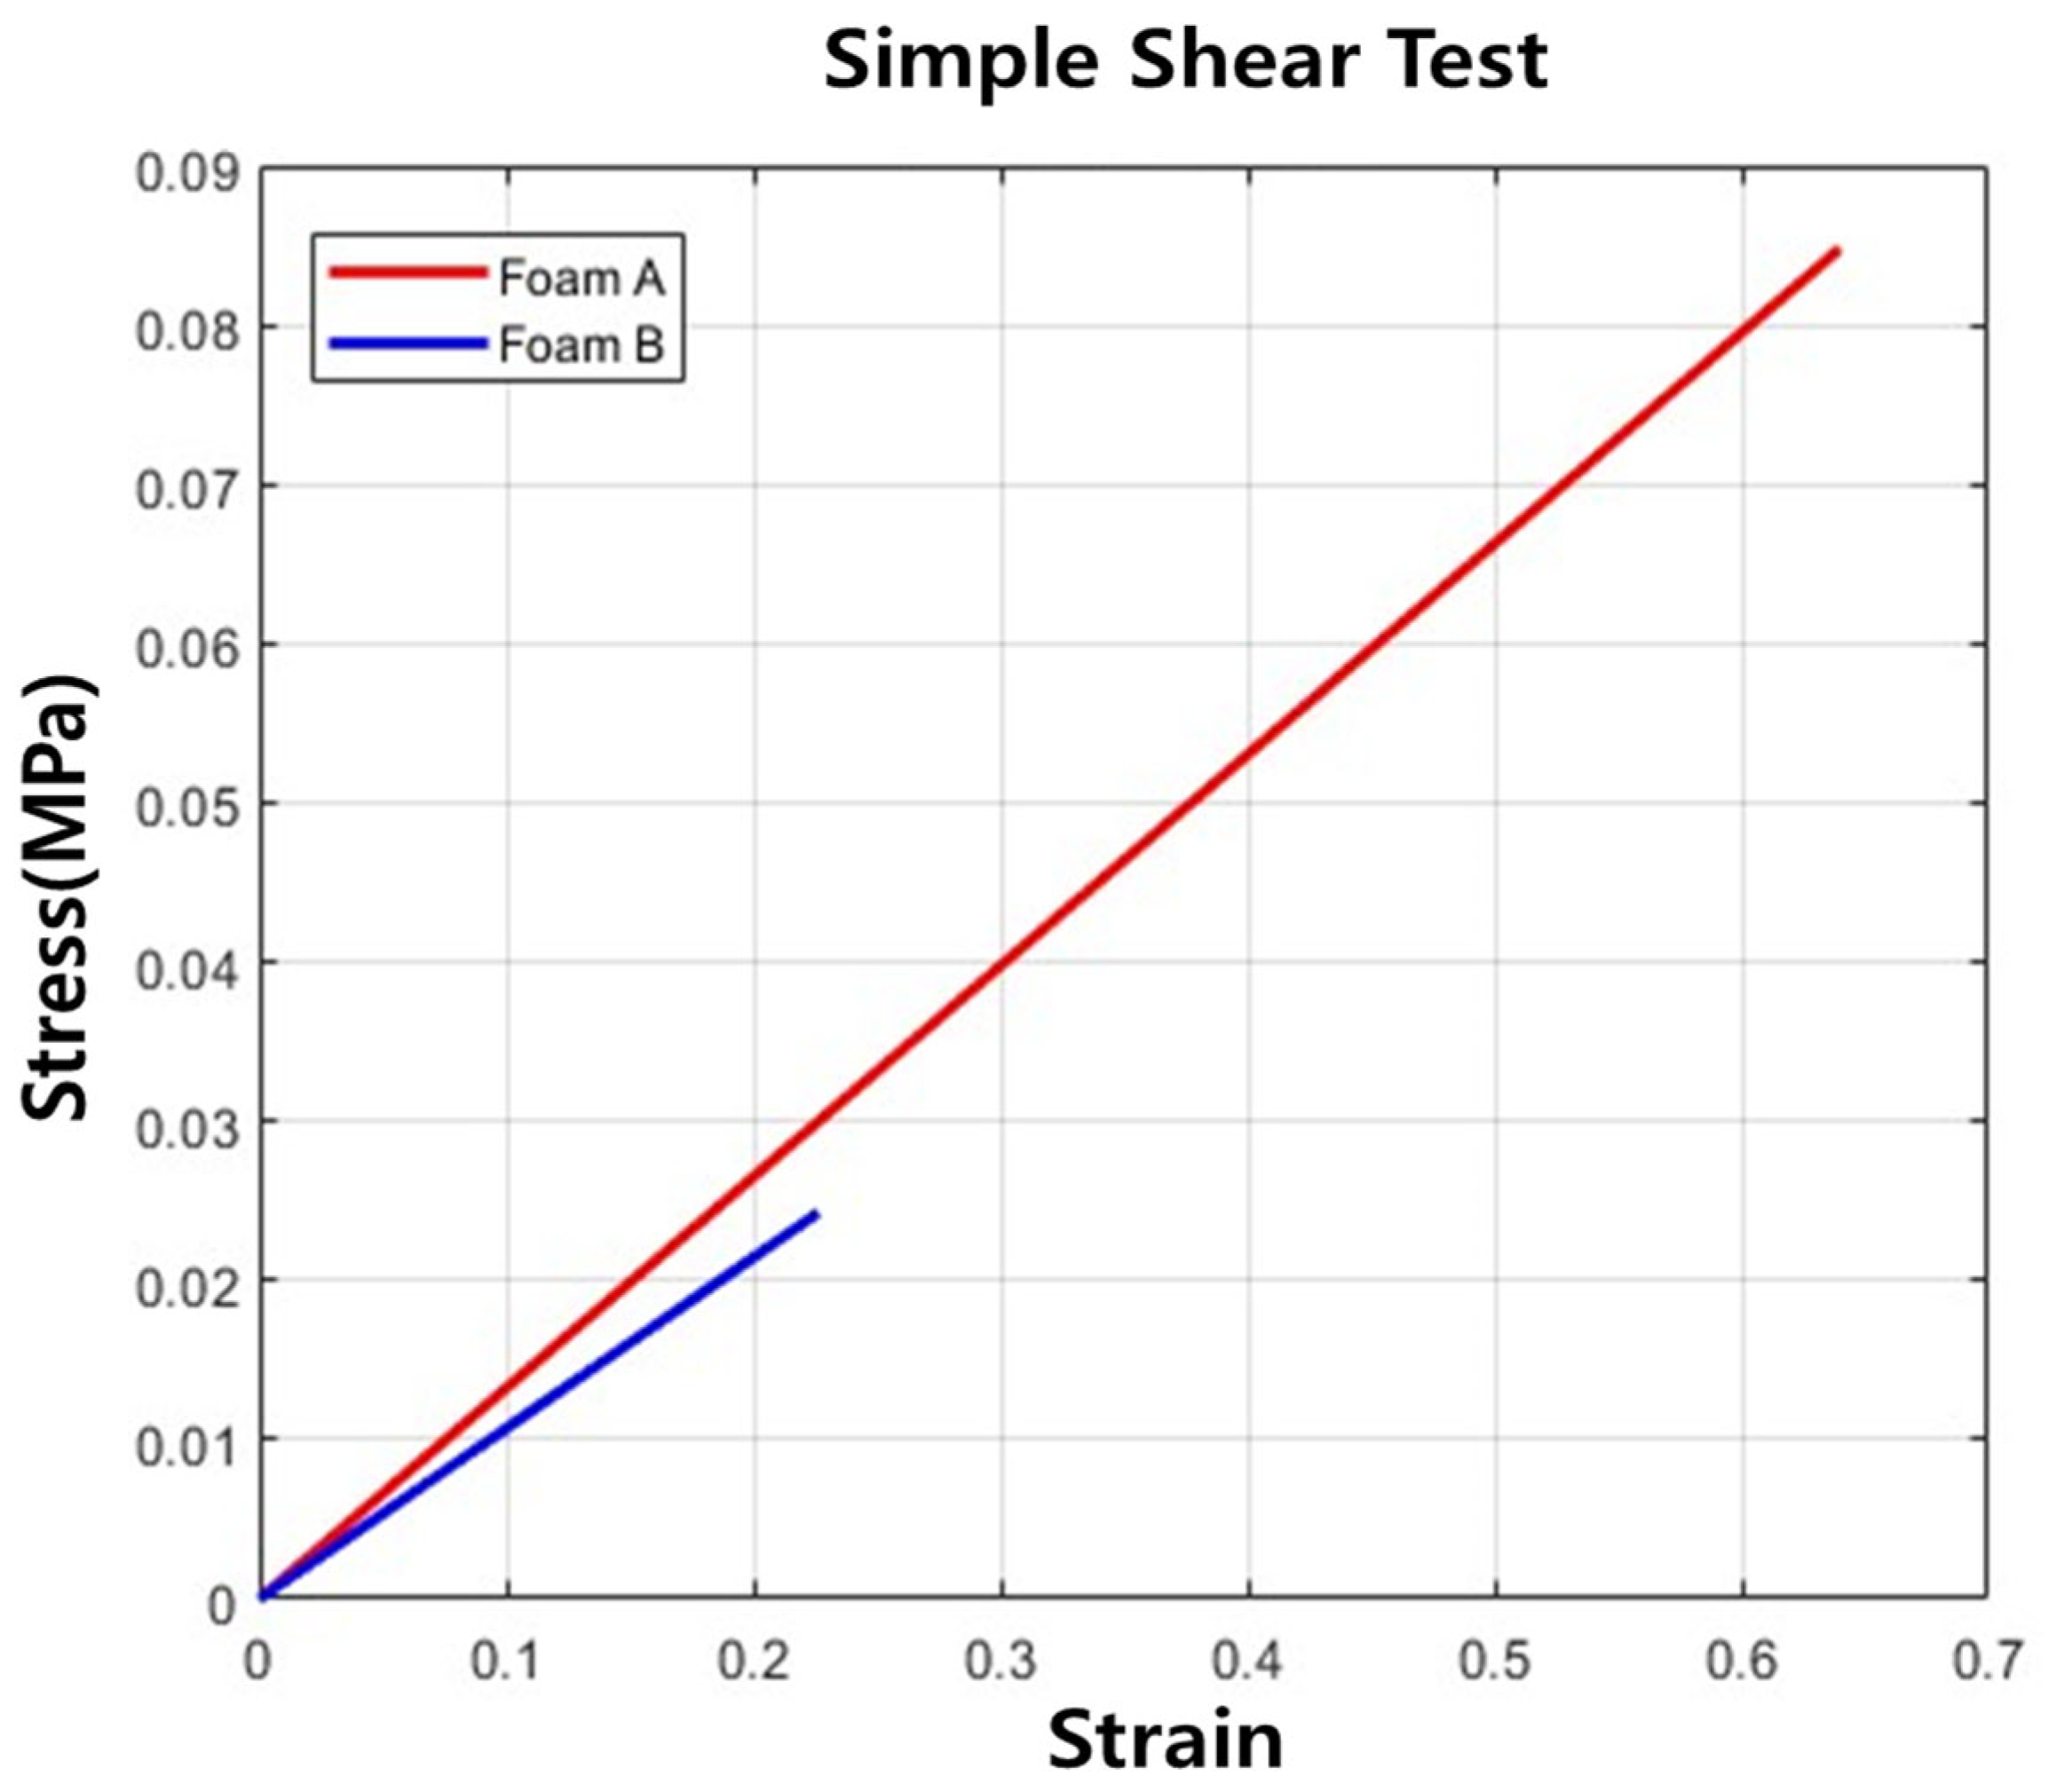
Figure 10 shows the results of comparing the results of the simple shear test data of specimens A and B. In the case of the shear test, it can be seen that specimen A has a greater shear stress according to shear strain than specimen B, which is attributed to the influence of the expanded flame retardant that has been added to specimen B, and it is believed that the mechanical shear strength decreased because the size of the expanded graphite particles was very large and there was no functional group interacting with the silicone rubber. It can also be seen that specimen A fractured at a shear strain of 64.0% and specimen B fractured at a shear strain of 22.6%. This difference is attributed to the influence of the inorganic flame-retardant filler added to specimen B, and the mechanical shear strength of specimen B is judged to be lower than that of specimen A, because the interfacial bonding force of specimen B is weakened due to the addition of inorganic flame retardant [37].

Figure 10.
Data of simple shear test.
3.2.4. Material Parameter Identification
The elastomeric foam material analysis model used in the finite element analysis was the Ogden model. The strain energy density function can be expressed as a function of principal stretch () based on the Ogden model as shown in Equation (2) [1,26,38,39,40].
In Equation (2), is the order and is the volume function, which is expressed as in Equation (3) [1,26,38,39,40].
In Equation (3), is the elastic volumetric strain, expressed as . When performing the uniaxial compression test and the simple shear test, the thermal volumetric deformation was not considered, because the temperature in the laboratory remained constant. In Equations (2) and (3), , and are expressed as material constants in Table 4 [1,26,38,39,40] and they are derived through fitting to the test data. The compressive stress is also derived by differentiating the strain energy density function of Equation (2) from the elongation rate. Here, considering the uniaxial compression test in one direction, since , then the compressive stress is calculated as in Equation (4) by substituting it [1,26,38,39,40].
Table 4.
Ingredient constants (E: shear strength; ν: Poisson’s ratio).
Simple shear stress is derived by differentiating the strain energy density function in Equation (2) with the shear strain. At this time, considering due to incompressibility, it is calculated as shown in Equation (5) [1,26,38,39,40].
From Equation (5), the principal elongation is calculated as in Equation (6) [1,26,38,39,40].
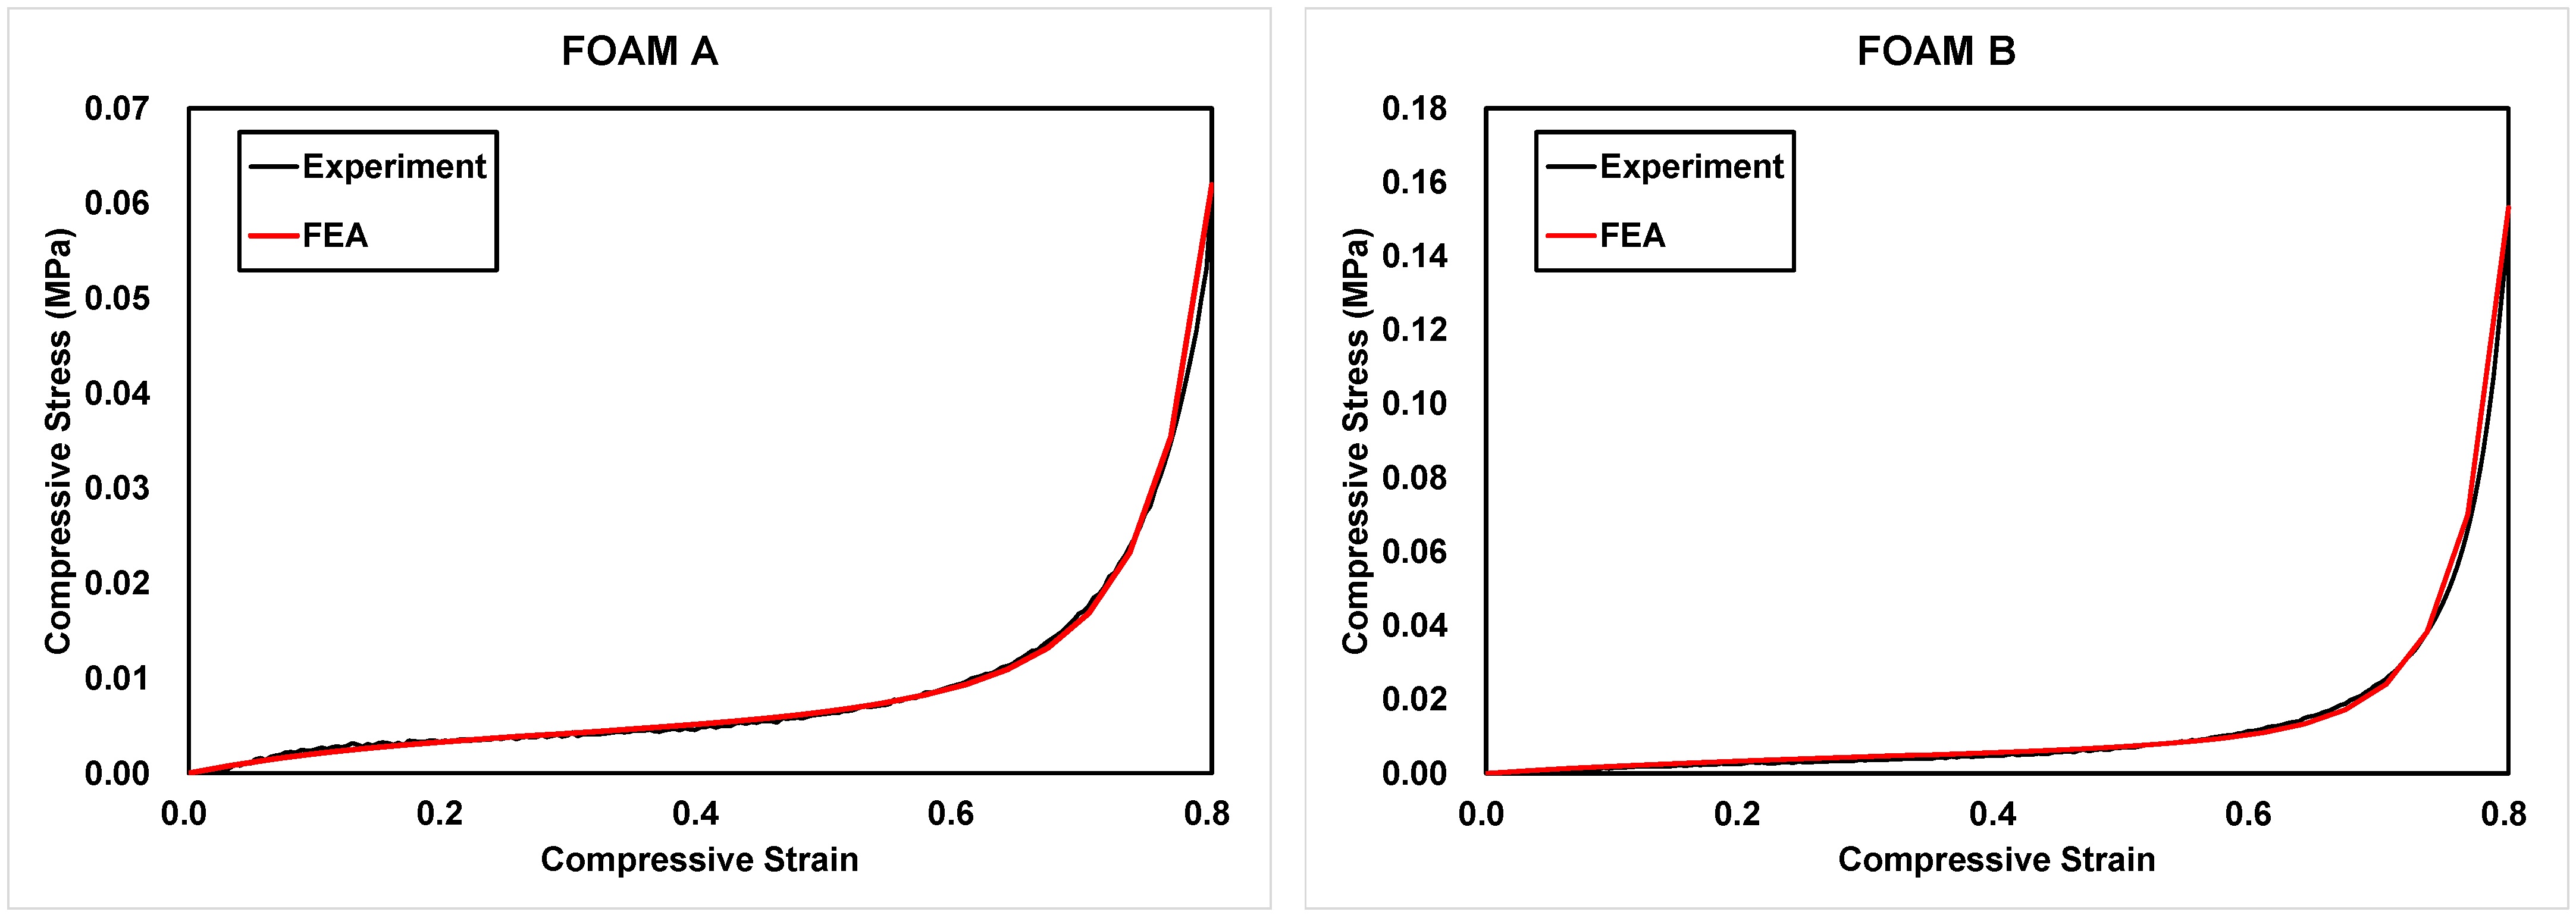
Finite element analysis was performed using the commercial FEA software Abaqus 2021. The simulation model was constructed with the same dimensions as the test specimen and modeled using three-dimensional solid elements considering geometric nonlinearity. For the uniaxial compression (UC) test, a mesh size of 5 mm was adopted to ensure sufficient resolution and accuracy. To replicate the experimental conditions, rigid constraints were applied to the loading surfaces, and a displacement load was imposed to conduct the simulation. The analysis was performed by applying a compressive load equal to 80% of the specimen’s thickness. In this study, material constants were derived as presented in Table 5 through fitting using uniaxial compression testing and simple shear test data. Figure 11 presents a comparison between the experimental data and the finite element analysis (FEA) results. Table 6 summarizes the RMSE and R2 values for Foams A and B, comparing the experimental and FEA results. The analysis showed that the R2 value was 99.19% for specimen A and 98.69% for specimen B, confirming that the compressive behavior of the foam obtained from the FEA closely matched the actual experimental data for both specimens.
Table 5.
Ingredient constants of Foams A and B.
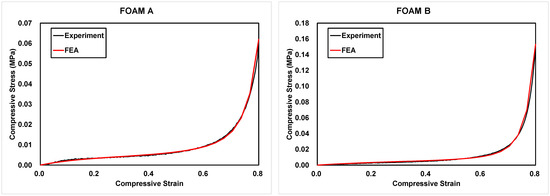
Figure 11.
Results of experimental data and finite element analysis for Foam A and Foam B.
Table 6.
Quantitative comparison of experimental and FEA results using RMSE and R2 for Foams A and B.
3.3. Dynamic Characteristics Results
Transmissibility Test Results
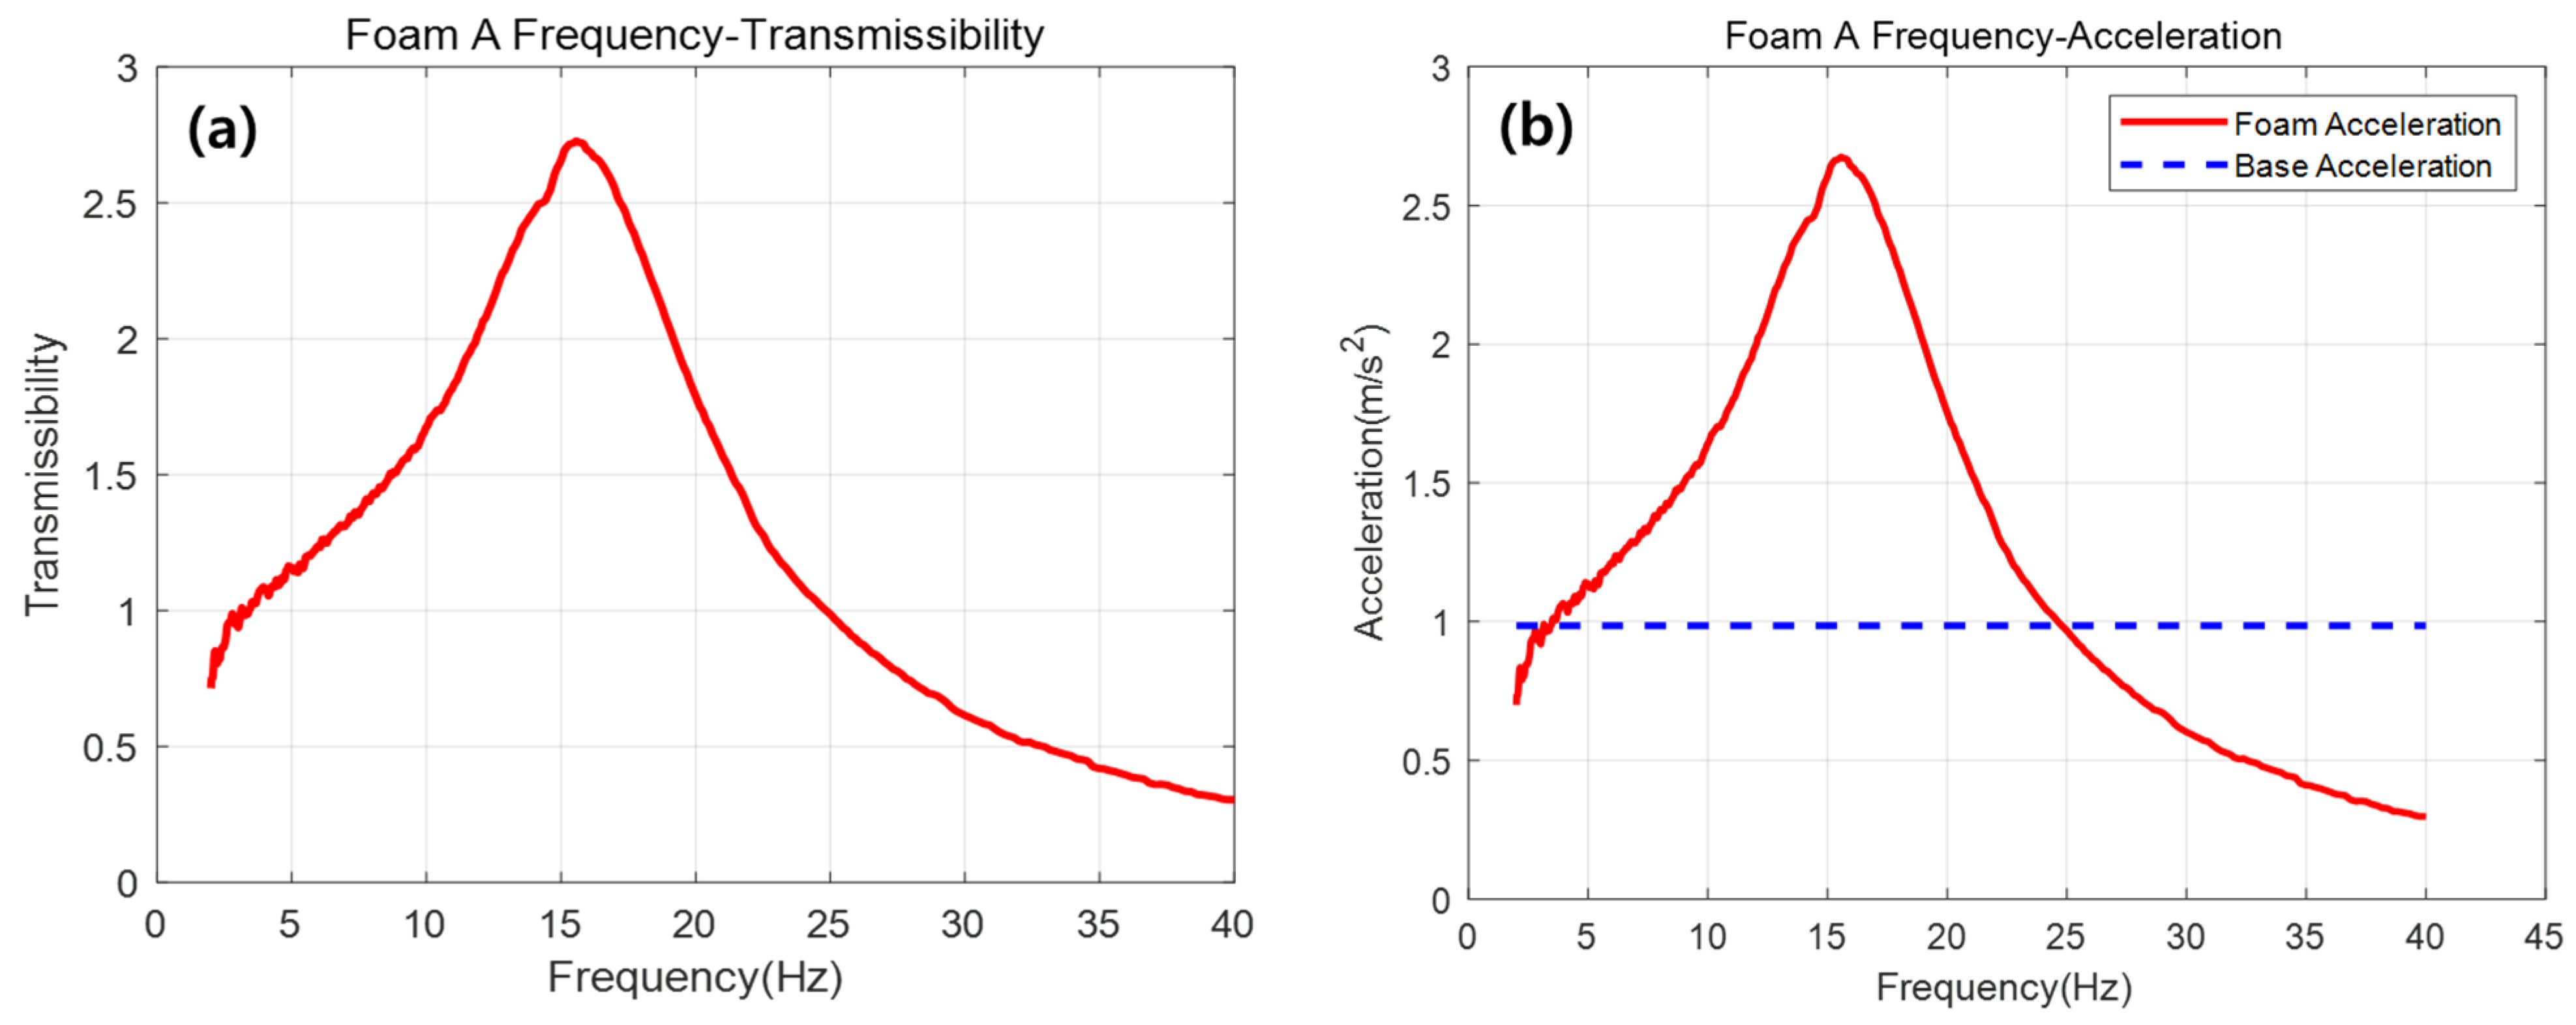
In this section, transmissiblilty tests were conducted at a frequency condition range of 2–40 Hz to evaluate the vibration isolation performance of the specimen, and the resulting dynamic behavior is presented. Figure 12 shows the results of the transmissibility test of specimen A: (a) shows the result of the transmissibility according to the change in frequency of specimen A, while (b) shows the result of the floor acceleration and the acceleration of the specimen according to the change in frequency of specimen A. In Figure 12a, it can be seen that the moment the transmissibility exceeds 10 Hz, the maximum transmissibility value of 2.7 is found at 15.6 Hz. It can also be seen that the transmissibility value is either about 1 or less than 1 at the frequency ranges from 2 to 4 Hz and 25 Hz or higher. In Figure 12b, the dotted line represents the floor acceleration whereas the solid line represents the acceleration of specimen A. Similar to the graph results in Figure 12a, the acceleration of specimen A also has a similar value to the floor acceleration between 2 and 4 Hz, and when the frequency exceeds 25 Hz, it can be seen that the acceleration of specimen A has a smaller value than the floor acceleration.
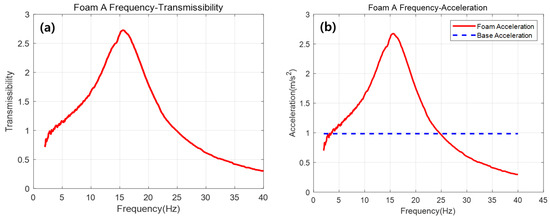
Figure 12.
(a) Transmissibility and (b) acceleration according to the frequency of Foam A.
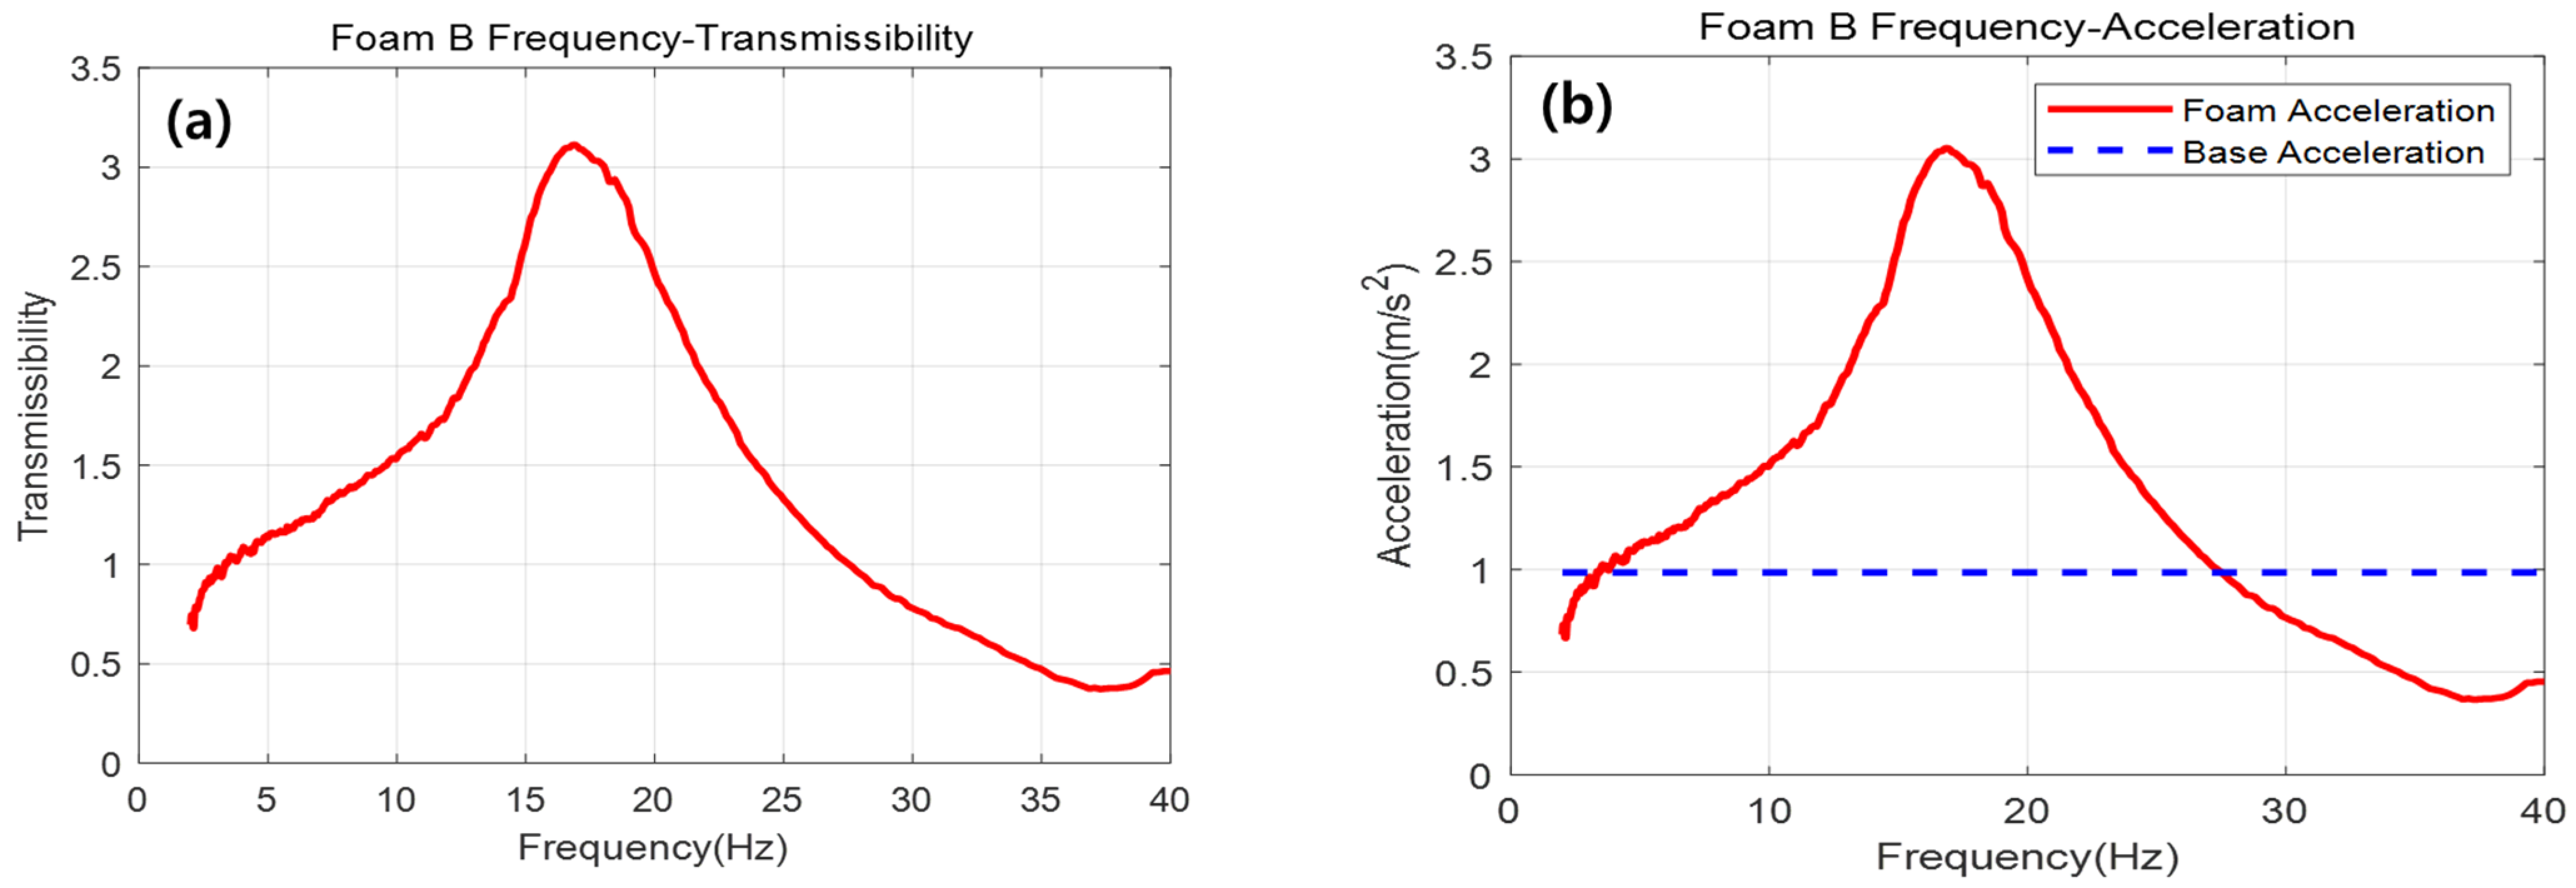
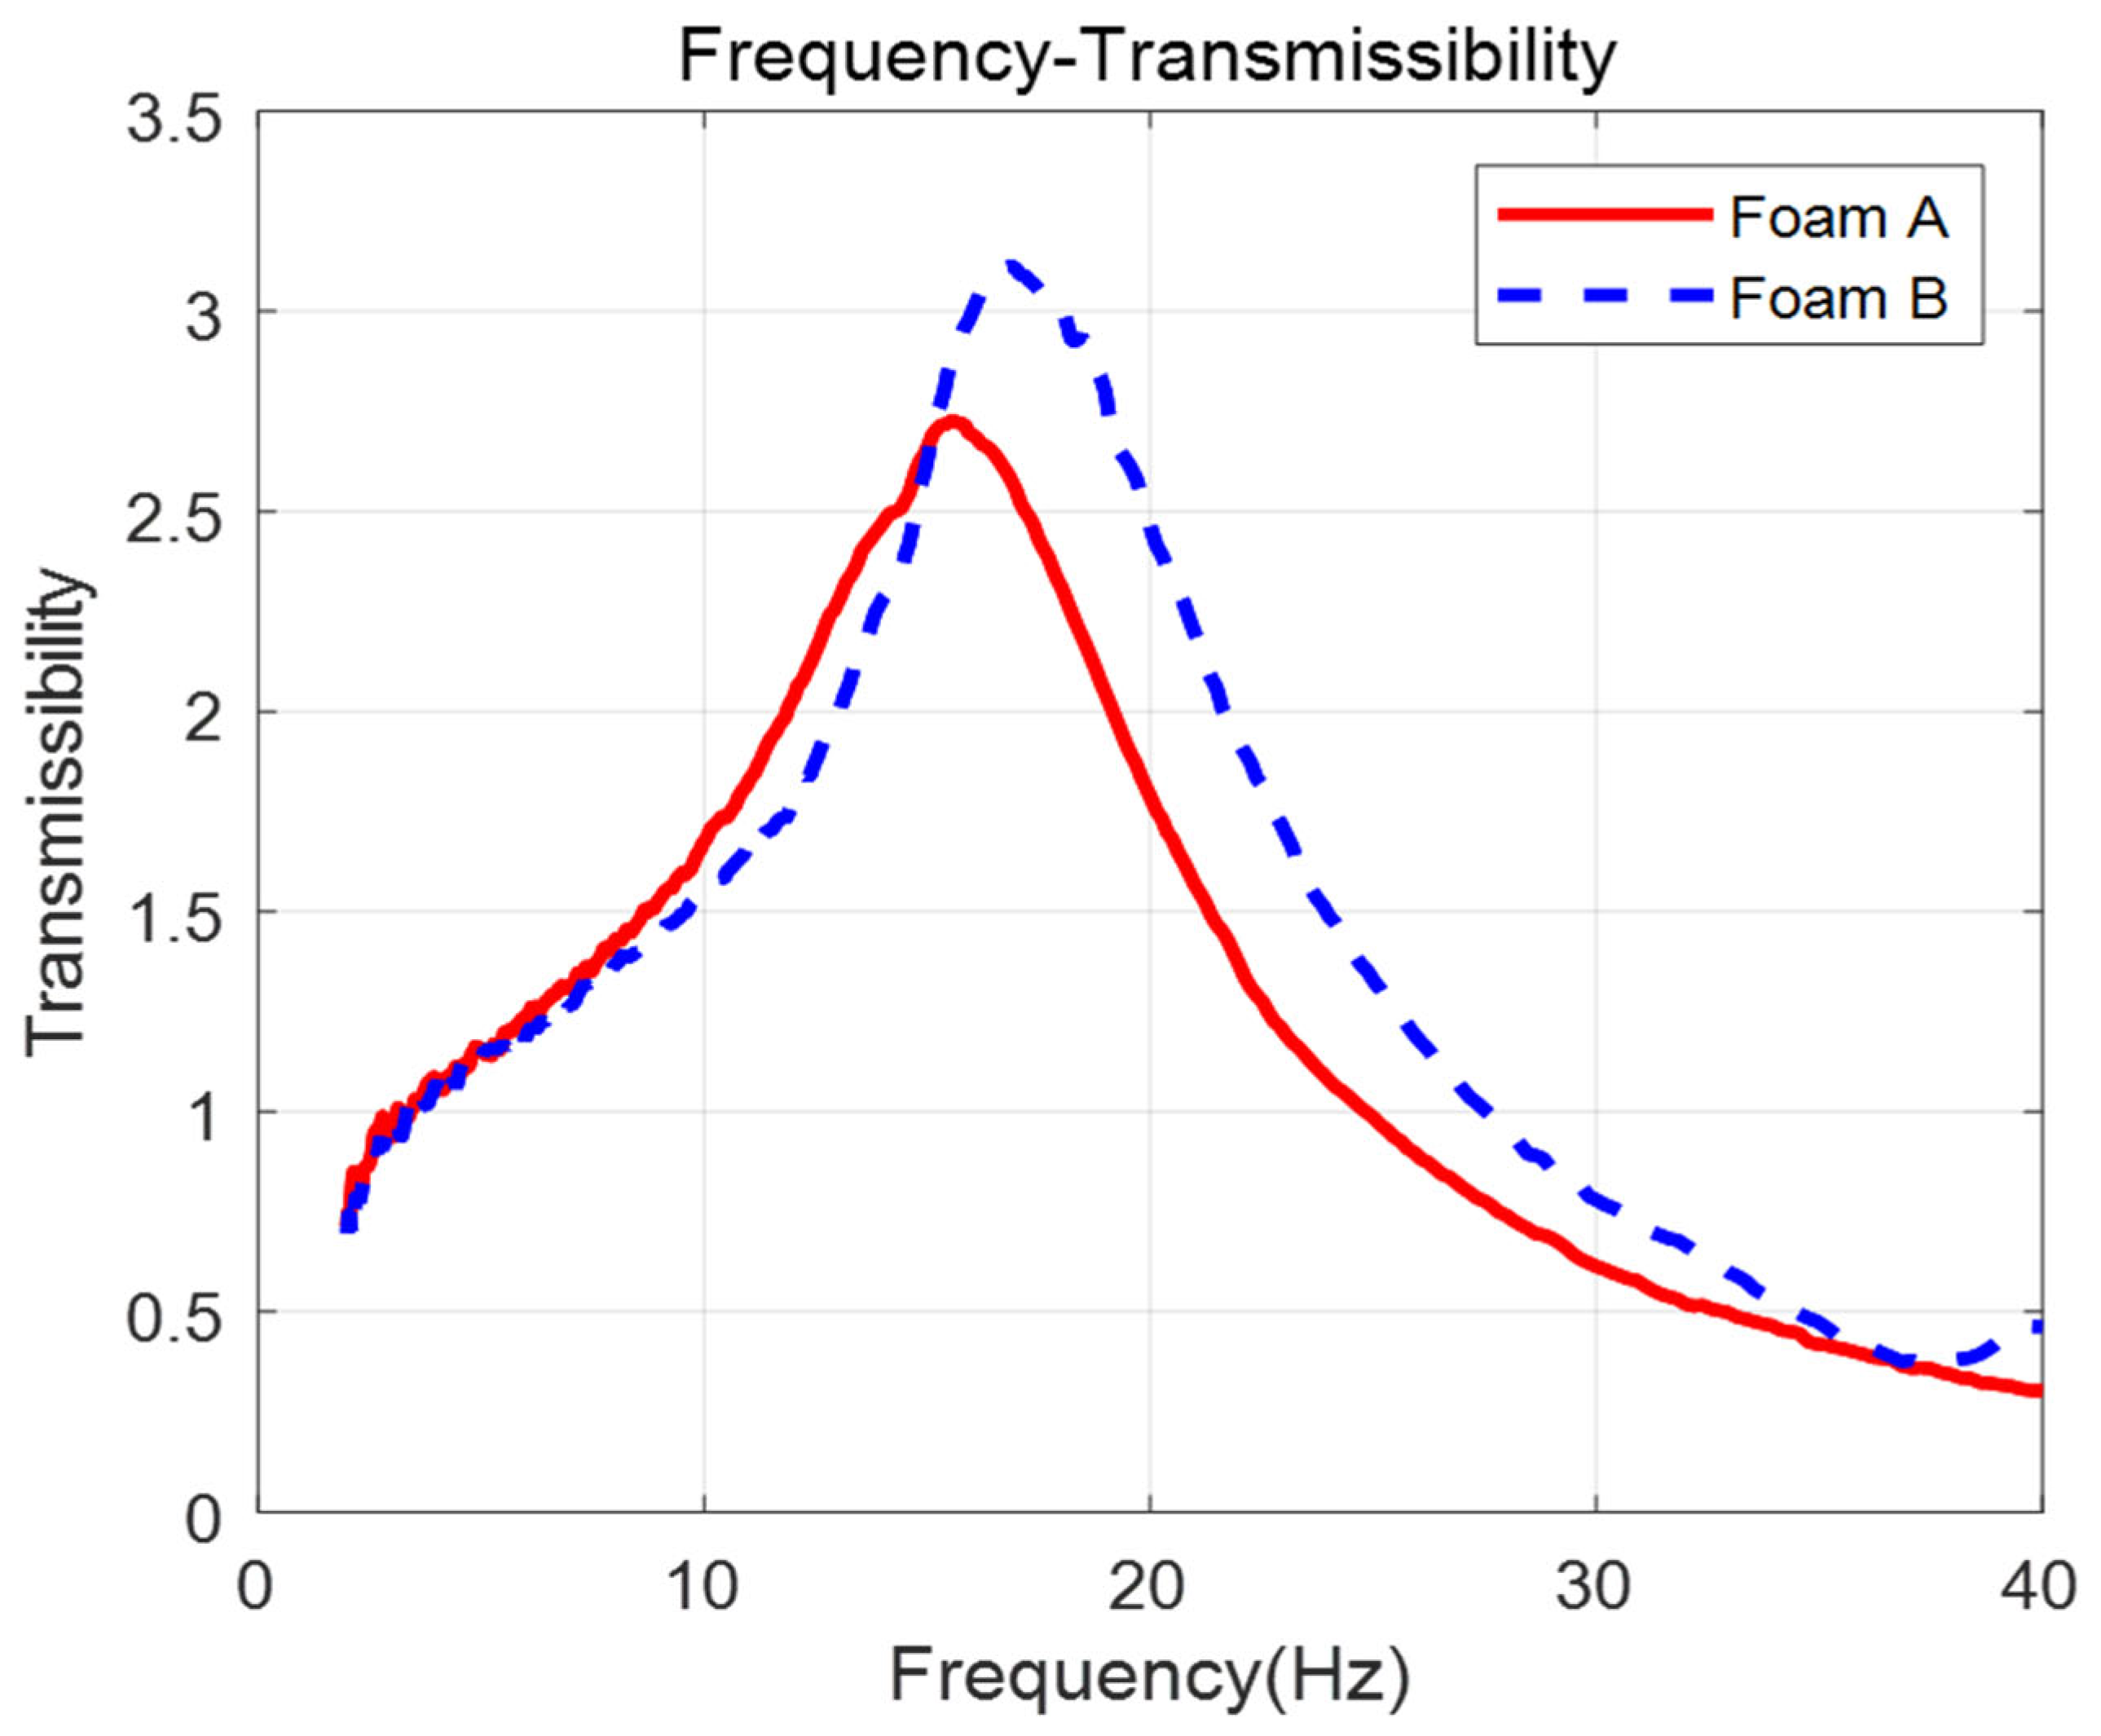
(a) and (b) in Figure 13 are the results of the transmissibility test of specimen B. (a) is the result of the transmissibility according to the frequency of specimen B; (b) is the result of the floor acceleration and the acceleration of the specimen according to the change in frequency of specimen B. In the case of Figure 13a, it can be seen that the transmissibility increases rapidly from 2 Hz and reaches its maximum transmissibility value of 3.2 at 17.0 Hz. It can also be confirmed that the transmissibility has a value of either about 1 or less than 1 at the frequency ranges of 2 to 5 Hz and 28 Hz or higher. In Figure 13b, the dotted line represents the floor acceleration whereas the solid line represents the acceleration of specimen B. Moreover, Figure 13b is similar to the graph results shown in Figure 13a. The acceleration of the specimen has a similar value to the floor acceleration when the frequency is between 2 and 5 Hz, while it has a smaller value than the floor acceleration in the frequency range of 28 Hz or higher. Figure 14 shows a graph comparing the transmissibility according to the frequency of silicone Foams A and B, while Table 7 presents the result of comparing the maximum transmissibility and natural frequency of specimens A and B based on Figure 14. As can be seen in Table 7, the maximum transmissibility of specimen A is smaller than the maximum transmissibility of specimen B, and in both specimens, it can be confirmed that the maximum transmissibility occurs in the range of 15–17 Hz.

Figure 13.
(a) Transmissibility and (b) acceleration according to the frequency of Foam B.
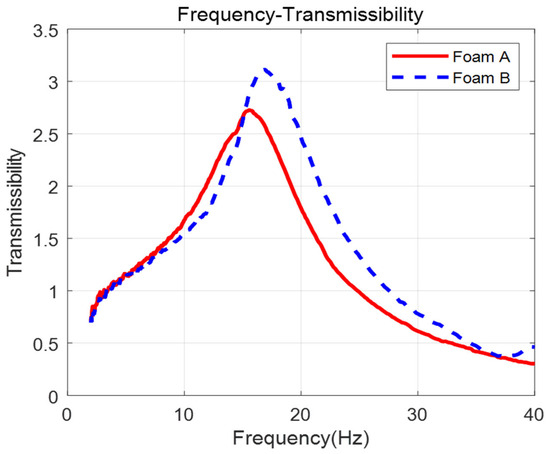
Figure 14.
Comparison of transmissibility according to the frequency of Foams A and B.
Table 7.
Natural frequency and maximum transmissibility of Foams A and B.
4. Conclusions
This study evaluated the mechanical and fire performance of eco-friendly flame-retardant silicone foam for application as a seat cushioning material in railway vehicles. Uniaxial compression and simple shear tests were conducted to derive the static comfort indices, and a second-order Ogden model was applied in the finite element analysis (FEA) to represent the hyperelastic behavior of the silicone foam. The simulation results show a good agreement with the experimental data, confirming the reliability of the developed model as a predictive tool for foam design prior to physical prototyping. The Ogden model used in this study is designed to capture nonlinear elastic (hyperelastic) behavior, and therefore does not account for time-dependent phenomena, such as viscoelasticity or creep. However, by applying the proposed methodology to various foam structures and deriving model parameters from the corresponding experimental data, the model can be calibrated to accurately reflect the behavior of different foam configurations.
Cone calorimeter tests demonstrated that the silicone foam filled with magnesium hydroxide and expandable graphite meets the fire safety requirements for railway interior materials, with a 53.6% reduction in the peak heat release rate and a 48.1% decrease in MARHE. Despite a slight increase in stiffness due to filler addition, static comfort indices, such as hardness, Hysteresis Loss, and Sag Factor, remained within acceptable ranges, supporting its suitability as a cushioning material.
Dynamic transmissibility tests revealed that both foam specimens exhibited favorable vibration isolation characteristics outside the resonance region (below 5 Hz and above 25 Hz), which aligns well with the dominant vibration frequencies observed in subway and high-speed rail systems (e.g., 3.5–5 Hz for subways and 4.5–28 Hz for KTX) [1]. These findings indicate that flame-retardant silicone foam is a promising alternative to conventional polyurethane foam, offering enhanced fire safety, mechanical integrity, and ride comfort.
Future research will explore the optimization of filler content and foam structure to improve weight efficiency, as well as long-term durability and performance under real-world environmental conditions, including temperature cycling and mechanical fatigue. The integration of this material into full-scale seat systems and its validation through real-world rail vehicle testing are also recommended for practical application.
Author Contributions
Conceptualization, T.-S.K. and K.C.; methodology, T.-S.K. and K.C.; software, H.-L.J.; validation, H.-L.J., T.-S.K., and K.C.; formal analysis, S.-J.P., H.-J.S., and Y.-G.S.; investigation, S.-J.P., H.-J.S., and Y.-G.S.; resources, T.-S.K.; data curation, T.-S.K.; writing—original draft preparation, H.-L.J.; writing—review and editing, T.-S.K. and K.C.; visualization, T.-S.K.; supervision, K.C.; project administration, K.C.; funding acquisition, K.C. All authors have read and agreed to the published version of the manuscript.
Funding
This work was supported by the Technology Innovation Program (20013794, Center for Composite Materials and Concurrent Design) funded By the Ministry of Trade, Industry & Energy (MOTIE, Korea), and also supported by the Ministry of Trade, Industry and Energy (MOTIE, Korea) under the Industrial Technology Innovation Program (grant No. 20010265).
Institutional Review Board Statement
Not applicable.
Informed Consent Statement
Not applicable.
Data Availability Statement
The original contributions presented in this study are included in the article. Further inquiries can be directed to the corresponding authors.
Conflicts of Interest
The authors declare no conflicts of interest.
References
- Hong, M.J.; Chae, S.G.; Kang, M.G.; Choi, D.G.; Jang, H.L.; Choi, K.W. Mechanical Reliability Analysis of Flame Retardant Silicone Foam for Mass Transportation. Polym. Korea 2023, 47, 64–71. [Google Scholar] [CrossRef]
- Kwan, W.D.; Lee, J.C.; Seo, K.S.; Seo, C.S.; Kim, S.B. Effect of Flame Retardants on Flame Retardancy of Flexible Polyurethane Foam. Appl. Chem. Eng. 2013, 24, 208–213. [Google Scholar]
- Jang, S.Y.; Kim, S.B. Effect of Blowing Agents on Properties of Phenolic Foam. J. Korean Inst. Gas 2016, 20, 30–34. [Google Scholar] [CrossRef]
- Drysdale, D.D. Unit of Fire Safety Engineering, Fire and Cellular Polymers. Fire Saf. J. 1987, 12, 63–65. [Google Scholar]
- Park, Y.S.; Lee, J.W.; Kang, J.S. Silicorn Polymer. KISTI 2002, 1, 1–13. [Google Scholar]
- Shin, J.H. Componential Analysis of Textiles Treated by Halogen Type Flame Retardants. Korean J. Community Living Sci. 2013, 24, 460. [Google Scholar]
- Park, C.S.; Jung, W.W. Introduction and Recent Trends of Flame Retardants. Rubber Technol. 2000, 8, 114–122. [Google Scholar]
- Lee, G.W. Recent Eco-Friendly Flame Retardant Technology Trends. KISTI 2000, 1, 1–8. [Google Scholar]
- Hardy, M.L. Regulatory Status and Environmental Properties of Brominated Flame Retardants Undergoing Risk Assessment in the EU: DBDPO, OBDPO, PeBDPO and HBCD. Polym. Degrad. Stab. 1999, 64, 545–555. [Google Scholar] [CrossRef]
- Moon, S.C.; Choi, J.K.; Jo, B.W. Flame Retardancy and Foaming Properties of the NBR/Ground Tire Rubber Foams Containing Expandable Graphite. Polym. Korea 2004, 28, 412–425. [Google Scholar]
- Jang, B.N.; Choi, J.H. Research Trends in Flame Retardants and Flame Retardant Resins. Polym. Sci. Technol. 2009, 20, 8–15. [Google Scholar]
- Bae, S.J.; Go, J.W.; Lee, J.Y.; Park, J.H.; Choi, P.J.; Sur, S.H. Flame Retardancy and Physical Properties of Polyurethane Foam with Expandable Graphite. Soc. Adhes. Interface 2019, 20, 96–101. [Google Scholar]
- Kim, I.T.; Moon, J.H.; Ryu, J.H.; Yi, C.H.; Lee, W.K.; Oh, J.S. Perceptual Evaluation of Automotive Polyurethane Foams. Polym. Sci. Technol. 2019, 30, 527–531. [Google Scholar]
- Hong, C.H.; Back, H.S.; Kim, K.M.; Kim, S.Y.; Choi, S.M.; Hwang, T.W. Polyurethane Flexible Foam for Automotive Seat Cushion Having Both Superior Static and Dynamic Properties. Polym. Korea 2007, 31, 47–52. [Google Scholar]
- Lee, B.J.; Lee, S.H.; Choi, K.Y.; Kim, S.B. Effect of Change in Water Content and NCO Index on the Static Comfort of Polyurethane Seat Foam Pad for Automobiles. Appl. Chem. Eng. 2017, 28, 57–63. [Google Scholar]
- Bang, J.H.; Lee, C.A.; Kim, H.Y.; Kim, H.J.; Choi, K.Y. Optimization of the Static Properties of Seat Foam to Improve the Seating Comfort. Proc. Inst. Mech. Eng. Part D J. Automob. Eng. 2017, 231, 1945–1960. [Google Scholar] [CrossRef]
- Lee, B.J.; Kim, S.B.; Mun, J.H. Effect of Foaming Agent Productivity on Static Clamp Reduction of Flexible Polyurethane Foam for Automobile Seats. Korean Soc. Ind. Eng. Chem. 2015, 26, 272. [Google Scholar]
- ASTM D 3574-03; Standard Test Method for Flexible Cellular Materials-Slab, Bonded, and Molded Urethane Foams. Frazier Precision Instrument Company, Inc.: Hagerstown, MD, USA, 2024.
- Kim, W.D.; Kim, W.S.; Woo, C.S.; Lee, H.J. Experimental Testing of Rubber Materials for Finite Element Analysis. Proc. KSME Conf. A 2001, 29, 704–709. [Google Scholar]
- Kim, H.Y.; Choi, C.; Bang, W.J.; Kim, J.S. Large Deformation Finite Element Analysis for Automotive Rubber Components. J. Korean Soc. Automot. Eng. 1993, 15, 107–119. [Google Scholar]
- Park, W.J.; Hwang, H.H. Prediction of Failure Mode Under Static Loading in Long Span Bridge Deck Slabs by FEM. J. Korea Inst. Struct. Maint. Insp. 2012, 16, 52–59. [Google Scholar]
- Lee, K.S.; Ki, M.S.; Park, B.J. Comparative Study on the Nonlinear Material Model of Hyperelastic Material Due to Variations in the Stretch Ratio. J. Ocean Eng. Technol. 2018, 32, 253–260. [Google Scholar] [CrossRef]
- Briody, C.; Duignan, B.; Jerrams, S. Testing, modelling and validation of numerical model capable of predicting stress fields throughout polyurethane foam. In Constitutive Models for Rubber VII; CRC Press: Boca Raton, FL, USA, 2011; p. 143. [Google Scholar]
- Briody, C.; Duignan, B.; Jerrams, S.; Tiernan, J. The implementation of a visco-hyperelastic numerical material model for simulating the behaviour of polymer foam materials. Comput. Mater. Sci. 2012, 64, 47–51. [Google Scholar] [CrossRef]
- Ju, M.L.; Jmal, H.; Dupuis, R.; Aubry, E. Visco-hyperelastic constitutive model for modeling the quasi-static behavior of polyurethane foam in large deformation. Polym. Eng. Sci. 2015, 55, 1795–1804. [Google Scholar] [CrossRef]
- Jang, H.L.; Kwon, T.S.; Park, W.H.; Lee, D.H.; Kim, S.R.; Bae, Y.H. A Study on Strength Properties of Sandwich Panels Including Flame Resisting Polyurethane Foam Cores for Application to Rolling Stocks. J. Korean Soc. Hazard Mitig. 2017, 17, 227–234. [Google Scholar] [CrossRef]
- Kim, D.M.; Min, K.W.; Park, H.K.; Park, J.H. Measurement of the Distributed Dynamic Stiffness of Seats and Analysis of Dynamic Properties of Seats. In Proceedings of the Korean Society for Noise and Vibration Engineering Conference, Daegu, Republic of Korea, 29–31 October 2014; Korean Society for Noise and Vibration Engineering: Seoul, Republic of Korea; pp. 994–995. [Google Scholar]
- Ryu, S.C.; Jun, Y.D. Hold Feeling Assessment of Vehicle Seat Cushions. Trans. Korean Soc. Automot. Eng. 2021, 29, 1025–1032. [Google Scholar] [CrossRef]
- Wang, W.; Yang, F.; Lu, Y.; Luo, Z.; Li, F.; Wu, Y.; Zhang, J.; Xiao, Z.; Li, W.; Qin, C. Application of Magnesium Hydroxide/Diphenoxy Phosphate in Silicone Rubber Flame Retardant Cable Material. Coatings 2023, 13, 934. [Google Scholar] [CrossRef]
- Hong, L.; Hu, X. Mechanical and Flame Retardant Properties and Microstructure of Expandable Graphite/Silicone Rubber Composite. J. Macromol. Sci. Part B Physics. 2016, 55, 175–187. [Google Scholar] [CrossRef]
- Sato, T.; Ikoma, S.; Ozawa, F.; Nakamura, T. Thermal Decomposition of Magnesium Hydroxide. Gypsum Lime 1982, 181, 283–289. [Google Scholar]
- ISO 5660-1:2015; Reaction-to-Fire Tests-Heat Release, Smoke Production and Mass Loss Rate-Part 1: Heat Release Rate (Con Calorimeter Method) and Smoke Production Rate (Dynamic Measurement). International Organization for Standardization: Geneva, Switzerland, 2015.
- KS M ISO 3386-2:2013; Methods for Measuring Compressive Stress-Strain Characteristics of Soft Foamed Polymer Materials—Part 2: High Load Applications. Korean Agency for Technology and Standards: Eumseong, Republic of Korea, 2013.
- KS M ISO 1827:2014; Vulcanized or Thermoplastic Rubber—Measurement of Adhesion to a Rigid Plate. Korean Agency for Technology and Standards: Eumseong, Republic of Korea, 2014.
- EN 45545-2; Fire Protection on Railway Vehicles. Technical Information. Plastic Materials and Processes (NZ) Ltd.: Auckland, New Zealand, 2020.
- Casavola, C.; Del Core, L.; Moramarco, V.; Pappalettera, G.; Patronelli, M. Full-Field Experimental Study and Numerical Modeling of Soft Polyurethane Foam Subjected to Cyclic Loading. Phys. Sci. Forum 2022, 4, 20. [Google Scholar]
- Moon, S.Y.; Lee, S.Y.; Lim, H.M. Flame Retardant Properties of Basalt Fiber Reinforced Epoxy Composite with Inorganic Fillers. Compos. Res. 2019, 32, 368–374. [Google Scholar]
- Kim, D.M.; Min, K.W.; Park, H.K.; Park, J.H. Evaluation of Vibration Comfort Using Dynamic Properties of Vehicle Seats. Korean Soc. Noise Vib. Eng. 2015, 15, 883–884. [Google Scholar]
- Ogden, R.W. Large Deformation Isotropic Elasticity–On the Correlation of Theory and Experiment for Incompressible Rubberlike Solids. Rubber Chem. Technol. 1973, 46, 102–124. [Google Scholar] [CrossRef]
- Ogden, R.W. Recent Advances in the Phenomenological Theory of Rubber Elasticity. Rubber Chem. Technol. 1986, 59, 361–383. [Google Scholar] [CrossRef]


Disclaimer/Publisher’s Note: The statements, opinions and data contained in all publications are solely those of the individual author(s) and contributor(s) and not of MDPI and/or the editor(s). MDPI and/or the editor(s) disclaim responsibility for any injury to people or property resulting from any ideas, methods, instructions or products referred to in the content. |
© 2025 by the authors. Licensee MDPI, Basel, Switzerland. This article is an open access article distributed under the terms and conditions of the Creative Commons Attribution (CC BY) license (https://creativecommons.org/licenses/by/4.0/).