Article

Simulation-Based Assessment of Evacuation Efficiency in Sports Stadiums: Insights from Case Studies

1
Department of Architecture, National Taiwan University of Science and Technology, Taipei 106335, Taiwan
2
Department of Architecture and Urban Design, Chinese Culture University, Taipei 11114, Taiwan
*
Authors to whom correspondence should be addressed.
Fire 2025, 8(6), 210; https://doi.org/10.3390/fire8060210
Submission received: 22 April 2025 / Revised: 20 May 2025 / Accepted: 22 May 2025 / Published: 26 May 2025
(This article belongs to the Special Issue Building Fires, Evacuations and Rescue)

Abstract

Architectural design seeks to address many challenges, one of which is creating buildings that can quickly and safely evacuate people. Therefore, it is even more important to pay attention to the safety of personnel evacuation. Past disasters have shown that the number of casualties in large sports stadiums can be as severe as those caused by plane crashes. This study uses a case study approach to analyze the evacuation of spectators in a 40,000-seat stadium, comparing the practical application of three performance verification methods. The results indicate that Simulex’s visual dynamic simulation effectively reflects how walking speeds decrease in crowded conditions and how bottlenecks form along evacuation routes. People tend to gather at corners, leading to congestion and uneven distribution of evacuees, with several escape staircases being underutilized. The Guide to Safety at Sports Grounds is suitable for the early planning stages of architectural design, while the “Verification Guideline of Buildings Evacuation Safety Performance-based Design” is better suited for the detailed design phase to ensure compliance with the safety standard of evacuating spectators within 8 min. Compared to planning and designing based solely on regulations or empirical verification formulas, using visualization software allows for effective adjustments to evacuation routes before finalizing the design, balancing crowd flow across all safety exits and improving evacuation efficiency during the operational phase.

1. Introduction

Due to the social nature of humans, the frequency of large gatherings such as events, sports competitions, and music performances has significantly increased after the COVID-19 pandemic. These activities often require large stadium spaces to host events. Therefore, it is essential to re-evaluate and study the evacuation safety of stadium seating in order to develop innovative evacuation strategies that enhance and improve evacuation efficiency.
In recent years, the demand for large venues such as stadiums and arenas has increased significantly [1]. In addition to the rationality, practicality, and aesthetic value of seat distribution, architects should also consider evacuation safety [2]. The most reliable method is to use optimal spatial planning decisions for the building and structure [3]. When people leave their seats and move along the stairways and concourses of the stadium area, their flow will undergo significant changes [4]. Design guidelines for evacuation, including controlling crowd gathering and the sequence of evacuation, can improve evacuation efficiency [5]. Establishing emergency evacuation simulation models helps analyze the effectiveness of evacuation strategies [6]. By simulating individual behaviors with the model, it is shown that reasonable exit configurations can effectively reduce evacuation time, highlighting the importance of design considerations [7]. A framework for evaluating evacuation times in sports facilities can assist designers in verifying the safety plans of venues [8]. By analyzing the flow of people, we can identify the factors affecting the safe and timely evacuation of individuals to safety zones. These parameters should include evacuation time, number of people, pedestrian density, the horizontal projection area of individuals, the geometric parameters of evacuation routes, and the design features of the building [9]. Participants are often unfamiliar with the evacuation routes, which may increase the time required to find their way during an event. Pre-evacuation behavior itself can be influenced by several variables, such as social distractions, media noise, or alcohol consumption. In such cases, in addition to guidance from staff [10], fire evacuation design plays an important role in improving the fire safety standards of the stadium [11]. When large public spaces face emergencies, pedestrians need to be evacuated to safety zones in the shortest time possible, which can easily lead to crowding and stampede incidents. Therefore, effective evacuation guidance and layout are important means to improve pedestrian evacuation efficiency and ensure safety [12]. Pure herd behavior means the entire crowd will eventually move toward the same direction, which could become blocked, and thus available exits are not effectively utilized [13]. Using barriers to divert people at emergency exits cannot be considered a universal solution to the bottleneck congestion problem. We believe that crowd management and the design of escape facilities must be considered at the macro scale [14]. Evacuation simulations can also assist safety management authorities in predicting crowd flow and identifying potential bottlenecks [15]. Based on the literature review of the background context, we have identified the current research issues related to stadiums and summarized the following key points:
  • Prevention and Planning
During the design phase of stadiums, key considerations should include building safety, crowd and pedestrian flow management, regular equipment inspections, and a comprehensive maintenance plan.
2.
On-site Response and Emergency Plans
During stadium operations, it is crucial to implement clear emergency response plans and notification systems. Other considerations include security screening, counter-terrorism measures, and preparedness for medical emergencies and first aid.
3.
Safety Awareness for Spectators and Staff
To ensure safe operations, efforts should be made to enhance safety awareness through public education for spectators and ongoing safety training for staff.
4.
Post-Incident Response and Improvement
In the event of a disaster at a stadium, psychological counseling should be provided for affected individuals, and open communication with the public should be maintained. Transparent and accurate information should be released through official channels to prevent the spread of rumors and public panic. These actions are crucial for effective crisis management.
The FIFA World Cup is held every four years, and the Summer and Winter Olympics are held every two years. Large stadiums have unique architectural forms and accommodate a large number of people. When a fire or other accidental incidents occur, the issue arises of having to evacuate a large crowd from the same space. Before being affected by fire, smoke, or heat waves, panic and stampede incidents are more likely to occur. This is a common and significant issue that deserves research into potential solutions. Statistics of major accidents at sports venues worldwide over the past 100 years [16,17] show that stampede incidents at stadiums have caused 23 accidents, resulting in at least 1380 deaths. A recent example occurred on 1 October 2022, at the Kanjuruhan Stadium in Malang, East Java, Indonesia, where a stampede incident caused 135 deaths and 583 injuries [18].
Through a review of relevant literature, we found that there is a research gap in comprehensively integrating appropriate performance-based verification methods into the design and planning process of sports stadiums. Addressing this gap is crucial to suggest improvements and provide solutions to prevent incidents that may occur without adequate response. However, since activities at sports venues are a regular human behavior, incidents at these venues continue to occur. Therefore, in the era of artificial intelligence following the computer revolution, we should be able to identify the correct solutions through the use of computer software for evaluation and improvement.
The construction of a stadium in a city can showcase its economic development and investment potential. Building a stadium is often part of the city’s development, symbolizing its modernization and progress. A stadium represents the city’s emphasis on sports, which helps improve citizens’ health awareness and quality of life. If a stadium can host large international events, it can enhance the city’s global recognition, attracting more tourists and investors. A stadium is not just a venue for competitions but also a gathering place for local residents, fostering community cohesion and city pride. Therefore, we take Taiwan’s latest and largest stadium as a case study, using three research methods—qualitative analysis, quantitative analysis, and computer simulation software—to explore how stadiums can be designed to achieve safety and reliability, minimizing casualties in the event of an accident.
To ensure that a building can effectively protect the lives of occupants during a fire, an effective method to address the aforementioned issues is to use fire safety performance-based design to evaluate the effectiveness of evacuation facilities. Therefore, the UK’s DCMS guidelines on stadium design, Guide to Safety at Sports Grounds [19], serve as a reference for spectator seating evacuation design. This guide outlines the characteristics of evacuation behavior and the psychological stress experienced by individuals during emergencies. It specifies that spectators should be evacuated from the seating area within 8 min. The 8 min limit is based on research and experience, indicating that, within this timeframe, spectators are unlikely to become overly agitated or experience frustration and stress. This provides the crowd with an acceptable amount of time to enter the evacuation system and ultimately evacuate to safe levels or locations. This guideline is referenced to examine whether the seating area of the stadium in this study meets the evacuation safety standards.
Therefore, this study uses the design of a newly completed and operational large stadium in Asia as an example, which is more representative of large sports venues. It examines the evacuation safety of the stadium’s spectator seating and evaluates the effectiveness of the evacuation facilities using the performance-based design method. Through the design procedures and steps of this method, the study assesses whether the building’s evacuation facilities can effectively and quickly evacuate crowds during a fire, providing accurate evacuation safety design for the building.

2. Materials and Methods

The performance-based fire safety design method is an important basis for the design of special buildings. It is used to calculate the time required for safe evacuation during a fire and compare it with the allowable evacuation time, to assess whether the occupants can safely escape the space, ensuring their life safety.
This study utilizes three performance-based design methods: the UK’s DCMS “Guide to Safety at Sports Grounds” [19], Taiwan’s Ministry of the Interior Building Research Institute “Verification Guideline of Buildings Evacuation Safety Performance-based Design” [20], and the evacuation simulation software “Simulex” developed by Integrated Environmental Solutions in the UK [21]. These three design methods are applicable to the design practices in Taiwan.
This study evaluates several commonly used evacuation simulation software tools, including FDS + Evac, Pathfinder, and Simulex. Given that the research focus is on human movement behavior and the impact of exit configurations on evacuation efficiency—rather than the simulation of fire dynamics and smoke propagation—Simulex was selected as the primary simulation tool. Simulex utilizes an agent-based modeling approach to simulate individual movement behavior within a space. It can predict evacuation time and identify potential congestion areas based on various environmental configurations and crowd characteristics. Due to its relatively intuitive user interface and its widespread application in both academic research and engineering practice, Simulex is considered one of the most common and reliable simulation tools for building fire safety design and evacuation analysis.

2.1. Methods and Procedures for Implementation

This study assumes that during the design and planning phase of a sports stadium, a combination of two empirical formula-based performance verification methods and computer simulation (using Simulex) are applied to conduct crowd evacuation analysis. It is assumed that, in the event of a disaster, all occupants within the stadium have a strong intention to evacuate, will not return to the hazardous area once they have escaped, and will not exhibit abnormal or irrational evacuation behavior due to panic.
First, the evacuation design conditions of the case are explored, including the configuration of the seating, number of seats, walking distance, exit width, etc. Then, an analysis of the evacuation time is conducted, discussing parameters such as the design of escape routes, types of verification methods, and the evacuation behavior of occupants. The research process is detailed in Figure 1. Using three performance-based design methods, an early evaluation of the building’s evacuation design is conducted. The verification results are quantified with data and compared with the design model for analysis. The differences in the practical application of the three performance verification methods are then explored through evacuation analysis. This allows for a deeper understanding of how various factors affect overall evacuation efficiency. Based on these analysis results, appropriate adjustments are made to the design to ultimately enhance the overall escape safety effectiveness.

2.2. Summary of Evacuation Simulation Software and Verification Calculation Methods

2.2.1. Guide to Safety at Sports Grounds

In recent years, the Guide to Safety at Sports Grounds [19], published by the UK Department for Digital, Culture, Media and Sport (DCMS) and commonly known as the Green Guide, has become a key international reference standard for the design and operation of sports stadiums. The guide provides comprehensive principles on spectator capacity calculation, crowd flow planning, and emergency evacuation route design. It is not only applicable in the United Kingdom but has also been widely adopted as a foundational reference for stadium safety regulations in many countries [22,23,24]. In this study, the recommended evacuation time calculation standards provided in the Green Guide are used as a reference for stadium egress design. Specifically, Section 10.5 to 10.7 of the Sports Ground Safety Design Guide specify the calculation standards for stadium evacuation rates and evacuation times.
The stadium safety design guidelines recommend following the design standards for spectator seating areas in spectator facilities [25], with the suggested values as follows:
  • On a stepped floor surface, 66 spectators per meter width per minute can reasonably evacuate.
  • On a level floor surface, 82 spectators per meter width per minute can reasonably evacuate.
Calculation of Spectator Evacuation Time (1):
Tescape = Σ P Σ N e f f B e f f
Tescape: Total time required for evacuation.
P: Number of spectators in the area (persons).
Neff: Flow rate (persons/min/m).
Beff: Exit width (m).
The Guide to Safety at Sports Grounds specifies the characteristics of personnel evacuation under emergency conditions and the psychological stress they may experience. Spectators should evacuate the seating area within 8 min. This 8 min limit is based on research and experience, suggesting that within this time, spectators are unlikely to become agitated or experience frustration or stress. It allows the crowd to enter the evacuation system within an acceptable time frame, ultimately evacuating to a safe area or refuge.

2.2.2. Verification Guideline of Buildings Evacuation Safety Performance-Based Design

This manual is published by the Architecture and Building Research Institute of Taiwan’s Ministry of the Interior [20]. It divides the evacuation process in a building into three stages: residential evacuation safety verification, floor evacuation safety verification, and overall building evacuation safety verification. This study focuses on evaluating the evacuation performance of the seating area, using residential evacuation safety verification to review the safety of spectators evacuating from the seats.
The study targets the spectators in the seating area of the stadium, evaluating the time required for evacuation from any point in the area to the designated refuge space in the concourse on that level.
The calculation of evacuation time for the seating area can be divided into three parts (2) as follows:
  • The time to start the evacuation (3),
  • The time to reach the exit (4),
  • The time to pass through the exit (5).
Tescape = Tstart + Ttravel + Tqueue
Tescape: Total evacuation time required.
Tstart: The time required to start evacuation includes the time from the occurrence of the fire to the awareness of the fire alarm action, as well as the time from awareness to the initiation of evacuation actions (3).
Evacuation start time (3):
Tstart = Σ A a r e a 30
Aarea: The total floor area of the spectator seating area (m2).
Ttravel: The time required to reach the exit is calculated by dividing the longest evacuation path distance by the walking speed, as per the following Formula (4).
Time to reach the exit (4):
Ttravel = l i v
V: Walking speed (m/min): 27 m/min for stairs going up, 36 m/min for stairs going down, 30 m/min for between seating areas, and 60 m/min for horizontal walkways.
li: The farthest walking distance to reach the exit (m).
Tqueue: The time required to pass through the exit refers to the delay caused by personnel in front of them as they pass through the exit. The total time spent to clear the congestion and allow all individuals to pass through the exit is the time required to pass through the exit, calculated using the following Formula (5).
Time to pass through the exit (5):
Tqueue = Σ P Σ N e f f B e f f
P: The number of spectators in the area (people).
Neff: The maximum effective flow rate coefficient is 90 (people/min/m). It is necessary to analyze the total number of evacuees in the seating area and the number of people that the concourse can accommodate to determine if there is congestion, which would result in a decrease in the effective flow rate coefficient.
Beff: Effective exit width (m).

2.2.3. Evacuation Simulation Software (Simulex)

Simulex (Version 5.0) is an evacuation simulation software developed by Integrated Environmental Solutions (IES) in the UK [21], designed for simulating the evacuation of buildings. Simulex adopts an agent-based modeling approach, which simulates the movement behavior of individuals within a space. It can predict evacuation time and identify potential congestion areas based on varying environmental configurations and crowd characteristics. The software is particularly suitable for buildings with complex compartment layouts and large interior areas, as well as high occupant loads.
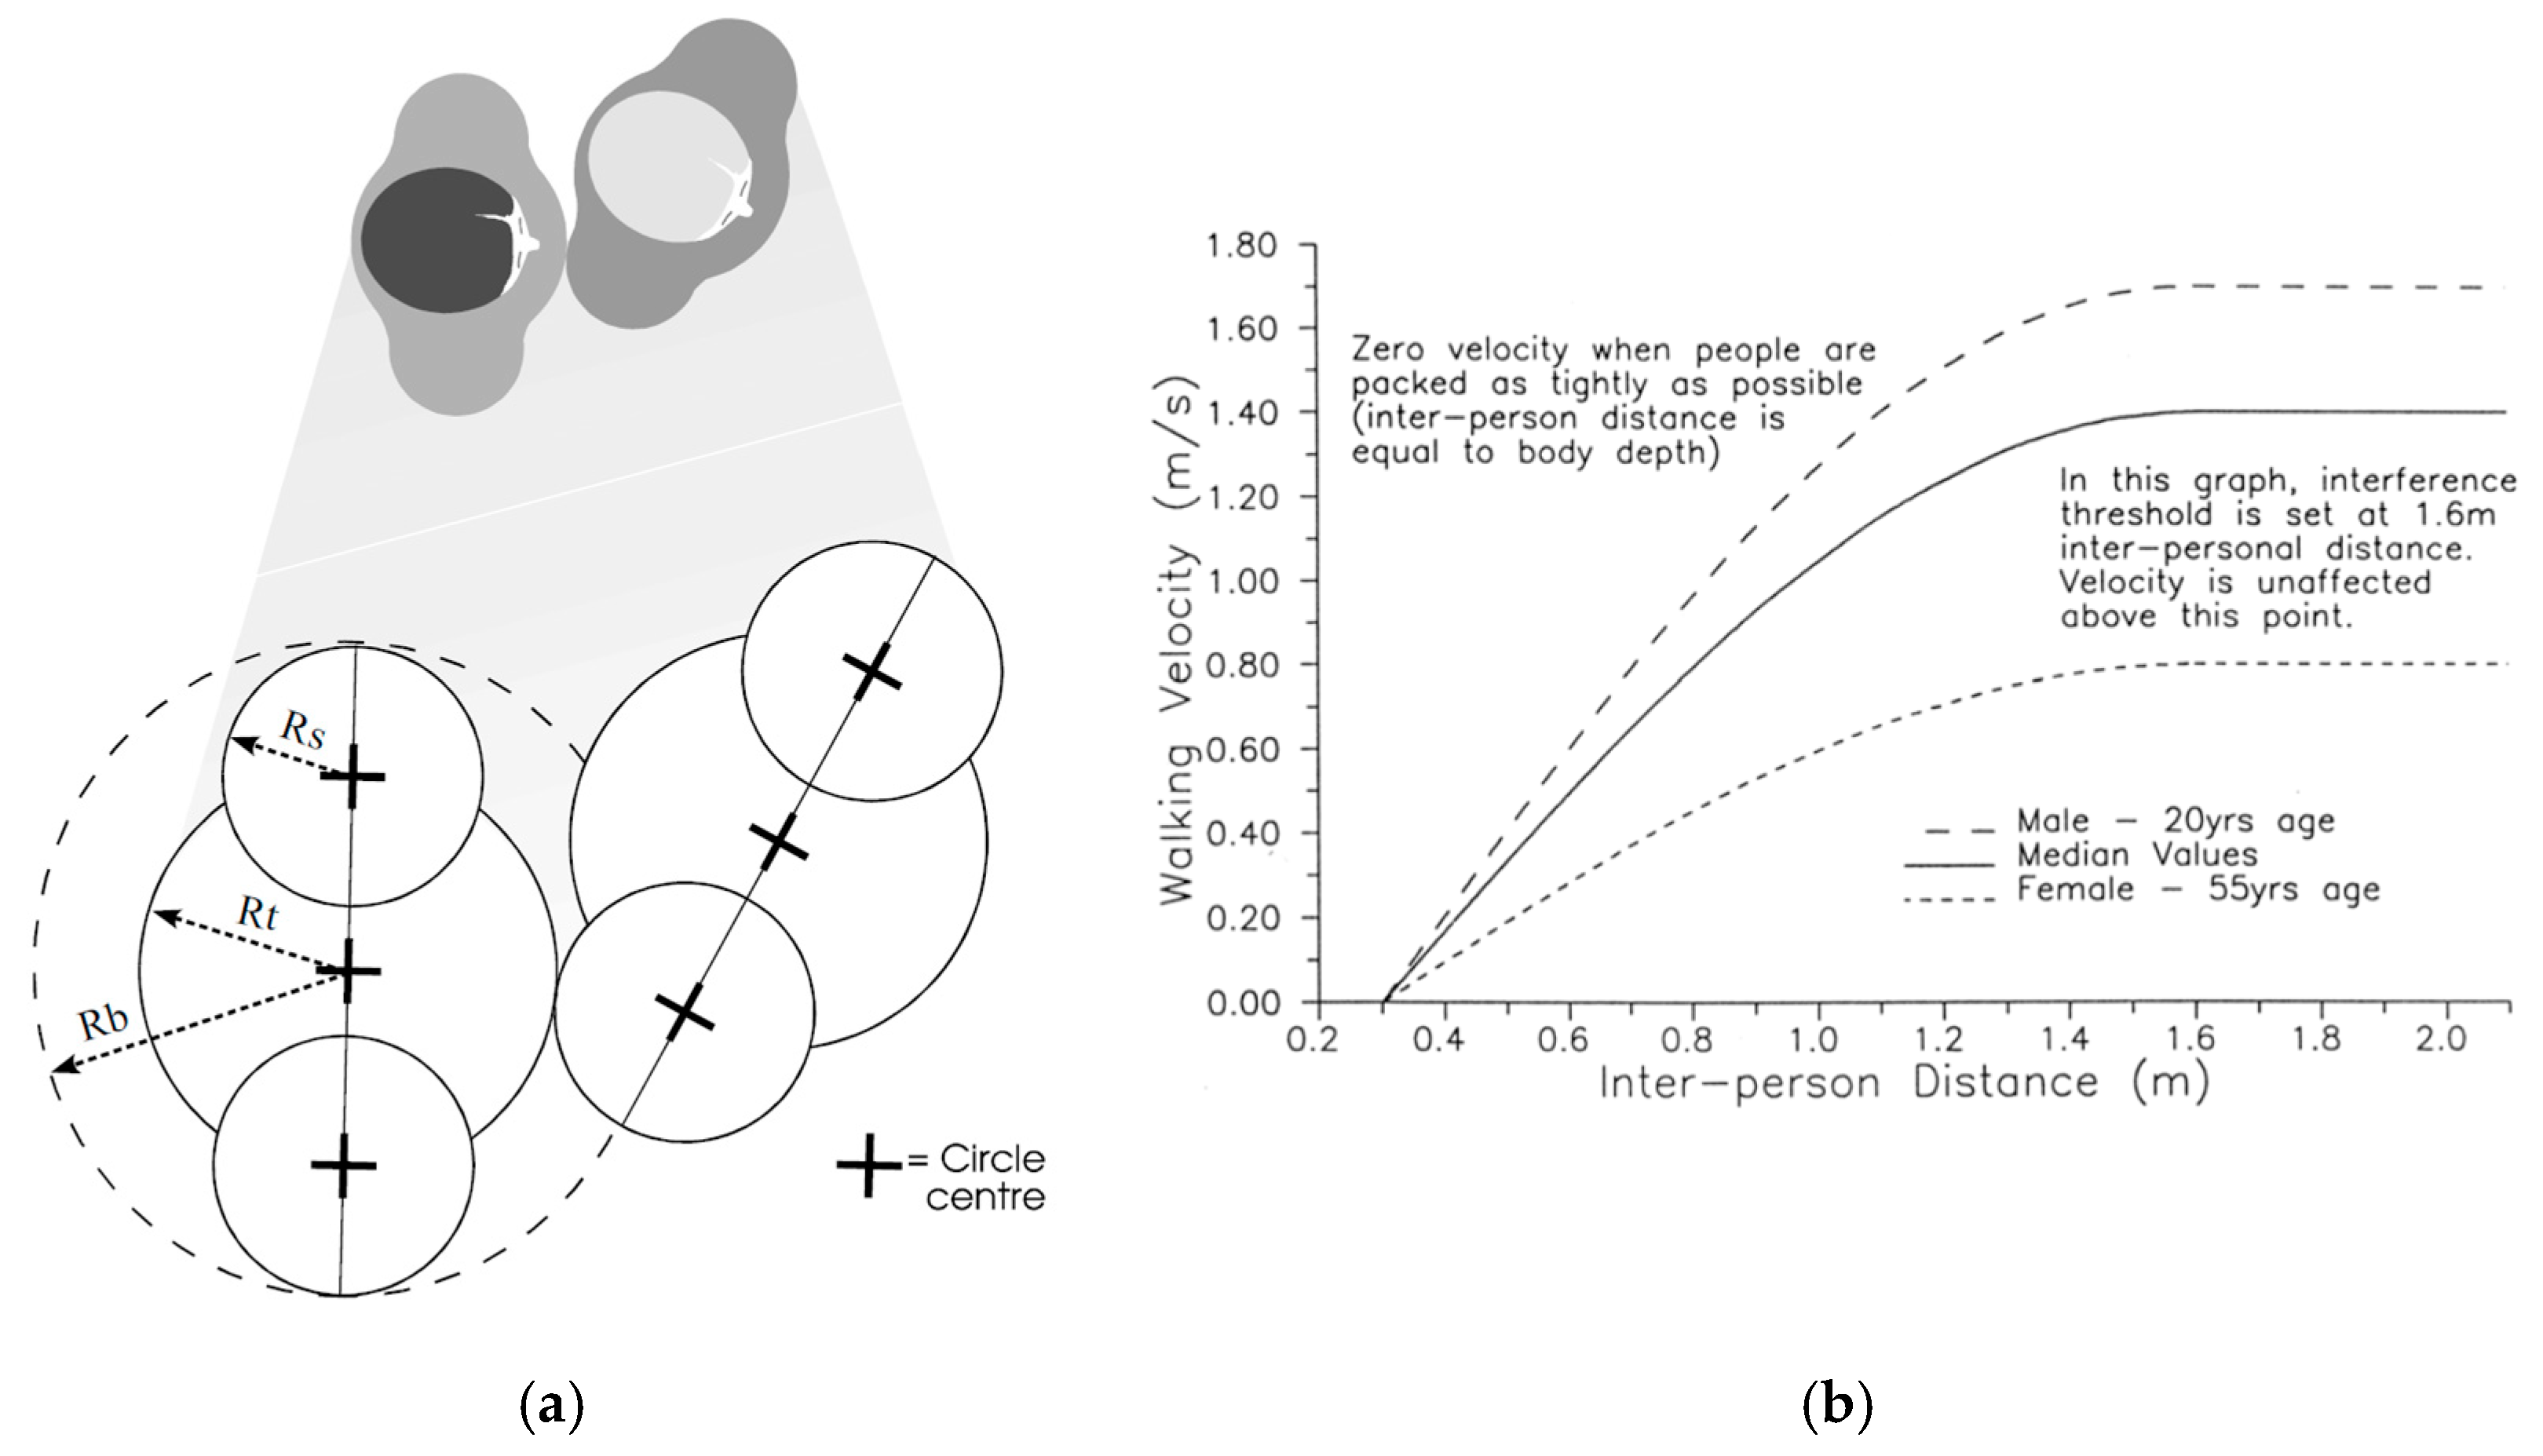
In Simulex, walking speed is determined by the distance between individuals, as illustrated in Figure 2a. When a person is more than approximately 1.6 m from the person ahead, their walking speed is randomly set within the range of 0.8 to 1.7 m/s. However, when the distance to the person in front drops below 0.3 m, walking speed decreases to zero, creating a queuing or crowding effect. The relationship between inter-person distance and walking speed is shown in Figure 2b. This method more accurately reflects the actual movement characteristics of individuals compared to traditional methods that estimate walking speed solely based on occupant density.
All simulation software has its limitations. Regarding Simulex, the following key assumptions about occupant behavior during the evacuation process are made, which form the basis of the decision-making logic and movement patterns of individuals within the simulation:
  • Individual behavior is self-steering, meaning each occupant independently chooses to move toward the nearest accessible exit. This route is guided by a pre-calculated “Distance Map”, and each individual moves along the direction of the shortest path.
  • The model does not account for complex social interactions or herd behavior. It assumes individuals select exits based on the Distance Map and are not significantly influenced by the behavior of others (e.g., following crowds, panic, or changing exit goals due to congestion). However, crowding and density do affect movement speed.
  • Basic bodily motion adjustments are supported. The model allows for minor lateral movements and turning, overtaking behavior (only when space permits), and simple avoidance strategies such as stepping backward and rerouting. Nevertheless, the model does not include abnormal evacuation behaviors such as panic running, falling, or pushing.
As a two-dimensional space simulation program, Simulex can link different floors using stairs to simulate multi-floor evacuation. It also accounts for the fact that people walk slower when going upstairs compared to going downstairs. Simulex has a comprehensive database that models the different walking speeds of individuals while moving between floors. This allows for a realistic simulation of how people behave and move during evacuation within a building.
Simulex provides valuable insights during the design phase of buildings, offering references for determining evacuation routes and the placement of evacuation facilities to ensure efficient and safe evacuation.
The detailed assumptions and conditions used in the Simulex simulation for this study are listed in Table 1.

2.3. Stadium Design Description

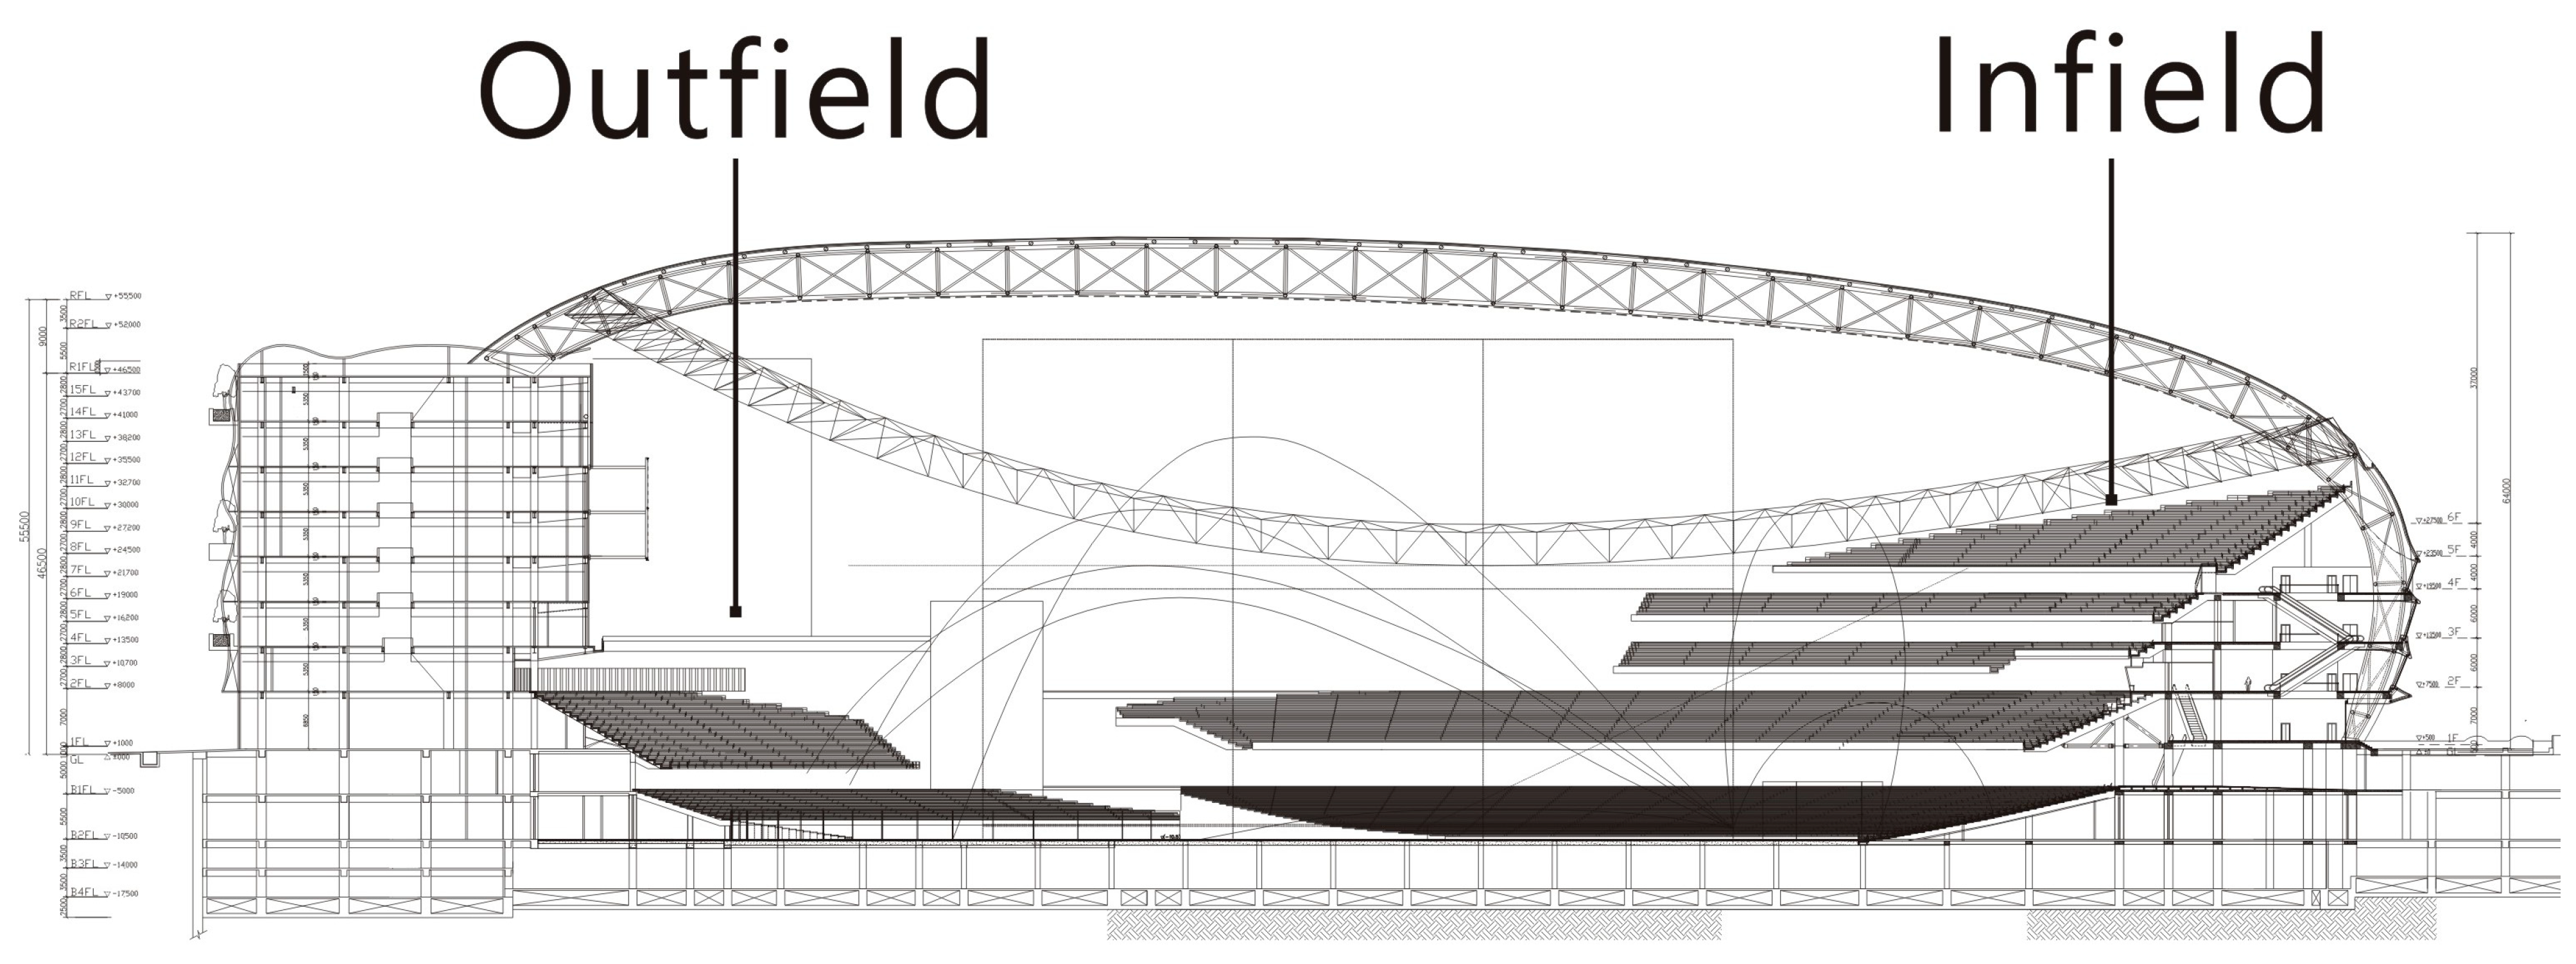
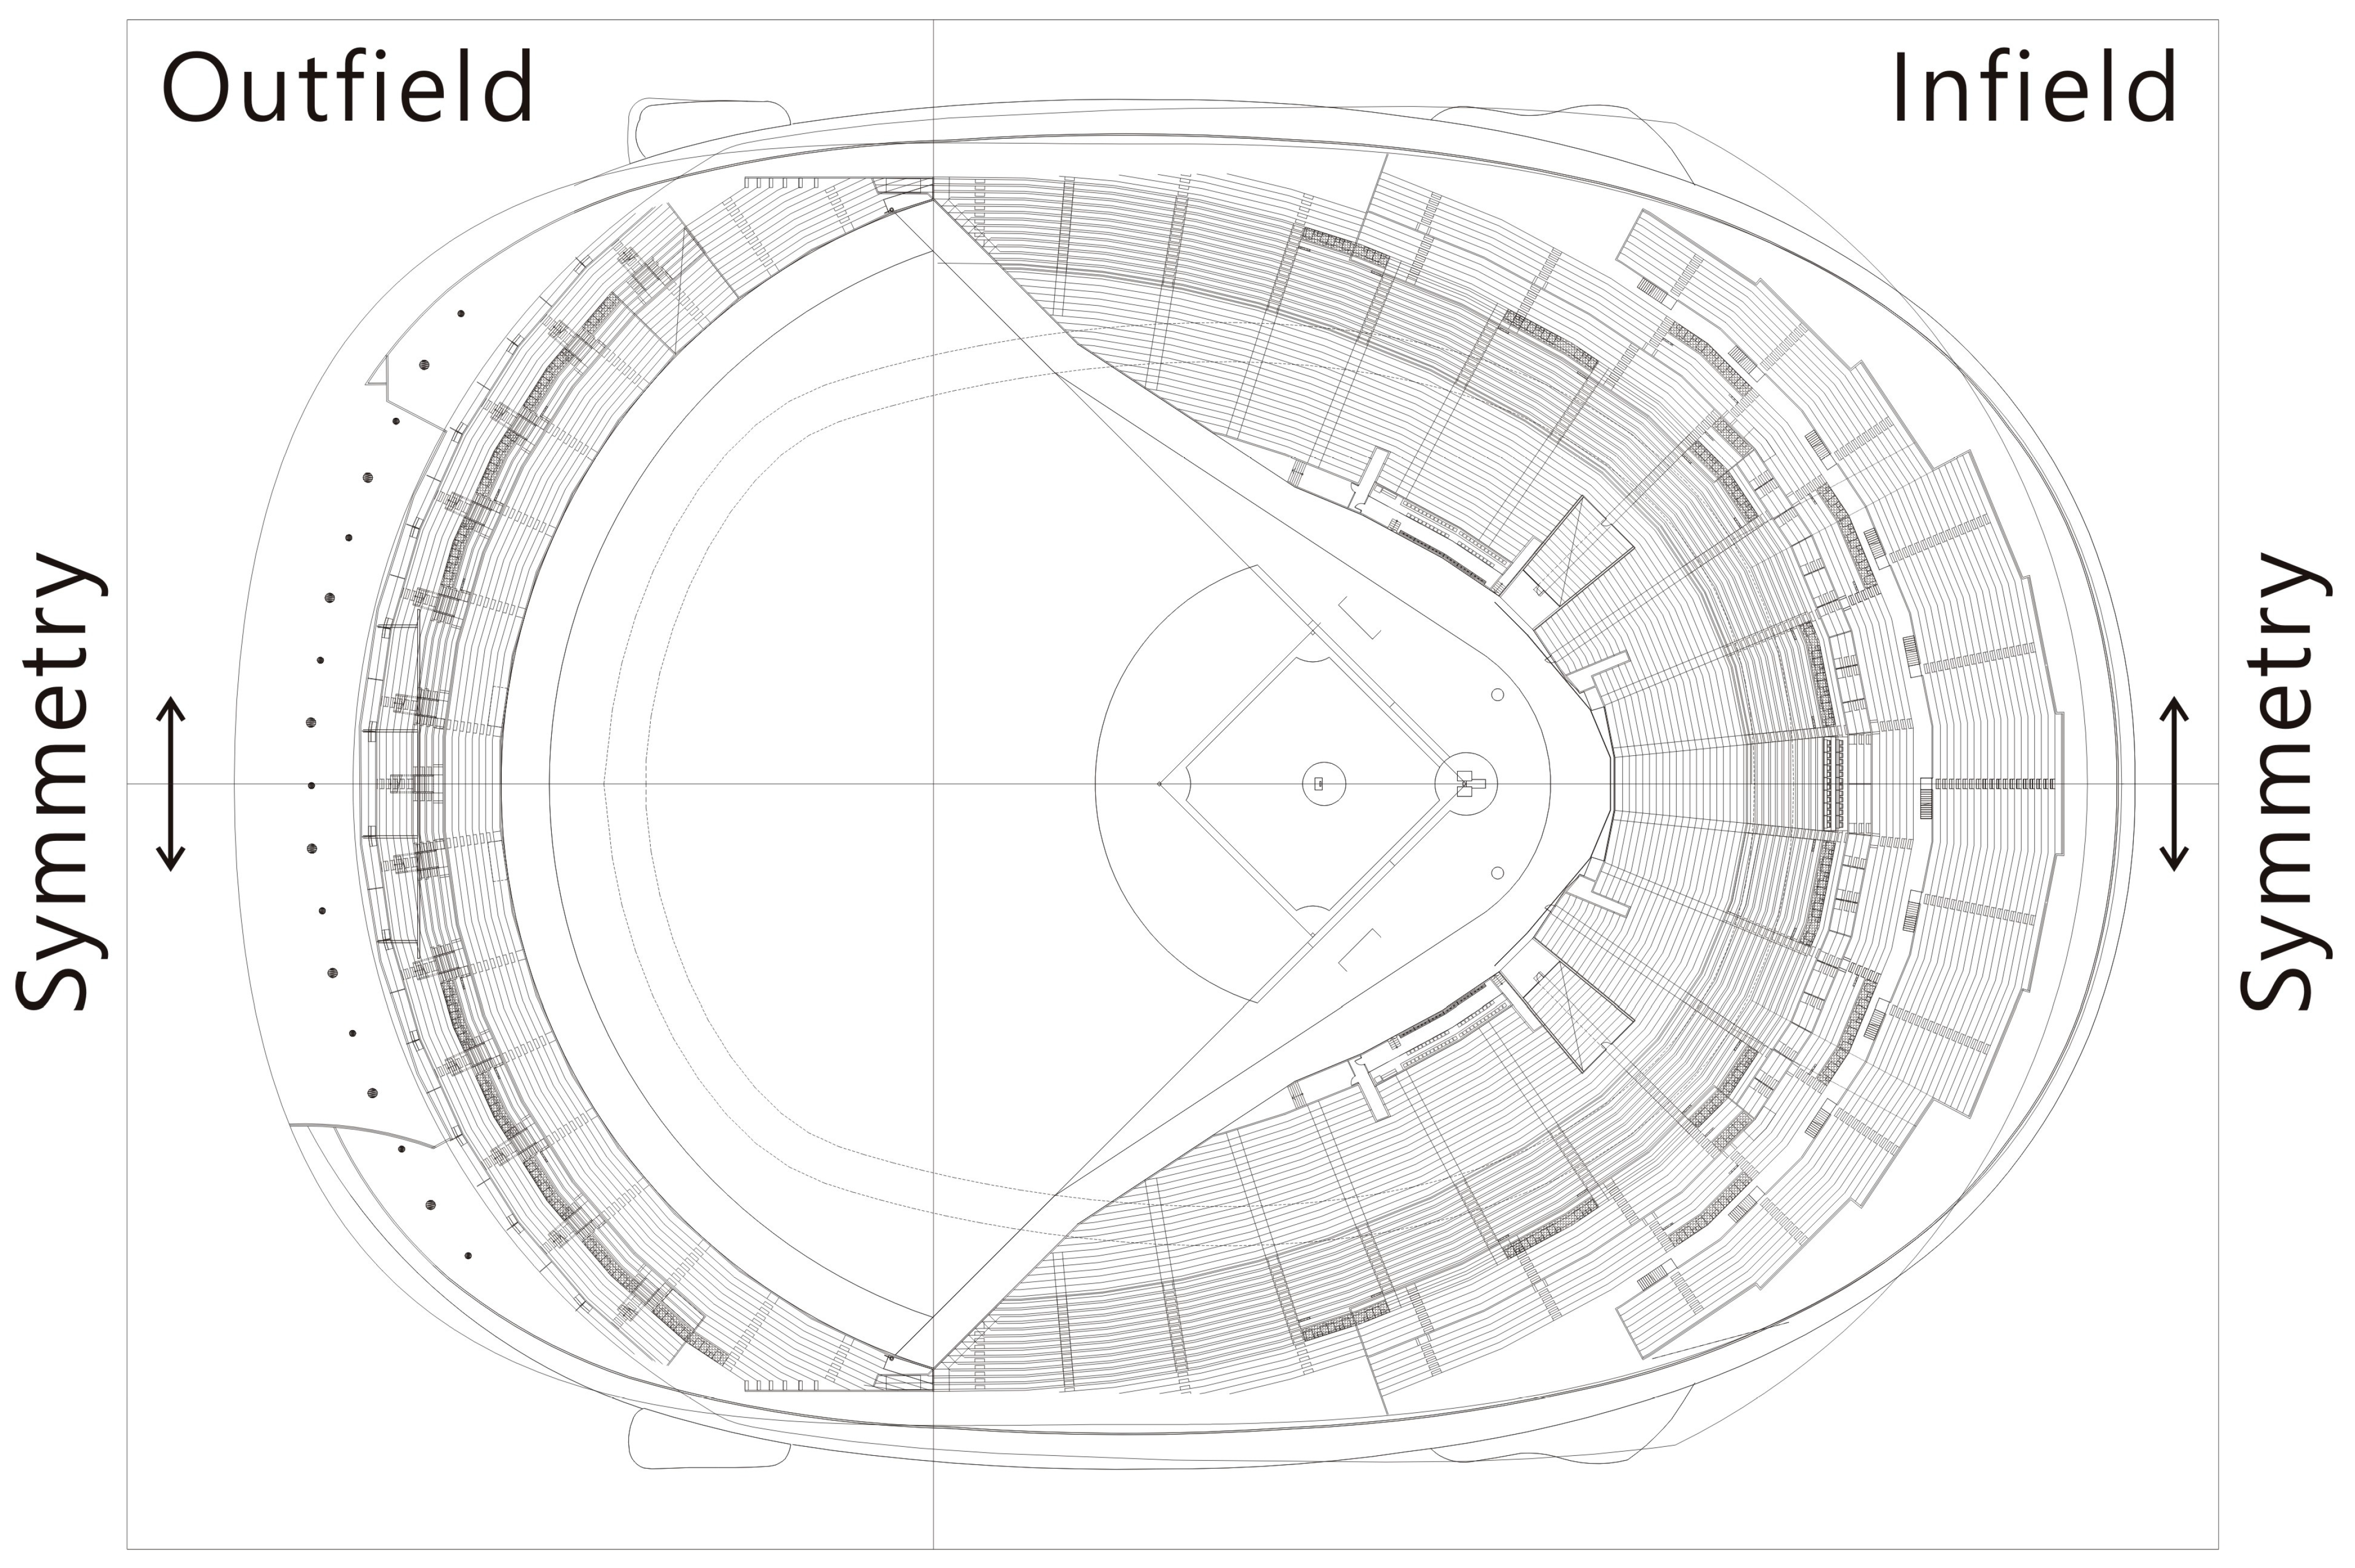
The building for this research case, the “Taipei Dome”, hosted its first official event, the “2023 Asian Baseball Championship”, on 3 December 2023. The stadium’s architectural dimensions are 222 m in length, 164.5 m in width, and 65 m in height, with a seating capacity of 40,000. It is a large-scale sports venue designed to serve functions such as sports competitions, assemblies, and performances, providing a spacious indoor environment. The seating layout is divided into the infield and outfield areas, as shown in Figure 3 and Figure 4, with a symmetrical arrangement for the seats as depicted in Figure 3. The seating capacity on each level is outlined in Table 2.
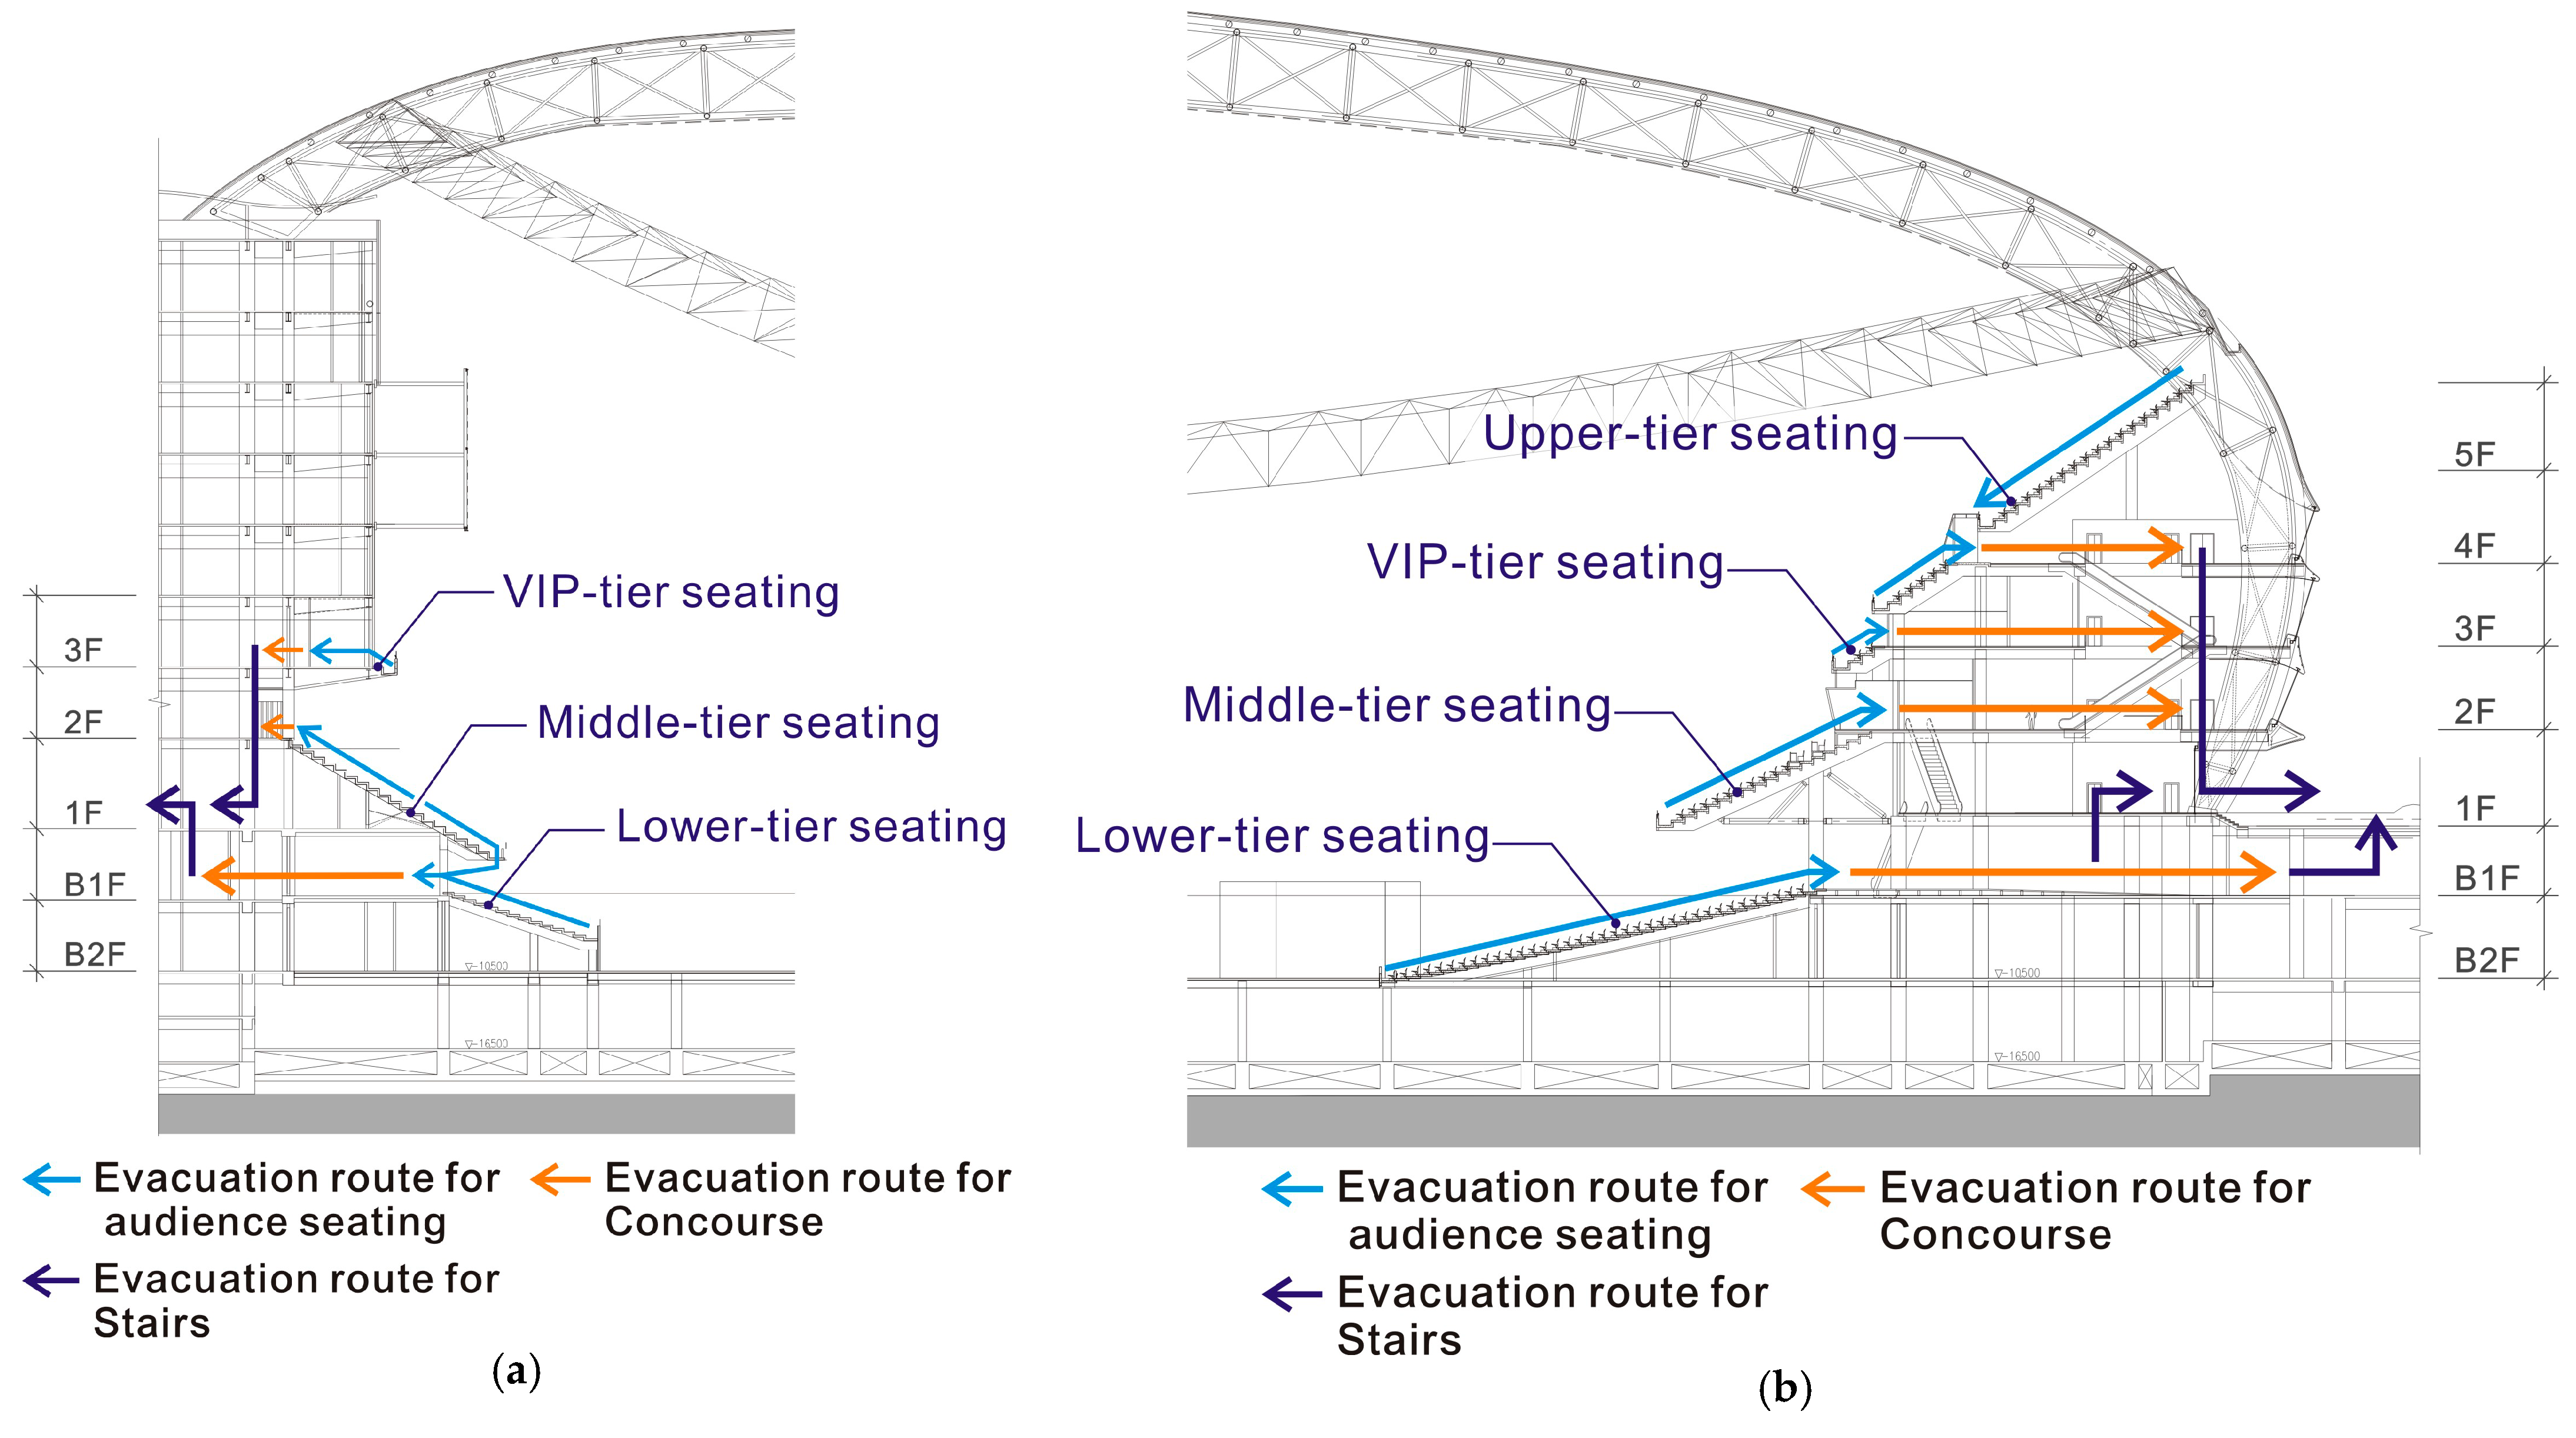
The Infield Spectator Seating in the stadium is divided into four levels: Lower Level, Middle Level, VIP Level, and Upper Level. The evacuation routes for the spectator seating are shown in Figure 5b. The evacuation route planning for each level involves evacuating from the seating areas to the concourses, then directly to the stairways leading to the evacuation levels and finally to the outdoor safe areas.
The Outfield Spectator Seating is divided into three levels: Lower Level, Middle Level, and VIP Level. The evacuation routes for the spectator seating are shown in Figure 5a. The evacuation route planning for each level is similar, involving evacuation from the seating areas to the concourses, then directly to the stairways leading to the evacuation levels and outdoor safe areas.
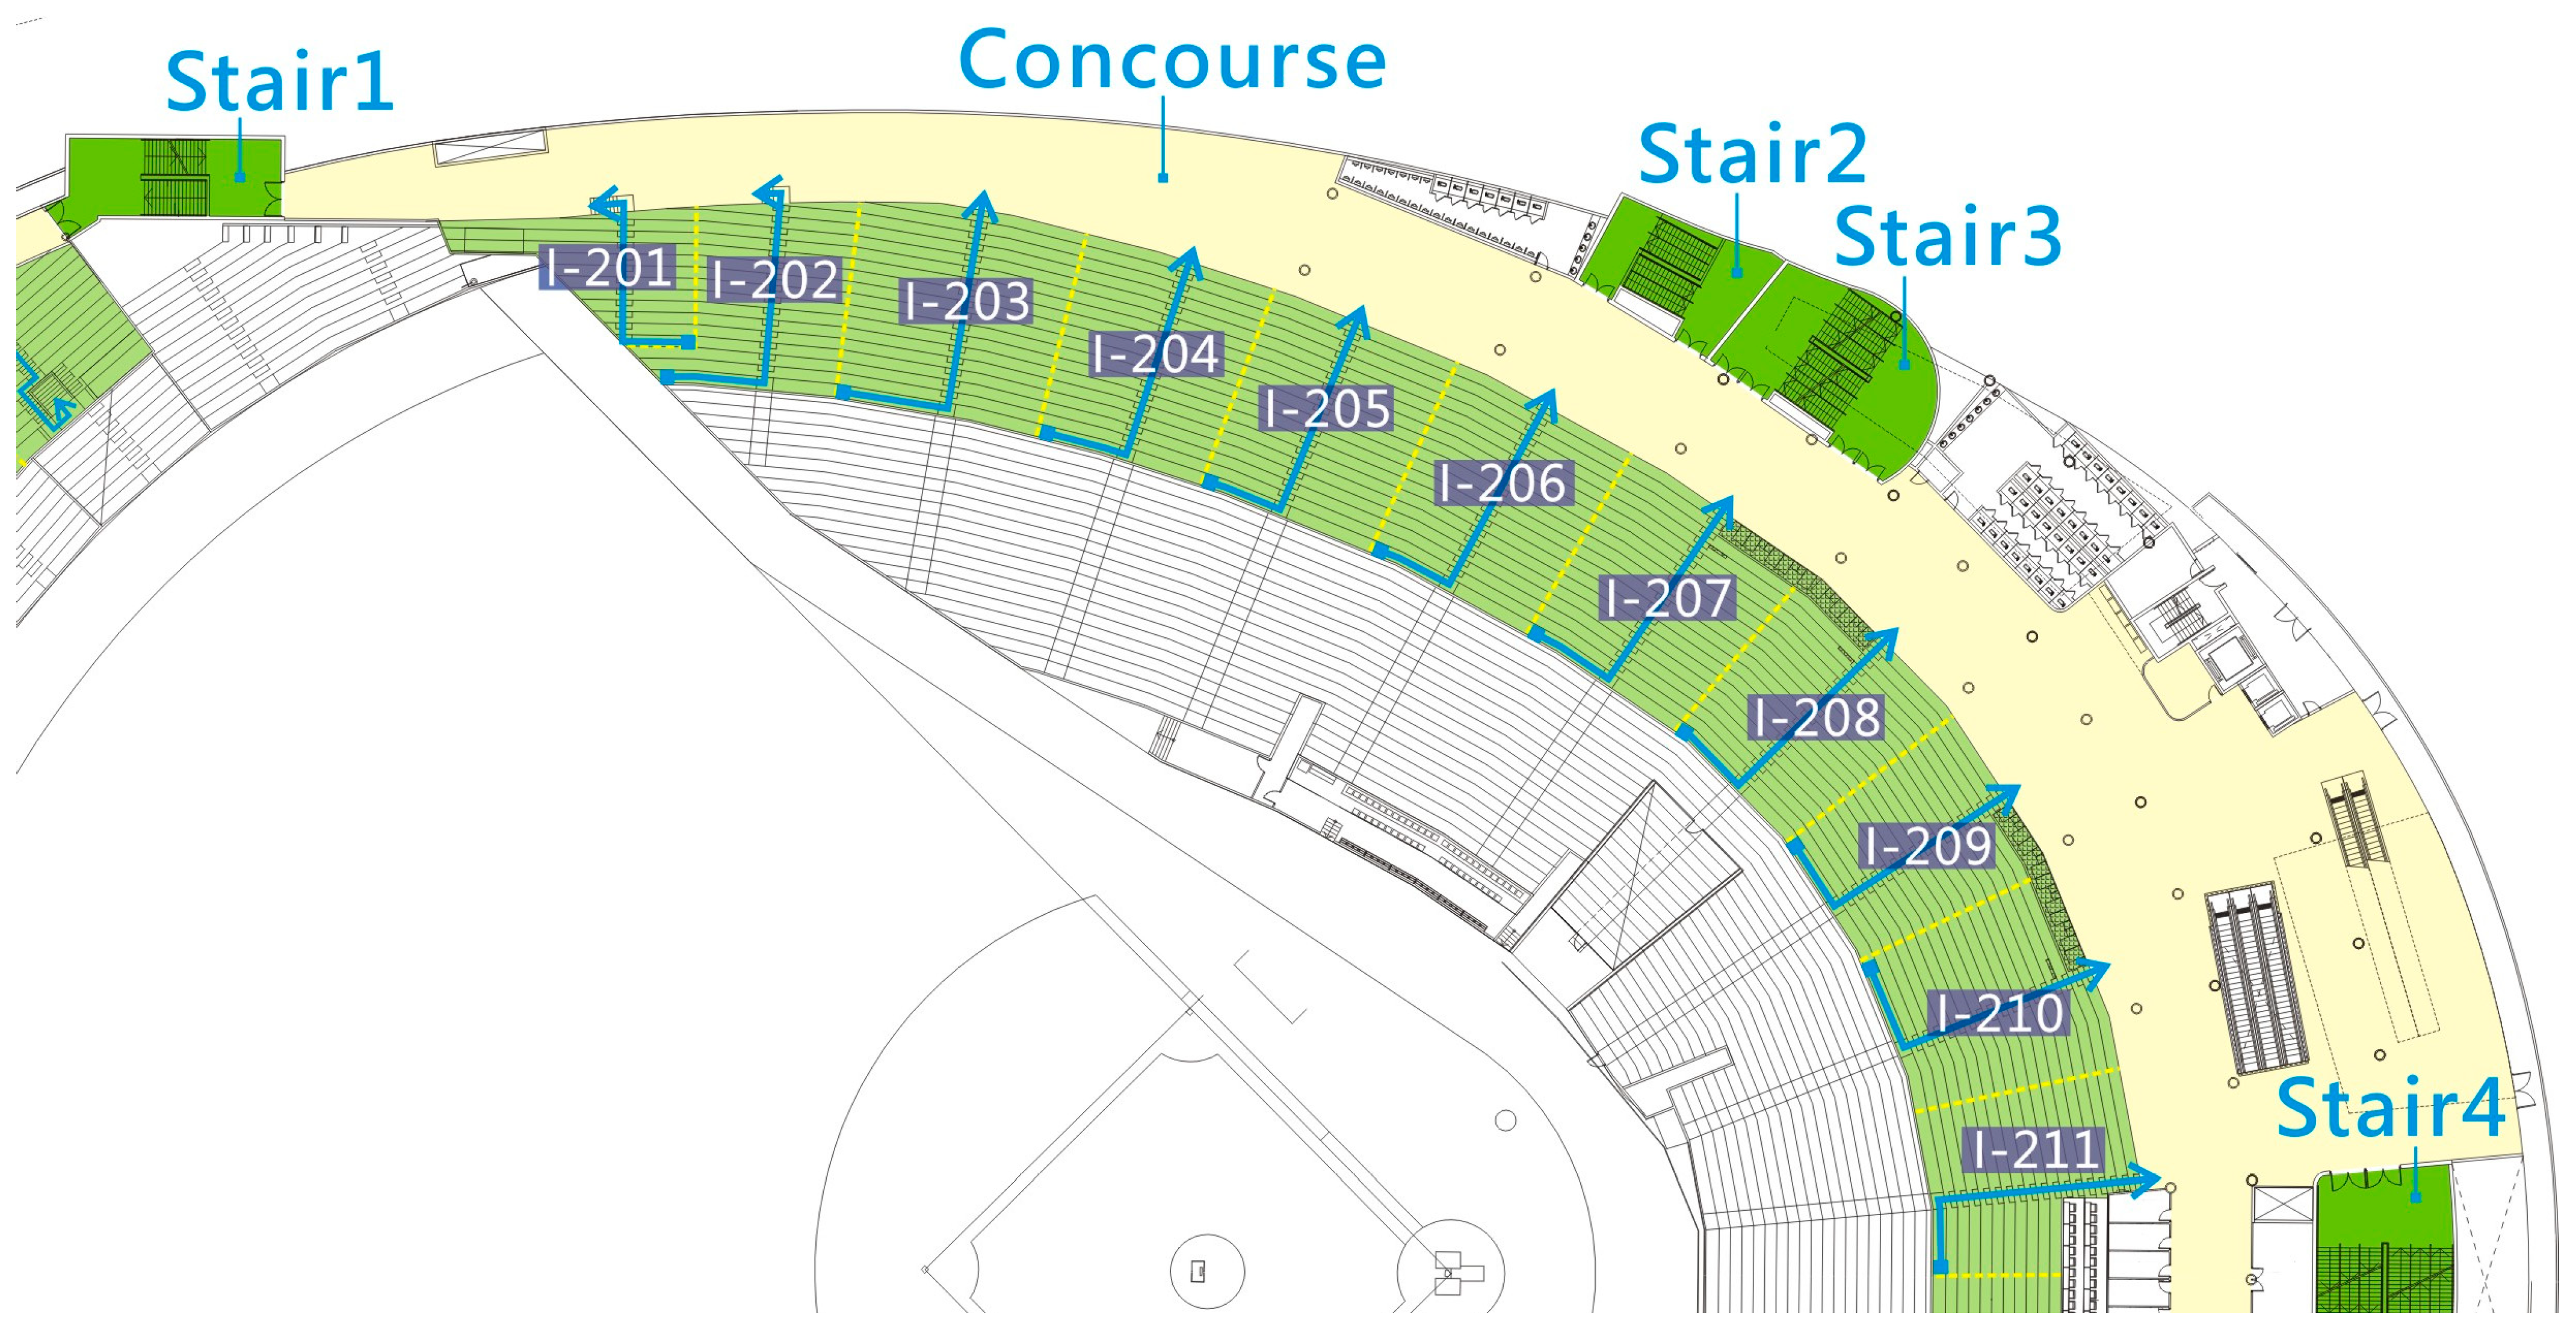
This study selects the Infield Lower Level and Infield Middle Level with the highest number of spectators and more complex evacuation routes. These levels require the use of both the upper and lower stairways to evacuate to the 4th Floor Concourse in the Infield Upper Level for evacuation analysis.

2.3.1. Analysis of Evacuation for Infield Lower-Level Seating

The Infield Lower-Level Seating is the main spectator level, with the largest number of seats. It is divided into 22 evacuation review areas, with the seating arranged in a symmetrical upper–lower pattern. The analysis focuses on the upper half, consisting of 11 areas. Relevant basic information is shown in Table 3, and the corresponding evacuation zone details are shown in Figure 6.

2.3.2. Analysis of Evacuation for Infield Middle-Level Seating

The Infield Middle-Level Seating is the main spectator level, divided into 22 evacuation review areas, with the seating arranged in a symmetrical upper–lower pattern. The analysis focuses on the upper half, consisting of 11 areas. Relevant basic information is shown in Table 4, and the corresponding evacuation zone details are shown in Figure 7.

2.3.3. Analysis of Evacuation for Infield Upper-Level Seating

The Infield Upper-Level Seating is distributed across two floors. The 4th floor is divided into 14 evacuation review areas, with the seating arranged in a symmetrical upper–lower pattern. The analysis focuses on the lower half, consisting of 7 areas. The 5th floor is divided into 11 evacuation review areas, also arranged symmetrically, with the analysis focusing on the lower half, consisting of 6 areas. Relevant basic information is shown in Table 5, and the corresponding evacuation zone details are shown in Figure 8.

3. Results

3.1. Evacuation Safety Verification and Review

Through the evacuation review methods of the “Verification Guideline of Buildings Evacuation Safety Performance-based Design”, Guide to Safety at Sports Grounds (Green Guide), and Simulex, the evacuation review results for the spectator seating on each floor of the infield have been compiled.

3.1.1. Infield Lower-Level Seating

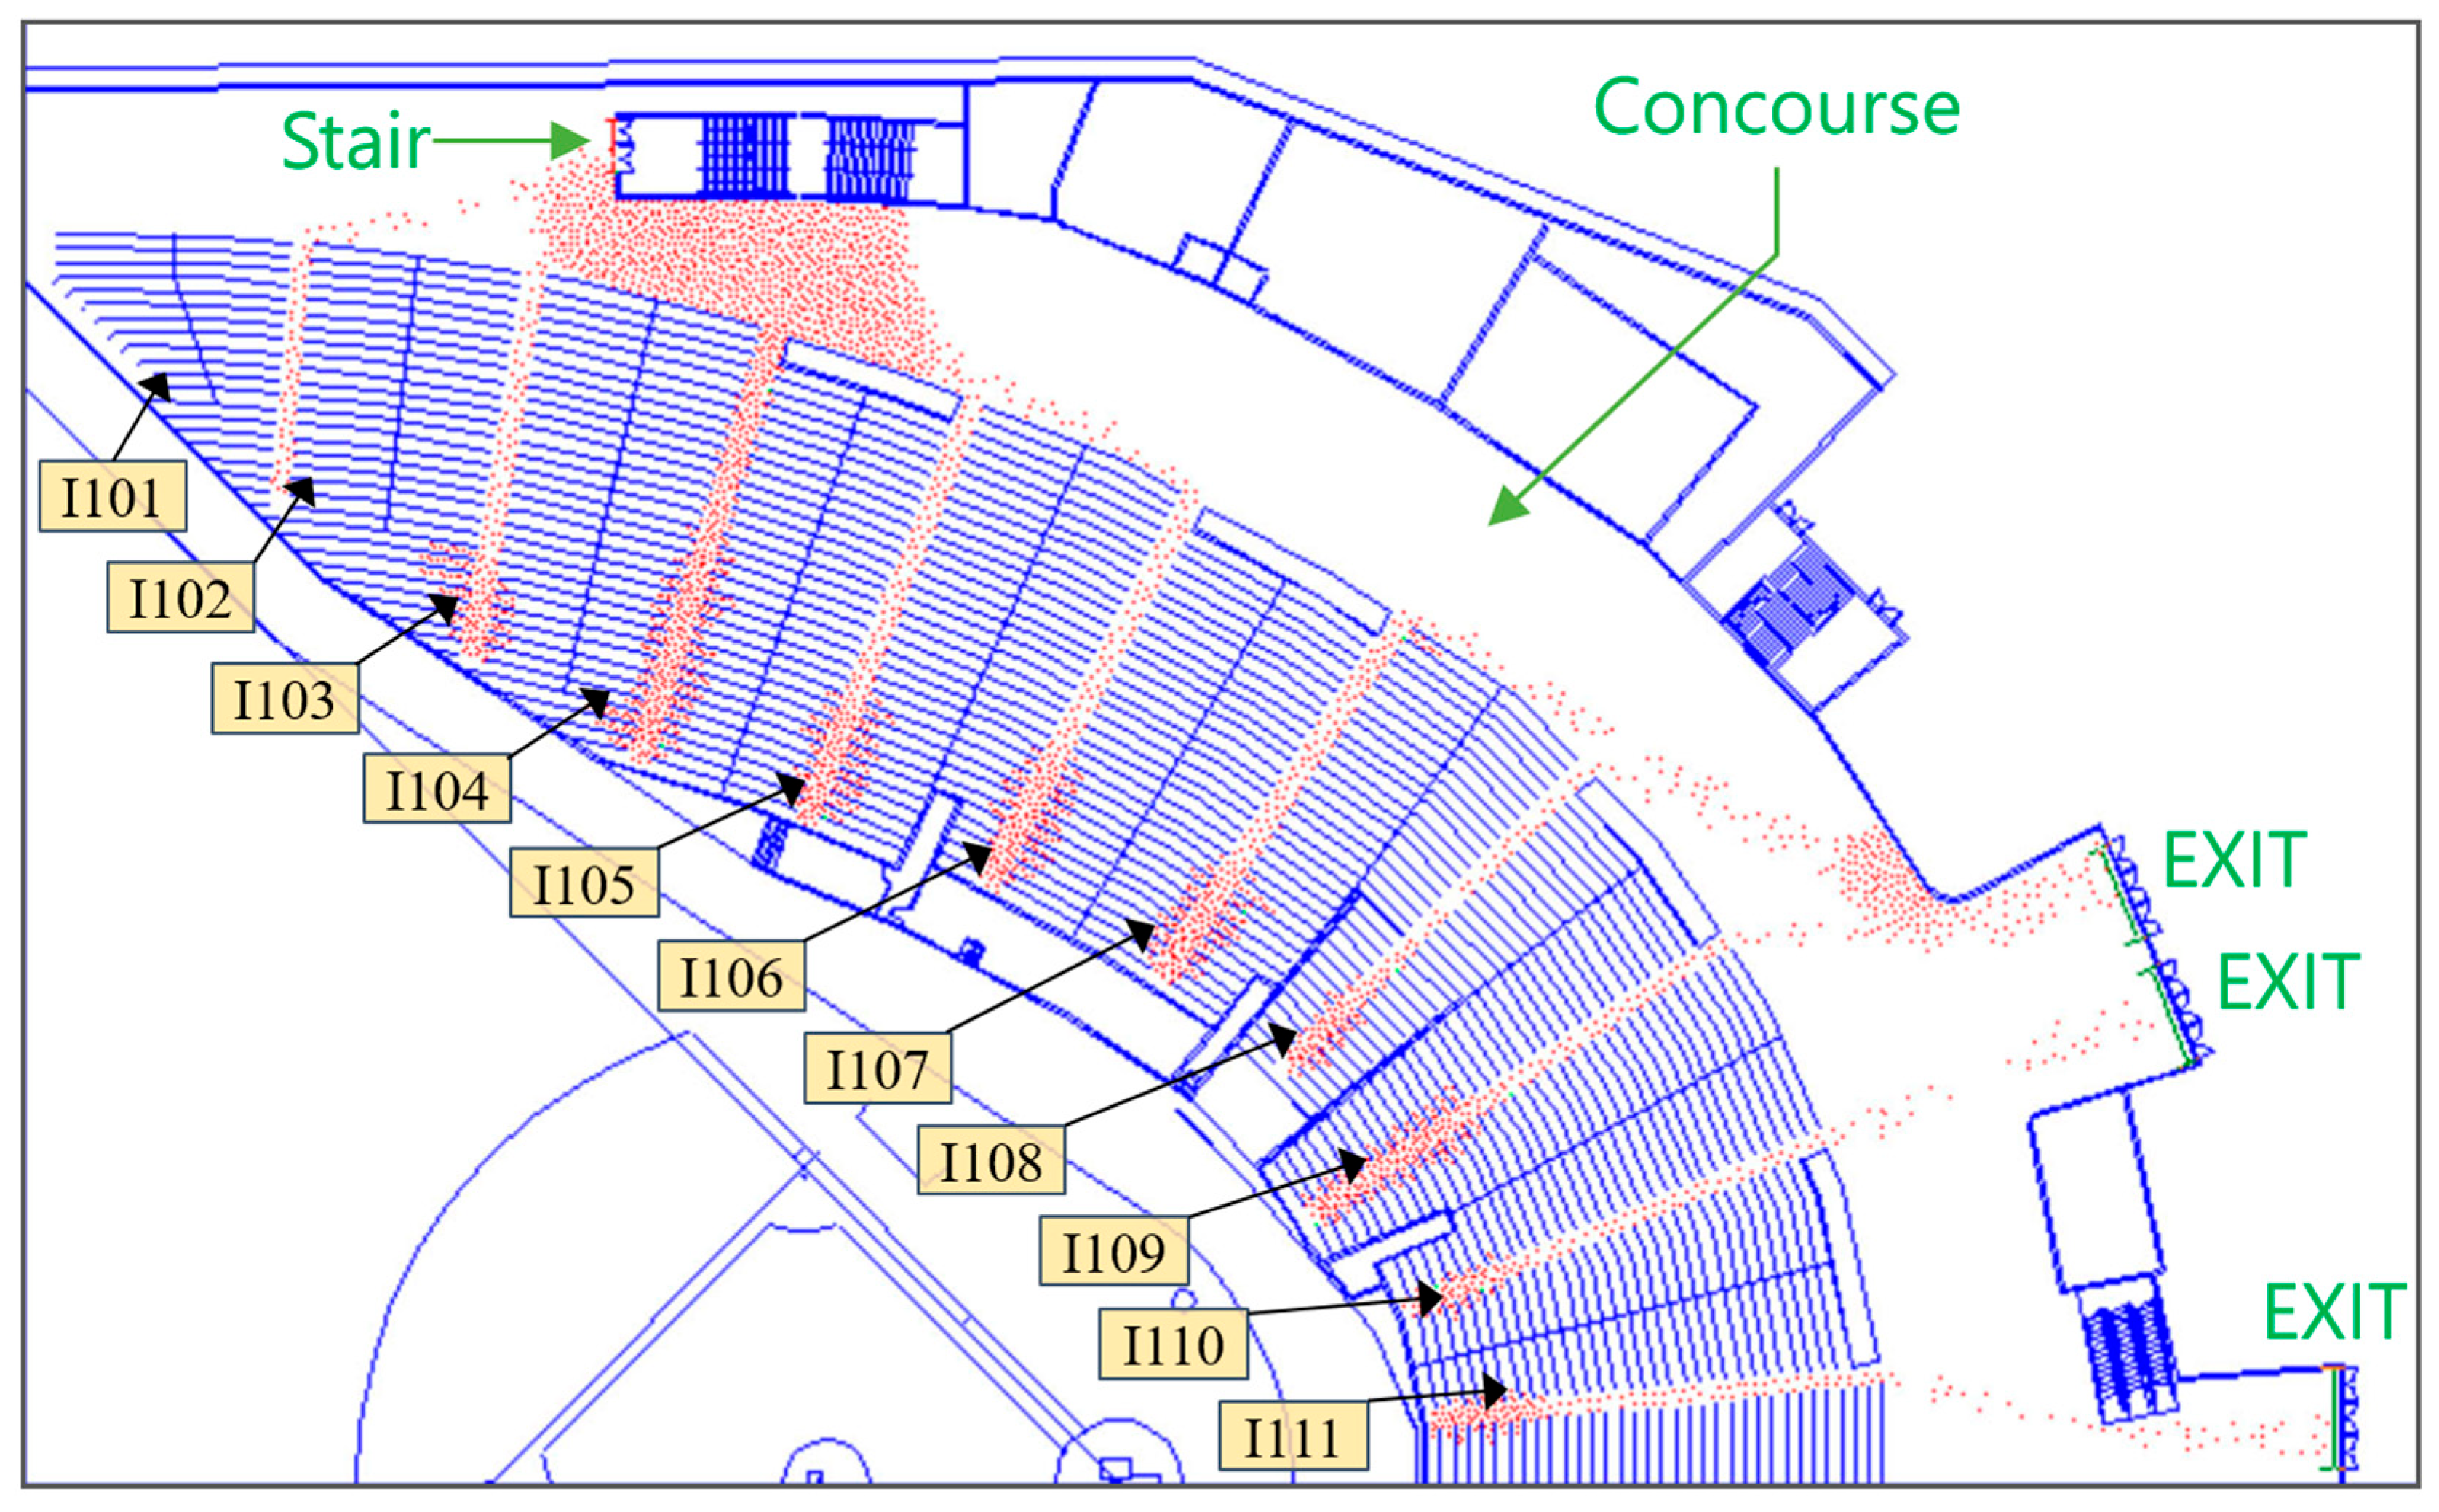
This is the floor with the largest number of seats. Section I-106 has a maximum capacity of 764 people, with the maximum number of seats in a row reaching 27 seats. After review, the evacuation times for the seating area are shown in Table 6. According to the analysis using two empirical formulas, all areas in the Infield Lower-Level Seating can evacuate within 8 min. Based on the dynamic simulation using Simulex, the software assumes that occupants will evacuate toward the nearest exit. The simulation results show that in some areas, after the spectators reach the concourse, the evacuation routes affect the smoothness of the spectator exit flow. The concourse evacuation space is not fully utilized, leading to uneven distribution of evacuees and congestion at the ST1 stairway, causing large crowds in Sections I-405 and I-105 waiting to evacuate through the ST1 stairway, resulting in a bottleneck and preventing evacuation within the 8 min time frame. Additionally, in Sections I-107 and I-109, the width of the aisle between the seats is insufficient, which prevents the evacuees in these areas from completing the evacuation within 8 min, as shown in Figure 9 and Figure 10.

3.1.2. Infield Middle-Level Seating

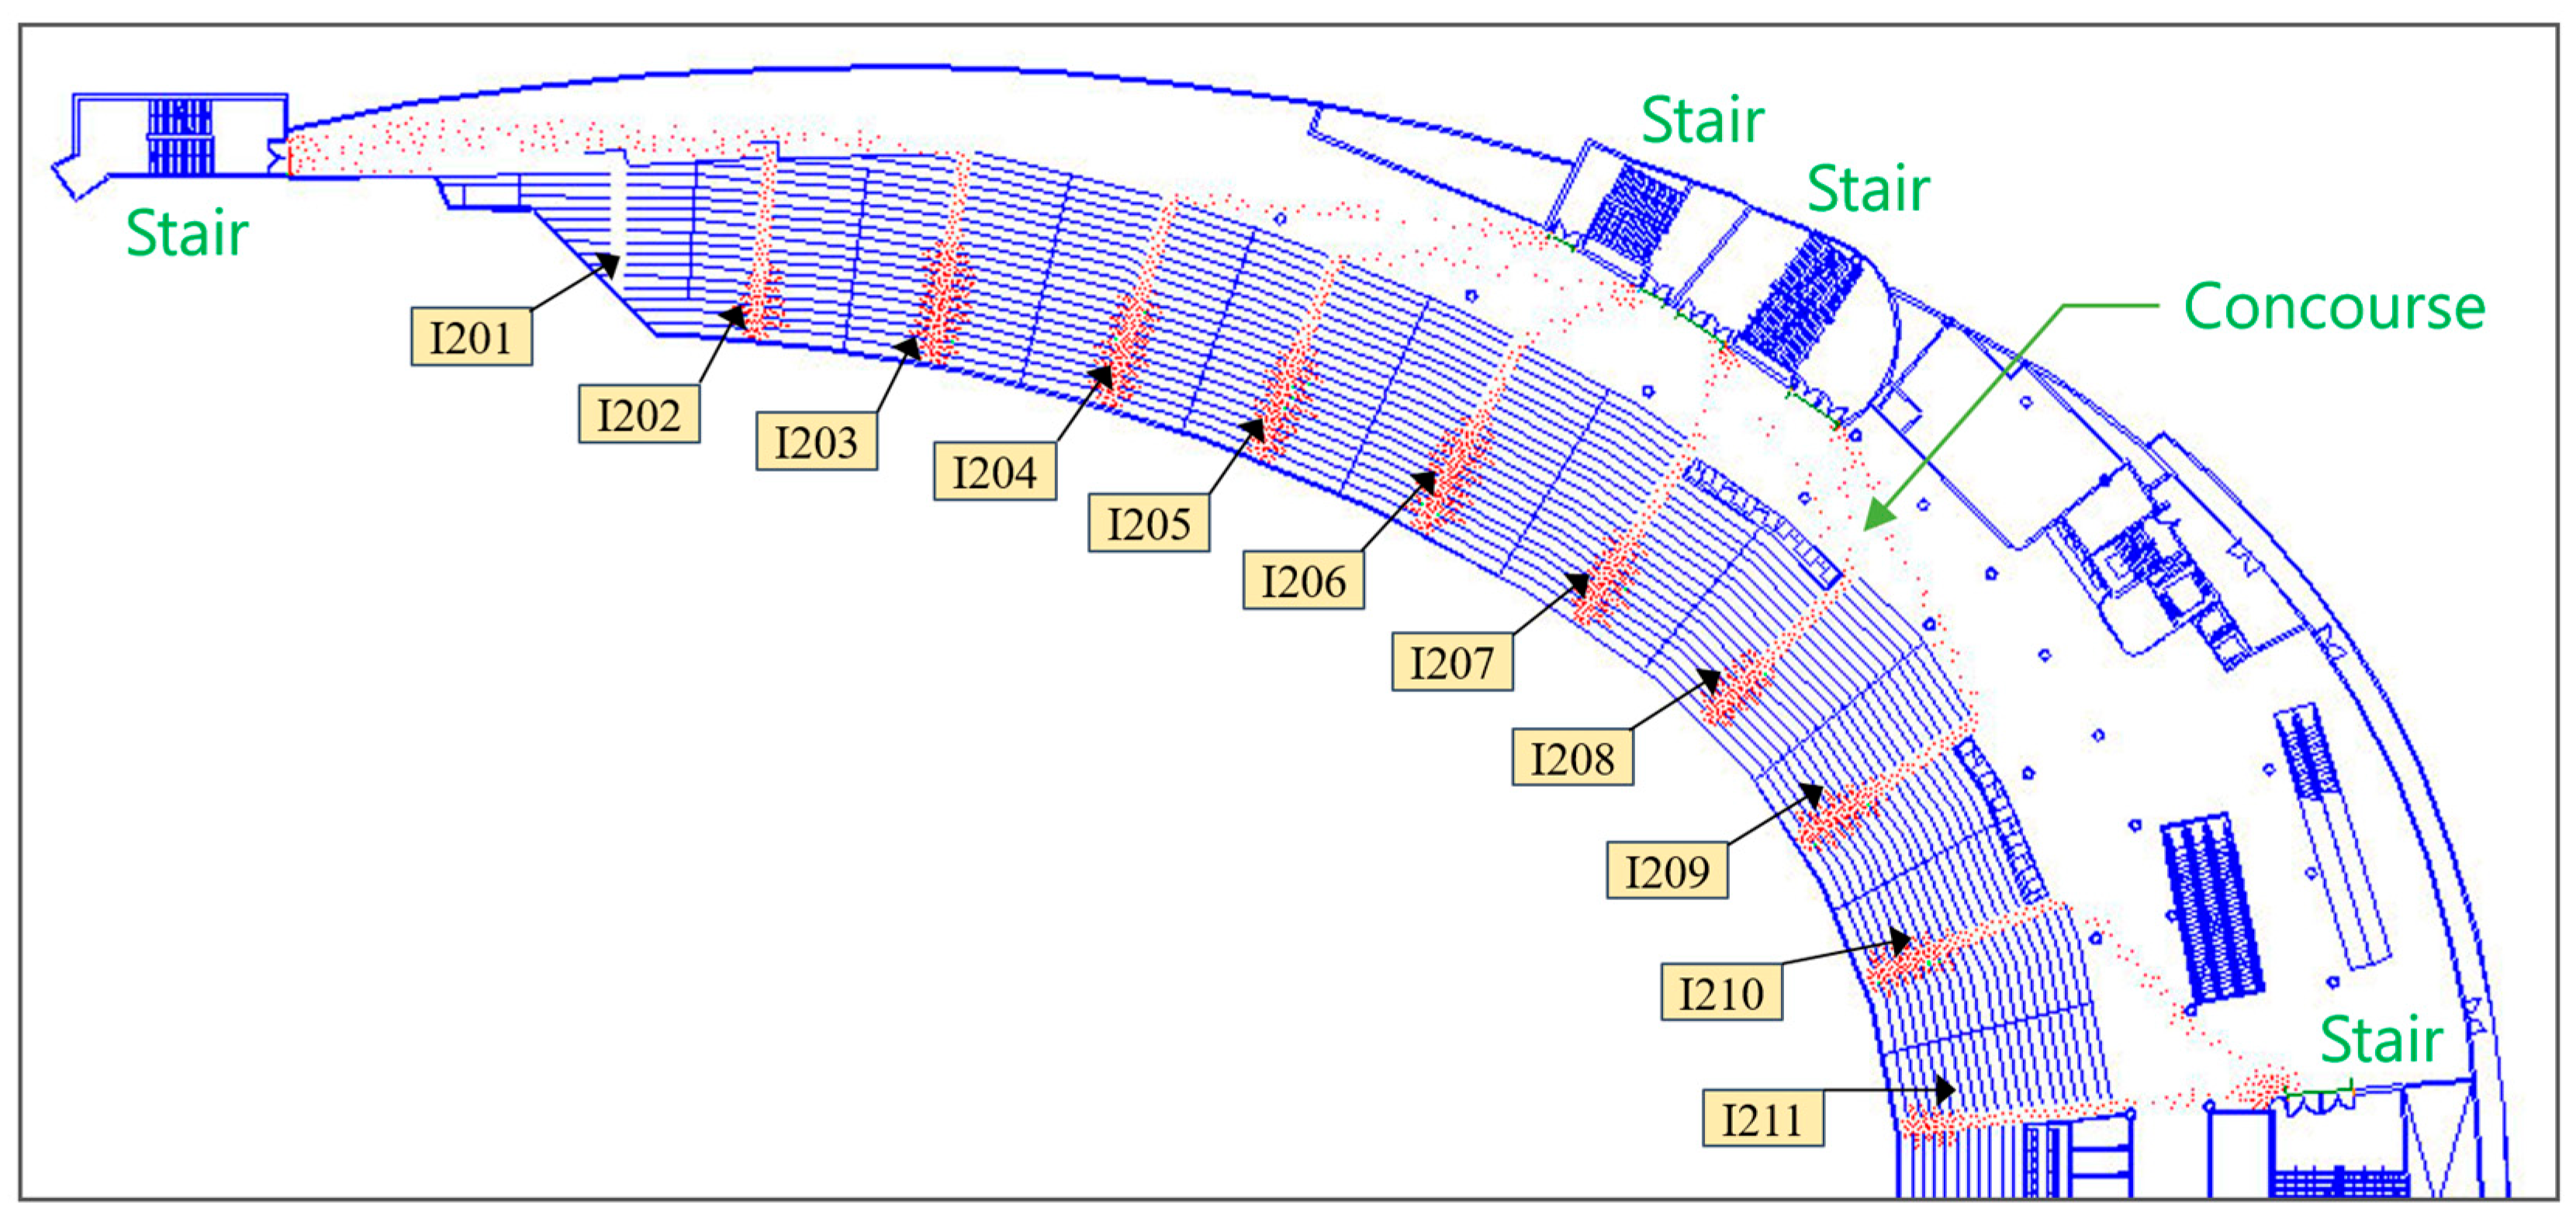
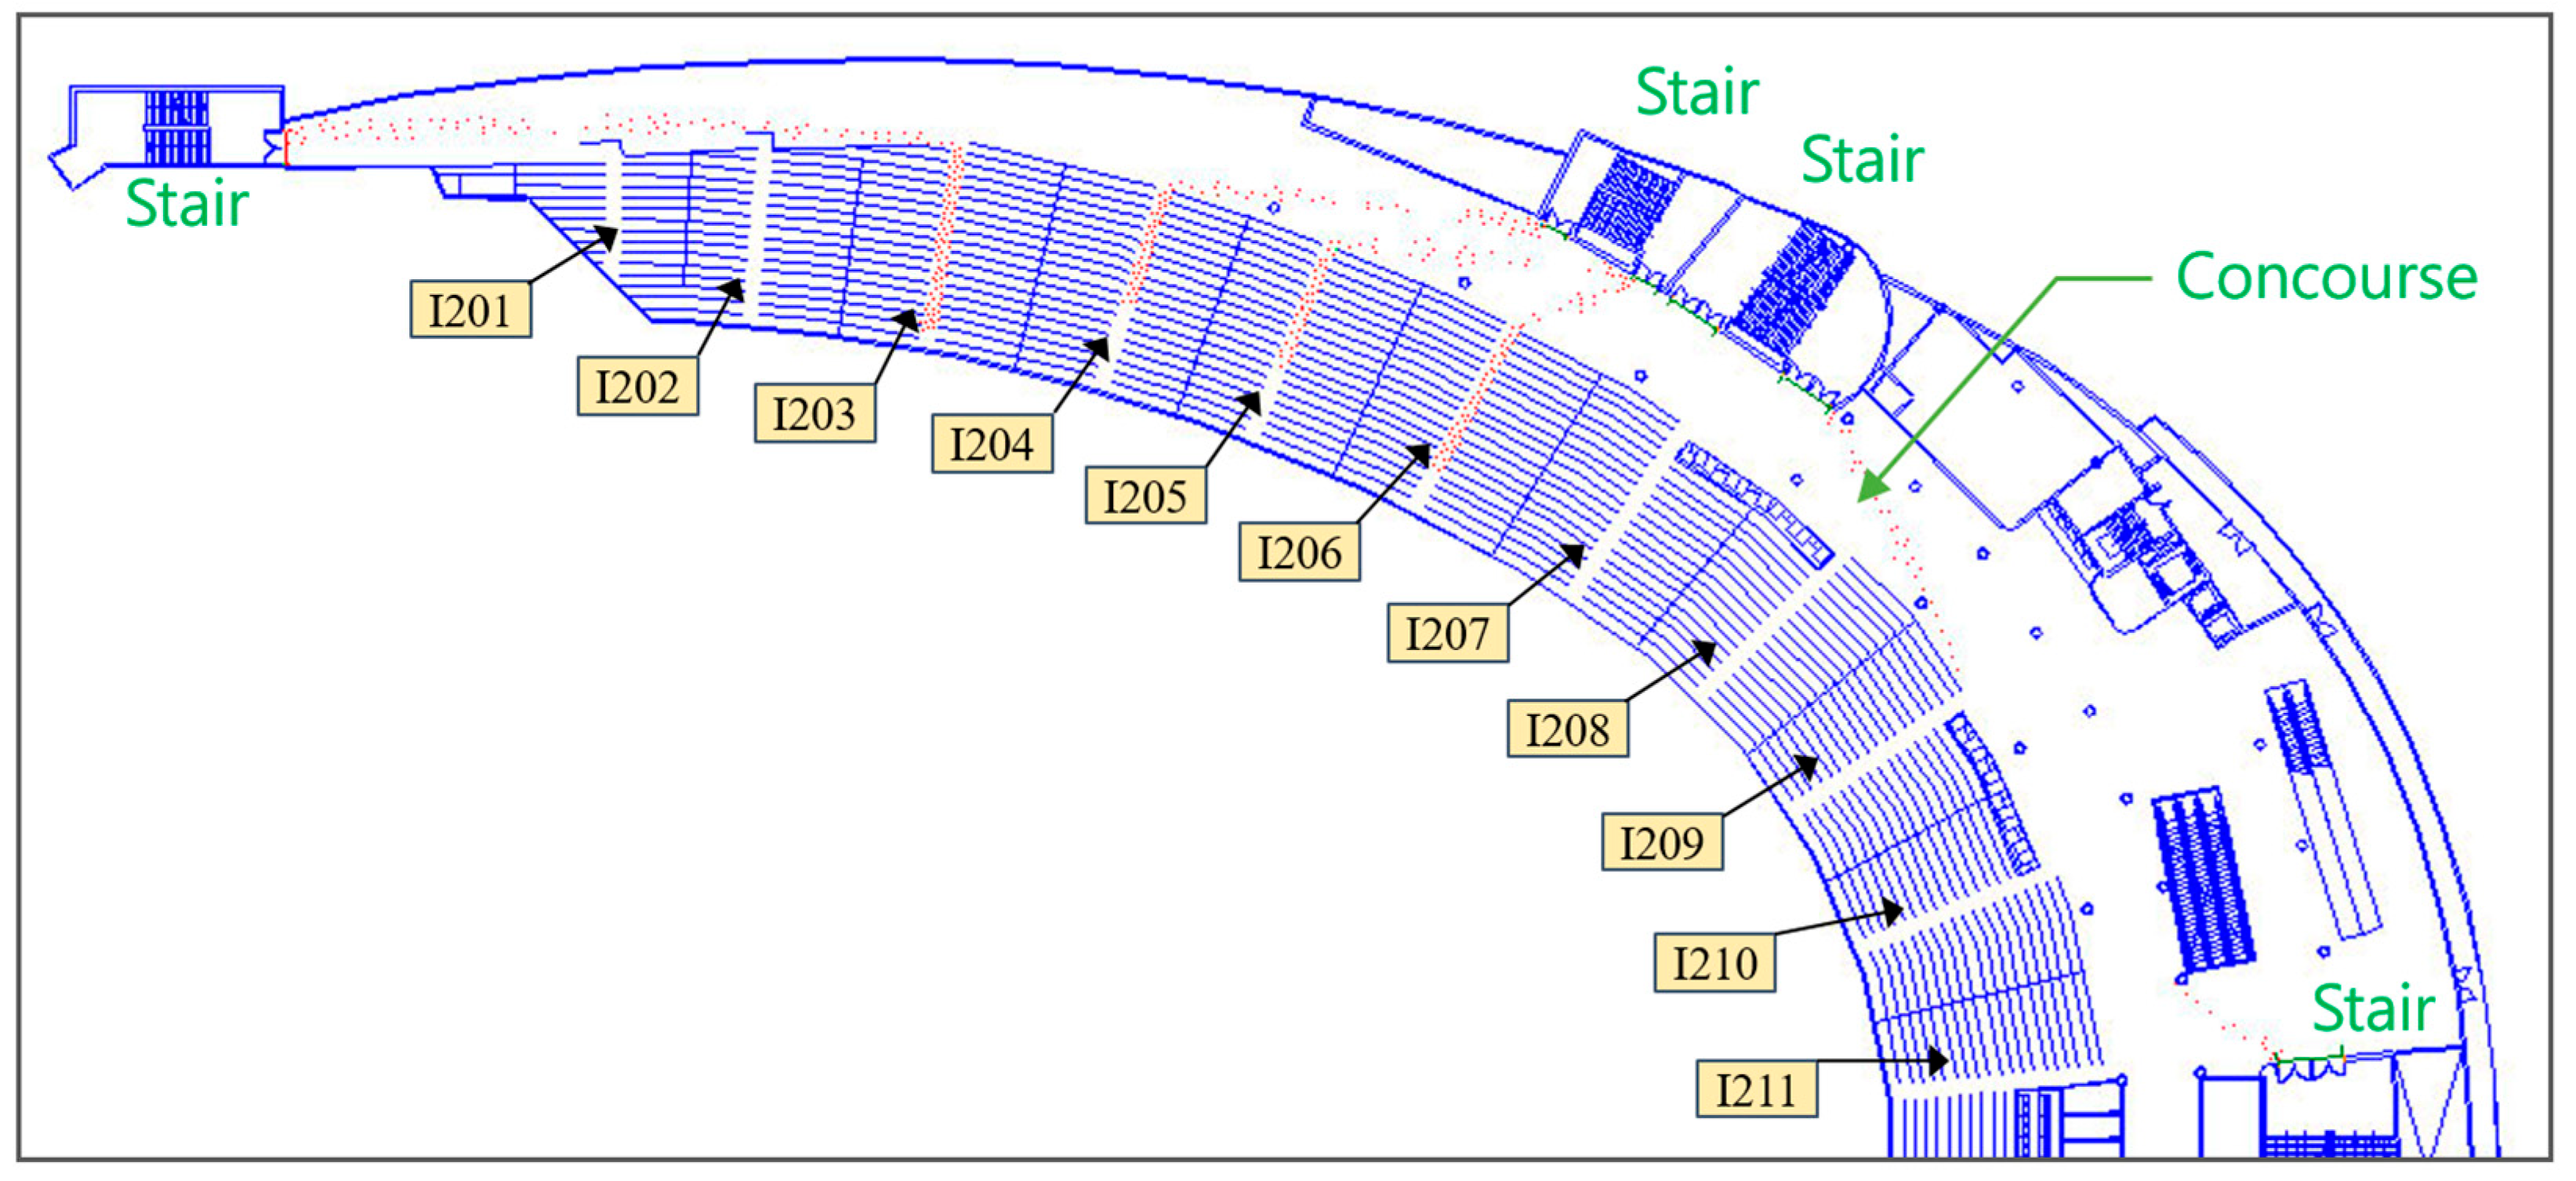
This floor is also a main spectator level, with Section I-205 having a maximum of 472 seats and the maximum number of seats in a row reaching 30 seats. After review, the evacuation times for the seating area are shown in Table 7. According to the analysis using two empirical formulas, all areas in the Infield Middle-Level Seating can evacuate within 8 min. Based on the dynamic simulation using Simulex, the stairways and exit configurations on this floor are well-balanced, allowing for a uniform distribution of people once they reach the concourses. This ensures balanced usage of all stairways for evacuation. The dynamic simulation results confirm that all seating areas can evacuate within 8 min, as shown in Figure 11 and Figure 12. The simulation results indicate that it is extremely important for the spectators to be evenly distributed across the stairways during evacuation.

3.1.3. Infield Upper-Level Seating

The Infield Upper-Level Seating is distributed across two floors (4F and 5F). The seating area I-506 has a maximum capacity of 576 seats, with the maximum number of seats in a row reaching 34 seats. After review, the evacuation times for the seating area are shown in Table 8. According to the analysis using two empirical formulas, all areas in the Infield Lower-Level Seating can evacuate within 8 min.
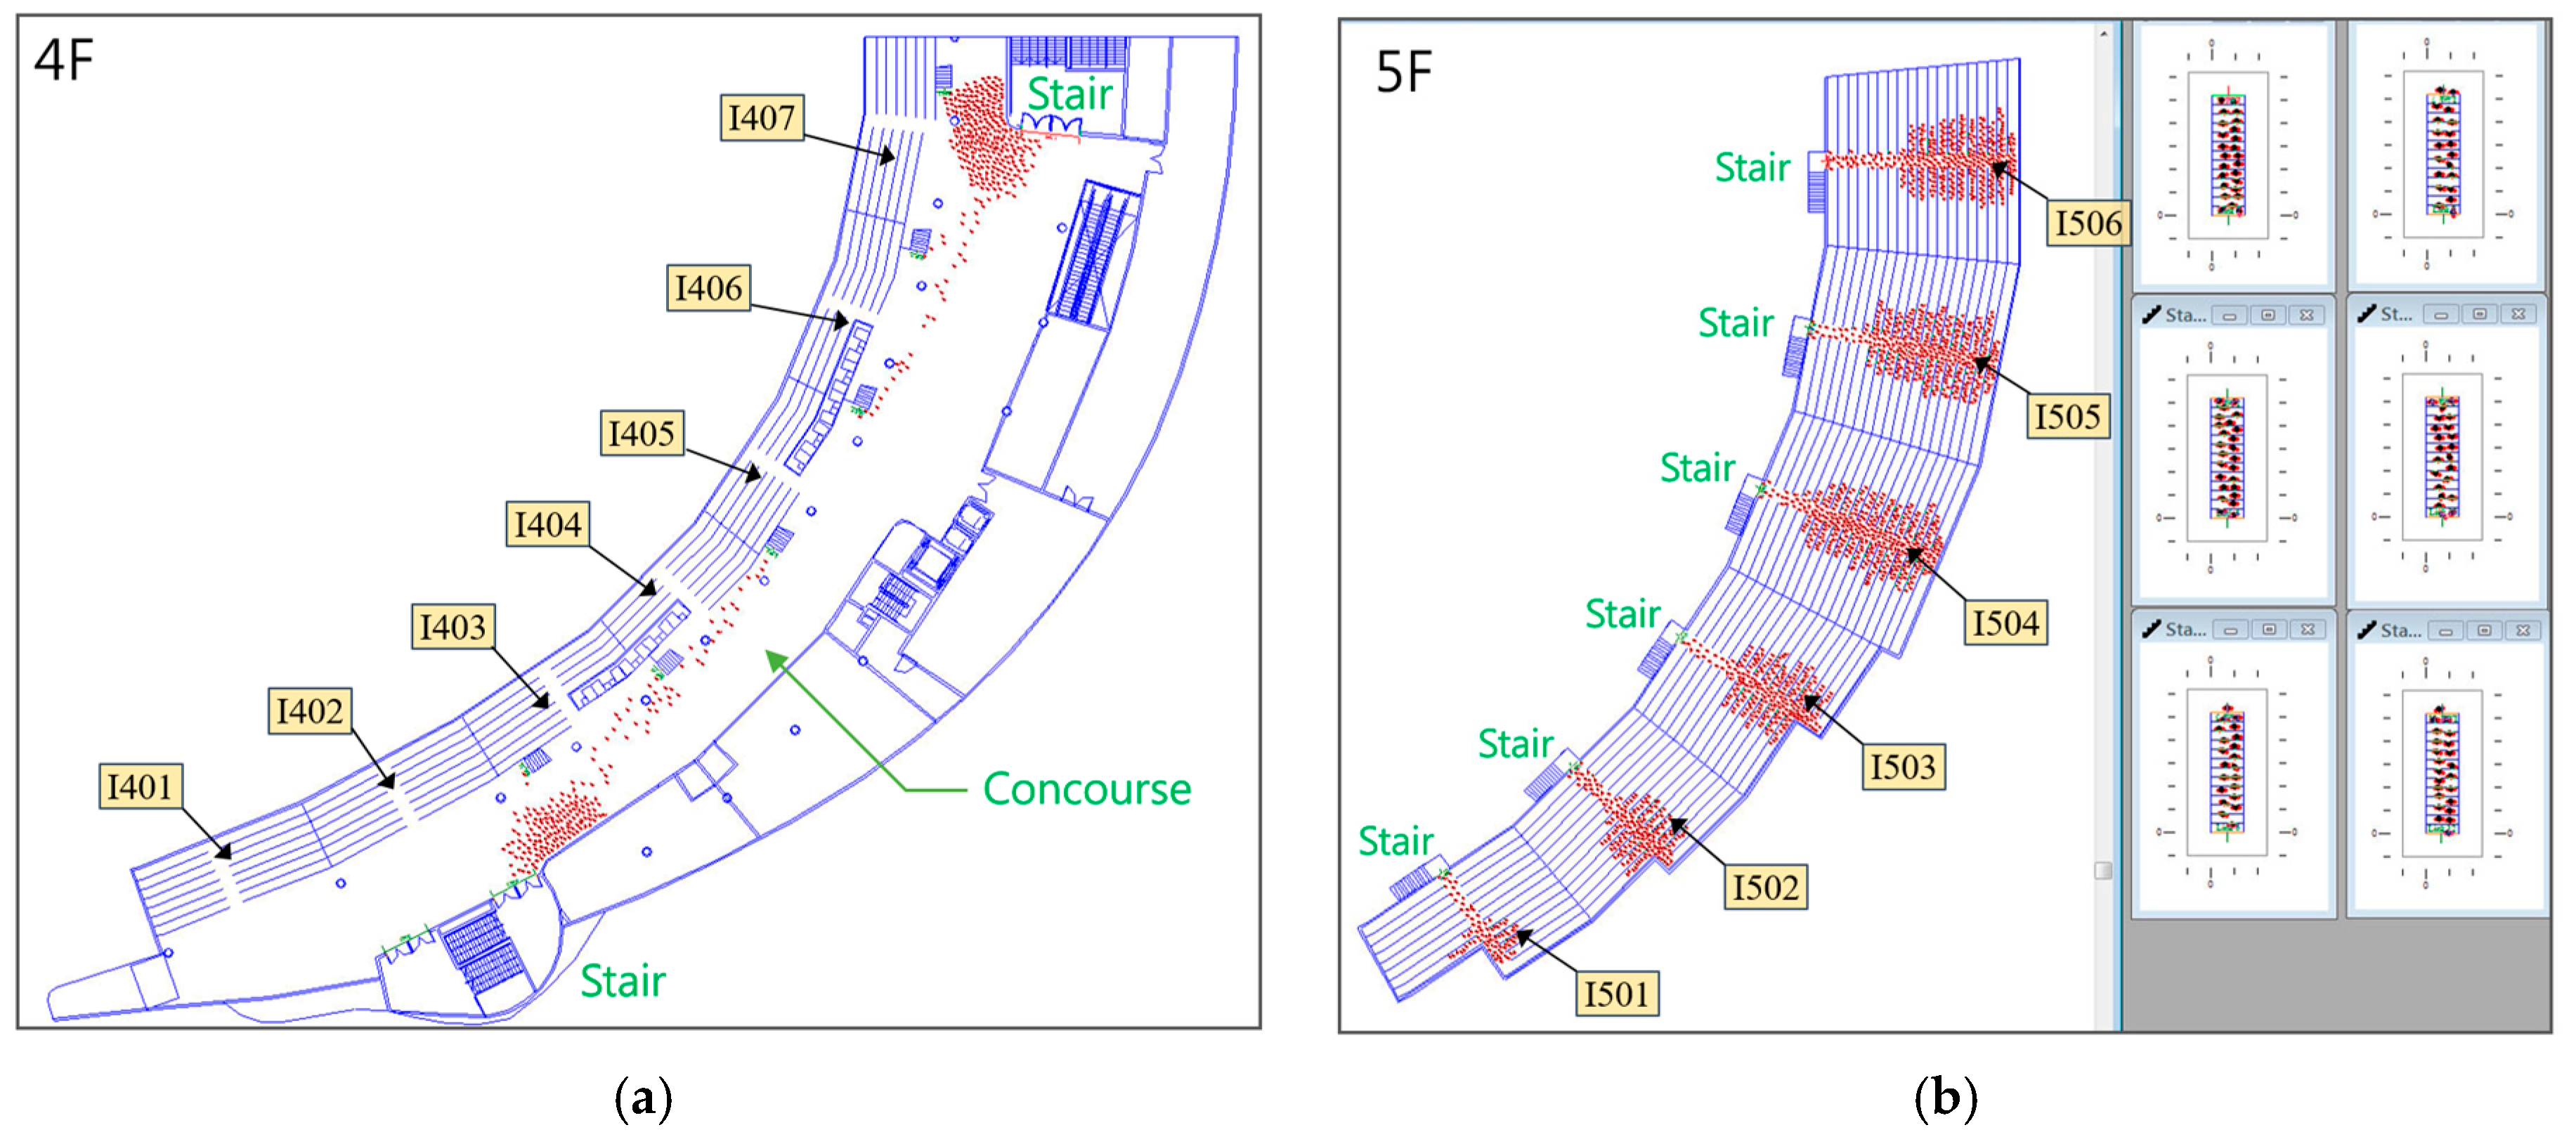
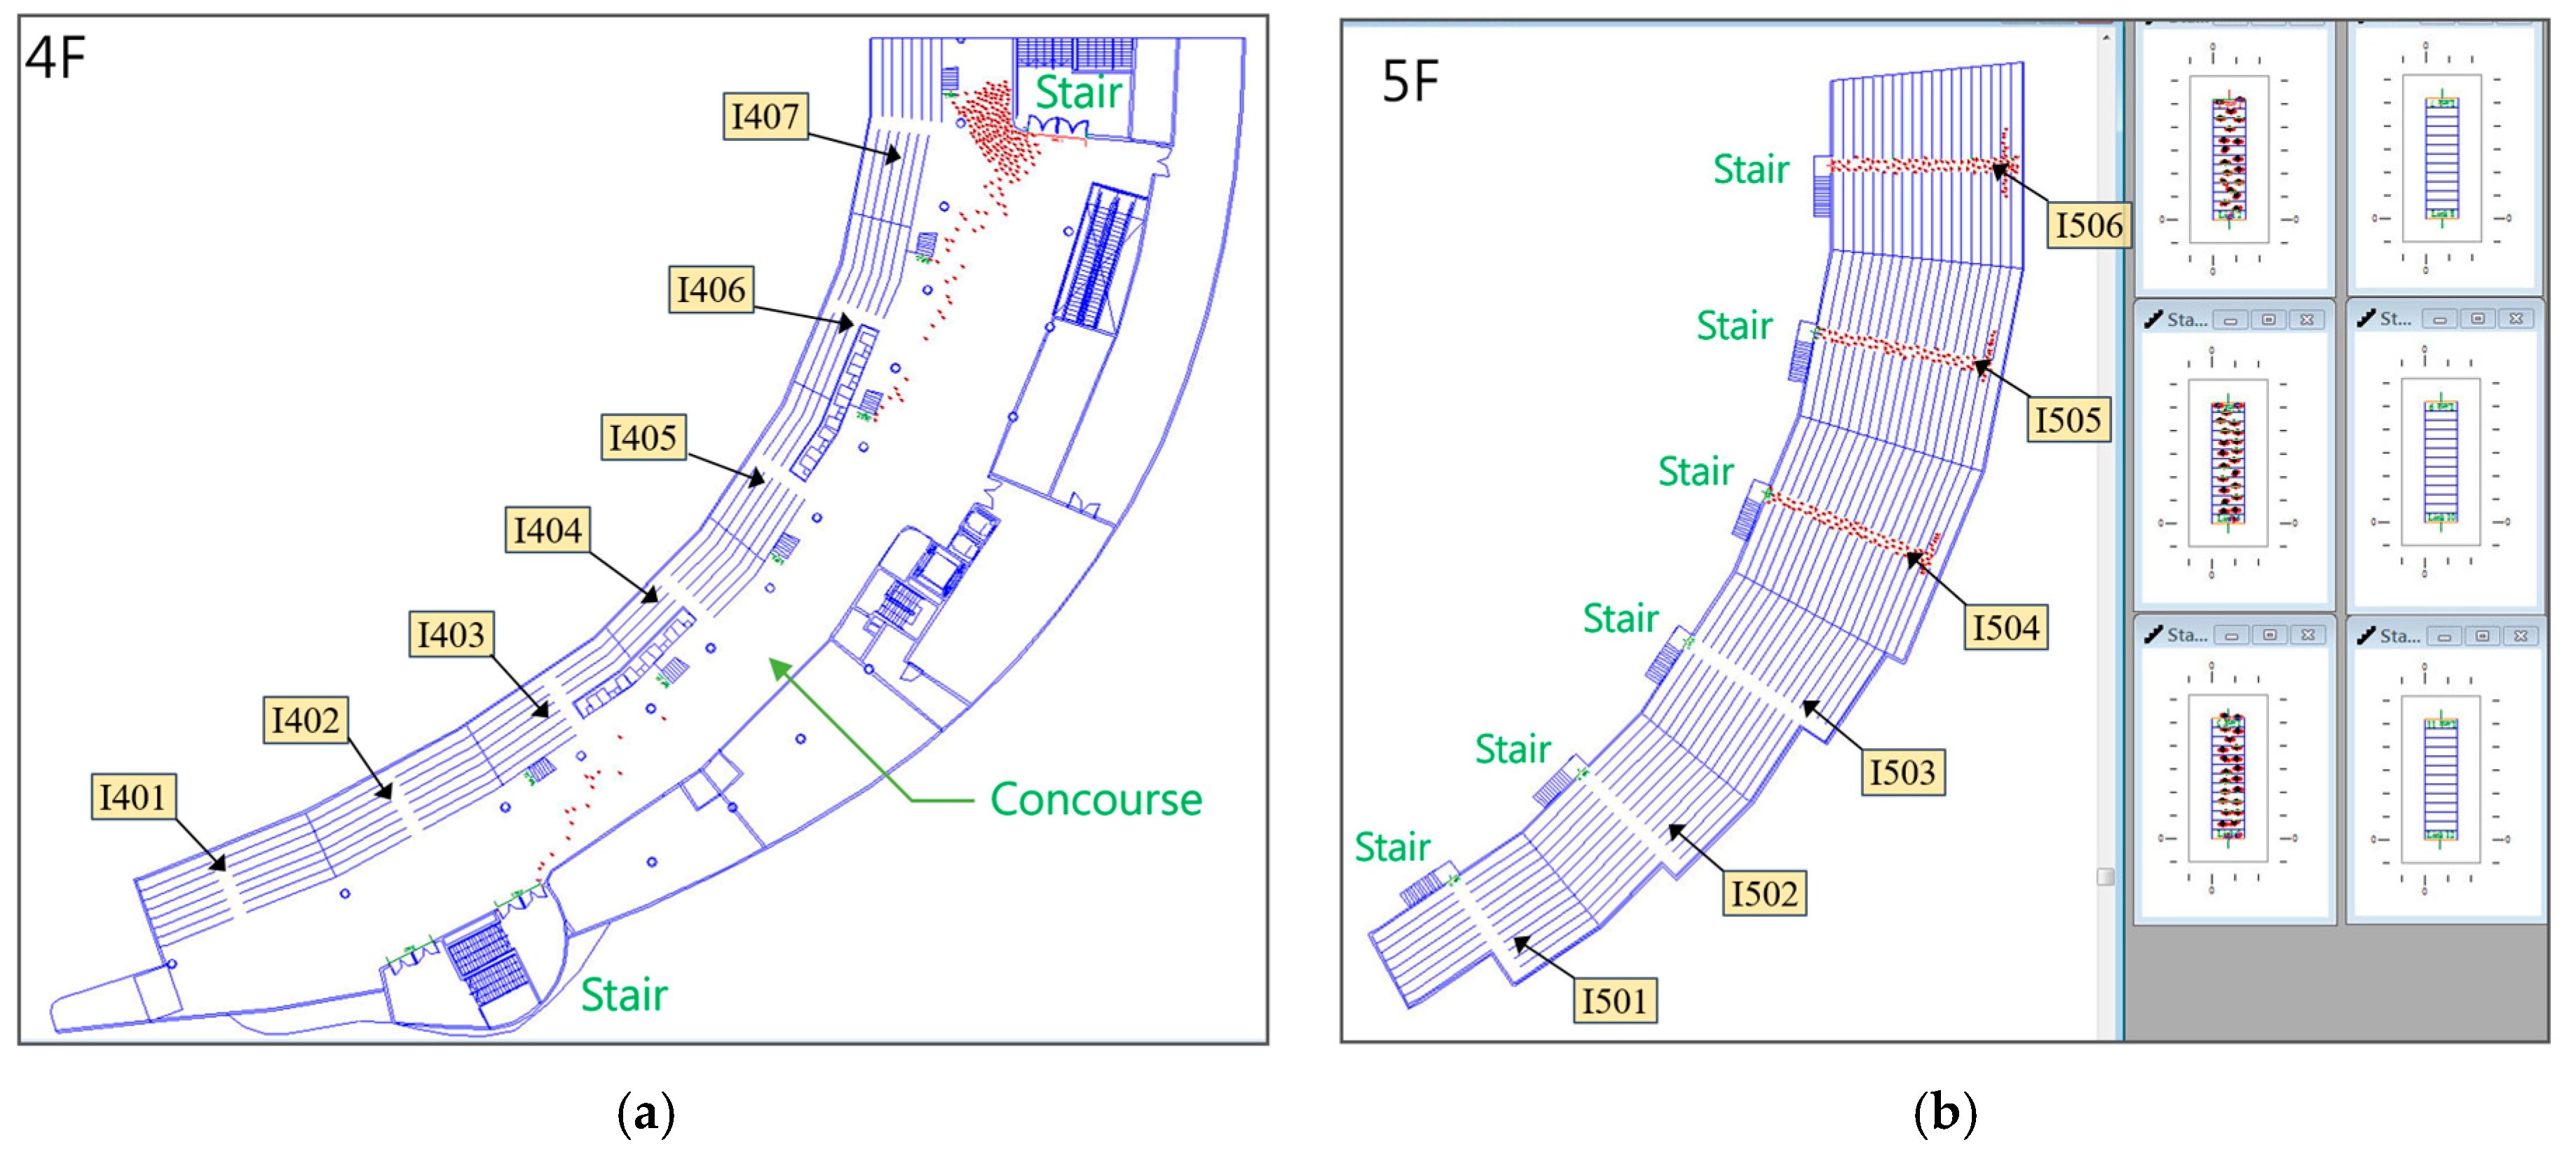
Based on the dynamic simulation using Simulex, the spectators in the Infield Upper-Level (5F) need to evacuate via the stairs in the passageway to the 4F concourse for escape. After evacuation to the concourse on 4F, the evacuation route from 5F converges with the 4F downward evacuation route, causing overcrowding on the stairs connecting 5F and 4F, which affects the smoothness of the exits. Additionally, the concentration of evacuees at the ST4 stairway causes a bottleneck in the evacuation, preventing the spectators in Sections I504 to I506 from completing evacuation within 8 min. The simulation results, as shown in Figure 13 and Figure 14, confirm this.

3.2. Results Analysis

3.2.1. Guide to Safety at Sports Grounds (Green Guide)

When planning spectator seating exits, a fixed flow rate per meter is used for calculations to ensure effective crowd evacuation in emergency situations. According to safety standards, there is a direct relationship between the total width of the spectator seating exits and the number of people they can accommodate. As the number of people increases proportionally, the evacuation time will also be extended accordingly. Therefore, during the design phase, the exit width must be determined based on the maximum number of spectators in each area to ensure that all individuals can evacuate within a safe time frame in case of an emergency.

3.2.2. Verification Guideline of Buildings Evacuation Safety Performance-Based Design

The evacuation verification process can be divided into three stages to ensure the effectiveness of escape routes and the efficiency of personnel evacuation. First, based on the area size of each spectator section, the time for personnel to start evacuation is calculated, which is the delay time between the fire alarm sounding and the beginning of the evacuation process.
Second, based on the walking distance from the farthest point in the spectator seating area to the exit, the walking time of the spectators is calculated. This stage must consider the impact of different evacuation routes, such as whether spectators move along horizontal walkways to the main passage or directly through vertical walkways toward the exit. The width, slope, and capacity of the horizontal and vertical walkways will all affect the speed of movement. Additionally, crowd density and walking speed are also influencing factors [26]. When the seating area is more crowded, movement speed may decrease due to congestion, leading to an increase in walking time.
Finally, the time for personnel to pass through the exit is calculated based on the width and flow capacity of the spectator seating exits. This stage primarily depends on the passage capacity of the exit width design, which refers to the number of people who can pass through the exit per unit of time. Each meter of exit width corresponds to a certain number of evacuees. If the number of exits is insufficient or the width is not enough, a bottleneck effect will occur, significantly increasing the evacuation time.
In summary, this verification method divides evacuation behavior into three stages for analysis. Even if the number of spectators and the exit width are the same, the evacuation time may vary due to factors such as seating arrangement, walkway width, movement paths, and walking distances. Therefore, in the building design and safety evaluation process, all these variables must be comprehensively considered to ensure that all spectators can evacuate safely within a reasonable time and minimize the risks of fire and personnel casualties.

3.2.3. Simulex Evacuation Dynamic Simulation

Unlike the results obtained through the two aforementioned empirical formula methods, in-depth research and analysis have revealed that these formulas treat evacuation speed and exit flow capacity as averaged data and base their calculations on these generalized values. When the number of evacuees or the layout of spectator seating changes, evacuation time is adjusted proportionally to reflect those changes in the final outcome.
However, in contrast, Simulex, as a computer-based dynamic simulation tool, offers a more detailed and realistic representation—especially in evacuation route planning. Simulex can clearly illustrate bottlenecks that emerge during the evacuation process, which may cause congestion in specific areas or seating zones, thereby impacting the overall smoothness of evacuation.
In particular, simulation results for certain seating zones indicate that evacuation time may exceed the 8 min safety standard [17], highlighting complexities that traditional empirical formulas fail to adequately account for. This simulation approach not only provides a more accurate reflection of actual evacuation behavior in stadiums but also offers a more scientific foundation for future venue operations and emergency response planning—ultimately enhancing spectator safety more effectively.

4. Discussion

This study employed three performance-based design methods to calculate evacuation times and conducted a detailed analysis of the results. The research found that the parameters used in the two empirical formulas were based on homogenized data for quick verification, allowing these formulas to quickly provide preliminary evacuation safety design references during the design phase. However, while these methods can offer guidance in the early stages of design, they are still unable to fully reflect the complexities of the actual evacuation process. Therefore, further computer dynamic simulation analysis is crucial for understanding the location of evacuation bottlenecks and making necessary adjustments to the evacuation route design. Without computer dynamic simulation analysis in the early stages, the evacuation safety of large sports venues cannot be accurately confirmed.
According to the analysis results from the Simulex software dynamic simulation, for the audience seating area to achieve rapid evacuation, it is not only necessary to ensure that the exit width corresponds to the total number of seats in that area but also to consider factors such as the location of the escape stairs within the floor, the configuration of the exits, and the number of turning points in the evacuation route. These factors play a crucial role in creating evacuation bottlenecks and must be carefully planned and optimized during the design process to avoid congestion and blockages along the escape paths. The issue of trampling casualties caused by panic during evacuation is a problem that Simulex software dynamic simulation cannot solve, which is one of the limitations of this study.
The basic assumption of the “Verification Guideline of Buildings Evacuation Safety Performance-based Design” and the Simulex software is that all personnel will choose the path closest to the exit for evacuation. However, from the simulation process of the Simulex software, it can be observed that this assumption often leads to an uneven distribution of personnel along specific paths, and large crowds tend to accumulate in front of certain stairs or exits, causing the formation of evacuation bottlenecks, which in turn extends the evacuation time. Therefore, based on the results of dynamic simulation analysis, we suggest reallocating spectators to evacuate toward designated exits instead of choosing the nearest one. This approach aims to balance the overall usage rate of evacuation exits and achieve a more uniform distribution. The findings of this study can be incorporated into the design of an evacuation performance indicator system and be used to improve evacuation guidance and egress route training.
Specifically, during the design process, facilities such as spectator seating, exits, and floor areas can be marked with different colors to help evacuees quickly identify evacuation directions at the first moment, thereby improving overall evacuation efficiency. In addition, the evacuation guidance system should also take into account differences in human behavior patterns, providing flexible and effective evacuation instructions to ensure that individuals can make the most appropriate escape decisions based on the actual situation. A multifaceted approach—considering seat distribution patterns, the width, number, and location of exits, as well as the design of guidance equipment on floors or walls—not only helps balance the utilization of evacuation facilities but also significantly enhances the safety and smoothness of the evacuation process, ultimately achieving the goal of improving overall evacuation safety.

5. Conclusions

This study employed three performance-based verification methods to analyze the differences in evacuation time for stadium seating. The analysis of the results is shown in Figure 15 below.
  • According to the Guide to Safety at Sports Grounds, the requirement for spectators to evacuate seating areas within eight minutes primarily considers the calculation of the width and flow capacity of access routes in each seating section. This calculation method typically uses a formula that correlates the total number of spectators with the flow capacity based on exit width. The advantage of this formula lies in its simplicity and efficiency, allowing designers to quickly obtain preliminary reference data for planning layouts, including spectator distribution and the required width of exits in different areas.
    For advanced simulations combining fire smoke control and evacuation, FDS+Evac can be used. Through the software analysis, it is possible to simultaneously observe critical locations affected by smoke hazards and key evacuation points, allowing for analysis and improvements.
    This method enables a rapid estimation of evacuation needs for each area during the early stages of architectural design. However, its limitation lies in overlooking detailed issues that arise during actual evacuation processes, such as the distance between seats and exits or potential congestion at escape routes.
    In summary, while this quick calculation method provides essential reference data to assist architects in making appropriate decisions during the early planning phase—ensuring that stadium designs meet basic evacuation safety requirements—achieving optimal evacuation effectiveness still requires more complex simulation analyses. These analyses are necessary to verify whether the final design truly meets real-world needs and maximizes spectator safety.
  • Regarding the evacuation time design criteria outlined in the “Verification Guideline of Buildings Evacuation Safety Performance-based Design”, the start time of evacuation is reviewed based on the floor area of each spectator zone. It also includes a detailed analysis of walking time from the farthest point of the seating area to the nearest exit. This method accounts for the varying sizes of seating areas and uses that information to estimate the evacuation start time for each zone. It then further analyzes the walking time required for spectators to reach an evacuation exit, ensuring that all zones can be evacuated within the designated timeframe.
    Additionally, the guideline includes a thorough assessment of the flow coefficient at evacuation exits, specifically incorporating the impact of crowd density. According to the analysis, when the number of people the corridor can accommodate exceeds the number of spectators in the area, it is assumed that no crowding or stagnation will occur. Under such conditions, a fixed flow rate value of Neff = 90 (people/min/m) is adopted. However, this assumption is based on an ideal scenario and does not take into account potential congestion or bottlenecks at specific points, which could reduce the actual flow rate. As such, this value may not align with real-world situations.
    Nevertheless, the verification method offers high accuracy by dividing the evacuation process into three distinct stages for detailed analysis. It allows for a more granular evaluation of how variables such as seating area size, configuration, number of spectators, and exit width influence evacuation time. This level of detail helps designers better understand how different factors affect overall evacuation efficiency and make appropriate adjustments to the design accordingly.
    Therefore, this guideline serves as a valuable reference for designers before entering the detailed design phase of a building project. It helps confirm whether evacuation conditions meet the safety standard of evacuating all spectators within eight minutes. Such analysis not only enhances the practicality and safety of the design but also helps prevent potential evacuation issues, ultimately improving the safety of spectators.
  • Simulex is a computer-based dynamic simulation tool capable of visualizing evacuation scenarios, effectively reflecting the reduction in walking speed under crowded conditions and clearly highlighting potential bottlenecks in evacuation routes. This makes it a realistic tool for simulating human behavior during emergency evacuations. In this case study, it was observed that congestion often occurs near corners during evacuation, and many individuals tend to choose the nearest exit route. This behavior results in an uneven distribution of evacuees across staircases, with some staircases being underutilized.
    By using Simulex for simulation, these issues can be more accurately analyzed, allowing architects to optimize evacuation routes and reassign escape paths in a more balanced and logical manner for each seating area.
    For advanced simulations combining fire smoke control and evacuation, FDS + Evac can be used. Through the software analysis, it is possible to simultaneously observe critical locations affected by smoke hazards and key evacuation points, allowing for analysis and improvements.
  • Although this study uses a regional stadium as a case example, the adopted simulation process and parameter settings—such as assumptions about occupant behavior and exit selection models—are highly transferable. They are applicable to stadium facilities of similar scale and spectator arrangements in other countries, providing cross-regional reference value. From different perspectives, we can summarize three types of evacuation safety performance verification methods, which can be applied to different stages of a building’s life cycle, including the preliminary planning stage, the detailed design stage, and the operational management stage of evacuation strategy development, each with distinct requirements. As such, the three verification methods offer unique value, depending on the phase of application.
    Through these methods, designers can implement effective evacuation strategies tailored to the specific needs of each phase, addressing various challenges accordingly. The practical experience gained from applying these methods will provide valuable insights for future evacuation planning of large-scale venues, serving as an important reference for future planning, design, and operational management.

Author Contributions

C.-H.Y.: validation, formal analysis, investigation, data curation, writing—original draft preparation, and editing. C.-Y.L.: methodology, manuscript review, and approval. T.-W.K.: manuscript review and editing. All authors have read and agreed to the published version of the manuscript.

Funding

This research received no external funding.

Institutional Review Board Statement

Not applicable.

Informed Consent Statement

Not applicable.

Data Availability Statement

All data generated or analyzed during this study are included in this published article. The data that support the findings of this study are available from the corresponding author upon reasonable request. Correspondence and requests for materials should be addressed to the first author.

Conflicts of Interest

The authors declare no conflicts of interest.

References

  1. Minegishi, Y. Tracer observation of egress and way-home crowdbehavior at stadiums: From the perspective of crowdcontrol in emergency evacuations. Trans. AIJ 2023, 88, 1–12. [Google Scholar] [CrossRef]
  2. Sun, S. Research on the Algorithm of Seat Arrangement in Olympic Stadium. In Proceedings of the 2020 International Conference on Robots & Intelligent System (ICRIS), Sanya, China, 7–8 November 2020; Available online: https://ieeexplore.ieee.org/document/9524000 (accessed on 20 April 2025).
  3. Gravit, M.; Kirik, E.; Savchenko, E.; Vitova, V.; Shabunina, D. Simulation of Evacuation from Stadiums and Entertainment Arenas of Different Epochs on the Example of the Roman Colosseum and the Gazprom Arena. Fire 2022, 5, 20. Available online: https://www.mdpi.com/2571-6255/5/1/20 (accessed on 20 April 2025). [CrossRef]
  4. Ivanusa, A.; Marych, V.; Kobylkin, D.; Yemelyanenko, S. Construction of a visual model of people’s movement to manage safety when evacuating from a sports infrastructure facility. East.-Eur. J. Enterp. Technol. 2023, 2, 28–41. [Google Scholar] [CrossRef]
  5. Minegishi, Y.; Takeichi, N. Design guidelines for crowd evacuation in a stadium for controlling evacuee accumulation and sequencing. Jpn. Arch. Rev. 2018, 1, 471–485. [Google Scholar] [CrossRef]
  6. Mahmudzadeh, A.; Ghorbani, M.; Hakimelahi, A. Providing an Emergency Evacuation Model for the Stadium. Transp. Res. Procedia 2020, 48, 620–631. [Google Scholar] [CrossRef]
  7. Wang, J. Research on the Personnel Evacuation Simulation Model for Large-Scale Stadium. In Proceedings of the 7th International Conference on Mechatronics, Computer and Education Informationization (MCEI 2017), Advances in Computer Science Research, Shenyang, China, 3–5 November 2017; Volume 75. [Google Scholar] [CrossRef]
  8. de Falco, M.; Di Stasi, D.; Novellino, C. Sports Facility Safety Plans: A Framework for Evaluation of Evacuation Times. Am. J. Sports Sci. 2016, 4, 69–76. [Google Scholar] [CrossRef]
  9. Young, T.; Gales, J.; Kinsey, M.; Wong, W.C.-K. Variability in stadia evacuation under normal, high-motivation, and emergency egress. J. Build. Eng. 2021, 40, 102361. [Google Scholar] [CrossRef]
  10. Ronchi, E.; Uriz, F.N.; Criel, X.; Reilly, P. Modelling large-scale evacuation of music festivals. Case Stud. Fire Saf. 2016, 5, 11–19. [Google Scholar] [CrossRef]
  11. Yao, H.-W.; Zhang, D.-S.; Liang, D. Fire Evacuation Design and Fire Risk Assessment for a Stadium. In Proceedings of the 2019 International Conference on Intelligent Transportation, Big Data & Smart City (ICITBS), Changsha, China, 12–13 January 2019; Available online: https://ieeexplore.ieee.org/document/8669549 (accessed on 20 April 2025).
  12. Fang, H.; Lv, W.; Cheng, H.; Li, X.; Yu, B.; Shen, Z. Evacuation Optimization Strategy for Large-Scale Public Building Considering Plane Partition and Multi-Floor Layout. Front. Public Health 2022, 10, 847399. [Google Scholar] [CrossRef] [PubMed]
  13. Helbing, D.; Farkas, I.; Vicsek, T. Simulating dynamical features of escape panic. Nature 2000, 407, 487–490. Available online: https://www.nature.com/articles/35035023 (accessed on 20 April 2025). [CrossRef] [PubMed]
  14. Feliciani, D.; Zuriguel, I.; Garcimartín, A.; Maza, D.; Nishinari, K. Systematic experimental investigation of the obstacle effect during non-competitive and extremely competitive evacuations. Sci. Rep. 2020, 10, 15947. [Google Scholar] [CrossRef] [PubMed]
  15. Weerasekara, N.N. Modeling and Simulation of the Evacuation Plan for Hancock Stadium; Nirmal Neranjan Weerasekara, Illinois State University: Normal, IL, USA, 2015. [Google Scholar]
  16. Wang, W.; Zhang, H.; Wan, Y. Application of CFD software to performance-based fire design. In Proceedings of the 3rd Engineering Computational Fluid Dynamics Conference, Harbin, China, 5 January 2006; pp. 65–73. (In Chinese). [Google Scholar]
  17. Wei, Z.; Hui, D.; Tong, W. The application of fire spread and evacuation simulationtechnology in large stadium. Stoch Env. Res Risk Assess 2009, 23, 433–439. [Google Scholar] [CrossRef]
  18. Yang, C.H. The Research on Evaluation for Evacuation Safety Performance of Auditoriums in Stadium, Case Study of Taipei Dome. Master’s Thesis, National Chiao Tung University, Hsinchu, Taiwan, 2013. Available online: https://hdl.handle.net/11296/s7zwxa (accessed on 20 April 2025).
  19. Guide to Safety at Sports Grounds, 5th ed.; Her Majesty’s Stationery Office: Shanghai, China, 2008; ISBN 9780117020740. Available online: https://www.google.com.tw/books/edition/Guide_to_Safety_at_Sports_Grounds/iqWcsIY9IpcC?hl=zh-TW&gbpv=1&dq=Guide+to+Safety+at+Sports+Grounds&printsec=frontcover (accessed on 20 April 2025).
  20. Guideline to Verifying Evacuation in Building Fires; Architecture and Building Research Institute (ABRI): Taipei, Taiwan, 2004; ISBN 978 9 86049386 3.
  21. Egress: Simulex User Guide; Integrated Environmental Solutions Limited: Shanghai, China, 2015; Available online: https://www.iesve.com/downloads/help/VE2015/Evacuation/Simulex.pdf (accessed on 20 April 2025).
  22. Melrose, A.; Hampton, P.; Manu, P. Safety at Sports Stadia. Procedia Eng. 2011, 14, 2205–2211. [Google Scholar] [CrossRef]
  23. Mineko, I.; Tomonori, S. Route Choice and Flow Rate in Theatre Evacuation Drills: Analysis of Walking Trajectory Data-Set. Fire Technol. 2019, 55, 569–593. [Google Scholar] [CrossRef]
  24. Au, S.; Gilroy, J.; Haslam, R. Assessing Crowd Dynamics and Spectator Safety in Seated Area at a Football Stadium. In Pedestrian and Evacuation Dynamics; Springer: Boston, MA, USA, 2011; pp. 663–674. [Google Scholar] [CrossRef]
  25. BS EN 13200-1:2003; Spectator Facilities. Layout Criteria for Spectator Viewing Area. Specification. British Standards Institution: London, UK, 2004.
  26. Brocklehurst, D.; Bouchlaghem, D.; Pitfield, D.; Palmer, G.; Still, K. Crowd circulation and stadium design: Low flow rate systems. Struct. Build. 2005, 158, 281–289. [Google Scholar] [CrossRef]
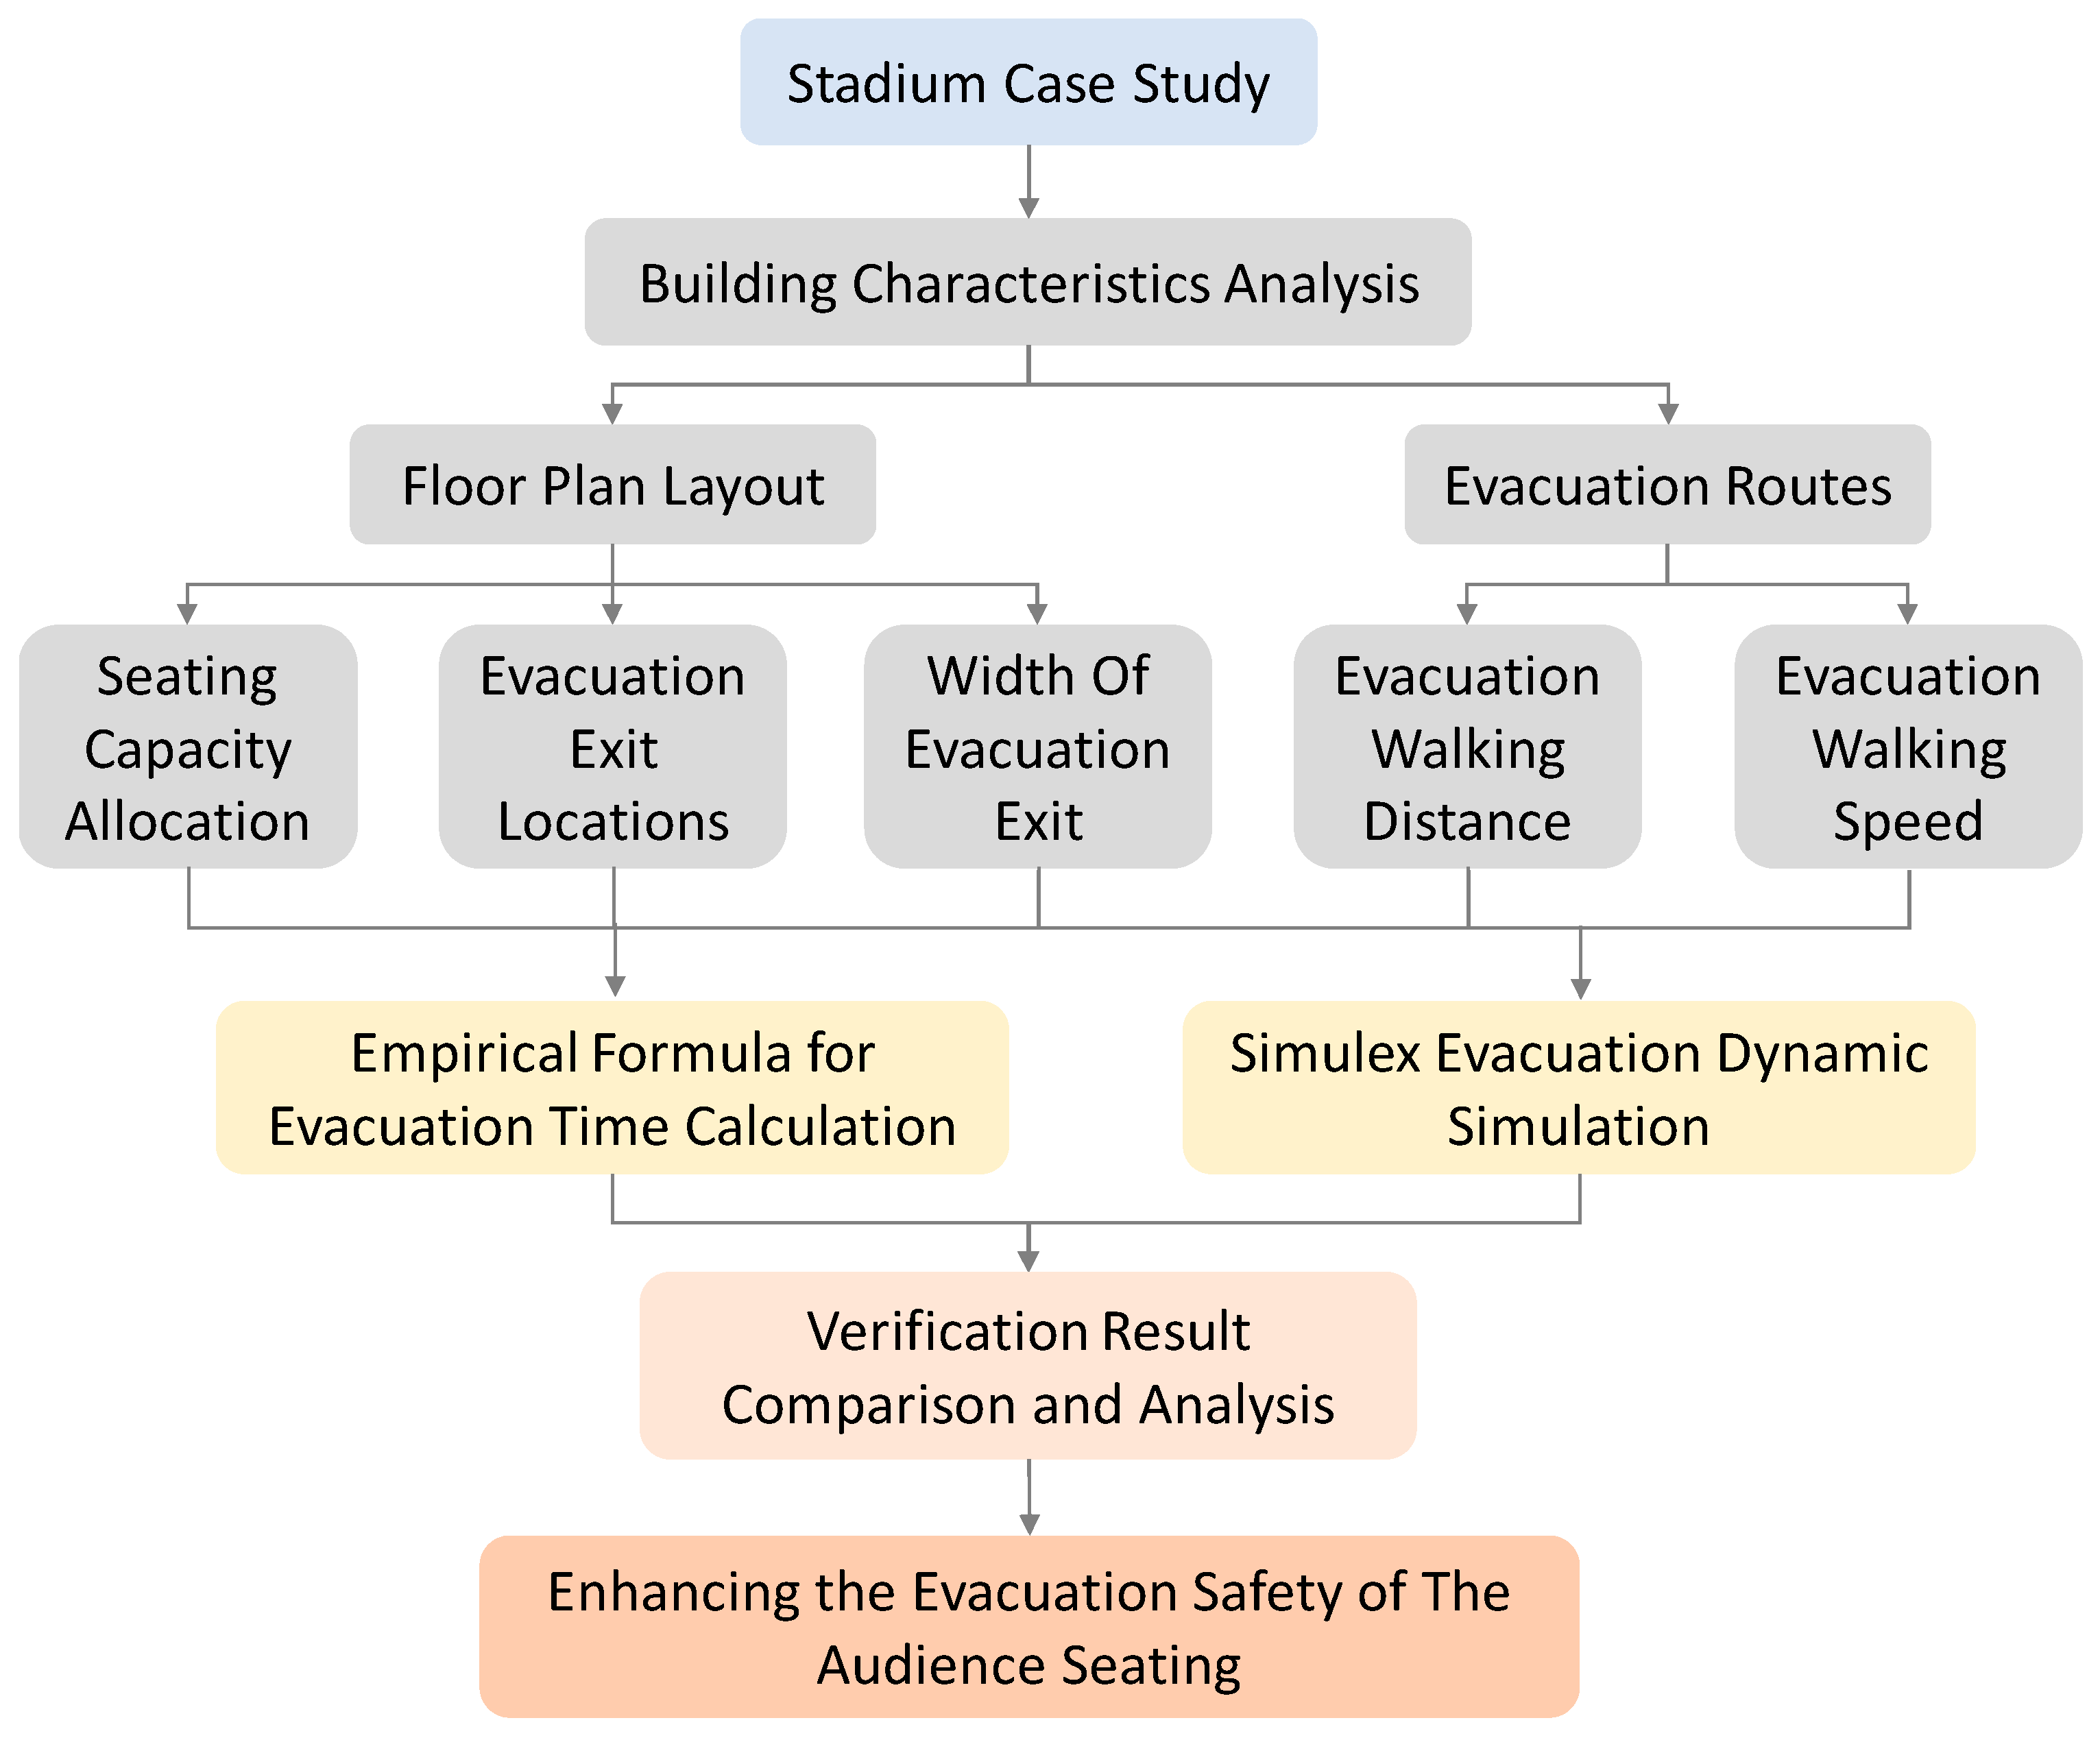
Figure 1. Research process diagram.
Fire 08 00210 g001
Figure 2. (a) Interpersonal contact distance; (b) relationship between interpersonal distance and walking speed (Source: Simulex User Manual).
Fire 08 00210 g002
Figure 3. Longitudinal section of the stadium.
Fire 08 00210 g003
Figure 4. Stadium seating layout plan.
Fire 08 00210 g004
Figure 5. (a) Evacuation Routes for Outfield Seating Areas; (b) Evacuation Routes for Infield Seating Areas.
Fire 08 00210 g005
Figure 6. Evacuation zones for infield lower-level seating.
Fire 08 00210 g006
Figure 7. Evacuation zones for Infield Middle-Level Seating (the colorless sections of the audience seating represent the Lower-Level projected seating, not the seating on the current level).
Fire 08 00210 g007
Figure 8. (a) Evacuation zones for Infield Upper-Level 4F Seating; (b) evacuation zones for Infield Upper-Level 5F Seating (the colorless sections of the audience seating represent the Lower-Level projected seating, not the seating on the current level).
Fire 08 00210 g008
Figure 9. Simulex simulation of Infield Lower-Level evacuation at 5 min.
Fire 08 00210 g009
Figure 10. Simulex simulation of Infield Lower-Level evacuation at 8 min.
Fire 08 00210 g010
Figure 11. Infield Middle-Level Simulex simulation at 3 min.
Fire 08 00210 g011
Figure 12. Infield Middle-Level Simulex simulation at 6 min.
Fire 08 00210 g012
Figure 13. (a) Infield Upper-Level 4F evacuation simulation at 3 min; (b) Infield Upper-Level 5F evacuation simulation at 3 min.
Fire 08 00210 g013
Figure 14. (a) Infield Upper-Level 4F evacuation simulation at 8 min; (b) Infield Upper-Level 5F evacuation simulation at 8 min.
Fire 08 00210 g014
Figure 15. The relationship between stadium architectural design phases and their corresponding safety planning references and tools.
Fire 08 00210 g015
Table 1. Assumptions and parameter settings for Simulex simulation.
Occupant Settings
Occupant Group: Shoppers
Occupant Types: Average 30%, Male 30%, Female 30%, Child 10%
Distribution Method: Distributed according to actual seating locations in the audience area
Walking Speed
Flat walking speed: randomly set between 0.8 and 1.7 m/s under unimpeded conditions
Upward walking speed: 0.35 times the horizontal walking speed
Downward walking speed: 0.55 times the horizontal walking speed
Collision Response
Occupants will avoid direct collisions; when obstacles (people or objects) appear ahead, they will automatically slow down or detour.
The simulation adjusts walking speed based on natural interpersonal spacing during crowd movement.
Exit Selection Logic
Default behavior follows the nearest exit selection principle.
No dynamic behavior change is simulated (e.g., occupants do not change their exit choice midway).
Multiple exits are simulated, and the usage distribution of each exit is recorded.
Crowd Response
When density is too high, the system restricts free movement of occupants to simulate congestion and stagnation.
Abnormal evacuation behaviors (such as panic running, falling, or pushing) are not considered in the simulation.
Table 2. Stadium seating configuration table.
FloorZoneSeating Capacity
B1FLower-tier seating17,531 seats
2FMiddle-tier seating13,753 seats
3FVIP-tier seating2200 seats
4FUpper-tier seating2352 seats
5FUpper-tier seating5126 seats
Total40,962 seats
Table 3. Basic information of infield lower-level seating.
Seating Area NumberFloor Area (m2)Seating Capacity (Seats)Horizontal Aisle Walking Distance (m)Vertical Aisle Walking Distance (m)Exit Width (m)
I-10195.241772.7512.941.2
I-102215.84146.1717.591.2
I-103353.467512.9918.421.5
I-104354.270210.4725.921.5
I-105366.97505.8928.71.5
I-106338.27645.3927.81.5
I-107372.77186.2327.831.5
I-108254.36513.0227.751.5
I-109347650432.191.5
I-110289.76522.9228.571.5
I-111295.66383.2628.891.5
Table 4. Basic information of Infield Middle-Level Seating.
Seating Area NumberFloor Area (m2)Seating Capacity (Seats)Horizontal Aisle Walking Distance (m)Vertical Aisle Walking Distance (m)Exit Width (m)
I-20197.41994.6112.991.2
I-202180.353687.3415.61.2
I-203231.024706.6215.961.2
I-204216.24706.5215.91.2
I-205222.24726.1515.951.2
I-206232.155086.7915.891.2
I-207216.774506.9615.911.2
I-208201.644226.1415.951.2
I-209199.24085.73161.2
I-210202.524065.7161.2
I-211173.353445.29161.2
Table 5. Basic information of Infield Upper-Level Seating.
Seating Area NumberFloor Area (m2)Seating Capacity (Seats)Horizontal Aisle Walking Distance (m)Vertical Aisle Walking Distance (m)Exit Width (m)
I-40197.572048.145.751.2
I-40296.172147.435.751.2
I-40375.961528.544.91.2
I-40458.991216.854.91.2
I-40567.441266.834.911.2
I-40679.781627.574.911.2
I-40793.941977.935.761.2
I-501143.362947.9614.981.2
I-502176.113788.1216.661.2
I-503212.834538.3719.281.2
I-504265.835748.5320.961.2
I-505265.885768.47211.2
I-506265.885768.5420.911.2
Table 6. Evacuation time statistics for Infield Lower-Level Seating.
Seating Area NumberGreen Guide
(min)
Verification Guideline of Buildings Evacuation Safety Performance-Based DesignSimulex
(min)
Evacuation Start Time (min)Time to Reach Exit (min)Time to Pass Through Exit (min)Total
(min)
I-1012.230.330.571.642.541.32
I-1025.230.490.863.835.185.70
I-1036.820.631.125.06.757.22
I-1047.090.631.315.27.1418.53
I-1057.580.641.265.567.4610.78
I-1067.720.611.215.667.487.95
I-1077.250.641.245.327.28.22
I-1086.580.531.134.826.486.78
I-1096.570.621.336.027.978.27
I-1106.590.330.571.642.546.52
I-1116.440.490.863.835.186.70
Table 7. Infield Middle-Level Evacuation Time Statistics.
Seating Area NumberGreen Guide
(min)
Verification Guideline of Buildings Evacuation Safety Performance-Based DesignSimulex
(min)
Evacuation Start Time (min)Time to Reach Exit (min)Time to Pass Through Exit (min)Total
(min)
I-2012.510.330.631.842.812.58
I-2024.650.450.823.414.685.28
I-2035.930.510.814.355.677.17
I-2045.930.490.814.355.656.67
I-2055.960.500.804.375.666.60
I-2066.410.510.814.706.036.67
I-2075.680.490.824.175.485.67
I-2085.330.470.803.915.185.5
I-2095.150.470.783.785.035.87
I-2105.130.470.783.765.025.67
I-2114.340.440.773.194.394.58
Table 8. Statistics of Upper Infield evacuation time.
Seating Area NumberGreen Guide
(min)
Verification Guideline of Buildings Evacuation Safety Performance-Based DesignSimulex
(min)
Evacuation Start Time (min)Time to Reach Exit (min)Time to Pass Through Exit (min)Total
(min)
I-4012.580.330.481.892.702.52
I-4022.70.330.461.982.772.10
I-4031.920.290.471.412.161.88
I-4041.530.260.411.121.791.62
I-4051.590.270.411.171.851.80
I-4062.050.300.431.502.231.92
I-4072.490.320.481.822.621.98
I-5013.710.400.682.723.804.30
I-5024.770.440.733.504.687.02
I-5035.720.490.814.195.507.17
I-5047.250.540.875.316.729.15
I-5057.270.540.875.336.749.25
I-5067.270.540.875.336.749.8
Disclaimer/Publisher’s Note: The statements, opinions and data contained in all publications are solely those of the individual author(s) and contributor(s) and not of MDPI and/or the editor(s). MDPI and/or the editor(s) disclaim responsibility for any injury to people or property resulting from any ideas, methods, instructions or products referred to in the content.