Article

Study on the Spatial and Temporal Evolution of Hydrogen-Blended Natural Gas Leakage and Flare-Up in the Typical Semi-Open Space

1
China Academy of Safety Science and Technology, Beijing 100012, China
2
Shenzhen Gas Co., Ltd., Shenzhen 518049, China
3
Huaneng North United Power Co., Ltd., Hohhot 010000, China
4
Northwest Electric Power Design Institute Co., Ltd. of China Power Engineering Consulting Group, Xi’an 710075, China
*
Author to whom correspondence should be addressed.
Fire 2025, 8(4), 146; https://doi.org/10.3390/fire8040146
Submission received: 19 February 2025 / Revised: 31 March 2025 / Accepted: 2 April 2025 / Published: 4 April 2025
(This article belongs to the Special Issue Hydrogen Safety: Challenges and Opportunities)

Abstract

:
Numerical simulations reveal the combustion dynamics of hydrogen-blended natural gas (H-BNG) in semi-open spaces. In the typical semi-open space scenario, increasing the hydrogen blending ratio from 0% to 60% elevates peak internal pressure by 107% (259.3 kPa → 526.0 kPa) while reducing pressure rise time by 56.5% (95.8 ms → 41.7 ms). A vent size paradox emerges: 0.5 m openings generate 574.6 kPa internal overpressure, whereas 2 m openings produce 36.7 kPa external overpressure. Flame propagation exhibits stabilized velocity decay (836 m/s → 154 m/s, 81.6% reduction) at hydrogen concentrations ≥30% within 2–8 m distances. In street-front restaurant scenarios, 80% H-BNG leaks reach alarm concentration (0.8 m height) within 120 s, with sensor response times ranging from 21.6 s (proximal) to 40.2 s (distal). Forced ventilation reduces hazard duration by 8.6% (151 s → 138 s), while door status shows negligible impact on deflagration consequences (412 kPa closed vs. 409 kPa open), maintaining consistent 20.5 m hazard radius at 20 kPa overpressure threshold. These findings provide crucial theoretical insights and practical guidance for the prevention and management of H-BNG leakage and explosion incidents.

1. Introduction

With the growing global emphasis on decarbonization, natural gas has gained global prominence as a transitional clean energy source. However, its combustible nature poses substantial safety risks in confined or semi-enclosed environments [1]. The emerging hydrogen-blended natural gas (H-BNG), while promising for deeper carbon footprint reduction, introduces new combustion complexities due to hydrogen’s distinct physicochemical profile [2]. Hydrogen exhibits markedly different characteristics compared to methane (the primary component of natural gas), including lower density (0.0899 vs. 0.656 kg/m3), wider flammability range (4.0–77% vs. 4.4–17% by volume), and significantly lower ignition energy (0.017 mJ vs. 0.23 mJ) [3]. Recent catastrophic events in China—the 2021 Shiyan underground pipeline explosion (25 fatalities), Shenyang commercial district blast, and 2023 Yinchuan urban restaurant detonation—underscore the critical need to understand H-BNG behavior in semi-open spaces [4].
In the field of H-BNG dispersion research, groundbreaking work has revealed critical transport mechanisms. Lowesmith et al. [5] established a vertical jet model incorporating wind-buoyancy interactions, demonstrating that 30% hydrogen content increases dispersion rates by 40–60% in residential scenarios. Marangon and Carcassi [6] identified persistent stratification phenomena in large enclosures, attributable to hydrogen’s high diffusivity. Su et al. [7] employed numerical simulations to investigate the leakage and diffusion patterns of H-BNG in residential kitchens, systematically analyzing the effects of hydrogen blending ratio, leakage rate, ventilation conditions, and spatial dimensions. Li et al. [8] developed a numerical model for H-BNG leakage in confined containers, examining how varying hydrogen proportions influence concentration distributions and the evolution of flammable zones during diffusion.
Multiple experimental studies have revealed hydrogen’s critical role in modifying methane combustion dynamics. Mitu et al. [9] demonstrated hydrogen’s capacity to alter burning velocities through its effects on diffusion rates, heat release, and free radical concentrations at flame fronts. Ma et al. [10] identified significant enhancement of explosion characteristics in methane-hydrogen mixtures at high hydrogen fractions. Witkowski et al. [11] established a safety threshold: H-BNG mixtures with >50% hydrogen volume fraction exhibit substantially increased risks. Middha et al. [12] evaluated combustion properties, finding H-BNG’s risk profile under specific conditions lower than pure methane or hydrogen. Di Sarli et al. [13] uncovered hydrogen’s ability to intensify flame-vortex interactions, while Yu et al. [14] highlighted the critical influence of ignition location on deflagration behavior. Duan et al. [15] reported rapid overpressure escalation in pipelines with increasing hydrogen content, and Zhang et al. [16] confirmed carbon dioxide’s superior flame suppression efficacy. Li et al. [17] further explored supersonic combustion wave propagation in hydrogen–methane mixtures.
Advanced numerical simulations have deepened understanding of methane–hydrogen mixture hazards. Ma et al. [18] showed marked explosion intensification when hydrogen blending ratios exceed 0.5. Zhou et al. [19] examined the coupled effects of ambient wind speed and hydrogen blending on combustion outcomes. Stolecka [20] conducted comparative analyses of jet fire consequences across hydrogen concentrations. Zhang et al. [21] revealed vapor cloud morphology’s critical role in explosion hazards within elongated confined spaces. Kang et al. [22] performed detailed consequence analyses for high-pressure fueling station fires. To enhance flame propagation modeling, Di Sarli and Benedetto [23] developed a large eddy simulation framework, while Cellek [24] systematically investigated combustion mechanisms using multiple turbulence models. Wang et al. [25] identified fundamental shifts in hydrogen’s flame role when concentrations surpass 20%.
Extensive research has been conducted on the leakage, diffusion, combustion, and explosion characteristics of H-BNG. Experimental studies have systematically investigated post-leakage behaviors, including diffusion accumulation, stratification phenomena, and combustion dynamics, revealing hydrogen’s profound impact on methane’s burning velocity and explosive properties. Complementary numerical analyses have comprehensively assessed safety risks in methane-hydrogen mixtures, incorporating critical variables such as hydrogen blending ratios, ambient wind speeds, and spatial configurations. Building on these experimental and numerical foundations, this study establishes a semi-open vented container model to systematically examine the effects of hydrogen blending ratio, ignition position, vent size, and volume blockage ratios on both intra-container pressure evolution and external flame propagation dynamics. To enhance practical relevance, we further designed a realistic street-front restaurant scenario simulating H-BNG leakage and subsequent explosions, enabling in-depth exploration of gas dispersion patterns and combustion characteristics within representative semi-enclosed urban environments.

2. Methods and Models Construction

2.1. Mathematical Model

Subsequent investigations in this study will utilize FLACS, a specialized computational fluid dynamics (CFD) tool designed for safety-critical applications [26].

2.1.1. Diffusion and Ventilation Model

The diffusion module in FLACS solves compressible fluid flow governed by three fundamental conservation laws:
(1) Mass conservation equation:
t ( β v ρ ) + x j ( β j ρ u j ) = m V
where t is time; β v is volume porosity of gas; ρ is density of gas; x j , β j , and u j correspond to the coordinate, area porosity, and velocity in j direction, respectively. m is mass rate of gas; V is volume of gas.
(2) Momentum conservation equation:
t ( β v ρ u i ) + x j ( β j ρ u i u j ) = β v p x i + x j ( β j σ i j ) + F o i + F w i + β v ( ρ ρ 0 ) g i
where u i and u j are the velocities of the gas in the i and j directions, respectively in m/s; x i and x j are the coordinates in the i and j directions, respectively; β j is the area porosity in the j direction; p is the absolute pressure of the gas in Pa; F o i and F w i are the flow resistances due to grid obstacles and wall flows in N; ρ 0 is the ideal atmospheric density in kg/m3; g i is the gravitational acceleration in the j direction in m/s2; σ i j is the stress tensor in N/m2.
(3) Energy Conservation Equation:
t ( β v ρ h ) + x j ( β j ρ u j h ) = x j ( β j μ e f f σ h h x j ) + β v D p D t + Q V
where h is the specific enthalpy of the gas in J/kg; μ e f f is the effective viscosity of the gas in Pa·s; σ h is a constant, with a value of 0.7; D p D t is the rate of pressure increase in the gas in Pa/s; and Q is the heat flux rate of the gas in J/s.
(4) The turbulence model employed by FLACS is accurately simulated using the two-equation k ε model.
a. Turbulent Kinetic Energy Transport Equation:
t ( β v ρ k ) + x j ( β j ρ u j k ) = x j ( β j μ e f f σ k k x j ) + β v P k β v ρ ε
where k is the turbulent kinetic energy in m2/s2; σ k is a constant, equal to 1.0; P k represents the production of turbulent kinetic energy in N; and ε is the dissipation rate of turbulent kinetic energy in m2/s3.
b. Turbulent Kinetic Energy Dissipation Rate Transport Equation:
t ( β v ρ ε ) + x j ( β j ρ u j ε ) = x j ( β j μ e f f σ ε ε x j ) + β v P ε C 2 ε β v ρ ε 2 k
where σ ε is a constant, equal to 1.3; P ε represents the dissipation production in N; and C 2 ε is another constant, equal to 1.92.
FLACS’ wind boundary settings are capable of accurately reflecting the characteristics of the near-surface atmospheric boundary layer. This setup is based on the theoretical framework proposed by Monin and Obukhov in 1954, which provides a deep understanding of the role of buoyancy in the atmospheric boundary layer and establishes an important characteristic length scale:
L = ρ a c p T a u * 3 κ g H s
where L is the Monin–Obukhov length in m; ρ a is the atmospheric density in kg/m3; c p is the specific heat capacity of air at constant pressure in J/(K·kg); T a is the atmospheric temperature in K; u * is the friction velocity in m/s; κ is the von Kármán constant (typically κ = 0.41); g is the acceleration due to gravity in m/s2; and H s is the sensible heat flux at the surface in W/m2.
The wind speed profile used in the atmospheric boundary layer model in FLACS is calculated using the following equation:
U ( z ) = u * κ ln ( ( z z d ) + z 0 z 0 ) ψ u ( z ) U 0 , z 0 = 0 , z 0 > 0
where U 0 is the characteristic wind speed at the reference height in m/s; z is the distance from the ground in m; z d is the displacement height, representing the canopy height of vegetation or buildings in m; and z 0 is the aerodynamic roughness length in m. The specific equation for solving ψ u ( z ) can be found in the FLACS documentation.

2.1.2. Combustion and Explosion Model

(1) Mass Fraction Transport Equation
In the Gas Explosions module of FLACS, when simulating gas combustion explosions, the mass fraction transport equation for the fuel must be satisfied. The equation is expressed as follows:
t ( β v ρ Y f u e l ) + x j ( β j ρ u j Y f u e l ) = x j ( β j μ e f f σ f u e l Y f u e l x j ) + R f u e l
where μ e f f is the effective viscosity of the fuel in Pa·s; σ f u e l is the Prandtl–Schmidt number for the fuel; Y f u e l is the mass fraction of the fuel; and R f u e l is the reaction rate of the fuel in kg/(m3·s).
(2) Combustion Rate Formulas
In a static environment, when a combustible gas cloud encounters a weak ignition source, the initial combustion mode appears as laminar combustion, characterized by a smooth flame front, with propagation entirely governed by thermal and molecular diffusion mechanisms. Subsequently, due to various instabilities, the flame surface becomes increasingly wrinkled, accelerating the flame speed as it transitions to a quasi-laminar combustion stage. Over time, depending on the hydrodynamic conditions, the flame ultimately evolves into a turbulent combustion state.
Laminar Combustion:
S L = S L 0 ( P P 0 ) γ p
where S L is the flame speed in the laminar combustion state in m/s; P is the overpressure generated during combustion in Pa; P 0 is the atmospheric pressure in Pa; and γ P is the pressure exponent for laminar burning velocity.
Quasi-Laminar Combustion:
S Q L = S L ( 1 + χ min ( ( R 3 ) 0.5 , 1 ) )
where S Q L is the flame speed in the quasi-laminar combustion state in m/s; R is the flame radius in m; and χ represents fuel-related parameters.
Turbulent Combustion:
S T = 1.81 u 0.412 l I 0.196 S L 0.784 ν 0.196
where S T is the flame speed in the turbulent combustion state in m/s; u is the root mean square of velocity fluctuations in m/s; l I is the turbulent integral length scale in m; and ν is the kinematic viscosity of the gas in m2/s. Assuming ν is constant, the turbulent burning velocity is given by the following.
S u = max ( S Q L , S T )

2.2. Independence of Geometry and Mesh

2.2.1. Typical Semi-Open Space Scenario

(1) Geometric Configuration
Figure 1 presents a cubic container measuring 3 m × 3 m × 3 m with 0.2 m thick walls. A 1.5 m × 1.2 m opening is designed along the positive X-axis direction, with its center positioned 1 m below the container’s top surface. A total of 20 monitoring points are deployed for comprehensive surveillance, including three internal points: MP1 (2.5, 3, 2), MP2 (0, 0.75, 0.5), and MP3 (2.6, 0, 2). Points MP4–MP20 are equally spaced at 1 m intervals along the horizontal plane coinciding with the opening’s center height. To simulate far-field explosive wave propagation, a plane-wave boundary condition (PLANE-WAVE) is applied along the positive X-axis direction, while Euler boundaries (EULER) are implemented in other directions to accommodate explosion simulation requirements.
(2) Mesh Independence
The mesh configuration combines core and extended domains to accurately simulate H-BNG combustion. The core domain spans (−0.2, 20) along the X-axis, (−0.2, 3.2) along the Y-axis, and (−0.2, 3.2) along the Z-axis, designed to mitigate boundary effects and provide adequate buffer space for external explosion dynamics. To address potential strong feedback near the vent, the extended domain expands to X(−3, 22), Y(−6, 9), and Z(−3, 6), enhancing model adaptability.
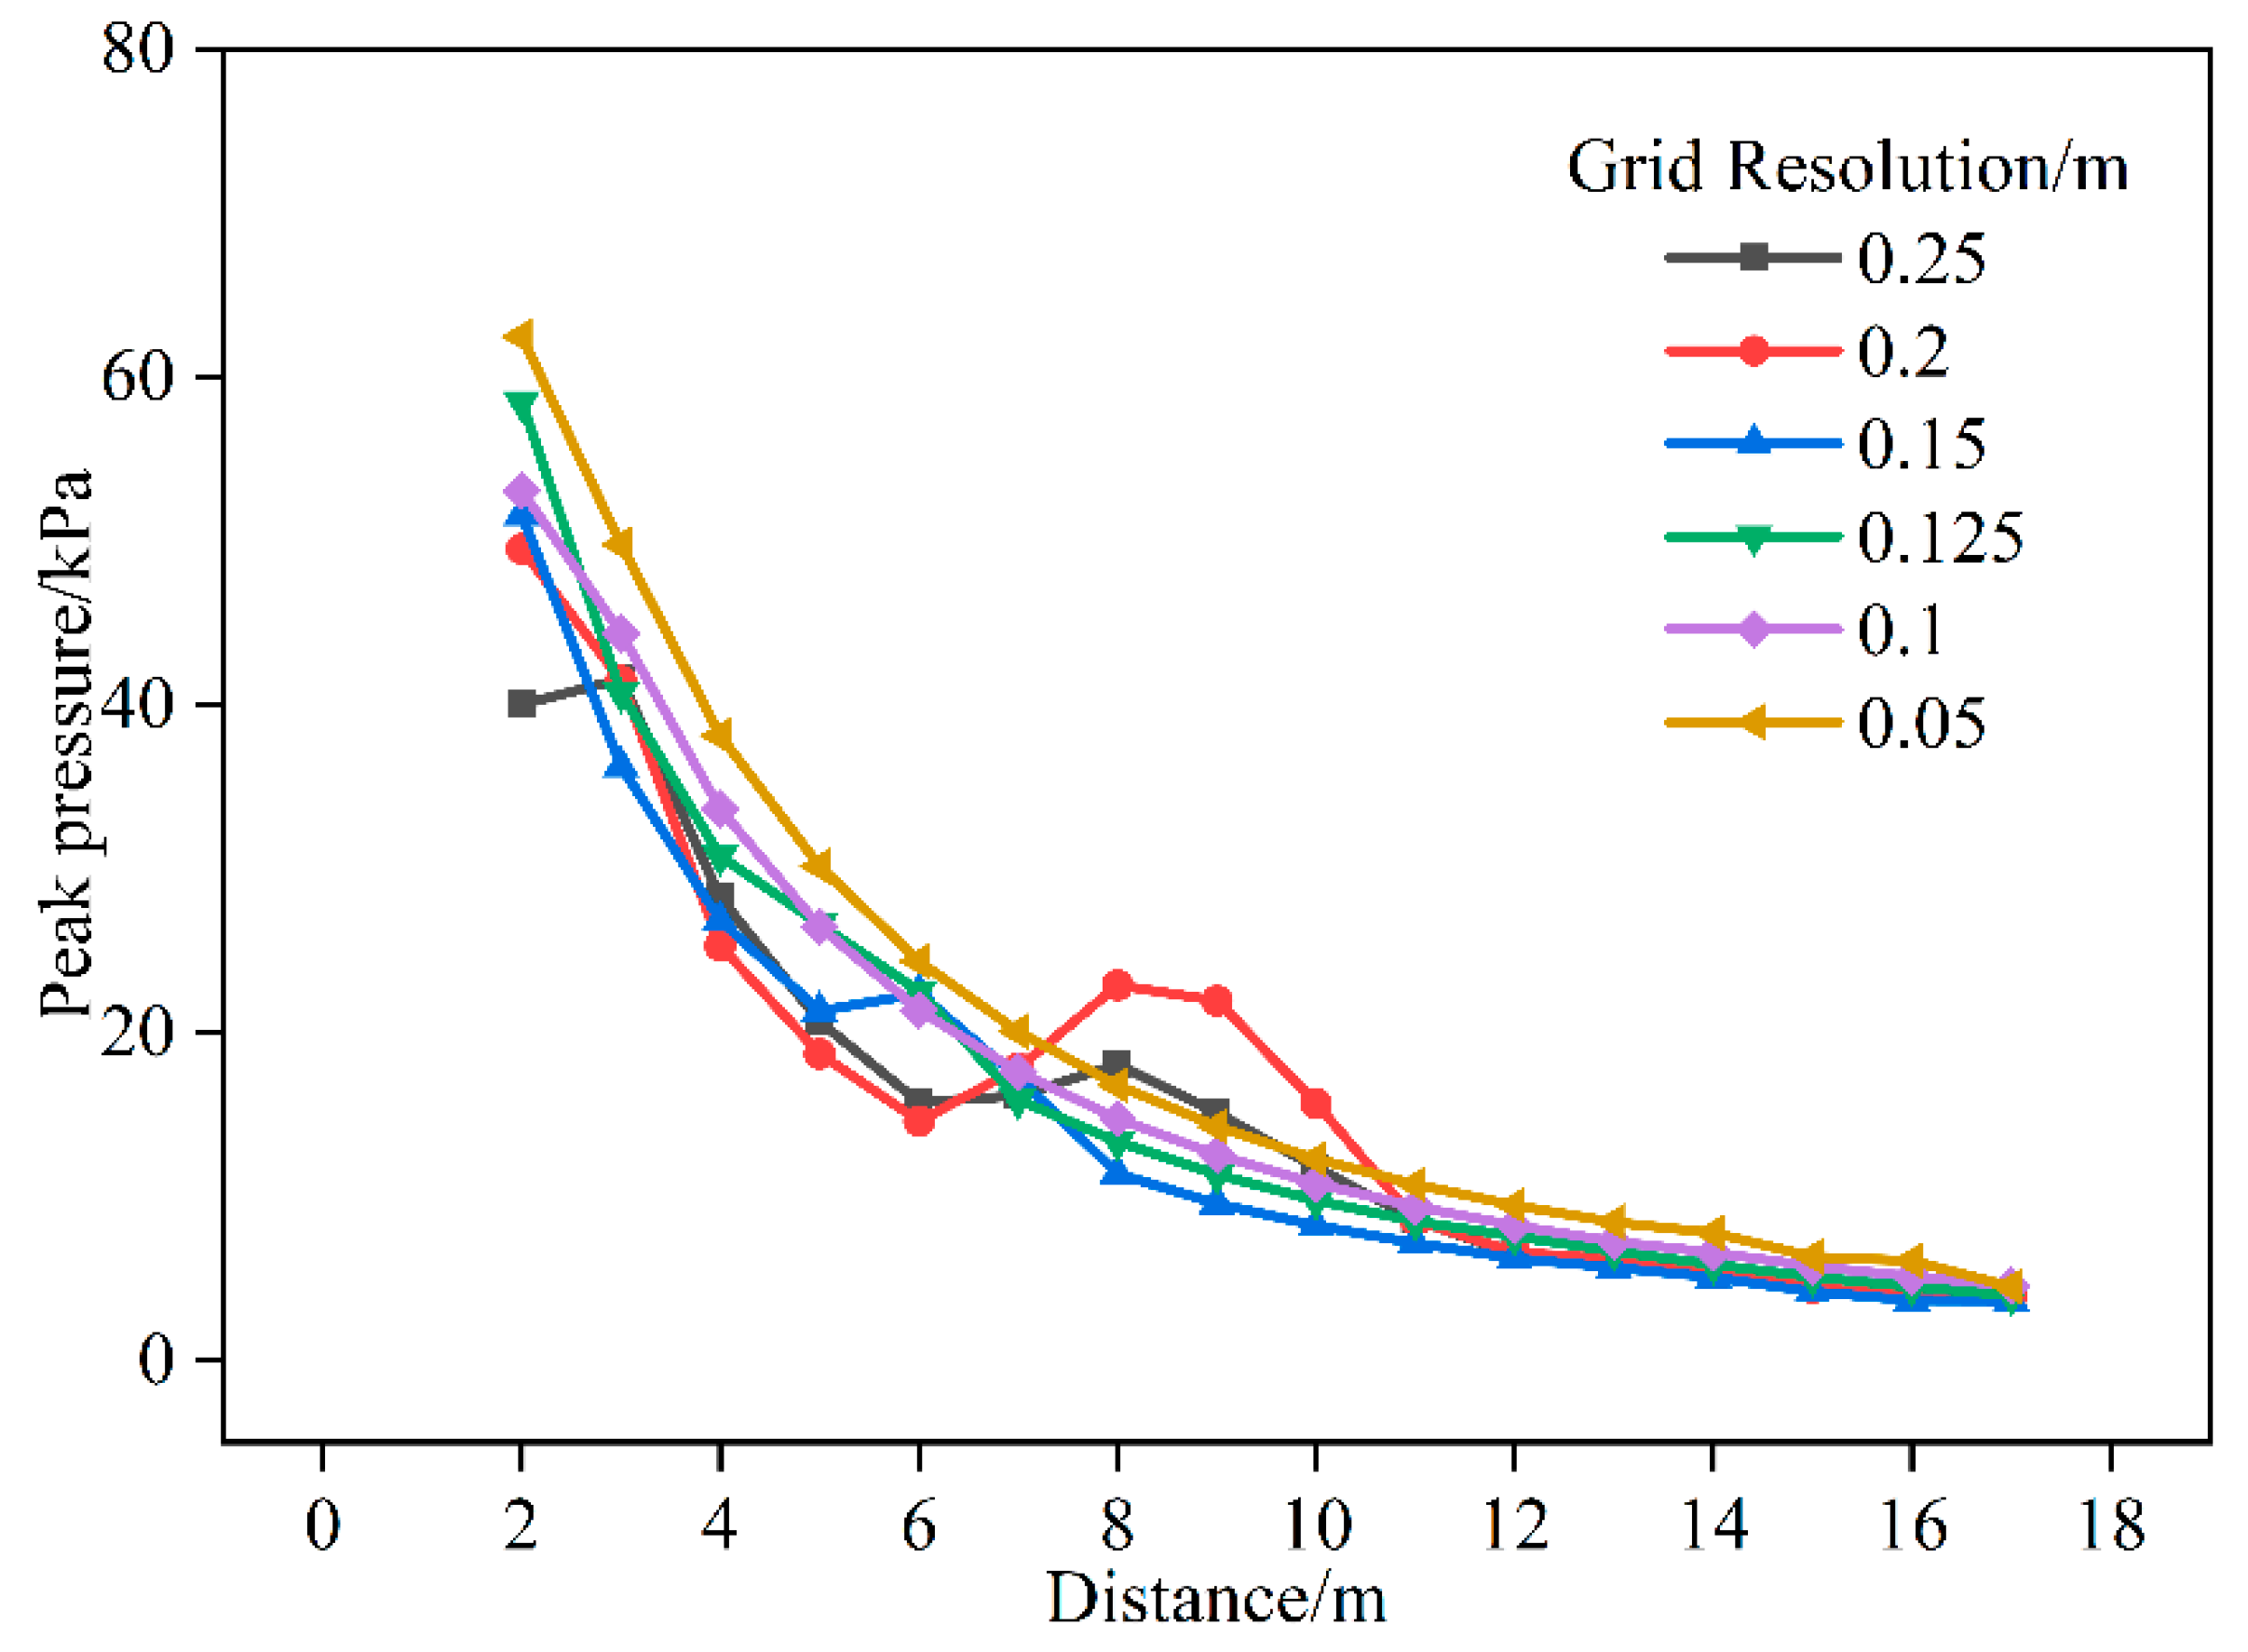
Figure 2 investigates six grid resolutions (0.25–0.05 m) and their impact on combustion pressure peak curves. The results demonstrate significant resolution-dependent characteristics: high-resolution grids (≤0.125 m) reveal complex pressure fluctuations indicative of detailed combustion features, while coarser resolutions produce smoother curves potentially overlooking local phenomena. Notably, the 0.05 m resolution exhibits overestimated combustion velocity, suggesting excessive precision may introduce numerical artifacts.
Comprehensive evaluation of simulation accuracy and computational efficiency identifies 0.125 m as the optimal resolution. This configuration effectively captures critical combustion characteristics while avoiding unnecessary computational overhead and error accumulation.
The model developed in this study aligns with Han’s research [27], maintaining identical parameters except for adjustments in volumetric hydrogen concentration (12.1%, 22.2%, 35.7%) to examine peak internal pressure variations within the container. The simulations demonstrated an average deviation of 6.4% compared to experimental results under these modified concentration conditions.

2.2.2. Typical Street-Front Restaurant Scenario

(1) Geometric Configuration
Figure 3 demonstrates a representative street-front restaurant model strategically partitioned into two primary functional zones: dining and kitchen areas. The dining section incorporates six optimally arranged tables to replicate real-world spatial efficiency and operational practicality. The kitchen integrates essential culinary infrastructure including cooking ranges, food preparation stations, and service counters, fully capturing back-of-house operational workflows. The specific measurements are presented in Figure 3 and Table 1.
To ensure simulation precision and numerical stability, NOZZLE boundary conditions are specifically configured throughout the domain. This selection outperforms conventional EULER boundaries in ventilation simulation fidelity and gas dispersion prediction accuracy, enabling reliable reproduction of complex indoor airflow patterns and contaminant transport mechanisms. The main entrance is geometrically centered 1 m from the XOZ plane, a critical spatial parameter enhancing environmental simulation authenticity.
(2) Mesh Independence
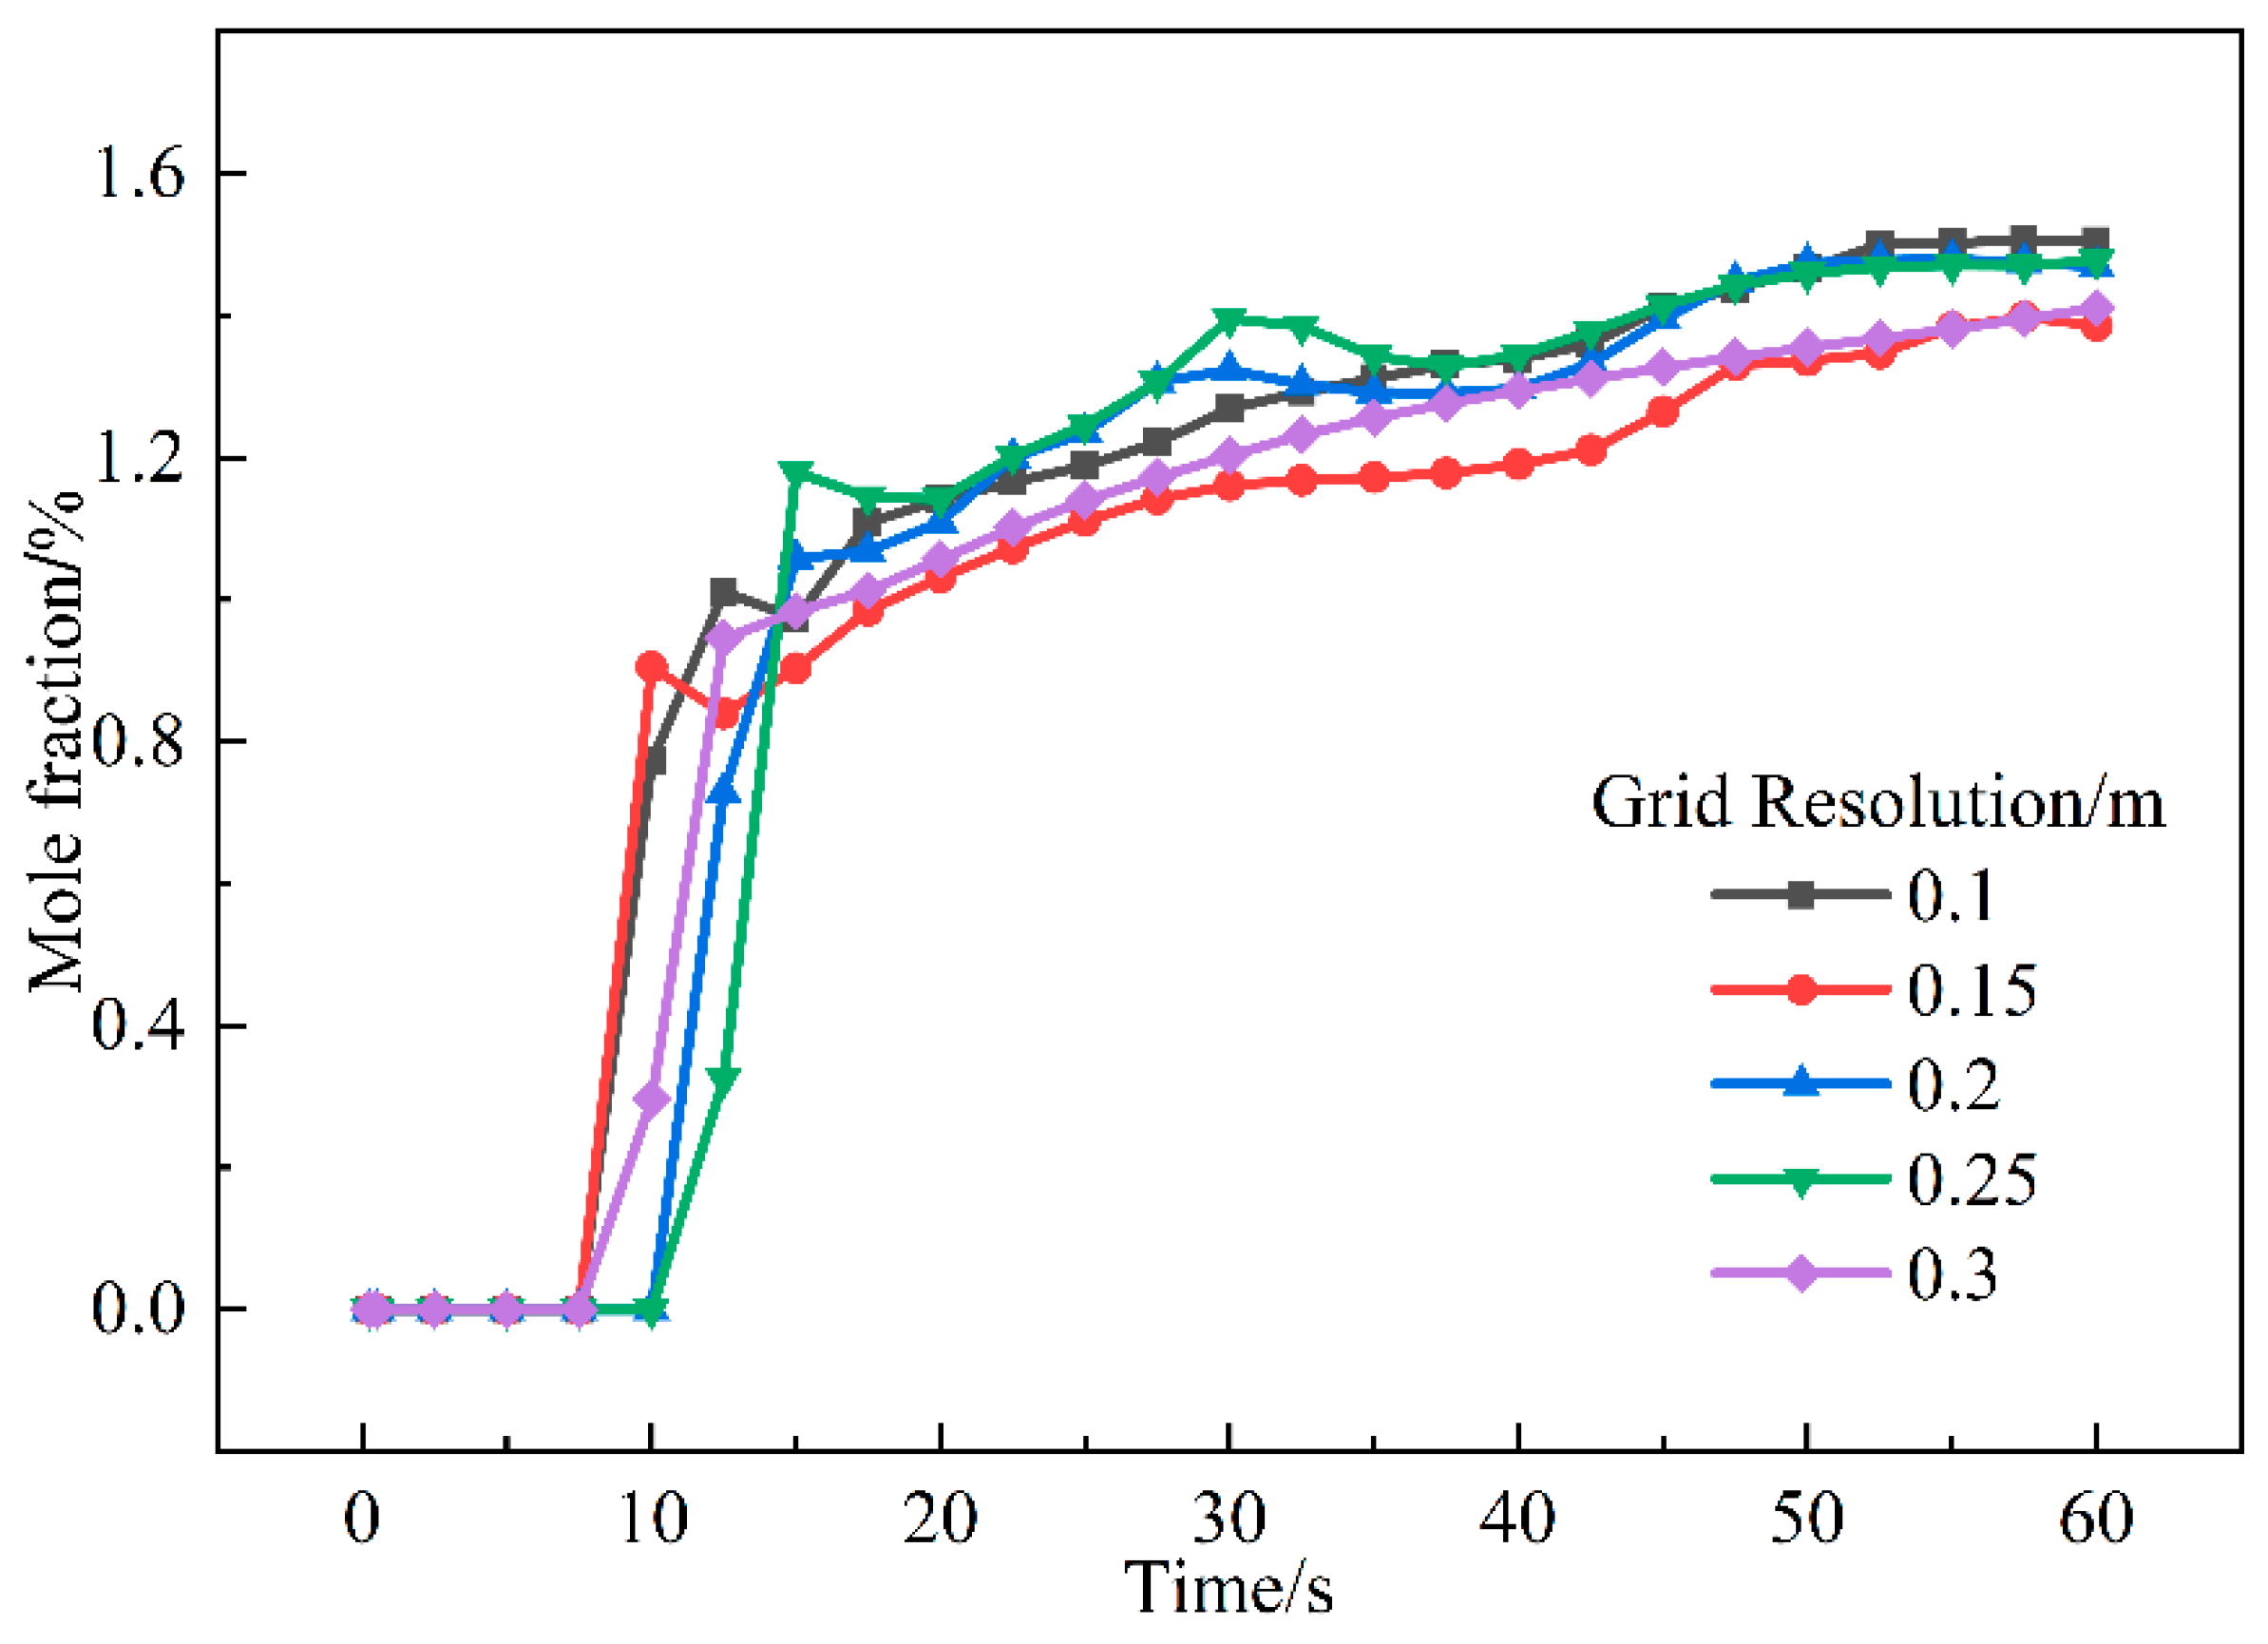
Through systematic evaluation of H-BNG molar fractions across mesh resolutions (0.1–0.3 m), Figure 4 demonstrates strong convergence among 0.1 m, 0.2 m, and 0.25 m configurations. Critical analysis of the 20–35 s timeframe reveals the 0.2 m resolution achieves <2% deviation from the 0.1 m benchmark, establishing this mid-range resolution as computationally optimal while maintaining physical fidelity.
To mitigate initial-phase dilution effects in combustible gas leakage simulations, targeted mesh refinement was implemented at leakage points, achieving 0.009 m resolution along both X and Y axes. This localized optimization enables high-fidelity representation of leakage dynamics, with post-refinement analysis confirming a grid-to-leakage area ratio of 1.213, ensuring adequate spatial resolution for capturing steep concentration gradients. While the refined zones exhibit a maximum cell aspect ratio of 22.222, this value remains compliant with computational fluid dynamics (CFD) stability criteria. The adopted multi-scale meshing strategy, combining domain-optimized 0.2 m resolution with leakage-focused refinement, successfully resolves critical phenomena such as H-BNG dispersion patterns, transient concentration evolution, and post-leakage gas transport mechanisms.

3. Results and Discussion

3.1. H-BNG Leak in a Semi-Open Space

3.1.1. Scenario

For far-field explosion pressure propagation simulation, this study establishes specialized boundary and initial conditions. A plane-wave boundary is configured along the positive X-axis direction while Eulerian boundaries are applied to other directions. The ambient environment is initialized at 20 °C and 100 kPa with atmospheric stability class F. The core investigation focuses on uniformly distributed H-BNG within a 3 m-edge cubic container centered at the origin. The fuel mixture, comprising variable hydrogen–methane ratios, is analyzed at stoichiometric equivalence ratio (Φ = 1) to simulate maximum combustion hazards. Instantaneous ignition sources are strategically positioned at three locations—central (1.5, 1.5, 1.5), front (2.6, 1.5, 1.5), and rear (0.4, 1.5, 1.5) regions of the container—to systematically investigate H-BNG’s far-field explosion propagation characteristics.

3.1.2. Pressure Field Distribution

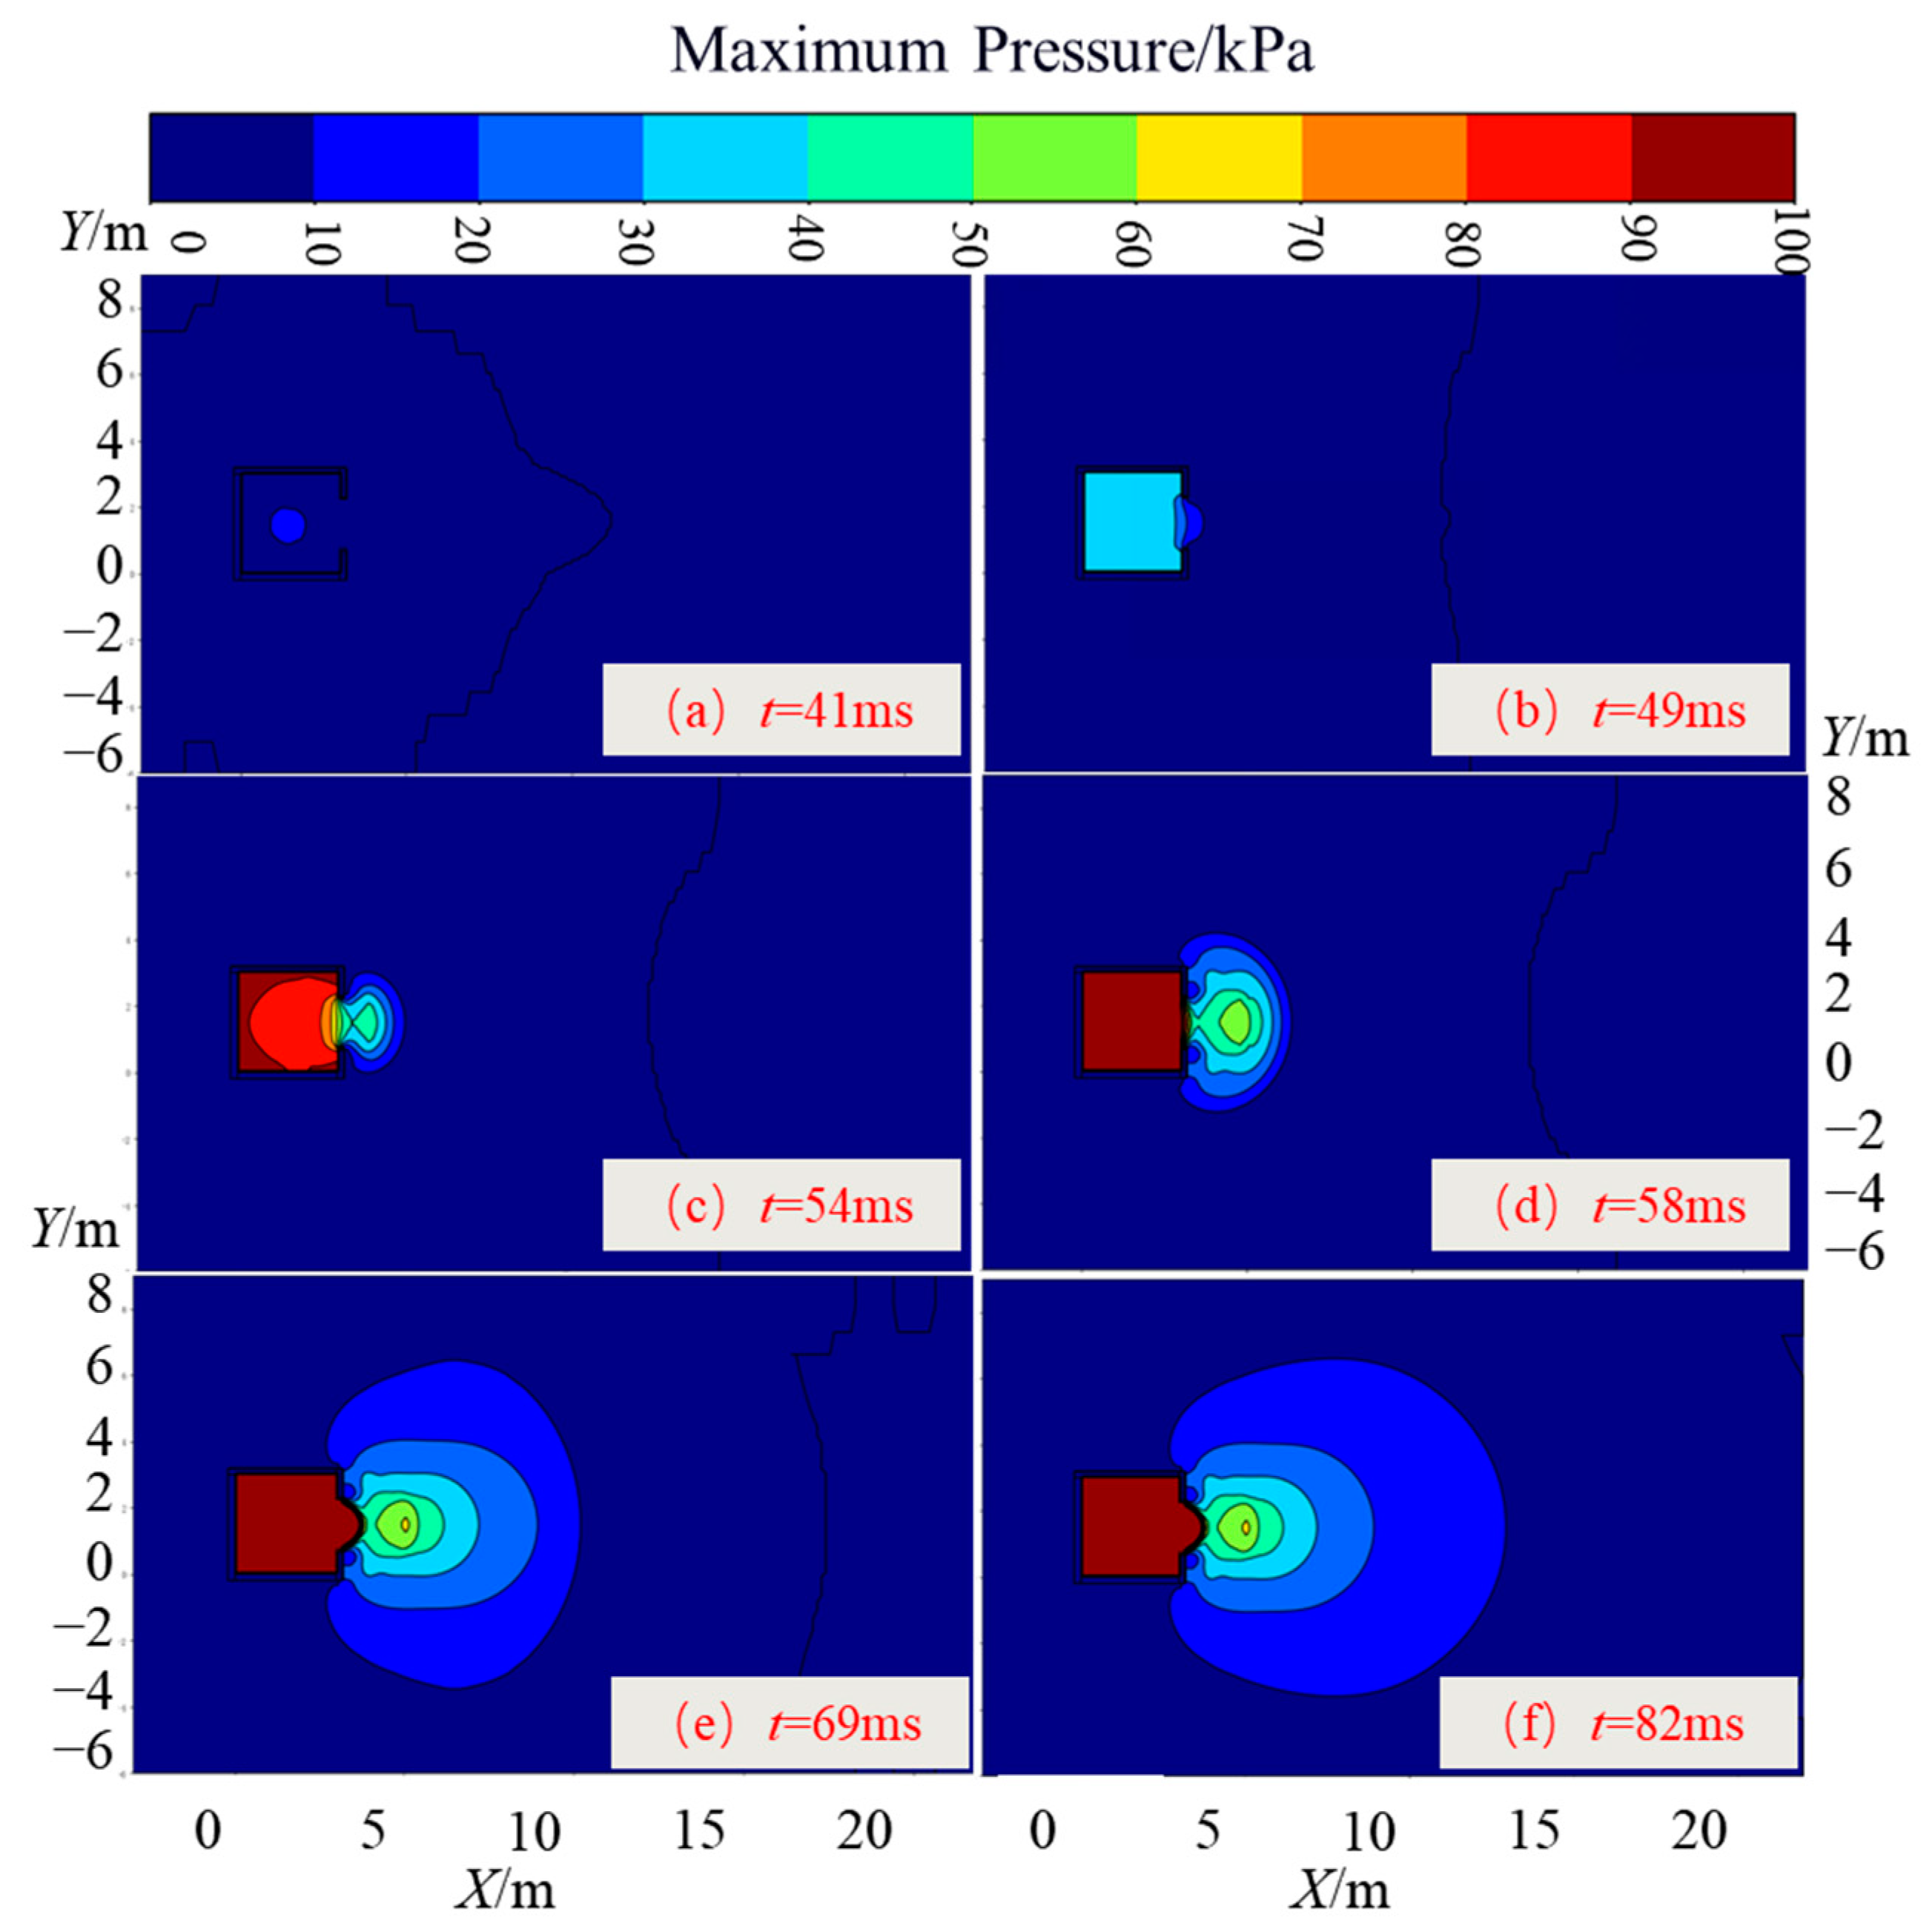
Figure 5 illustrates the far-field pressure field evolution of premixed H-BNG (20% H2) combustion at the Z = 2 m cross-section. Following central ignition, pressure rapidly accumulates and propagates radially. At 41 ms, the central overpressure reaches 10 kPa. By 49 ms, the container experiences full-coverage overpressure of 30 kPa, with 10 kPa observed at the vent opening. The maximum positive pressure of 58.5 kPa occurs 2 m from the container at 58 ms, while internal overpressure exceeds 100 kPa. A peak internal pressure of 361.8 kPa is recorded at 69 ms. By 82 ms, the pressure field stabilizes with the 10 kPa overpressure region extending vertically from Y = 6 m to Y = −4 m, and horizontally to X = 13 m. The hazardous zone (>20 kPa overpressure) spans up to X = 9 m downstream, presenting significant injury hazards.

3.1.3. Influence of Hydrogen-Blended Ratio

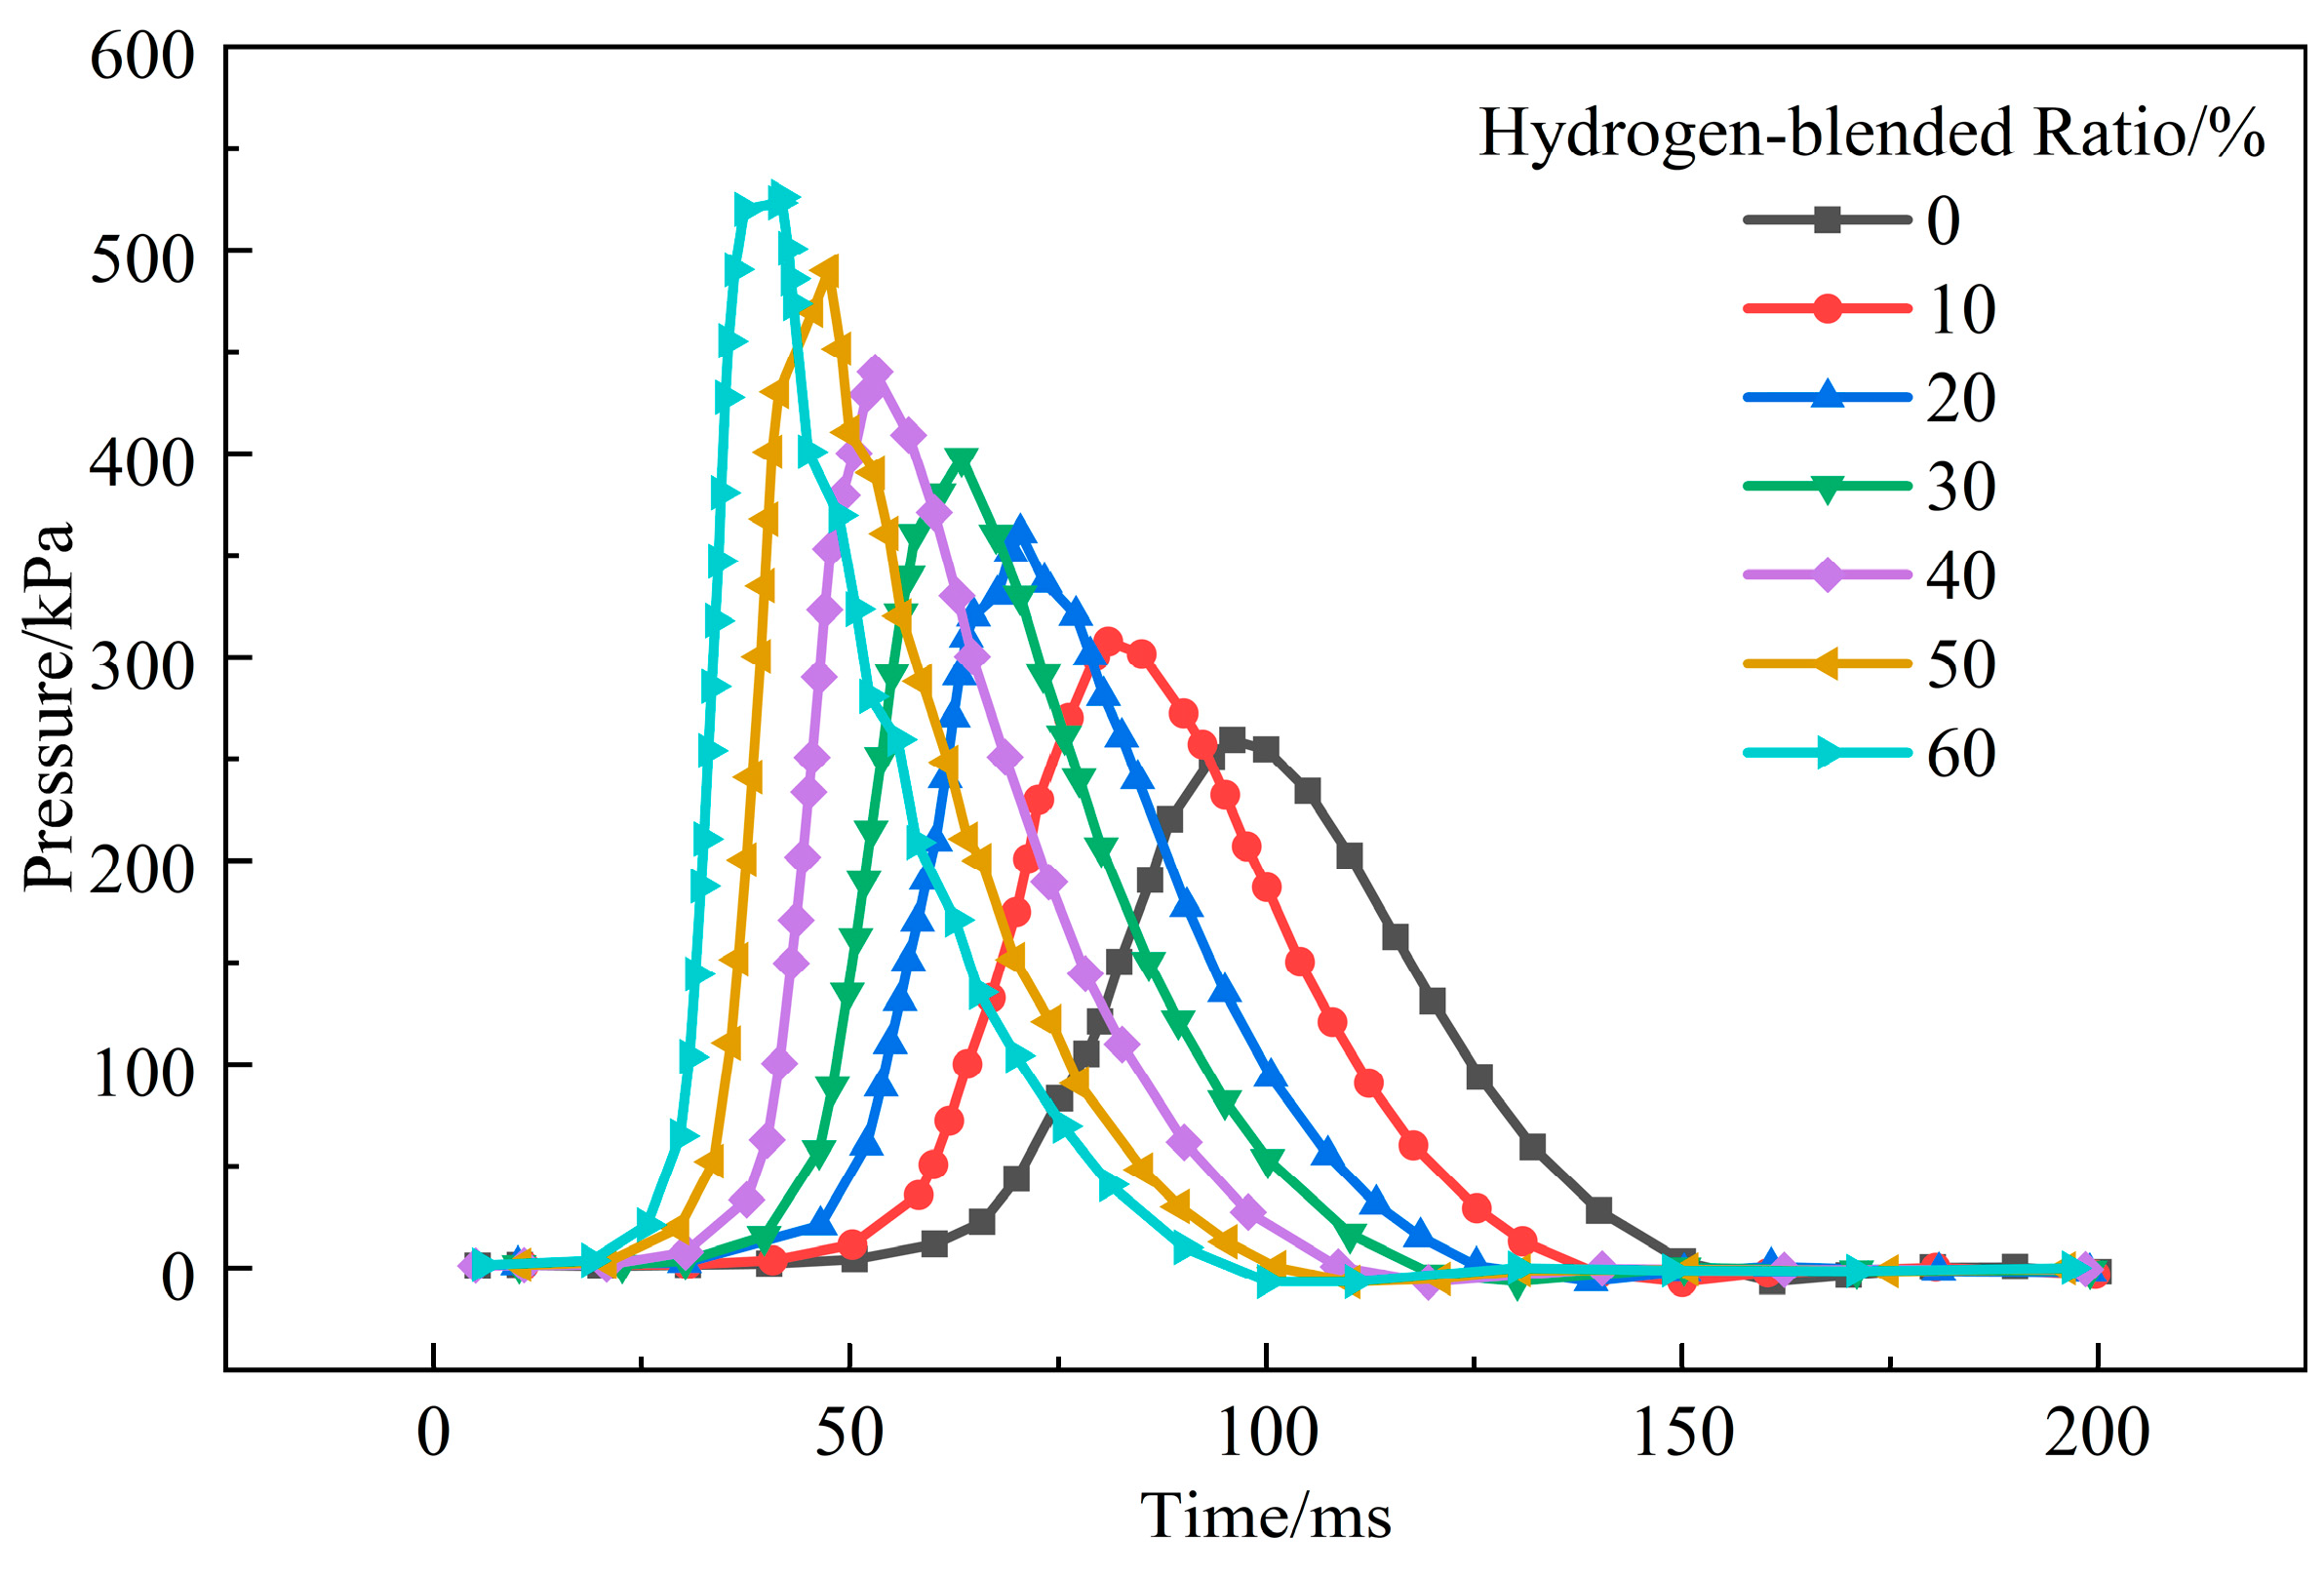
This section explores the explosion characteristics of H-BNG with varying hydrogen-blended ratios (ranging from 0% to 60%), with the ignition point at the center and an opening size of 1.5 m × 1.2 m. As shown in Figure 6, as the hydrogen-blended ratio increases, the peak internal pressure of the container significantly rises from 259.3 kPa to 526.0 kPa, while the corresponding peak pressure time decreases from 95.8 ms to 41.7 ms. This phenomenon is primarily attributed to the low ignition energy and high burning velocity of hydrogen. Data analysis from the monitoring points reveals that as the hydrogen-blended ratio increases, the shape of the pressure curve transitions from “short and wide” to “tall and narrow”, indicating that while the peak pressure significantly increases, the duration of high pressure correspondingly shortens. Specifically, the duration of pressure above 100 kPa decreases from 47.0 ms to 39.7 ms, likely due to the lower calorific value of hydrogen compared to methane.
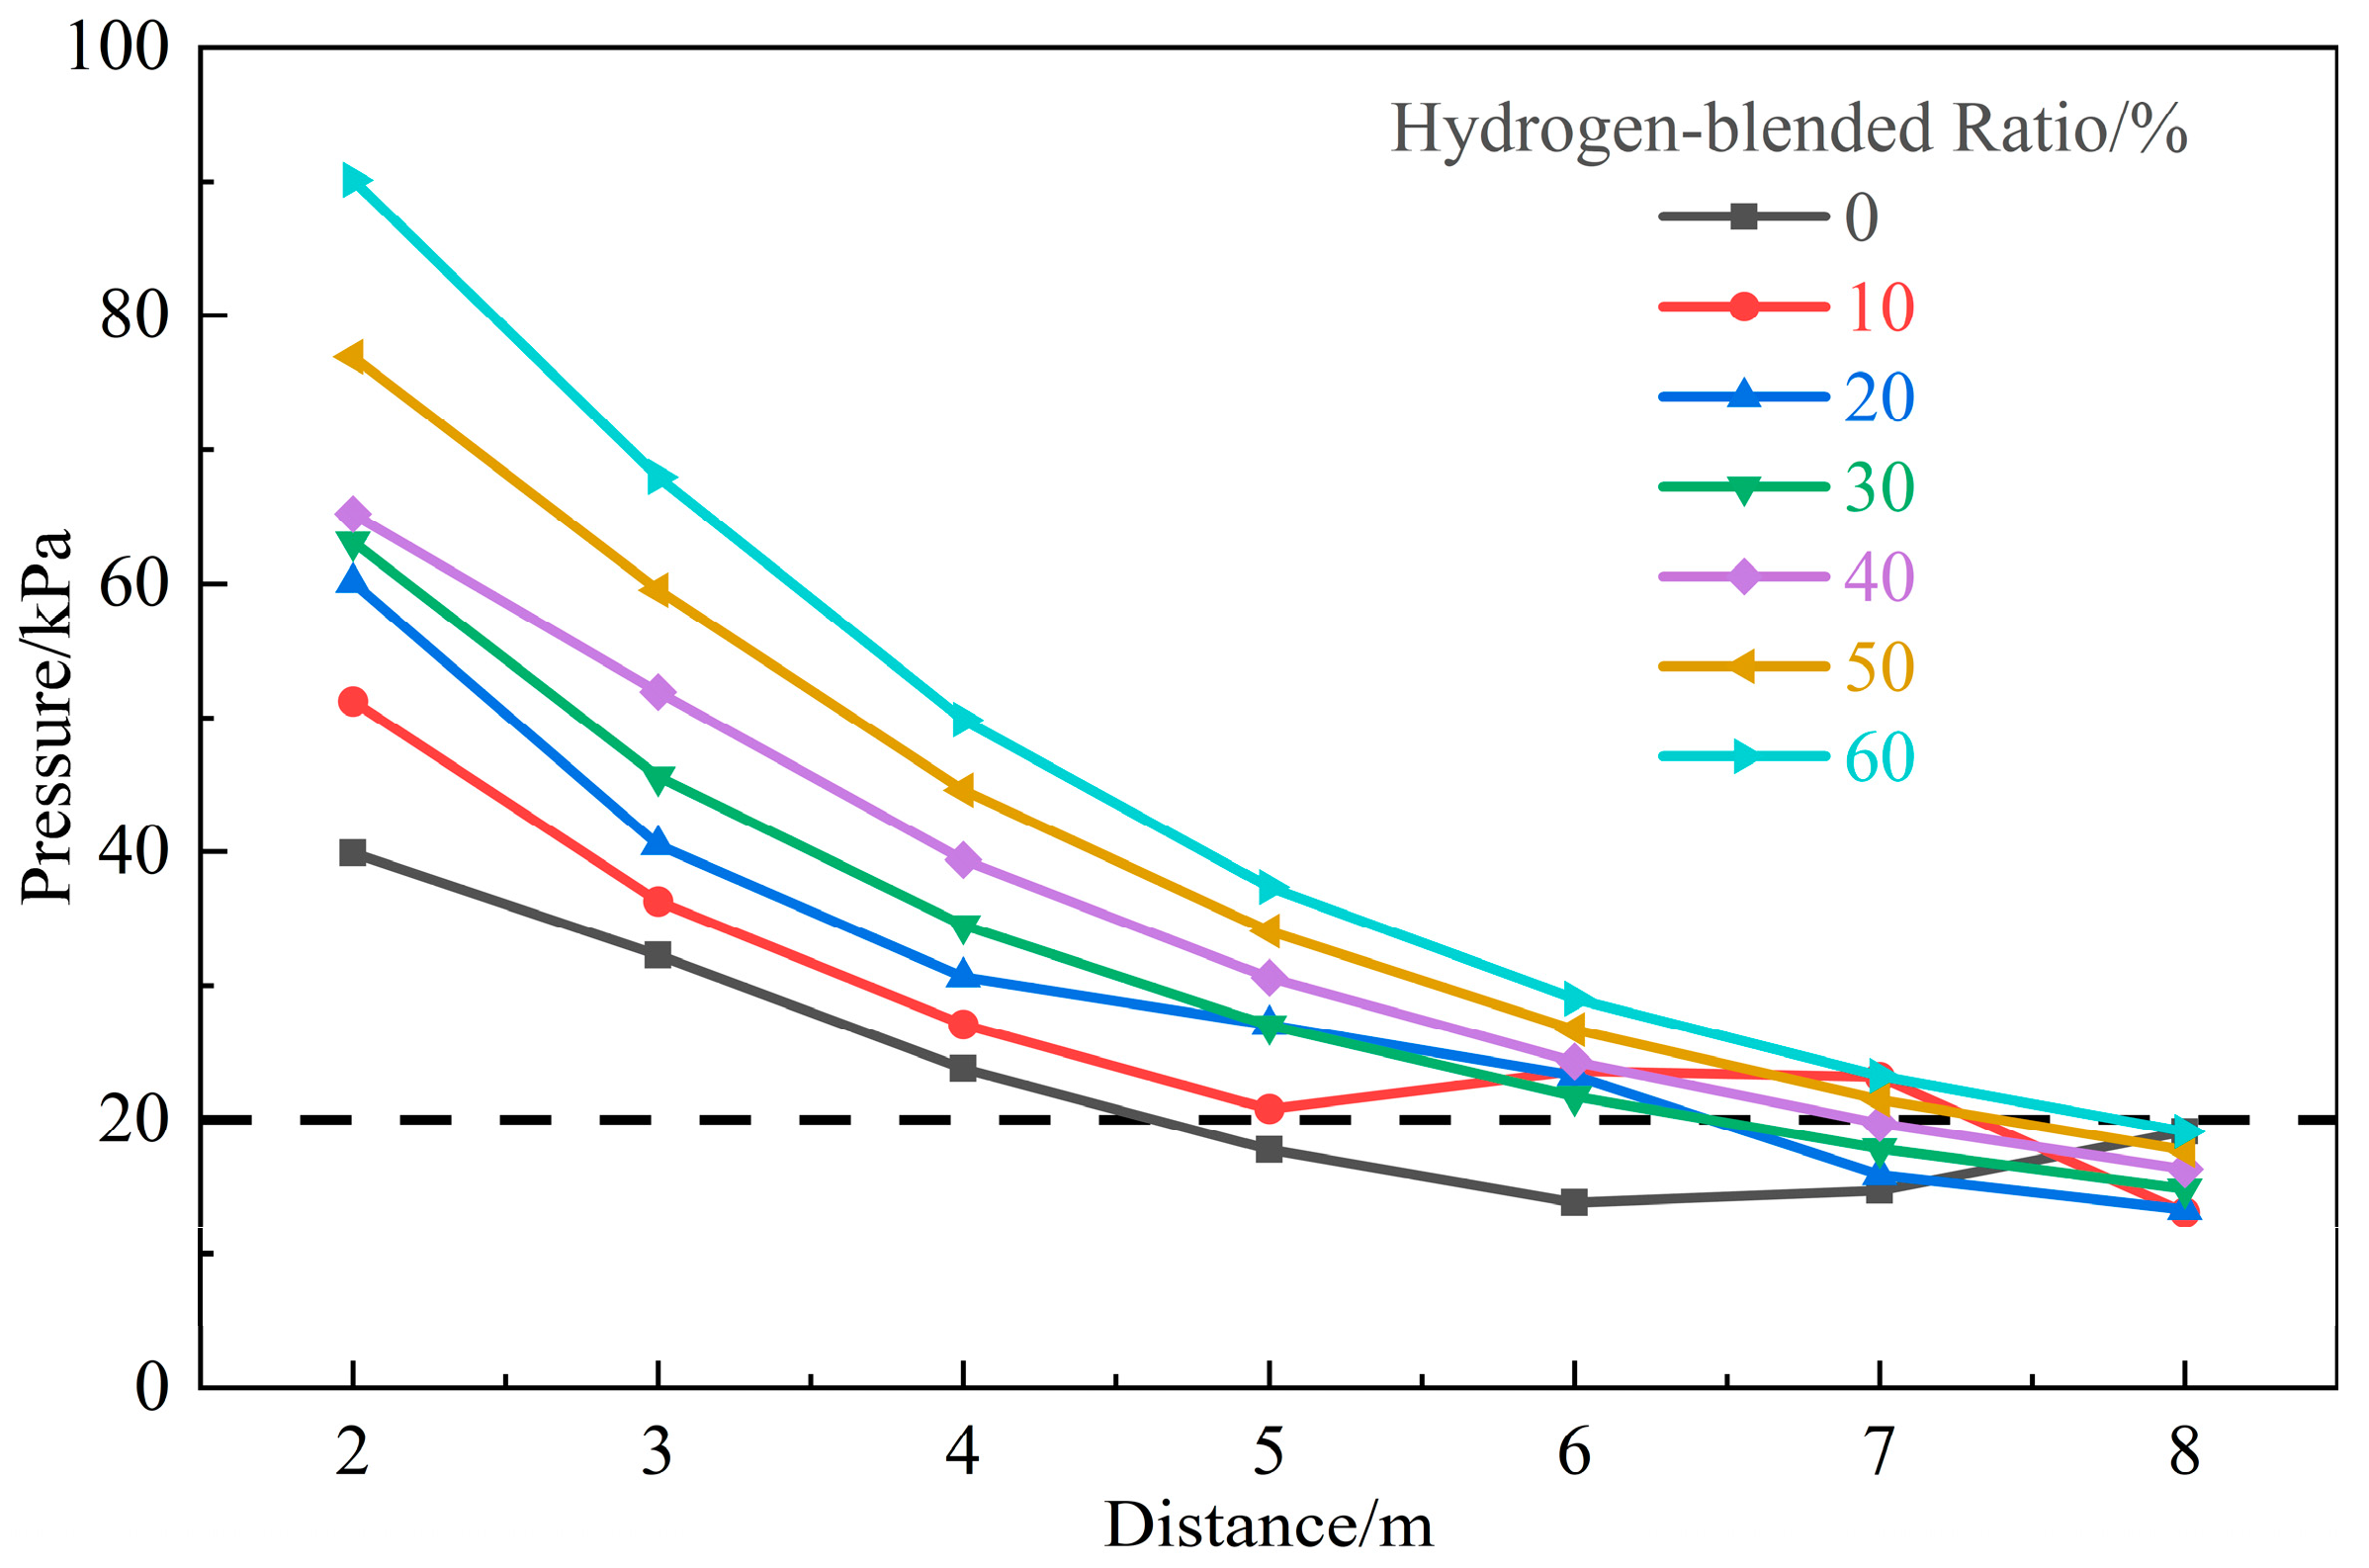
The external pressure curves shown in Figure 7 reveal that when the hydrogen-blended ratio reaches 30% or higher, the peak pressure increases significantly with the hydrogen-blended ratio, with the pressure drop following a “fast-then-slow” pattern. In contrast, when the hydrogen-blended ratio is 20% or lower, the pressure curve does not always decrease with distance; in some cases, it even increases. Notably, as the hydrogen-blended ratio rises, the distance at which the explosion can cause injury also increases, thereby raising the explosion’s hazard. Specifically, for hydrogen-blended ratios between 40% and 60%, the injury-causing distance ranges from 7 m to 8 m, while for ratios between 20% and 30%, it ranges from 6 m to 7 m. For pure methane, this distance is approximately 4.5 m.
In the external flame velocity curves shown in Figure 8, the flame propagation speed exhibits three distinct stages as it moves away from the opening: “steady high speed”, “rapid decline”, and “gradual decline”. In the first stage, the flame speed stabilizes at around 840 m/s, regardless of the hydrogen-blended ratio. For low hydrogen-blended ratios (below 20%), this stage extends up to 4 m, while for high hydrogen-blended ratios (above 30%), it only extends up to 2 m. As the distance increases, the flame speed rapidly decreases in the second stage, followed by a slower reduction in the third stage. Although the flame speed trends are similar for different hydrogen-blended ratios, the specific values and rates of decline vary.

3.1.4. Influence of Ignition Position

This section explores the influence of ignition position on the explosion characteristics of H-BNG, including internal and external pressure variations within the container and flame speed during far-field explosion propagation. The study uses a 20% H-BNG mixture with an opening size of 1.5 m × 1.2 m, with both the volume blockage ratio and venting pressure set to zero.
Different ignition positions significantly affect the deflagration characteristics of H-BNG within the container, as illustrated in Figure 9. When ignited at the front, the pressure peak occurs later (82.3 ms) and is the lowest (309.7 kPa). Central ignition produces the highest pressure peak (361.0 kPa), resulting in the most intense deflagration and the greatest risk. Rear ignition yields a slightly lower peak (327.7 kPa). Overpressure above 100 kPa can be fatal; the duration of overpressure above 100 kPa is shorter with front ignition, while it lasts approximately 41.2 ms for both central and rear ignitions. Due to its proximity to the opening, front ignition allows for some of the fuel to be expelled quickly, reducing the explosion’s hazard.
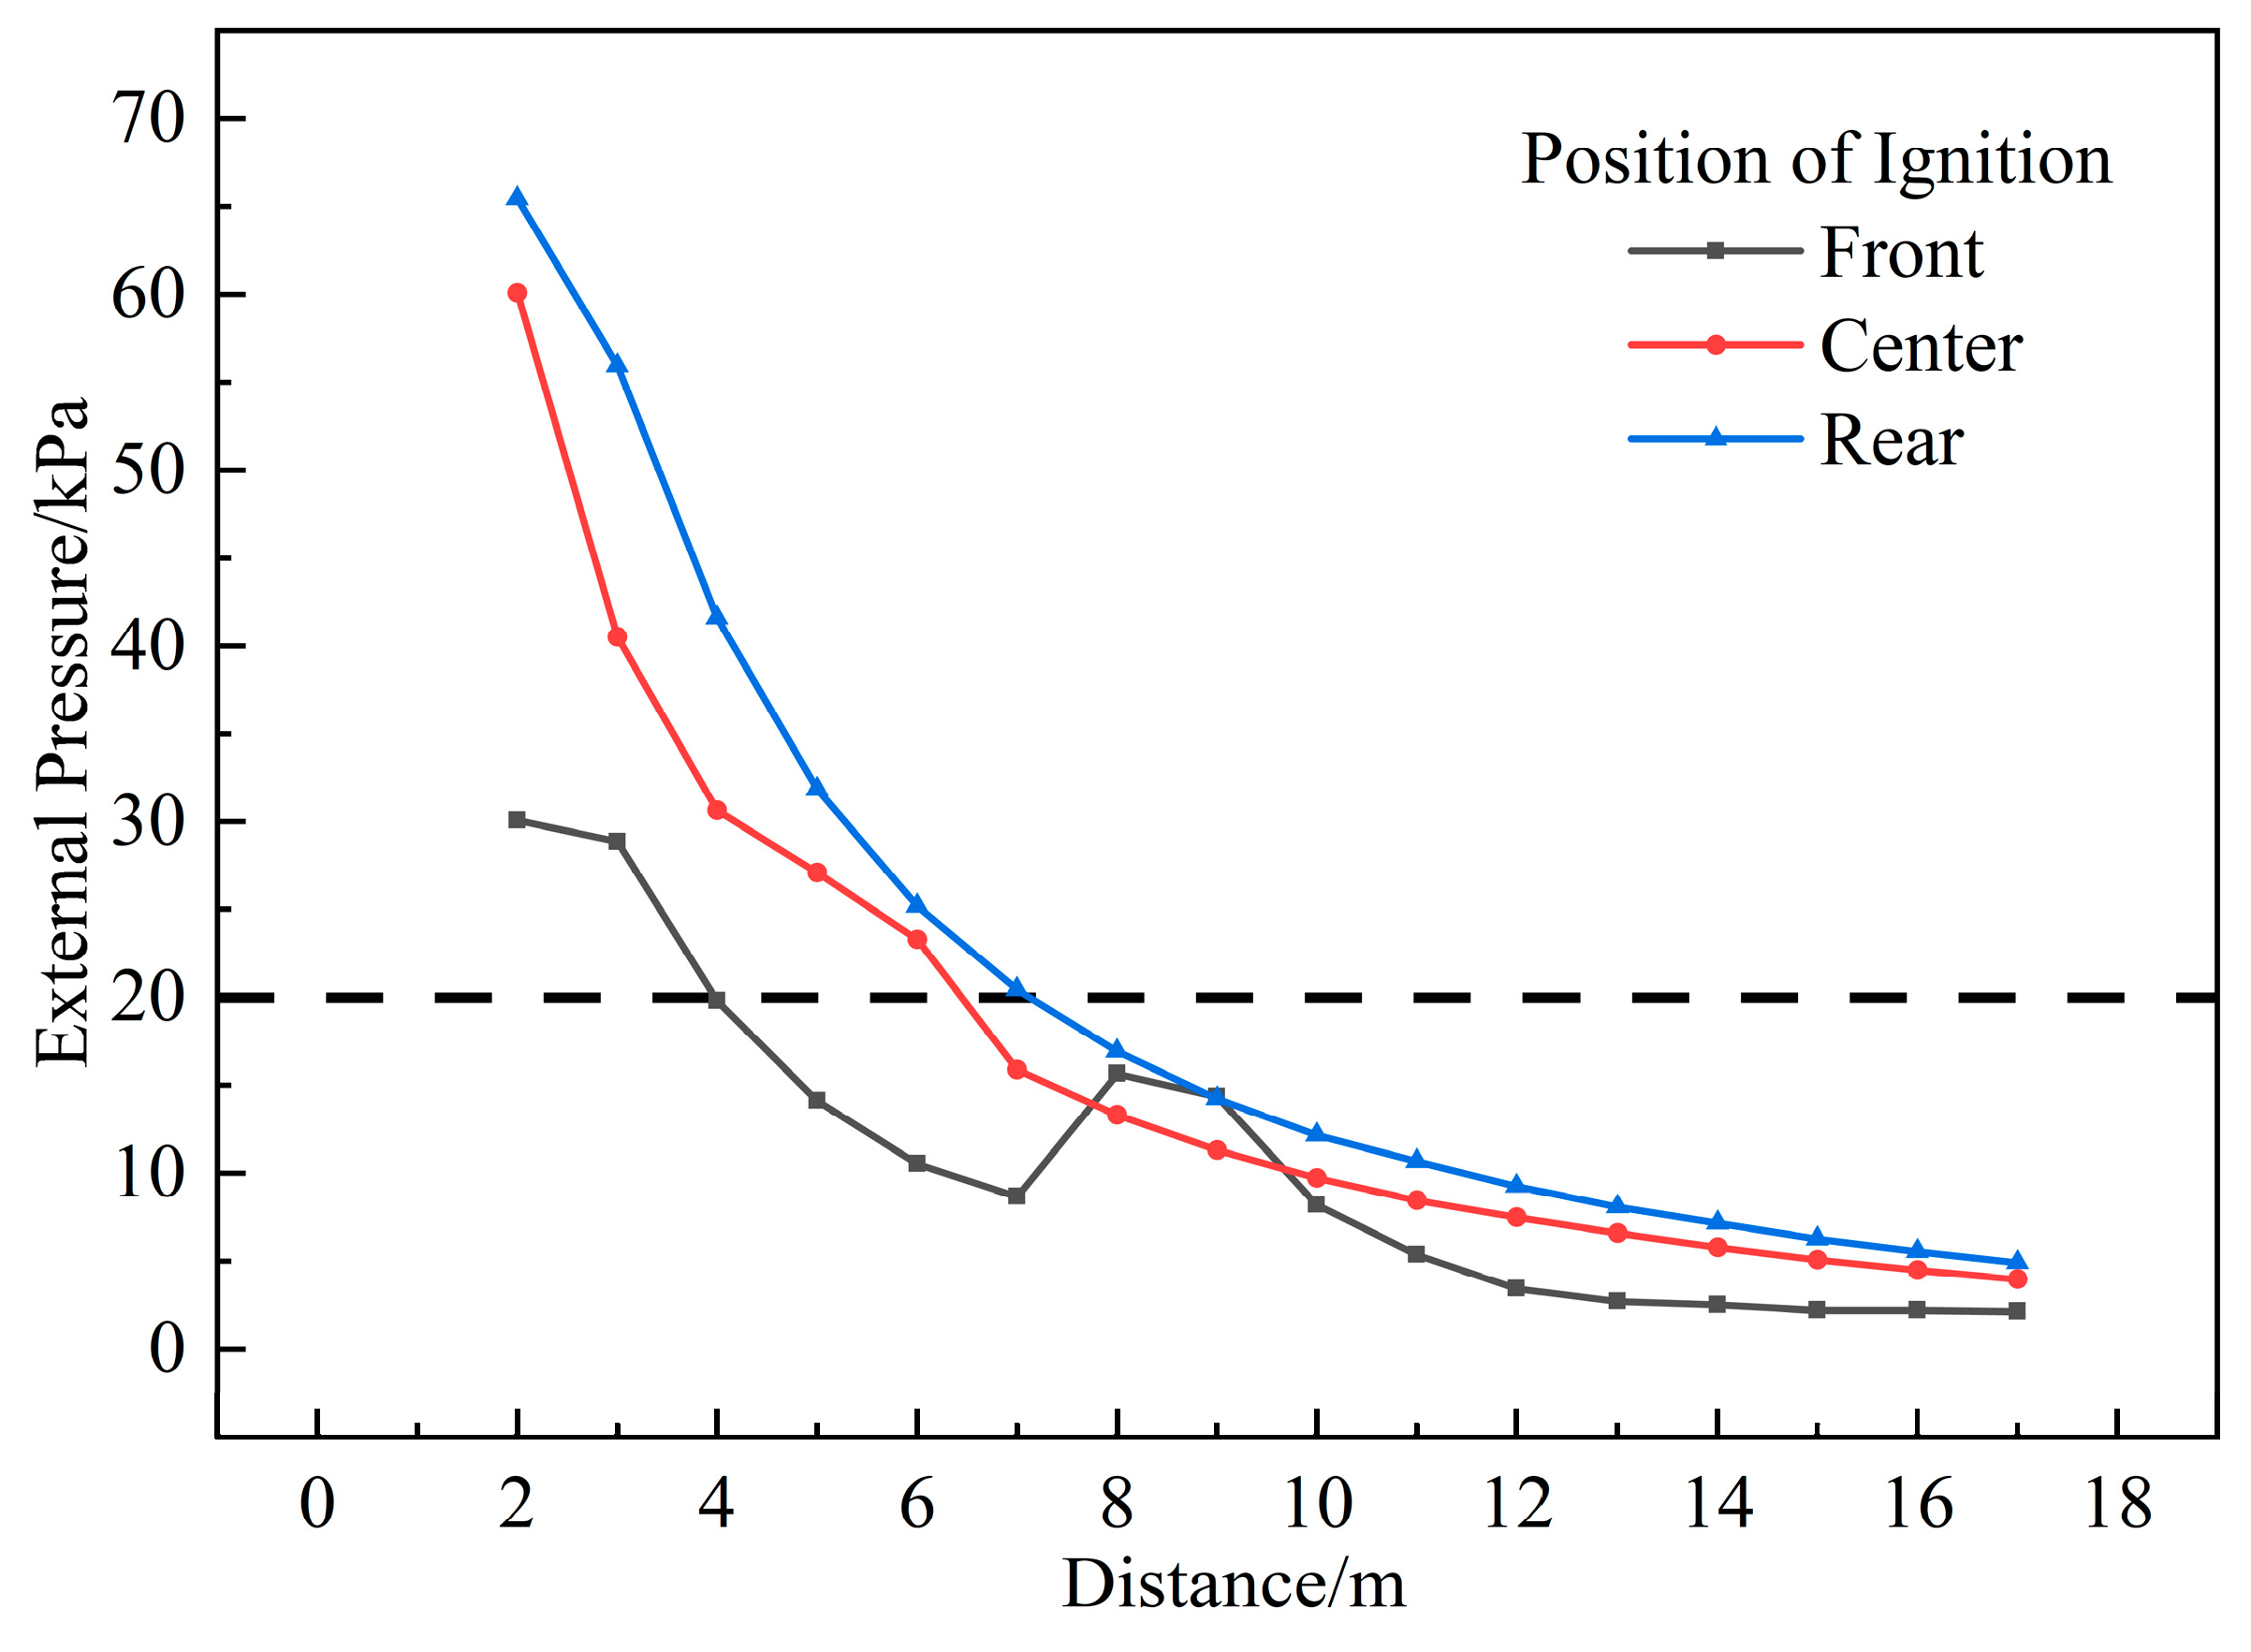
In the analysis of external pressure curves (Figure 10), front ignition results in a significant expulsion of fuel, leading to lower pressure peaks both inside and outside the container, with a peak of 30.1 kPa at 2 m. In contrast, rear ignition generates the highest external pressure peak, reaching 65.4 kPa at 2 m. Notably, front ignition shows a pressure rise at 8 m, likely due to unburned fuel mixing with air and reigniting. Regarding the human injury threshold (20 kPa), front ignition poses a risk within 4 m, while rear ignition extends the risk to 7 m. Although central ignition results in high internal pressure, rear ignition has a more significant impact during far-field propagation, with both ignition types posing similar injury risks at distances of 6–7 m. Rear ignition presents the highest far-field hazard, with the injury radius extending up to 7 m; front ignition, despite its initially lower impact, requires attention due to the pressure rise phenomenon.
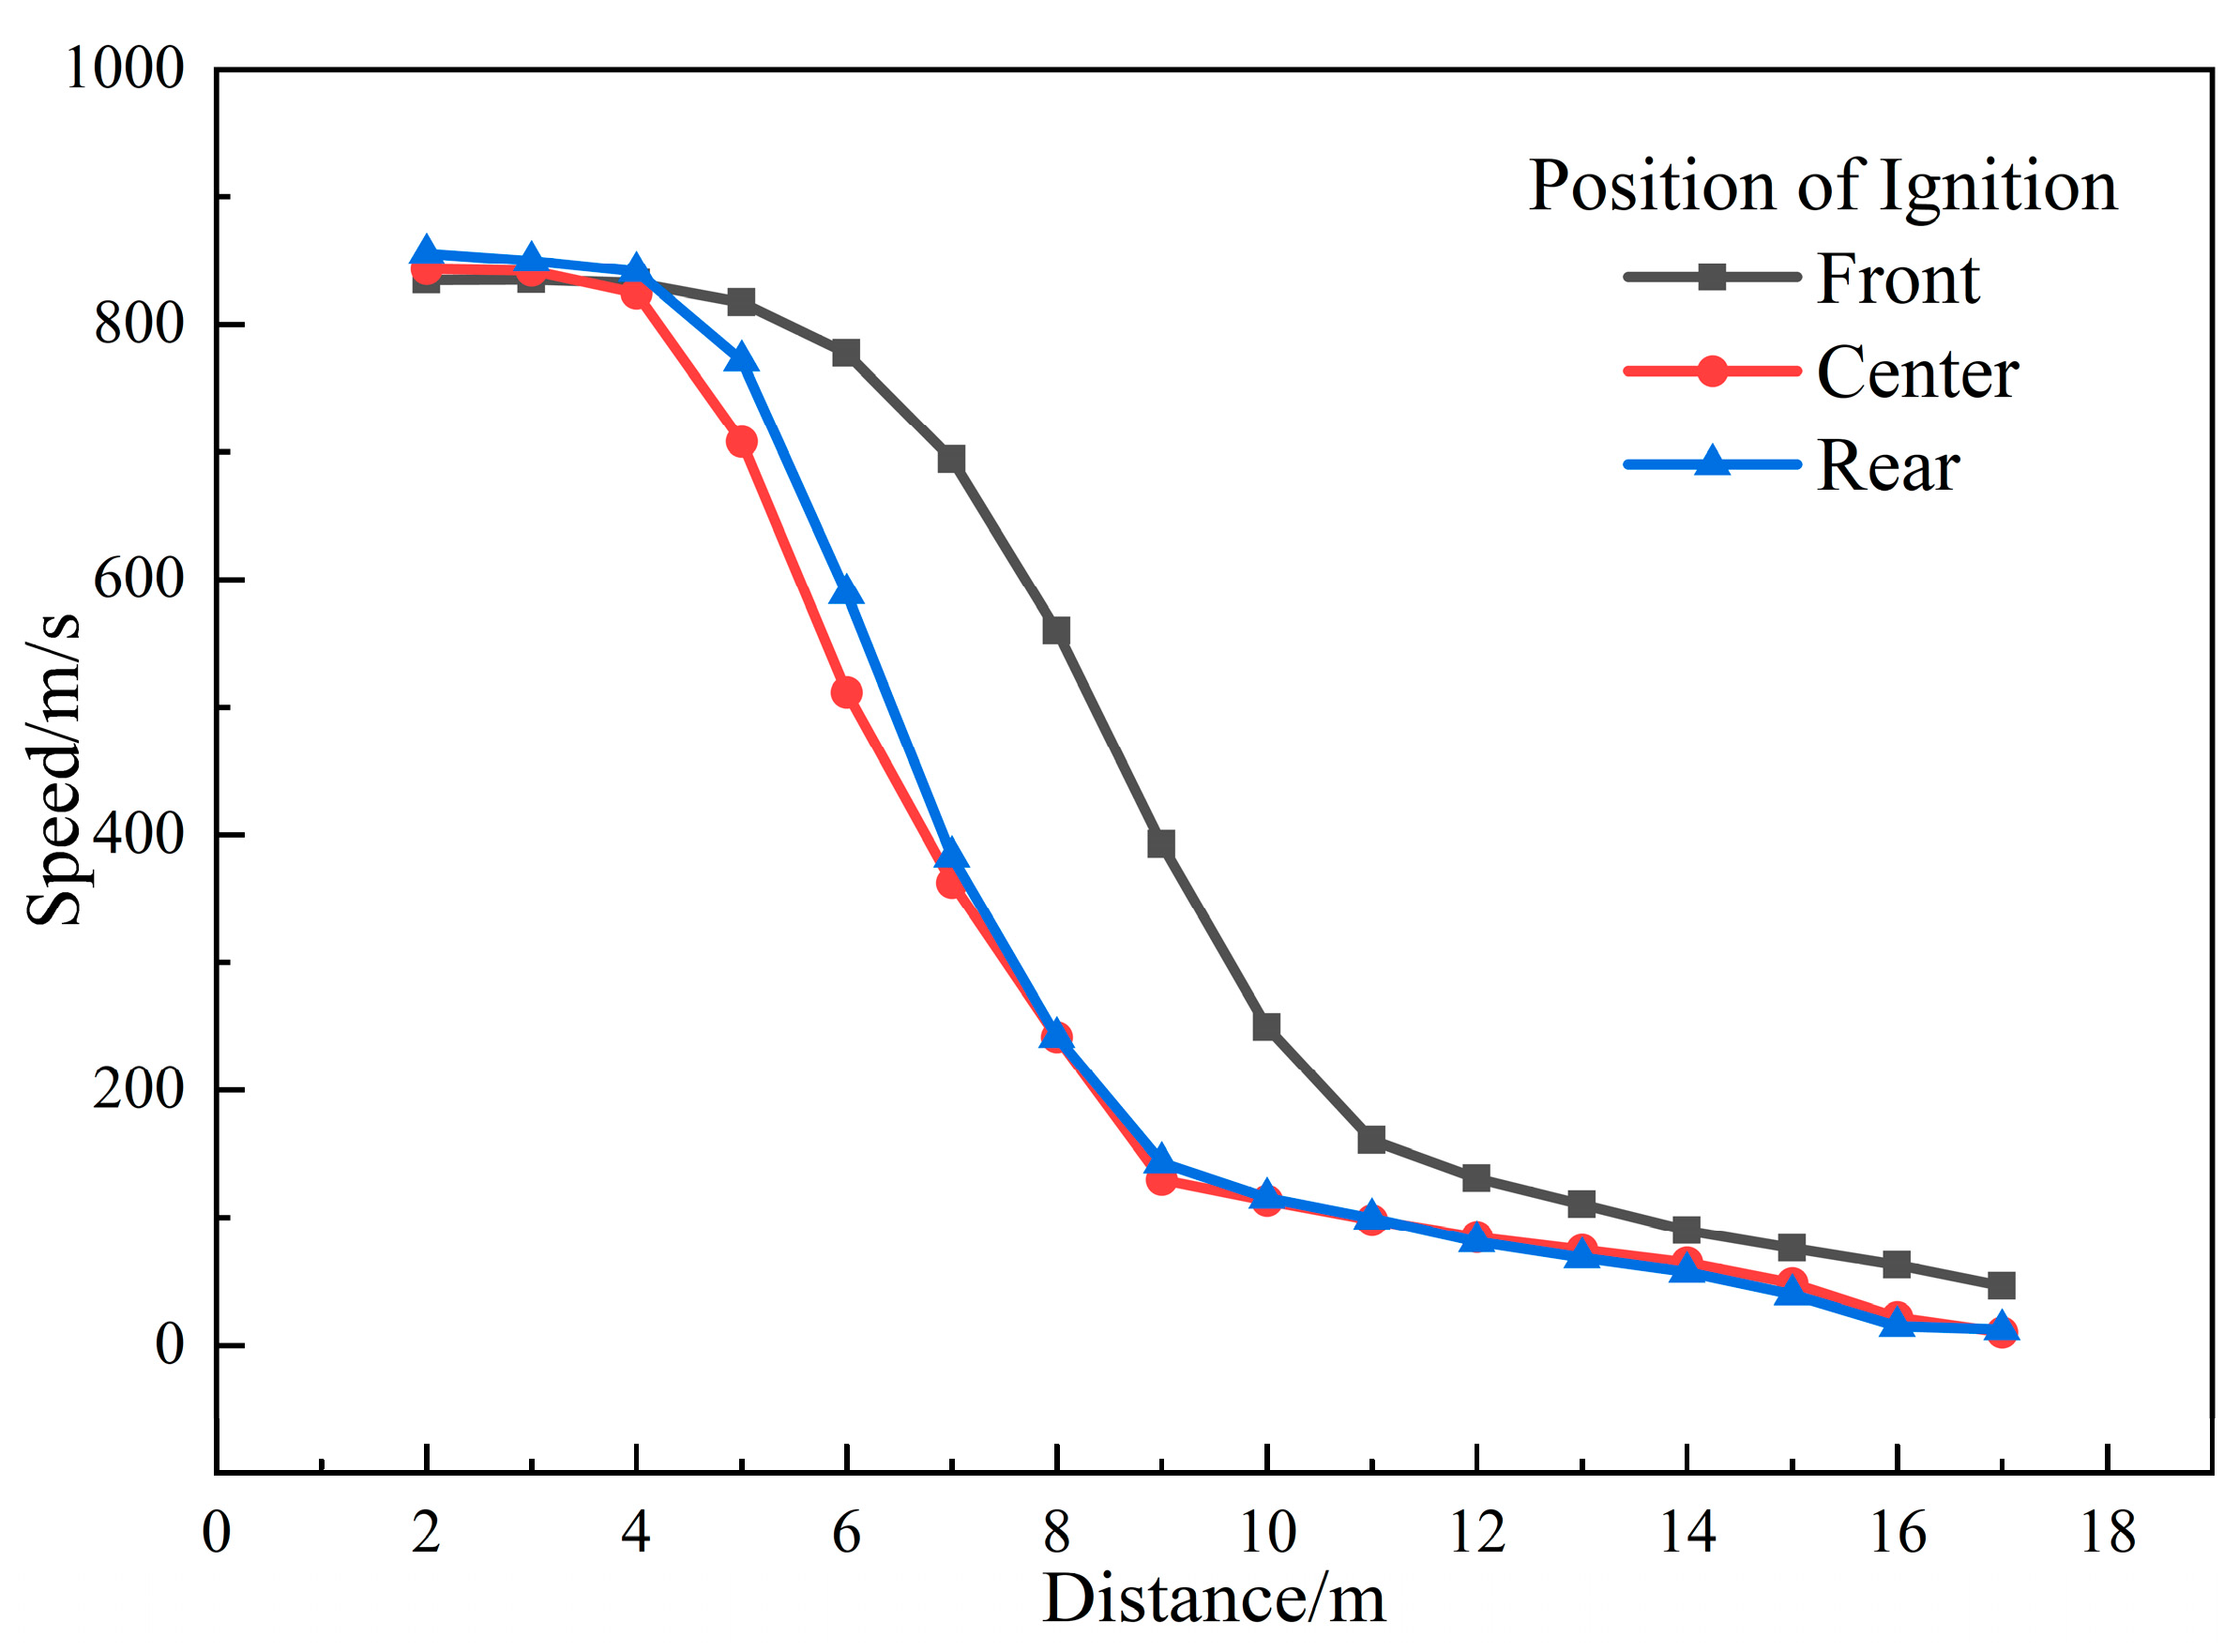
Figure 11 shows that in the analysis of internal pressure curves and flame velocity, front ignition is characterized by lower internal and external pressure peaks but an unusual flame propagation speed. In the external flame velocity curves, front ignition reaches 559.8 m/s at 8 m, significantly higher than the 241.7 m/s for central and rear ignitions. Especially within the first 4 m, the flame from front ignition propagates at a high speed of about 834 m/s before dropping sharply to 160.8 m/s and then gradually decreasing. The flame speed curves for central and rear ignitions are similar, with the flame initially propagating at high speed before gradually decreasing to 136 m/s. Although front ignition results in lower internal and external pressure peaks, its far-field flame propagation speed is the highest, indicating a potential hazard that should not be overlooked from the perspective of flame propagation.

3.1.5. Influence of Opening Size

This section examines the internal and external pressure and flame velocity during the explosion of 20% H-BNG under different opening sizes. The opening width is fixed at 1.2 m, with lengths of 2 m, 1.5 m, 1 m, and 0.5 m, using central ignition and no volume blockage or venting pressure.
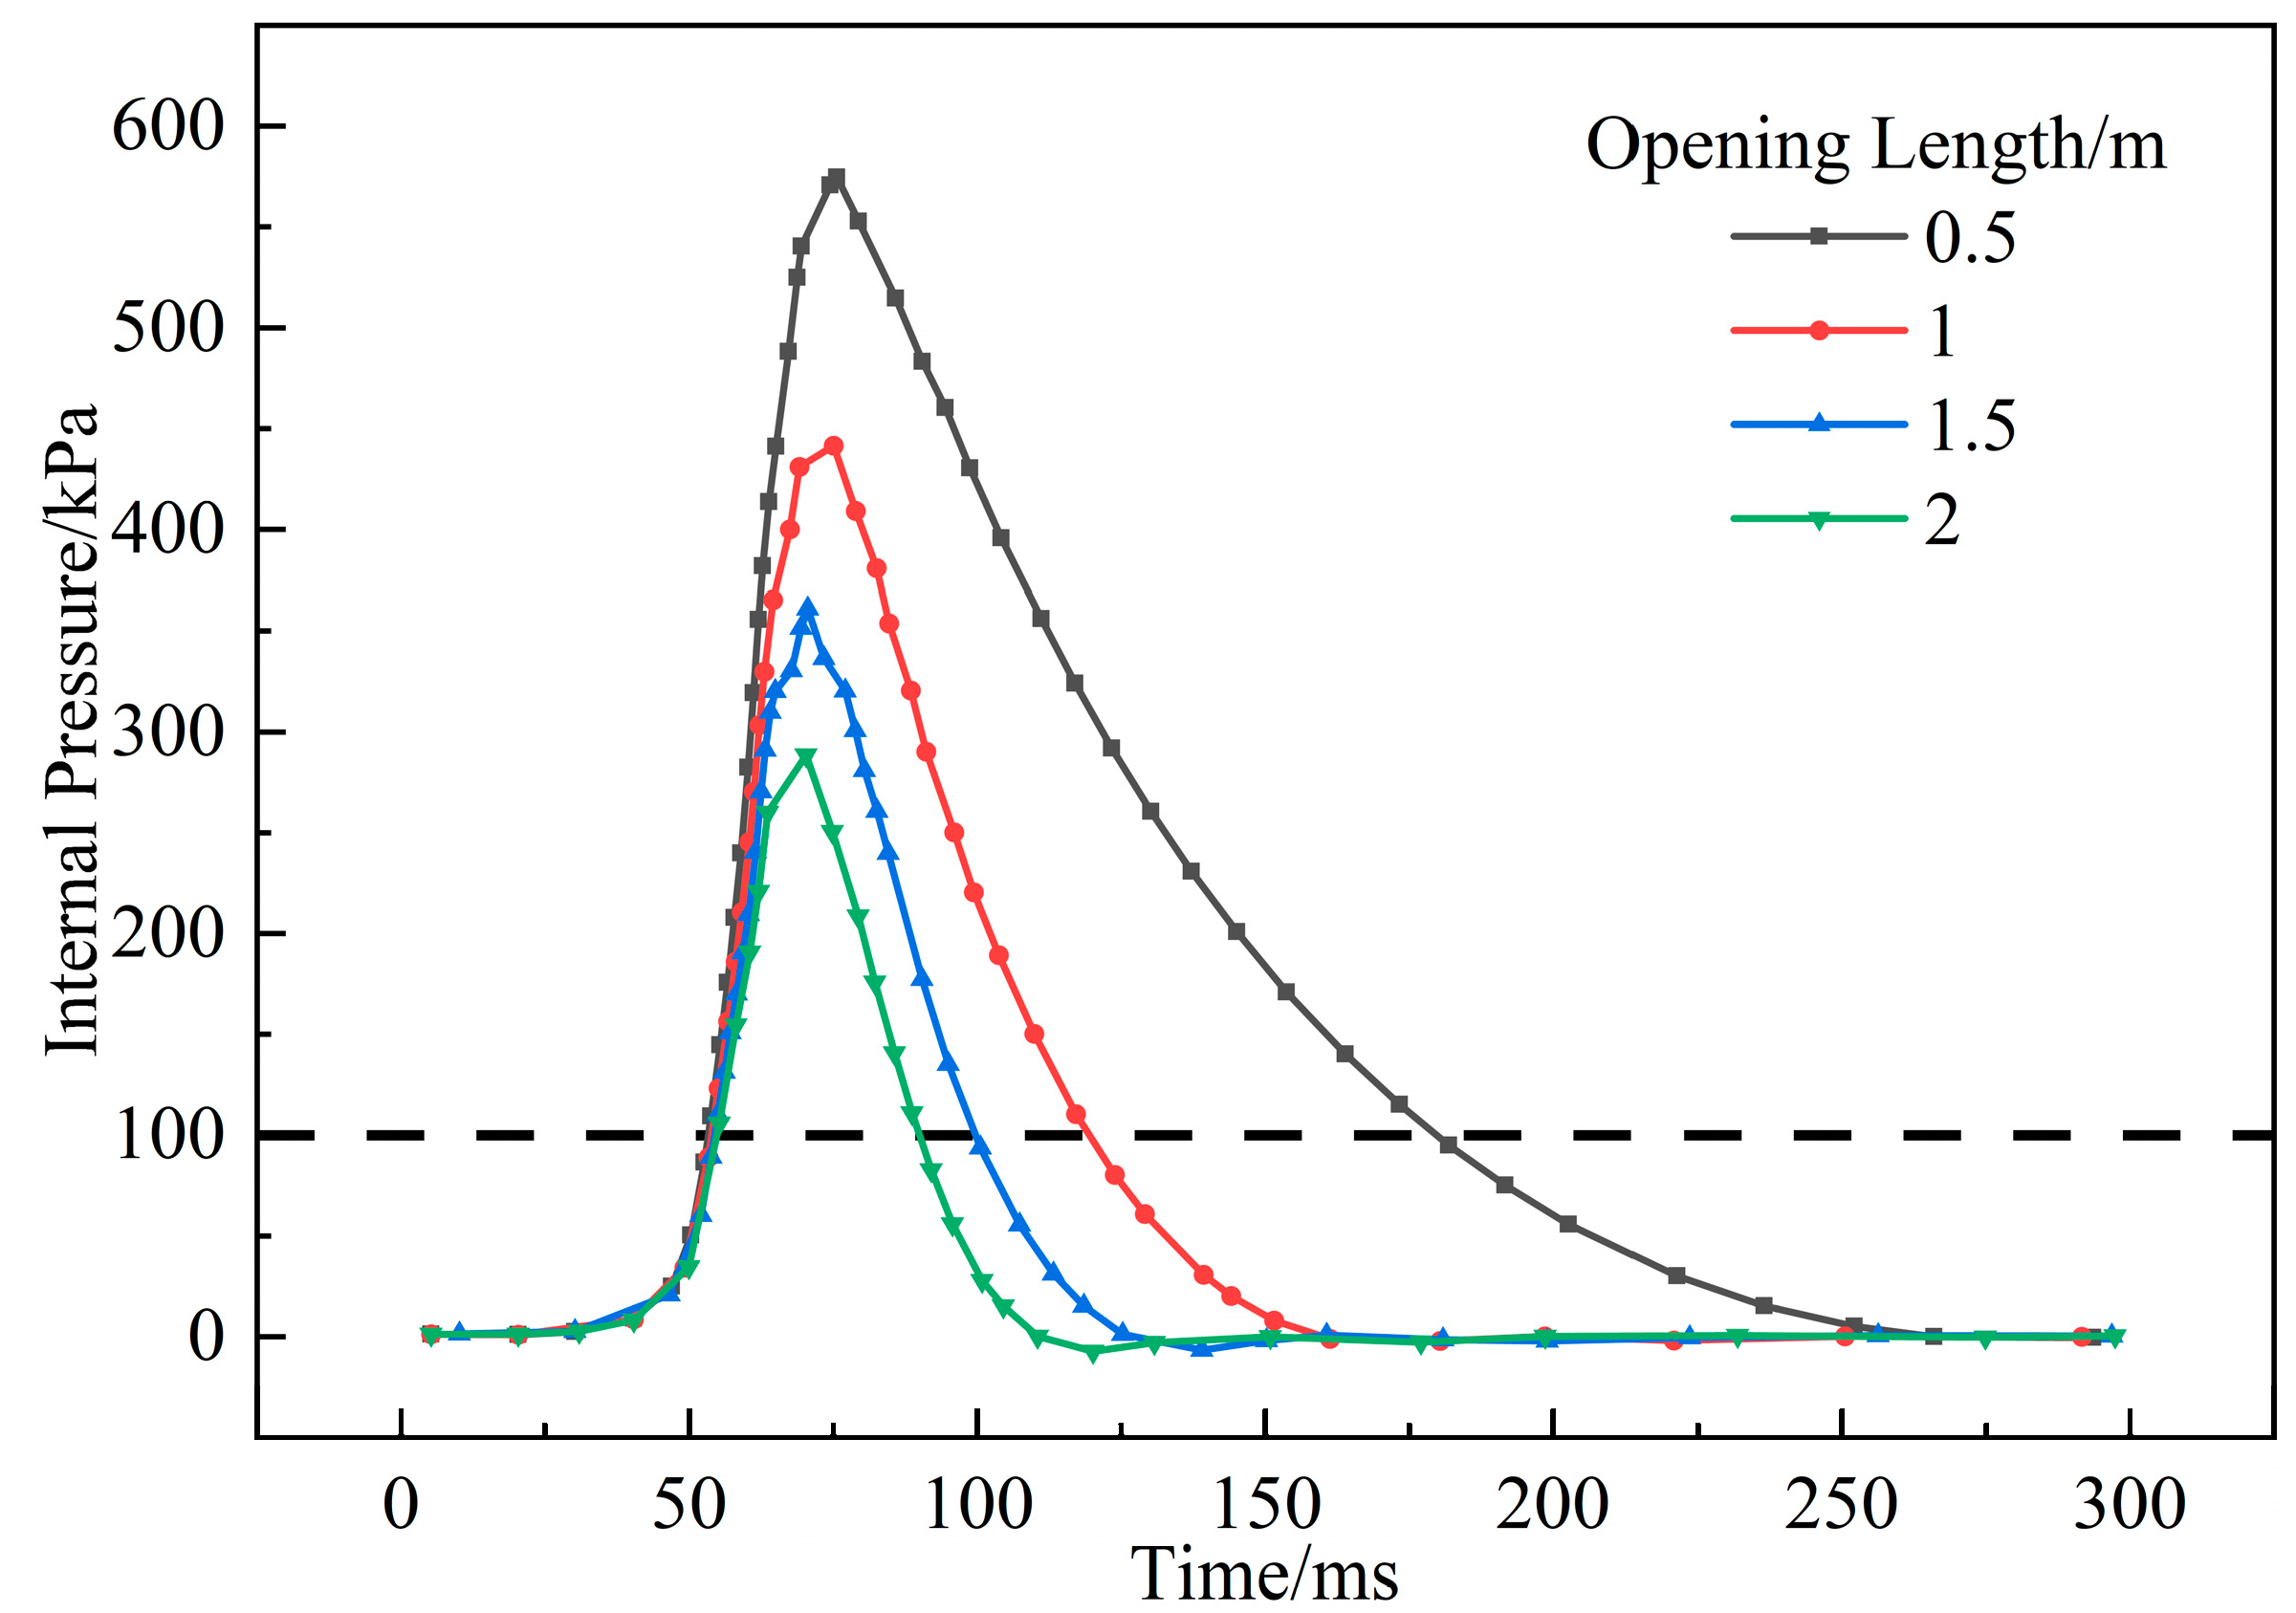
The internal pressure variation within the container is significantly affected by different opening sizes, as shown in Figure 12. As the opening size decreases, the space becomes increasingly confined, enhancing turbulence and compressibility during the explosion, leading to a gradual increase in peak internal pressure. The peak pressure reaches 570.7 kPa with a 0.5 m opening, significantly higher than the 288.5 kPa with a 2 m opening. While the opening size has little impact on the time to peak pressure, it significantly affects the duration of overpressure. The smaller the opening, the longer the duration of overpressure (≥100 kPa), with the 0.5 m opening lasting 127 ms compared to 33 ms for the 2 m opening. In confined spaces, as the opening size reduces (transitioning towards a sealed environment), both the peak internal pressure and the duration of lethal overpressure increase significantly, thereby substantially raising the risk of an incident.
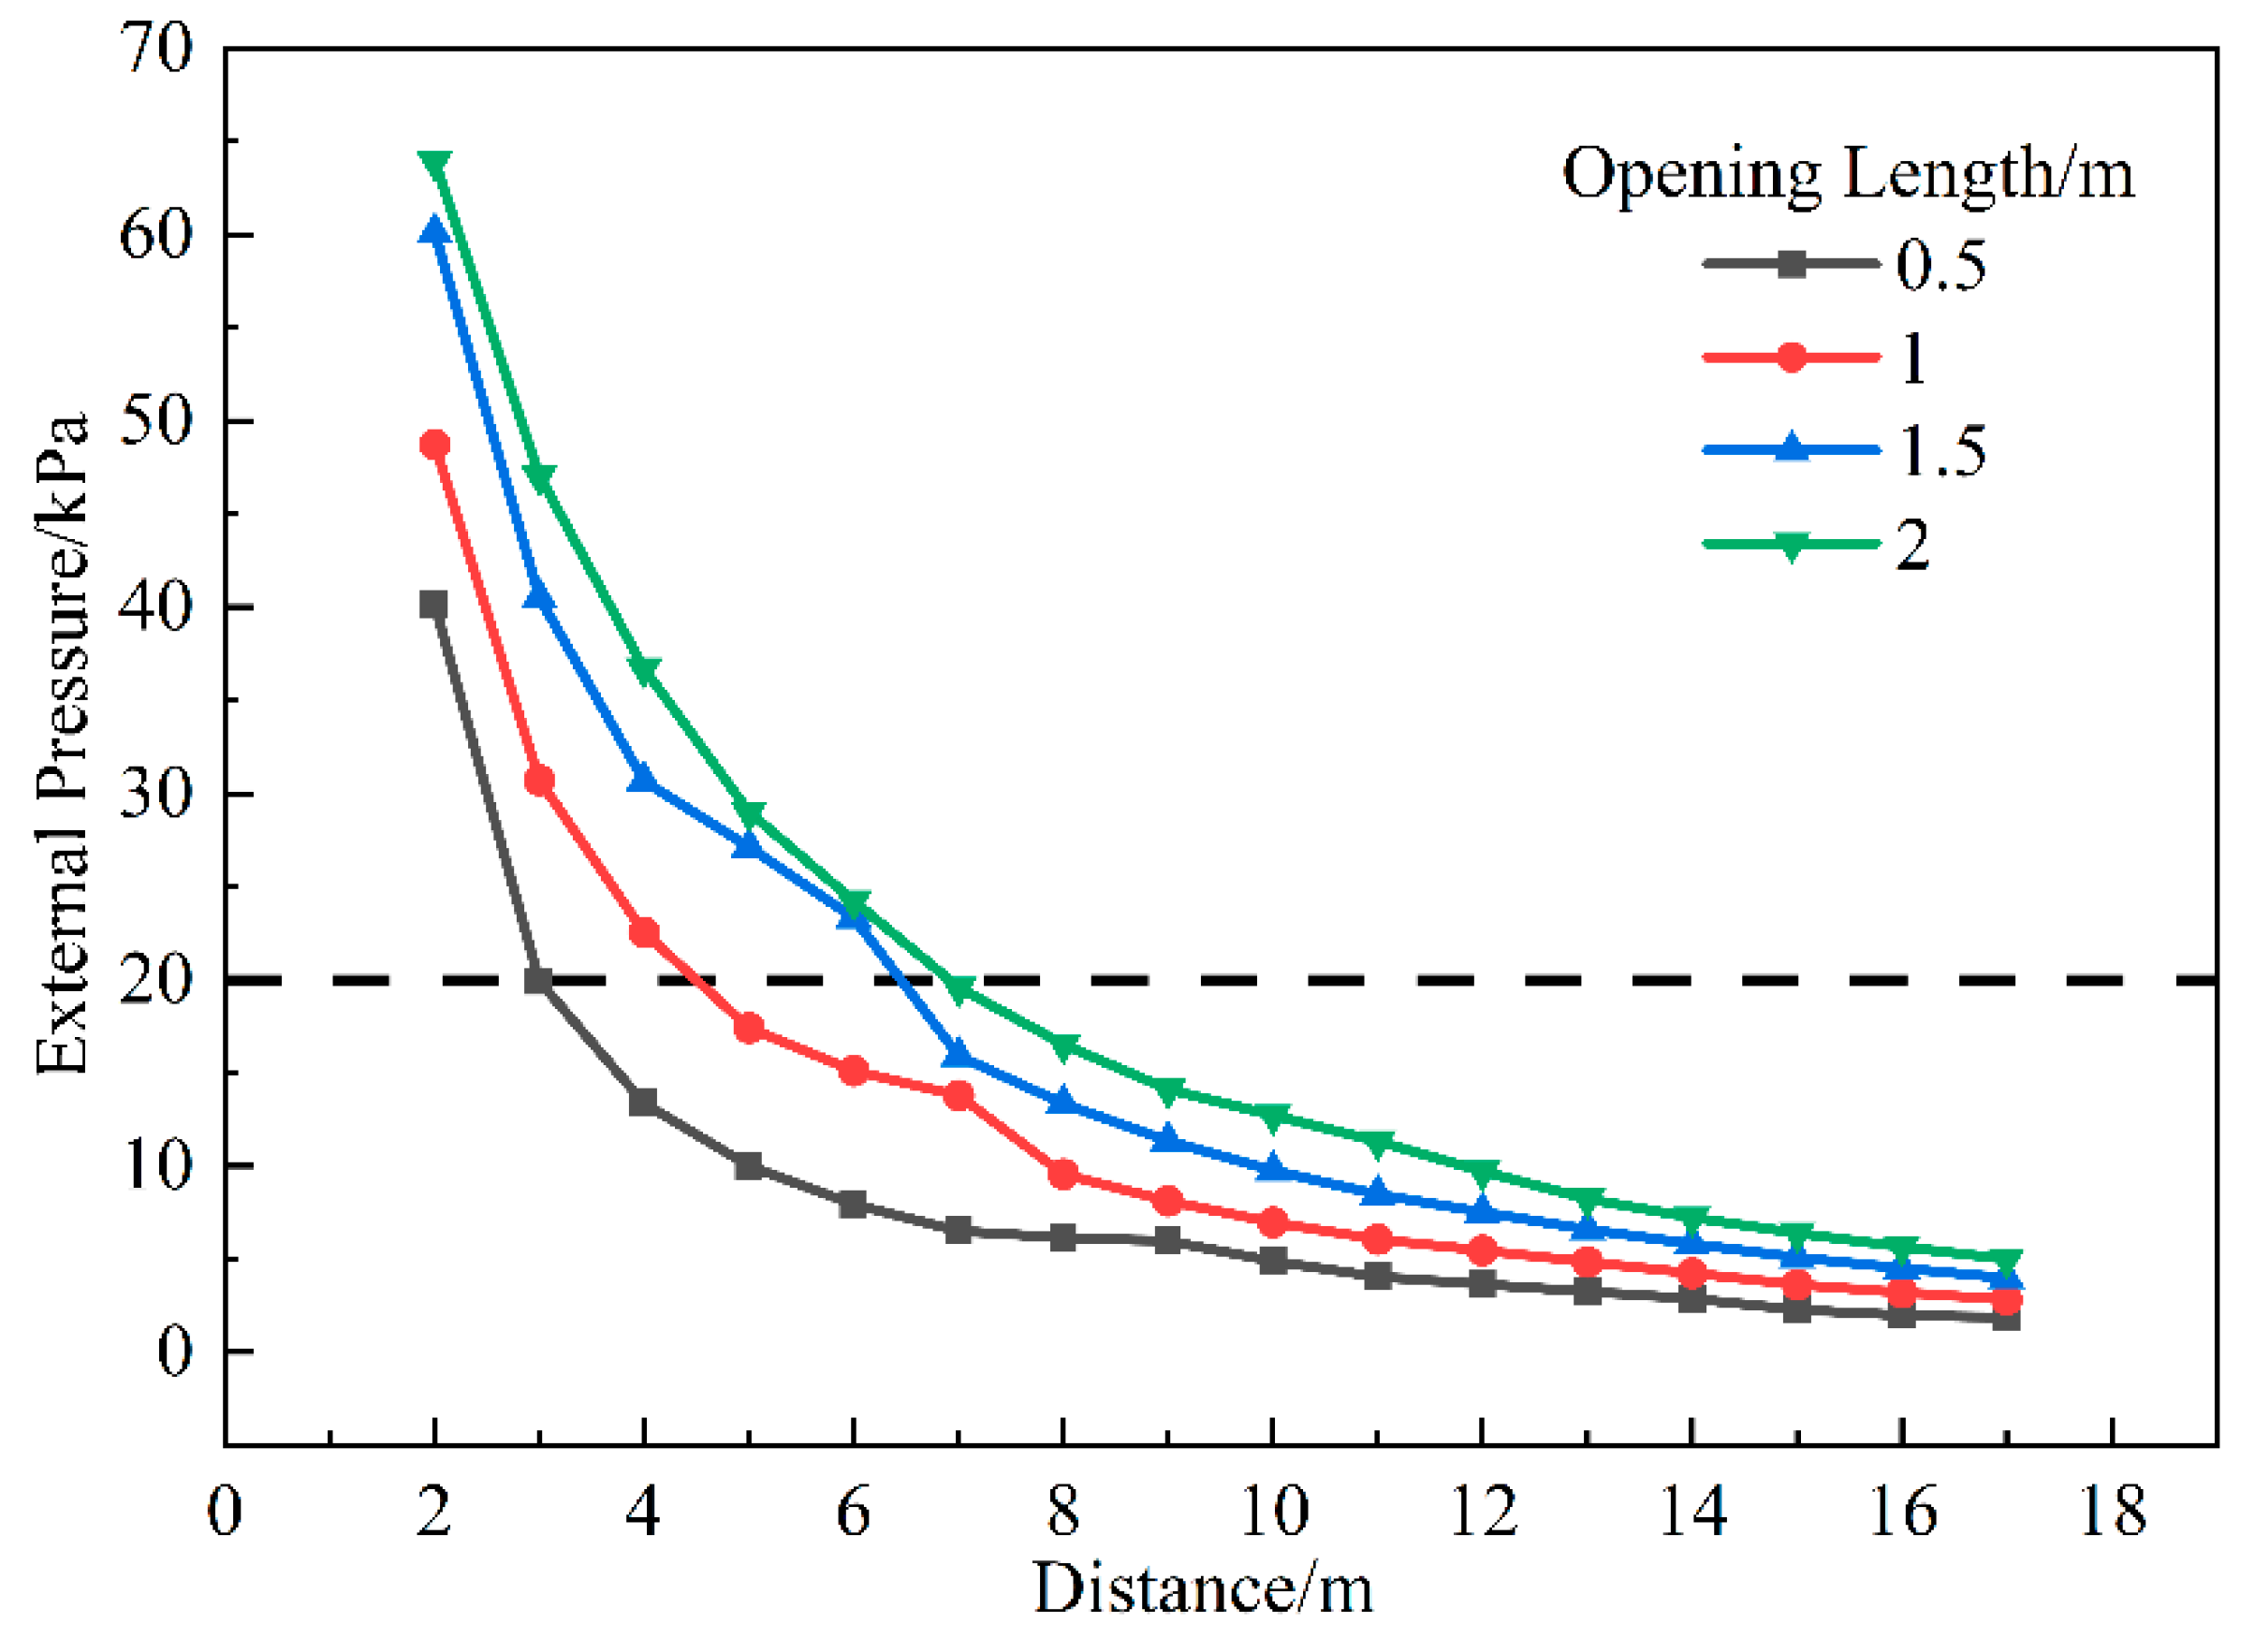
As shown in Figure 13, as the opening size decreases, the internal space of the container becomes more confined, leading to a gradual increase in the peak internal pressure during the explosion of H-BNG. Conversely, the peak external pressure decreases as the opening size reduces. Specifically, at a distance of 4 m, the peak external pressure with a 0.5 m opening is 13.4 kPa, while the 2 m opening reaches 36.7 kPa. The injury-causing distance (overpressure ≥20 kPa) for the 2 m opening is about 7 m, while it reduces to 3 m for the 0.5 m opening.
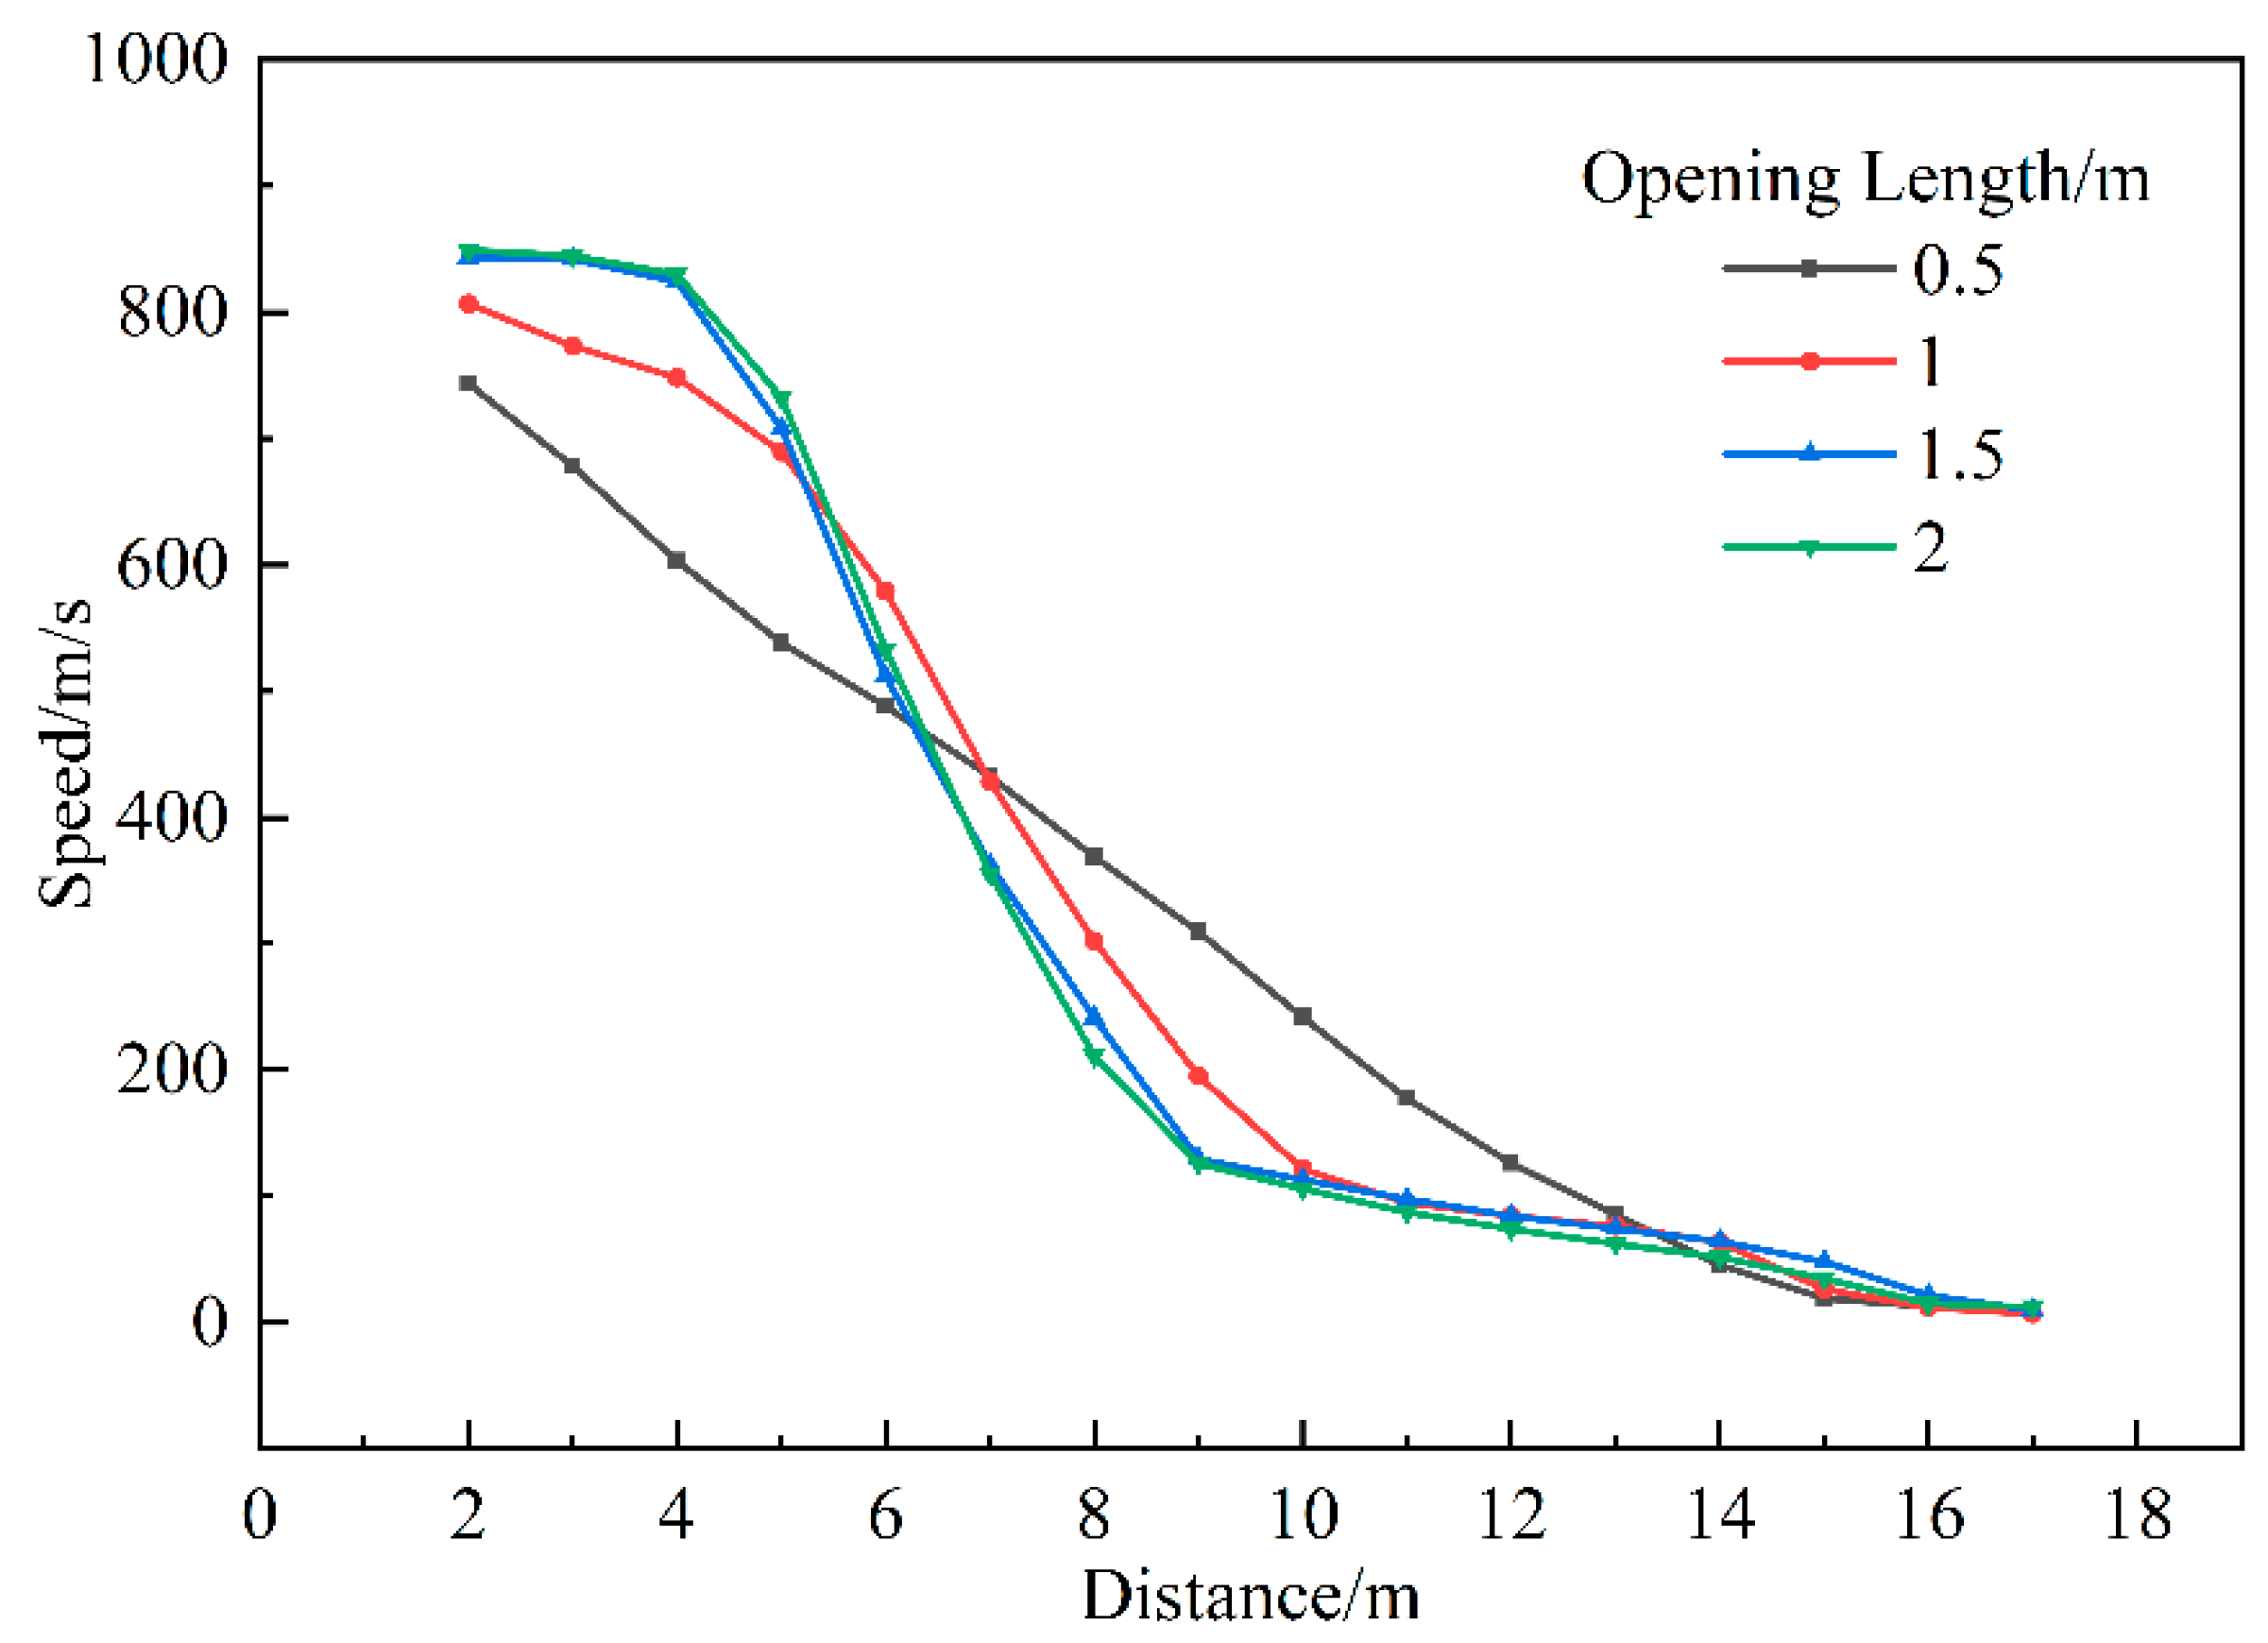
Figure 14 shows that external flame velocity is significantly affected by the opening size: for openings of 1.5 m or larger, the flame propagates rapidly (approximately 840 m/s) within 4 m then sharply decreases to 126.4 m/s between 4 and 9 m. However, when the opening is smaller than 1.5 m, the flame skips the high-speed phase and decreases rapidly over a longer distance; for instance, with a 0.5 m opening, the flame speed drops from 743.5 m/s to 19.6 m/s within 15 m, with the rate of decrease slowing as the opening size reduces.

3.1.6. Influence of Volume Blockage Ratio

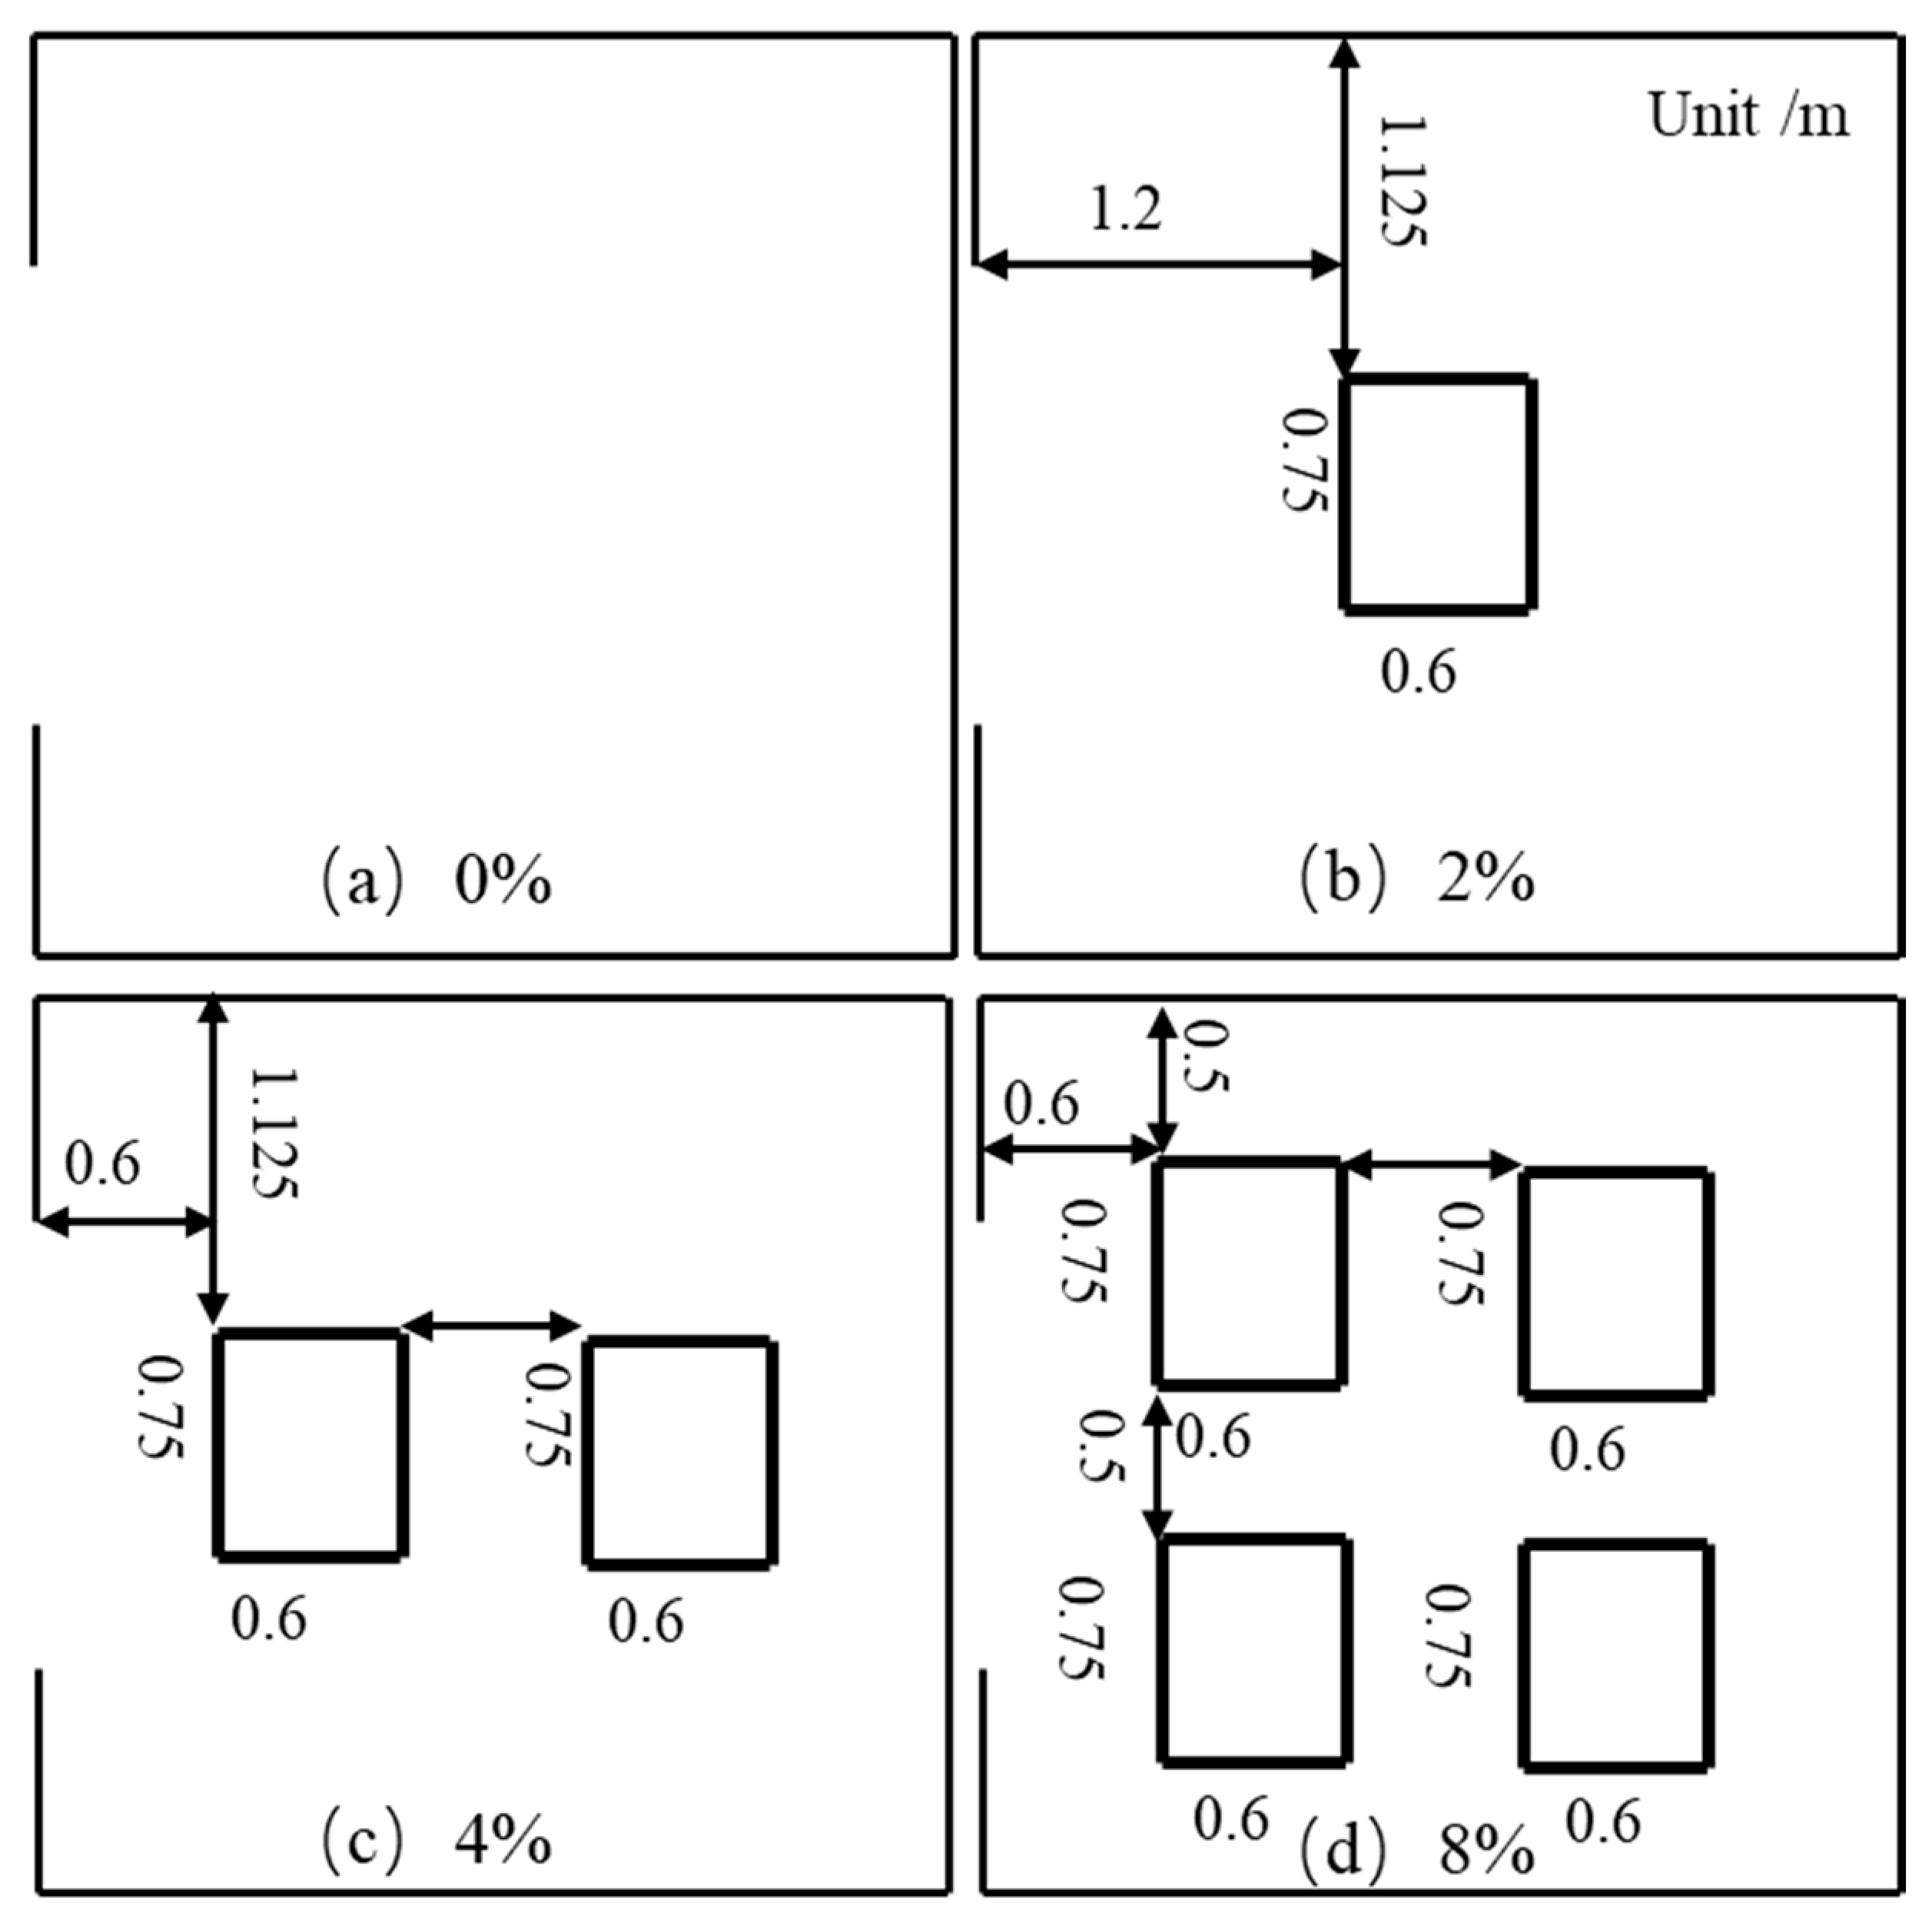
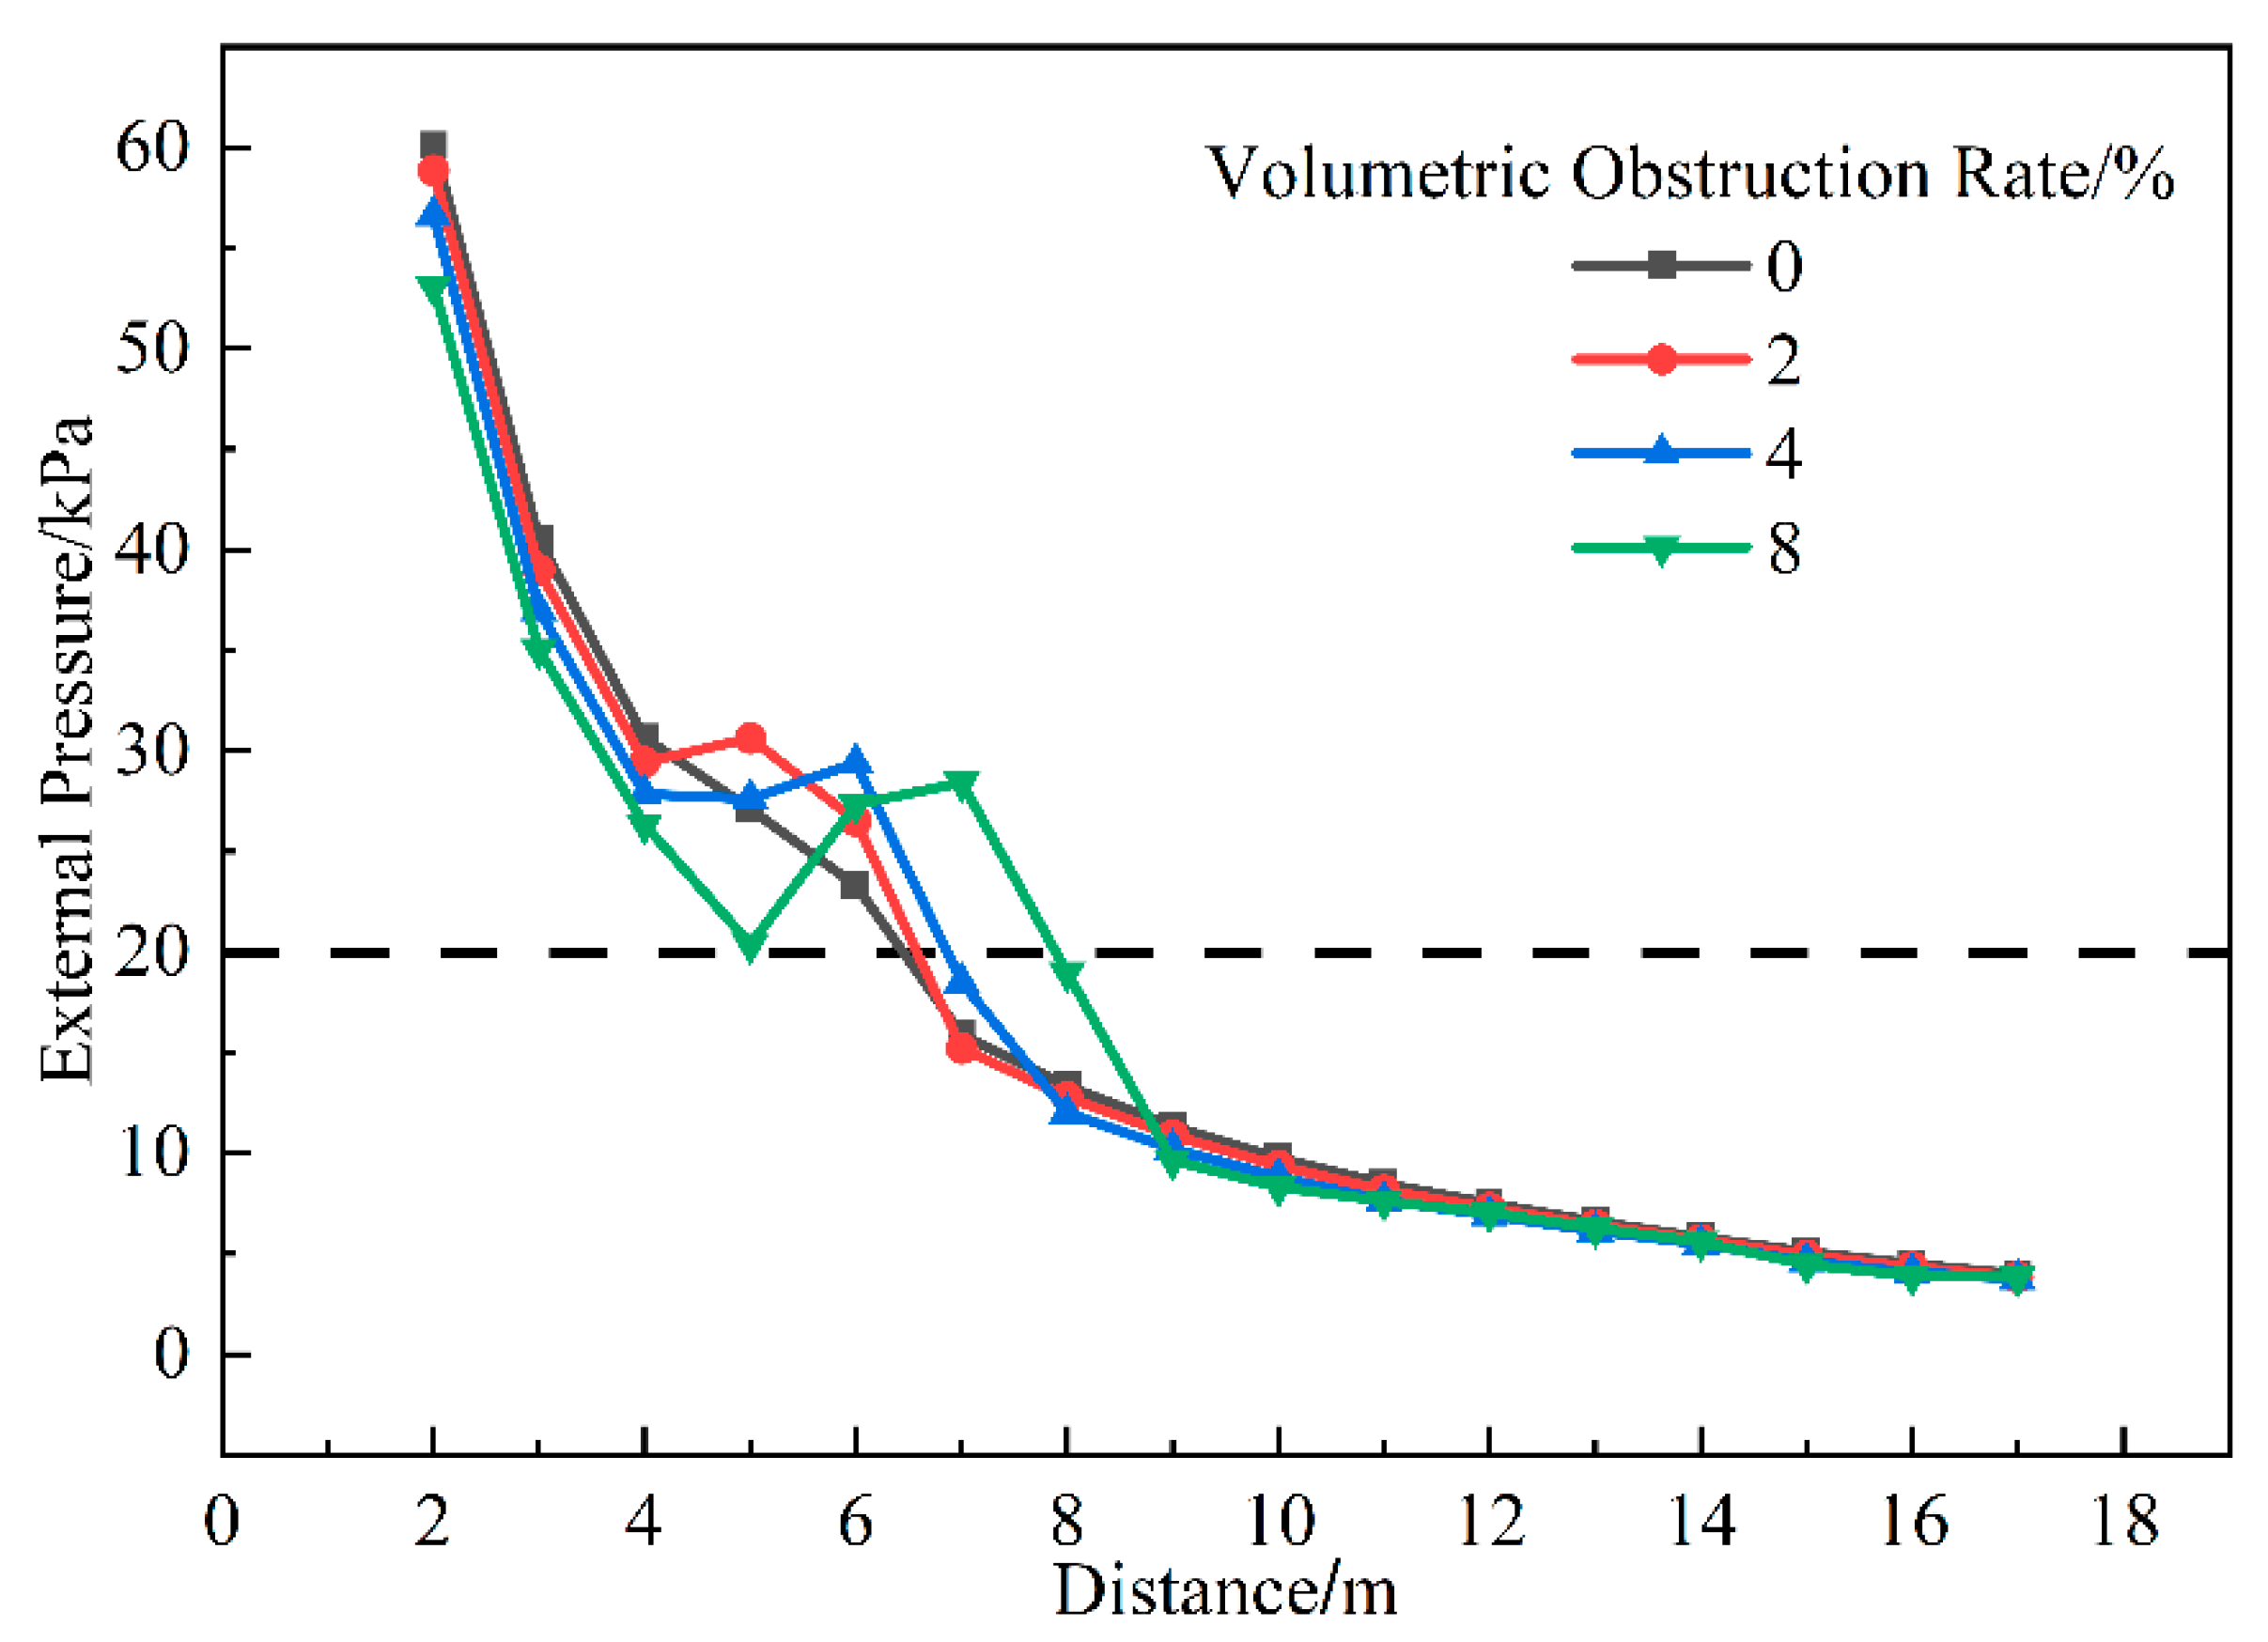
This section focuses on the effect of different volume blockage ratios on internal pressure during the explosion of H-BNG in confined spaces, as well as flame propagation speed and pressure during far-field explosions. Four different volume blockage ratios are considered: 0%, 2%, 4%, and 8%, using a 20% hydrogen-blended premixed gas. The ignition is centrally located, with an opening size of 1.5 m × 1.2 m, and the venting pressure is set to zero (Figure 15).
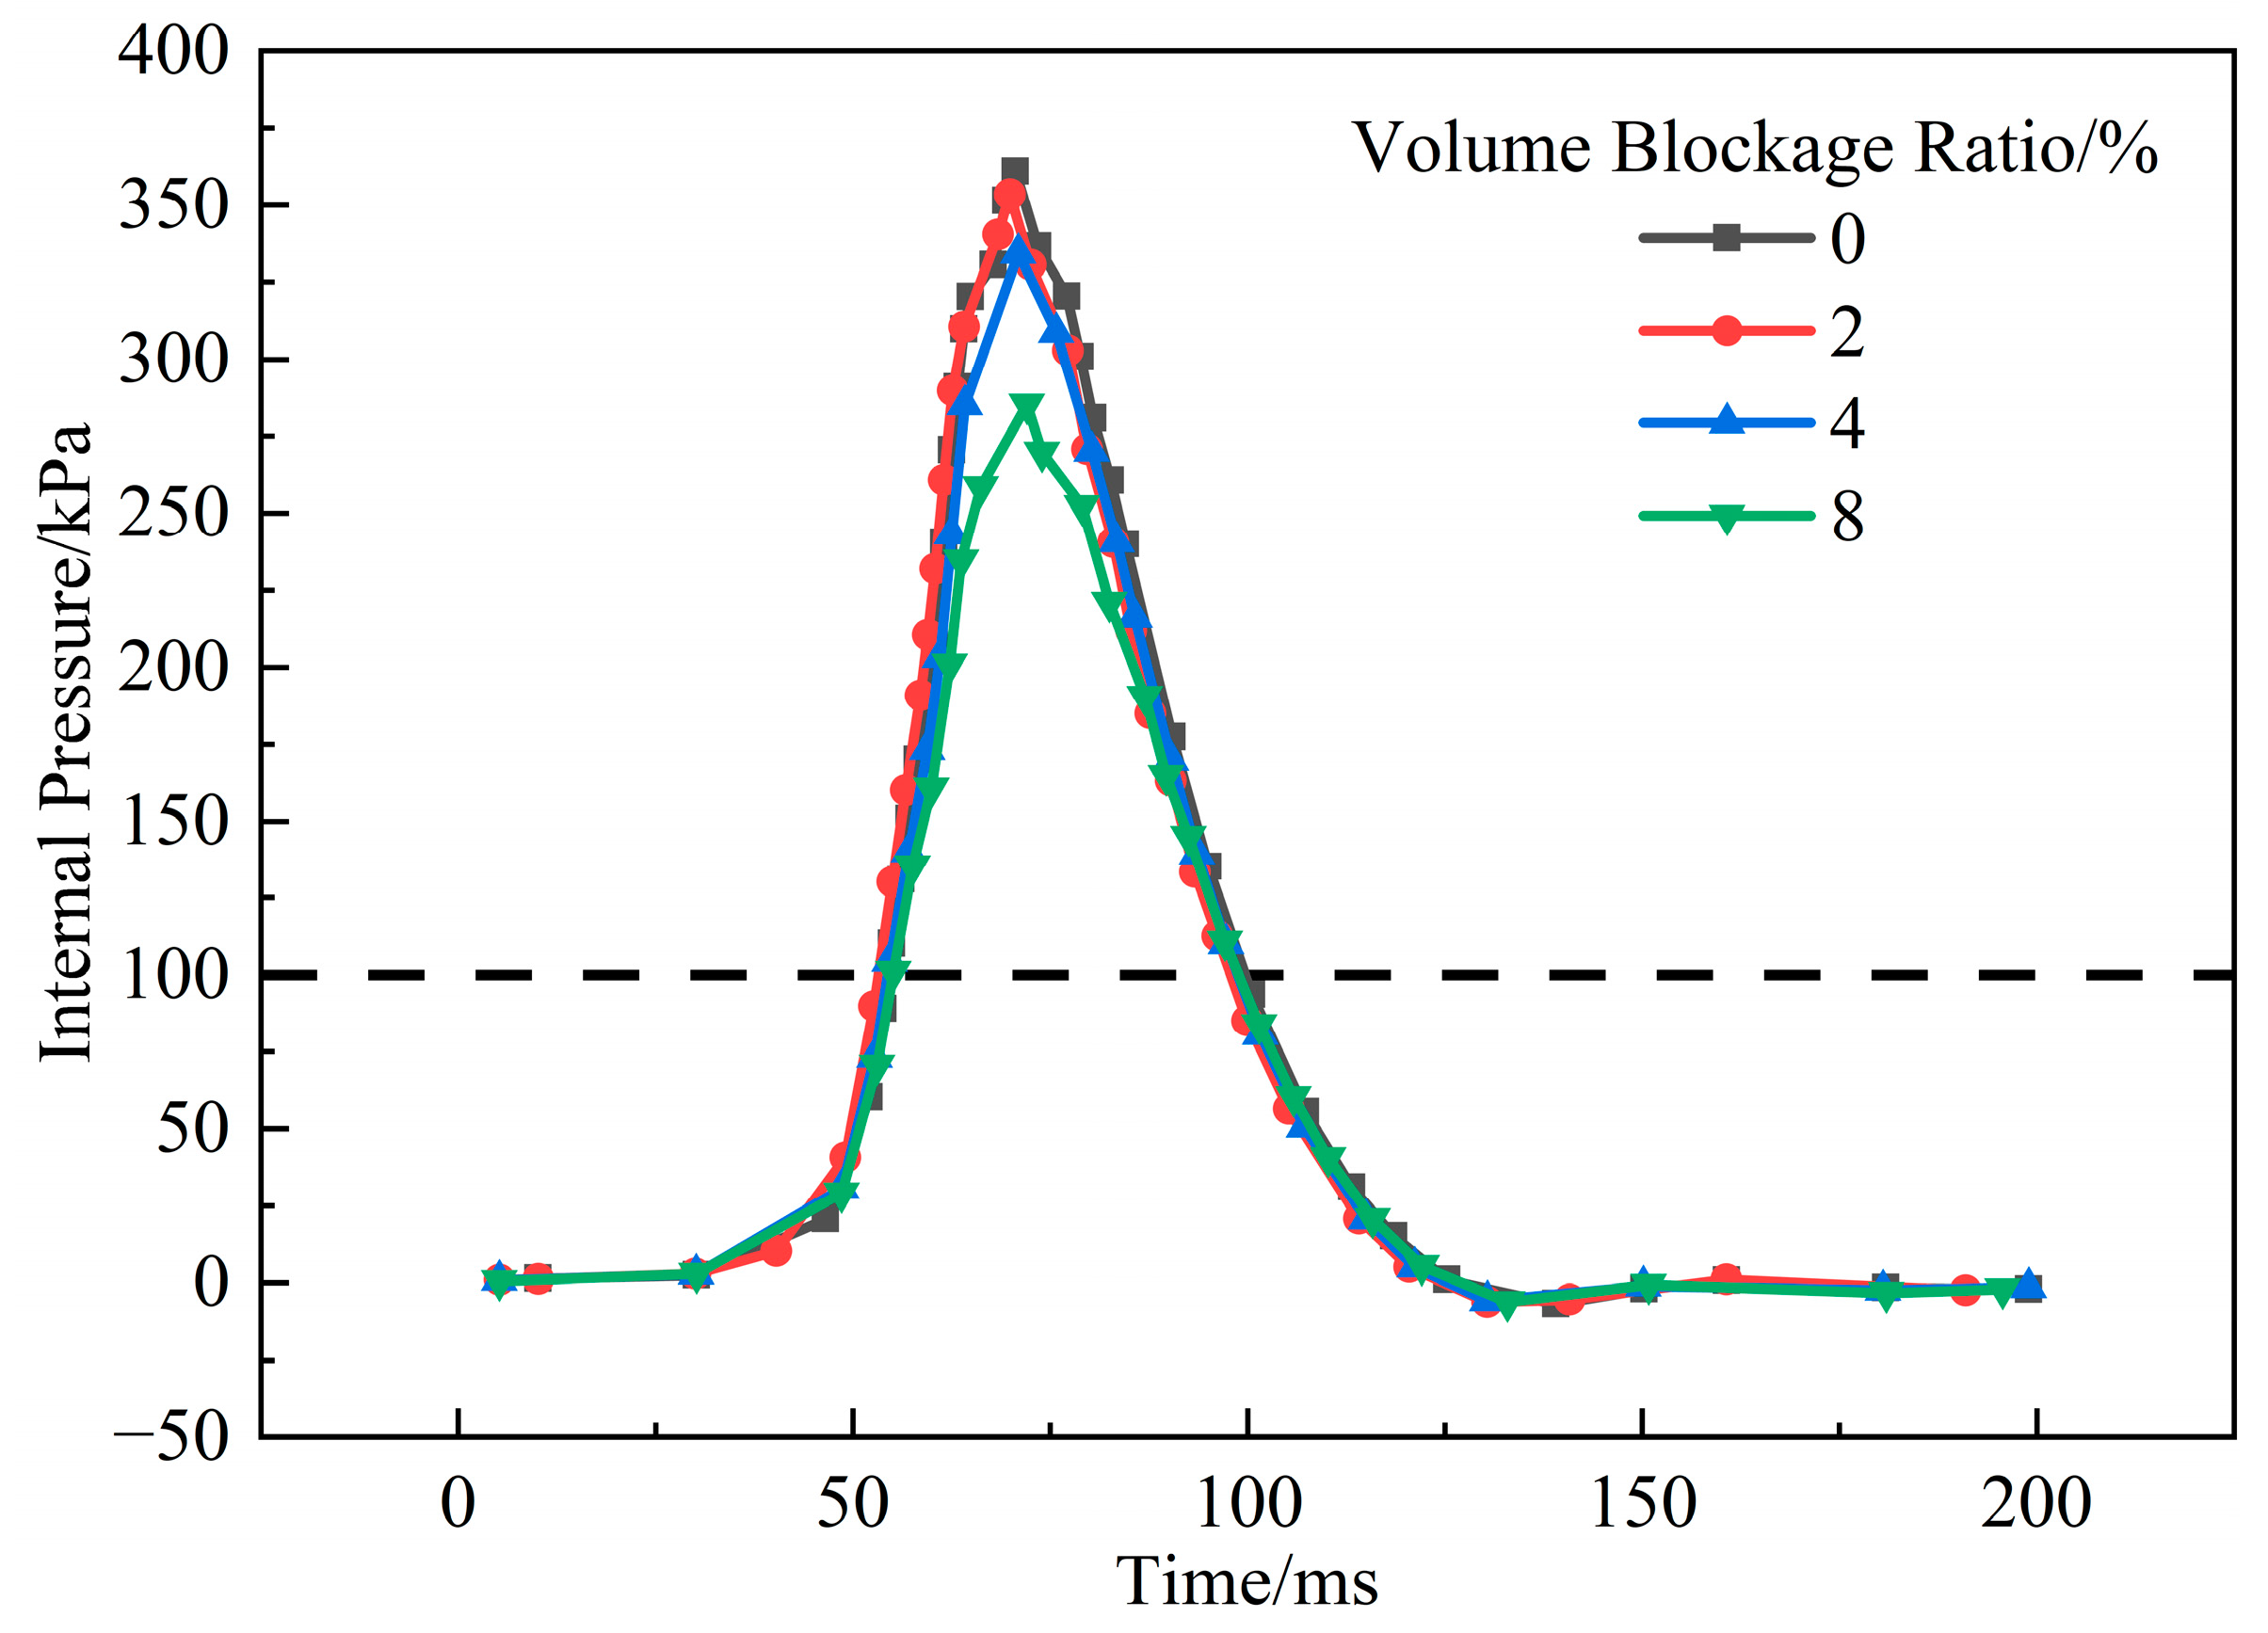
As shown in Figure 16, in the absence of internal obstacles, the peak pressure is the highest (361.0 kPa). As the volume blockage ratio increases (2%, 4%, 8%), the peak pressure gradually decreases, with a significant drop to 285.3 kPa at 8%. The volume blockage ratio has little effect on the time to peak pressure (69.8–72.0 ms) and the duration of overpressure above 100 kPa (55–100 ms), indicating that the volume blockage ratio primarily affects peak pressure while having limited impact on temporal parameters.
In the study of external pressure (Figure 17), within 4 m of the container, external pressure drops rapidly with distance, and the peak pressure decreases as the blockage ratio increases. In the 4–9 m range, external pressure generally rises and then falls, with increased blockage ratio leading to more pronounced fluctuations. Beyond 9 m, the pressure curve gradually flattens. At the injury threshold of 20 kPa, the injury range for a 4% blockage ratio is about 6–7 m, while the 8% blockage ratio results in a double pressure peak, first dropping at 5 m then rising and dropping again at 8 m. While the internal peak pressure significantly decreases, external pressure fluctuations increase significantly with higher blockage ratios.
The external flame velocity is also significantly affected by the volume blockage ratio, as shown in Figure 18. Low blockage ratios (≤2%) produce flame speeds similar to those in an unobstructed container, with rapid propagation within 4 m followed by a sharp decline. Higher blockage ratios (4%, 8%) extend the high-speed propagation zone but transition to a slow decline after a specific distance (9–11 m). As the blockage ratio increases, flame speed first increases and then decreases at the same distance, with the effect most pronounced at an 8% blockage ratio, especially with a notable speed increase at 7 m. Overall, while the blockage ratio does not change the general trend of the curve, it significantly influences the flame propagation speed and stage distribution.

3.2. H-BNG Leak in a Typical Street- Front Restaurant

3.2.1. Scenario

This section examines the concentration distribution and alarm response following a H-BNG leak in a typical street-front restaurant. This study considers five hydrogen-blended ratios (0–80%) with the leak point located at (0.25, 2, 0.8) and oriented along the +Z direction. The simulation is conducted under conditions of 20 °C, 100 kPa, and atmospheric stability class F. According to GB 50028-2006 standards, the leak pressure is set to 2000 Pa with a diameter of 10 mm. By varying the hydrogen-blended ratio, the study explores the response of combustible gas alarms, taking into account the direction and location of the leak to comprehensively assess the leakage risk. The lower flammability limit (LFL) of the 20% H-BNG mixture is 5.86%. The alarm threshold for combustible gas detectors is set at 20% of the LFL for H-BNG (1.17%).

3.2.2. Diffusion Analysis

(1) Influence of Hydrogen-blended Ratio
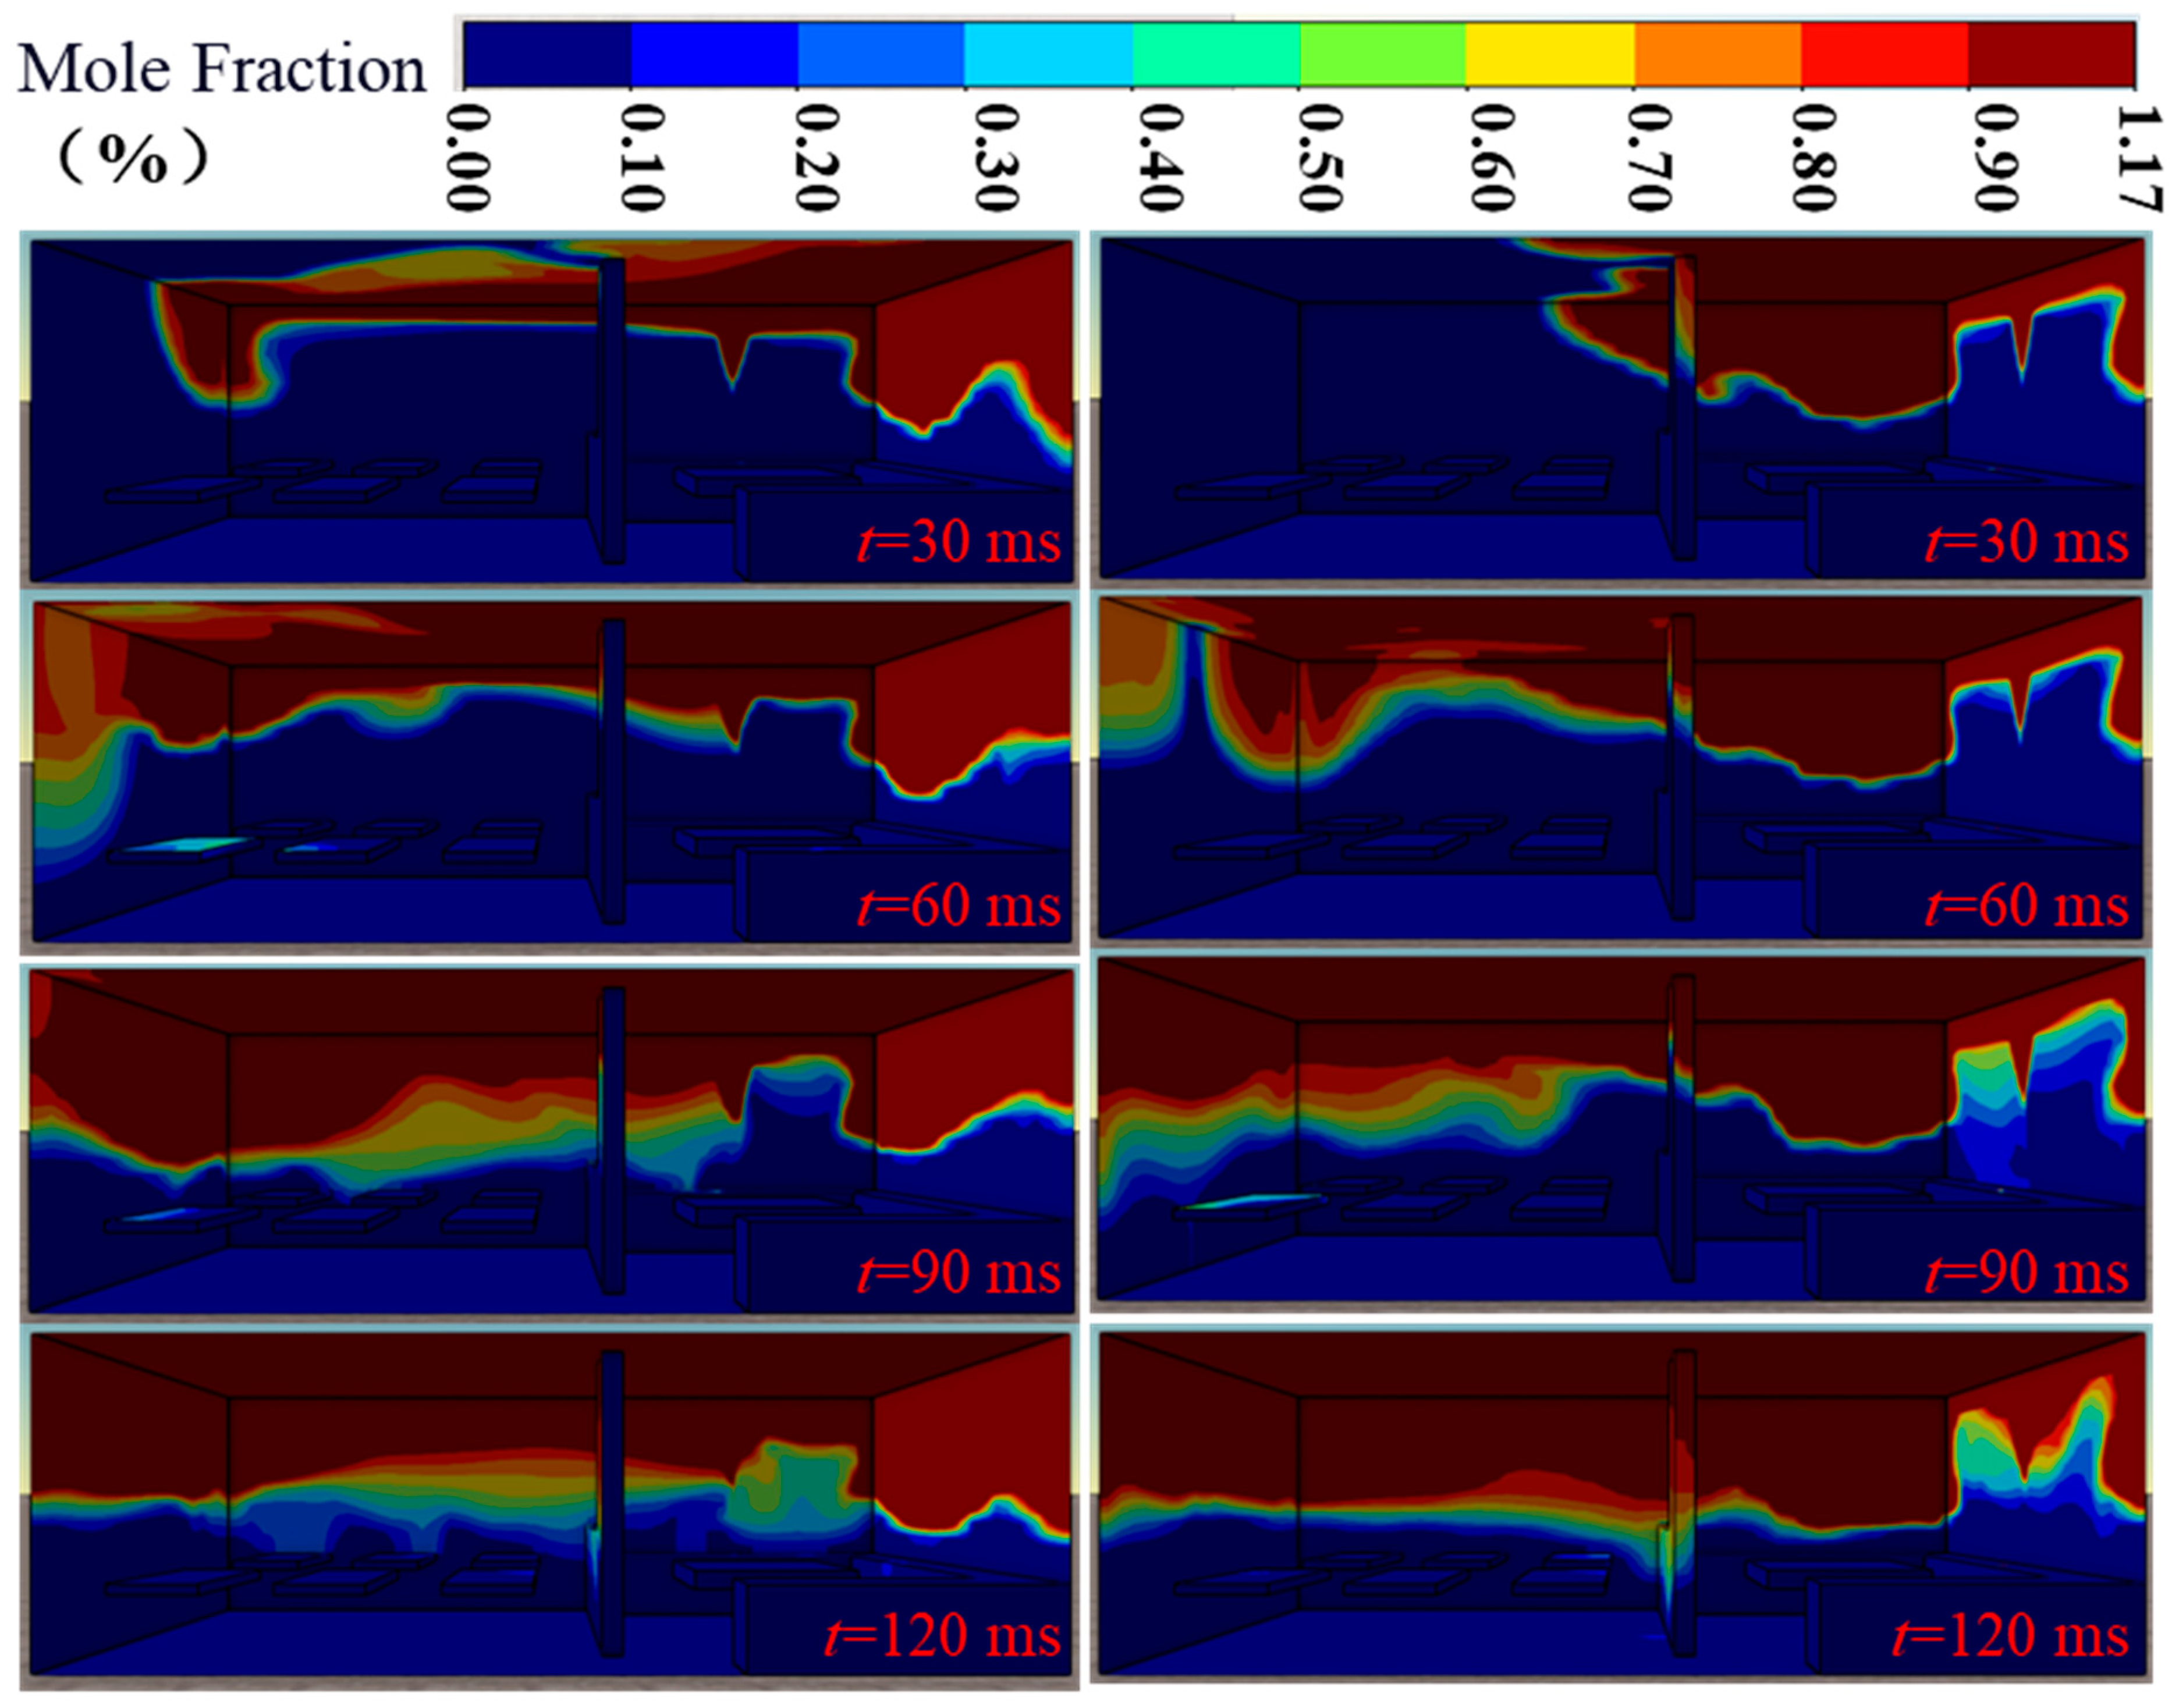
In this section, the alarm is set to trigger when the concentration of H-BNG reaches 20% of its lower flammability limit (LFL). Figure 19 displays the mole fraction distribution for gas mixtures with 0% and 80% hydrogen-blended ratios. After the leak, the mixed gas initially jets toward the ceiling, then spreads along the walls into the dining area, and disperses under the influence of buoyancy and gravity. The 80% hydrogen-blended gas covers the stove and triggers the alarm within 30 s; by 60 s, even the low hydrogen-blended gas triggers the alarm at the ceiling of the dining area. The gas primarily expands along the ceiling toward the restaurant’s front door then spreads downwards to fill the entire area. At 120 s, the difference in hydrogen blending becomes significant: high hydrogen-blended gas fully triggers the alarm; while low hydrogen-blended gas remains confined to the upper space, with the lower parts of the kitchen also beginning to show differences in gas concentration.
As shown in Figure 20, as the hydrogen-blended ratio increases, the time at which the gas mole fraction at the monitoring points rises significantly advances, shortening from 13.0 s for 0% hydrogen-blended gas to 5.9 s for 80% hydrogen-blended gas. Initially, the gas rapidly diffuses toward the ground, causing a sharp increase in mole fraction; subsequently, it spreads laterally along the walls, with the rate of increase slowing. The increase in hydrogen-blended ratio significantly shortens the time for the alarm to reach its threshold concentration, with a marked decrease from 22.6 s to 17.7 s in the 40–80% range, indicating that gas leak detection becomes more responsive under higher hydrogen-blended ratios.
(2) Influence of Leak Location
This section studies the variation in mole fraction and alarm response of H-BNG at different leak locations. The leak points are set at (2, 0.25, 0.8) and (0.25, 2, 0.8), leaking along the +Z axis, with the restaurant sealed.
Figure 21 presents the spatiotemporal evolution of mole fractions for 20% H-BNG at different leak locations, focusing on the diffusion characteristics as the mixed gas reaches 20% of the LFL (alarm concentration). The results show that the gas rapidly hits the ceiling and spreads along the wall after leaking in the +Z direction. The gas at the (2, 0.25, 0.8) leak point expands along the ceiling toward the +X and +Y axes, reaching the front door within 30 s; the gas at the (0.25, 2, 0.8) leak point quickly covers the kitchen ceiling, expanding to the front door within 60 s and covering the entire restaurant ceiling by 90 s. Over time, the gas settles downward, expanding the alarm range, but the difference in location has little impact on the final alarm range due to the same leak volume.
According to Figure 22, the H-BNG shows significant differences in alarm times depending on the leak location. After leaking from the location at (0.25, 2, 0.8), the gas mole fraction rises sharply at 12 s, with the alarm triggering at 21.6 s. For the leak location at (2, 0.25, 0.8), which is farther from the monitoring point, the noticeable increase occurs at 23 s, with the alarm triggering at 40.2 s.
(3) Influence of Leak Direction
This section examines the spatiotemporal distribution of mole fractions of H-BNG under three leak directions: +Z, +X, and −Y, with the leak point at (0.25, 2, 0.8). The front door and exhaust fans are closed, and the hydrogen-blended ratio is 20%.
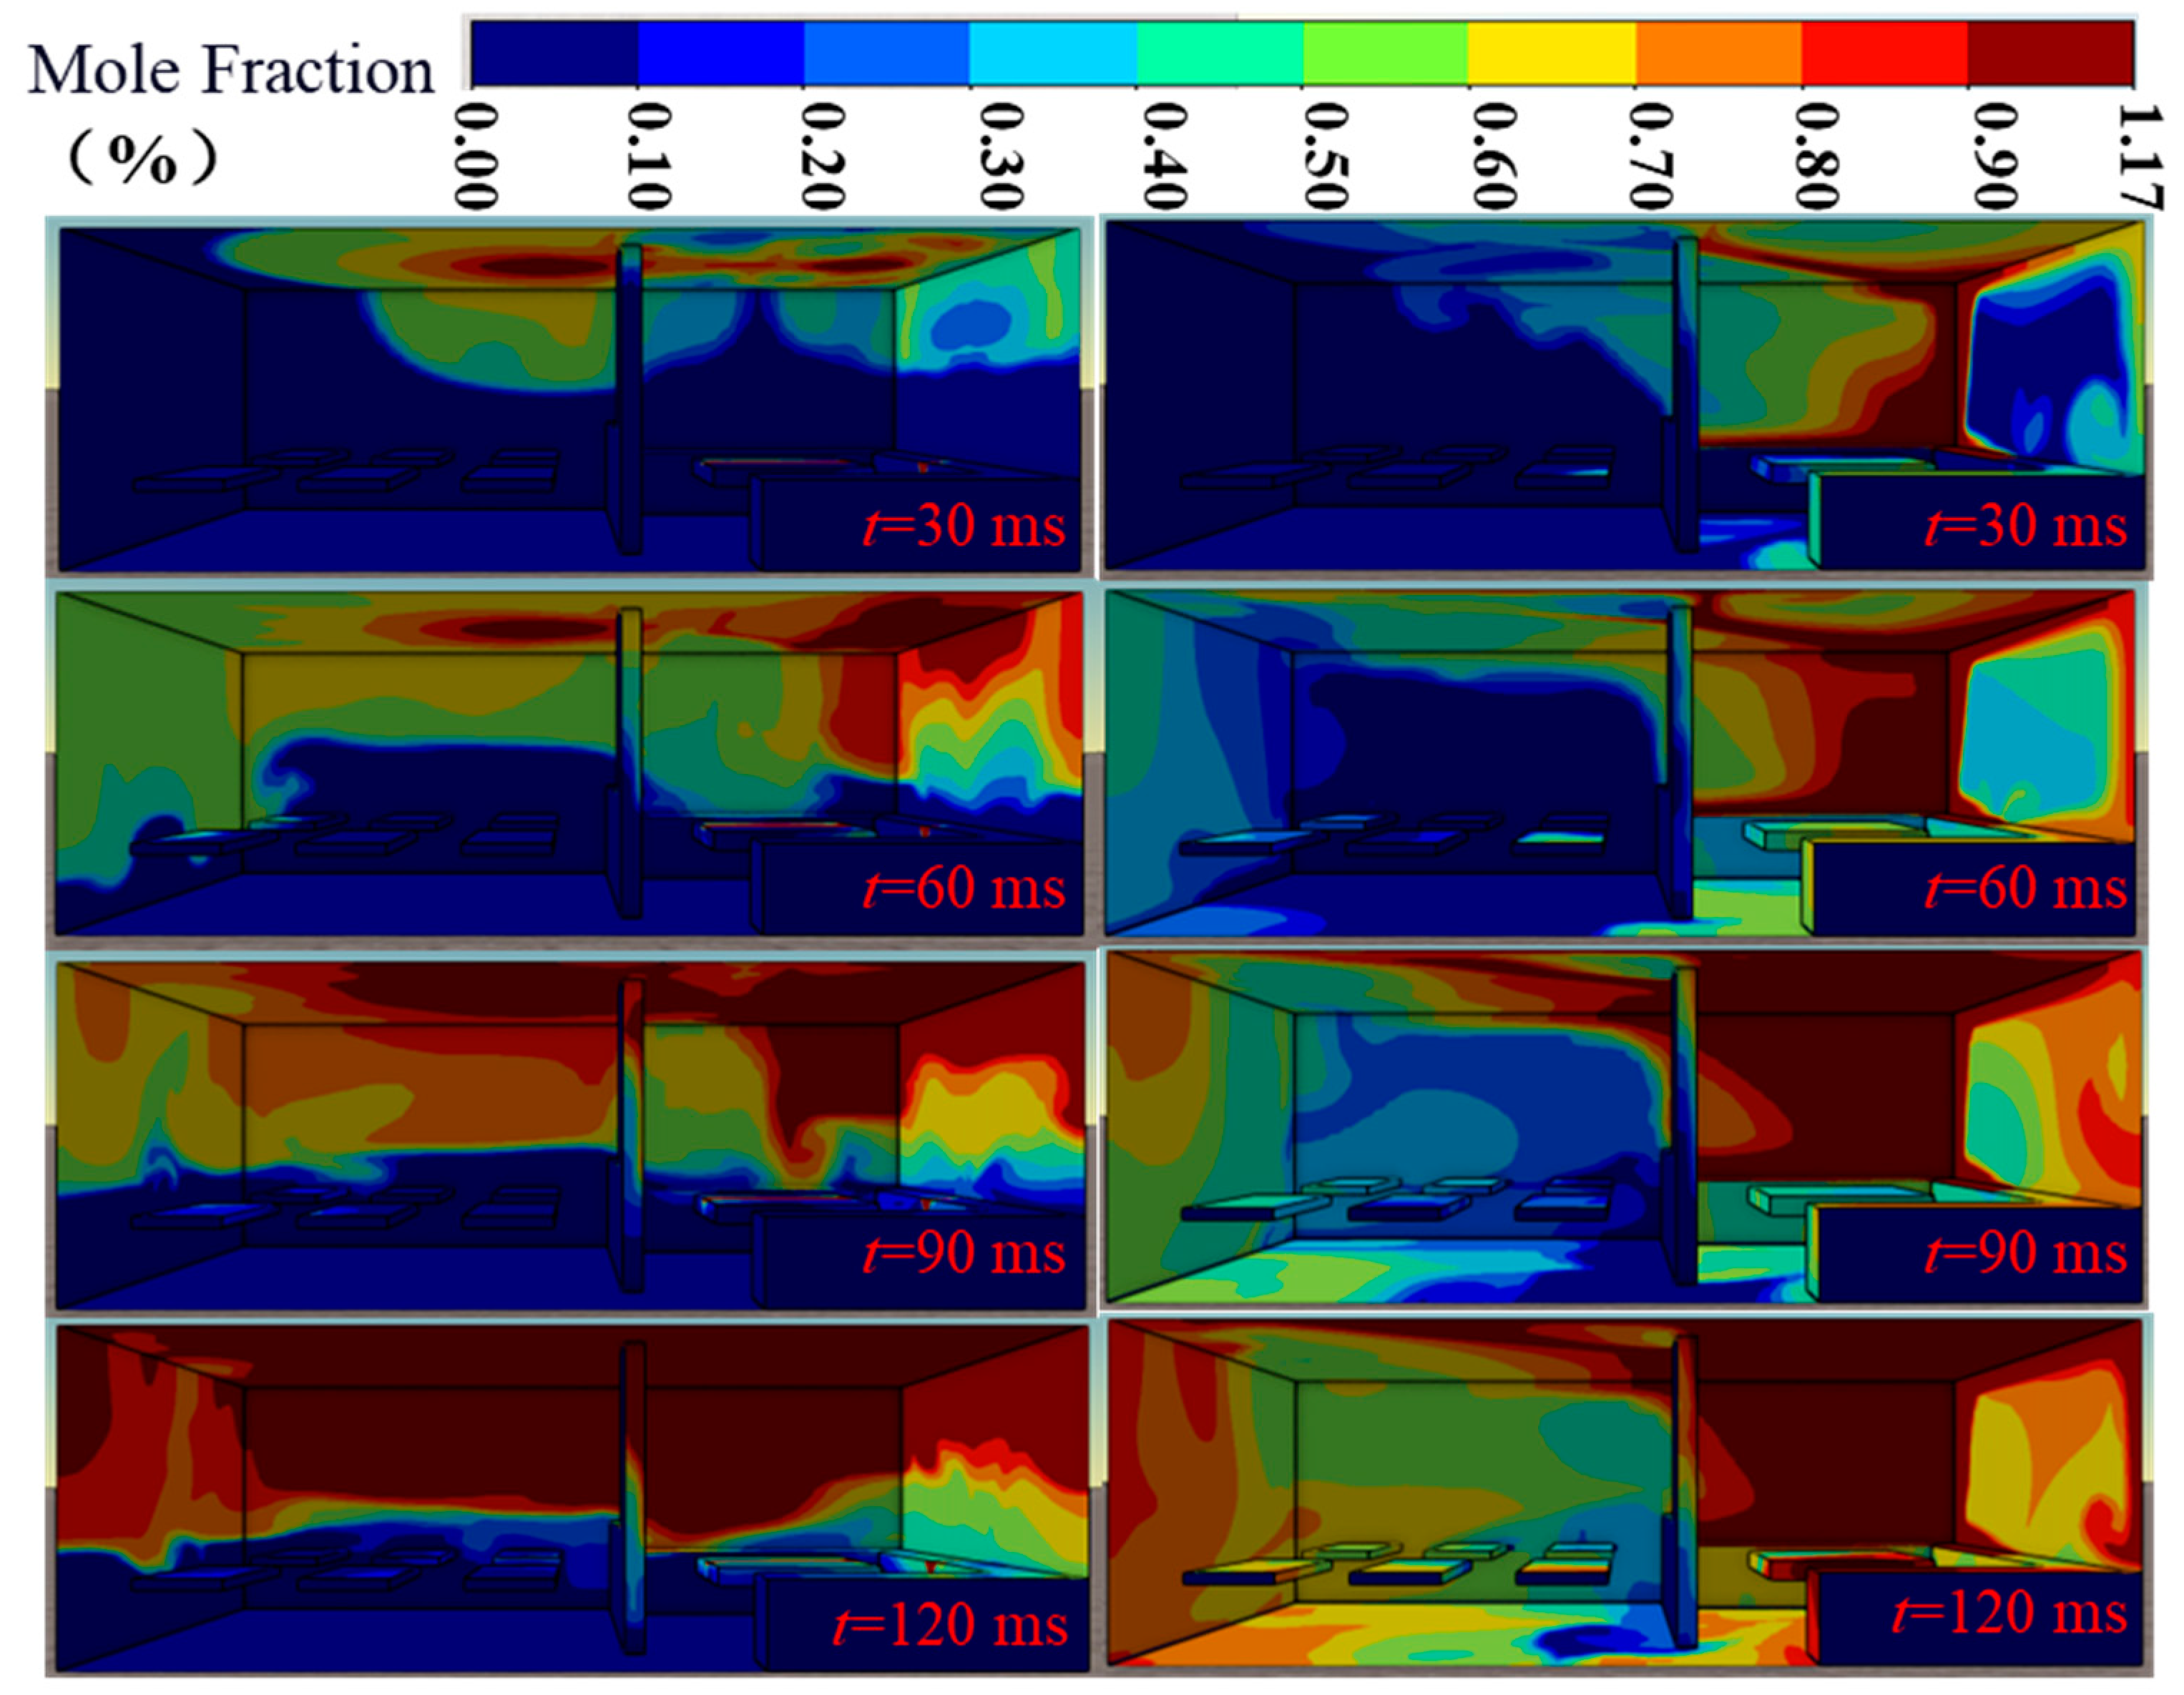
Figure 23 demonstrates the spatiotemporal distribution of mole fractions for 20% H-BNG under different leak directions. This study reveals that the leak direction significantly affects the diffusion pattern of H-BNG. In the +X direction, the gas cloud primarily spreads along the +Z axis to the ceiling, resulting in higher concentrations above the workstation and serving counter. In the −Y direction, the gas first hits specific positions before spreading along the +Z axis, forming a high-concentration line on the ceiling. Over time, the gas in the +X direction primarily spreads into the dining area, while the gas in the −Y direction spreads into the kitchen and along the wall at Y = 4 toward the dining area. By 120 s, the leak in the −Y direction nearly covers the entire restaurant, though with a lower concentration; in contrast, the leak in the +Z direction remains concentrated in the upper part of the restaurant, later spreading along the floor, with higher concentrations but a limited range. Overall, the leak direction significantly impacts the distribution of H-BNG, with the −Y direction covering a wide area with lower concentrations, while the +Z direction results in a smaller but more concentrated distribution.
Figure 24 compares the changes in mole fractions at monitoring points during leaks in different directions for 20% H-BNG. In each direction, the mole fraction increases rapidly initially, then slows down. The gas in the +Z direction diffuses quickly, with the earliest inflection point at 11.5 s, due to its rapid spread along the wall; the +X direction shows the slowest diffusion, with the latest inflection point at 26.0 s due to multiple collisions with obstacles. In the +Z direction, the alarm triggers at 21.6 s, indicating rapid gas accumulation; however, in the −Y and +X directions, the concentration remains low (around 0.8%) even at 80 s, without triggering the alarm. With a constant leak volume, the +Z direction triggers the alarm quickly, aiding timely intervention and reducing accumulation risk. In contrast, the −Y and +X directions may lead to gas accumulation at distant points, increasing the risk of combustion and explosion, with delayed alarms making effective prevention and control more difficult.
(4) Influence of Door Opening and Closing
This section explores the spatiotemporal distribution of mole fractions of 20% H-BNG leaking from (0.25, 2, 0.8) in the +Z direction, analyzing the response of combustible gas alarms with the exhaust fan turned off under conditions of an open or closed front door.
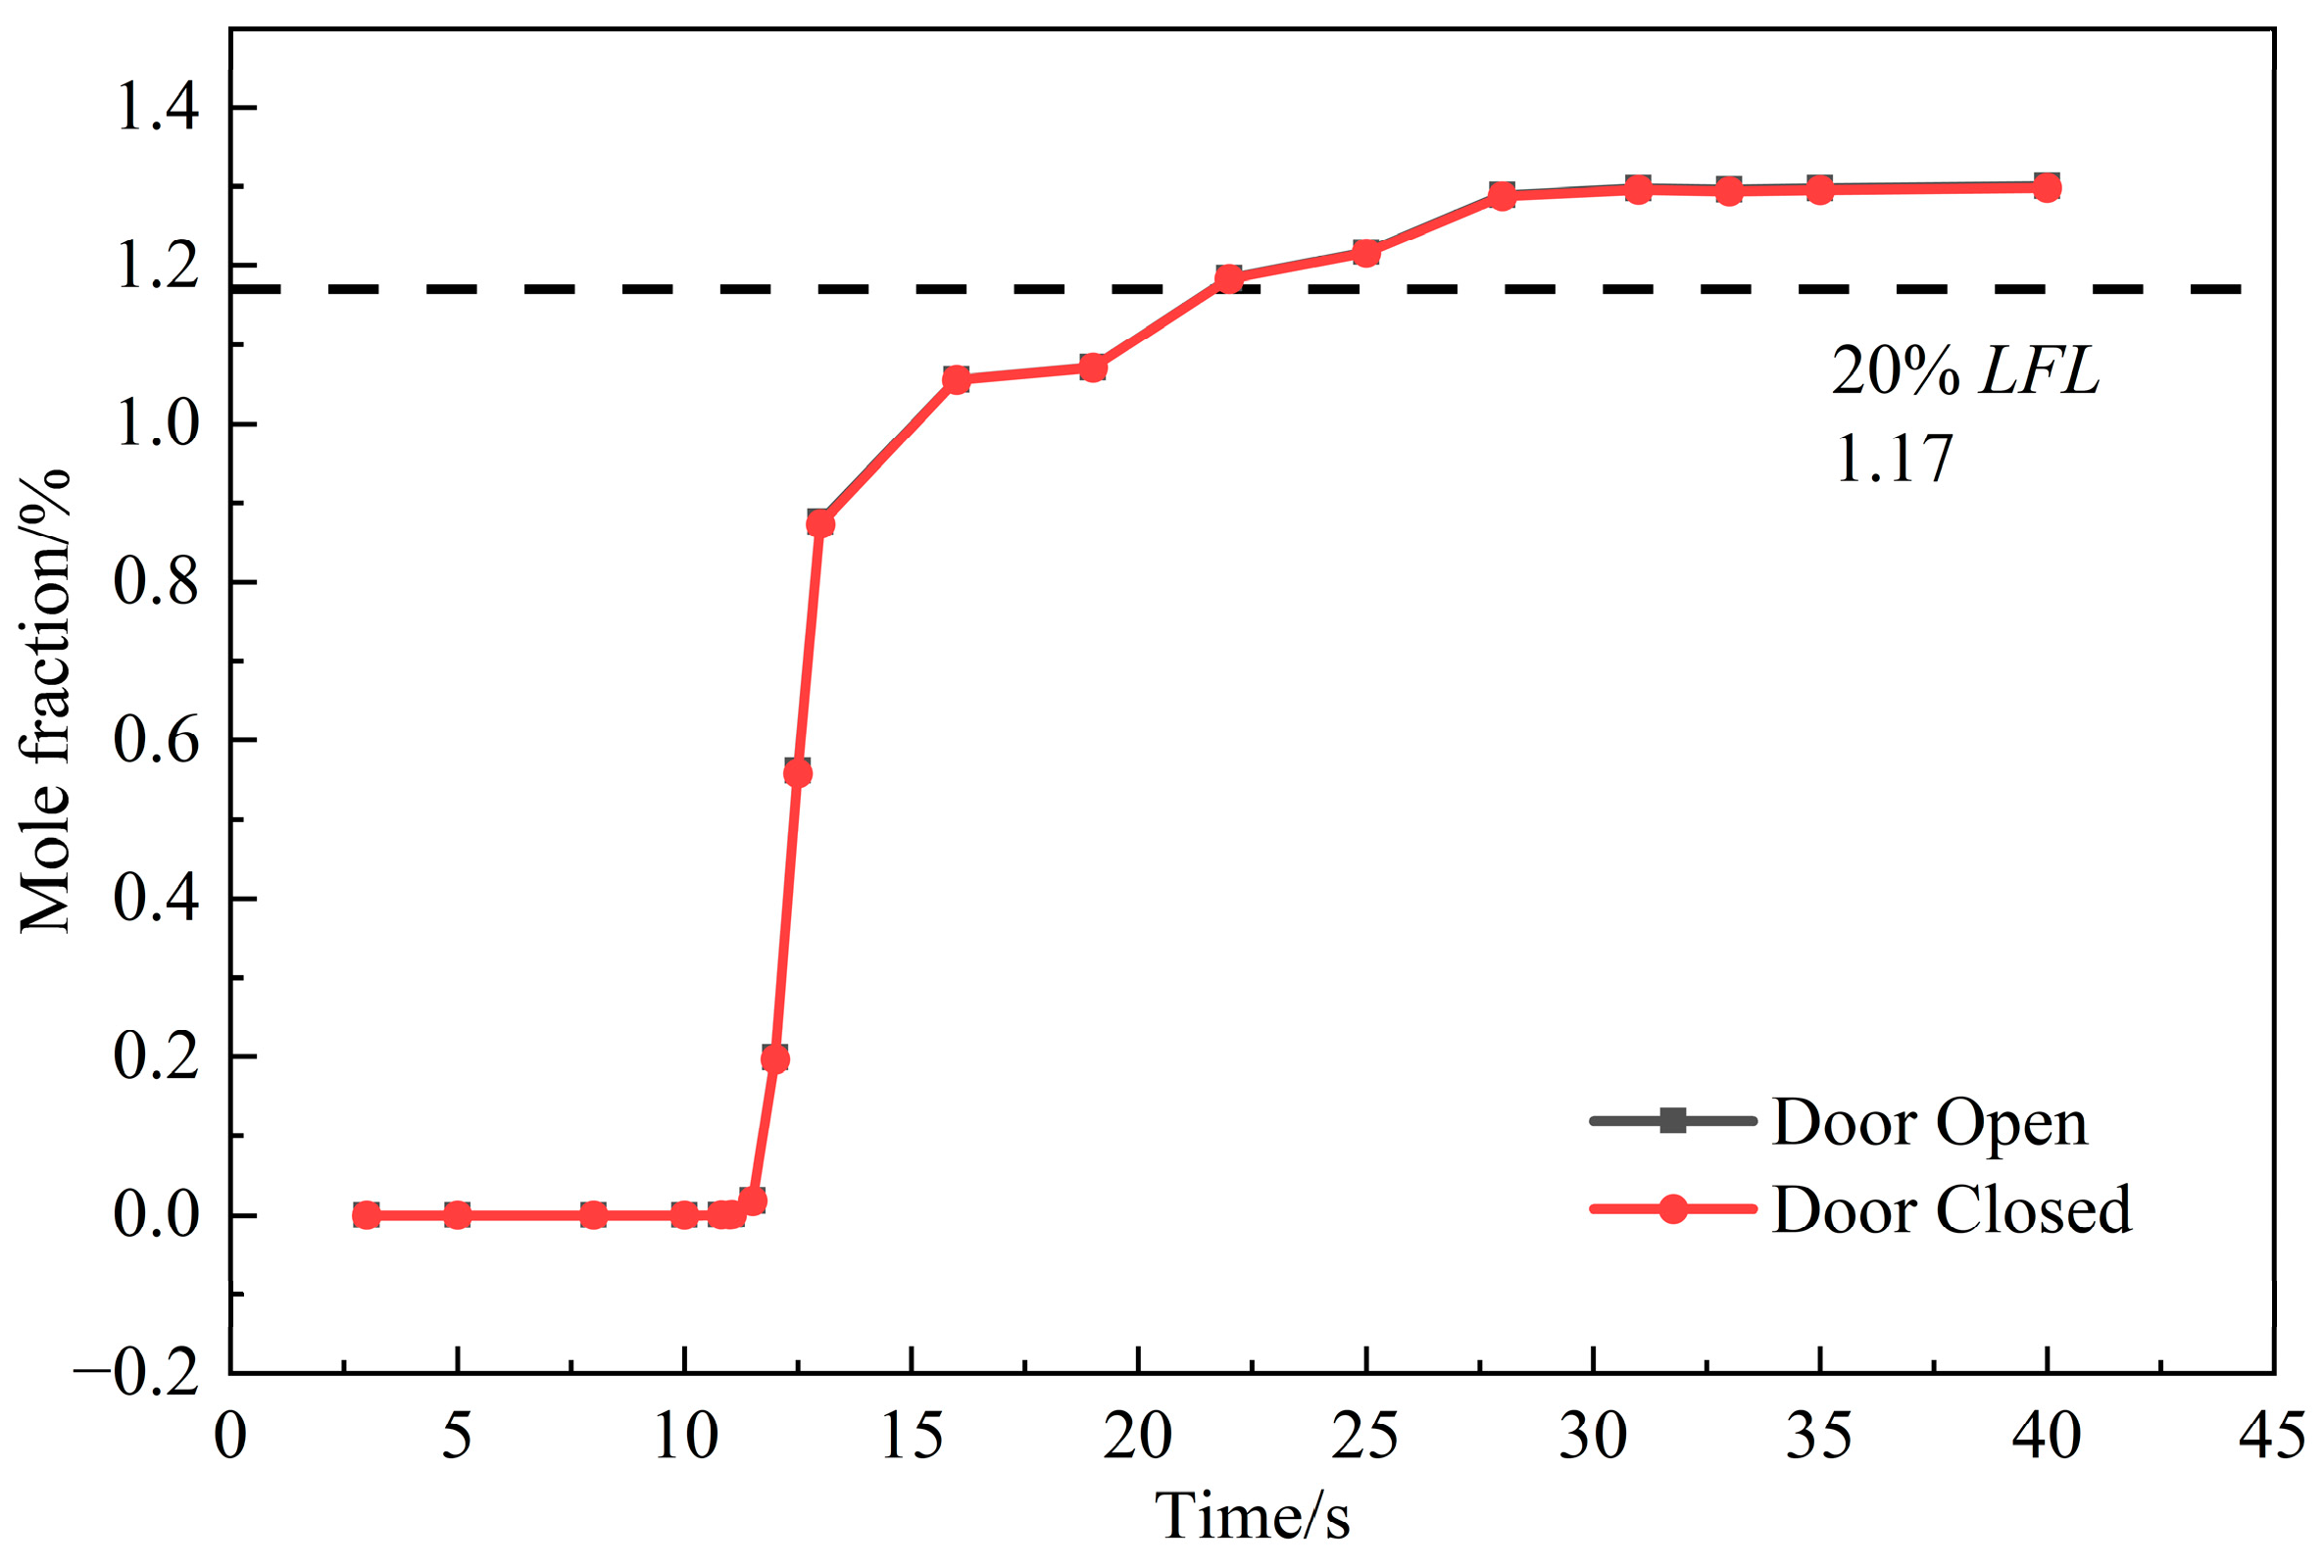
Figure 25 illustrates the spatiotemporal evolution of mole fractions of 20% H-BNG under different door states in the restaurant. In the initial stage (30 s), the gas leak spreads along the wall toward the front door, with no significant impact on the mole fraction distribution whether the door is open or closed. At 60 s, the open door allows the mixed gas to diffuse freely outside, but the initial difference is minimal. As time progresses (90 to 120 s), the gas concentration in the dining area significantly decreases with the door open, reducing the coverage area, while the kitchen area, being farther from the front door, shows no significant change in mole fraction distribution regardless of the door state. Data from the monitoring points in Figure 26 further confirm that the mole fraction of H-BNG in the kitchen remains stable and unaffected by the door state, aligning with the distribution analysis and indicating the localized diffusion of leaked gas within the restaurant and the front door’s regulatory effect on gas distribution within the restaurant layout.

3.2.3. Ventilation Analysis

(1) Free Diffusion
This section studies the change in mole fraction after stopping a leak and opening the front door for natural diffusion at different times (60 s, 120 s, 180 s) under a closed-door state with a 20% H-BNG leak from (0.25, 2, 0.8) along the +Z direction and with the exhaust fan turned off.
Figure 27 presents a simulation of H-BNG (20% hydrogen, LFL = 5.86%) leaking in a restaurant without an exhaust fan, followed by manual intervention to stop the leak and open the front door for natural diffusion. The results show that the duration of the leak significantly affects the efficiency of combustible gas dilution: as the leak duration extends from 60 s to 120 s and 180 s, the time required for the concentration to drop below the LFL 20% threshold (alarm cutoff time) increases to 75.1 s, 151 s, and 415 s, respectively, with a significant increase (101% and 175%, respectively).
(2) Fan System
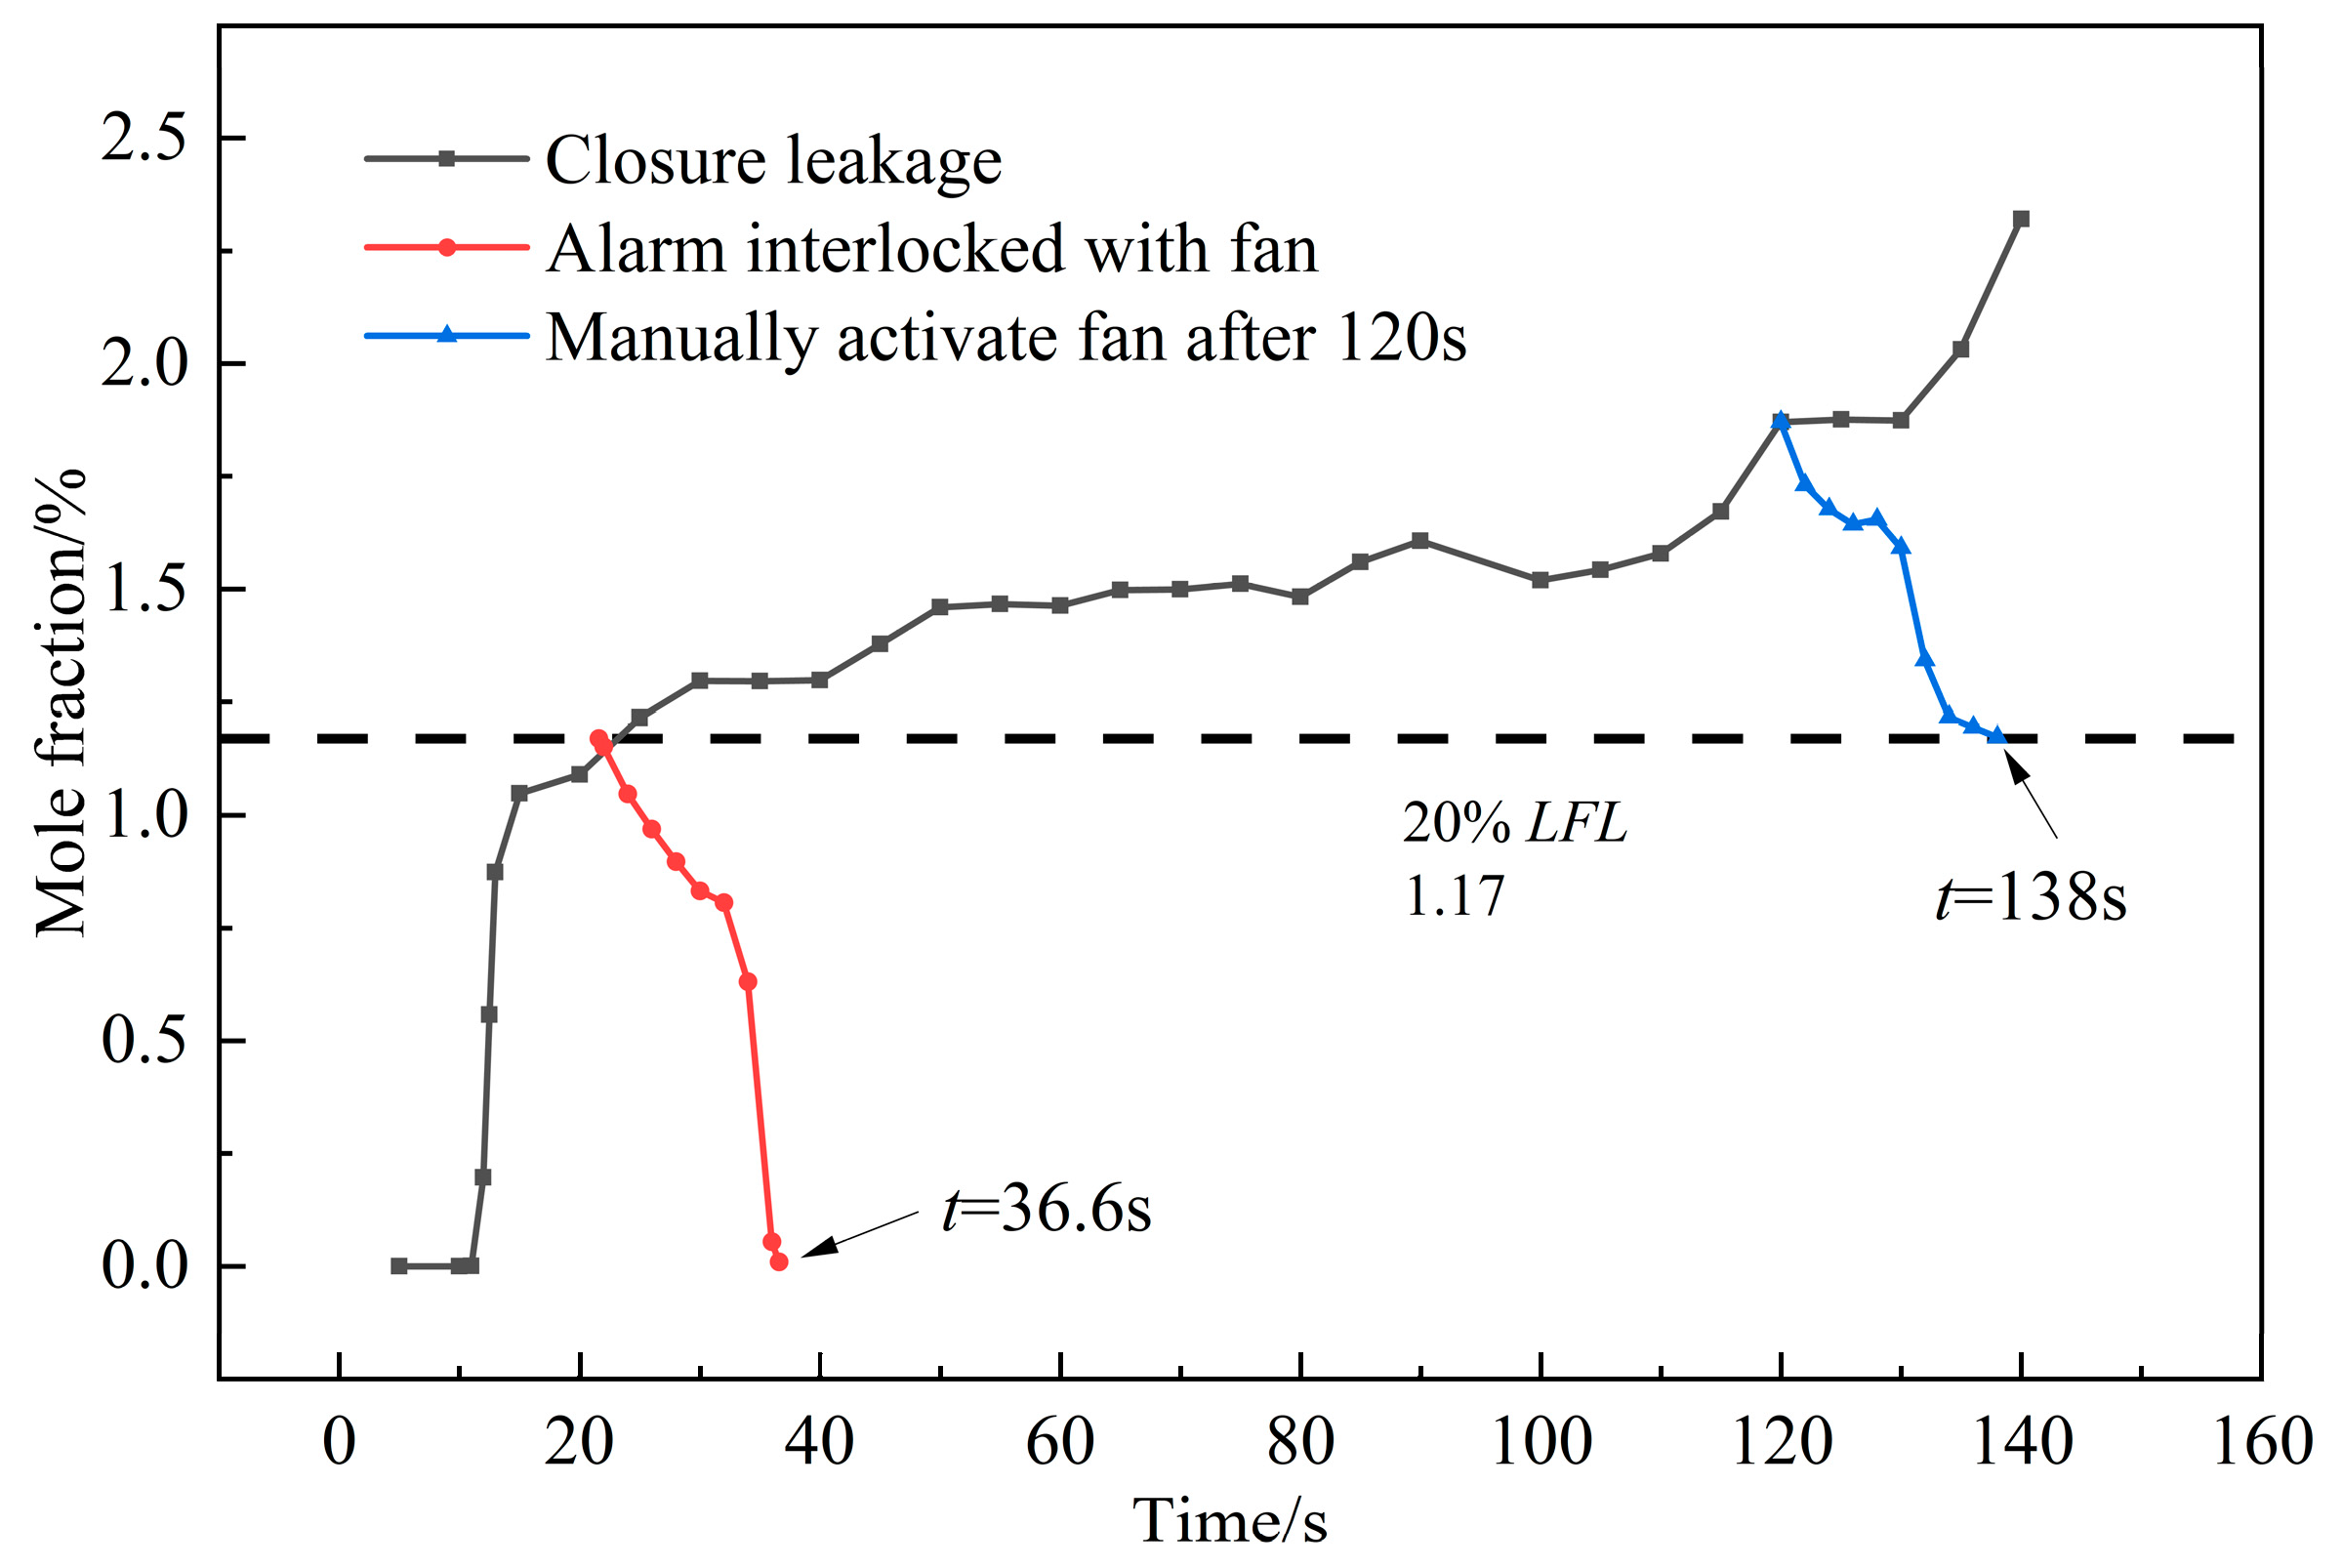
This section explores the diffusion characteristics of 20% H-BNG in a sealed restaurant (front door closed) under a SUCTION leak mode, with a leak rate of 2.322 kg/s, a pressure of 500 Pa, and dimensions of 700 × 500 mm, with a “uniform” profile and a leak location at (0, 4, 2.4). The focus is on analyzing the effect of closing the valve and starting the fan at different times on gas mole fraction.
This study examines emergency response strategies for hydrogen-blended natural gas (H-BNG) leaks in sealed restaurant environments with closed front doors, using FLACS simulations to evaluate exhaust system performance. Figure 28 demonstrate that combustible gas alarms triggering automatic valve closure and fan activation reduce H-BNG mole fraction to safe levels (0%) within 36.6 s, achieving an 82% faster hazard mitigation than manual intervention (138 s to reach alarm threshold). Furthermore, automated mechanical ventilation proves 3.1 times more efficient than passive door-opening measures (151 s for door-opening vs. 36.6 s for active ventilation), confirming its essential role in emergency protocols. The data quantitatively validate the critical need for integrated alarm–ventilation systems in hydrogen-mixed fuel applications.

3.2.4. Explosion Analysis

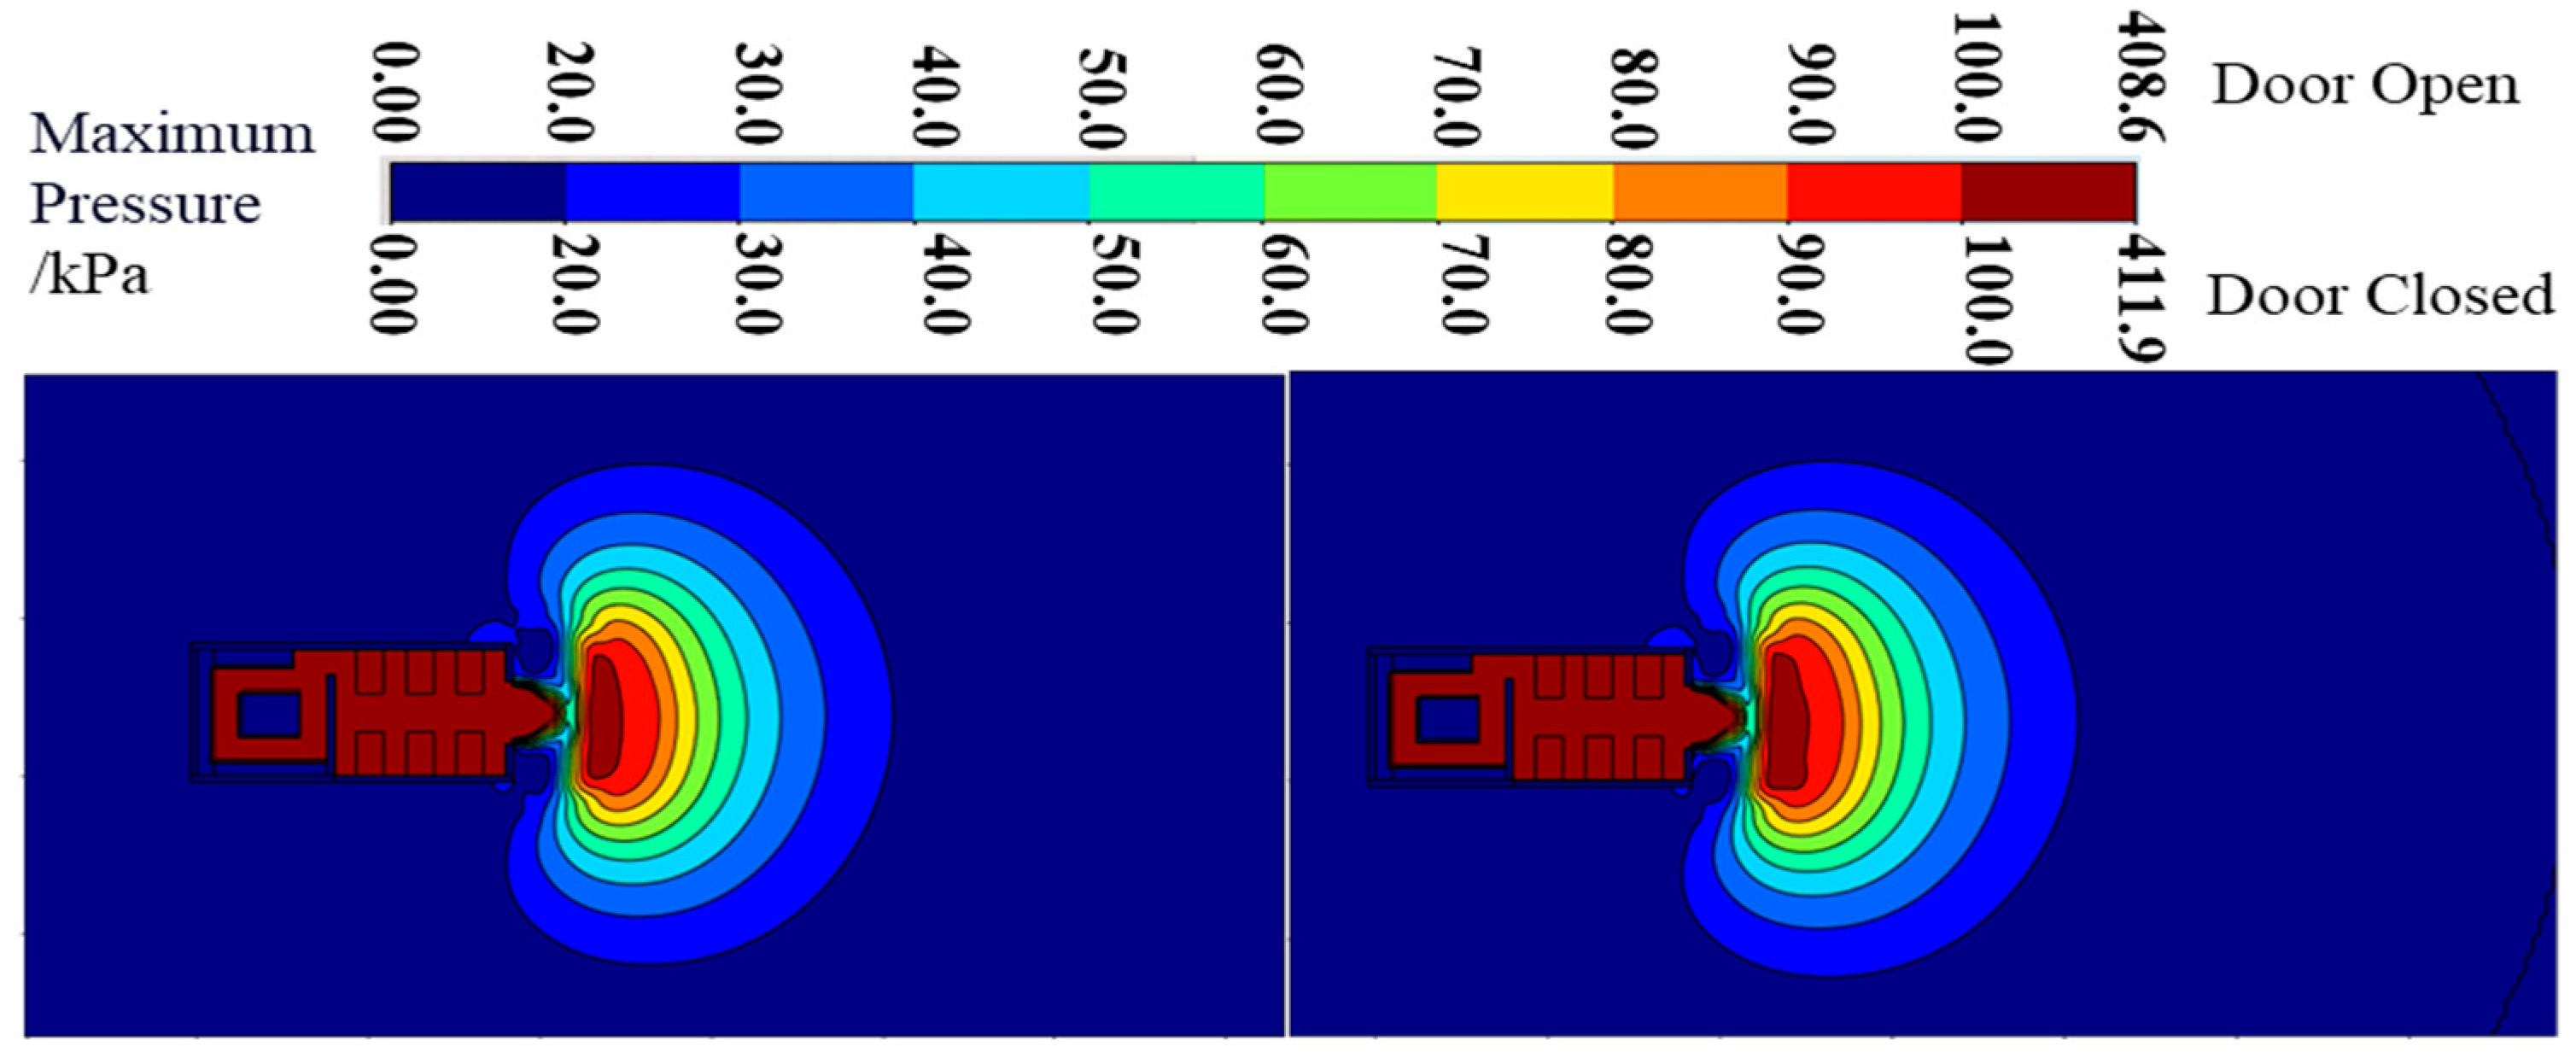
This section delves into the evolution mechanism of H-BNG explosions under different door states, analyzing the overpressure risk and far-field propagation effects. To accurately simulate far-field explosion consequences, the simulation domain is expanded to 2–3 times its original size, and the grid is refined to a resolution of 0.2 m. The front door’s venting threshold is set to 0.01 MPa, with the X-axis boundary treated with a plane wave boundary condition and the others with Euler boundaries. The environment is set with 20% H-BNG, and an ignition source is placed at the original leak point to explore the explosion behavior and propagation characteristics.
Figure 29 shows the evolution of maximum pressure during the explosion of H-BNG under different door states. The front door’s venting pressure setting has limited impact on the explosion’s consequences, especially when the ventilation area ratio is around 0.05, where the venting pressure has minimal effect on the peak explosion pressure. Whether the door is open or closed, the maximum explosion pressure in the restaurant increases slightly from 409 kPa to 412 kPa, with the injury radius (20.5 m causing injury, 12.5 m causing death) remaining largely unaffected by the door state.

4. Conclusions

The FLACS-based numerical simulations systematically reveal the combustion dynamics of H-BNG in semi-open environments.
(1) Leakage Scenarios in Typical Semi-Open Space
FLACS simulations reveal that increasing hydrogen blending ratios (0% → 60%) significantly elevate peak internal pressure from 259.3 kPa to 526.0 kPa, with the pressure rise time decreasing from 95.8 ms to 41.7 ms. Central ignition generates the highest internal overpressure of 361.0 kPa, 16.6% greater than front ignition (309.7 kPa). Reducing vent length from 2 m to 0.5 m increases internal overpressure to 570.7 kPa, while 8% volume blockage reduces peak pressure by approximately 21%.
External pressure analysis shows injury-risk distances expanding from 4.5 m (pure methane) to 7–8 m (40–60% H2). Rear ignition produces the maximum external overpressure of 65.4 kPa at 2 m, corresponding to a 7 m hazard range. Vent size paradoxically modulates external pressures: 2 m openings yield the highest external overpressure (36.7 kPa); while 2–4% blockages induce localized pressure recovery between 4 and 9 m.
Flame propagation analysis indicates rapid velocity decay from 836 m/s to 154 m/s (81.6% reduction) within 2–8 m for mixtures ≥30% H2. Front ignition maintains higher flame speeds in the 4–11 m range compared to other positions.
(2) Leakage Scenarios in Street-Front Restaurants
For 80% H2 leaks along the +Z direction, alarm concentration (0.8 m height) is reached within 120 s, with faster dispersion compared to low-H2 blends. Sensor response times vary spatially (21.6 s proximal vs. 40.2 s distal). −Y-axis leakage achieves broader coverage; while +Z-axis leakage concentrates higher molar fractions in ceiling regions.
Open-door configurations reduce post-120 s concentrations through cross-ventilation, and forced ventilation shortens hazard duration from 151 s to 138 s. Deflagration consequences show minimal door influence (412 kPa closed vs. 409 kPa open) with identical hazard radii (20.5 m at 20 kPa; 12.5 m at 100 kPa). Gas detection and ventilation systems effectively mitigate accumulation risks.

Author Contributions

Conceptualization, X.W. and S.Z.; methodology, X.W. and S.H.; software, S.H.; validation, T.Z. and J.X.; formal analysis, S.H.; investigation, T.Z., J.X. and X.W.; re-sources, S.Z. and Y.D.; data curation, S.H.; writing—original draft preparation, S.H. and X.W.; writing—review and editing, X.W., S.H. and S.Z.; visualization, X.W.; supervision, S.Z. and X.W.; project administration, S.Z. and Y.D.; funding acquisition, S.Z. and X.W. All authors have read and agreed to the published version of the manuscript.

Funding

This research was funded by the Key Science and Technology Project of the Ministry of Emergency Management of the People’s Republic of China (Grant no. 2024EMST090903) and the National Key R&D Program of China (Grant no. 2022YFC3070100).

Institutional Review Board Statement

Not applicable.

Informed Consent Statement

Not applicable.

Data Availability Statement

The raw data supporting the conclusions of this article will be made available by the authors on request.

Conflicts of Interest

Author Saitao Hu was employed by Shenzhen Gas Co., Ltd. Author Jinhuai Xu was employed by Huaneng North United Power Co., Ltd. Author Tong Zhao was employed by Northwest Electric Power Design Institute Co., Ltd. of China Power Engineering Consulting Group. The authors Xu Wang, Shengzhu Zhang, and Yingquan Duo declare that the research was conducted in the absence of any commercial or financial relationships that could be construed as a potential conflict of interest.

Nomenclature

β v Volume porosity ρ Density
β j Area porosity in the j th directiontTime
u j Mean velocity (j th component, vector) m Mass rate
V Volume p Absolute pressure
F o i Flow resistance due to sub-grid obstructions F w i Flow resistance due to walls
ρ 0 Ideal atmospheric density g Gravitational acceleration
σ i j Stress tensor h Specific enthalpy
μ e f f Effective viscosity σ h Constant, 0.7
Q Heat flow ratekTurbulent kinetic energy
σ k Constant, 1.0 ε Dissipation of turbulent kinetic energy
σ ε Constant, 1.3 C 2 ε Constant, 1.92
L Monin–Obukhov length scale c p Specific heat capacity at constant pressure
u * Friction velocity κ Von Karman constant (typically, κ = 0.41)
H s Sensible heat flux from the surface U 0 Reference, characteristic velocity
zDistance above the ground z 0 Aerodynamical roughness length
z d Canopy height σ Prandtl–Schmidt number
R f u e l Reaction rate for fuel Y Mass fraction
S L Laminar burning velocity γ P Pressure exponent for the laminar burning velocity,
S Q L Quasi-laminar burning velocity χ Progress variable
S T Turbulent burning velocity u Root mean square of velocity
ν Kinematic viscosity l I Turbulent integral scale

References

  1. Messaoudani, Z.L.; Rigas, F.; Binti Hamid, M.D.; Che Hassan, C.R. Hazards, safety and knowledge gaps on hydrogen transmission via natural gas grid: A critical review. Int. J. Hydrogen Energy 2016, 41, 17511–17525. [Google Scholar] [CrossRef]
  2. Song, Y.; Jiang, Y.; Zhong, W. Numerical study on the influence of venting interlayer structure on the explosion venting effects. Int. Commun. Heat Mass Transf. 2024, 156, 107714. [Google Scholar] [CrossRef]
  3. Jurca Adrian, M.; Florin, A.P.; Mihai, C.P. Ignition risk assessment to the non-electrical equipment from hydrogen production, storage, transport and use facilities. In MATEC Web of Conferences; EDP Sciences: Les Ulis, France, 2024; Volume 389. [Google Scholar] [CrossRef]
  4. Yang, K.; Li, W.; Dai, X.; Guo, Y.; Pang, L. Effect of hydrogen ratio on leakage and explosion characteristics of hydrogen-blended natural gas in utility tunnels. Int. J. Hydrogen Energy 2024, 64, 132–147. [Google Scholar] [CrossRef]
  5. Lowesmith, B.J.; Hankinson, G.; Spataru, C.; Stobbart, M. Gas build-up in a domestic property following releases of methane/hydrogen mixtures. Int. J. Hydrogen Energy 2009, 34, 5932–5939. [Google Scholar] [CrossRef]
  6. Marangon, A.; Carcassi, M.N. Hydrogen–methane mixtures: Dispersion and stratification studies. Int. J. Hydrogen Energy 2014, 39, 6160–6168. [Google Scholar] [CrossRef]
  7. Su, Y.; Li, J.; Yu, B.; Zhao, Y. Numerical investigation on the leakage and diffusion characteristics of hydrogen-blended natural gas in a domestic kitchen. Renew. Energy 2022, 189, 899–916. [Google Scholar] [CrossRef]
  8. Li, H.; Cao, X.; Du, H.; Teng, L.; Shao, Y.; Bian, J. Numerical simulation of leakage and diffusion distribution of natural gas and hydrogen mixtures in a closed container. Int. J. Hydrogen Energy 2022, 47, 35928–35939. [Google Scholar] [CrossRef]
  9. Mitu, M.; Razus, D.; Schroeder, V. Laminar Burning Velocities of Hydrogen-Blended Methane–Air and Natural Gas–Air Mixtures, Calculated from the Early Stage of p(t) Records in a Spherical Vessel. Energies 2021, 14, 7556. [Google Scholar] [CrossRef]
  10. Ma, Q.; Zhang, Q.; Chen, J.; Huang, Y.; Shi, Y. Effects of hydrogen on combustion characteristics of methane in air. Int. J. Hydrogen Energy 2014, 39, 11291–11298. [Google Scholar] [CrossRef]
  11. Witkowski, A.; Rusin, A.; Majkut, M.; Stolecka, K. Analysis of compression and transport of the methane/hydrogen mixture in existing natural gas pipelines. Int. J. Press. Vessel. Pip. 2018, 166, 24–34. [Google Scholar] [CrossRef]
  12. Middha, P.; Engel, D.; Hansen, O.R. Can the addition of hydrogen to natural gas reduce the explosion risk? Int. J. Hydrogen Energy 2011, 36, 2628–2636. [Google Scholar] [CrossRef]
  13. Di Sarli, V.; Di Benedetto, A.; Long, E.J.; Hargrave, G.K. Time-Resolved Particle Image Velocimetry of dynamic interactions between hydrogen-enriched methane/air premixed flames and toroidal vortex structures. Int. J. Hydrogen Energy 2012, 37, 16201–16213. [Google Scholar] [CrossRef]
  14. Yu, M.; Luan, P.; Zheng, K.; Yang, X.; Han, S.; Duan, Y. Experimental study on explosion characteristics of syngas with different ignition positions and hydrogen fraction. Int. J. Hydrogen Energy 2019, 44, 15553–15564. [Google Scholar] [CrossRef]
  15. Duan, Z.; Guo, J.; Wang, X.; Li, J.; Zhang, S.; Yang, F. Experiments on vented deflagration of stoichiometric hydrogen–methane–air mixtures: Effect of hydrogen fraction. Int. J. Hydrogen Energy 2020, 45, 25615–25622. [Google Scholar] [CrossRef]
  16. Zhang, C.; Shen, X.; Wen, J.X.; Xiu, G. The behavior of methane/hydrogen/air premixed flame in a closed channel with inhibition. Fuel 2020, 265, 116810. [Google Scholar] [CrossRef]
  17. Li, Q.; Wei, Z.; Lv, Z.; Guo, W.; Liu, X. The behaviors of supersonic combustion wave through a perforated plate in a stoichiometric mixtures of H2/CH4/O2 and H2/O2. Fuel 2022, 317, 123092. [Google Scholar] [CrossRef]
  18. Ma, Q.; Zhang, Q.; Pang, L.; Huang, Y.; Chen, J. Effects of hydrogen addition on the confined and vented explosion behavior of methane in air. J. Loss Prev. Process Ind. 2014, 27, 65–73. [Google Scholar] [CrossRef]
  19. Zhou, C.; Yang, Z.; Chen, G.; Zhang, Q.; Yang, Y. Study on leakage and explosion consequence for hydrogen blended natural gas in urban distribution networks. Int. J. Hydrogen Energy 2022, 47, 27096–27115. [Google Scholar] [CrossRef]
  20. Stolecka, K. Hazards of hydrogen transport in the existing natural gas pipeline network. J. Power Technol. 2018, 98, 329. [Google Scholar]
  21. Zhang, S.; Ma, H.; Huang, X.; Peng, S. Numerical simulation on methane-hydrogen explosion in gas compartment in utility tunnel. Process Saf. Environ. Prot. 2020, 140, 100–110. [Google Scholar] [CrossRef]
  22. Kang, S.-K.; Bang, H.-J.; Jo, Y.-D. Consequence Analysis of Hydrogen Blended Natural Gas(HCNG) using 3D CFD Simulation. J. Korean Inst. Gas 2013, 17, 15–21. [Google Scholar] [CrossRef]
  23. Di Sarli, V.; Di Benedetto, A. Effects of non-equidiffusion on unsteady propagation of hydrogen-enriched methane/air premixed flames. Int. J. Hydrogen Energy 2013, 38, 7510–7518. [Google Scholar] [CrossRef]
  24. Cellek, M.S. Flameless combustion investigation of CH4/H2 in the laboratory-scaled furnace. Int. J. Hydrogen Energy 2020, 45, 35208–35222. [Google Scholar] [CrossRef]
  25. Wang, J.; Huang, Z.; Tang, C.; Miao, H.; Wang, X. Numerical study of the effect of hydrogen addition on methane–air mixtures combustion. Int. J. Hydrogen Energy 2009, 34, 1084–1096. [Google Scholar] [CrossRef]
  26. Gexcon, A.S. FLACS v22.1 User’s Manual; Gexcon AS: Bergen, Norway, 2022. [Google Scholar]
  27. Han, S. Study on Explosion Characteristics of Hydrogen with Concentration Gradient in Cube Chamber; Hefei University of Technology: Hefei, China, 2019. [Google Scholar]
Figure 1. Geometric model of the semi-open vented container.
Fire 08 00146 g001
Figure 2. Mesh independence analysis for the semi-open vented container.
Fire 08 00146 g002
Figure 3. Mesh independence of a typical street-front restaurant scenario.
Fire 08 00146 g003
Figure 4. Mesh independence of the typical street-front restaurant model.
Fire 08 00146 g004
Figure 5. Pressure field distribution of a 20% H-BNG explosion.
Fire 08 00146 g005
Figure 6. Internal pressure curves of the container at different hydrogen-blended ratios.
Fire 08 00146 g006
Figure 7. External pressure curves of the container at different hydrogen-blended ratios.
Fire 08 00146 g007
Figure 8. External flame speed curves for different hydrogen-blended ratios.
Fire 08 00146 g008
Figure 9. Internal pressure curves at different ignition positions.
Fire 08 00146 g009
Figure 10. External pressure curves at different ignition positions.
Fire 08 00146 g010
Figure 11. External flame velocity curves at different ignition positions.
Fire 08 00146 g011
Figure 12. Internal pressure curves for different opening sizes.
Fire 08 00146 g012
Figure 13. External pressure curves at different opening sizes.
Fire 08 00146 g013
Figure 14. External flame velocity curves at different opening sizes.
Fire 08 00146 g014
Figure 15. Schematic of different volume blockage ratios.
Fire 08 00146 g015
Figure 16. Internal pressure curves at different volume blockage ratios.
Fire 08 00146 g016
Figure 17. External pressure curves at different volume blockage ratios.
Fire 08 00146 g017
Figure 18. External flame velocity curves at different volume blockage ratios.
Fire 08 00146 g018
Figure 19. Spatiotemporal distribution of H-BNG mole fractions at different ratios (left: 0% hydrogen; right: 80% hydrogen; from top to bottom: 30 s, 60 s, 90 s, 120 s).
Fire 08 00146 g019
Figure 20. Mole fraction curves and alarm times for different hydrogen-blended ratios.
Fire 08 00146 g020
Figure 21. Spatiotemporal distribution of H-BNG mole fractions at different leak locations (left: (2, 0.25, 0.8); right: (0.25, 2, 0.8)).
Fire 08 00146 g021
Figure 22. Mole fraction curves for different leak locations.
Fire 08 00146 g022
Figure 23. Spatiotemporal distribution of H-BNG mole fractions for different leak directions (left: +X; right: −Y).
Fire 08 00146 g023
Figure 24. Mole fraction curves for H-BNG in different leak directions.
Fire 08 00146 g024
Figure 25. Spatiotemporal distribution of H-BNG mole fractions with door open and closed (left: door closed; right: door open).
Fire 08 00146 g025
Figure 26. Mole fraction curves for H-BNG with door open and closed.
Fire 08 00146 g026
Figure 27. Mole fractions of H-BNG during closed-door leakage and free diffusion after valve closure and door opening at different times.
Fire 08 00146 g027
Figure 28. Response of H-BNG leakage to fan activation under different conditions.
Fire 08 00146 g028
Figure 29. Analysis of H-BNG explosion with door open and closed (left: door open; right: door closed).
Fire 08 00146 g029
Table 1. Height of the upper and lower surfaces of objects within the model.
Object NameUpper Surface (m)Lower Surface (m)Object NameUpper Surface (m)Lower Surface (m)
Dining Table0.80.7Stove0.80
Serving Counter1.20Workstation0.80.6
Disclaimer/Publisher’s Note: The statements, opinions and data contained in all publications are solely those of the individual author(s) and contributor(s) and not of MDPI and/or the editor(s). MDPI and/or the editor(s) disclaim responsibility for any injury to people or property resulting from any ideas, methods, instructions or products referred to in the content.