
Influence of Recirculation Zones on Flaming Ignition of Porous Wood Fuel Beds

Abstract
1. Introduction
2. Methodology
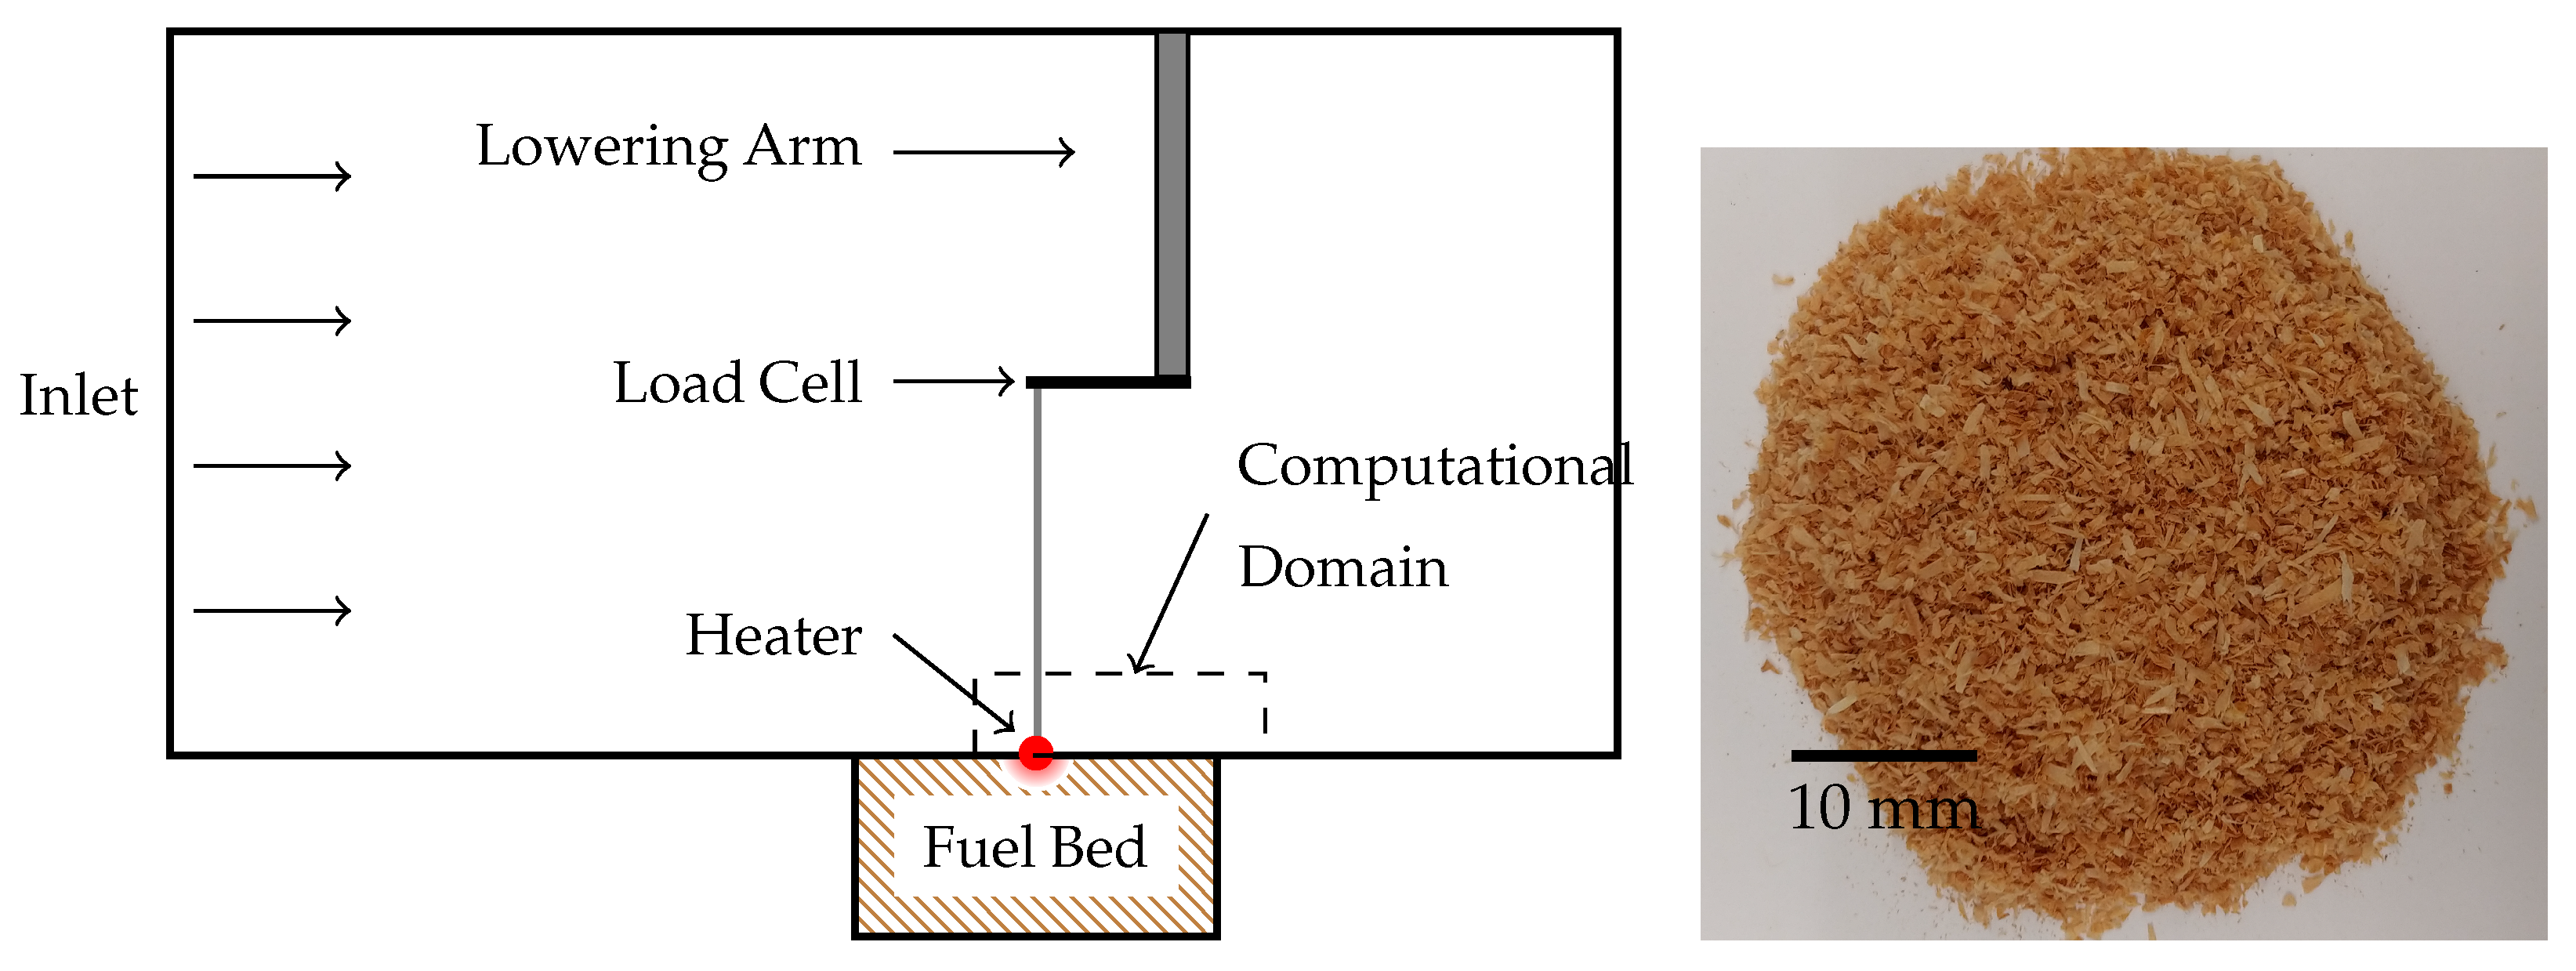
2.1. Experimental
2.2. Computational
- Fuel beds were considered to have constant thermal properties; although pyrolysis did occur during the experiments, changing the properties of the fuel bed, the mass loss from the start of heat transfer to a typical ignition event is small compared to the total mass that undergoes heating.
- The temperature evolution of the fuel bed was assumed to be symmetric around the centerline of the heater.
- Heat losses from the fuel bed to the surroundings were assumed to be significantly less than the heat transfer from the heater to the fuel bed. Thus, the interface between the fuel bed and the air was considered insulated.
- The fuel bed was modeled as a solid with thermal and physical properties representative of a porous material; its properties were either measured or derived from measurements. Density and particle size were directly measured. Thermal conductivity and chemical composition were derived.
3. Results
4. Summary and Conclusions
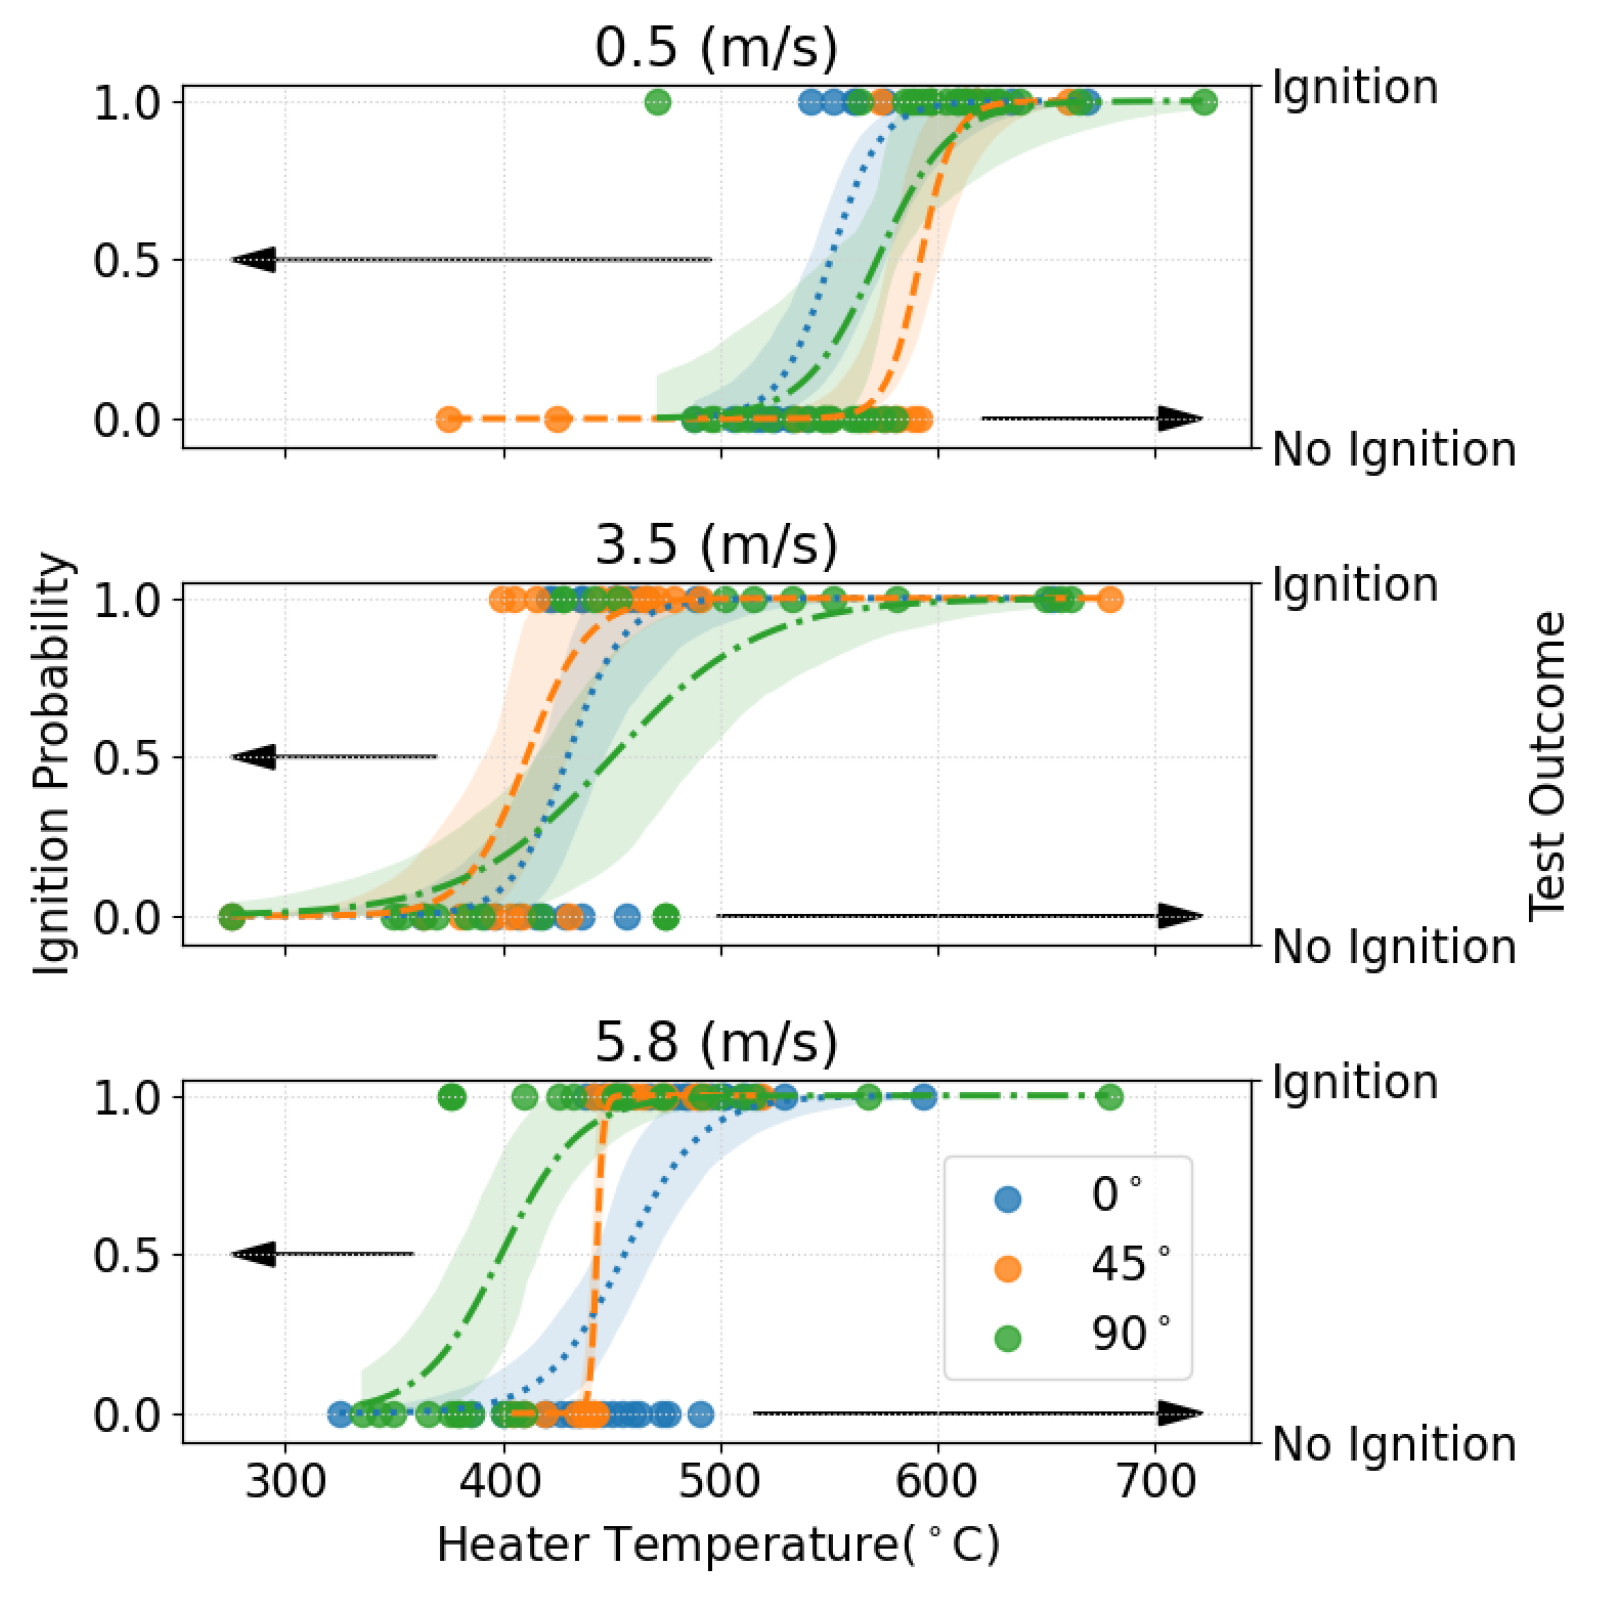
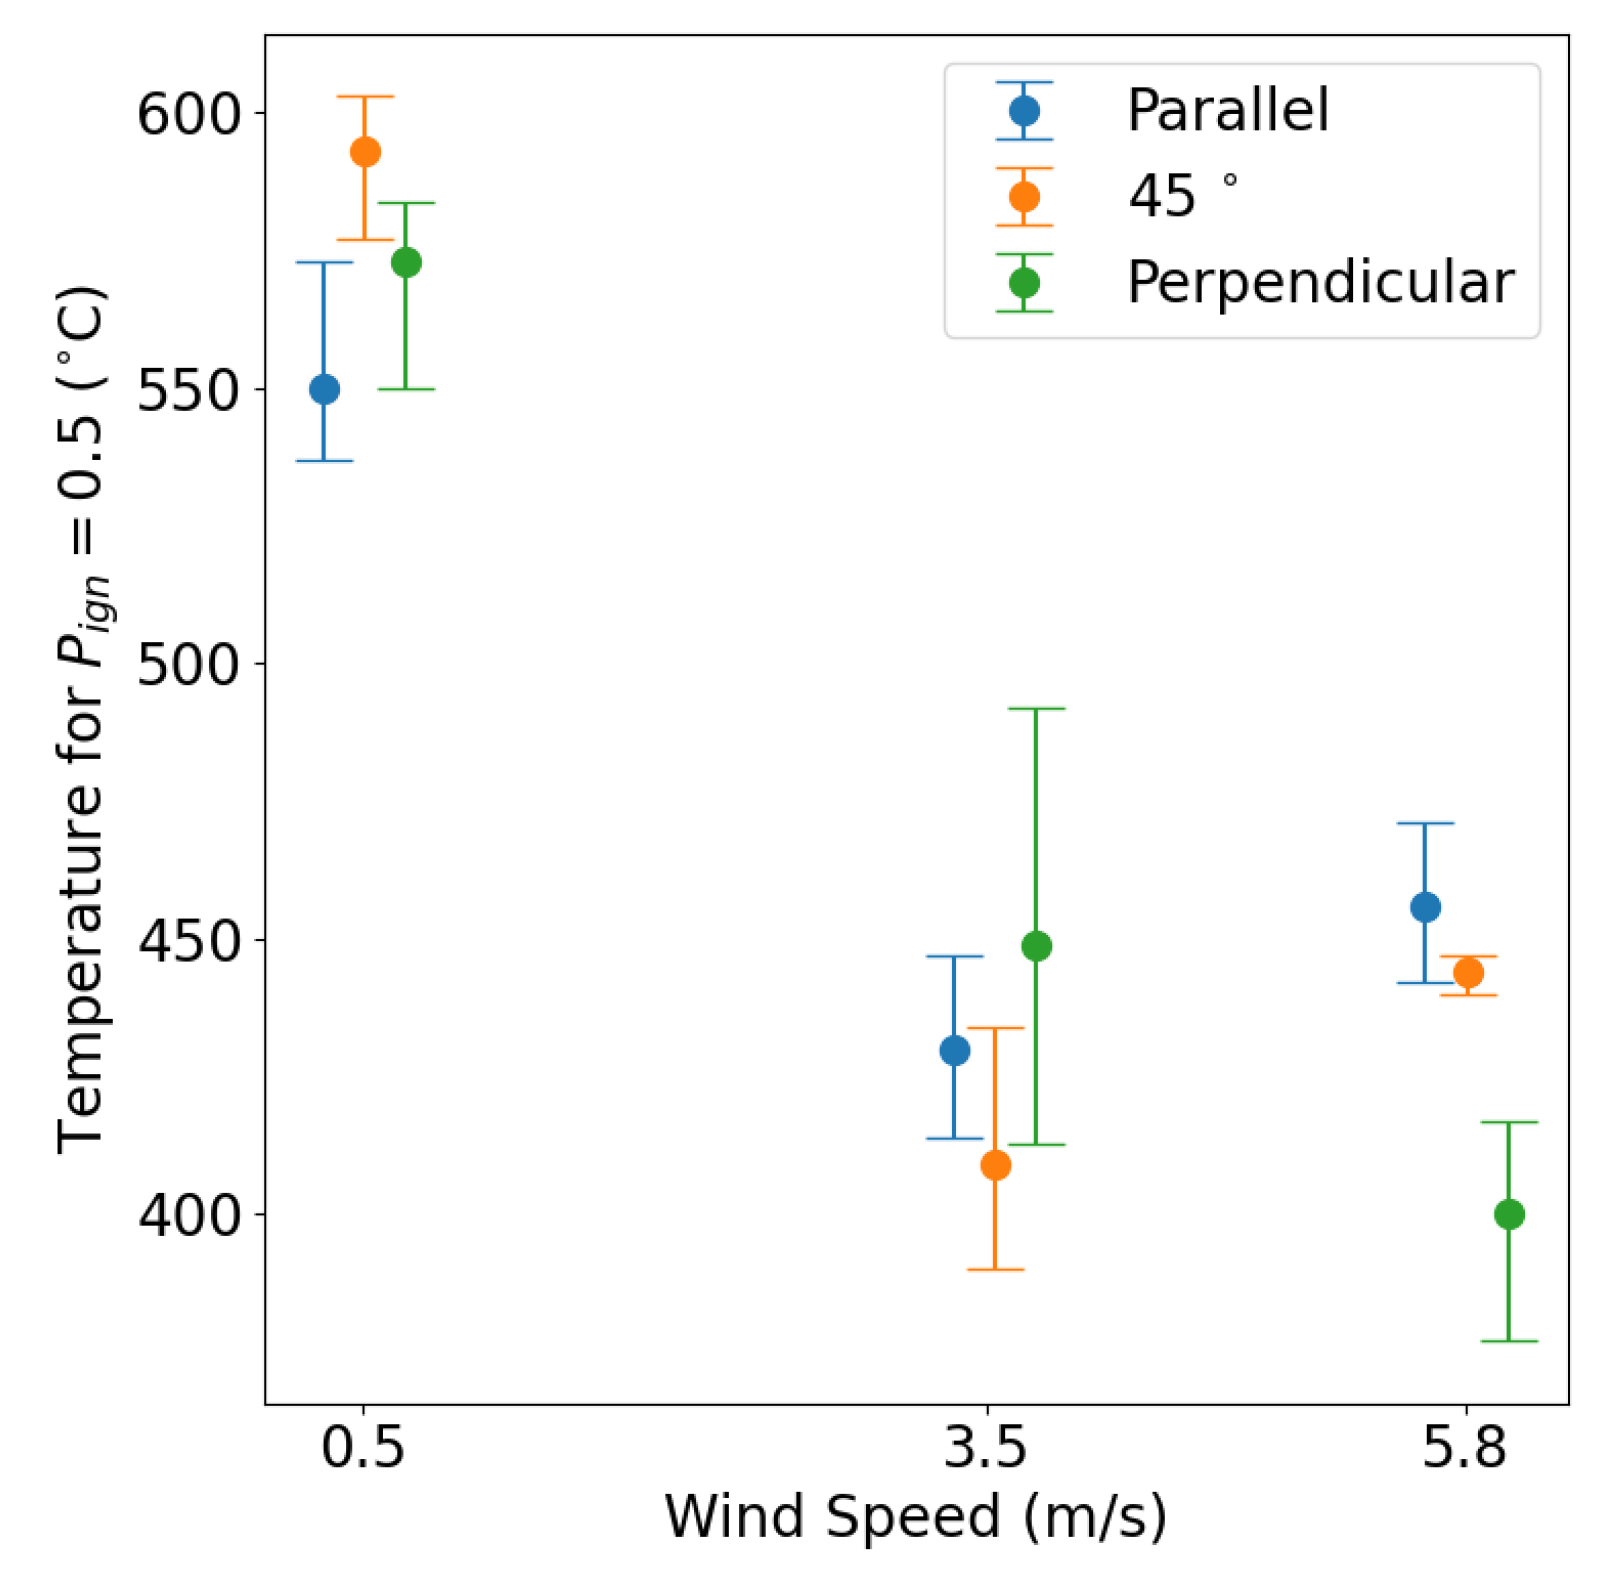
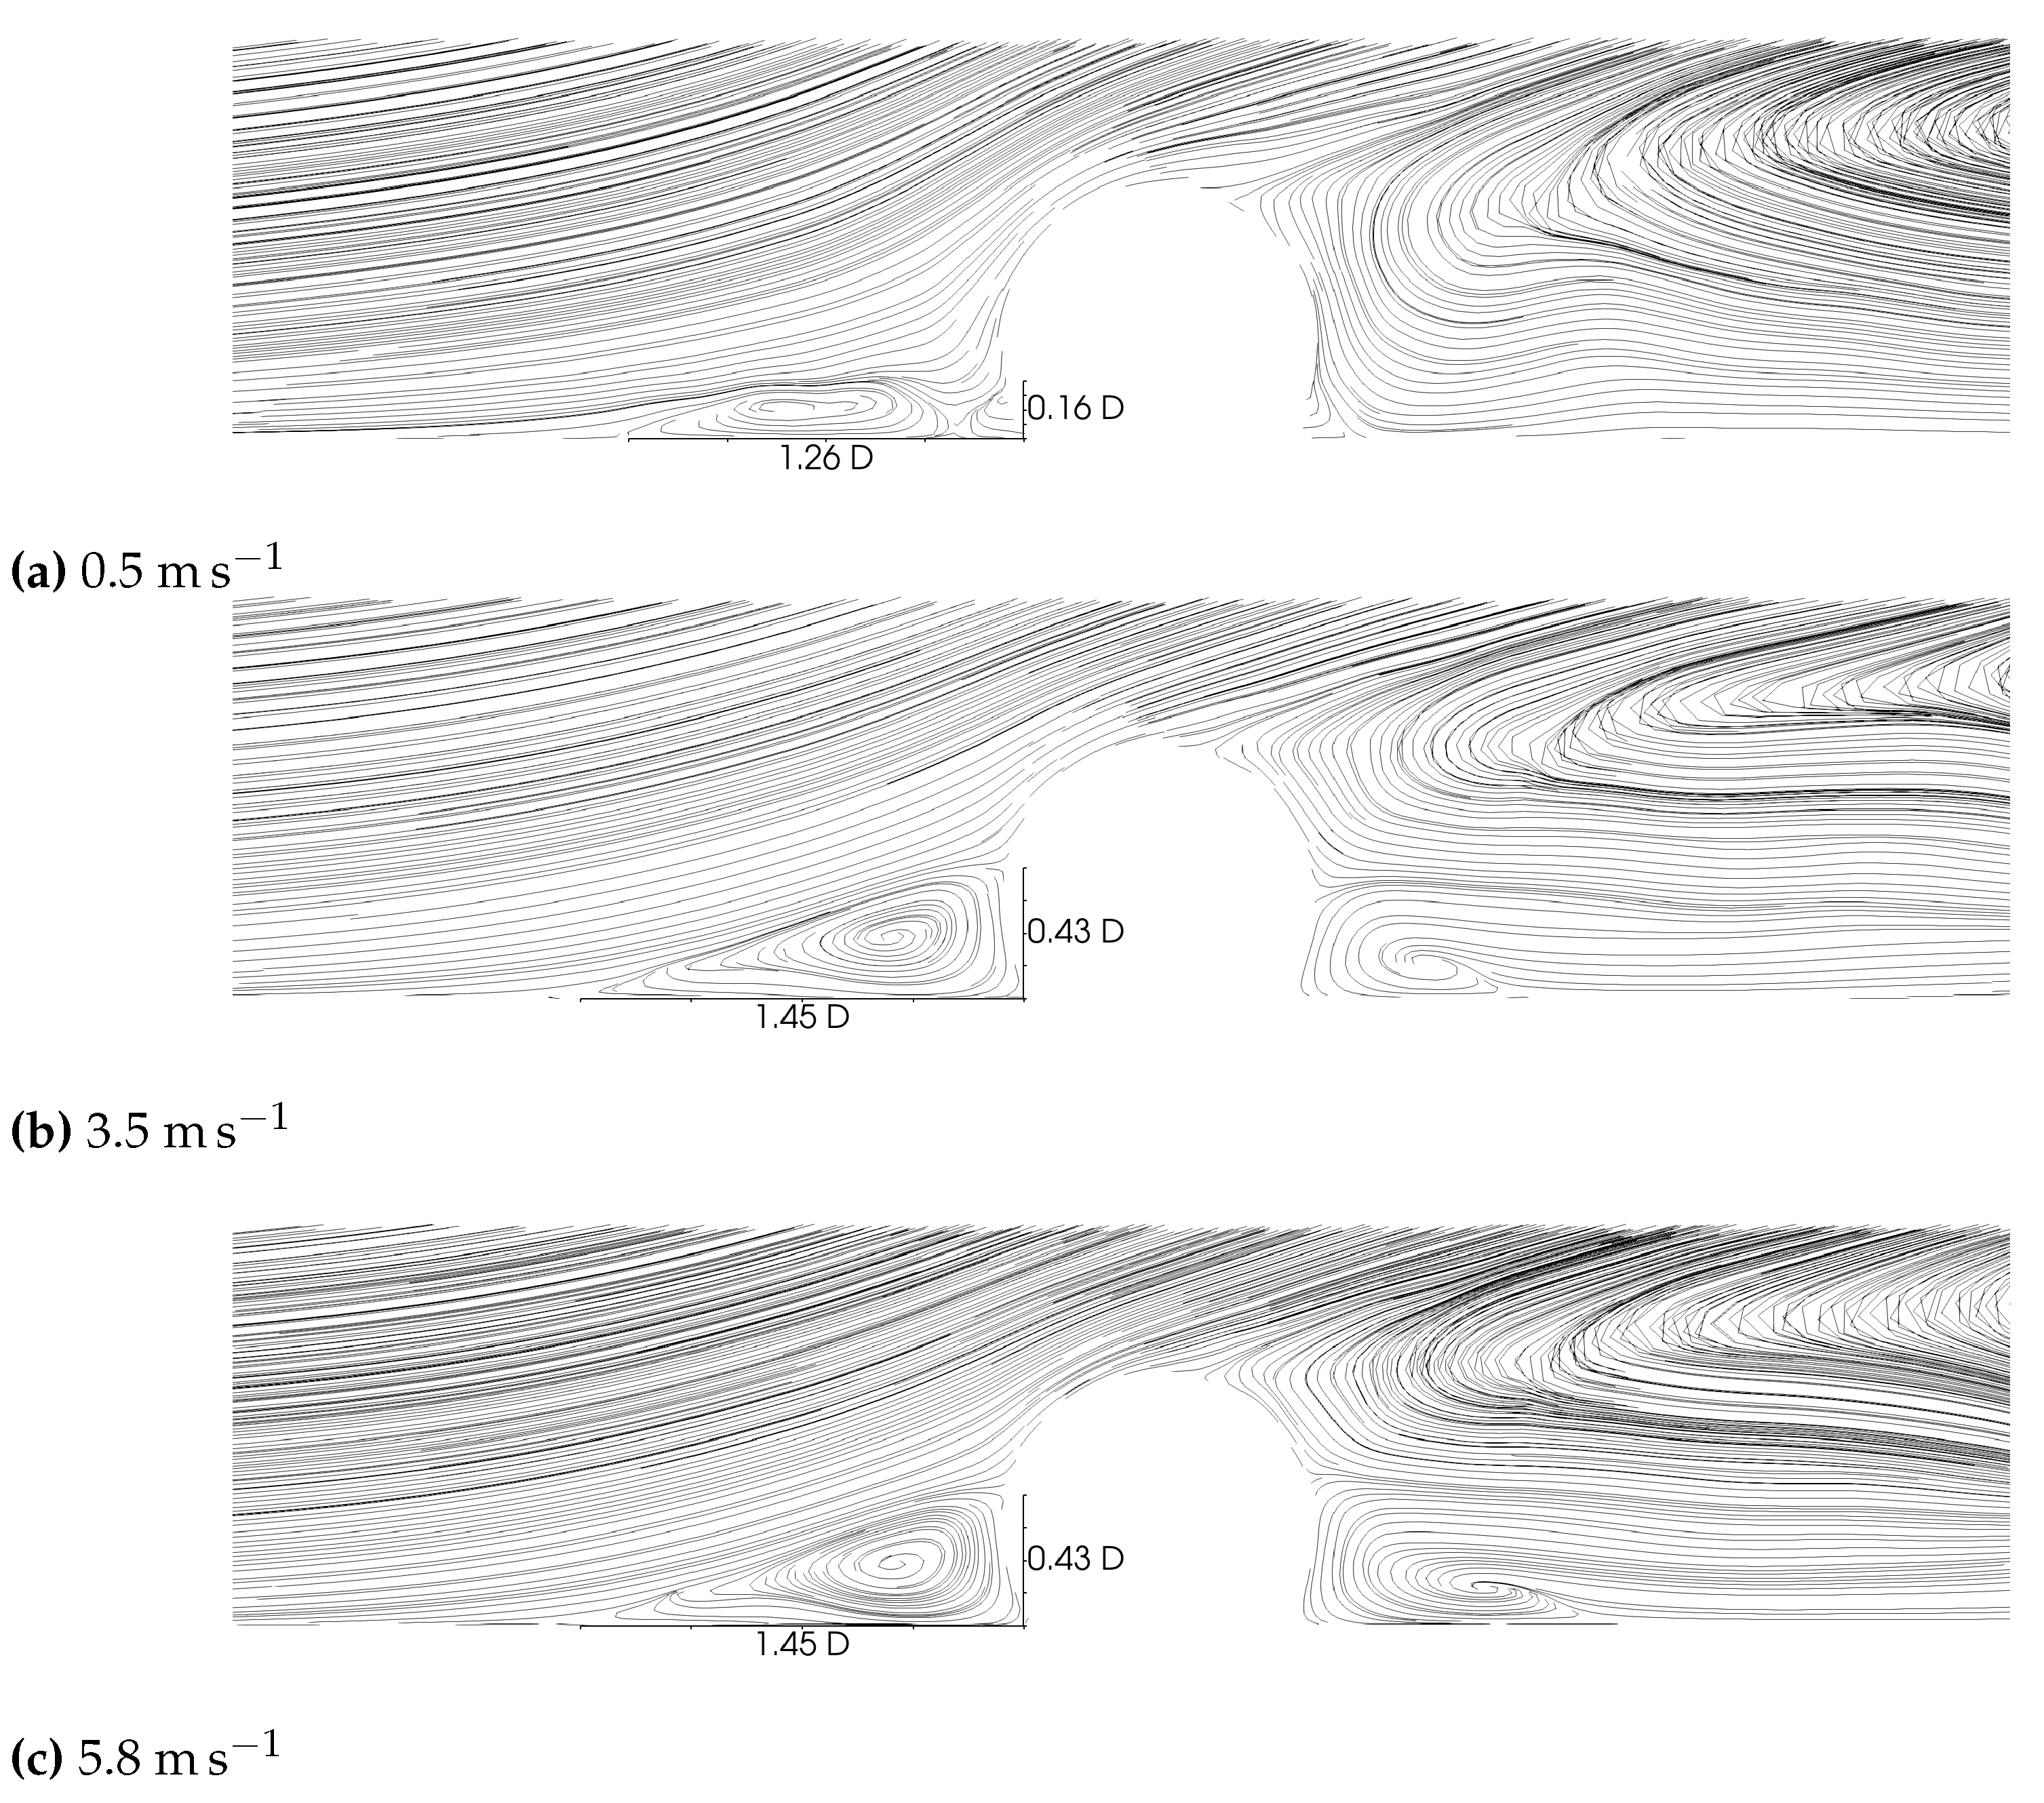
- Increasing the wind speed reduces the temperatures required for the flaming ignition of a fuel bed, at least for the conditions evaluated in this study. However, increases in wind speed do not result in a linear increase in ignition probability. In contrast, increasing the wind speed from quiescent to 5.8 reduces the temperature required for ignition by only 25%, suggesting a threshold above which increasing wind speed does not enhance ignition. It is noted that, at sufficient wind speeds, ignition is expected to be suppressed due to heat losses, although this limit was not found in the present study.
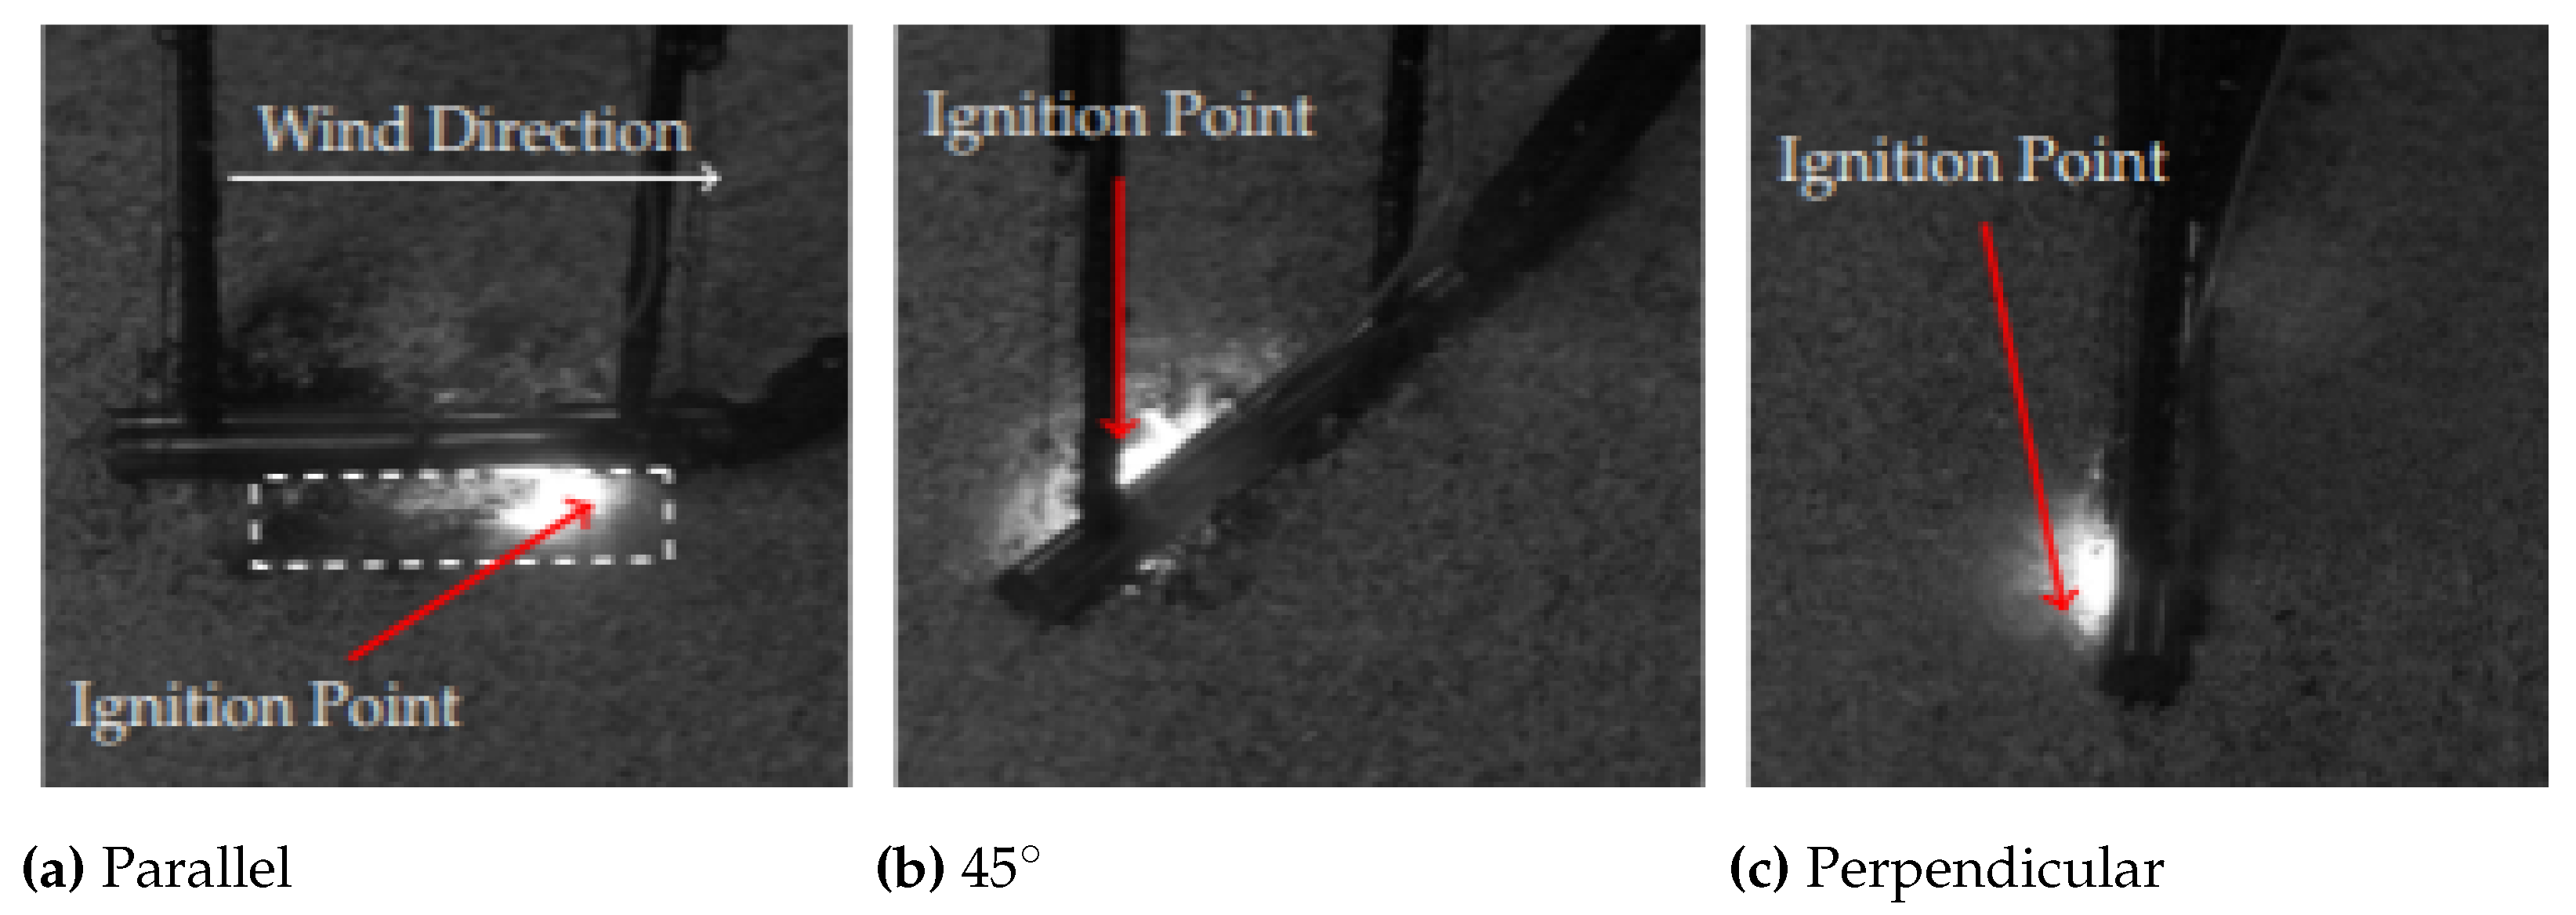
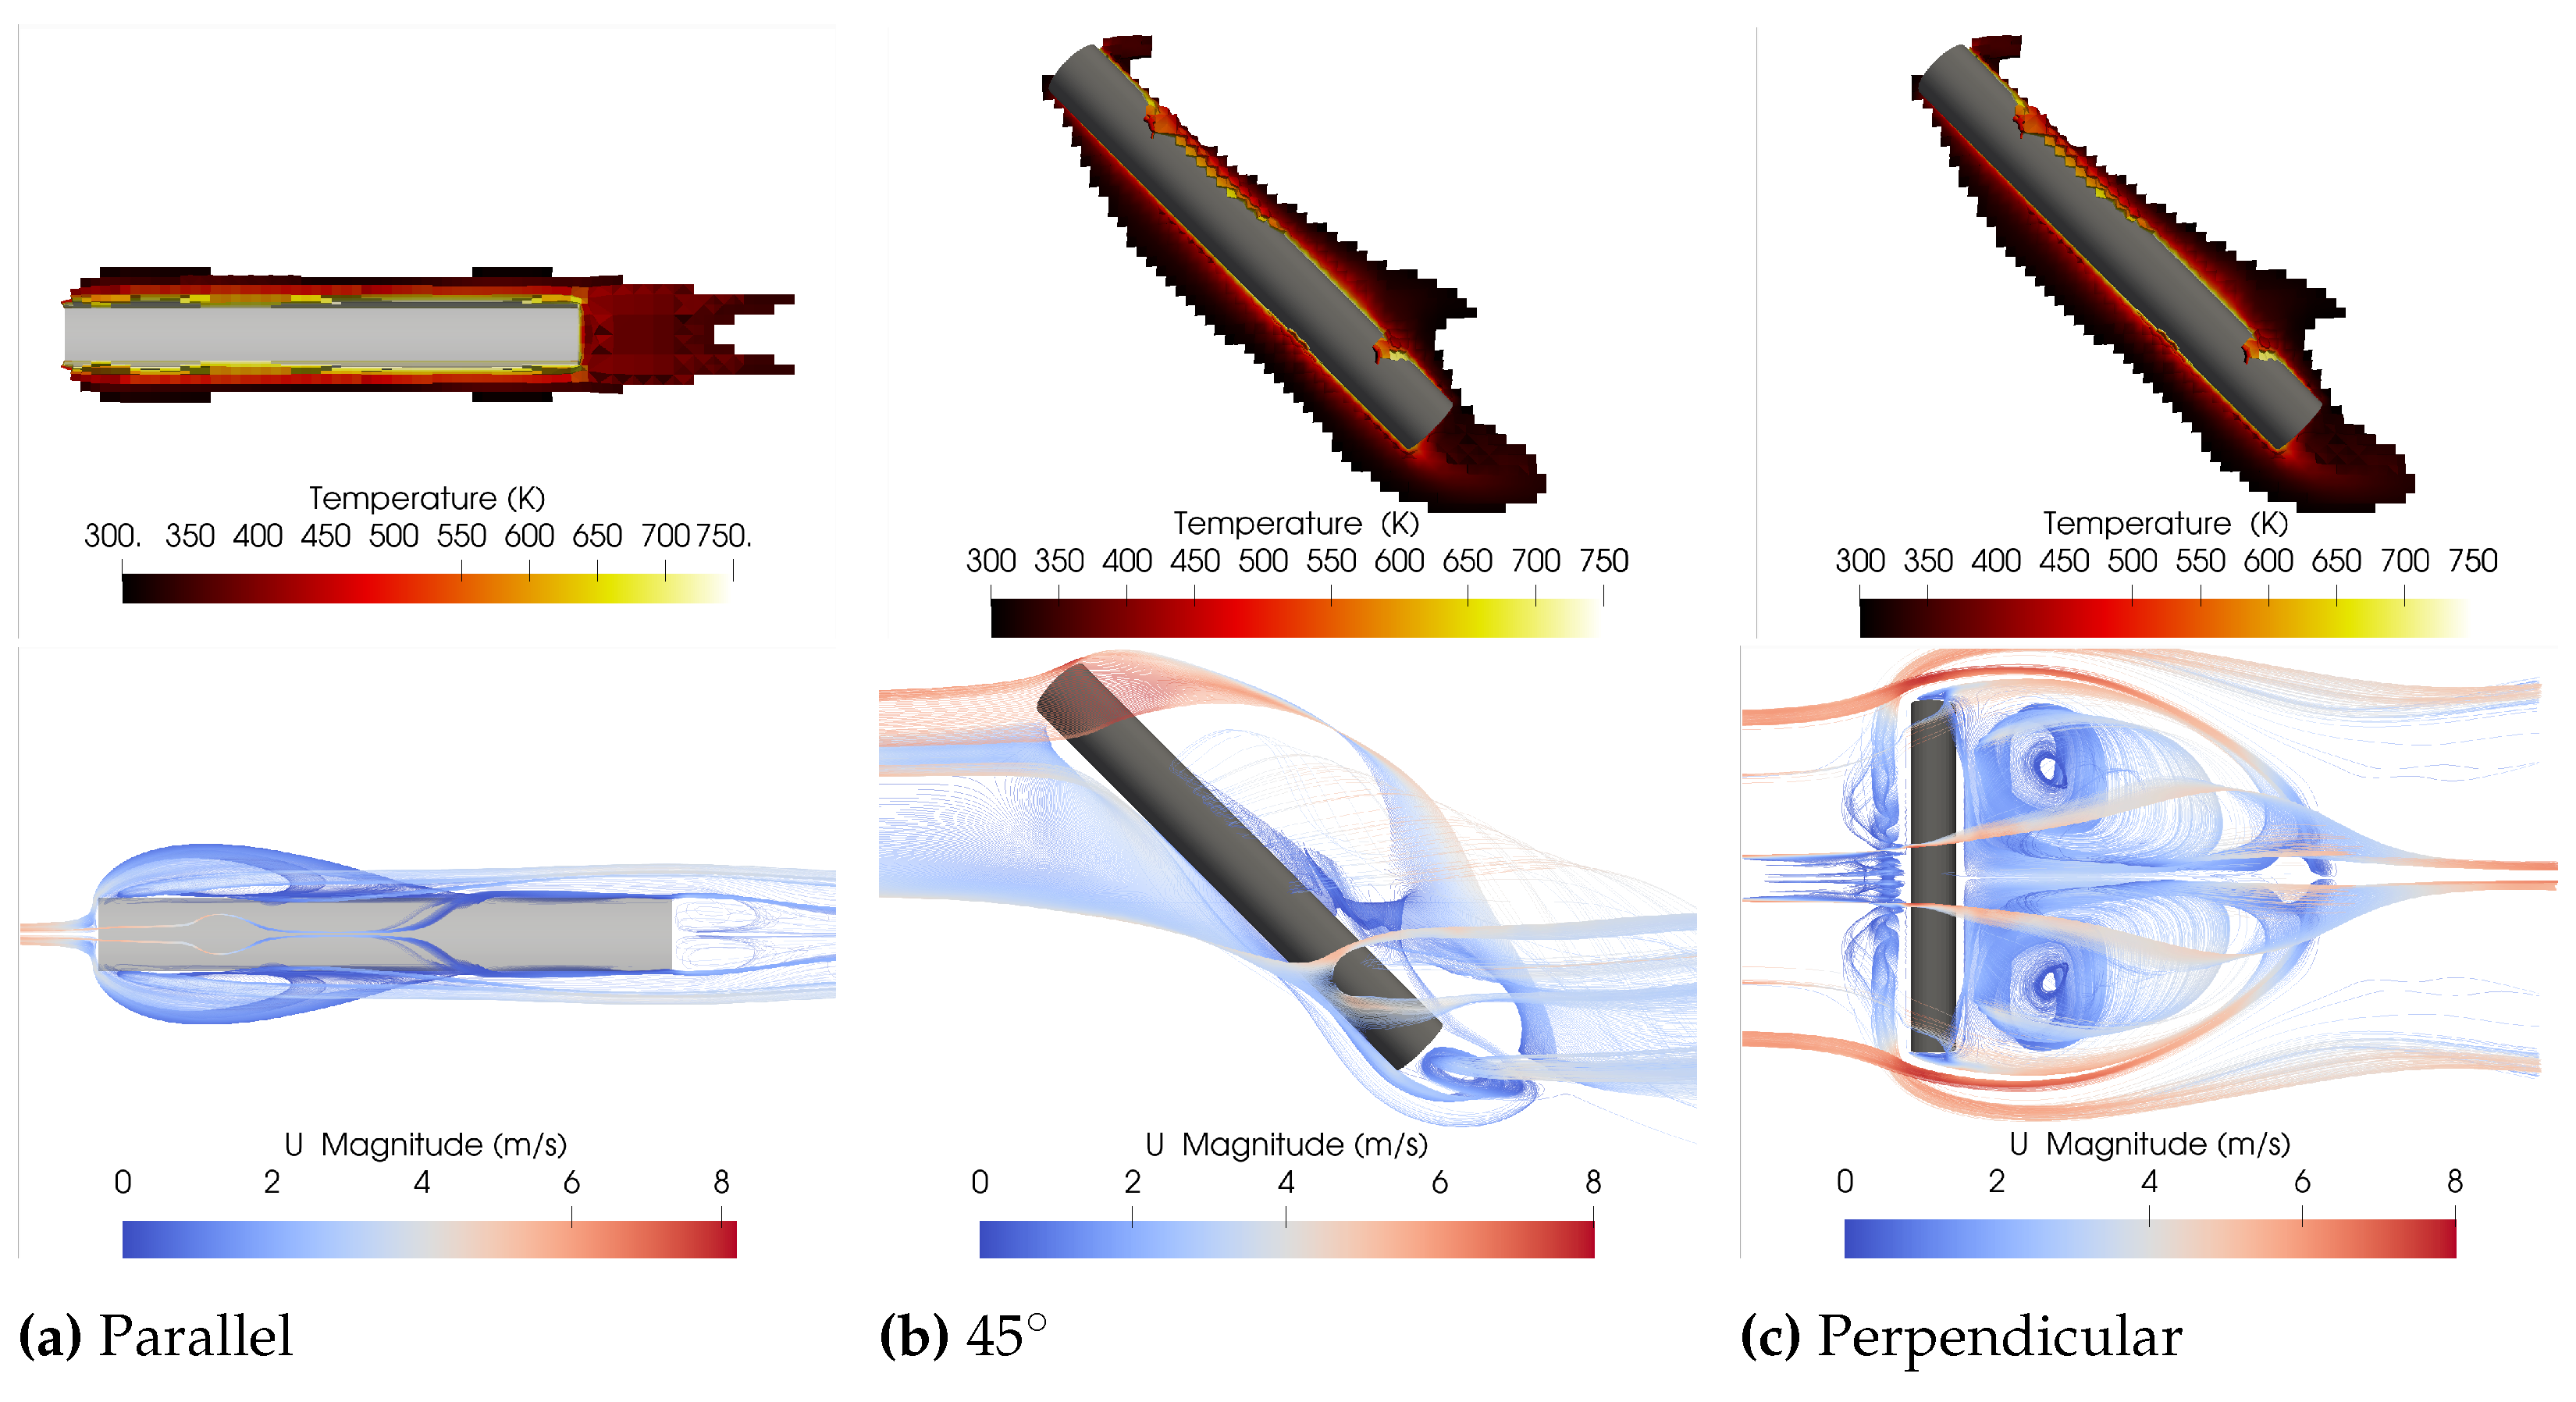
- The temperature at which ignition occurs in porous fuel beds such as Douglas fir is sensitive to the orientation of an object of constant temperature relative to the wind direction. Higher temperatures are typically required for ignition when the heater is parallel to the flow than when it is 45° or perpendicular to the flow. This sensitivity is attributable to differences in recirculation zones and residence times of air and pyrolysates near the hottest region of the heater.
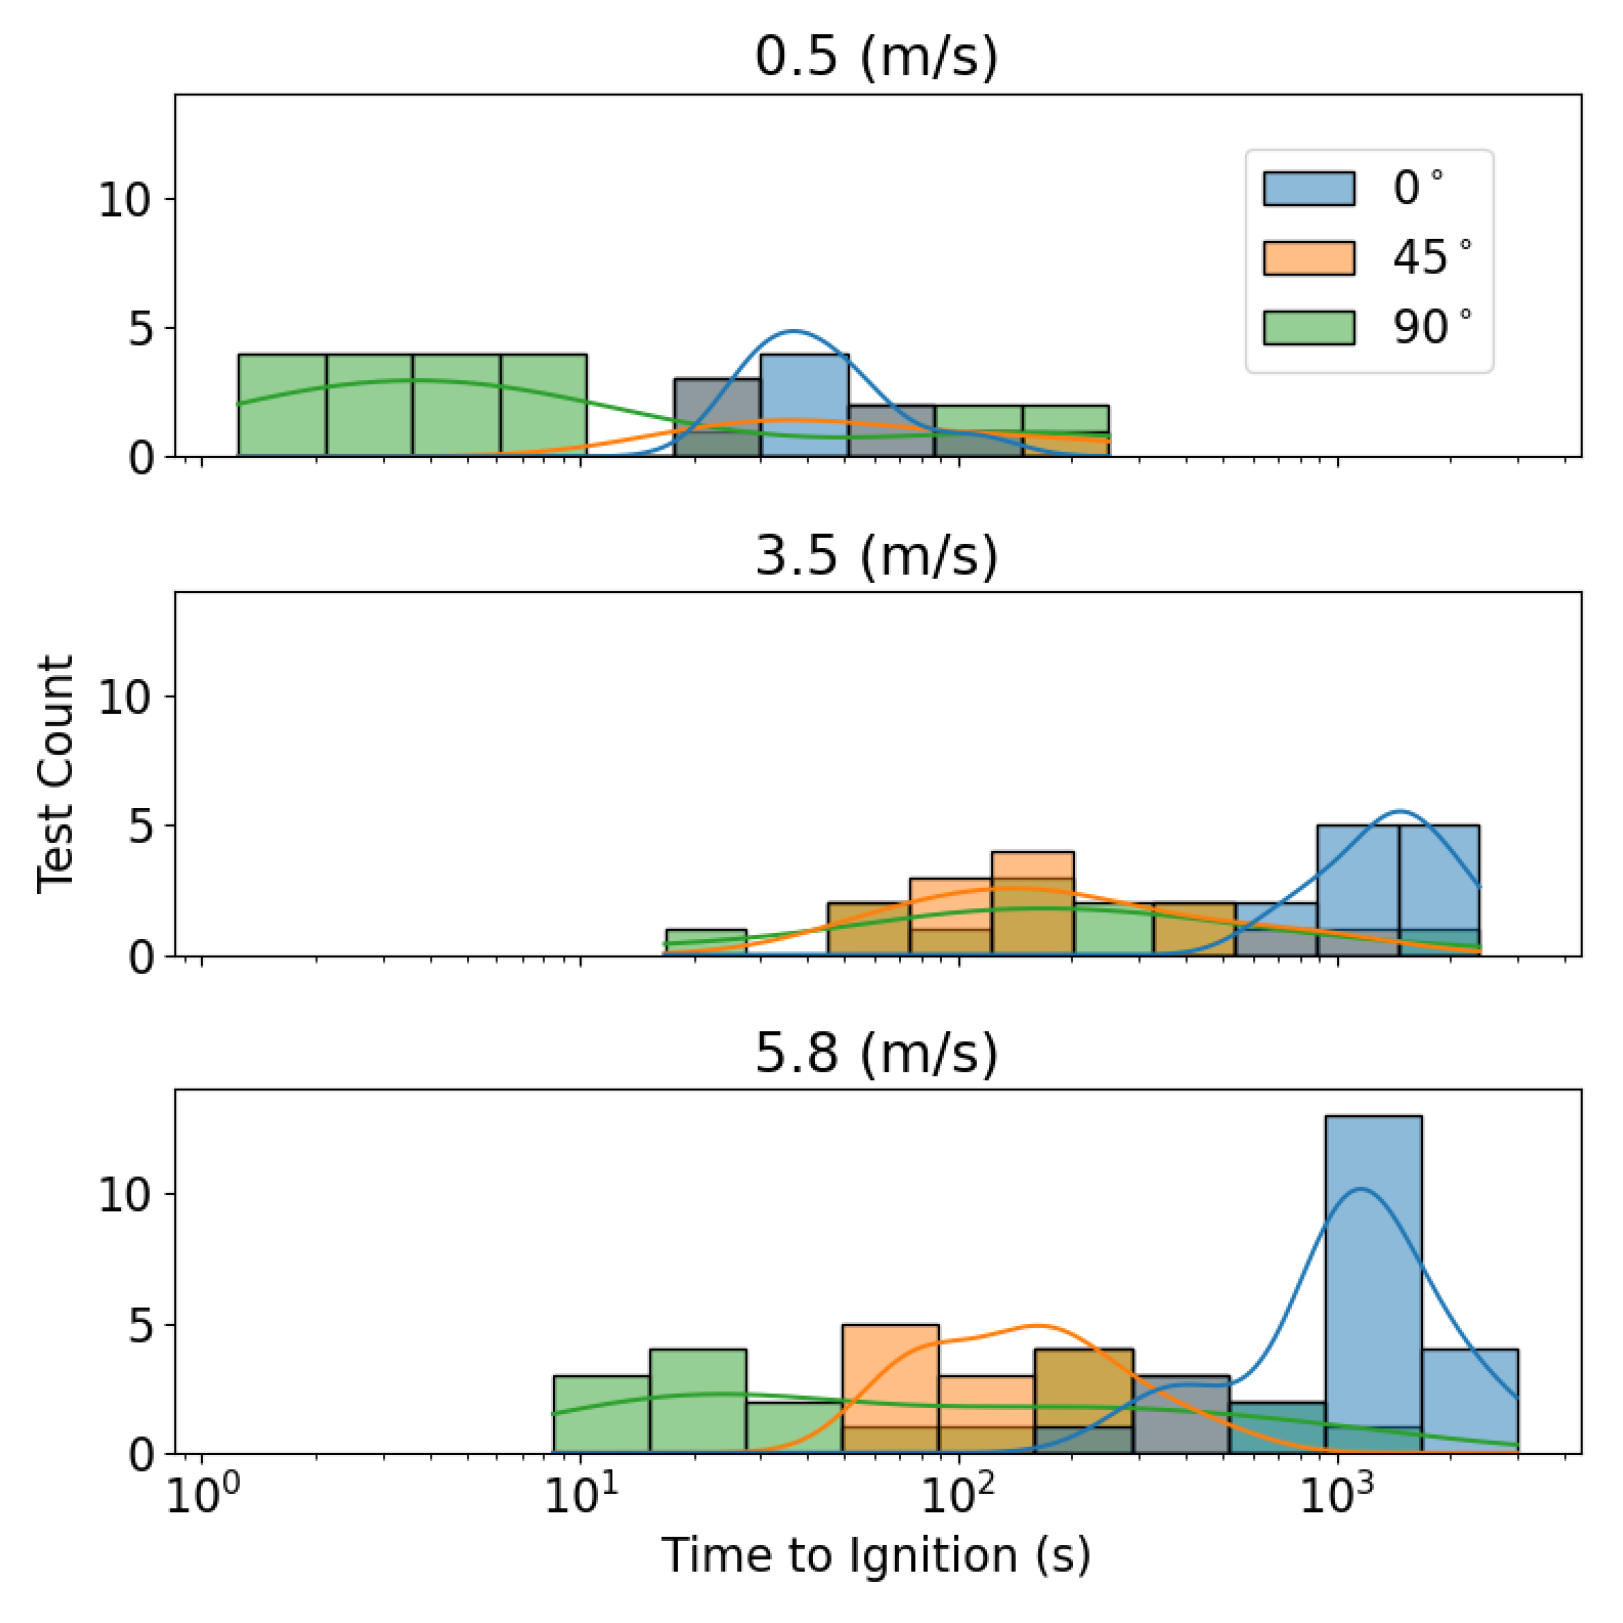
- Times required for flaming ignition of porous fuel beds are sensitive to the angle of a constant-temperature ignition source. A heater in a parallel orientation takes the longest time to ignite the fuel, followed by the 45° case, with the perpendicular case igniting the fuel in the shortest amount of time. High-speed images indicate that ignition typically occurs in regions where recirculation zones occur, as indicated by CFD calculations. The heightened propensity toward ignition is attributable to increased residence times of pyrolysates in the recirculation zones, as supported by calculations.
Author Contributions
Funding
Data Availability Statement
Conflicts of Interest
Abbreviations
| WUI | Wildland–Urban Interface |
| CFD | Computational Fluid Dynamics |
| PID | Proportional–Integral–Derivative |
| LES | Large Eddy Simulation |
References
- Marlon, J.R.; Bartlein, P.J.; Gavin, D.G.; Long, C.J.; Anderson, R.S.; Briles, C.E.; Brown, K.J.; Colombaroli, D.; Hallett, D.J.; Power, M.J.; et al. Long-term perspective on wildfires in the western USA. Proc. Natl. Acad. Sci. USA 2012, 109, 535–543. [Google Scholar] [CrossRef] [PubMed]
- Manzello, S.L.; Yamada, T.; Jeffers, A.; Ohmiya, Y.; Himoto, K.; Carlos Fernandez-Pello, A. Summary of workshop for fire structure interaction and urban and wildland-urban interface (WUI) Fires-operation Tomodachi-fire research. Fire Saf. J. 2013, 59, 122–131. [Google Scholar] [CrossRef]
- Barrett, K. Wildfires Destroy Thousands of Structures Each Year; Headwaters Economics: Bozeman, Montana, 2020. [Google Scholar]
- Manzello, S.L.; Suzuki, S. The world is burning: What exactly are firebrands and why should anyone care? Front. Mech. Eng. 2023, 8, 1–18. [Google Scholar] [CrossRef]
- Manzello, S.L.; Suzuki, S.; Gollner, M.J.; Fernandez-Pello, A.C. Role of firebrand combustion in large outdoor fire spread. Prog. Energy Combust. Sci. 2020, 76, 100801. [Google Scholar] [CrossRef] [PubMed]
- Maranghides, A.; Mell, W. A Case Study of a Community Affected by the Witch and Guejito Wildland Fires. Fire Technol. 2011, 47, 379–420. [Google Scholar] [CrossRef]
- Fernandez-Pello, A.C. Wildland fire spot ignition by sparks and firebrands. Fire Saf. J. 2017, 91, 2–10. [Google Scholar] [CrossRef]
- Ellis, P.F. The likelihood of ignition of dry-eucalypt forest litter by firebrands. Int. J. Wildland Fire 2015, 24, 225–235. [Google Scholar] [CrossRef]
- Hadden, R.M.; Scott, S.; Lautenberger, C.; Fernandez-Pello, C.C. Ignition of Combustible Fuel Beds by Hot Particles: An Experimental and Theoretical Study. Fire Technol. 2011, 47, 341–355. [Google Scholar] [CrossRef]
- Zak, C.D.; Urban, J.L.; Fernandez-Pello, C. Characterizing the flaming ignition of cellulose fuel beds by hot steel spheres. Combust. Sci. Technol. 2014, 186, 1618–1631. [Google Scholar] [CrossRef]
- Suzuki, S.; Manzello, S.L.; Hayashi, Y. The size and mass distribution of firebrands collected from ignited building components exposed to wind. Proc. Combust. Inst. 2013, 34, 2479–2485. [Google Scholar] [CrossRef]
- Suzuki, S.; Manzello, S. Experimental investigation of firebrand accumulation zones in front of obstacles. Fire Saf. J. 2017, 94, 1–7. [Google Scholar] [CrossRef]
- Suzuki, S.; Manzello, S.L. Role of accumulation for ignition of fuel beds by firebrands. Appl. Energy Combust. Sci. 2020, 1, 100002. [Google Scholar] [CrossRef]
- Manzello, S.L. Enabling the investigation of structure vulnerabilities to wind-Driven firebrand showers in wildland-Urban Interface (WUI) fires. Fire Saf. Sci. 2014, 11, 83–96. [Google Scholar] [CrossRef]
- Hakes, R.S.; Salehizadeh, H.; Weston-Dawkes, M.J.; Gollner, M.J. Thermal characterization of firebrand piles. Fire Saf. J. 2019, 104, 34–42. [Google Scholar] [CrossRef]
- Tao, Z.; Bathras, B.; Kwon, B.; Biallas, B.; Gollner, M.J. Effect of firebrand size and geometry on heating from a smoldering pile under wind. Fire Saf. J. 2020, 120, 103031. [Google Scholar] [CrossRef]
- Salehizadeh, H.; Hakes, R.S.; Gollner, M.J. Critical ignition conditions of structural materials by cylindrical firebrands. Front. Mech. Eng. 2021, 1–13. [Google Scholar] [CrossRef]
- Filkov, A.; Kasymov, D.; Zima, V.; Matvienko, O. Experimental investigation of surface litter ignition by bark firebrands. In AIP Conference Proceedings; AIP Publishing: Melville, NY, USA, 2016; Volume 1698. [Google Scholar] [CrossRef]
- Manzello, S.L.; Cleary, T.G.; Shields, J.R.; Yang, J.C. On the ignition of fuel beds by firebrands. Fire Mater. 2006, 30, 77–87. [Google Scholar] [CrossRef]
- Manzello, S.L.; Cleary, T.G.; Shields, J.R.; Yang, J.C. Ignition of mulch and grasses by firebrands in wildlandurban interface fires. Int. J. Wildland Fire 2006, 15, 427–431. [Google Scholar] [CrossRef]
- Matvienko, O.V.A.; Kasymov, D.P.A.; Filkov, A.I. Simulation of fuel bed ignition by wildland firebrands. Int. J. Wildland Fire 2018, 27, 550–561. [Google Scholar] [CrossRef]
- Plucinski, M.P.; Anderson, W.R. Laboratory determination of factors influencing successful point ignition in the litter layer of shrubland vegetation. Int. J. Wildland Fire 2008, 17, 628–637. [Google Scholar] [CrossRef]
- Richter, F.; Bathras, B.; Barbetta Duarte, J.; Gollner, M.J. The Propensity of Wooden Crevices to Smoldering Ignition by Firebrands. Fire Technol. 2022, 58, 2167–2188. [Google Scholar] [CrossRef]
- Ellis, P.F.M. Fuelbed ignition potential and bark morphology explain the notoriety of the eucalypt messmate ’stringybark’ for intense spotting. Int. J. Wildland Fire 2011, 20, 897–907. [Google Scholar] [CrossRef]
- Ganteaume, A.; Lampin-Maillet, C.; Guijarro, M.; Hernando, C.; Jappiot, M.; Fonturbel, T.; Ṕrez Gorostiaga, P.; Vega, J.A. Spot fires: Fuel bed flammability and capability of firebrands to ignite fuel beds. Int. J. Wildland Fire 2009, 18, 951–969. [Google Scholar] [CrossRef]
- Wang, S.; Huang, X.; Chen, H.; Liu, N. Interaction between flaming and smouldering in hot-particle ignition of forest fuels and effects of moisture and wind. Int. J. Wildland Fire 2017, 26, 71–81. [Google Scholar] [CrossRef]
- Manzello, S.L.; Maranghides, A.; Shields, J.R.; Mell, W.E.; Hayashi, Y.; Nii, D. Mass and size distribution of firebrands generated from burning Korean pine (Pinus koraiensis) trees. Fire Mater. 2009, 33, 21–31. [Google Scholar] [CrossRef]
- Rivera, J.; Hernández, N.; Consalvi, J.L.; Reszka, P.; Contreras, J.; Fuentes, A. Ignition of wildland fuels by idealized firebrands. Fire Saf. J. 2020, 120, 103036. [Google Scholar] [CrossRef]
- Zhu, L.; Urban, J.L. Cooperative spot ignition by idealized firebrands: Impact of thermal interaction in the fuel. Fire Saf. J. 2023, 135, 103701. [Google Scholar] [CrossRef]
- Reszka, P.; Cruz, J.; Valdivia, J.; González, F.; Rivera, J.; Carvajal, C.; Fuentes, A. Ignition delay times of live and dead pinus radiata needles. Fire Saf. J. 2020, 112, 102948. [Google Scholar] [CrossRef]
- Bean, D.; Blunck, D.L. Sensitivities of Porous Beds and Plates to Ignition by Firebrands. Front. Mech. Eng. 2021, 7, 1–11. [Google Scholar] [CrossRef]
- Bearinger, E.D.; Hodges, J.L.; Yang, F.; Rippe, C.M.; Lattimer, B.Y. Localized heat transfer from firebrands to surfaces. Fire Saf. J. 2021, 120, 103037. [Google Scholar] [CrossRef]
- Bean, D. Ignition of Fuel Beds by Firebrands. Ph.D. Thesis, Oregon State University, Corvallis, OR, USA, 2022. [Google Scholar]
- Wu, C.F.; Tian, Y. Three-phase optimal design of sensitivity experiments. J. Stat. Plan. Inference 2014, 149, 1–15. [Google Scholar] [CrossRef]
- Burke, S.; Truett, L. Test Strategies for Experiments with a Binary Response and Single Stress Factor Best Practice; Technical Report June; Air Force Institute of Technology: Dayton, OH, USA, 2017. [Google Scholar]
- Pedregosa, F.; Varoquaux, G.; Gramfort, A.; Michel, V.; Thirion, B.; Grisel, O.; Blondel, M.; Prettenhofer, P.; Weiss, R.; Dubourg, V.; et al. Scikit-learn: Machine Learning in Python. J. Mach. Learn. Res. 2011, 12, 2825–2830. [Google Scholar]
- OpenFOAM. The OpenFOAM Foundation; OpenCFD: Reading, UK, 2020. [Google Scholar]
- Incropera, F.; Dewitt, D.; Bergman, T.; Lavine, A. Fundamentals of Heat and Mass Transfer, 7th ed.; Wiley: Hoboken, NJ, USA, 2011; pp. 119–121. [Google Scholar]
- Idaho National Laboratory. Bioenergy Feedstock Library; Technical report; U.S. Department of Energy: Washington, DC, USA, 2020.
- Dhahak, A.; Bounaceur, R.; Le Dreff-Lorimier, C.; Schmidt, G.; Trouve, G.; Battin-Leclerc, F. Development of a detailed kinetic model for the combustion of biomass. Fuel 2019, 242, 756–774. [Google Scholar] [CrossRef]
- Ranzi, E.; Cuoci, A.; Faravelli, T.; Frassoldati, A.; Migliavacca, G.; Pierucci, S.; Sommariva, S. Chemical kinetics of biomass pyrolysis. Energy Fuels 2008, 22, 4292–4300. [Google Scholar] [CrossRef]
- Jiang, H. Separation angle for flow past a circular cylinder in the subcritical regime. Phys. Fluids 2020, 32, 014106. [Google Scholar] [CrossRef]
Disclaimer/Publisher’s Note: The statements, opinions and data contained in all publications are solely those of the individual author(s) and contributor(s) and not of MDPI and/or the editor(s). MDPI and/or the editor(s) disclaim responsibility for any injury to people or property resulting from any ideas, methods, instructions or products referred to in the content. |
© 2025 by the authors. Licensee MDPI, Basel, Switzerland. This article is an open access article distributed under the terms and conditions of the Creative Commons Attribution (CC BY) license (https://creativecommons.org/licenses/by/4.0/).
Share and Cite
Bean, D.; Blunck, D.L. Influence of Recirculation Zones on Flaming Ignition of Porous Wood Fuel Beds. Fire 2025, 8, 141. https://doi.org/10.3390/fire8040141
Bean D, Blunck DL. Influence of Recirculation Zones on Flaming Ignition of Porous Wood Fuel Beds. Fire. 2025; 8(4):141. https://doi.org/10.3390/fire8040141
Chicago/Turabian StyleBean, Derek, and David L. Blunck. 2025. "Influence of Recirculation Zones on Flaming Ignition of Porous Wood Fuel Beds" Fire 8, no. 4: 141. https://doi.org/10.3390/fire8040141
APA StyleBean, D., & Blunck, D. L. (2025). Influence of Recirculation Zones on Flaming Ignition of Porous Wood Fuel Beds. Fire, 8(4), 141. https://doi.org/10.3390/fire8040141