1. Introduction
Wildfires are catastrophic ecological phenomena with an important role in the dynamics of many ecosystems worldwide, shaping them and influencing their evolution [
1,
2]. Although wildfires are an integral part of the natural cycles of many ecosystems, their increasing frequency and intensity in recent decades have raised concerns about their impacts. Wildfires can significantly impact the composition, structure, and functioning of ecosystems, as well as their capacity to provide valuable services for human well-being. These disturbance events also represent challenging natural and technological risks [
3,
4,
5] with pervasive effects on public health [
6] as well as water quantity and quality [
7,
8].
Despite the advances in prevention, wildfire events have increased in frequency and size, particularly across the Mediterranean region [
9,
10,
11]. Factors such as global climate change and long-term fuel accumulation due to rural abandonment or inadequate forest management have aggravated these events [
12]. This increasing occurrence of wildfires represents a critical societal issue that calls for effective tools for evaluating and forecasting their impacts on ecosystems to support effective fire prevention and fighting.
Wildfires have been the subject of intensive study over the past decades, given their devastating impact on ecosystems, local economies, and human well-being [
2,
13,
14,
15]. Understanding these phenomena encompasses everything from their origin to their long-term effects on landscape resilience. Therefore, effective assessment and monitoring of wildfires are critical, not only for better understanding these events but also for mitigating their impacts and implementing post-fire recovery strategies.
In this context, remote sensing technologies have played a relevant role. Remote sensing has become a fundamental tool for comprehensive wildfire management, as it provides extensive spatial and temporal data and enables the analysis and understanding of wildfires and their impacts at different stages [
16,
17,
18,
19,
20]. As wildfires become more frequent and intense, remote sensing in wildfire management is becoming increasingly useful for preventing, detecting, and monitoring active fires, as well as large-scale assessment and monitoring of their impacts, enabling more effective management of post-fire recovery efforts.
One of the contributions of remote sensing applications in wildfire management is their use in evaluating burn severity [
18,
21,
22,
23,
24], improving post-fire assessments, and planning recovery efforts. Burn severity seeks to understand the impacts beyond the immediate consequence of the fire, namely how fire intensity affects environmental conditions and functions [
25]. In this regard, the framework proposed by Marcos et al. [
26] emphasizes the importance of metrics derived from satellite images to assess post-fire recovery and resilience across distinct dimensions of ecosystem functioning related to energy-matter flows (related to carbon, water, and energy exchanges).
Several remotely sensed indices have been used to quantify the severity of burned areas [
27,
28,
29,
30], with extensive use of Normalized Burn Ratio (NBR) to assess burned areas [
18,
31]. This spectral index has been used in the definition of several derived indicators of burn severity, such as the Delta Normalized Burn Ratio (dNBR) [
21], the Relative dNBR (RdNBR) [
32] and the Relativized Burn Ratio (RBR) [
33]. The use of remote sensing imagery to produce severity indicators allows the regular and timely provision of large-scale datasets, which are fundamental to assess wildfires’ ecological impact, fostering better decision-making in the aftermath of wildfires.
The emergence of new remote sensing platforms, technologies and algorithms offers significant potential for wildfire monitoring and management. In particular, the rise of cloud computing platforms, such as Google Earth Engine (GEE), Microsoft’s Planetary Computer, and Earth on Amazon Web Services, has enabled the mobilization, processing and analysis of petabyte-scale remote sensing datasets [
34]. However, using these platforms for remote sensing data processing often requires specialized knowledge and programming skills to effectively use the datasets and deliver meaningful results [
35,
36]. Decision-makers, managers, and GIS professionals who could benefit from these tools often face significant technical challenges. To address this issue, it is essential to develop freely accessible and user-friendly solutions that unlock the potential of remote sensing data and products, particularly for wildfire-related applications.
Web-based applications and open-data repositories can play an important role in bridging the gap between the data requirements for managing wildfires and the use of cutting-edge technologies (such as cloud-based geospatial processing) by making information from remote sensing sources more accessible. Additionally, they can facilitate a wider group of stakeholders to participate in and profit from research data and products related to remote sensing.
Several datasets (all with fixed analysis intervals) have been made available in the context of burn severity, including the global burn severity database (MOSEV) from 2000 to 2020 [
37], the global forest burn severity (GFBS) dataset from 2003 to 2016 [
38], the Landscape Fire Scars Database for Chile from 1985 to 2018 [
39] and, recently, the Multidecadal satellite-derived Portuguese Burn Severity Atlas from 1984 to 2022 (for fire perimeters ≥500 hectares from 1984 and ≥100 hectares from 2021 [
40]).
Web applications are also available, offering graphical user interfaces to allow the access, filter and download of burn severity data, including: the access to the Monitoring Trends in Burn Severity (MTBS) data available for US [
41] through its data explorer (
https://apps.fs.usda.gov/lcms-viewer/mtbs.html, accessed on 21 February 2025) or its Interactive Viewer (
https://www.mtbs.gov/viewer/, accessed on 21 February 2025); the Burn Intensity Delta Greenness Estimate (BRIDGE) that allows to generate near real-time wildland-fire burn scar maps b(
https://cimss.ssec.wisc.edu/bridge/, accessed on 21 February 2025); the European Forest Fire Information System (EFFIS) that provides fire risk forecast and fire danger assessment [
42], including a layer on burn severity through its current situation viewer (
https://forest-fire.emergency.copernicus.eu/apps/effis_current_situation/, accessed on 21 February 2025); and FIREMAP application (
https://firemap.unileon.es; registration required, accessed on 21 February 2025) based on Google Earth Engine, which allows fire perimeters to be mapped, burn severity spectral indices to be computed, and post-fire recovery to be calculated [
35].
However, despite the increasing availability of remote sensing data and products, there is still a lack of publicly accessible, updated, and standardized datasets on burn severity, particularly in fire-prone regions like those with a Mediterranean climate. In this context, this paper describes the development of a fully open-access platform that allows users to obtain the benefits of satellite remote sensing technologies to access severity indicators of burned areas. The platform is grounded in a new approach that leverages the computational capabilities of Google Earth Engine to automate data processing and the calculation of burn severity indicators. To the best of our knowledge, there is no comprehensive, updated, validated, multisource (including MODIS, Landsat-5, -7, and -8, and Sentinel-2), multi-indicator, multitemporal dataset and related data service on burn severity for mainland Portugal. This novel platform (and related data products), developed as part of the SeverusPT research project (URL:
https://doi.org/10.54499/PCIF/RPG/0170/2019;
https://severus.pt/en, accessed on 21 February 2025), aims to deliver relevant and standardized information for evaluating and predicting burn severity. It focuses on mainland Portugal and provides regularly updated data to enhance post-fire knowledge and management. The platform has been implemented to facilitate the access, search, visualization, and downloading of precalculated and continuously updated data on burn severity based on the integration of advanced data analysis of satellite image time series and a web data portal with a graphical interface. The strategy chosen in the platform’s development aims to create a robust solution that provides access to regularly updated data on burn severity (unlike solutions based on datasets that are “static” covering specific periods and therefore lacking up-to-dateness). In this regard, readily available data is often the most critical aspect of post-fire assessments, allowing for the prioritization of urgent interventions to stabilize burned areas, identify vulnerable sites, and mitigate/compensate for damages. The platform allows direct access (and via WMS–Web Map Service) to a wide range of precomputed severity indicators, unlike platforms that rely on on-demand computation and, therefore, are constrained by limited computing resources. It also includes all wildfire perimeters for a given year, enabling streamlined comparisons and trend assessments.
The following sections describe the architecture, technologies, and workflows that support the novel SeverusPT platform, followed by the presentation of results and a discussion of the potential uses and limitations of the web platform and the foreseen future developments.
2. Materials and Methods
The web-based platform of the SeverusPT (URL:
https://geoportal-dev.severus.pt; accessed 21 February 2025) project was designed to provide an innovative tool for computing and sharing free, open geospatial data on burn severity indicators for mainland Portugal. The system aimed to use well-established methodologies and spectral indices derived from remotely sensed image time series from Landsat, MODIS, and Sentinel-2 missions to calculate and regularly update burn severity products through an automated computational workflow. The precalculated products are accessible through a user-oriented web data portal described below in detail.
2.1. Architecture, Technologies, and Workflow of Web-Based Platform
The platform was designed as a centralized repository for sharing and distributing multitemporal, multisource, and multidimensional assessment data (and metadata) on burn severity through standardized products. Moreover, the platform can provide, in a periodic and timely manner, relevant, updated, and standardized information on the assessment of burn severity based on semi-automated routines and calculation libraries.
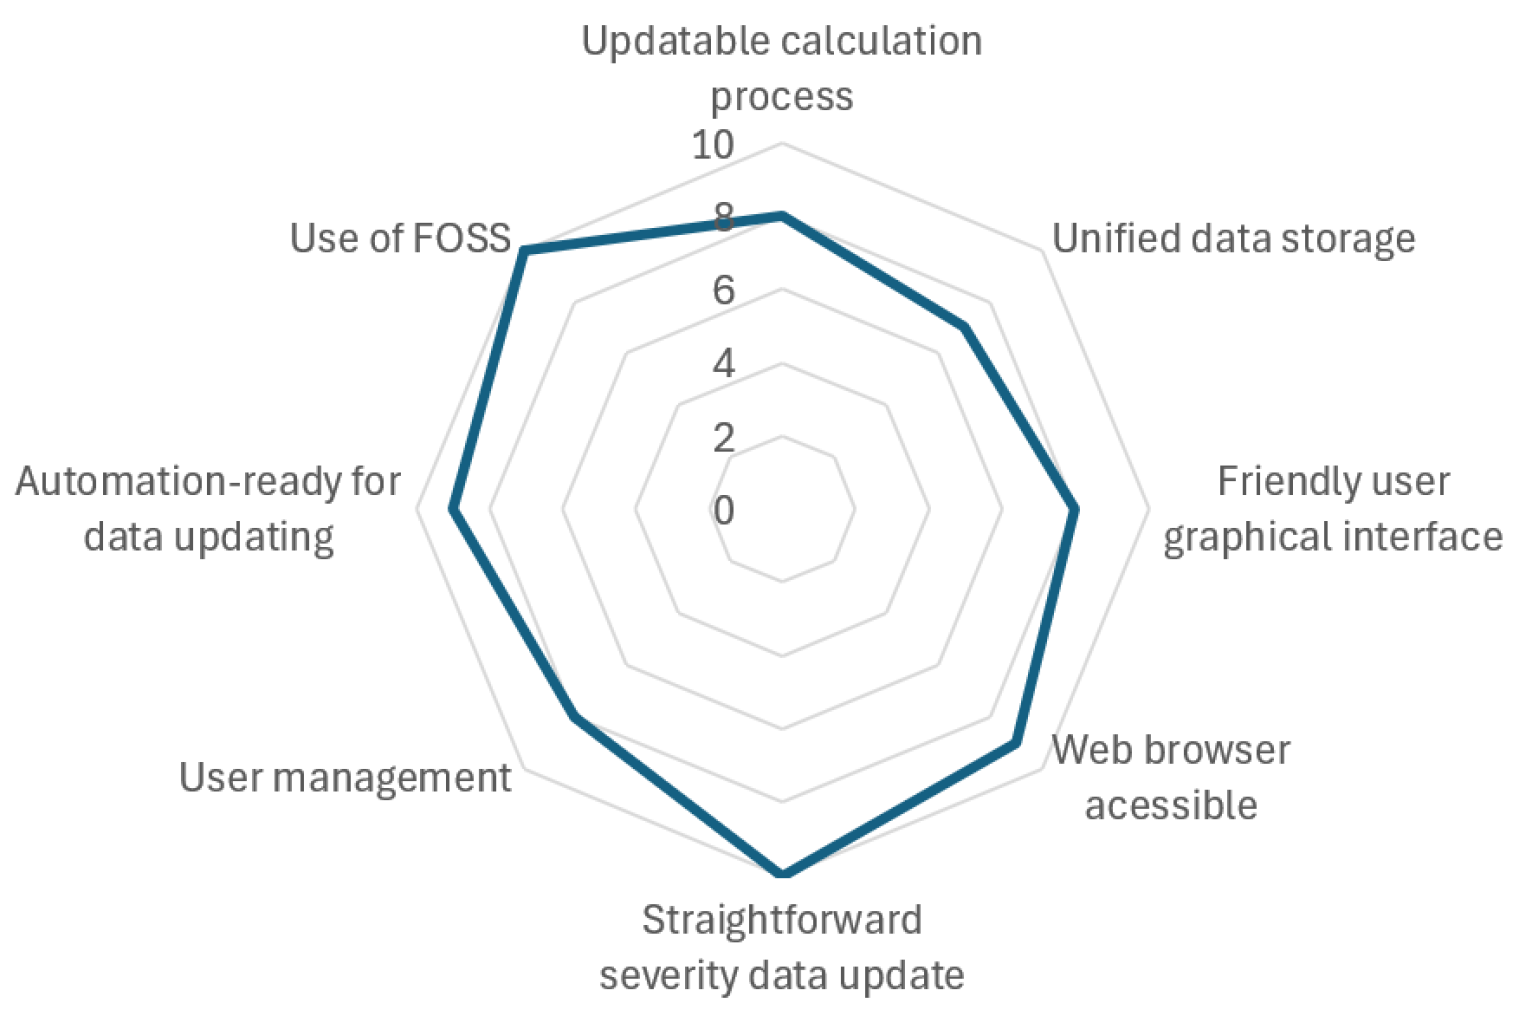
Taking into account the objectives of the platform, the design and specification of the logical and technological architecture were guided by the following characteristics and requirements: (i) implement a procedure to streamline the calculation of burn severity of burned areas that can be easily configured to accommodate changes in the data sources or calculated severity indicators; (ii) include data organization routines that enable the storage, structuring and access to both alphanumeric and geographical severity data within a unified system; (iii) provide a simple and user-friendly graphical interface that allows users to easily navigate the portal to consult the available information, filter data based on their requirements and visualize severity values on a geographical interface; (iv) be easily accessible through a web browser without requiring the installation of additional software; (v) provide a straightforward procedure for uploading new information as new wildfire occurrence data and satellite images become available, followed by the calculation of new severity indicators/products, enabling regular updates; (vi) manage user profiles and user access privileges; (vii) implement a software architecture that will allow the implementation of a complete automation of the updating process of severity data in a future version; and (vii) use of free and open source software (FOSS) in order to create a solution with reduced development and maintenance costs, while ensuring a platform with a robust, scalable and secure architecture.
Figure 1 illustrates and summarizes the relative importance of each identified requirement, with higher values indicating greater relevance in the platform’s design and implementation.
Furthermore, a questionnaire and two workshops were conducted at several development stages to engage stakeholders and potential users in the co-design and improvement processes. The target audience included students and researchers, private companies in forestry and infrastructure, and government agencies involved in wildfire management, fire suppression, forestry, and nature conservation. During these interactions, participants were asked about their requirements for the data products, service, and platform (e.g., spatial and temporal resolution, minimum wildfire size, update frequency). This process enabled us to customize specific aspects of the products and the platform and address user requirements whenever technically feasible. These activities also introduced potential users to the platform’s features and functionalities and provided guidance and training on how to use it while gathering valuable feedback that informed refinements regarding its design and functionalities.
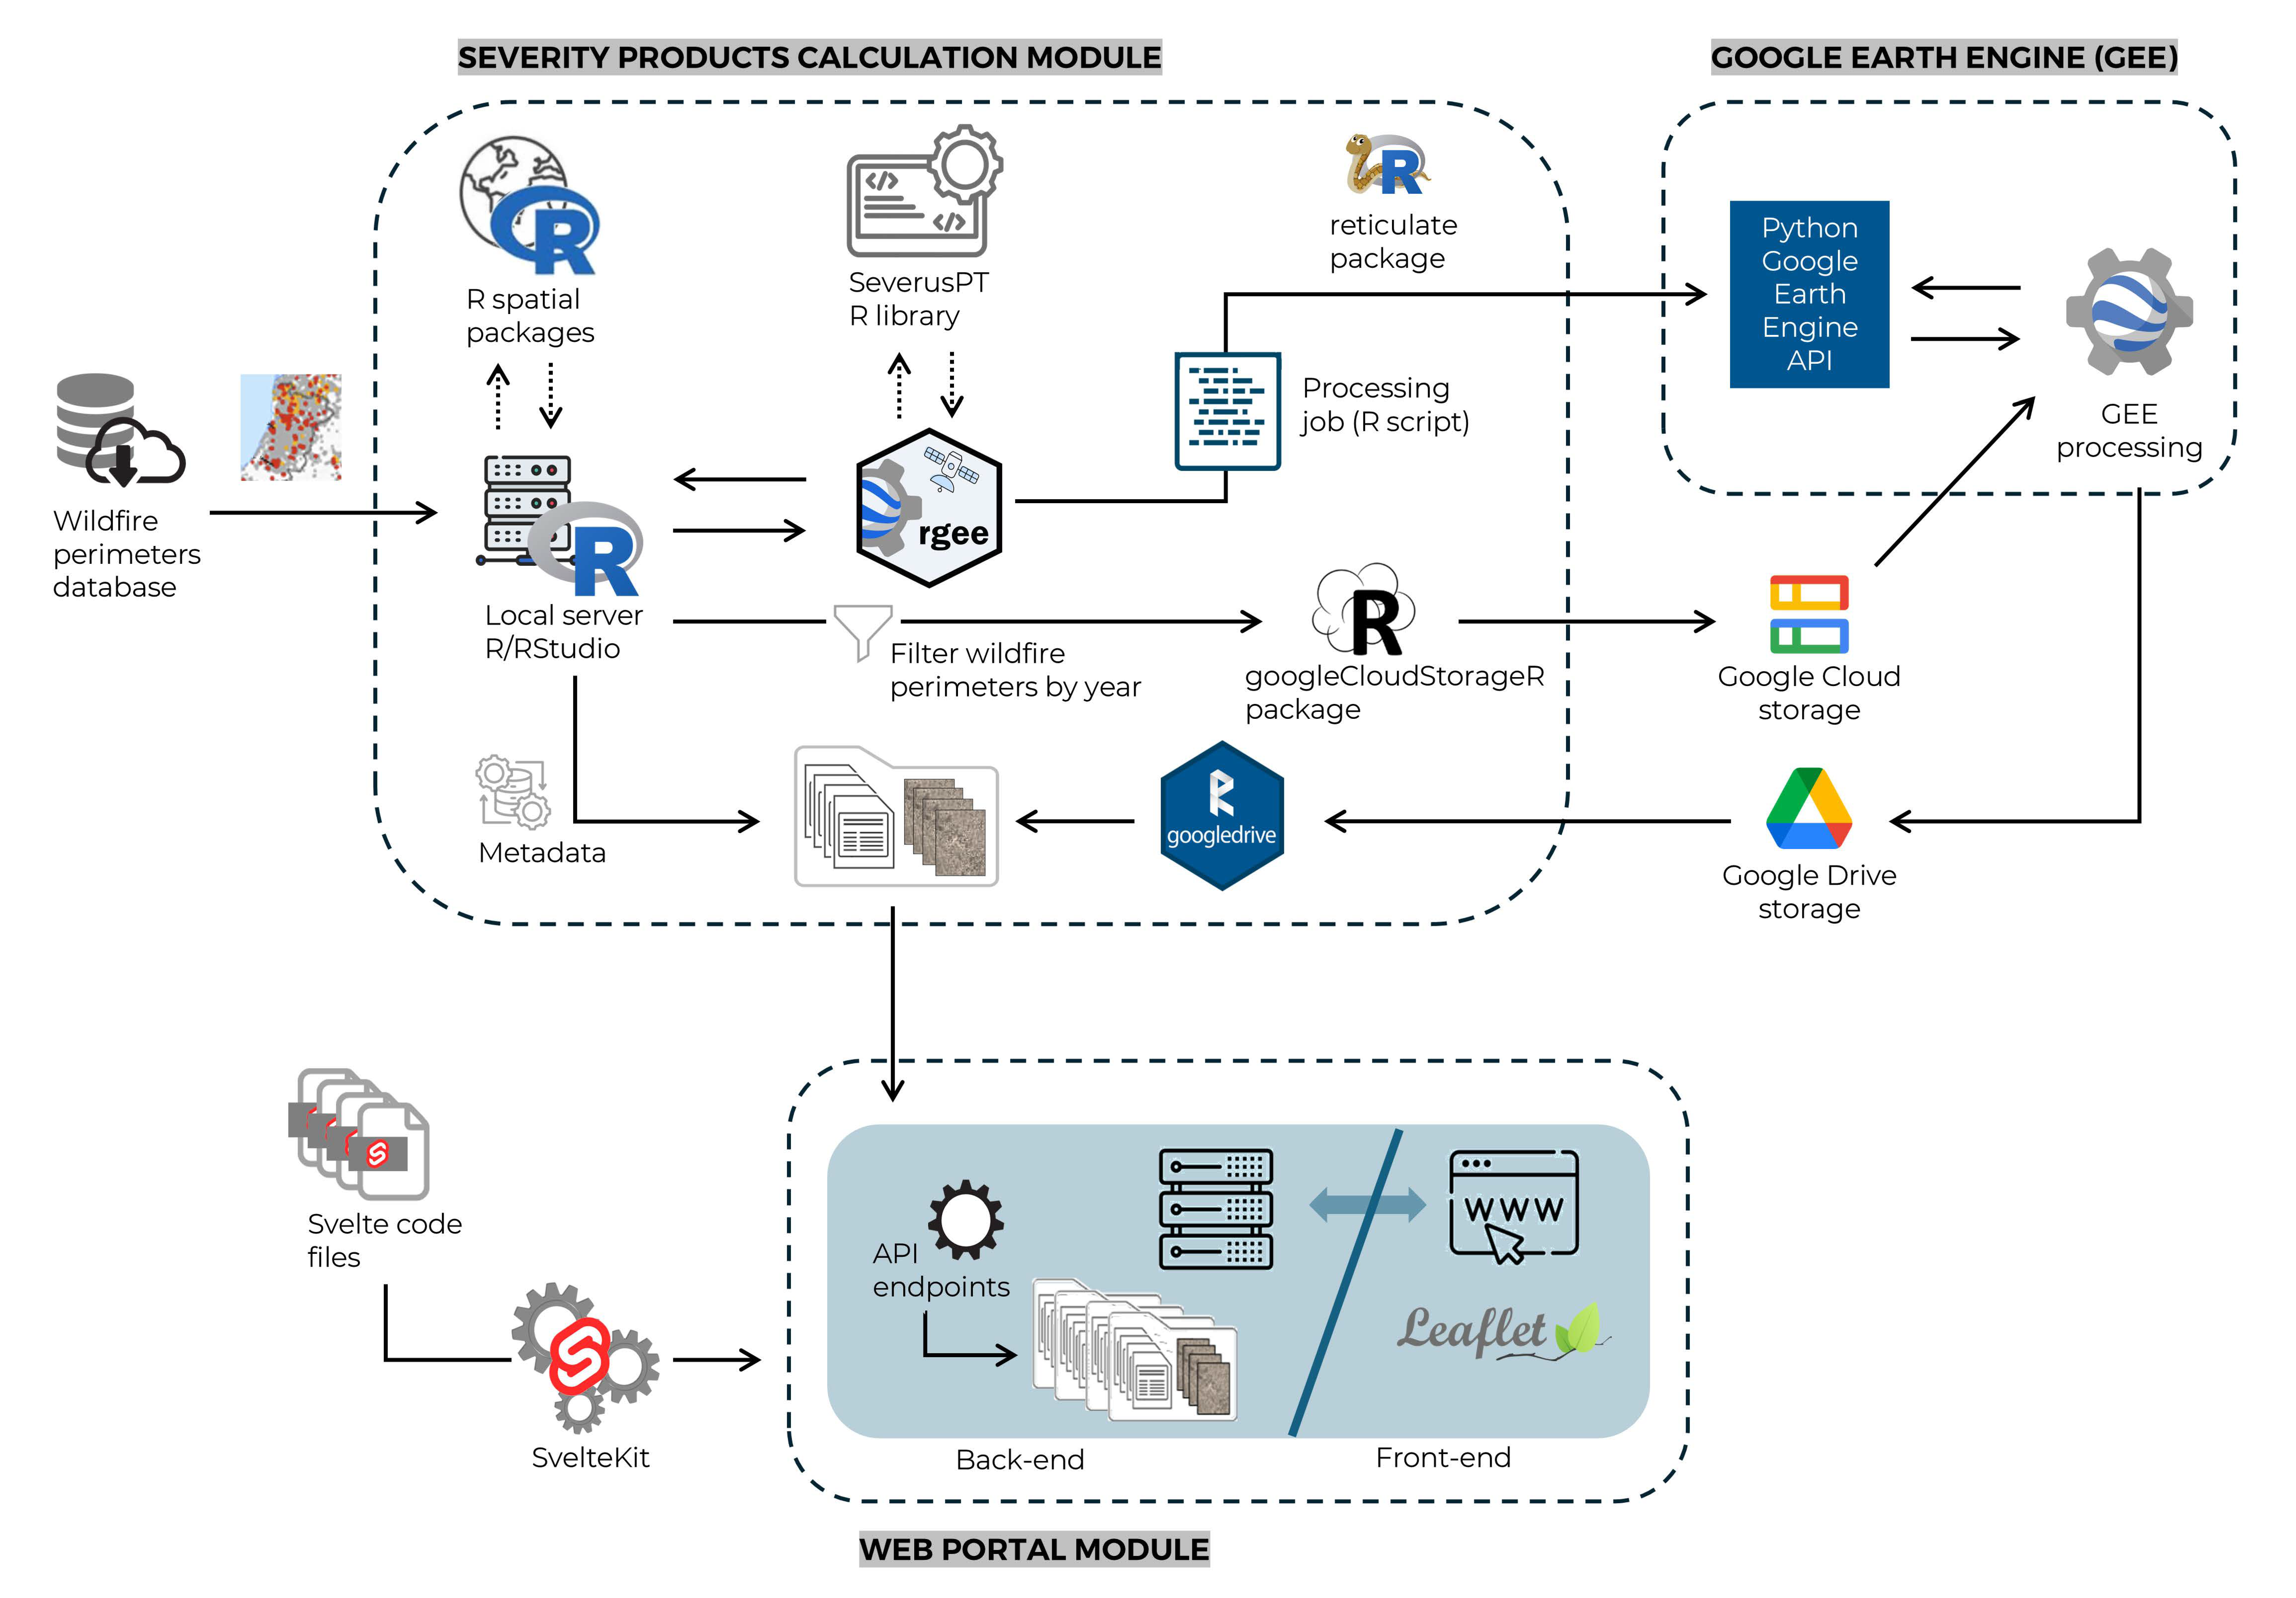
Considering the platform’s requirements, the architecture was structured as two main interconnected modules: (i) a module for calculating burn severity products, which is responsible for producing standardized satellite-derived datasets on observed/historical severity in burned areas for mainland Portugal; and (ii) the web portal module, which facilitates the sharing of the generated data by the previous module (
Figure 2).
2.1.1. Severity Products Calculation Module
The severity product calculation module performs the processing tasks needed to generate the burn severity products, outputting raster files in GeoTIFF format for all available indicators and associated metadata. The process is based on a methodology that uses multitemporal aggregation of satellite image time series (SITS) from different satellite sensors, using different burn severity calculation methods and calculated for several temporal horizons (i.e., 3, 6, 9, and 12 months after the fire). These time steps allow us to assess maximum severity (typically occurring in the first quarter) and, if needed, the early post-fire recovery. The calculation module is also designed as a configurable component, making it easier to update the platform with new indicators in future versions (exploring different satellite missions or SITS), thus allowing the integration of a more comprehensive range of burn severity products.
The generation of severity products combines/integrates different technologies and tools. The calculation of burn severity products follows a ‘delta’ approach based on spectral indices such as the Delta Normalized Burn Ratio (dNBR). These products are calculated through a processing pipeline implemented in Google Earth Engine (GEE) geospatial cloud computing infrastructure and integrated with R running on a local server (
Figure 2). The implemented procedure allows leveraging the potential of GEE for accessing and processing large satellite image time series, enabling the generation of burn severity data products. In a nutshell, GEE is a cloud-based platform that simplifies access to a wide range of earth observation data and provides advanced data analysis and visualization tools [
36]. GEE supports complex data preprocessing tasks, such as spectral index calculations, spatiotemporal aggregations, and merging of image mosaics, making it an invaluable resource for large-scale studies [
43], including in wildfire science. Another relevant GEE key feature is its distributed computing architecture, which enables users to process large datasets without significant local computing resources. Furthermore, GEE offers the use of JavaScript or Python to access an application programming interface (API), allowing the integration of the extensive computing power of Google’s infrastructure and access to a multi-petabyte remote sensing data repository within the development of customized applications [
44].
The workflow of the processing pipeline is controlled within the R software environment, running on a local server to compute the multisource and multitemporal burn severity data files. The management and manipulation of spatial data are achieved using R geospatial packages (
Figure 2). The ‘rgee’ package [
45] enables access to GEE’s vast geospatial data catalog and conducts complex analysis tasks in the cloud from an R programming environment. The data flows between the local server and the GEE platform (e.g., interacting via API with Google Drive to download data) are managed using R packages ‘Rgoogledrive’ and ‘googleCloudStorageR’. One of the key features of the ‘rgee’ package, in the context of the development of the calculation module, is the possibility of writing scripts to streamline workflows, facilitating the automation of repetitive geospatial tasks for different datasets. This feature is vital as it allows the programming of a procedure to automate the calculation tasks to generate the various severity indicators. To allow the use of Google Earth Engine’s Python API within R, ‘rgee’ uses ‘reticulate’ [
46], providing a comprehensive interface between R and Python. This integration allows R scripts to interact with the GEE server, accessing all the functionalities of GEE Python API classes, modules, and functions [
45].
Additionally, a specifically tailored R library was developed to generate the processing jobs (R scripts), including the sequential tasks that must be executed for each burned area. This library was programmed as a customizable procedure to develop a processing pipeline that can run autonomously, as independently as possible from data sources, and that can be easily updated or extended with new options to generate new severity indicators.
The computation of the severity products for a given year begins by downloading and preprocessing (e.g., reprojection, topological check/correction, intersection with Portuguese boundaries) a spatial database containing the fire perimeters such as the one provided by the Europen Forest Fires Information System (EFFIS; URL:
https://forest-fire.emergency.copernicus.eu, accessed 21 February 2025). This dataset is preprocessed to filter the burned areas for the analysis period (from 2006, which is the first year in the EFFIS database with complete coverage of fire ignition dates, to the current year) and loaded to Google Cloud Storage (using ‘googleCloudStorageR’ package) to be available for GEE processing. Then, the R library generates a series of processing jobs with the instructions to compute the severity data products for each fire event. The generated code is then sent to GEE’s servers through the GEE Web REST API for processing. As the GEE server completes code execution, the resulting images are available to R through Google Drive for post-processing and metadata generation. Then, the files are uploaded to the portal module for storage and final publishing/sharing through the project’s platform.
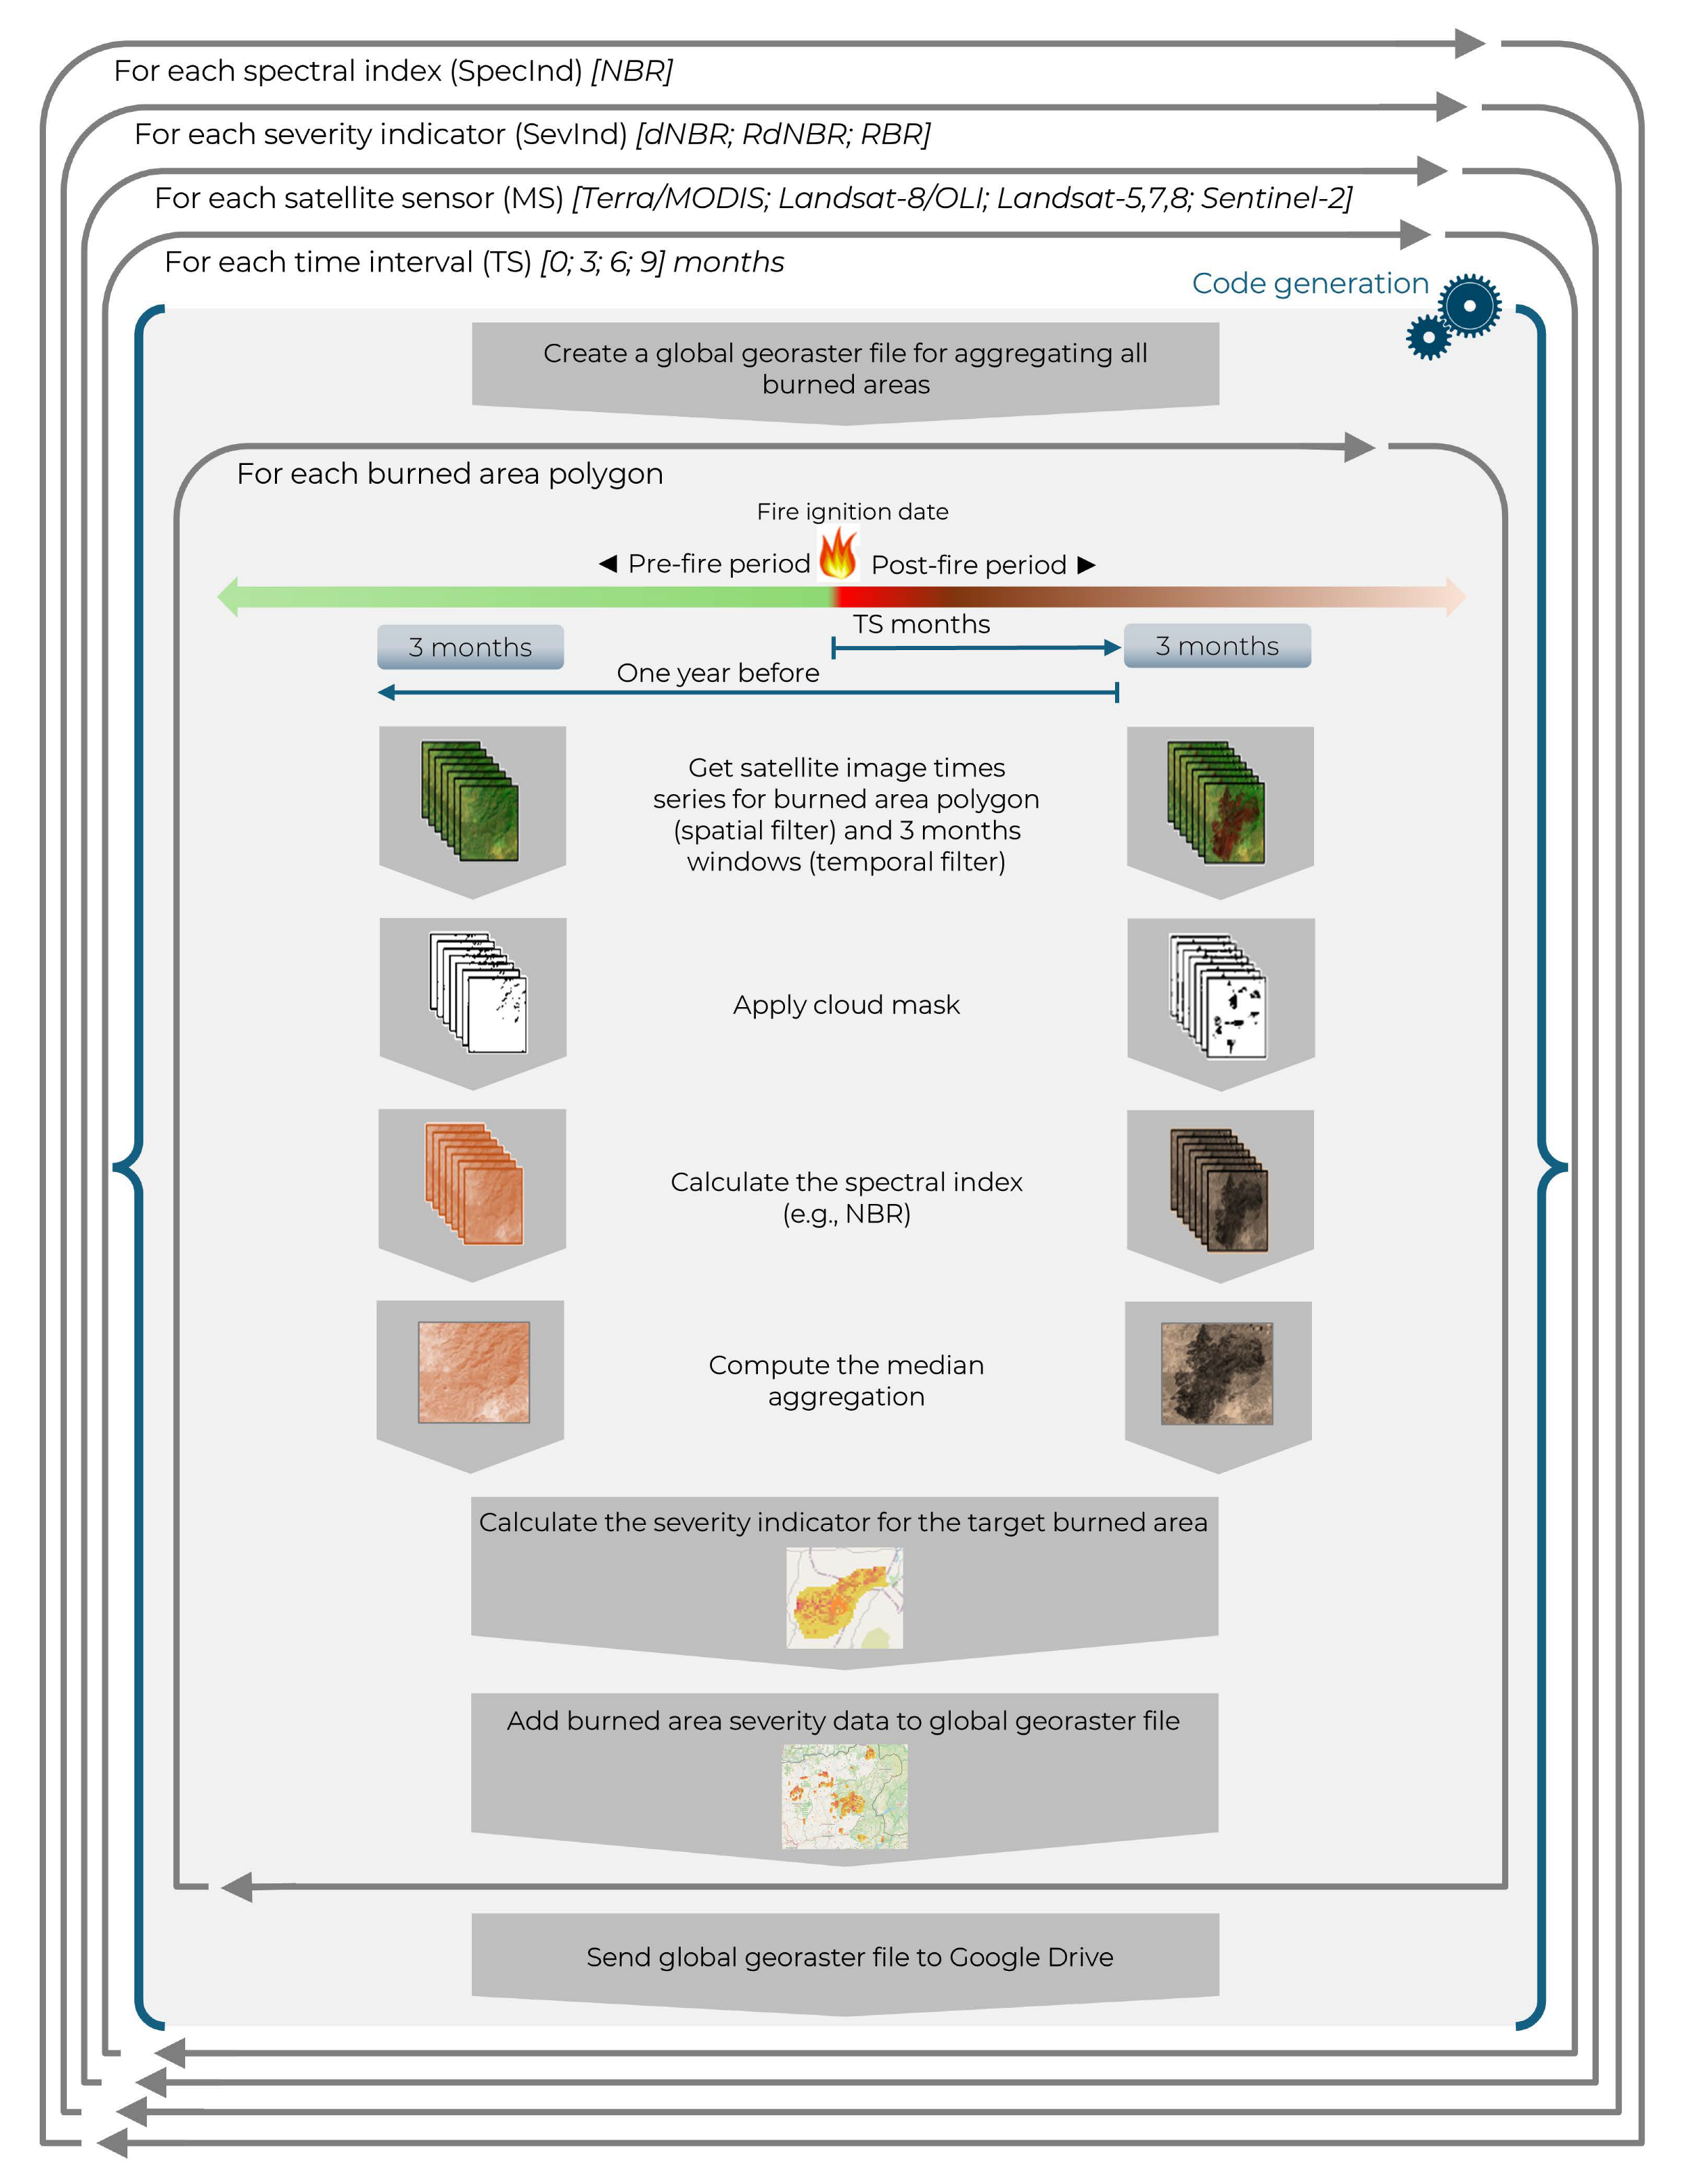
The execution of processing jobs in GEE is handled by running nested loops (
Figure 3). This iterative process generates the programming code (i.e., R scripts) needed to produce burn severity files for each product, outputting raster files in GeoTIFF format. To create a job for each product, a loop iterates over the values of each of the dimensions used in the computation process, namely the spectral index to quantify the burn severity (e.g., Normalized Burn Ratio, NBR), the severity indicator (e.g., delta, relativized burn ratio), the mission to obtain the satellite images from (e.g., Sentinel-2, Landsat-8, MODIS), and the reference periods used for pre- and post-fire burn severity computation (e.g., 3, 6, 9, or 12 months after the fire ignition date; explained in more detail below). For each combination resulting from the previous loops, a processing job (i.e., a script) is created with the code to iterate over the burned areas and execute a sequence of tasks required to compute each severity product. The script is sent to GEE servers to be processed. Each script includes instructions to execute the following tasks: (i) select the satellite images based on the fire ignition date to create the pre- and post-fire image stacks for the defined quarterly period (the number of images selected for each stack depends on the temporal resolution of the satellite mission and image availability); (ii) apply a cloud mask; (iii) calculate the spectral index for each image in each stack; (iv) then, the pre-fire and post-fire image stacks are aggregated to generate a multitemporal median composite to improve image quality and remove clouds or other potential artifacts; and (v) lastly, the severity indicator based on the pre- vs. post-fire difference is calculated.
In the current version of the platform, the computed raster files aggregate the severity values computed for each burned area using a set of processing parameters:
Spectral index: Normalized Burn Ratio (NBR; Equation (1)) was selected because it is a widely used and validated satellite-based spectral index for delineating burned areas and estimating burn severity [
18,
31]. This spectral index is based on a normalized ratio between the near-infrared (NIR) and shortwave infrared image bands (SWIR). Given the modular structure of the calculation pipeline, other spectral indices can be implemented (e.g., NDVI, EVI, SAVI, Tasseled Caps components).
Severity indicator: This defines the method used to calculate burn severity values from satellite images and relies on the well-known “delta” approach. This approach calculates the difference between the pre-fire and post-fire NBR values (among other spectral indices) obtained from multitemporal remote sensing image composites. In this version of the platform, the delta-based indicators used to calculate burn severity include the following: delta Normalized Burn Ratio—dNBR [
21] (Equation (2)), the Relative Difference NBR—RdNBR [
32,
47] (Equation (3)), and the Relativized Burn Ratio—RBR [
33] (Equation (4)).
Satellite mission: The satellite missions selected to obtain the pre- and post-fire satellite images are Terra/MODIS (2006–2023), Landsat-8/OLI (2014–2023), Landsat-5, -7, and -8 Harmonized through [
48] coefficients (2006–2023), and Sentinel-2 (2018–2023), in order to have results for different spatiotemporal resolutions.
Pre- and post-fire reference periods: The delta-based severity indicators are generated based on quarterly median composites to aggregate image data for several periods before and after the fire event, capturing the maximum severity and early recovery up to one year after the fire. The calculation is executed using a 3-month moving window to select the images to aggregate, which is applied to equivalent periods after and before the wildfire ignition date. The implemented post-fire periods include temporal windows between months 1 to 3, months 4 to 6, months 7 to 9, and months 10 to 12 after the ignition date and the corresponding pre-fire period one year before (i.e., pre-fire image composite). This approach aims to compare the burn severity levels at the same comparable timeframe and, thus, reduce intra-annual or seasonal/phenological differences in pre-fire vs. post-fire comparisons. The multitemporal quarterly image composites approach aims to improve image quality and remove clouds or other potential artifacts [
49].
The list of burned areas to process is obtained by downloading and preprocessing the EFFIS fire perimeters database (and the associated ignition date). EFFIS provides services to upload a continuously/daily updated version of geospatial data of burned areas through a WFS service [
50], as well as related data files that are accessible online. One of the key components of EFFIS is its robust database of historical wildfire perimeters, which serves as a key resource for researchers, policymakers, and land managers seeking to understand the spatial and temporal patterns of wildfires in Europe [
42]. Despite EFFIS’s updated status, only from 2006 has the fire ignition date been recorded in all fire occurrences, enabling fully automated burn severity estimates/mapping. However, while the current web portal version uses the EFFIS database, the platform’s modular design allows it to easily integrate other spatial databases containing fire perimeters. The only prerequisite to include other databases is that each record includes ignition dates (to ensure the calculation of pre- and post-fire image composites), enabling compatibility with the platform’s processing workflows, which rely on calculating pre- and post-fire image composites.
As mentioned, the processing tasks also include generating metadata files for each computed raster file (in JSON, CSV, and Txt formats). Including metadata increases data longevity and facilitates its reuse and sharing [
51]. Metadata files contain information about the project, contact information, and parameters used to calculate the severity product (e.g., spectral index, severity formula, satellite mission, pre/post-periods).
2.1.2. Web Portal Module
The web portal module is implemented as a reactive web application in JavaScript based on the SvelteKit framework that allows the development of complete web applications covering both server-side (backend) and client-side (frontend) components. SvelteKit is a framework oriented towards developing stable and high-performance web applications using Svelte, providing features such as routing, server-side and client-side rendering, and optimization of the generated code, among others [
52]. Svelte is based on a compiler-based approach that allows code written in HTML, CSS, and JavaScript to be converted during the application creation process into highly optimized and compact JavaScript code, which results in applications with smaller bundle sizes, leading to faster loading times and better performance.
The client-side of the web portal module (frontend) includes the user interface executed in a web browser, designed to create a simple and intuitive user experience and to enable the execution of operations such as loading, querying, searching, viewing, and downloading severity data. The geographic data viewer of the graphical user interface is based on the Leaflet library, which provides an interactive map to visualize the different types of geospatial data (burned areas and severity indicators). The server-side component of the portal (backend) includes routines for loading and validating newly uploaded data, controlling the access for different types of users, accessing sets of severity products, and managing users and services (API endpoints) to enable autonomous data uploading.
Considering the characteristics of the severity products (computed by the calculation module), the server-side data storage comprises files grouped into folders based on common characteristics. A rigorously structured data filename scheme was established to facilitate the identification of the procedure used to generate the product files. Each file’s name (data and metadata) is produced by concatenating codes that uniquely identify each product and include the following components: the project acronym, severity indicator, spectral index, satellite mission, the fire boundaries database source and fire occurrence year, pre- and post-fire reference periods, coordinate reference system, calculation date, and version number. This structured filename convention ensures a straightforward identification of individual products, providing an easy and simple search of the files.
As previously mentioned, the main objective of the public data portal is to allow and facilitate the dissemination of historical/observed data on the severity of burned areas in mainland Portugal, including the results of analyses on historical fire data. To this end, a server-side data organization structure was defined to ensure simplified access and sharing of data files. The implemented organization of the severity products is structured in a two-level system file, where data files are grouped in folders labeled as products based on some of the characteristics and procedures used in their generation. The first level, the products level (i.e., a folder in the backend server), is identified by the concatenation of the codes of the following elements: the project acronym, calculation approach/pipeline, severity indicator, spectral index, satellite mission, the burned areas database source, and version number. Each folder contains the data that meets the defined elements, including GeoTIFF raster files with the estimated severity values and their respective metadata files in various formats. This comprehensive identification system ensures an unambiguous identification and contextualization of each data file.
2.2. Comparative Evaluation of Burn Severity Datasets and Services
To evaluate the data products and the approach developed in the SeverusPT project, its features were compared with six similar burn severity datasets/services: the Portuguese Burn Severity Atlas [
40], Monitoring Trends in Burn Severity (MTBS) [
41], the Landscape Fire Scars Database [
39], the EFFIS Fire Severity dataset [
51], MOSEV [
37], and the Global Forest Burn Severity Dataset [
38]. This comparative analysis focuses on a comprehensive set of features, including spatial extent, archive duration, minimum mapping size, supported satellite missions (e.g., MODIS, Landsat, Sentinel-2), severity indicators (e.g., dNBR, RdNBR, RBR), support for additional spectral indices, compatibility with any fire perimeter database, inclusion of multiple years and post-fire dates, temporal compositing, frequency of updates, availability of data services, presence of a dedicated geoportal, metadata quality, and open calculation libraries. This evaluation aims to highlight differences in these attributes to contextualize the contributions and potential applications of the SeverusPT products/service.
2.3. Exploratory Data Analysis
Exploratory data analysis was conducted to assess products’ capabilities in comparing burn severity across years, evaluating temporal trends for mainland Portugal across satellite missions, and performing regional comparisons. To compare burn severity distributions between 2017 and 2022, density plots were generated using the Relativized Burn Ratio (RBR) values derived from Landsat-8 and Terra/MODIS, and a Wilcoxon signed-rank test was applied to determine statistical differences. To analyze temporal trends in burn severity across different satellite missions, annual median RBR values were extracted from the Landsat Harmonized dataset (L5, 7, and 8) and Terra/MODIS, constructing a time series spanning from 2006 to 2023. Lastly, to examine regional burn severity variations targeting the year 2017 (the year with the maximum burned area in the series), mean and standard deviation RBR values were computed for NUTS-2 regions of mainland Portugal.
3. Results and Discussion
3.1. Advancing Burn Severity Mapping Through Data Integration, Automation, and Accessibility
The SeverusPT platform provides a comprehensive, updated, validated, multisource, and multitemporal dataset on burn severity. By utilizing data from multiple satellite missions, including MODIS, Landsat-5, -7, and -8, and Sentinel-2, the platform calculates standardized burn severity indicators across various timeframes. This approach enhances spatial and temporal coverage, enabling a more detailed and comprehensive assessment of wildfire impacts. Integrating advanced computational resources from Google Earth Engine coupled with R enables the efficient calculation of multiple burn severity indicators across different timeframes while ensuring regularly updated satellite imagery. This automated updating procedure also ensures that users can access burn severity data based on the most recent available imagery, unlike repositories with static datasets (e.g., [
37,
38,
39,
40]). Moreover, the implementation of a web data portal promotes accessibility, allowing users to search, filter, visualize, and download burn severity data without requiring advanced technical expertise. In addition, the availability of a graphical user interface allows users to explore the data without having to download it or use external software.
The platform’s modular and scalable framework also allows the integration of more spectral indices, burn severity indicators, and other wildfire perimeter databases. These design features enable the platform to be adapted to other regions beyond its initial focus on mainland Portugal. Its compatibility with various satellite missions (existing and upcoming) through Google Earth Engine’s available data catalog ensures that users can take full advantage of advancements in remote sensing technology. Additionally, the platform architecture supports future enhancements to address post-fire recovery. This feature includes tracking vegetation regrowth and changes in ecosystem function and integrating model-based indicators using Google Earth Engine’s robust capabilities, such as machine-learning libraries.
3.2. Web Data Portal
The platform’s final implementation results in a comprehensive web-based data portal that serves as a centralized repository for burn severity data, accessible to distinct groups of users, including the general public, local government officials, forest and nature conservation managers, technicians, and researchers. The primary goal of the portal is to streamline access to geospatial burn severity data by enabling users to search, visualize, and download it. The platform also provides system administrators with tools to manage, verify, and upload new data (e.g., new/improved versions and updated data) and allows them to manage registered users. These datasets are generated through the analysis and calculation pipelines developed within the SeverusPT project implemented in R and Google Earth Engine (
Figure 2). The web-based data portal—URL:
https://geoportal-dev.severus.pt (accessed on 24 February 2025)—is supported by a user-friendly and intuitive interface that allows access to functionalities that can be divided into the following main groups:
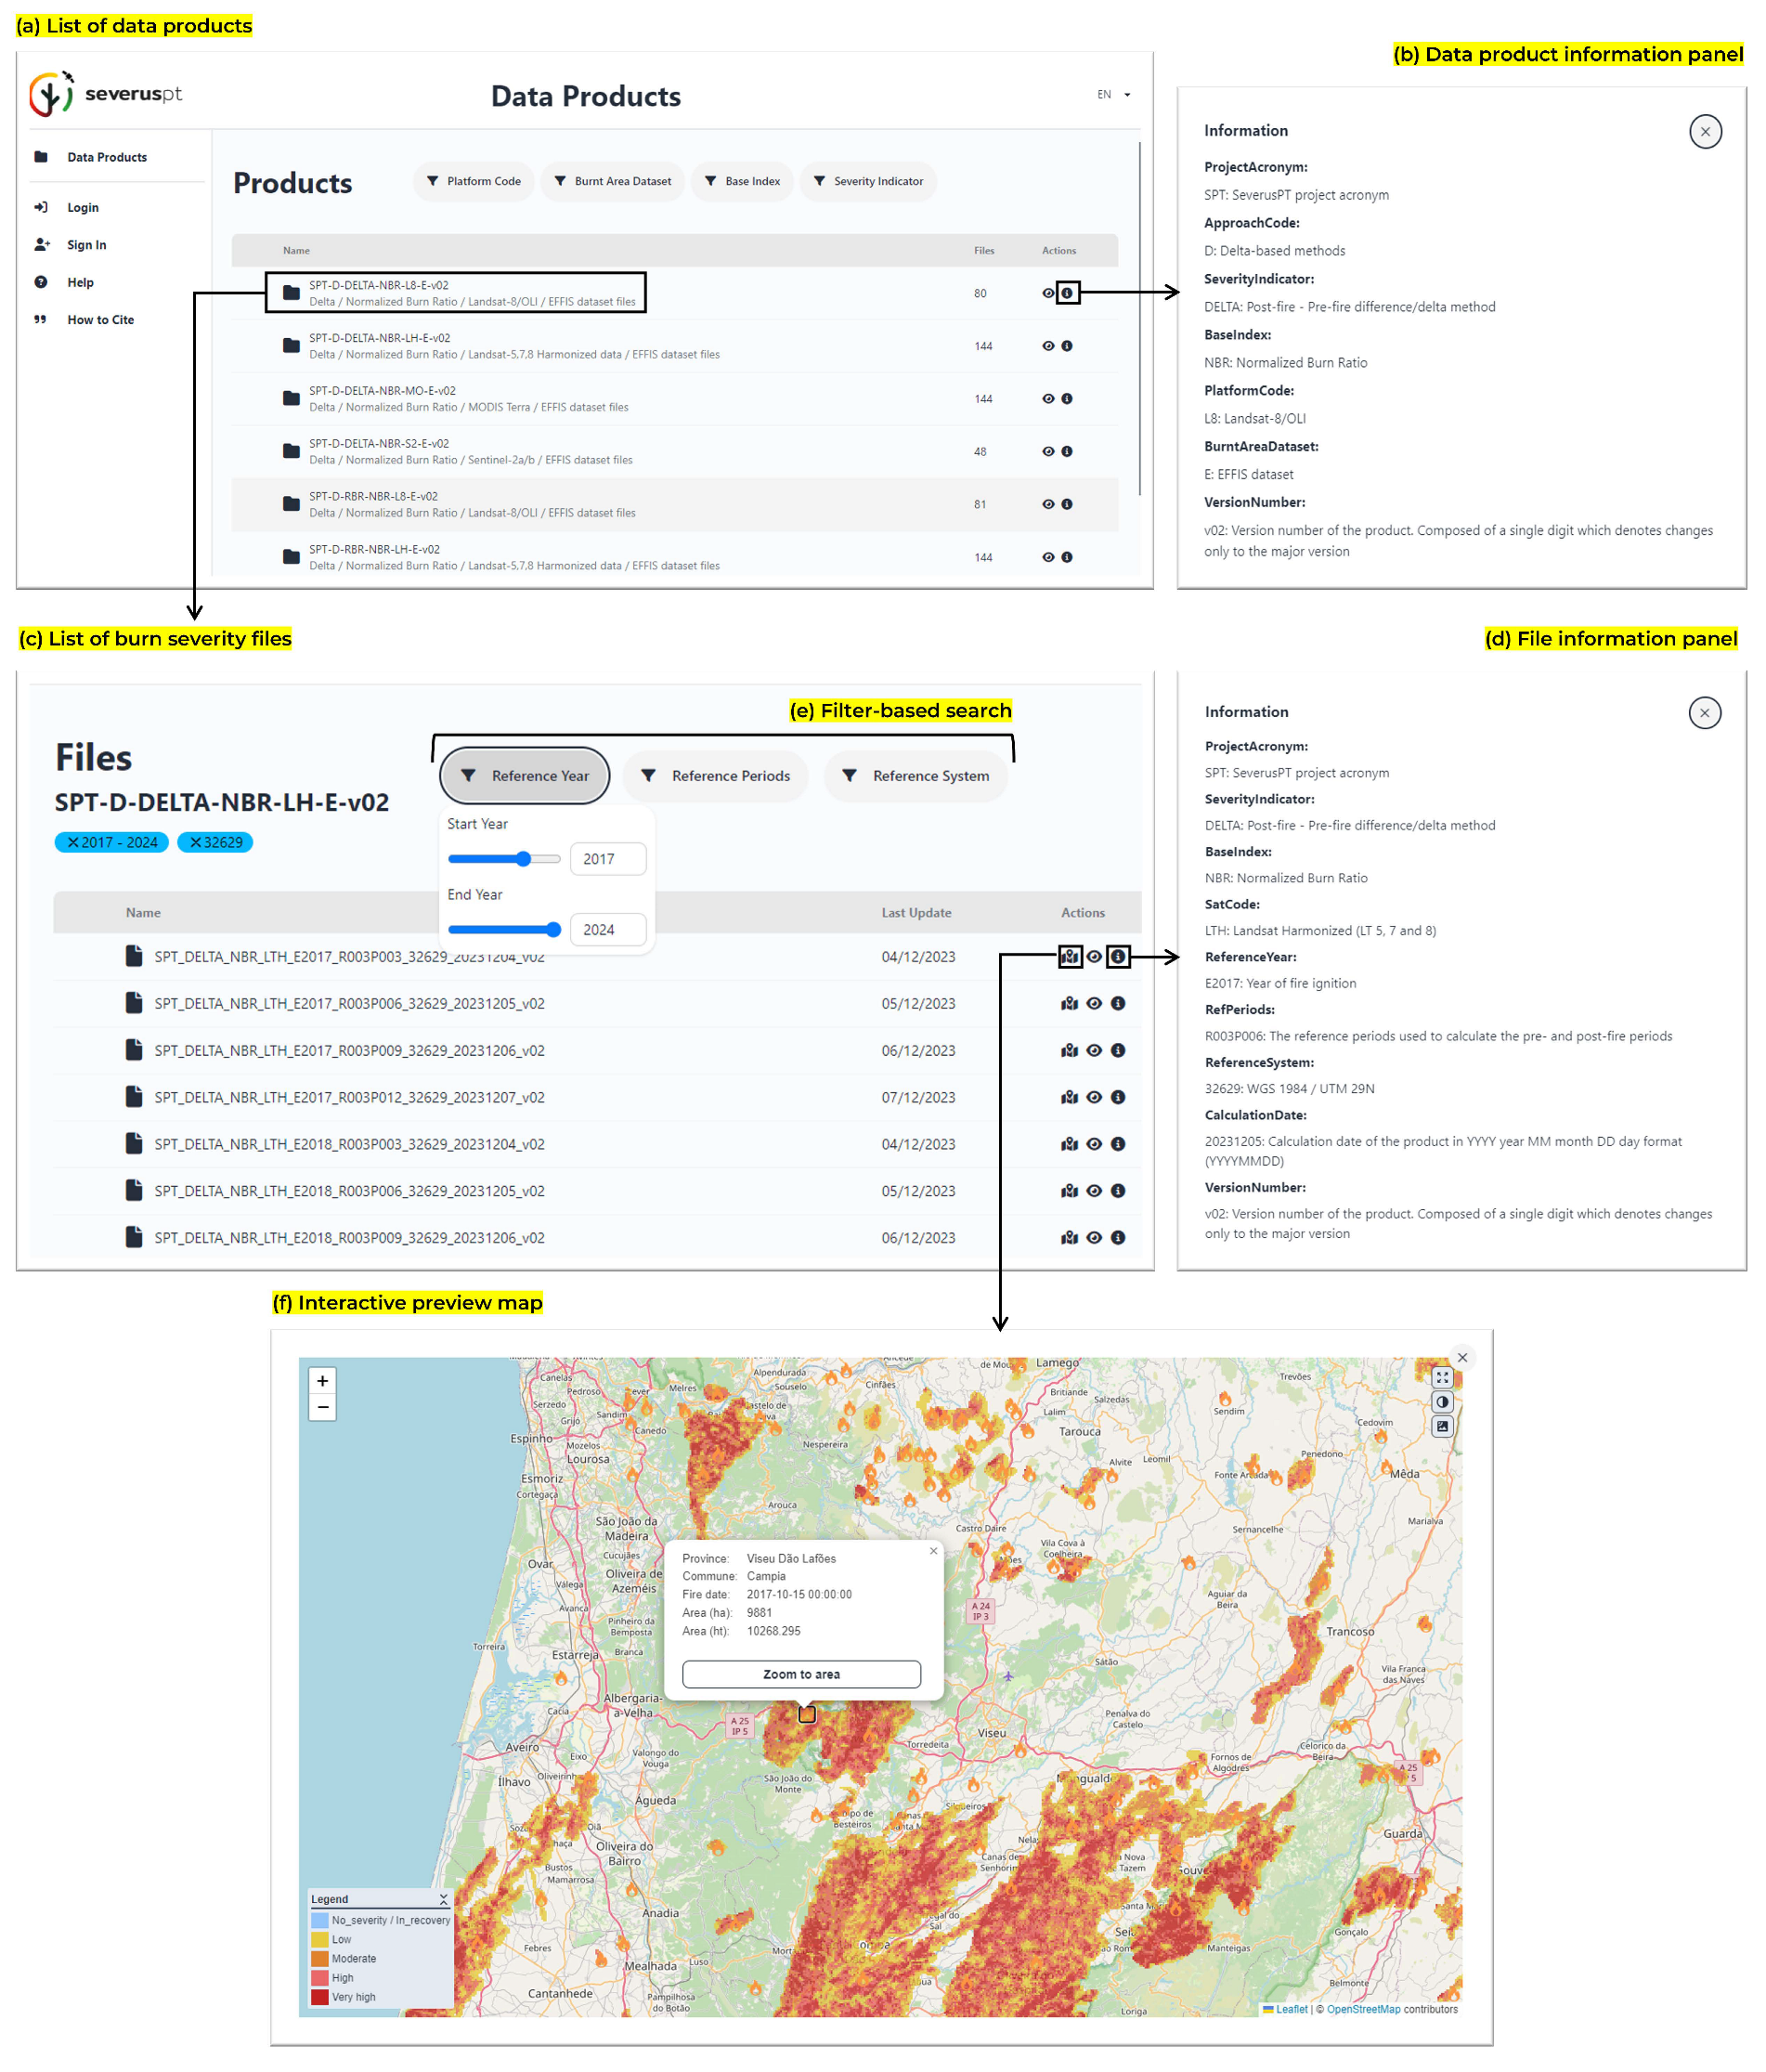
Data navigation: These functionalities allow users to explore and view available severity products. The data consultation/visualization is accessible through a two-level structure: (i) a list of data products corresponding to the folders existing in the server data storage (
Figure 4a); and (ii) a list of available severity data files list within a selected data product (
Figure 4b). As mentioned, each filename has a systematic format that allows for data search and filtering based on concatenated codes separated by an underscore. Users can also access an information panel that presents detailed information on data products or files (
Figure 4c,d). An interactive preview map allows the visualization of severity indicator values for each file, including the location and description of the fire event (
Figure 4e). Severity data is represented on the map using a graduated symbology, where severity values are classified into five intervals. This option aims to provide a detailed map and ensure a more responsive data loading and smooth navigation on the interactive map while aligning with the user profile strategy described below.
Filter-based search: The platform includes filter-based functionality to help users efficiently locate specific data based on their requirements. Users can search the products (i.e., folders) and severity data (i.e., files) using predefined filters based on properties such as the severity indicators, wildfire database sources, spectral indices, satellite missions, year of fire, post-fire reference periods and coordinate reference systems (
Figure 4f).
Data download: Registered users can download full-resolution data files with their associated metadata. This functionality facilitates using the data in external software for specific analysis (e.g., spatial patterns, temporal trends).
Data management: The portal includes tools for organizing, updating, and maintaining product files. Users (with “manager” level privileges) can manage the existing and new data, including creating new data products and uploading data files. The portal includes routines to verify and validate the correctness of data file nomenclature and structure and route files adequately within the file system. A system for generating and managing API keys is also implemented to facilitate the data updating process by uploading data files via API endpoints (i.e., web services). This feature automates data file uploads to the web portal and enables the severity calculation module to generate products as new satellite data becomes available to the Google Earth Engine catalog.
Users’ management: This allows users (with manager privileges) to list users who have registered on the portal and to validate users with a higher level of access privileges (described in the next section), granting higher privileges to individuals belonging to authorities or involved in forest/rural fires management or research.
Web services: This allows users to access the geospatial data through web services such as OGC Web Map Service (WMS), enabling the use of the severity data directly in external GIS software or integrated into other web applications.
The web-based data portal provides a highly flexible and interactive platform designed to meet the needs of a diverse user base. Its interactive tools, including zoomable maps, data filtering, downloading capabilities, and metadata consultation, enhance usability across various applications, including scientific research, technical assessment, and decision-making. Researchers and GIS professionals can access high-resolution, multisource, multi-indicator, and multitemporal precalculated datasets compatible with any GIS software, enabling advanced spatial analyses such as wildfire impact assessments, fire regime evaluations, and post-fire ecosystem recovery studies. Local and regional management authorities can utilize severity maps to identify priority areas for intervention and stabilization, efficiently allocate resources for ecosystem restoration, and monitor early vegetation recovery. The platform also serves as an educational and consultation tool for the general public, raising awareness of wildfire severity by enabling users to explore wildfire impacts through interactive map visualizations.
The data portal is publicly accessible, enabling users to explore and consult the data. It also implements a user management system that requires users to register and create personal accounts to access additional functionalities. The user registration is completed through a simple procedure that requires users to provide an email address and a password. Upon registration, users receive a confirmation email that allows them to verify their account to activate access.
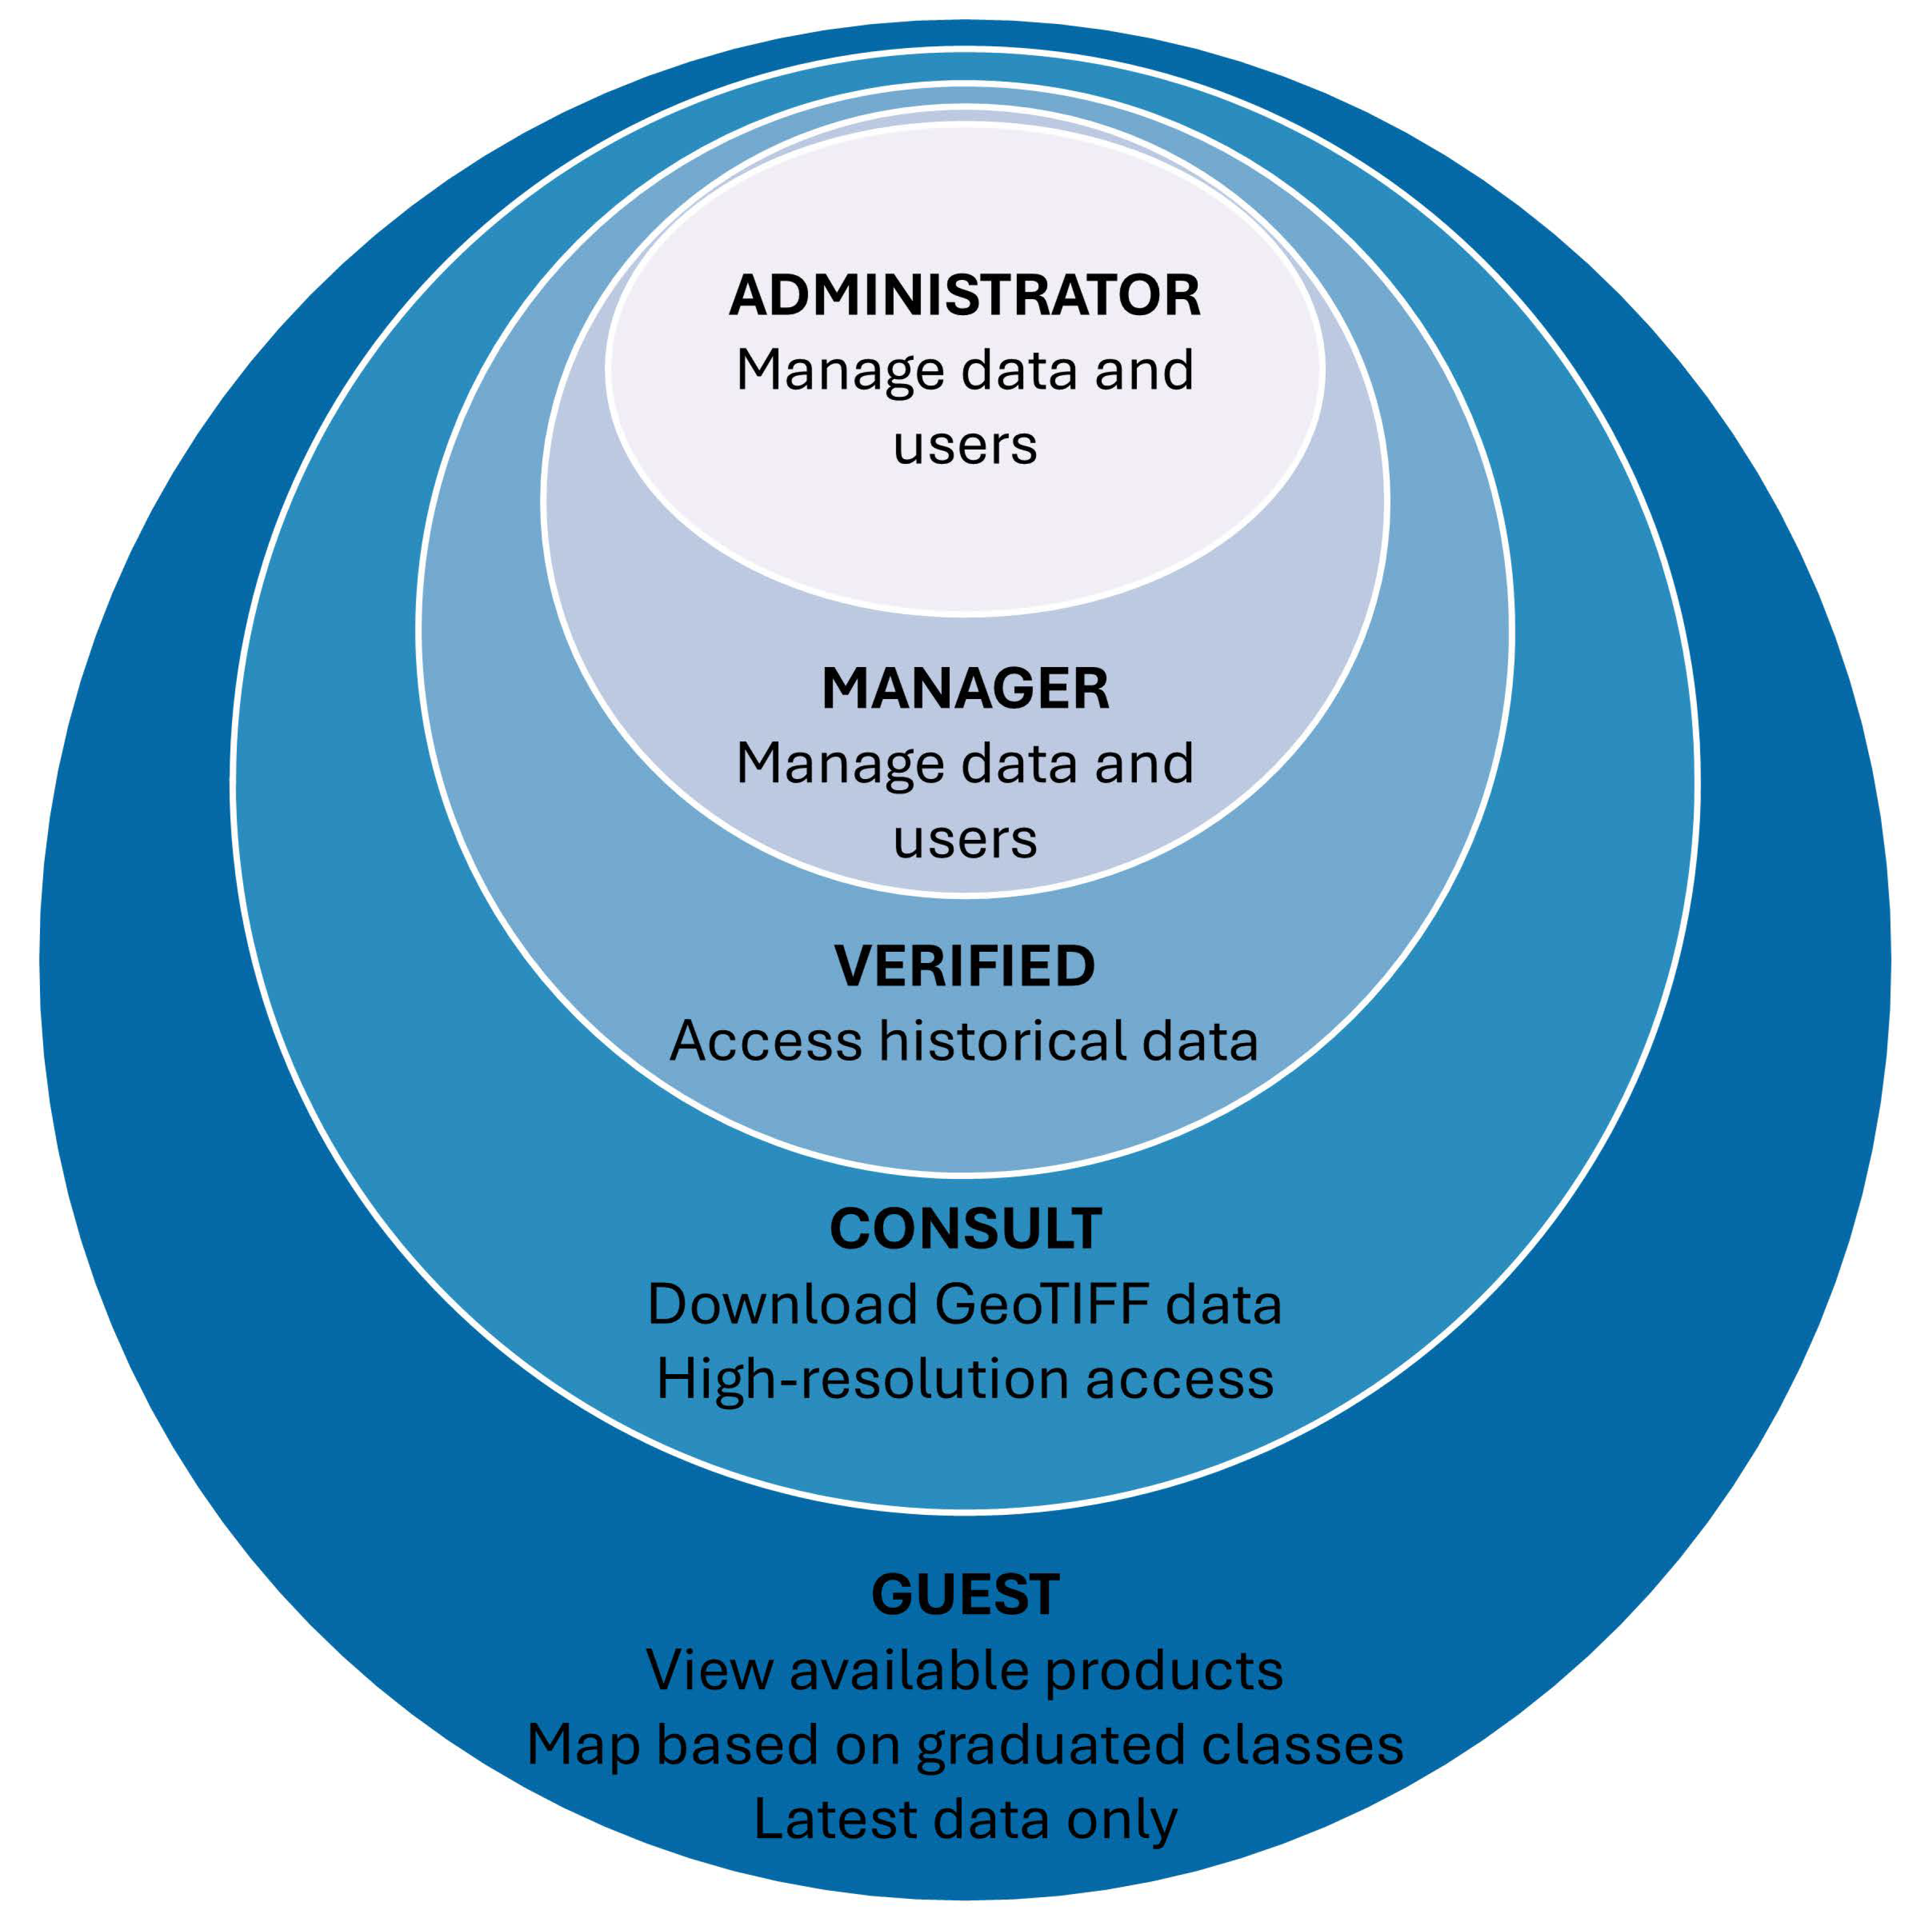
The access to the portal’s functionalities is structured according to five distinct user profiles structured hierarchically, with each profile accumulating the access permissions of the preceding levels (
Figure 5). The defined profiles and associated permissions are as follows:
Guest (public access): This entry-level profile is available for unregistered users. Guests can list the available data products and files, access the information panel, and preview data files on an interactive map based on a graduated symbology. These users cannot download any data and are only permitted to access the latest version of severity products.
Consult: Registered users can download data at full resolution, either as entire folders or as individual files. The spatial files are provided in GeoTIFF raster format compatible with any GIS or remote sensing software. As mentioned above, this level of access allows users to use the severity data for more specific analysis through external software.
Verified: After completing registration, users can request profile validation for more comprehensive access to the data. Verified users can download data beyond the latest version.
Manager: These are users with privileges to manage data file organization, perform data updates, and manage registered users’ accounts.
Administrator: This is the user with the highest level of access, encompassing all permissions available to managers, complete control over users (including managers), and access to platform usage statistics.
This structured approach to user management ensures that users are provided access to the information they need to fulfill their roles, needs, and responsibilities. The data portal aims to give access to burn severity data, with the possibility of having access to high-resolution data through a straightforward registration process. This portal’s open-access strategy can meet the diverse needs of those involved in burn severity assessment and management. The “Guest” user profile is designed for casual users interested in obtaining general insights into wildfire occurrences and impacts. Users with the “Consult” and “Verified” profiles have a higher level of data access, making it suitable for researchers, technicians, and decision-makers who require full-resolution data to generate reports and conduct in-depth spatial or temporal analyses. The “Verified” profile also extends these capabilities, allowing users to access different product versions.
3.3. Burn Severity Products—Comparative Assessment and Exploratory Data Analysis
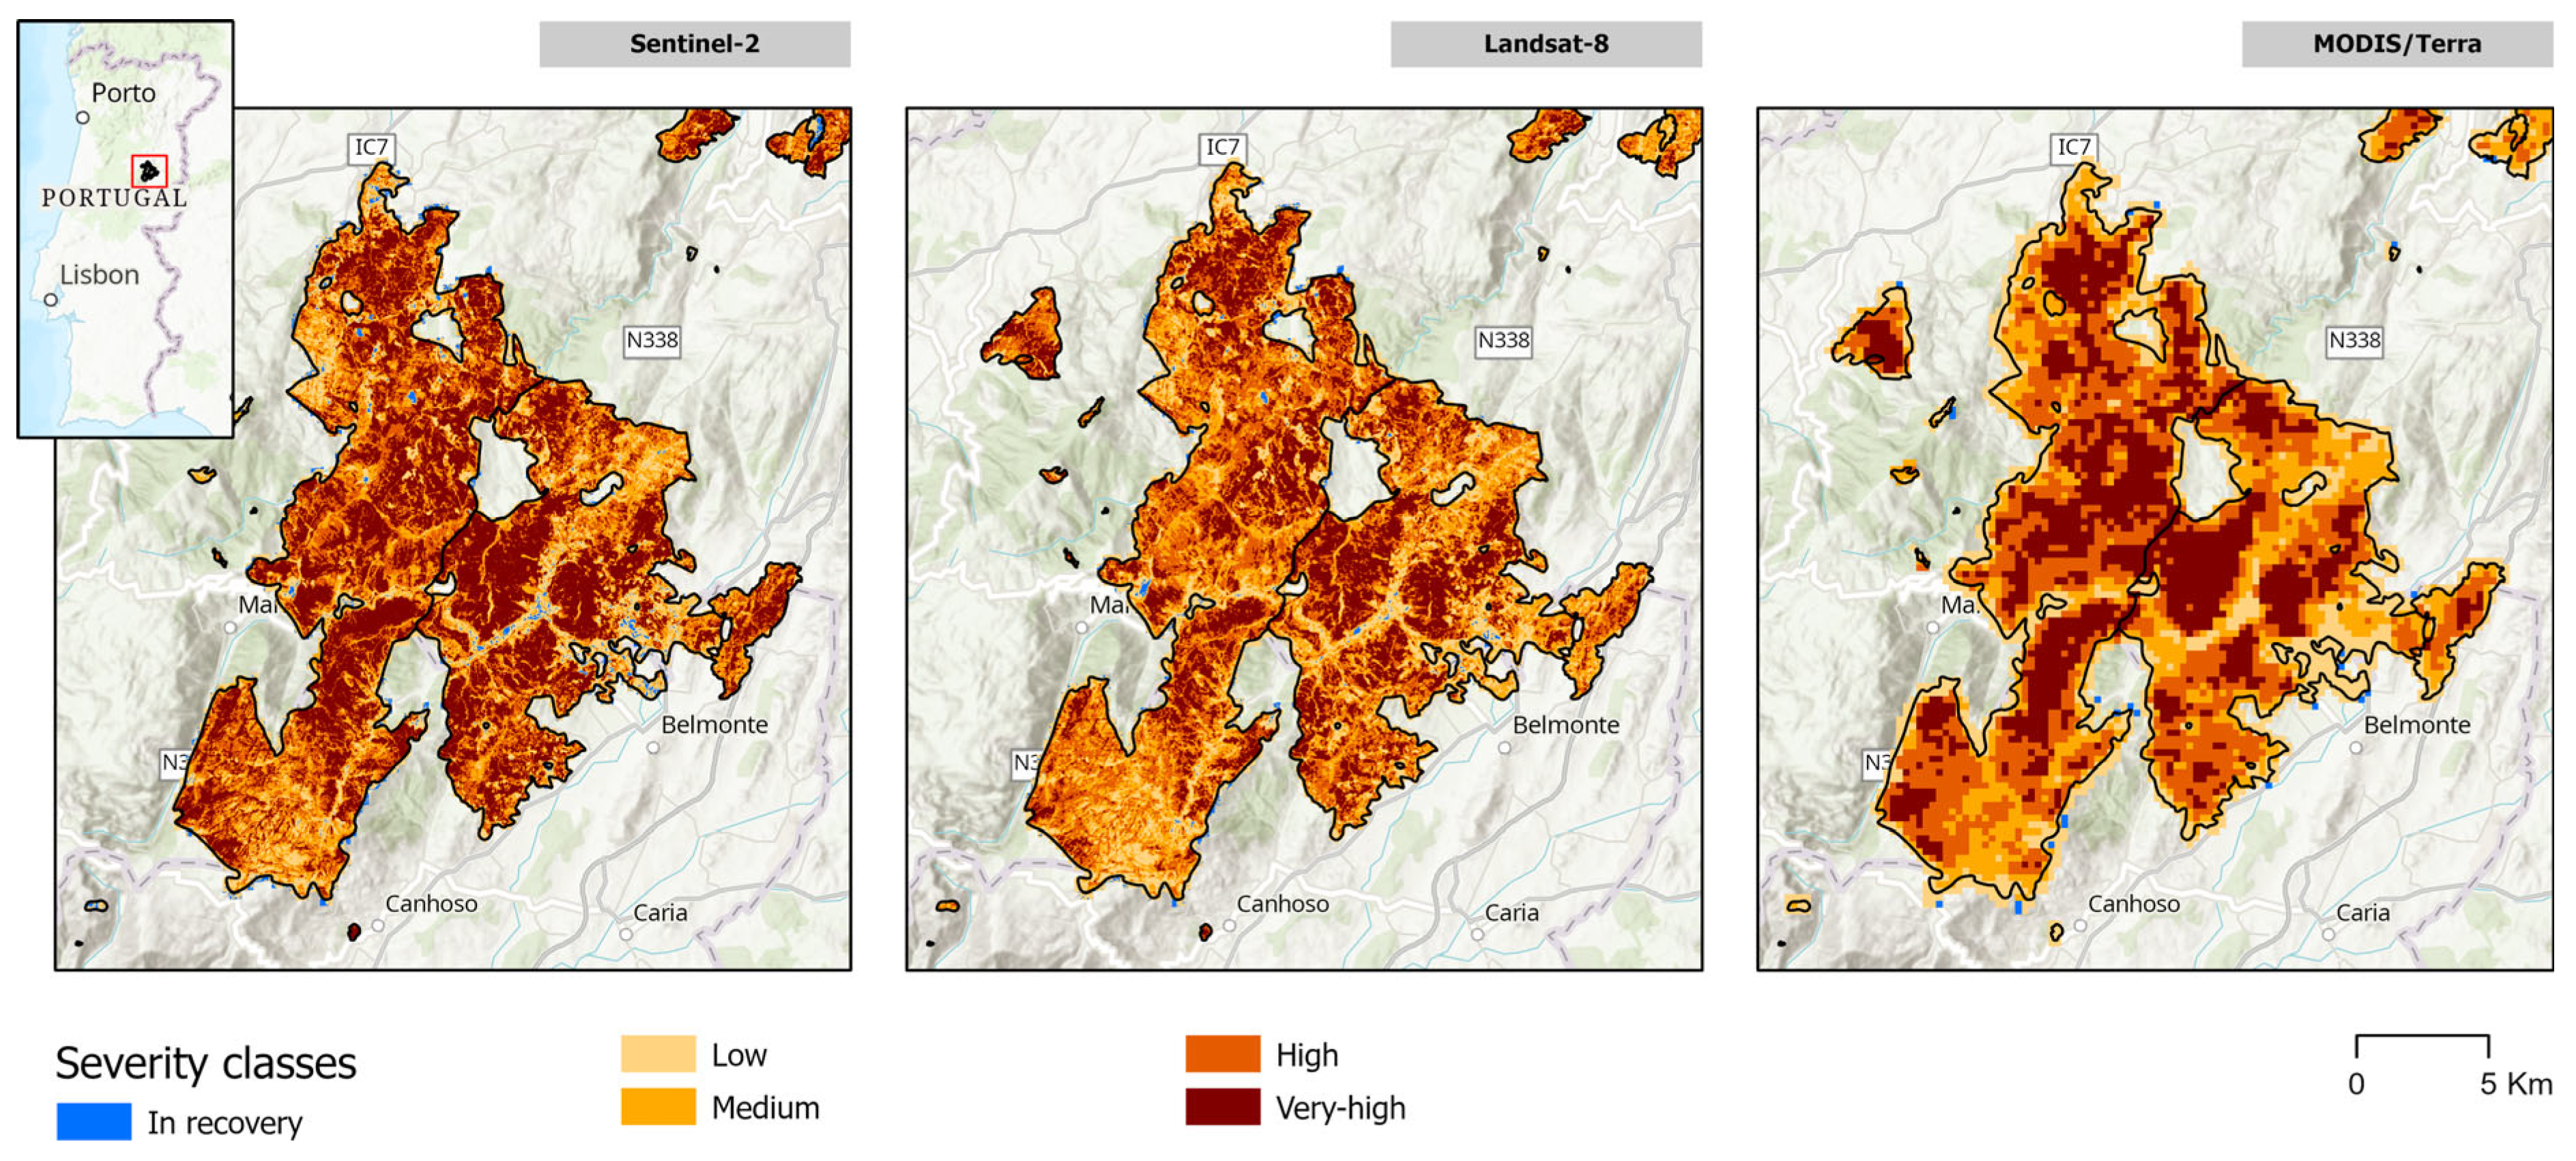
The platform generates a comprehensive set of burn severity products by integrating data from multiple satellite missions with different spatial, temporal, and spectral resolutions and various severity indicators. This approach enables a more comprehensive evaluation of wildfire impacts while providing more data to form evidence regarding patterns or trends across multiple spatial and temporal scales. It also provides the basis for identifying similarities and discrepancies among severity products resulting from different satellite missions and indicators (
Figure 6).
Comparison results (
Table 1) indicate that the SeverusPT platform offers more features than similar burn severity datasets or services, potentially enhancing its applicability and relevance. It supports three satellite missions (MODIS, Landsat-5, -7, and -8, and Sentinel-2), a capability unmatched by any other dataset, significantly enhancing its versatility for multisource assessments and comparisons (
Figure 7). Additionally, it incorporates all three severity indicators based on NBR (i.e., dNBR, RdNBR, and RBR) while allowing additional spectral indices through its modular calculation libraries, a feature not supported by any other service or dataset. This flexibility provides substantial analytical power for assessing burn severity.
SeverusPT is also fully extendable to any fire perimeter database, ensuring compatibility and adaptability for a wide range of regional and global applications. The unique features of SeverusPT also include its provision of multiple post-fire assessment periods (at up to 3, 6, 9, and 12 months after the fire) and support for temporal compositing (i.e., multitemporal mosaics known to outperform single images for severity assessments [
50], allowing post-fire vegetation recovery assessments over time, from maximum severity and early post-fire recovery.
Regarding spatial attributes, the SeverusPT data products have a smaller minimum mapping area—i.e., wildfire size threshold of >10 hectares—compared to other pre-calculated datasets such as the Portuguese Burn Severity Atlas [
40], MOSEV [
37], and Global Forest Burn Severity Dataset [
38], thus allowing finer and more detailed post-wildfire assessments. Given the platform’s modularity, such a threshold could be further reduced to include smaller occurrences if necessary.
Furthermore, data access and sharing are equipped with robust user-oriented features, such as data services (i.e., WMS—Web Map Service), a dedicated geoportal for accessibility, open calculation libraries, and simplified metadata. Despite the advantages, limitations also exist and are discussed in
Section 4.
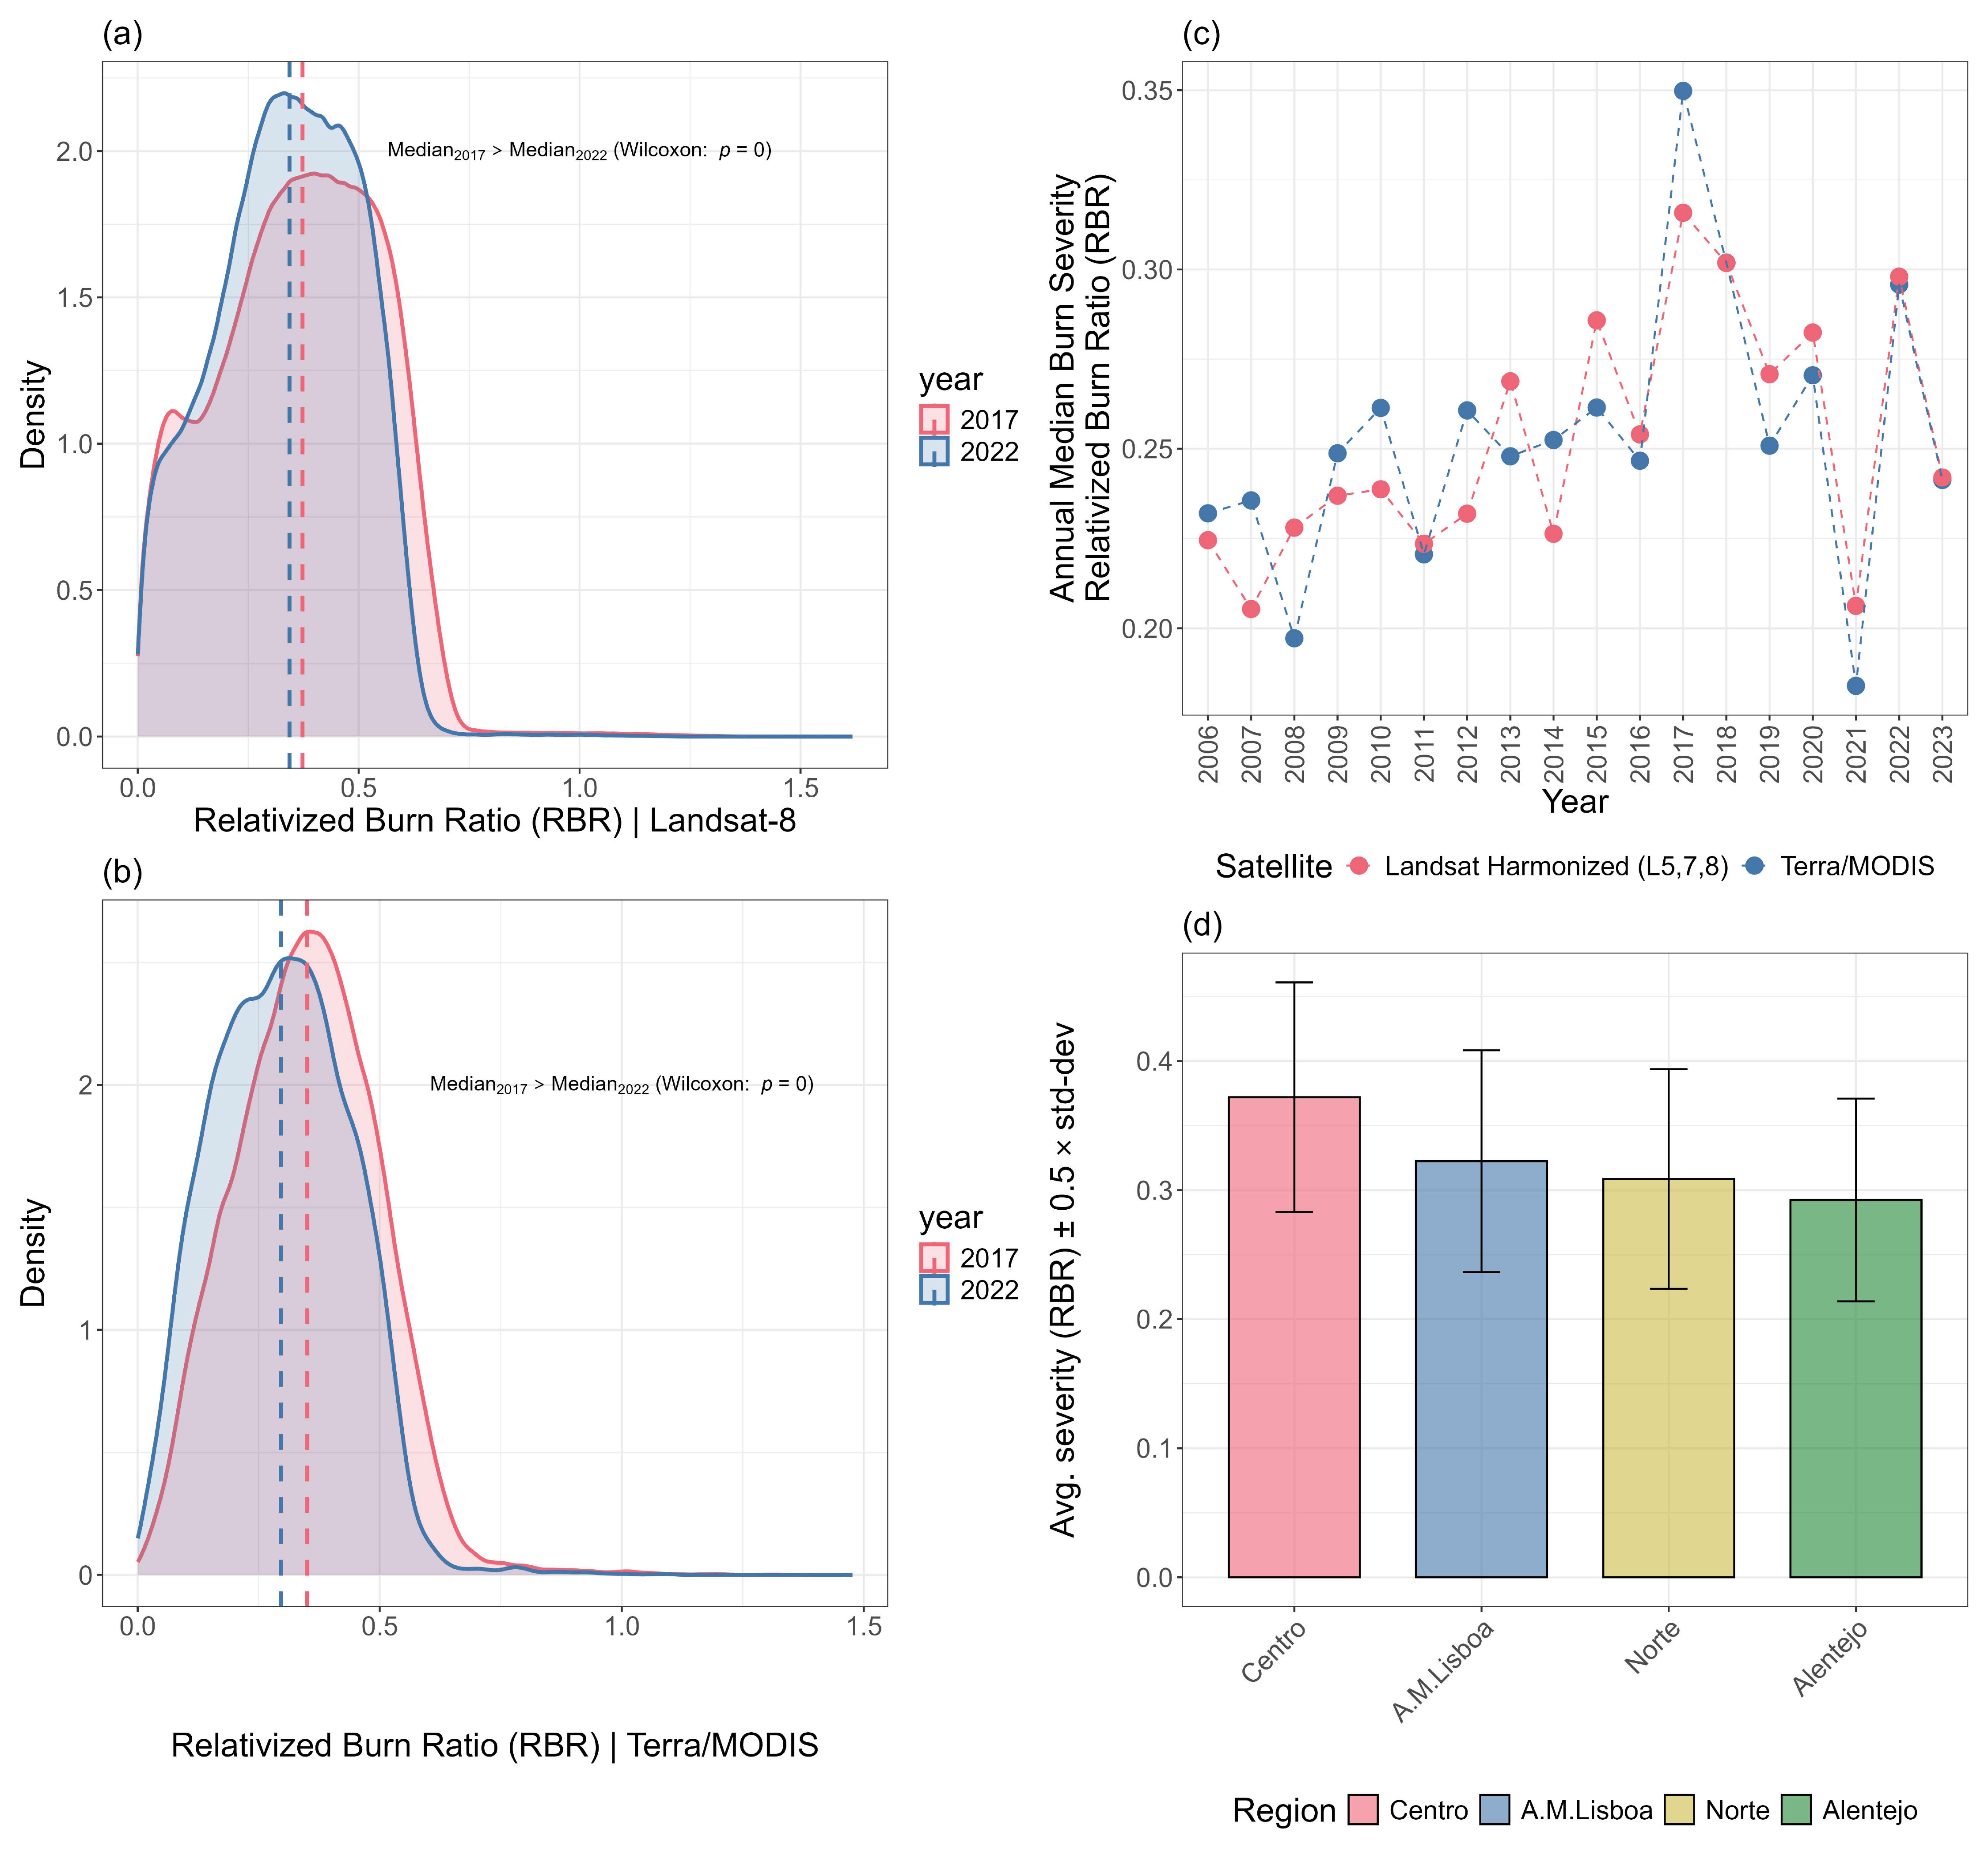
The exploratory analysis of burn severity data (
Figure 7) demonstrates the capability of burn severity products to compare different wildfire seasons, revealing a significantly higher median severity in 2017 compared to 2022 (Wilcoxon test, single-sided, i.e., median 2017 > median 2022,
p = 0;
Figure 7a,b). This result indicates that the data products can capture interannual variability and differences between wildfire seasons. Additionally, the temporal trend analysis highlights an evident rise in burn severity across mainland Portugal between 2006 and 2023 (
Figure 7c), with 2017 standing out as the most extreme wildfire season. The exceptionally high severity observed in 2017 can be attributed to an above-average period of fire activity and exceptional fire-weather conditions, including a severely dry and hot period, which created highly energetic and intense wildfires.
While a complete causal analysis is required regarding the rising burn severity trend, several underlying factors likely contribute to this increasing severity trend. The combination of rural land abandonment in inland regions of Portugal and subsequent afforestation has led to the proliferation of dense, highly flammable Mediterranean shrublands, often dominated by pyrophytic species. The lack of effective forest and fuel management has further exacerbated fire risks, accumulating high fuel loads, often with high horizontal continuity. Climate change effects—such as prolonged droughts, increasing temperatures, and more frequent heatwaves—also intensify fire severity across the region.
Regional comparisons of burn severity for 2017 (
Figure 7d) further highlight spatial disparities, with the central regions of mainland Portugal experiencing the most severe wildfires on average. Specifically, the NUTS-2 “Centro” region recorded the highest burn severity levels in 2017, corresponding to the year with the largest burned area (~520,000 hectares). This was followed by the “A.M. Lisboa” and “Norte” regions, suggesting that burn severity patterns are not uniform across the country but are influenced by regional differences in landscape patterns, vegetation structure and composition, land management, and climatic conditions. Overall, these exploratory analyses provide insights into the product’s capacity for spatial and temporal wildfire severity assessments and launch new questions to be deepened in subsequent studies.
4. Limitations and Future Developments
Despite the platform’s potential and broad applicability, its dependence on third-party services like Google Earth Engine (GEE, [
36]) introduces certain risks, including potential changes in the availability of analytical features or allocated computing time/resources due to evolving terms of use. However, GEE is a valuable tool in the context of this project as it facilitates access, preprocessing, spectral index calculations, spatiotemporal aggregations, and merging of image mosaics across large areas. It is also important to note that alternatives to the use of GEE can imply much higher computation times and resources that may not be readily available. The modular design of the platform should facilitate the adaptation to new contexts.
Another potential limitation of the platform is its reliance on optical satellite imagery, which can affect data usability and update, particularly in cases of high cloud cover or limited image availability. This limitation is particularly important for “cloudy” tropical and island regions, as well as for satellites with low to moderate temporal resolution, such as Landsat or even Sentinel-2, where data availability is often limited. To address these issues, future developments could incorporate additional satellite missions and implement more advanced algorithms for cloud detection and removal. Although the implemented feature of multitemporal image compositing helps to reduce cloud contamination [
50], it increases computational complexity and may slightly offset the detection of maximum burn severity.
Despite the advantages of the platform relying on third-party burned area databases like EFFIS [
51] (e.g., modularity, adaptability to other regions/contexts), it inherits its potential update delays and uncertainties. To address this issue, upcoming developments should aim to implement a self-integrated wildfire segmentation and classification pipeline using machine or deep learning methods, ensuring autonomous data updates.
Regarding future development of the platform, its modular design and architecture are inherently flexible and generalizable, making it adaptable to other geographic regions, satellite missions, spectral indices, and burn severity indicators. As such, the computation module can incorporate indicators to address different dimensions of matter-energy flows within ecosystems, such as productivity or vegetation greenness, water and moisture content, sensible heat, and albedo. This versatility provides a more comprehensive and multidimensional perspective on wildfire severity, capturing its impacts across ecological, hydrological, and energy balance dimensions (e.g., [
26]). Future versions are also expected to include advanced visualization tools that simultaneously display different severity products for the same region, allowing comparisons between indicators or periods, including more severity indicators and spatial-based filtering options. Finally, the platform’s capabilities could be further enhanced by integrating machine learning-based predictive modeling to estimate potential burn severity over short-to-medium timescales (e.g., two weeks to one month). This addition would expand the platform’s utility beyond post-fire analysis, supporting pre-fire planning and risk management.
5. Conclusions
Effective management of wildfires is an urgent and complex issue that requires innovative and integrated approaches that can contribute to overcoming the assessment of wildfire impacts by making severity estimates freely available, usable by all, regularly updatable in the future and based on open satellite data.
The platform proposed in the context of the SeverusPT project emerges as a significant response to this challenge by integrating standardized methods and a web data portal. The high level of standardization in the products allows for assessing and mapping burn severity, ensuring consistency and comparability across different fire events and periods. The data portal acts as a centralized access point for the multisource, multitemporal, multi-indicator, and regularly updated burn severity products, allowing access to and the filtering, visualizing, and downloading of spatial data and metadata for mainland Portugal. Furthermore, the platform’s capacity to generate new severity data as new data sources become available ensures that users can access the most updated information for decision-making and research purposes. By providing accurate and updated data on burn severity on a public access data portal, the platform offers several benefits, namely, (i) as a data source for the scientific community, allowing an in-depth assessment of burn severity spatial and temporal patterns and trends, assess impacts, and resilience of forest ecosystems and contributing for the understanding of wildfire dynamics and ecological processes; (ii) as a decision support tool for authorities as it can enable the identification of priority areas for recovery and ecological restoration and management of resource allocation, supporting the coordination of post-fire response efforts and implementation of preventive measures; and (iii) as an instrument for promoting awareness among the general public about the challenges associated with wildfires, encouraging active participation in conservation and prevention initiatives. However, it is important to recognize that the success of the data portal will depend not only on its technological robustness but also on the continuous commitment to updating data, collaboration among users, and adaptation to changes in wildfire science.
With the growing challenges of climate change and human development, the availability of tools like the present platform is paramount. This platform represents a significant step towards developing tools for effective wildfire management but also serves as a reminder of the ongoing need for innovation, collaboration, and commitment to protecting and conserving our ecosystems. The effective integration of scientific knowledge, geospatial data, and information technologies can contribute to a more coordinated and practical approach to assessing and mitigating the risks of wildfires.


 ,
, 
