Article

Relationship Between Post-Fire Vegetation Recovery and Soil Temperature in the Mediterranean Forest

1
Department of Life and Environmental Sciences, University of Cagliari, 09123 Cagliari, Italy
2
Servizio Tecnico Forestale, Agenzia Forestas, Viale Luigi Merello, 86, 09123 Cagliari, Italy
3
Research Centre of S. Teresa, ENEA (Italian National Agency for New Technologies, Energy and Sustainable Economic Development), 19032 Lerici, Italy
4
Servizio Territoriale di Oristano, Agenzia Forestas, Complesso Forestale Montiferru Planargia, 09170 Oristano, Italy
*
Author to whom correspondence should be addressed.
Submission received: 20 January 2025 / Revised: 22 February 2025 / Accepted: 23 February 2025 / Published: 25 February 2025

Abstract

:
In Mediterranean regions, fires are a key ecological factor, altering soil properties, biodiversity, and landscape dynamics. Post-fire recovery varies based on vegetation type, fire severity, and climate conditions. However, the specific relationship between post-fire vegetation recovery and soil temperature regimes remains poorly investigated. This study investigates this relationship in an area severely affected by a megafire. Three plots (unburned, low-severity fire, and high-severity fire) were monitored for species richness, vegetation cover and height, and soil temperature, with data from 2021 to 2024 analyzed. Vegetation surveys revealed that fire severity influenced species richness and vegetation cover and height. Particularly, burned areas showed a higher proliferation of pioneer and herbaceous species three years post-fire. Moreover, after the same period, burned areas showed consistently higher soil temperatures than the unburned ones, reflecting altered microclimatic conditions. This could be because the presence of more pioneer and herbaceous species is insufficient to mitigate the air temperatures. Our results show the impact of fires on soil and vegetation, highlighting the critical role of vegetation in modeling soil temperature. However, long-term monitoring is necessary to assess the real effect of vegetation type on soil temperature.

1. Introduction

Under tree canopies, organisms encounter unique climatic conditions that differ significantly from those outside forest environments [1,2,3]. Direct sunlight and wind speed significantly diminish inside the forest, resulting in a reduction of temperature and humidity fluctuations [4]. This creates microclimatic conditions that influence understory vegetation, soil biota and properties, and ecosystem processes [5,6]. In fact, microclimatic conditions can shape the physiology, occurrence, distribution, and development of biota [7]. Forests exhibit significant buffering of temperature extremes relative to open habitats, with colder maximum temperatures beneath the canopy, warmer minimum temperatures, and reduced seasonal and inter-annual variability [3,8,9]. This is due, among other factors, to the fact that vegetation intercepts solar radiation, leading to an increase in evapotranspiration and air mixing [2,4]. Additionally, micro-topographical features and intricate structural elements can alter microclimatic conditions in many forested areas [10,11]. The magnitude of positive and negative temperature differences between open lands and forest interiors depends on several factors, including forest structure, ambient temperatures, and local water balance [3,12,13]. Nevertheless, soil surface temperature—rather than air temperature—plays a more crucial role in defining the distribution and performance of most terrestrial species and many ecosystem functions, particularly those occurring at or below the soil surface [14,15,16,17,18]. For instance, daily and annual variations in soil temperature affect the decomposition and mineralization rates of soil organic matter, as well as CO2 emissions. Additionally, soil temperature influences plant growth directly (by influencing physiological activity) and indirectly (by influencing nutrient availability in the soil) [19]. At the same time, soil temperature is influenced by multiple factors, including site topography, soil water content, and texture, surfaces covered by litter and plant canopies, and climatic conditions such as air temperature and solar radiation [19].
Forest fires are a worldwide phenomenon that impacts many land areas. They are considered a devastating element in most tropical, temperate, and boreal forest ecosystems [20]. The magnitude of soil disturbance caused by fire depends on factors such as fire intensity, severity, duration, recurrence, fuel load, and soil characteristics [21]. The effects of fire on soil properties and characteristics are frequently spatially heterogeneous and mainly restricted to the top few centimeters of soil due to the unequal distribution of heat [22]. Despite the destructive effect of fires on forest vegetation and their role in modifying soil conditions, relatively few studies have analyzed the effects of fires on soil properties. For example, Memoli et al. [23] evaluated the impact of wildfires on different soil properties, such as pH, water content, and concentrations of C, N, Corg, P, NO2−, and NH4+ in shrub and tree stands. Gonzalez-Pelayo et al. [24] considered the variations in soil hydrological parameters under natural field conditions and after repeated fires, also considering the effect of the previous presence or absence of vegetation cover. Fernández-García et al. [25] studied the relationship between soil and vegetation, focusing on soil chemical and biochemical variables (e.g., total organic C, total N, available P, β-glucosidase, urease, and phosphatase) at different times after wildfire. Additionally, Caon et al. [26] reviewed changes in soil nutrient status in Mediterranean ecosystems affected by wildfires, showing that the soil nutrient content in burned drylands depends on the vegetation type, fire recurrence, and fire intensity. Moreover, the overall impacts of fire on soil geochemistry (including the composition of major and trace elements and their leachability capacity) have been evaluated by Megremi et al. [27]. Furthermore, forest fires expose vast areas of soil to air and sunlight, changing physical characteristics such as structure and humidity that subsequently impact the chemical and biological properties of the soil [21]. In addition, low-intensity fires that deposit ash on soil surfaces alter soil chemistry, increasing accessible nutrients and pH. In contrast, high-intensity fires are known for completely consuming organic matter and causing serious damage to forest soils [28]. At the same time, the combustion of plants induces various direct effects on biological, hydrological, and geomorphological processes, such as the loss of the organic litter layer [29]. After vegetation cover, the organic layer (including both the organic horizons of the pedological profile and those where the organic component is intimately connected to the mineral fraction) is the primary anti-erosion agent, as it cements soil particles and increases stability. The loss of this layer affects soil temperature, as it acts as an efficient thermal insulator [29]. It is plausible that areas where fire is more intense will experience higher soil temperatures and more significant impacts on soil and, more generally, on the ecosystem. Furthermore, seasonality could influence these effects, since factors such as soil moisture and vegetation present at the time of fire can contribute to determining the overall impact of fire on the ecosystem. However, despite soil temperature playing a fundamental role in ecosystem functioning, the effects of fire on this variable remain poorly studied and poorly understood.
Mediterranean climate regions rank among the most fire-prone globally [30]. Wildfires have been a recurring disturbance factor for millions of years, affecting ecosystem and forest biodiversity, species compositions and structures, and plant species characteristics, as well as the dynamics of natural vegetation and, ultimately, shaping landscapes e.g., [31,32,33]. Forests are frequently replaced by shrub or sparse woodland following severe fires, and they may turn into bare ground or arid grassland if they are burned repeatedly [34]. Current knowledge suggests that when canopy cover falls below approximately 75%, the protection of forest microclimates and biodiversity from climatic extremes decreases significantly [4,35]. This is particularly relevant in Mediterranean ecosystems, where temperatures are expected to increase by 0.9–5.6 °C by the end of 2100 compared to the last decades of the 20th century, with more frequent and intense heatwaves and drought [36].
Over the past few decades, wildfires have increased in frequency and severity due to land abandonment and global warming [33,37,38]. This trend raises concerns about potential detrimental effects on biodiversity, traditional landscapes, ecosystem functions and services, post-fire vegetation recovery dynamics, and, ultimately, human well-being [32,39]. Post-fire dynamics can be very different, and it may take a long time for forests to return to their pre-fire conditions [40,41,42]. Post-fire vegetation recovery time, in fact, can vary depending on factors such as vegetation type, fire severity, post-fire climate conditions, and ecoregions [43,44,45,46,47]. For instance, fire severity influences vegetation recovery as recovery rates are enhanced with increasing severity. However, extremely severe fires significantly reduce it. Furthermore, pre-fire vegetation characteristics may influence post-fire recovery rates in two ways: higher pre-fire greenness is associated with more intense fires and longer recovery, while lower pre-fire greenness is associated with faster recovery [48]. In addition, complex dynamics occur at the edges of burned areas, for example, the phenomenon of delayed mortality [49], which makes post-fire vegetation recovery dynamics extremely complex and, often, site-specific. After a fire, vegetation regeneration is primarily influenced by the sprouting of new shoots from surviving underground plant components and the germination of heat-resistant seeds. Many plant species have developed survival strategies that allow them to sacrifice their above-ground phytomass to endure forest fires [39,50,51,52]. Moreover, many Mediterranean plants show fire adaptations such as thick barks, resprouting ability, or stimulation of reproduction after fire exposure [53,54,55,56,57].
Although the relationships between topography, soil characteristics, soil temperature, and soil moisture have been widely studied, the biotic influence of vegetation on these aspects is still a subject of research [58,59]. In particular, it is known that dense vegetation covers can mitigate abiotic conditions, reducing the variability of soil temperature and moisture [60,61]. Numerous studies have analyzed vegetation recovery after fire [33,49,52,62,63], but to our knowledge, the short-term response of vegetation is often neglected, especially the differences between areas with different levels of fire severity. However, short-term vegetation recovery is crucial to understanding how changes in associated variables, such as vegetation composition, cover, and height, can contribute to broader ecosystem changes. Furthermore, the existing literature rarely considers together different species types (structural and non-structural) or different vegetation layers, aspects that are fundamental for a more complete view of post-fire recovery. Additionally, to our knowledge, no studies have investigated in detail the relationship between post-fire vegetation recovery and soil temperatures in the Mediterranean Basin. Initiating a study immediately after a fire is challenging, so such data are often difficult to obtain. In this context, our investigation began measurements immediately after the fire, establishing a baseline for vegetation dynamics and soil temperature.
Within this general framework, our study aimed to explore the potential relationships between post-fire vegetation recovery and soil temperature patterns in the short term following a megafire. Specifically, we set three main objectives: (1) investigate the short-term response of vegetation in areas with different levels of fire severity; (2) assess the soil temperature regimes in areas with different levels of fire severity; and (3) analyze if and how the vegetation recovery patterns affect the soil temperature regimes after a megafire. According to these objectives, we formulated the following hypotheses. (1) Vegetation recovery (in terms of number, cover, and height of species) will be slower in areas affected by high-severity fire, but the recovery rate is expected to vary depending on the species assemblages. Specifically, woody structural species may show a slower recovery compared to non-structural pioneer herbaceous species. Since our study focuses on short-term vegetation recovery, we expect that certain parameters, such as species richness, may recover more rapidly than others (e.g., height and cover), as initial post-fire recolonization is often dominated by fast-growing herbaceous species. (2) Soil temperatures will be higher in areas affected by high-severity fire. Nevertheless, the extent of these temperature changes may be influenced by seasonal fluctuations and vegetation dynamics, with stronger effects probably seen during the warmer months. (3) Post-fire vegetation recovery (in terms of total cover and height) will influence soil temperature over time, although it may not be sufficient to restore pre-fire conditions in the short term. We believe that increased plant cover and height will help to moderate soil temperature variations by limiting, for example, direct solar radiation.

2. Materials and Methods
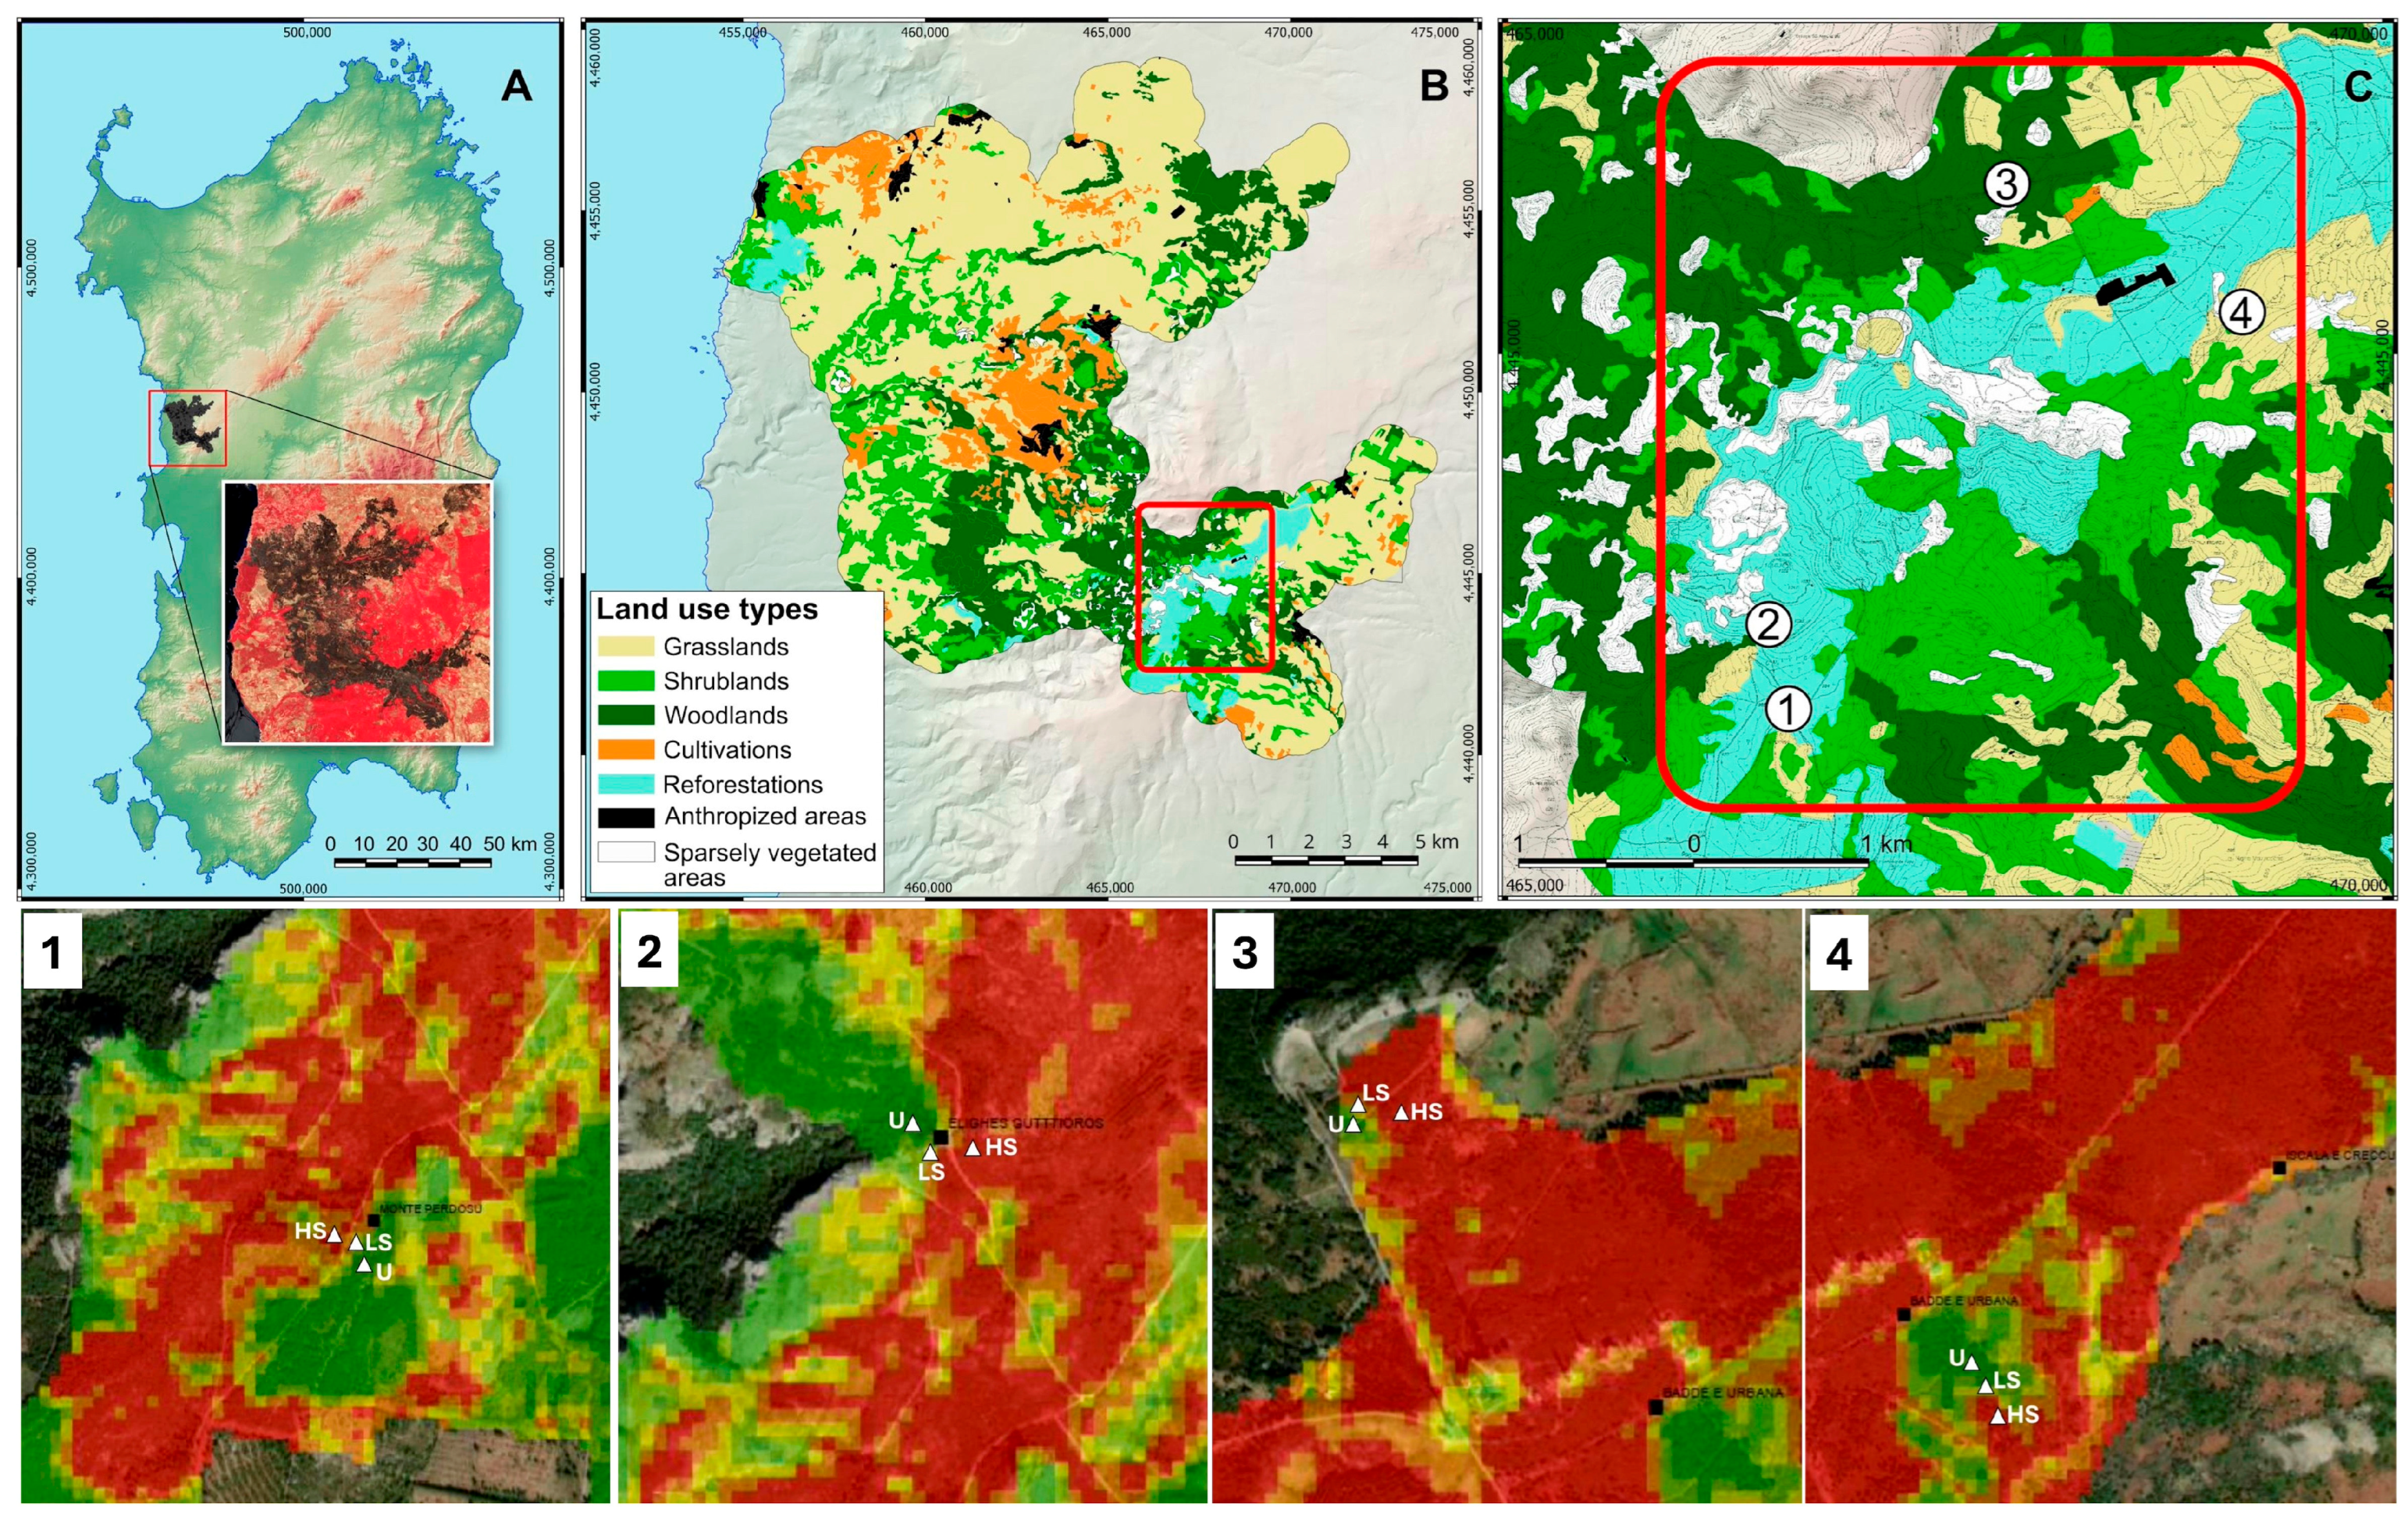
2.1. Study Area

The study area is located within the forest complex called “Pabarile”, covering an area of 768 ha in the upper section of the Montiferru massif (CW-Sardinia; Figure 1). Geolithologically, this area is characterized by basaltic lava flows and deeply incised lava sheets, which show two distinct volcanic cycles: the first occurred from the Oligocene to Miocene periods and the second from the Pliocene to Quaternary periods. This massif, originating from a Plio-Pleistocene shield volcano and surrounded by a large volcanic plateau, is mainly composed of trachytes, phonolites, and alkaline basalts, with some variations in composition due to the complex volcanic evolution of the region [64]. The “Pabarile” forestry commission yard, predominantly andesitic, includes the highest altitudes of the massif (above 800 m asl) and the peak of the massif (Mount Urtigu, 1050 m asl).
Bioclimatically, the area falls within the Mediterranean pluviseasonal oceanic bioclimate, in the upper meso-Mediterranean and lower humid belt [65], according to the Rivas–Martínez classification system [66]. There are no weather stations in this area, so there are no detailed climate data. However, available data from the nearest weather stations indicate a typically Mediterranean climate (mean annual temperatures ranged from 8.8 °C in January to 24.6 °C in August, and mean annual rainfall was 739.3 mm [52]).
The study area was affected in 2021 by a megafire (according to [67]) that occurred between the 23rd and 28th of July, affecting over 12,000 ha (Figure 1). This is not an isolated phenomenon, as other megafires of similar duration and intensity occurred in the same areas in 1976, 1984, and 1994 (Fenu G., personal communication; www.sardegnageoportale.it (accessed on 3 December 2024)).
Before this extreme event, the vegetation of the “Pabarile” forestry commission yard was mainly characterized by sclerophyllous forest communities dominated by holm oak (Quercus ilex L.), mainly referable to the Saniculo europaeae-Quercetum ilicis association, as well as mixed forests with deciduous oaks. A large portion of the area, especially at higher altitudes, was occupied by conifer afforestation. Throughout this area were widespread high-altitude heather groves of Erica arborea L. with Genista desoleana Vals., Cytisus villosus Pourr., and Crataegus monogyna Jacq. and, in the most degraded areas, garrigues referable to the Armerio sardoae-Genistetum desoleani association.

2.2. Experimental Protocol and Data Collection

The experimental activities were carried out within the forestry commission yard following a collaboration agreement specifically drawn up for this purpose. Study areas were selected based on the map developed by Rossetti et al. [52], which assessed the burned area and fire severity classes using remote sensing techniques. This map, with a 10 m spatial resolution, was derived from Copernicus Sentinel-2 multispectral data using the normalized burn ratio (NBR) and the differenced normalized burn ratio (dNBR) as spectral indices. To avoid redundancy, we refer to Rossetti et al. [49,52] for a detailed description of the methodology used to generate the spectral recovery map. The map summarized the burn severity classes proposed by the EFFIS (2022) and, among these, the three main severity classes relevant to this study were selected corresponding to three plots: unburned (our control plot), low-severity fire (0.27 > dNBR > 0.44), and high-severity fire (dNBR > 0.66).
In the first step, all areas dominated by holm oak forests were identified, ensuring that the three selected fire severity classes were located within less than 250 m from each other. Subsequently, a further selection was made through field surveys to filter areas with the same ecological conditions in terms of altitude, slope, exposure, soil substrate, and forest type. Four study areas with similar environmental characteristics were identified (Figure 1). We therefore assumed that any differences between plots were a result of the fire intensity.
During the autumn–winter of 2021, three plots of 15 × 10 m were positioned in each of the four selected areas (Figure 1), one for each severity class, following a gradient of increasing fire severity. All plots were fenced with wire mesh to exclude potential grazing by wild or domestic livestock. These preliminary operations were concluded before the beginning of the growing season so that we could include the zero point in our experimental design.
Every year, in late spring (except in 2021, when surveys were conducted three months after the fire), field surveys were carried out to collect parameters related to the structure (i.e., layering, canopy cover) and species composition of the Q. ilex forests in each plot. Vegetation layering was recorded by visually estimating the height and percent cover of each layer. The floristic composition was determined by listing and counting all vascular species occurring in each vegetation layer (species richness) and their relative abundance (plant cover) within the target community. The cover of each species was visually estimated. Since the composition of Mediterranean Q. ilex forests may undergo seasonal variations due to differences in species phenology, at least two field recognitions per year, one in spring and one in early summer, were performed to ensure the identification of the entire potential floristic assemblage.
In December 2021, two probes were placed in each study area to detect soil temperature: one in the unburned plot (in this case defined as the control plot) and one in the high-severity fire plot (in this case defined as the burned plot), and therefore at the extremes of the fire severity gradient. No probes were placed in the low-severity fire plot because, given their proximity to the two extreme plots, unburned and high-severity fire, an overlap in the detected values could have occurred, making it difficult to appreciate differences. To ensure greater clarity in the results, it was therefore decided not to place the probe in this plot. As currently used in ecology and evolution studies [68], soil temperature was recorded at 120-min intervals by a Pendant sensor (HOBO Onset, Bourne, MA, USA) placed in the soil at a depth of 5–8 cm. The accuracy of T sensors is ± 0.5°C.

2.3. Data Analysis

Soil temperature data were regularly downloaded using the shuttle (U-DTW-1—HOBO Waterproof Shuttle Data Transporter) and analyzed with HOBOware Software version 3.7.28. Then, consistent with what has been conducted in similar studies on forest habitat [69,70,71], the mean daily, monthly, and seasonal temperatures were calculated. In addition, using the minimum and maximum daily temperatures, the temperature range between these values (ΔT) was calculated. The daily soil ΔT values obtained were then analyzed at monthly and seasonal levels.
Before proceeding with the analysis, all plant species found in the plots were categorized into two groups:
(1)
Structural plants, including all characteristic or differential species of the association (Saniculo europaeae-Quercetum ilicis), alliance (Fraxino orni-Quercion ilicis), and vegetation class (Quercetea ilicis);
(2)
Other species not included in the above-mentioned syntaxa.
In plots where the vegetation was composed of more than one layer and therefore the total cover of species exceeded 100% due to the overlap of different layers, the plant species covers were standardized before the analysis.
After assessing the homogeneity of variance using Levene’s test, nonparametric Kruskal–Wallis tests, and Dunn’s post hoc comparisons were performed to analyze vegetation recovery. Specifically, the number, cover, and height of species were compared across the three different plots (unburned, high-severity fire, and low-severity fire) for each year investigated. These analyses were performed first considering the total species present in the plots and, secondly, considering separately the structural species and the non-structural species (other species) present within the plots. Moreover, we repeated the same analyses to study vegetation recovery by comparing the cover and height of species, distinguishing between tree, shrub, and herbaceous layers, across the three different plots (unburned, high-severity fire, and low-severity fire) for each year investigated.
To compare average soil temperature and soil ΔT (both monthly and seasonally across all years) between the control and burned plots, the nonparametric Kruskal–Wallis tests and Dunn’s post hoc comparisons were performed.
Bonferroni correction was applied in all the above-mentioned nonparametric statistical tests to the post hoc comparisons to obtain more conservative p values. In the results section, we discuss in detail only the statistically significant differences that occurred after the post hoc, to make the writing clearer and facilitate data interpretation. The analyses were performed in JASP version 0.19.1 [72].
The multiple linear regression test was used to assess the relationship between the vegetation recovery, especially using the variables number, cover, and height of total species, and the soil temperature and soil ΔT. The monthly averages of soil temperatures and soil ΔT were considered in this model, considering both the values measured in the control plots and the values present in the burned plots (high-severity fire plots). The standardized partial regression coefficient BETA was used to determine the significance of each principal component with respect to vegetation recovery. These analyses were performed using Statistica software version 8.0 (StatSoft Inc., Tulsa, OK, USA, [73]).
The level of statistical significance for all the analyses was set at p < 0.05.

3. Results

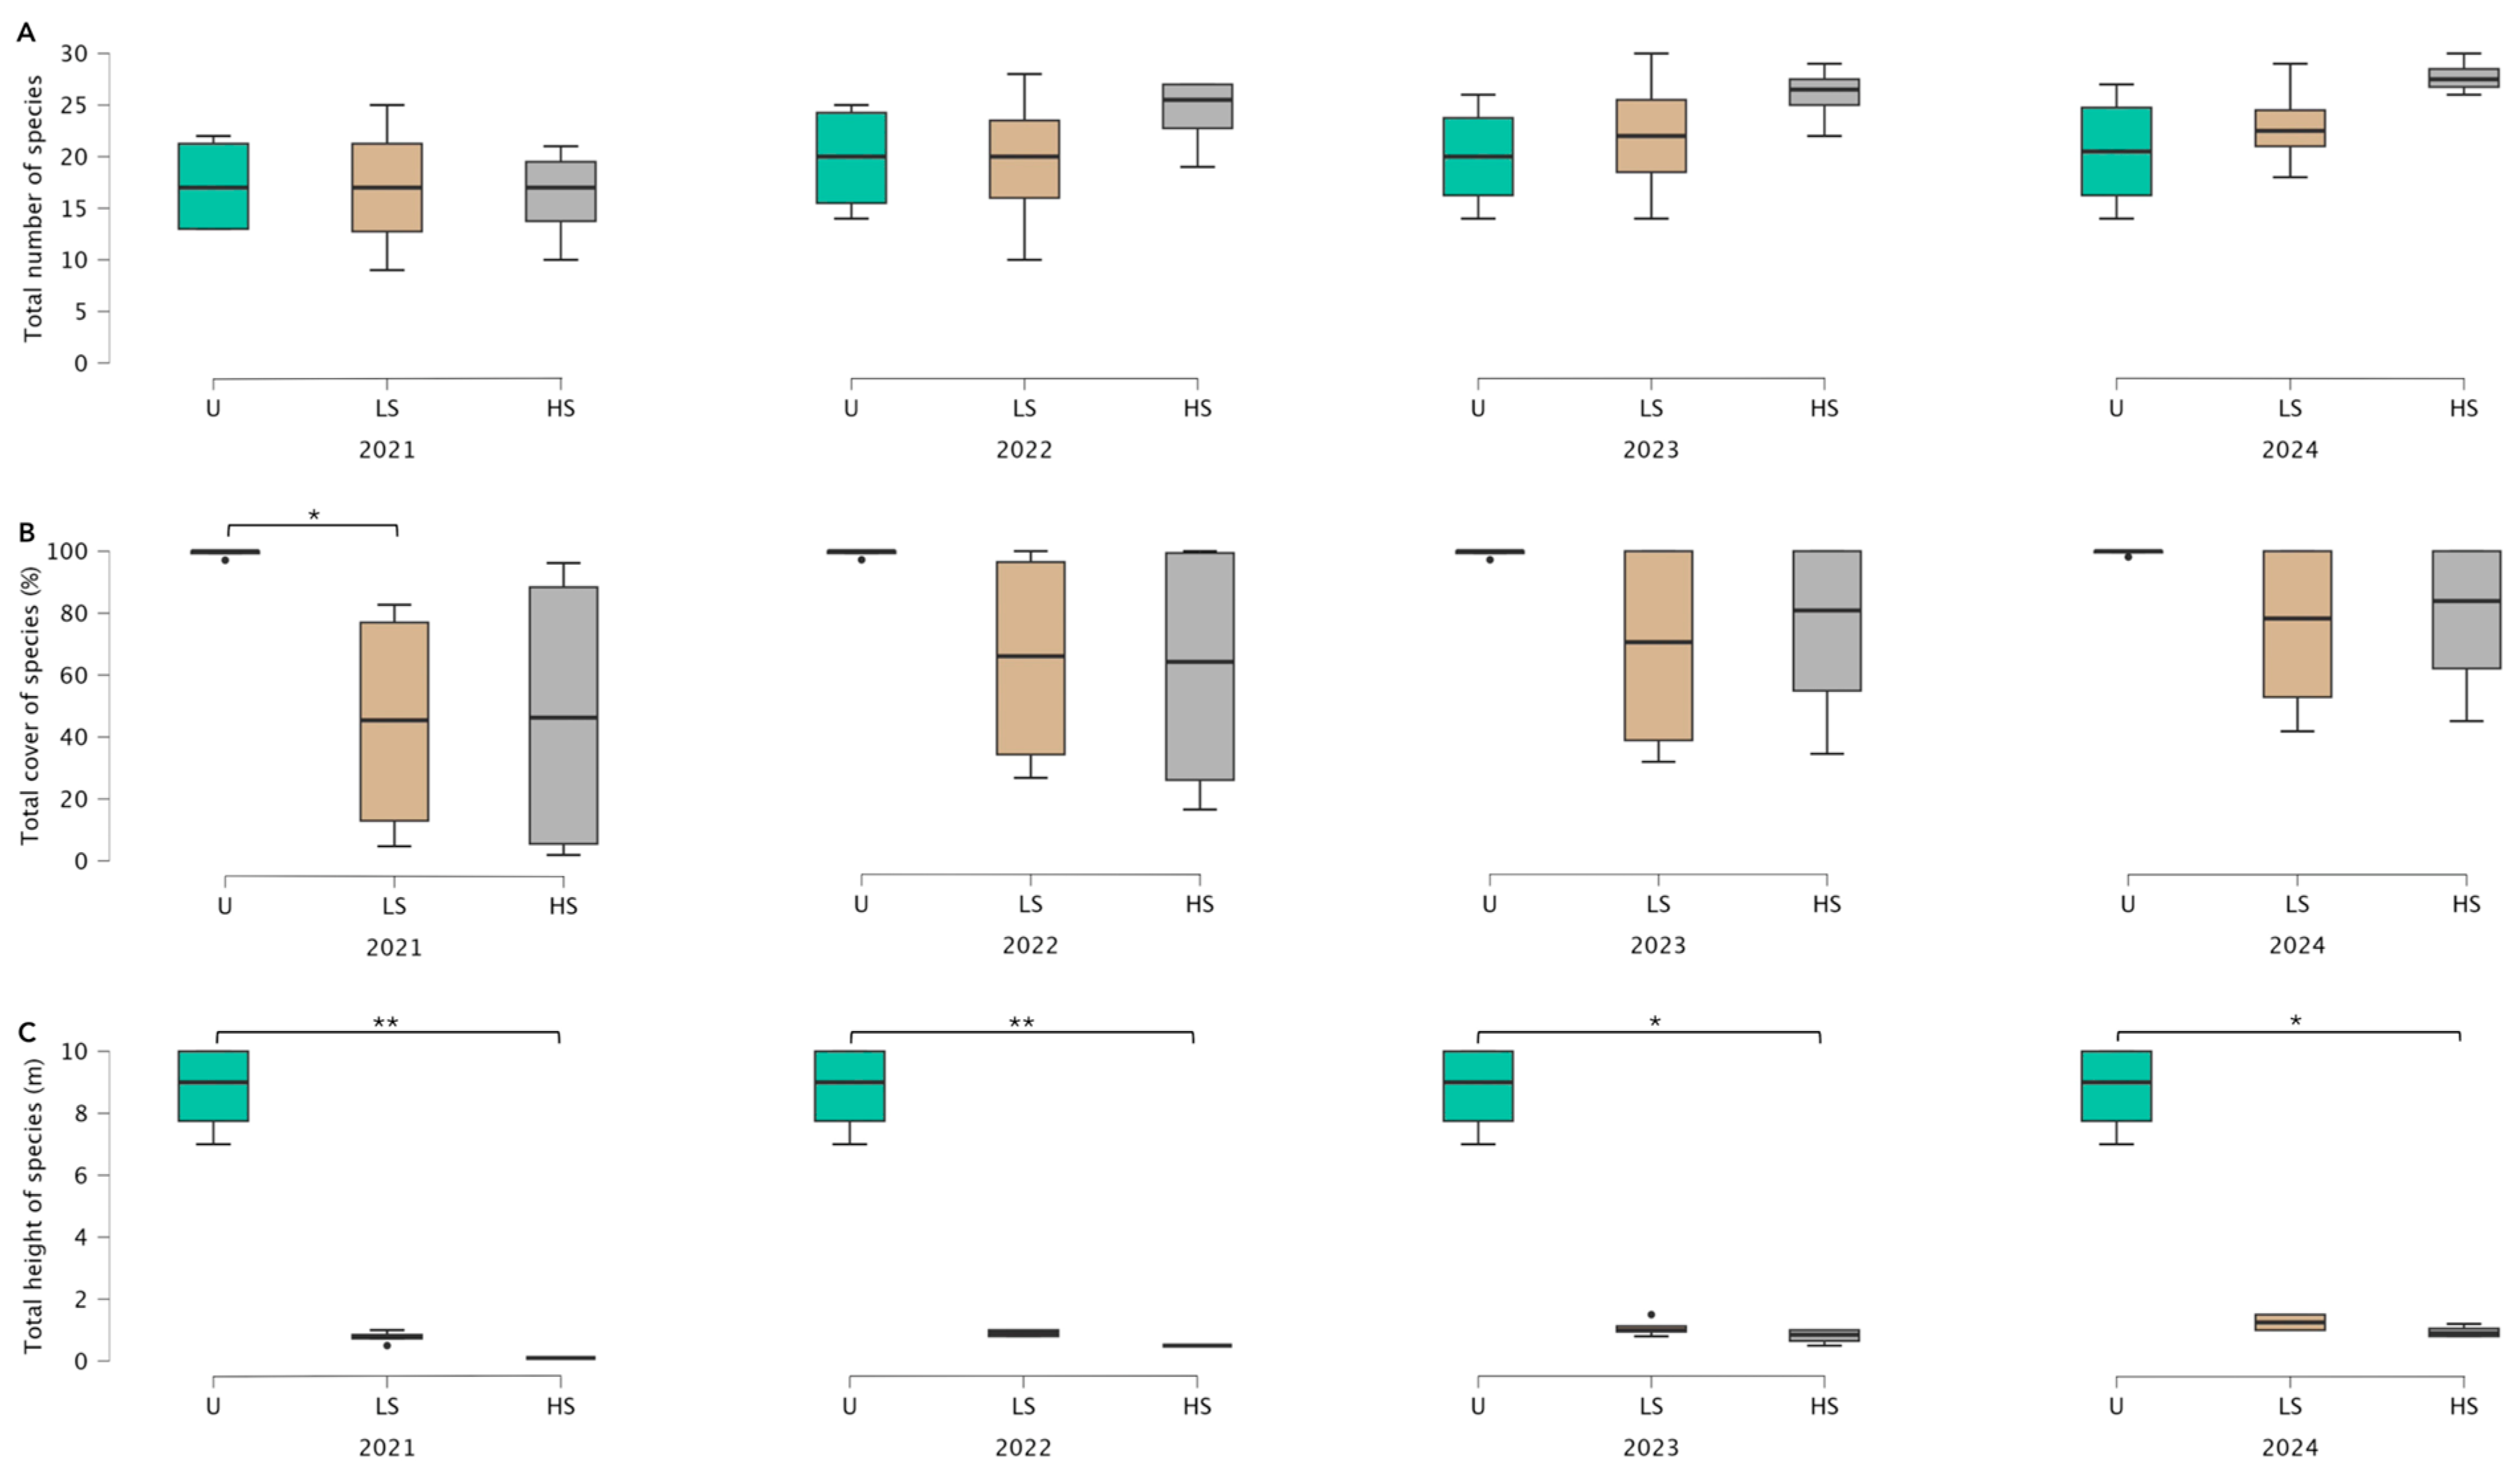
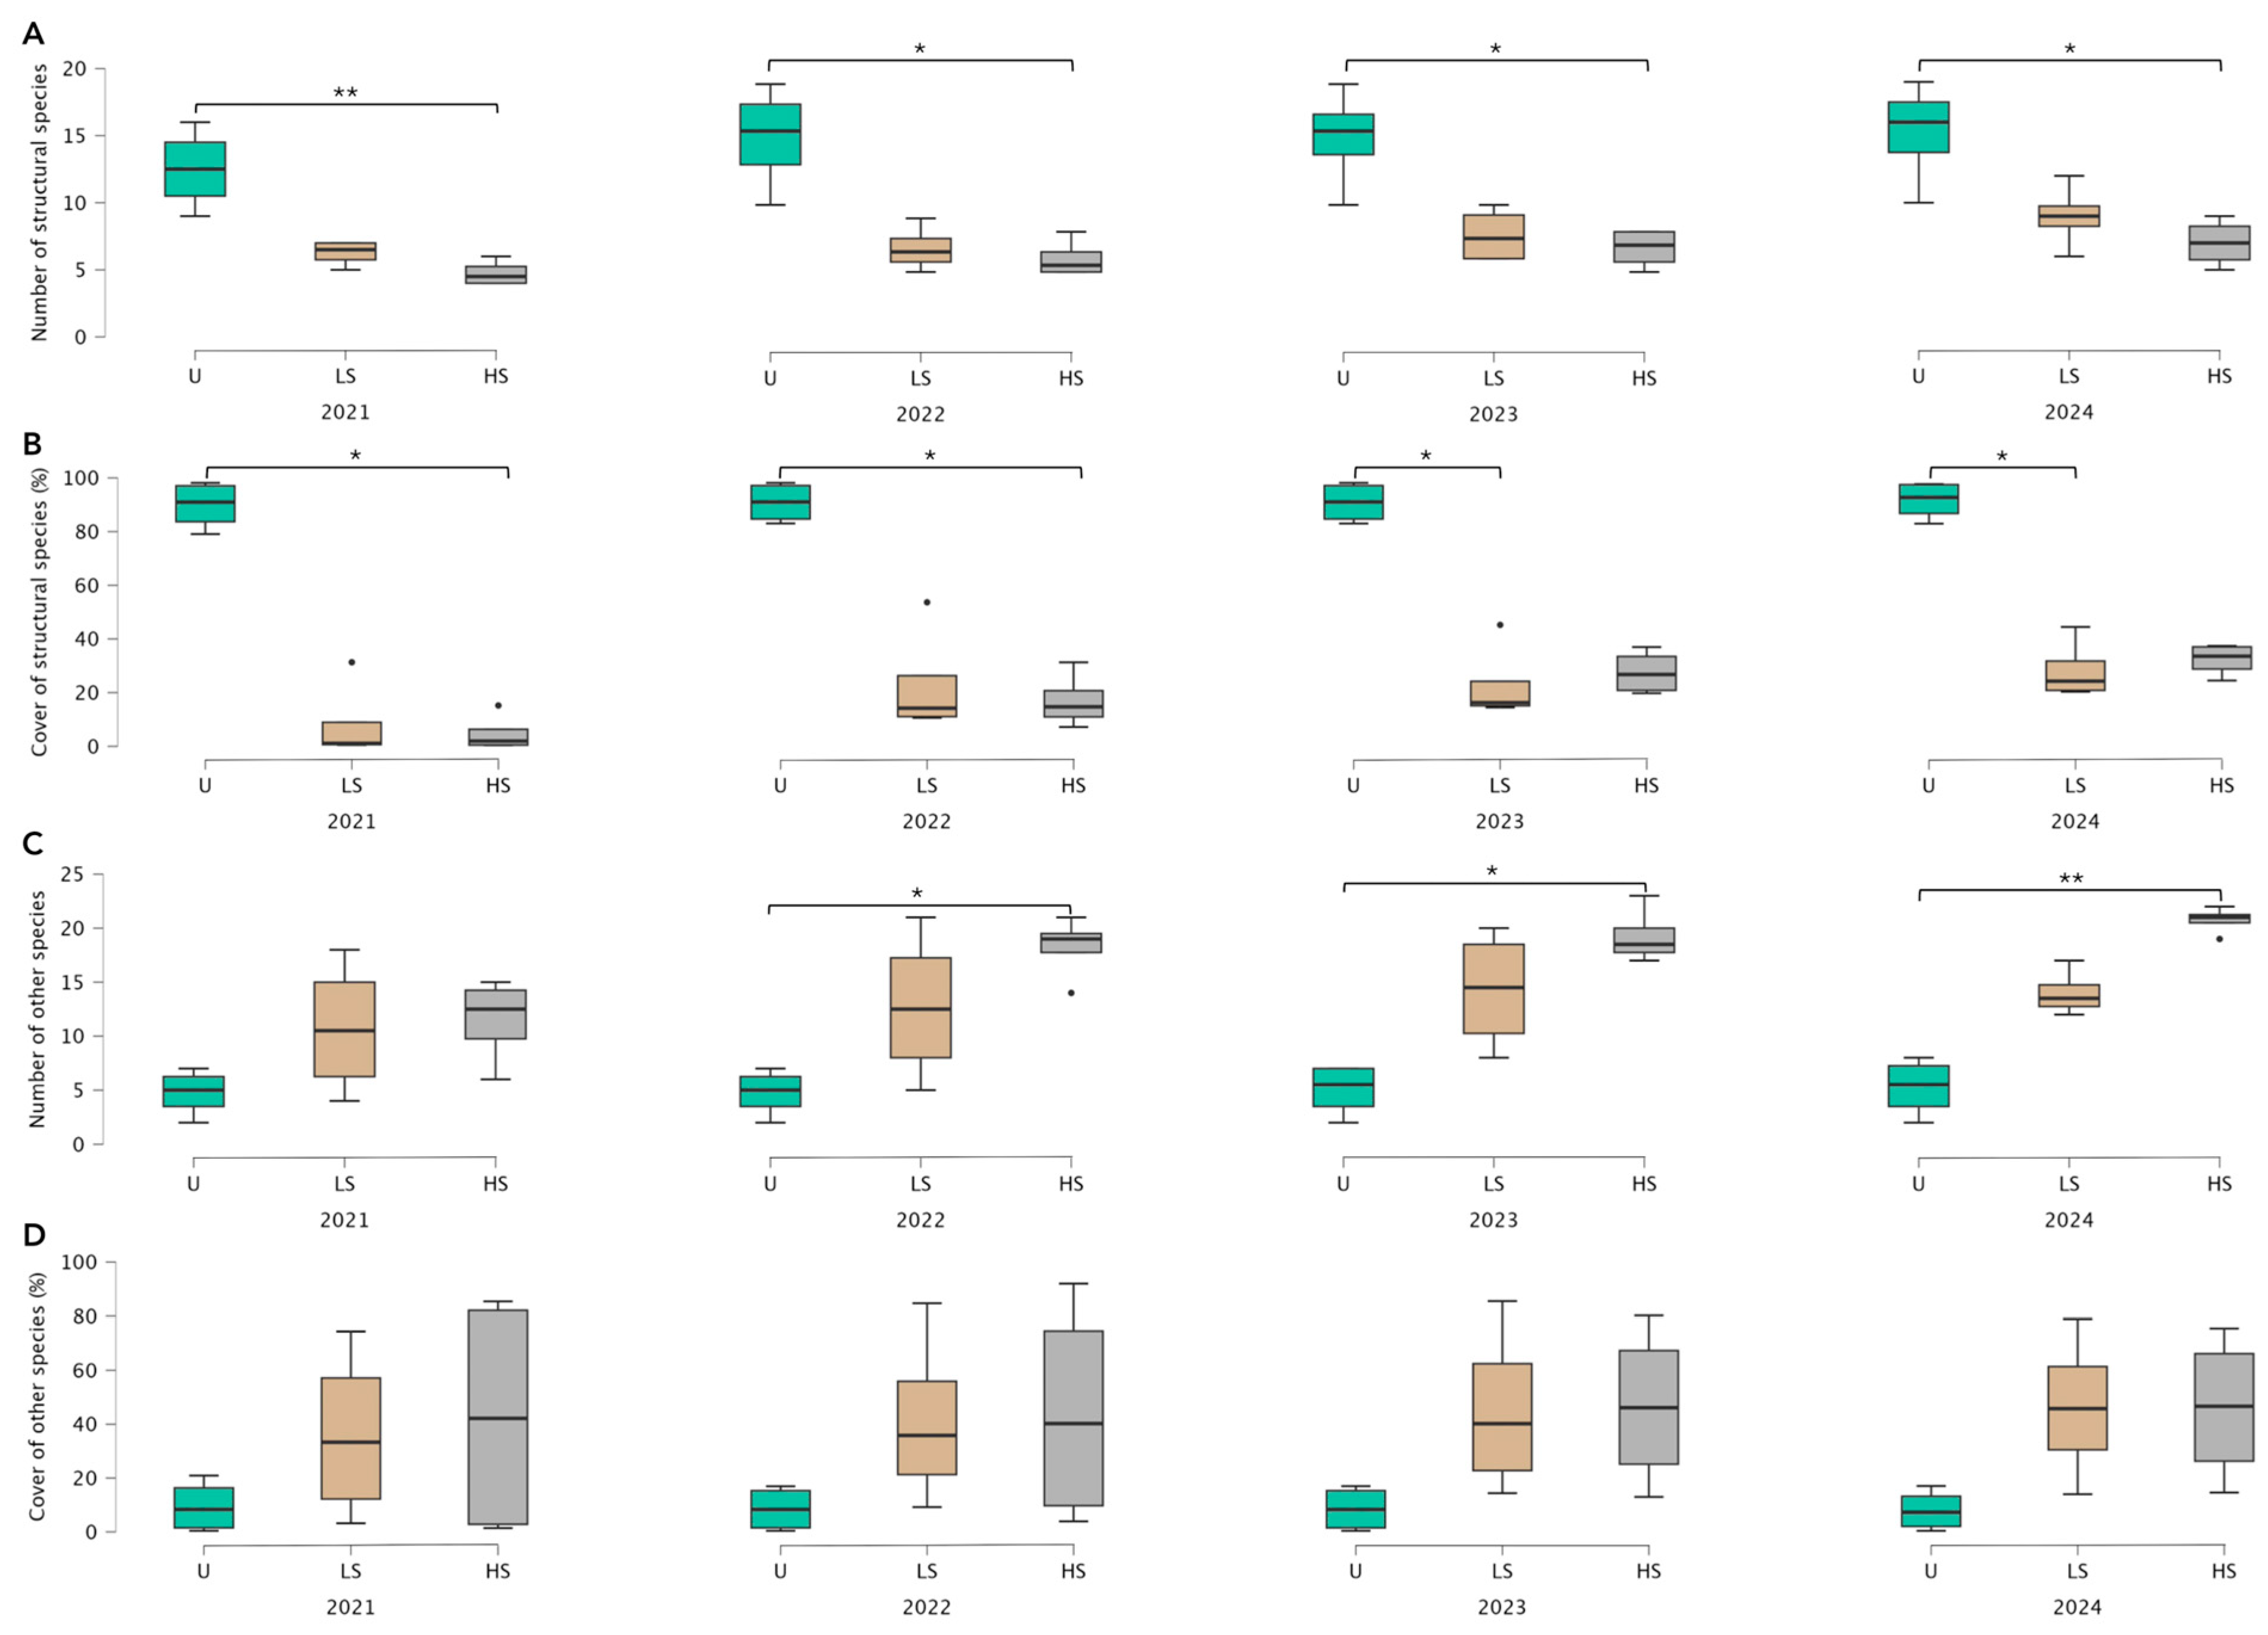
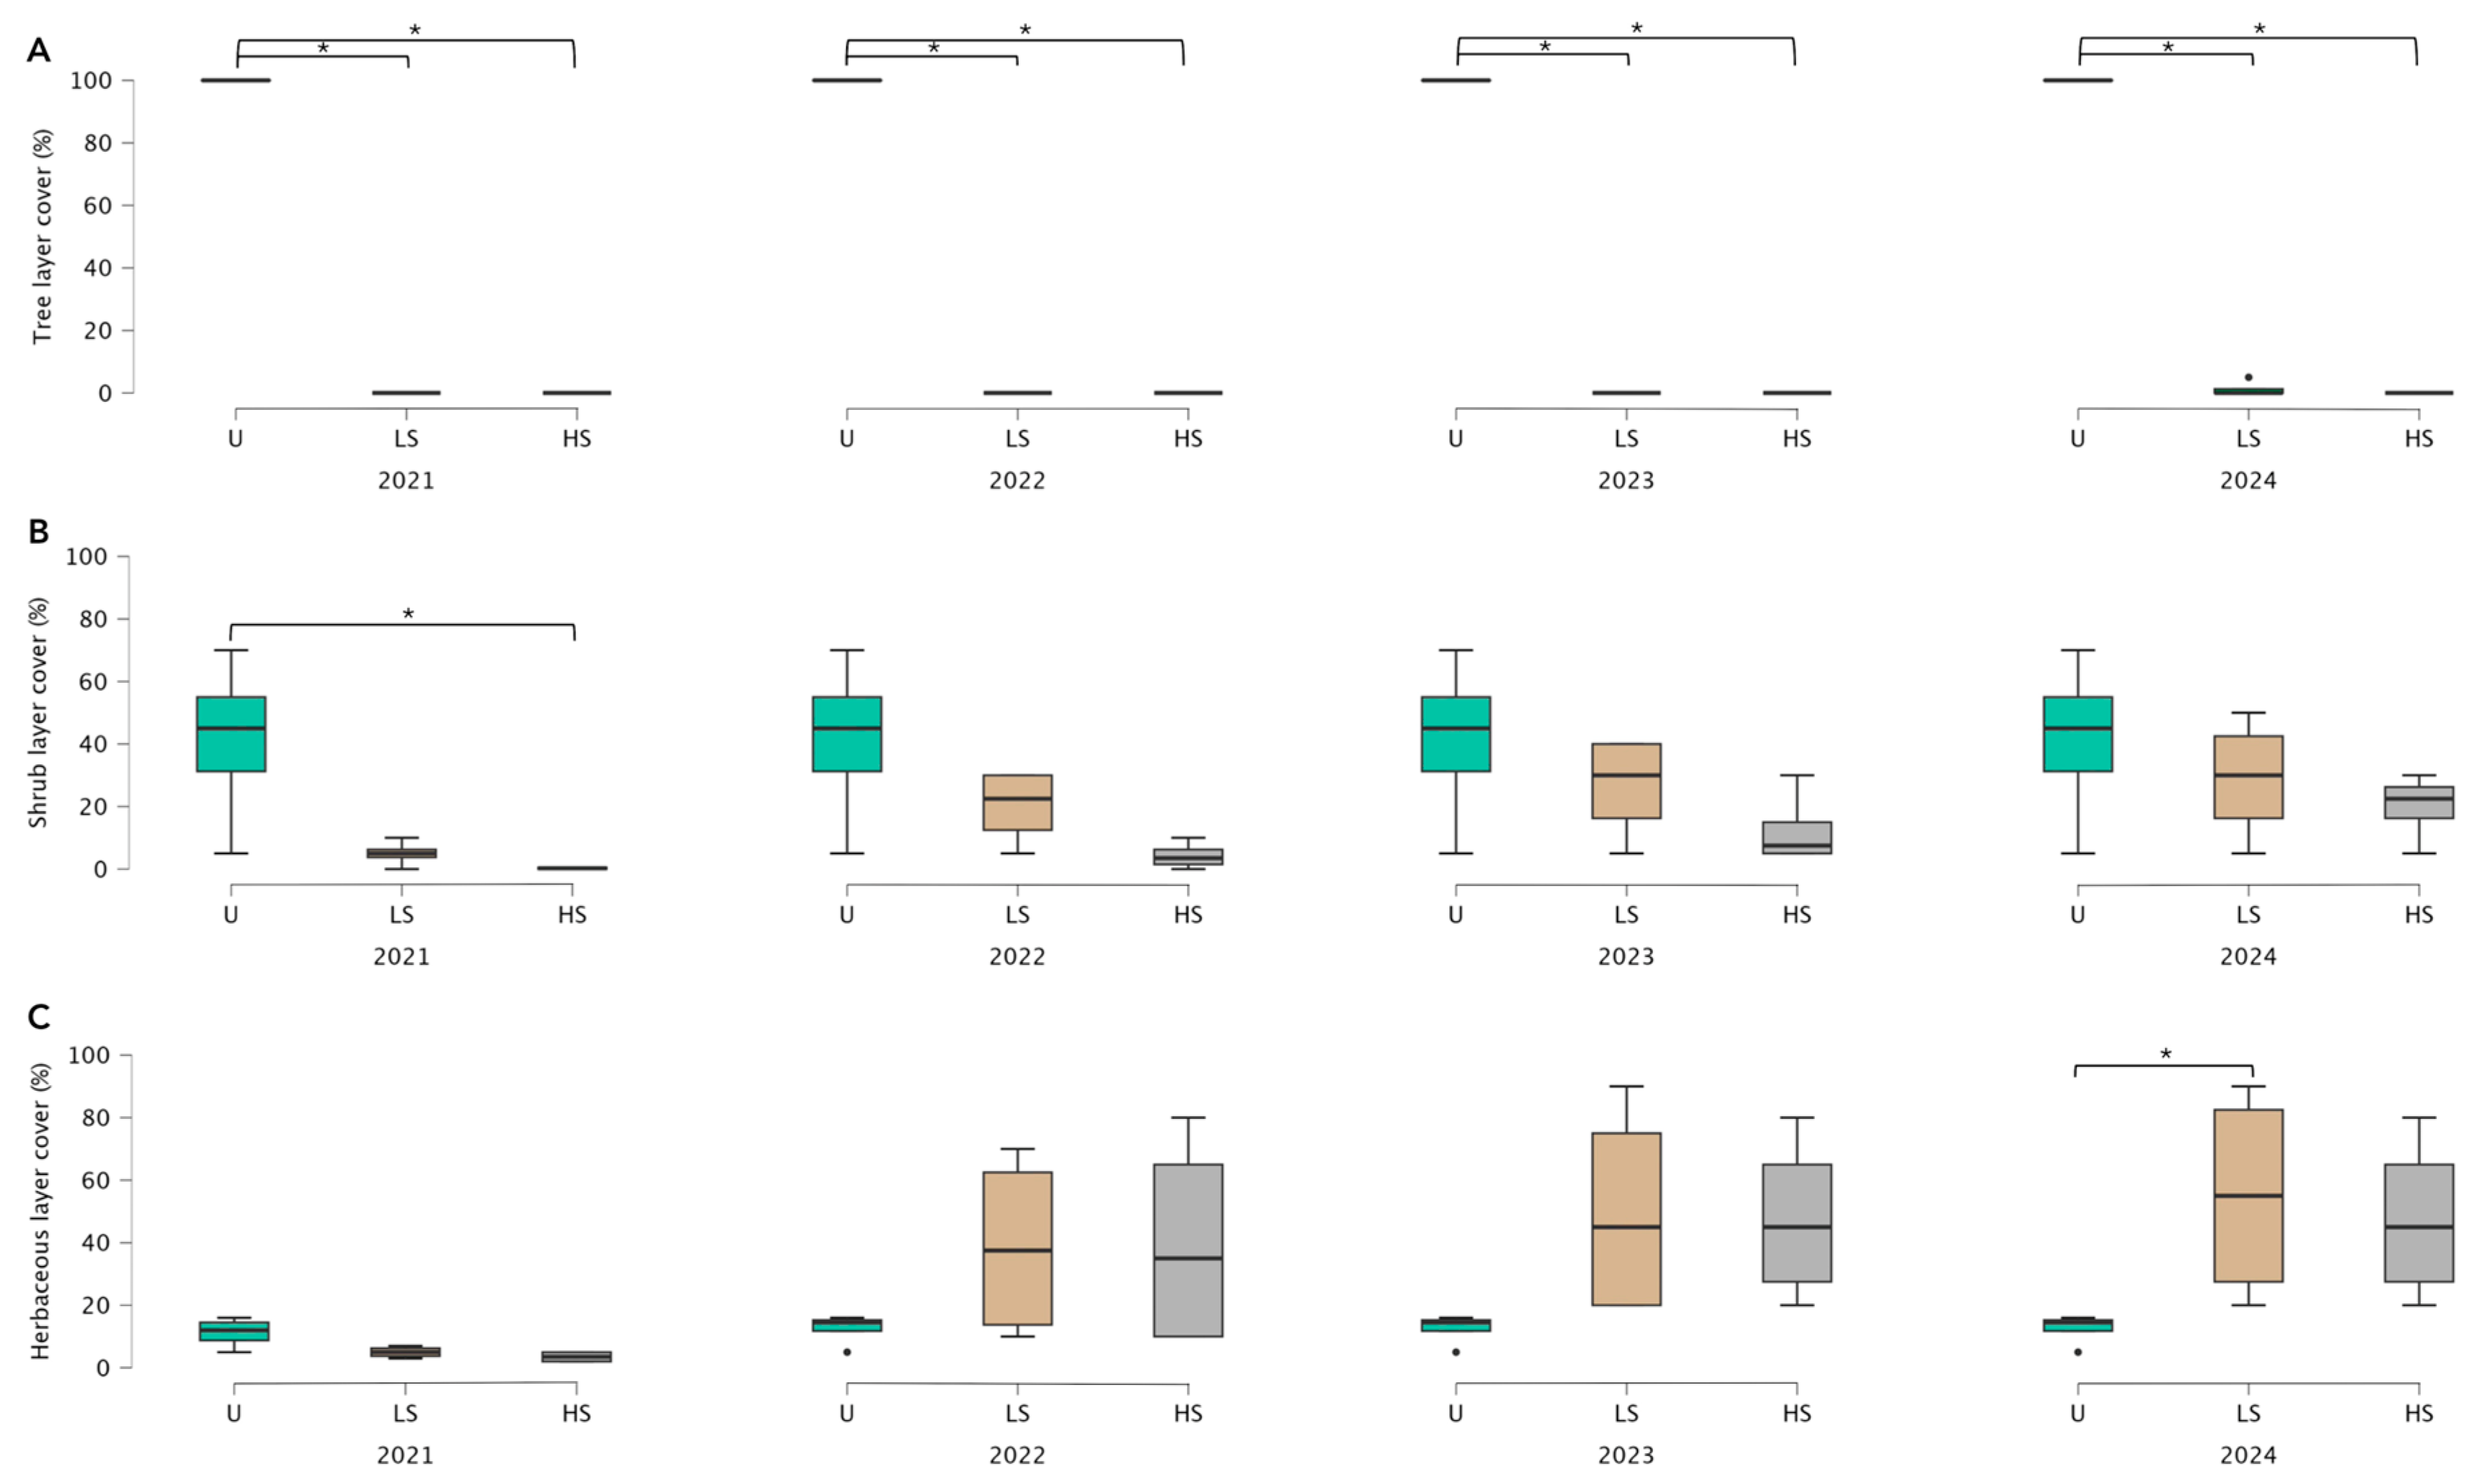
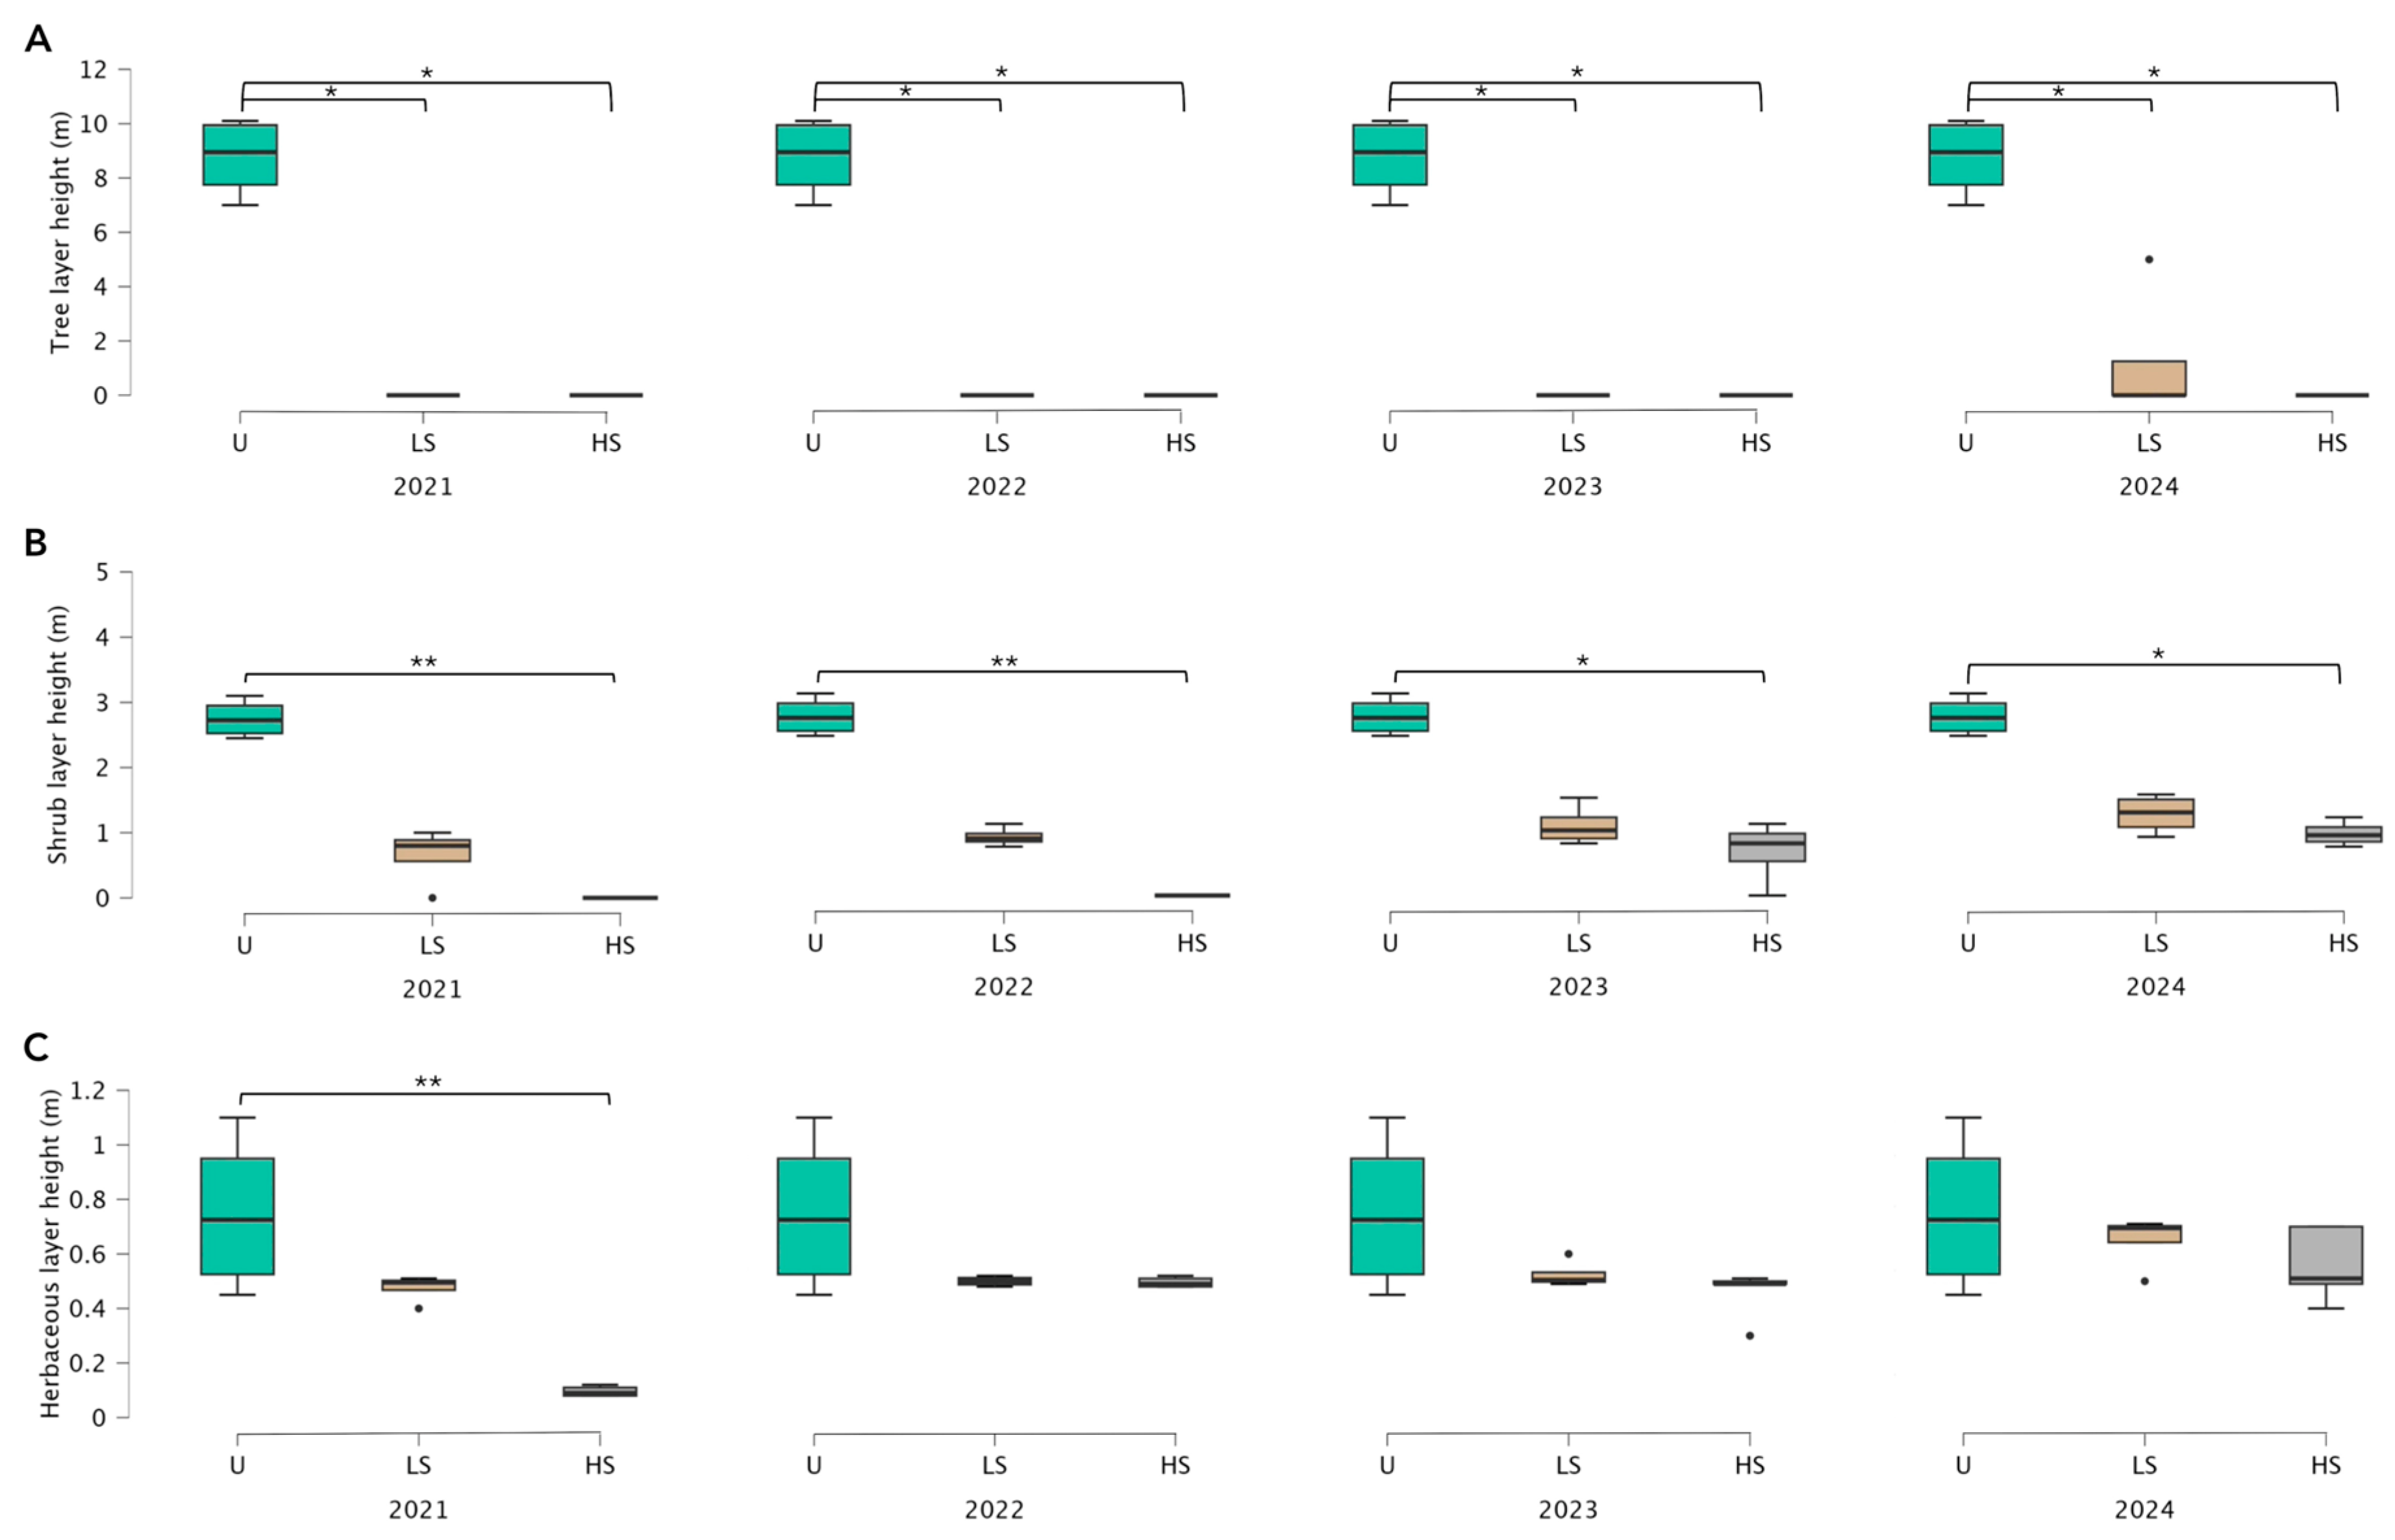
3.1. Vegetation Recovery Dynamics Following Different Levels of Fire Severity

No statistically significant differences (p > 0.05) in the total number of species (structural and other plant species) among the three plots (unburned, low-severity fire, and high-severity fire) in all years investigated were observed (Figure 2A; Table S1). The Kruskal–Wallis test revealed statistically significant differences (p < 0.05) considering the total cover of species (structural and other plant species) among the three plots only in the year 2021 (Figure 2B). Dunn’s post hoc comparisons showed statistically significant differences (p < 0.05) between unburned and low-severity fire plots (Table S1). The unburned plot showed a significantly higher average cover (99.27%) than the low-severity fire plot (44.55%), while in the high-severity fire plot, the average cover was 47.65% (Figure 2B). Considering the total height of species (structural and other plant species), the Kruskal–Wallis test revealed statistically significant differences (p < 0.05) among the three plots across all considered years (Figure 2C). Dunn’s post hoc comparisons showed statistically significant differences (p < 0.05) between unburned and high-severity fire plots across all four years considered (Table S1), with the unburned plot exhibiting a significantly higher average height of total species than the high-severity fire plot (2021: 8.75 unburned vs. 0.10 high-severity fire; 2022: 8.75 unburned vs. 0.50 high-severity fire; 2023: 8.75 unburned vs. 0.80 high-severity fire; and 2024: 8.75 unburned vs. 0.95 high-severity fire) (Figure 2C).
The Kruskal–Wallis test revealed statistically significant differences (p < 0.05) in the number of structural species among the three plots (unburned, low-severity fire, and high-severity fire) across all considered years (Figure 3A). Specifically, Dunn’s post hoc comparisons showed statistically significant differences (p < 0.05) between unburned and high-severity fire plots (Table S2) across all the years (2021: 12.50 unburned vs. 4.75 high-severity fire; 2022: 15.00 unburned vs. 6.00 high-severity fire; 2023: 15.00 unburned vs. 6.75 high-severity fire; and 2024: 15.25 unburned vs. 7.00 high-severity fire). Considering the cover of structural species, the Kruskal–Wallis test revealed statistically significant differences (p < 0.05) among the three plots in 2021, 2022, 2023, and 2024 (Figure 3B; Table S2). Particularly, Dunn’s post hoc comparisons showed statistically significant differences (p < 0.05) between unburned and high-severity fire plots (Table S2) only in the years 2021 (89.78% unburned vs. 4.87% high-severity fire) and 2022 (90.80% unburned vs. 16.97% high-severity fire). In addition, Dunn’s post hoc comparisons showed statistically significant differences (p < 0.05) between unburned and low-severity fire plots (Table S2) in the years 2023 (90.79% unburned vs. 23.05% low-severity fire) and 2024 (91.52% unburned vs. 28.32% low-severity fire). Regarding the number of other species, the Kruskal–Wallis test revealed statistically significant differences (p < 0.05) among the three plots in 2022, 2023, and 2024 (Figure 3C). Specifically, Dunn’s post hoc comparisons showed statistically significant differences (p < 0.05) between unburned and high-severity fire plots (Table S2) in the years 2022 (4.75 unburned vs. 18.25 high-severity fire), 2023 (5.00 unburned vs. 19.25 high-severity fire), and 2024 (5.25 unburned vs. 20.75 high-severity fire). No statistically significant differences (p > 0.05) in the cover of other species among the three plots across all investigated years were found (Figure 3D; Table S2).
The Kruskal–Wallis test revealed statistically significant differences (p < 0.01) in the tree layer cover among the three plots (unburned, low-severity fire, and high-severity fire) across all considered years (Figure 4A). Dunn’s post hoc comparisons showed statistically significant differences between unburned and low-severity fire plots and unburned and high-severity fire plots across all the years (2021: 100% unburned, 0% low-severity fire, and 0% high-severity fire; 2022: 100% unburned, 0% low-severity fire, and 0% high-severity fire; 2023: 100% unburned, 0% low-severity fire, and 0% high-severity fire; and 2024: 100% unburned, 1.25% low-severity fire, and 0% high-severity fire) (Figure 4A; Table S3). Considering the shrub layer cover, the Kruskal–Wallis test revealed statistically significant differences (p < 0.05) among the three plots during 2021 (Figure 4B; Table S3). Particularly, Dunn’s post hoc comparisons showed statistically significant differences between unburned (41.25%) and high-severity fire (0.25%) plots. Finally, the Kruskal–Wallis test revealed statistically significant differences (p < 0.05) in the herbaceous layer cover among the three plots in 2023 and 2024 (Figure 4C). Specifically, Dunn’s post hoc comparisons showed statistically significant differences only in 2024 between unburned (12.50%) and low-severity fire (55.00%) plots (Figure 4C; Table S3).
The Kruskal–Wallis test revealed statistically significant differences (p < 0.01) in tree layer height among the three plots (unburned, low-severity fire, and high-severity fire) across all considered years (Figure 5A). Specifically, Dunn’s post hoc comparisons showed statistically significant differences between the unburned and low-severity fire plots and the unburned and high-severity fire plots across all the years (2021: 8.75 m unburned, 0 m low-severity fire, and 0 m high-severity fire; 2022: 8.75 m unburned, 0 m low-severity fire, and 0 m high-severity fire; 2023: 8.75 m unburned, 0 m low-severity fire, and 0 m high-severity fire; and 2024: 8.75 m unburned, 1.25 m low-severity fire, and 0 m high-severity fire) (Figure 5A; Table S4). For shrub layer height, the Kruskal–Wallis test revealed statistically significant differences (p < 0.05) among the three plots across all considered years (Figure 5B). Dunn’s post hoc comparisons (Table S4) showed statistically significant differences between the unburned and high-severity fire plots across all the years (2021: 2.75 m unburned vs. 0 m high-severity fire; 2022: 2.75 m unburned vs. 0 m high-severity fire; 2023: 2.75 m unburned vs. 0.67 m high-severity fire; and 2024: 2.75 m unburned vs. 0.95 m high-severity fire). Regarding the herbaceous layer height, the Kruskal–Wallis test revealed statistically significant differences (p < 0.01) among the three different plots only in 2021. Specifically, Dunn’s post hoc comparisons showed statistically significant differences between the unburned (0.75 m) and high-severity fire (0.10 m) plots (Figure 5C; Table S4).

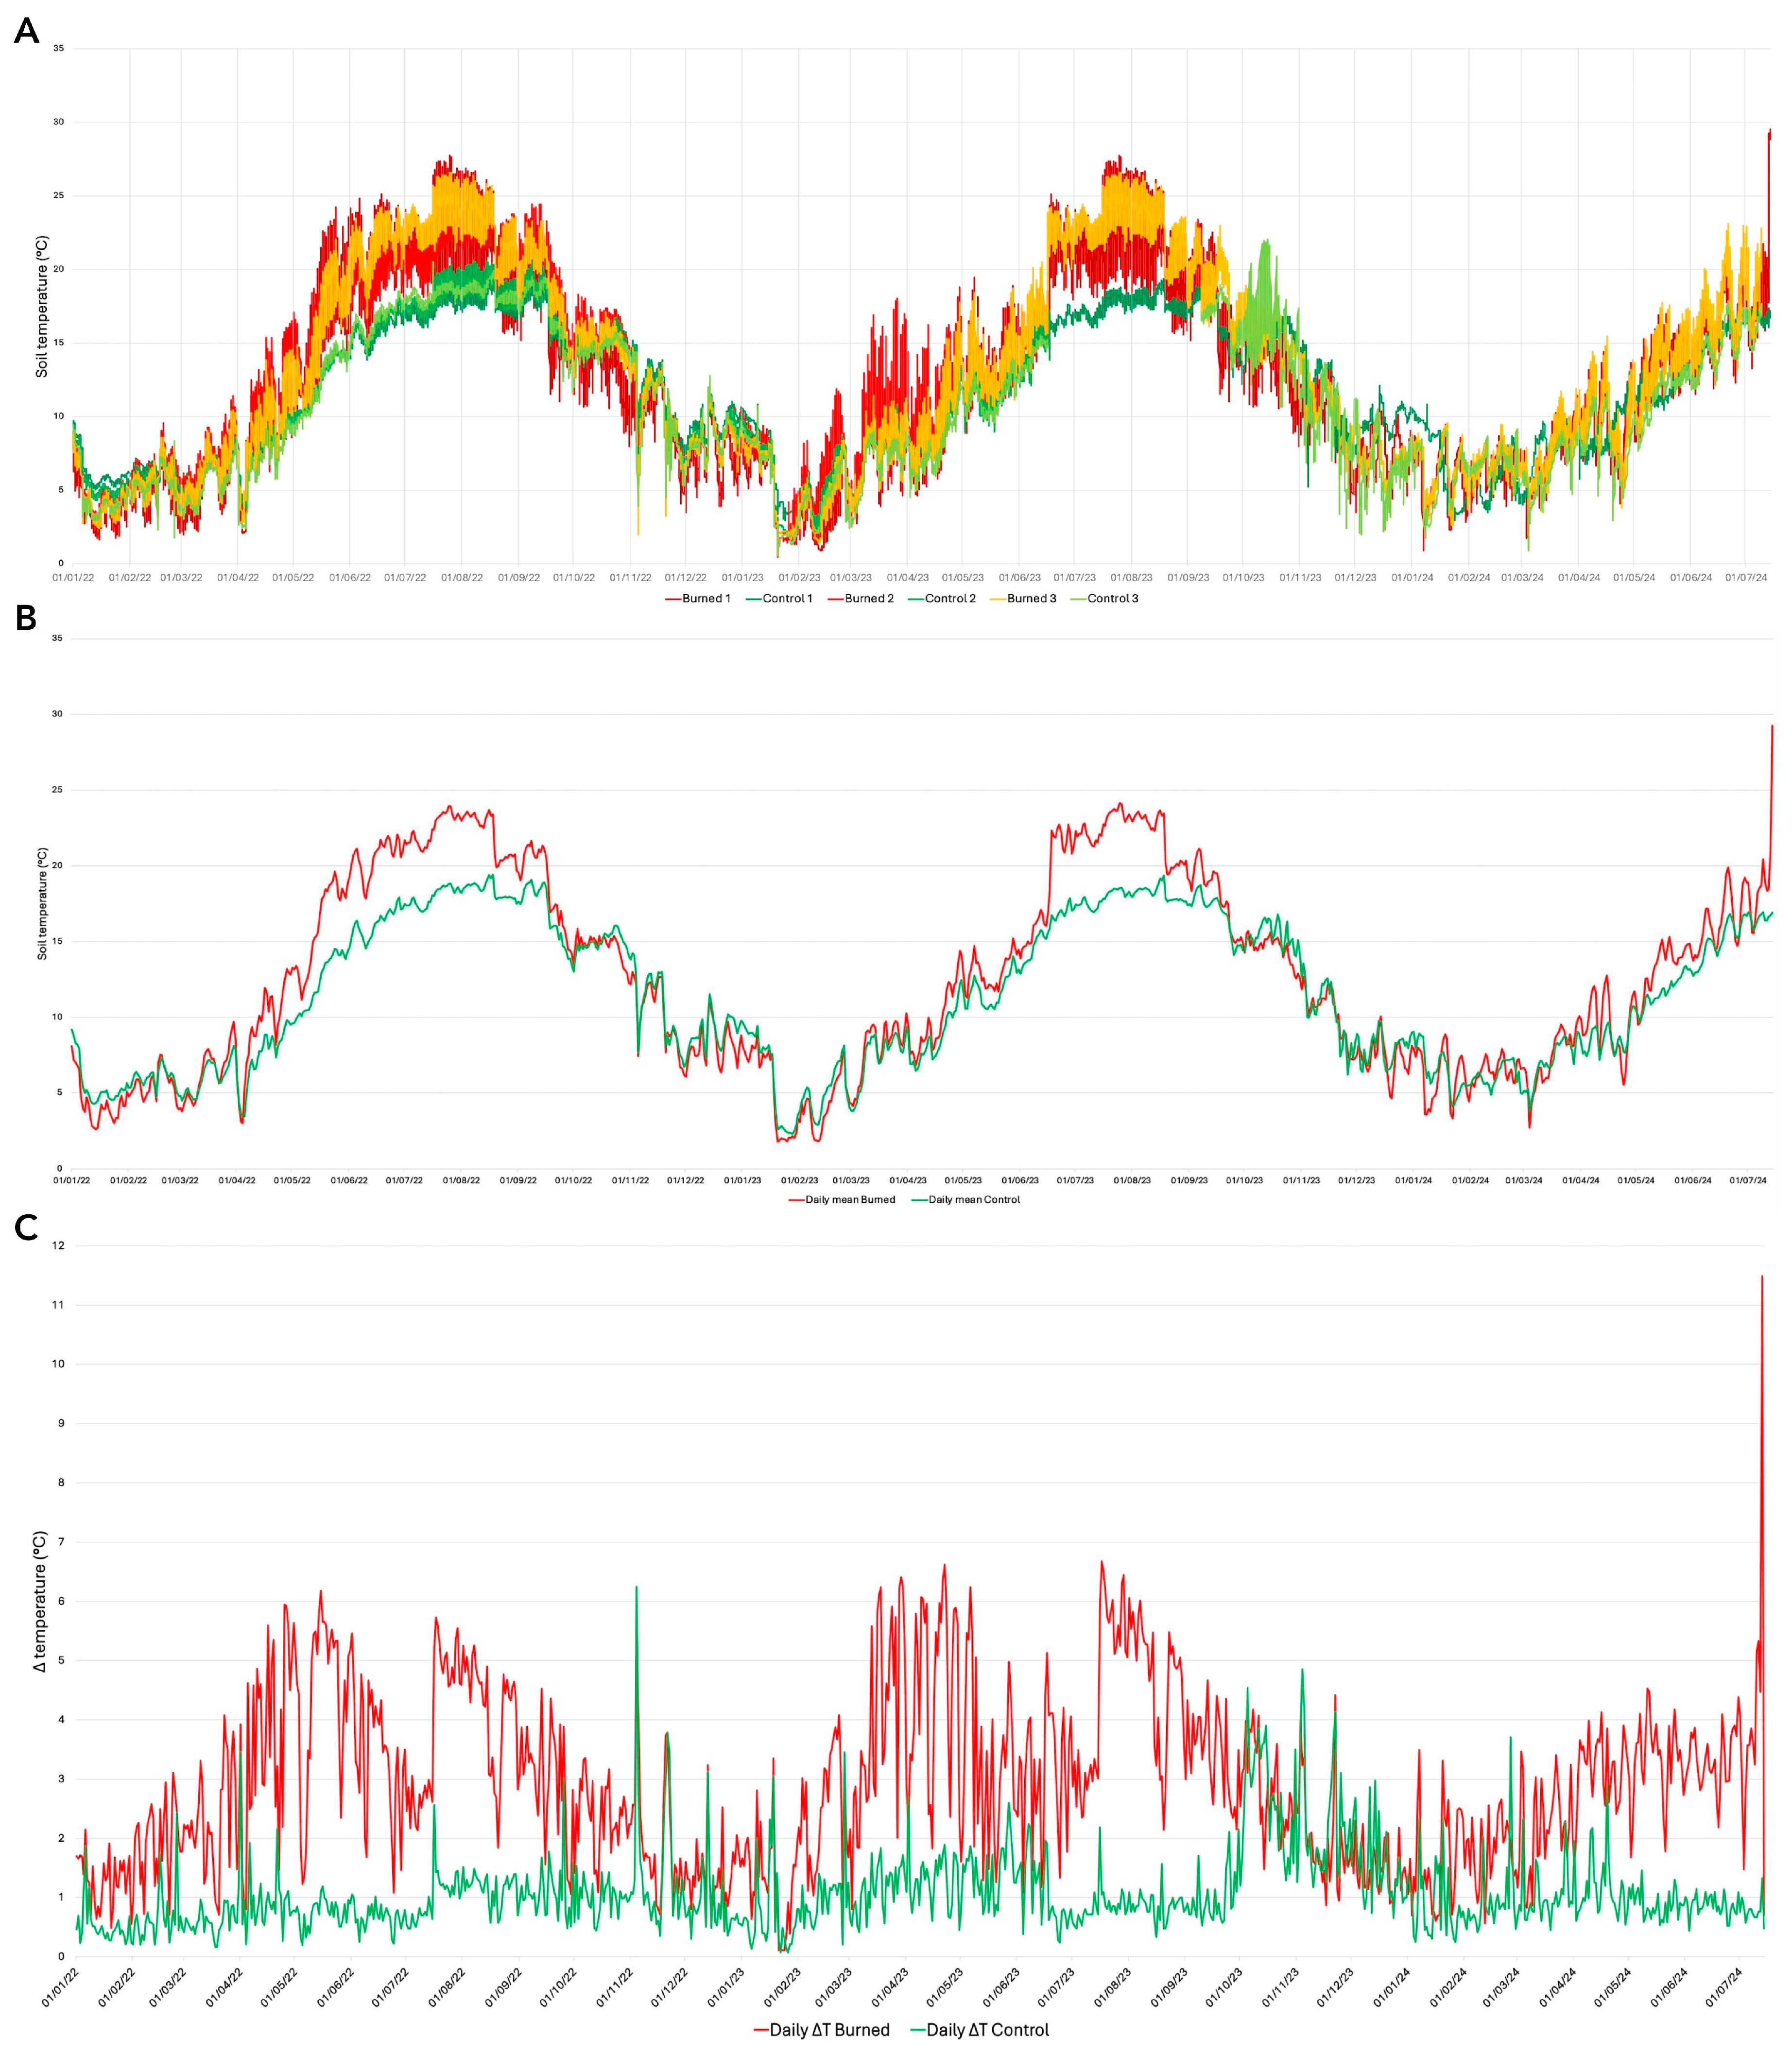
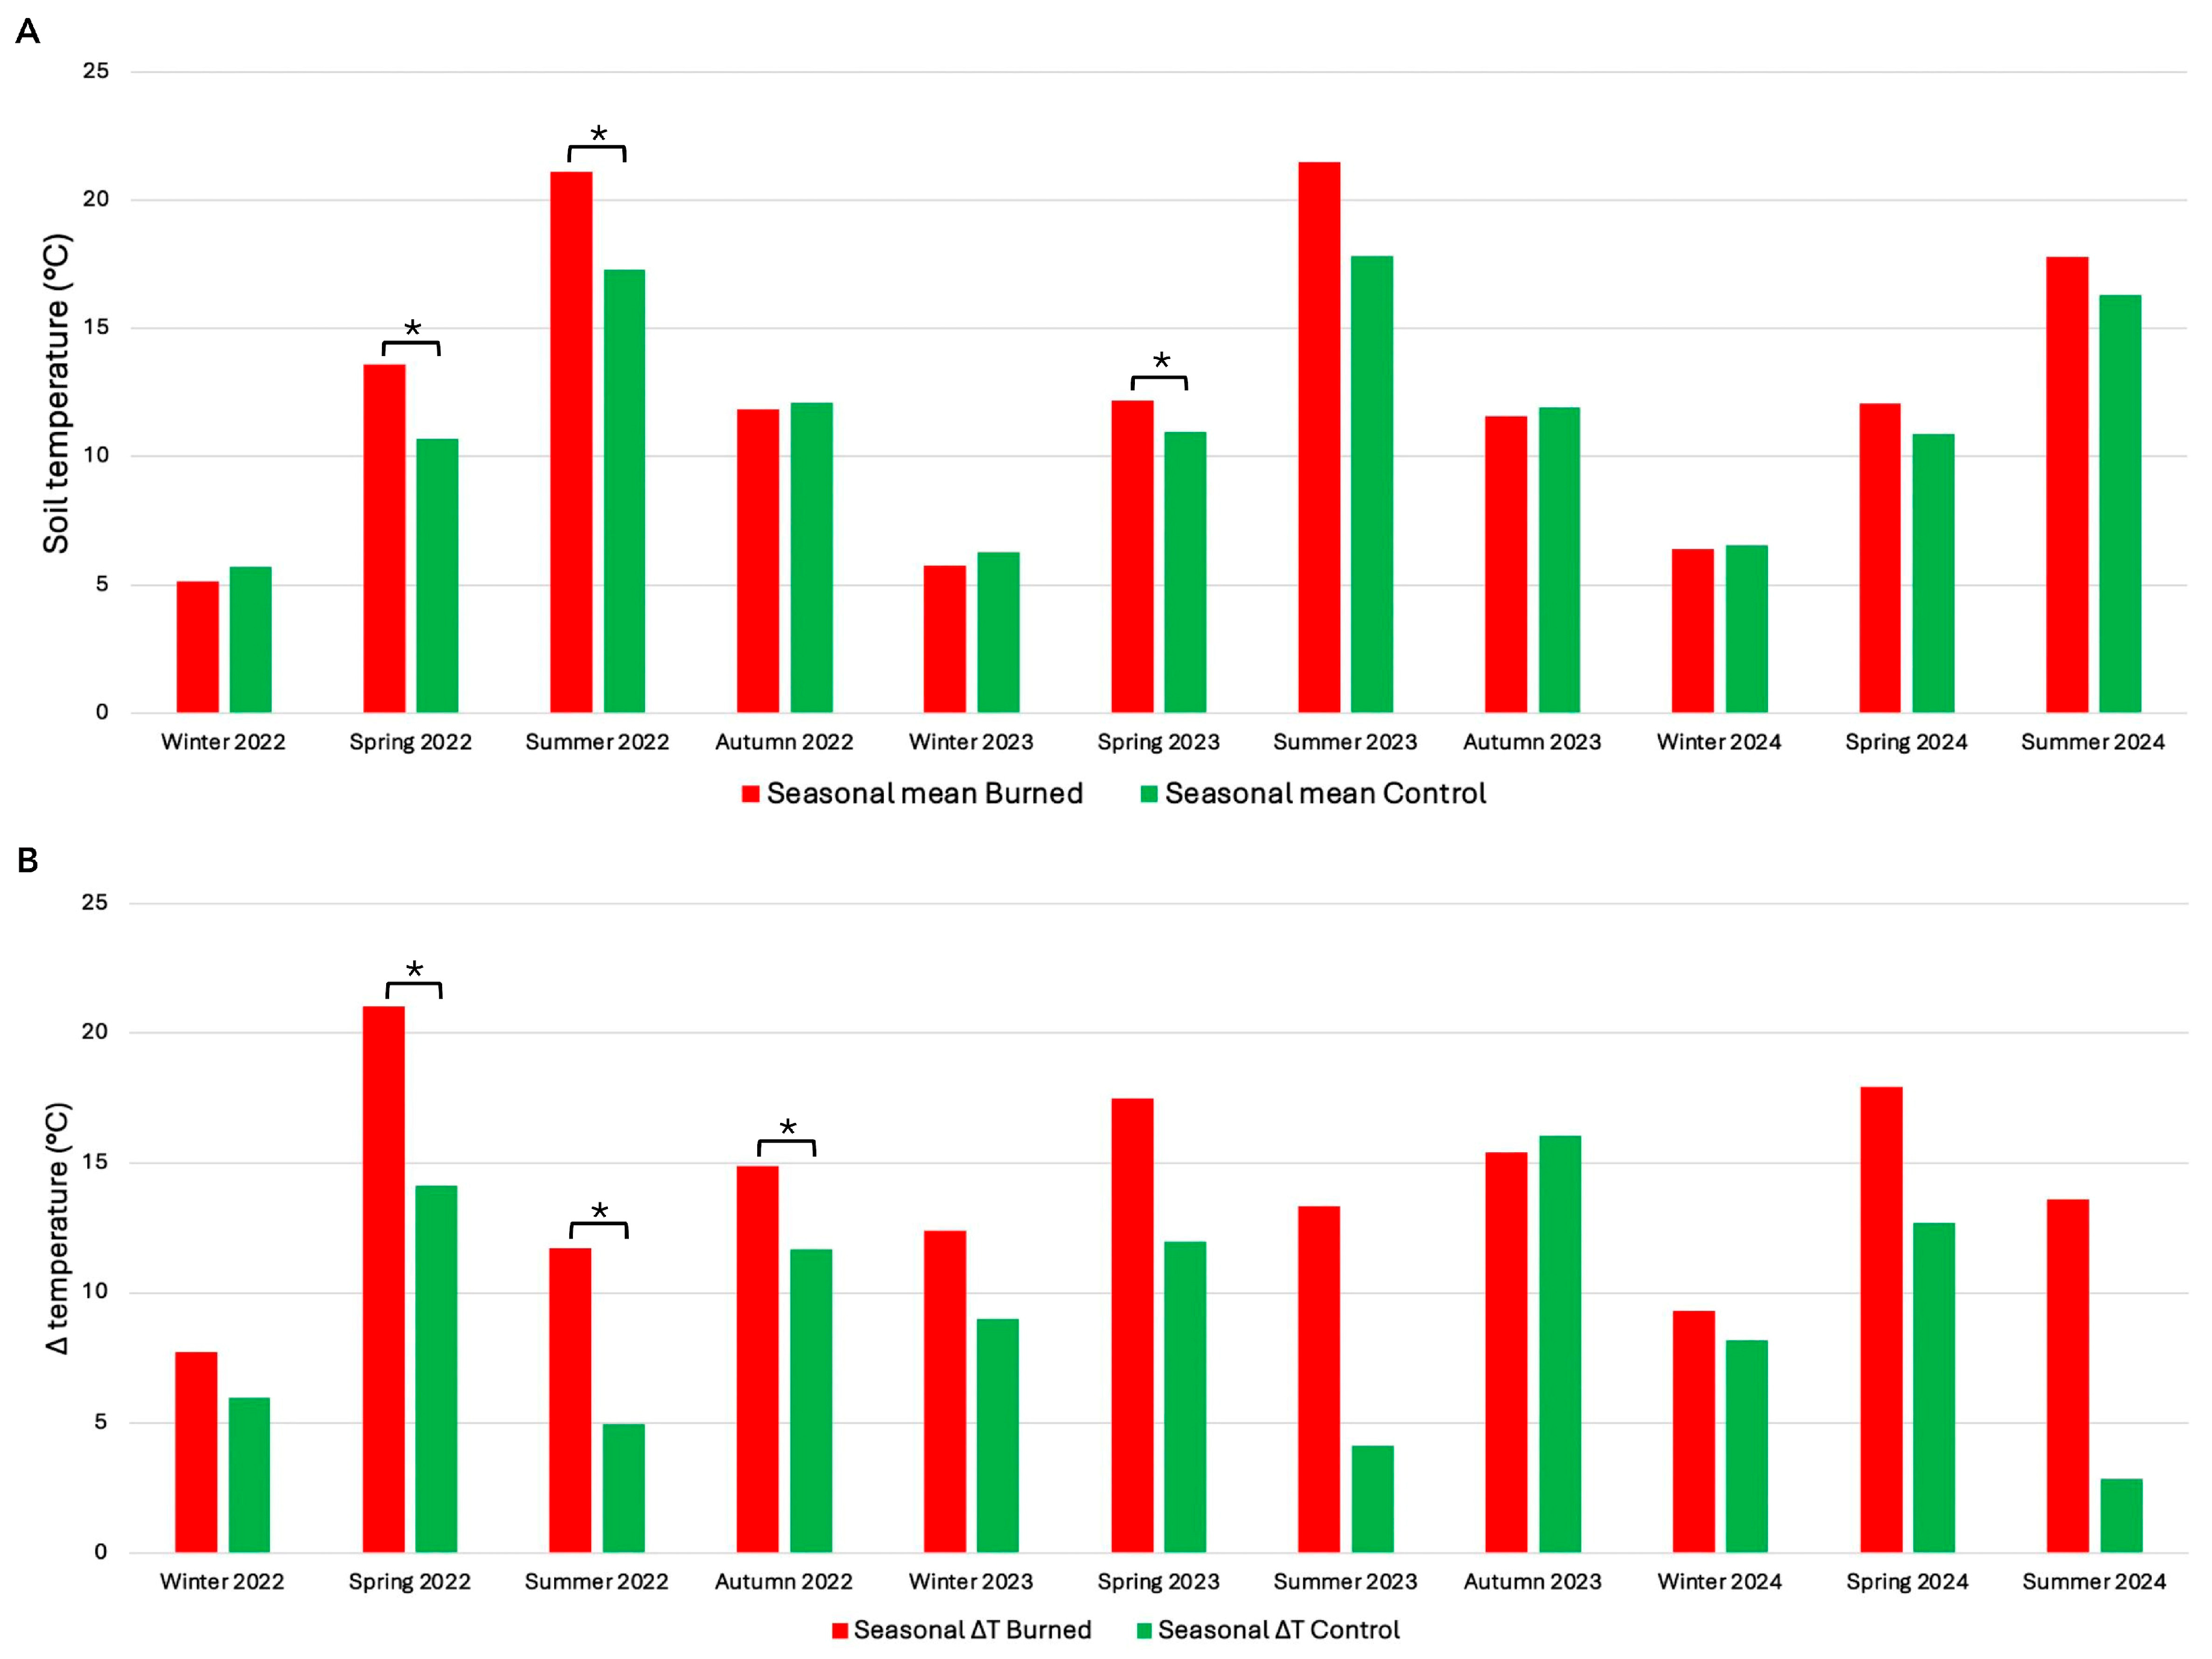
3.2. Soil Temperature Regimes Following a Megafire and Relationships with Post-Fire Vegetation Recovery Patterns

Soil temperature measurements, assessed from January 2022 to July 2024, show that the burned areas generally have higher soil temperatures than control areas, except in autumn and winter. In particular, control areas showed higher temperatures in January, February, October, November, and December 2022; in January, February, October, November, and December 2023; and in January 2024 (Figure 6A). The average daily soil temperature curve recorded for the burned and control areas has an average difference of 1.139 ± 0.066 °C. The greatest difference between the two curves occurred on 14 July 2024, with a difference of 12.350 °C, while the smallest difference between the two curves was on 7 January 2024, with a difference of −3.384 °C (Figure 6B). The day with the highest average soil temperature recorded in the burned areas was 14 July 2024 (29.269 °C), while the lowest was 20 January 2023 (1.810 °C; Figure 6B). The day with the highest average soil temperature recorded in the control areas was 18 August 2022 (19.419 °C), while the lowest was 28 January 2023 (2.323 °C; Figure 6B).
In the burned areas, the daily ΔT values of soil temperatures range from a minimum of 5.127 °C to a maximum of 21.491 °C, with an average of 12.632 ± 1.714 °C. In the control areas, however, the values range between 5.731 °C and 17.824 °C, with an average of 11.509 ± 1.291 °C. The daily mean soil ΔT curves recorded for the burned and control areas have an average distance of 1.841 ± 0.048 °C. The day with the largest difference between the two curves was 13 July 2024, with a difference of 10.159 °C, while the day with the smallest difference between the two curves was 14 October 2023, with a difference of −2.143 °C (Figure 6C).
Monthly (Figure S1A) and seasonal (Figure 7A) mean soil temperatures show that the burned areas almost always have higher soil temperatures than the control areas. Higher soil temperature values in the control areas compared to the burned ones are visible during the winter and autumn seasons (Figure 7A), but these results are not statistically significant (p > 0.05) according to the Kruskal–Wallis test. On the contrary, the Kruskal–Wallis test revealed statistically significant differences (p < 0.05), considering the seasonal average soil temperature, between the control and burned areas in the spring and summer 2022 and spring 2023 seasons (Figure 7A). The average seasonal soil temperature in the burned areas was 12.632 ± 1.714 °C, while in the control areas it was 11.509 ± 1.291 °C. The season with the highest average soil temperature recorded in the burned areas was summer 2023 at 21.491 °C, while the season with the lowest average soil temperature was winter 2022 at 5.127 °C (Figure 7A). The season with the highest average soil temperature recorded in the control areas was summer 2023 (17.824 °C), while the lowest average soil temperature was recorded in winter 2022 (5.731 °C; Figure 7A).
Taking into account the monthly mean soil temperature, the Kruskal–Wallis test revealed statistically significant differences (p < 0.05) between the control and burned areas in the months of April, May, June, July, August, September, and December 2022 and in the months of April and May 2023 (Figure S1A). In December 2022, soil temperature was significantly higher in the control areas compared to the burned areas, while for all other months, the opposite pattern was observed, with higher temperatures in the burned areas. The average monthly soil temperature in the burned areas was 12.512 ± 1.081 °C, while in the control areas it was 11.404 ± 0.833 °C. The month with the highest average soil temperature recorded in the burned areas was July 2023 at 22.708 °C, while the month with the lowest average soil temperature was February 2023 at 4.258 °C (Figure S1A). The month with the highest average soil temperature recorded in the control areas was August 2022 (18.394 °C), while the lowest average soil temperature was recorded in February 2023 (5.091 °C; Figure S1A).
The Kruskal–Wallis test revealed statistically significant differences (p < 0.05) in the seasonal mean soil ΔT between the control and burned areas in the spring, summer, and autumn 2022 seasons (Figure 7B). The mean seasonal soil ΔT in burned areas was 14.077 ± 1.165 °C, while in the control areas it was 9.246 ± 1.322 °C. The season with the highest soil ΔT recorded in the burned areas was spring 2022 (21.028 °C), while the lowest value was winter 2022 (7.734 °C; Figure 7B). The season with the highest soil ΔT recorded in control areas was autumn 2023 (16.053 °C), while the lowest value was summer 2024 (2.862 °C; Figure 7B).
The graph of the mean monthly soil ΔT (Figure S1B) shows that the areas affected by the fire have a higher soil ΔT than the control areas in almost all months, with some exceptions. Higher soil ΔT values are visible in the control areas compared to the burned ones in October and November 2023 (Figure S1B), but these results are not statistically significant (p > 0.05) according to the Kruskal–Wallis test. On the contrary, the Kruskal–Wallis test revealed statistically significant differences (p < 0.05), considering the monthly mean soil ΔT, between the control and burned areas in the months of March, April, May, June, July, August, September, and October 2022, and in the months of February, March, and April 2023 (Figure S1B). During these months, the mean soil temperature was higher in the burned areas than in the control areas. The mean monthly soil ΔT in burned areas was 9.137 ± 0.380 °C, while in the control areas it was 5.884 ± 0.373 °C. The month with the highest soil ΔT recorded in the burned areas was April 2022 (13.169 °C), while the lowest value was February 2024 (5.289 °C; Figure S1B). The month with the highest soil ΔT recorded in the control areas was November 2023 (10.738 °C), while the lowest soil ΔT was July 2024 (2.384 °C; Figure S1B).
Multiple linear regression tests were performed to evaluate the effect of the number of total species, the cover of total species, and the height of total species on soil temperature and soil ΔT. Considering the soil temperature, the overall model was not significant (F(3,156) = 0.746, p > 0.05), explaining only a small part of the variance in soil temperature (R2 = 0.014; adjusted R2 = 0.004). Neither the number of total species, nor the cover of total species, nor the height of total species showed a significant effect on soil temperature (p > 0.05). On the contrary, taking into consideration the soil ΔT, the overall model was significant (F(3,156) = 23.99, p < 0.05), explaining 31.6% of the variability (R2 = 0.316; adjusted R2 = 0.302). Among these factors, only the height of the total species showed a significant effect on soil ΔT (β = −0.6, p < 0.05).

4. Discussion

This study focuses on the short-term response of a typical Mediterranean forest to a severe megafire and investigates how the early stages of vegetation recovery (i.e., vegetation cover and type) can affect soil temperature by comparing three different plots: unburned plots, which were not affected by the fire; low-severity fire plots, which were affected by an intermediate level of fire severity; and high-severity fire plots, which were affected by a very high level of fire severity.

4.1. Vegetation Recovery Dynamics Following Different Levels of Fire Severity

Based on the findings presented in this article, it is evident that Mediterranean vegetation in our study area demonstrates a rapid recovery after a wildfire. This is consistent with what was reported in our previous study [52], where considerable phytomass regeneration was found in a short time. In fact, due to fire frequency, Mediterranean plant species have evolved adaptations that allow for post-fire regeneration [52]. A similar finding was reported by Nolè et al. [33], who analyzed wildfires in European forests and observed short vegetation recovery times within 2.5 years from fire disturbance. Their study noted a reduction in tree canopy in most cases, followed by a rapid colonization by grass species and understory shrub shoots [33]. However, despite the vegetation’s rapid recovery in terms of species number, differences in floristic composition (number of structural and non-structural species), cover, and height can be observed across plots.
Our results show that immediately after the fire, the numbers of total species present in the unburned, low-severity fire, and high-severity fire plots were very similar. This was primarily caused by changes in floristic composition, especially the loss of structural species and the proliferation of non-structural pioneer, often herbaceous, plant species in the low-severity fire plots and, above all, in the high-severity fire plots. This aligns with our initial hypothesis that non-structural species would recover more rapidly than structural species, particularly in areas affected by high-severity fire. For this reason, the statistical analyses did not reveal any statistically significant difference in the number of total species between the plots in all the considered years. This finding is consistent with previous research that has shown that herbaceous species colonize burned areas more easily than other growth forms [74], utilizing the nutrients provided by ash thanks to their superficial roots and rapid growth [75]. In the years following the fire, the total number of species increased in the low-severity fire and, above all, high-severity fire plots. This is linked to an increase in both structural and, especially, non-structural species in both plots. This confirms our expectation that species richness would recover more rapidly than other parameters, such as height and cover, due to the early establishment of fast-growing herbaceous species. Several studies have also highlighted the effects of recurrent fires on vegetation composition, often noting an increase in shrub and herbaceous species following recurrent fires and a reduction in tree cover [76,77,78,79]. Bates et al. [80], analyzing the effects of prescribed fires at the Northern Great Basin Experimental Range, Oregon, found that the prescribed fires killed all juniper and sagebrush in the burn units and that total herbaceous and perennial bunchgrass yields increased 2- to 2.5-fold in burn treatments compared with unburned controls. Contrary to previous studies, Bashirzadeh et al. [81], considering both unburned and burned shrublands in northeastern Iran, highlighted a significant variation in plant diversity and functional traits of semi-arid shrubs. They observed significant increases in taxonomic, functional, and phylogenetic diversity in all sites where fire had been absent for 10 and 20 years and a decrease in taxonomic diversity in sites where one and four years had passed since the last fire [81]. However, these results highlight how Mediterranean vegetation is adapted to fire and is highly resilient, as almost all perennial species can recover after a fire [82,83,84,85,86].
Conversely, significant differences in the average vegetation cover across the different plots clearly emerge. In fact, in the months immediately following the fire, both low-severity fire and high-severity fire plots showed a reduction in average vegetation cover. However, statistical analyses indicate that this reduction was significant only between low-severity fire and unburned plots. One possible explanation is that in plots with a greater fire severity, the reduced competition allows non-structural herbaceous species to rapidly colonize the unvegetated open areas, increasing their total vegetation cover. Additionally, the reduction in average vegetation cover in both low-severity fire and high-severity fire plots is also due to a decline in the cover of structural woody species in these plots. However, as non-structural species are predominantly herbaceous, they tend to occupy less surface area compared to structural species, explaining the decline in average cover found. Statistical analyses further reveal that the decline in structural woody species cover was statistically significant only between unburned and low-severity fire plots in the early stages of vegetation recovery, while in subsequent years statistically significant differences were observed between unburned and high-severity fire plots. This pattern can be explained by the different dynamics of vegetation recovery in relation to fire severity. In low-severity fire plots, some structural can trees survive, reducing space and resources for other structural plants and resulting in a slower recovery in the initial years. The cover of structural species in low-severity fire plots remains relatively constant throughout the years under study. In contrast, high-severity fire plots show very low levels of structural species in the first two years, but over time, recolonization becomes more pronounced, leading to a gradual increase in structural species cover, eventually surpassing low-severity fire plots. These patterns are further confirmed by the analyses at the layer levels, which highlight a progressive increase in shrub and herbaceous cover over time. In the years following the fire, the cover of total species remains stable both in the low-severity fire and high-severity fire plots, supporting the observation that burned communities tend towards a metastable equilibrium like the one that existed without fire [87,88,89].
Taking the height of total plant species into account, our findings demonstrate a considerable reduction of height in burned plots (both in low-severity fire and high-severity fire plots). The difference between unburned and high-severity fire plots is statistically significant in all years studied. These findings are consistent with reported changes in the number of total species and cover of total species, as structural woody species, which are greatly reduced in burned plots, contribute significantly to reaching higher heights in unburned areas. While non-structural species, frequently herbaceous, which thrive in burned plots, reach substantially lower heights, explaining the overall reduction in vegetation height in burned plots. This pattern is further confirmed by the analyses at the layer levels, which highlight a progressive decrease in tree and shrub height in low-severity fire and high-severity fire plots over time.
Another interesting result concerns the fact that no alien plant species were found in our study area following the fire. The lack of alien species in these areas could be attributed to the presence of an environmental filter that prevents their establishment. In particular, repeated high-severity fires could prevent alien species from establishing themselves, providing a threat to their survival from the early stages of their life cycle. This hypothesis is supported by the fact that these areas are subject to recurrent fires. However, since this contrasts with what is reported in the existing literature [90,91,92], it is necessary to further investigate this issue through targeted studies.

4.2. Soil Temperature Regimes Following a Megafire and Relationships with Post-Fire Vegetation Recovery Patterns

The significant alterations in ground cover and soil characteristics in wildfire-burned forests are widely recognized [21,28,93,94,95,96]. Despite that, to our knowledge, there are no studies that have investigated in detail the relationship between post-fire vegetation recovery and soil temperatures. In this study, we evaluate how soil temperatures vary in burned and control areas, both daily, monthly, and seasonally, in relation to post-fire vegetation recovery.
According to our hypothesis, the analysis of soil temperature data reveals that temperatures in burned areas are almost consistently higher than those in control areas. During spring and especially summer, average soil temperatures in burned areas increase compared to control areas within the forest. During the autumn and winter seasons, for all the considered years, our results have shown higher soil temperatures in the control areas compared to the burned areas. We hypothesize that these exceptions may occur because, during these seasons, control areas tend to maintain greater soil temperatures, for example, due to the presence of vegetation, which reduces the dispersion of accumulated heat and retains more moisture, slowing soil cooling. In contrast, in the spring and summer, burned areas may experience higher temperatures due to increased exposure to direct solar radiation and lower soil moisture. These factors may result in a seasonal inversion in soil temperatures between the two areas, with control plots warmer in the cold months and burned plots warmer in the hotter months. These results align with our initial hypothesis that soil temperature changes could be influenced by seasonal fluctuations and vegetation dynamics. A similar result was reported by Uribe et al. [97], who, analyzing the effects of fires on forests near Madrid, found higher soil temperatures in unburned sites compared to burned sites during the winter months. They attributed this difference to vegetation cover, which reduces heat loss from the soil.
Furthermore, there is a marked spike in soil ΔT values, with higher values in the burned areas compared to those found within the control areas. This can be explained by the presence of woody species within unburned forests. These species, maintaining the closed system, should be able to stabilize soil temperatures throughout the day. On the contrary, in the burned areas, these species are absent or poorly represented and are replaced by herbaceous species. This exposes the soil to more intense heating during the day and more rapid cooling at night, increasing the temperature range. Consequently, soil ΔT values are less stable, showing more pronounced peaks. Remarkably, in October and November 2023, a higher soil ΔT was observed in the control areas compared to the burned ones. This could be due to more evident daily variations in minimum and maximum temperatures within the forest during these months, attributable to the lower heat dissipation during the day in the closed system of the forest. In any case, the anomalies observed in soil ΔT values deserve further analysis to determine whether they represent an isolated phenomenon or if additional factors contribute to this anomaly during these months.
In addition, the results of the multiple linear regression test show that the total height of plant species has a significant effect on modifying the soil ΔT values. This confirms our expectation that post-fire vegetation recovery could influence soil temperature over time and mitigate the daily maximum-minimum oscillation. In particular, it seems that a greater total height of plant species is correlated with a reduction in soil ΔT. This result could be because higher vegetation creates more shading, reducing the amount of solar radiation reaching the soil. This could lead to less soil heating during the hottest hours and, consequently, decrease the amplitude of the temperature range. Another possible justification could be linked to the fact that in areas with taller vegetation, a greater amount of litter and organic material often accumulates on the soil. This layer, acting as an insulator, could limit daytime heating and nighttime cooling, contributing to a reduction in soil ΔT. This result is supported by the analyses of soil temperature and soil ΔT, which show that starting from June 2023, no statistically significant differences have been observed between the control and burned areas. This further highlights the regulatory role of vegetation, particularly in terms of average height, in stabilizing soil temperature over time. However, to better understand these results, it would be necessary to expand the analysis over a longer period to analyze the long-term influence of vegetation on soil temperature.

5. Conclusions

This study represents the first attempt to analyze in detail the relationship between soil temperature and post-fire vegetation recovery dynamics. Our findings reveal that three years after a fire, the soil temperature in the burned areas remains quite different from the control areas within the forest. This could be because, despite the short-term recovery of vegetation, the presence of more non-structural species, particularly herbaceous ones, is insufficient to restore the temperatures that existed prior to the fire. Moreover, our work highlights the complexity of this relationship, as soil temperature is influenced by multiple factors related to vegetation recovery, especially vegetation height, making the phenomenon highly variable in time and space. Further long-term studies are needed to better understand these dynamics and the mechanisms that regulate post-fire recovery. Long-term monitoring of soil and vegetation temperatures is also required in this scenario to better understand the occurrence as well as to develop conservation and management measures for burned ecosystems.

Supplementary Materials

The following supporting information can be downloaded at: https://www.mdpi.com/article/10.3390/fire8030091/s1, Table S1: Results of the Kruskal–Wallis one-way analysis of variance on ranks test; Multiple comparisons z’ values for the total number of species, the total cover of species, and the total height of species, analyzed in the study area during the years 2021, 2022, 2023, and 2024, for the three plots: unburned (U), low-severity fire (LS), and high-severity fire (HS). Statistically significant values (p < 0.05) are highlighted in bold; Table S2: Results of the Kruskal–Wallis one-way analysis of variance on ranks test; multiple comparisons z’ values for the number of structural species, the cover of structural species, the number of other species, and the cover of other species, analyzed in the study area during the years 2021, 2022, 2023, and 2024, for the three plots: unburned (U), low-severity fire (LS), and high-severity fire (HS). Statistically significant values (p < 0.05) are highlighted in bold; Table S3: Results of the Kruskal–Wallis one-way analysis of variance on ranks test; multiple comparisons z’ values for the tree layer cover, the shrub layer cover, and the herbaceous layer cover, analyzed in the study area during the years 2021, 2022, 2023, and 2024, for the three plots: unburned (U), low-severity fire (LS), and high-severity fire (HS). Statistically significant values (p < 0.05) are highlighted in bold; Table S4: Results of the Kruskal–Wallis one-way analysis of variance on ranks test; multiple comparisons z’ values for the tree layer height, the shrub layer height, and the herbaceous layer height, analyzed in the study area during the years 2021, 2022, 2023, and 2024, for the three plots: unburned (U), low-severity fire (LS), and high-severity fire (HS). Statistically significant values (p < 0.05) are highlighted in bold; Figure S1: Mean monthly values of soil temperature for the years 2022, 2023, and 2024 in burned and control areas (A) and monthly soil ΔT values for the years 2022, 2023, and 2024 in burned and control areas (B). Statistically significant values are represented by asterisks: * = p < 0.05.

Author Contributions

Conceptualization, E.S. and G.F.; methodology, D.C., E.S., F.M., G.C., G.F. and I.R.; formal analysis, G.C. and G.F.; investigation, D.C., E.S., F.M., G.C., I.R. and G.F.; data curation, G.C. and G.F.; writing—original draft preparation, G.C. and G.F.; writing—review and editing, D.C., E.S., F.M., G.C., G.F. and I.R.; supervision, E.S. and G.F.; project administration, E.S. and G.F. All authors have read and agreed to the published version of the manuscript.

Funding

This research received no external funding.

Institutional Review Board Statement

Not applicable.

Informed Consent Statement

Not applicable.

Data Availability Statement

The data presented in this study are available on request from the corresponding author.

Acknowledgments

The authors thank Salvatore Angotzi and all the forestry workers of the forest complex “Pabarile” (CW-Sardinia). The authors thank the six anonymous reviewers who greatly contributed to improving this manuscript.

Conflicts of Interest

The authors declare no conflicts of interest.

References

  1. Chen, J.Q.; Saunders, S.C.; Crow, T.R.; Naiman, R.J.; Brosofske, K.D.; Mroz, G.D.; Brookshire, B.L.; Franklin, J.F. Microclimate in forest ecosystem and landscape ecology—Variations in local climate can be used to monitor and compare the effects of different management regimes. BioScience 1999, 49, 288–297. [Google Scholar] [CrossRef]
  2. Geiger, R.; Aron, R.H.; Todhunter, P. The Climate Near the Ground; Rowman and Little Field Publishers, Inc.: Lanham, MD, USA, 2003. [Google Scholar]
  3. De Frenne, P.; Zellweger, F.; Rodriguez-Sanchez, F.; Scheffers, B.R.; Hylander, K.; Luoto, M.; Vellend, M.; Verheyen, K.; Lenoir, J. Global buffering of temperatures under forest canopies. Nat. Ecol. Evol. 2019, 3, 744–749. [Google Scholar] [CrossRef]
  4. De Frenne, P.; Lenoir, J.; Luoto, M.; Scheffers, B.R.; Zellweger, F.; Aalto, J.; Ashcroft, M.B.; Christiansen, D.M.; Decocq, G.; De Pauw, K. Forest microclimates and climate change: Importance, drivers and future research agenda. Global Change Biol. 2021, 27, 2279–2297. [Google Scholar] [CrossRef] [PubMed]
  5. De Frenne, P.; Rodriguez-Sanchez, F.; Coomes, D.A.; Baeten, L.; Verstraeten, G.; Vellend, M.; Bernhardt-Romermann, M.; Brown, C.D.; Brunet, J.; Cornelis, J.; et al. Microclimate moderates plant responses to macroclimate warming. Proc. Natl. Acad. Sci. USA 2013, 110, 18561–18565. [Google Scholar] [CrossRef]
  6. Xu, X.; Huang, A.; Belle, E.; De Frenne, P.; Jia, G. Protected areas provide thermal buffer against climate change. Sci. Adv. 2022, 8, eabo0119. [Google Scholar] [CrossRef]
  7. Ulrey, C.; Quintana-Ascencio, P.F.; Kauffman, G.; Smith, A.B.; Menges, E.S. Life at the top: Long-term demography, microclimatic refugia, and responses to climate change for a high-elevation southern Appalachian endemic plant. Biol. Conserv. 2016, 200, 80–92. [Google Scholar] [CrossRef]
  8. Ewers, R.M.; Banks-Leite, C. Fragmentation impairs the micro- climate buffering effect of tropical forests. PLoS ONE 2013, 8, e58093. [Google Scholar] [CrossRef] [PubMed]
  9. von Arx, G.; Graf Pannatier, E.; Thimonier, A.; Rebetez, M.; Gilliam, F. Microclimate in forests with varying leaf area index and soil moisture: Potential implications for seedling establishment in a changing climate. J. Ecol. 2013, 101, 1201–1213. [Google Scholar] [CrossRef]
  10. Dobrowski, S.Z. A climatic basis for microrefugia: The influence of terrain on climate. Glob. Change Biol. 2011, 17, 1022–1035. [Google Scholar] [CrossRef]
  11. Jucker, T.; Hardwick, S.R.; Both, S.; Elias, D.M.O.M.; Ewers, R.M.; Milodowski, D.T.; Swinfield, T.; Coomes, D.A. Canopy structure and topography jointly constrain the microclimate of human-modified tropical landscapes. Glob. Change Biol. 2018, 24, 5243–5258. [Google Scholar] [CrossRef]
  12. McLaughlin, B.C.; Ackerly, D.D.; Zion Klos, P.; Natali, J.; Dawson, T.E.; Thompson, S.E. Hydrologic refugia, plants, and climate change. Glob. Change Biol. 2017, 23, 2941–2961. [Google Scholar] [CrossRef] [PubMed]
  13. Davis, K.T.; Dobrowski, S.Z.; Holden, Z.A.; Higuera, P.E.; Abatzoglou, J.T. Microclimatic buffering in forests of the future: The role of local water balance. Ecography 2019, 42, 1–11. [Google Scholar] [CrossRef]
  14. Pleim, J.E.; Gilliam, R. An indirect data assimilation scheme for deep soil temperature in the Pleim-Xiu land surface model. JAMC 2009, 48, 1362–1376. [Google Scholar] [CrossRef]
  15. Portillo-Estrada, M.; Pihlatie, M.; Korhonen, J.F.J.; Levula, J.; Frumau, A.K.F.; Ibrom, A.; Lembrechts, J.J.; Morillas, L.; Horvath, L.; Jones, S.K.; et al. Climatic controls on leaf litter decom- position across European forests and grasslands revealed by reciprocal litter transplantation experiments. Biogeosciences 2016, 13, 1621–1633. [Google Scholar] [CrossRef]
  16. Hursh, A.; Ballantyne, A.; Cooper, L.; Maneta, M.; Kimball, J.; Watts, J. The sensitivity of soil respiration to soil temperature, moisture, and carbon supply at the global scale. Glob. Change Biol. 2017, 23, 2090–2103. [Google Scholar] [CrossRef]
  17. Gottschall, F.; Davids, S.; Newiger-Dous, T.E.; Auge, H.; Cesarz, S.; Eisenhauer, N. Tree species identity determines wood de- composition via microclimatic effects. Ecol. Evol. 2019, 9, 12113–12127. [Google Scholar] [CrossRef]
  18. Lembrechts, J.J.; Ashcroft, M.B.; Frenne, P.D.; Kemppinen, J.; Kopecký, M.; Luoto, M.; Maclean, I.M.D.; Crowther, T.W.; Bailey, J.J.; Haesen, S.; et al. Global Maps of Soil Temperature. Glob. Change Biol. 2022, 28, 3110–3144. [Google Scholar] [CrossRef]
  19. Paul, K.I.; Polglase, P.J.; Smethurst, P.J.; O’Connell, A.M.; Carlyle, C.J.; Khanna, P.K. Soil temperature under forests: A simple model for predicting soil temperature under a range of forest types. Agric. For. Meteorol. 2004, 121, 167–182. [Google Scholar] [CrossRef]
  20. García-Llamas, P.; Suárez-Seoane, S.; Fernández-Guisuraga, J.M.; Fernández-García, V.; Fernández-Manso, A.; Quintano, C.; Taboada, A.; Marcos, E.; Calvo, L. Evaluation and comparison of Landsat 8, Sentinel-2 and Deimos-1 remote sensing indices for assessing burn severity in Mediterranean fire-prone ecosystems. Int. J. Appl. Earth Observ. Geoinf. 2019, 80, 137–144. [Google Scholar] [CrossRef]
  21. Agbeshie, A.A.; Abugre, S.; Atta-Darkwa, T.; Awuah, R. A review of the effects of forest fire on soil properties. J. For. Res. 2022, 33, 1419–1441. [Google Scholar] [CrossRef]
  22. Santín, C.; Doerr, S.H. Fire effects on soils: The human dimension. Philos. Trans. R. Soc. B 2016, 371, 20150171. [Google Scholar] [CrossRef]
  23. Memoli, V.; Santorufo, L.; Santini, G.; Ruggiero, A.G.; Giarra, A.; Ranieri, P.; Di Natale, G.; Ceccherini, M.T.; Trifuoggi, M.; Barile, R.; et al. The combined role of plant cover and fire occurrence on soil properties reveals response to wildfire in the Mediterranean basin. Eur. J. Soil Biol. 2022, 112, 103430. [Google Scholar] [CrossRef]
  24. González-Pelayo, O.; Andreu, V.; Gimeno-García, E.; Campo, J.; Rubio, J.L. Effects of fire and vegetation cover on hydrological characteristics of a Mediterranean shrubland soil. Hydrobiol. Proc. 2010, 24, 1504–1513. [Google Scholar] [CrossRef]
  25. Fernández-García, V.; Marcos, E.; Huerta, S.; Calvo, L. Soil-vegetation relationships in Mediterranean forests after fire. For. Ecosyst. 2021, 8, 18. [Google Scholar] [CrossRef]
  26. Caon, L.; Vallejo, V.R.; Ritsema, C.J.; Geissen, V. Effects of Wildfire on Soil Nutrients in Mediterranean Ecosystems. Earth Sci. Rev. 2014, 139, 47–58. [Google Scholar] [CrossRef]
  27. Megremi, I.; Stathopoulou, E.; Vorris, E.; Kostakis, M.; Karavoltsos, S.; Thomaidis, N.; Vasilatos, C. Mediterranean Wildfires’ Effect on Soil Quality and Properties: A Case from Northern Euboea, Greece. Land 2024, 13, 325. [Google Scholar] [CrossRef]
  28. Certini, G. Effects of fire on properties of forest soils: A review. Oecologia 2005, 143, 1–10. [Google Scholar] [CrossRef] [PubMed]
  29. Bertani, R.; Blasi, C.; Biondi, E.; Bovio, G.; Camia, A.; Capogna, F.; Corona, P.; Cullotta, S.; Esposito, A.; Fabiani, M.L.; et al. Incendi e Complessità Ecosistemica. Dalla Pianificazione Forestale Al Recupero Ambientale; Blasi, C., Bovio, G., Corona, P.M., Marchetti, M., Maturani, A., Eds.; Ministero Dell’ambiente e della Tutela del Territorio; SBI, 2004; Available online: https://iris.uniroma1.it/handle/11573/64313 (accessed on 13 February 2025).
  30. Cramer, W.; Guiot, J.; Fader, M.; Garrabou, J.; Gattuso, J.-P.; Iglesias, A.; Lange, M.A.; Lionello, P.; Llasat, M.C.; Paz, S.; et al. Climate change and interconnected risks to sustainable development in the Mediterranean. Nat. Clim. Change 2018, 8, 972–980. [Google Scholar] [CrossRef]
  31. Koutsias, N.; Karteris, M. Classification analyses of vegetation for delineating forest fire fuel complexes in a Mediterranean test site using satellite remote sensing and GIS. Int. J. Remote Sens. 2002, 24, 3093–3104. [Google Scholar] [CrossRef]
  32. Xofis, P.; Buckley, P.G.; Takos, I.; Mitchley, J. Long Term Post-Fire Vegetation Dynamics in North-East Mediterranean Ecosystems. The Case of Mount Athos Greece. Fire 2021, 4, 92. [Google Scholar] [CrossRef]
  33. Nolè, A.; Rita, A.; Spatola, M.F.; Borghetti, M. Biogeographic variability in wildfire severity and post-fire vegetation recovery across the European forests via remote sensing-derived spectral metrics. Sci. Total Environ. 2022, 823, 153807. [Google Scholar] [CrossRef] [PubMed]
  34. Heim, R.J.; Bucharova, A.; Brodt, L.; Kamp, J.; Rieker, D.; Soromotin, A.V.; Yurtaev, A.; Holzel, N. Post-fire vegetation succession in the Siberian subarctic tundra over 45 years. Sci. Total Environ. 2021, 760, 143425. [Google Scholar] [CrossRef] [PubMed]
  35. Zellweger, F.; Coomes, D.; Lenoir, J.; Depauw, L.; Maes, S.L.; Wulf, M.; Kirby, K.J.; Brunet, J.; Kopecký, M.; Máliš, F.; et al. Seasonal drivers of understorey temperature buffering in temperate deciduous forests across Europe. Glob. Ecol. Biogeogr. 2019, 28, 1774–1786. [Google Scholar] [CrossRef] [PubMed]
  36. Ali, E.; Cramer, W.; Carnicer, J.; Georgopoulou, E.; Hilmi, N.J.M.; Le Cozannet, G.; Lionello, P. Cross-chapter paper 4: Mediterranean Region. In Climate Change 2022: Impacts, Adaptation and Vulnerability. Contribution of Working Group II to the Sixth Assessment Report of the Intergovernmental Panel on Climate Change; Pörtner, H.O., Roberts, D.C., Tignor, M., Poloczanska, E.S., Mintenbeck, K., Alegría, A., Craig, M., Langsdorf, S., Löschke, S., Möller, V., et al., Eds.; Cambridge University Press: Cambridge, UK; New York, NY, USA, 2022; pp. 2233–2272. [Google Scholar] [CrossRef]
  37. de Rigo, D.; Libertà, G.; Houston Durrant, T.; Artés Vivancos, T.; San-Miguel-Ayanz, J. Forest Fire Danger Extremes in Europe Under Climate Change: Variability and Uncertainty; Publication Office of the European Union: Luxemburg, 2017. [Google Scholar]
  38. Huerta, S.; Marcos, E.; Fernández-García, V.; Calvo, L. Resilience of Mediterranean communities to fire depends on burn severity and type of ecosystem. Fire Ecol. 2022, 18, 28. [Google Scholar] [CrossRef]
  39. Gibson, R.K.; White, L.A.; Hislop, S.; Nolan, R.H.; Dorrough, J. The post-fire stability index; a new approach to monitoring post-fire recovery by satellite imagery. Remote Sens. Environ. 2022, 280, 113151. [Google Scholar] [CrossRef]
  40. Liu, Z. Effects of climate and fire on short-term vegetation recovery in the boreal larch forests of Northeastern China. Sci. Rep. 2016, 6, 37572. [Google Scholar] [CrossRef] [PubMed]
  41. Au Yeung, C.; Li, R. Comparison of vegetation regeneration after wildfire between Mediterranean and tundra ecosystems by using landsat images. Ann. GIS 2018, 24, 99–112. [Google Scholar] [CrossRef]
  42. Arrogante-Funes, F.; Mouillot, F.; Moreira, B.; Aguado, I.; Chuvieco, E. Mapping and assessment of ecological vulnerability to wildfires in Europe. Fire Ecol. 2024, 20, 98. [Google Scholar] [CrossRef]
  43. Bastos, A.; Gouveia, C.M.; DaCamara, C.C.; Trigo, R.M. Modelling post-fire vegetation recovery in Portugal. Biogeosciences 2011, 8, 3593–3607. [Google Scholar] [CrossRef]
  44. Bright, B.C.; Hudak, A.T.; Kennedy, R.E.; Braaten, J.D.; Henareh Khalyani, A. Examining post-fire vegetation recovery with landsat time series analysis in three western north american forest types. Fire Ecol. 2019, 15, 8. [Google Scholar] [CrossRef]
  45. Cerdá, A.; Doerr, S.H. Influence of vegetation recovery on soil hydrology and erodibility following fire: An 11-year investigation. Int. J. Wildl. Fire 2015, 14, 423–437. [Google Scholar] [CrossRef]
  46. Gouveia, C.; DaCamara, C.C.; Trigo, R.M. Post-fire vegetation recovery in Portugal based on spot/vegetation data. Nat. Hazards Earth Syst. Sci. 2010, 10, 673–684. [Google Scholar] [CrossRef]
  47. Viana-Soto, A.; Aguado, I.; Salas, J.; García, M. Identifying post-fire recovery trajectories and driving factors using landsat time series in fire-prone mediterranean pine forests. Remote Sens. 2020, 12, 1499. [Google Scholar] [CrossRef]
  48. Ermitão, T.; Gouveia, C.M.; Bastos, A.; Russo, A.C. Recovery Following Recurrent Fires Across Mediterranean Ecosystems. Glob. Change Biol. 2024, 30, e70013. [Google Scholar] [CrossRef] [PubMed]
  49. Rossetti, I.; Calderisi, G.; Cogoni, D.; Fenu, G. Post-Fire Vegetation (Non-)Recovery across the Edges of a Wildfire: An Unexplored Theme. Fire 2024, 7, 250. [Google Scholar] [CrossRef]
  50. de Villalobos, A.E.; Peláez, D.V.; Bóo, R.M.; Mayor, M.D.; Elia, O.R. Effect of high temperatures on seed germination of Prosopis caldenia Burk. J. Arid Environ. 2002, 52, 371–378. [Google Scholar] [CrossRef]
  51. Cruz, Ó.; García-Duro, J.; Riveiro, S.F.; García-García, C.; Casal, M.; Reyes, O. Fire Severity Drives the Natural Regeneration of Cytisus scoparius L. (Link) and Salix atrocinerea Brot. Communities and the Germinative Behaviour of These Species. Forests 2020, 11, 124. [Google Scholar] [CrossRef]
  52. Rossetti, I.; Cogoni, D.; Calderisi, G.; Fenu, G. Short-Term Effects and Vegetation Response after a Megafire in a Mediterranean Area. Land 2022, 11, 2328. [Google Scholar] [CrossRef]
  53. Lawes, M.J.; Clarke, P.J. Ecology of Plant Resprouting: Populations to Community Responses in Fire-Prone Ecosystems. Plant Ecol. 2011, 212, 1937–1943. [Google Scholar] [CrossRef]
  54. Clarke, P.J.; Lawes, M.J.; Midgley, J.J.; Lamont, B.B.; Ojeda, F.; Burrows, G.E.; Enright, N.J.; Knox, K.J.E. Resprouting as a Key Functional Trait: How Buds, Protection and Resources Drive Persistence After Fire. New Phytol. 2013, 197, 19–35. [Google Scholar] [CrossRef]
  55. Pausas, J.G. Bark Thickness and Fire Regime. Funct. Ecol. 2015, 29, 315–327. [Google Scholar] [CrossRef]
  56. Harrison, S.P.; Prentice, I.C.; Bloomfield, K.J.; Dong, N.; Forkel, M.; Forrest, M.; Ningthoujam, R.K.; Pellegrini, A.; Shen, Y.; Baudena, M.; et al. Understanding and Modelling Wildfire Regimes: An Ecological Perspective. Environ. Res. Lett. 2021, 16, 125008. [Google Scholar] [CrossRef]
  57. Nolan, R.H.; Collins, L.; Leigh, A.; Ooi, M.K.J.; Curran, T.J.; Fairman, T.A.; de Dios, V.R.; Bradstock, R. Limits to Post-Fire Vegetation Recovery Under Climate Change. Plant Cell Environ. 2021, 44, 3471–3489. [Google Scholar] [CrossRef]
  58. Wundram, D.; Pape, R.; Löffler, J. Alpine soil temperature variability at multiple scales. Arct. Antarct. Alp. Res. 2010, 42, 117–128. [Google Scholar] [CrossRef]
  59. Liancourt, P.; Sharkhuu, A.; Ariuntsetseg, L.; Boldgiv, B.; Helliker, B.R.; Plante, A.F.; Petraits, P.S.; Casper, B.B. Temporal and spatial variation in how vegetation alters the soil moisture response to climate manipulation. Plant Soil 2012, 351, 249–261. [Google Scholar] [CrossRef]
  60. Legates, D.R.; Mahmood, R.; Levia, D.F.; DeLiberty, T.L.; Quiring, S.M.; Houser, C.; Nelson, F.E. Soil moisture: A central and unifying theme in physical geography. Prog. Phys. Geogr. 2010, 35, 65–86. [Google Scholar] [CrossRef]
  61. Gornall, J.L.; Woodin, S.J.; Jonsdottir, I.S.; van der Wal, R. Balancing positive and negative plant interactions: How mosses structure vascular plant communities. Oecologia 2011, 166, 769–782. [Google Scholar] [CrossRef]
  62. Monteiro, J.; Domingues, I.; Brilhante, M.; Serafim, J.; Nunes, S.; Trigo, R.; Branquinho, C. Changes in bryophyte functional composition during post-fire succession. Sci. Total Environ. 2024, 925, 171592. [Google Scholar] [CrossRef]
  63. Sapkota, D.; Edwards, D.; Massam, M.; Evans, K. A Pantropical Analysis of Fire Impacts and Post-Fire Species Recovery of Plant Life Forms. Ecol. Evol. 2025, 15, e71018. [Google Scholar] [CrossRef] [PubMed]
  64. Carmignani, L.; Oggiano, G.; Funedda, A.; Conti, P.; Pasci, S. The geological map of Sardinia (Italy) at 1: 250,000 scale. J. Maps 2016, 12, 826–835. [Google Scholar] [CrossRef]
  65. Regione Autonoma della Sardegna (RAS). Piano Forestale Ambientale Regionale: Distretto 12—Montiferru. 2007. Available online: https://www.regione.sardegna.it/documenti/1_5_20080214173430.pdf (accessed on 10 December 2024).
  66. Rivas-Martínez, S.; Rivas-Saenz, S. Worldwide bioclimatic classification system. Glob. Geobot. 2011, 1, 1–634. [Google Scholar]
  67. Linley, G.D.; Jolly, C.J.; Doherty, T.S.; Geary, W.L.; Armenteras, D.; Belcher, C.M.; Bliege Bird, R.; Duane, A.; Fletcher, M.-S.; Giorgis, M.A.; et al. What do you mean, ‘megafire’? Glob. Ecol. Biogeogr. 2022, 31, 1906–1922. [Google Scholar] [CrossRef]
  68. De Frenne, P.; Beugnon, R.; Klinges, D.; Lenoir, J.; Niittynen, P.; Pincebourde, S.; Senior, R.A.; Aalto, J.; Chytrý, K.; Gillingham, P.K. Ten practical guidelines for microclimate research in terrestrial ecosystems. Methods Ecol. Evol. 2024, 16, 269–294. [Google Scholar] [CrossRef]
  69. Lindenmayer, D.; Blanchard, W.; Mcburney, L.; Bowd, E.; Youngentob, K.N.; Marsh, K.; Taylor, C. Stand age related differences in forest microclimate. For. Ecol. Manag. 2022, 510, 120101. [Google Scholar] [CrossRef]
  70. Máliš, F.; Ujházy, K.; Hederová, L.; Ujházyová, M.; Csölleová, L.; Coomes, D.A.; Zellweger, F. Microclimate variation and recovery time in managed and old-growth temperate forests. Agric. For. Meteorol. 2023, 342, 109722. [Google Scholar] [CrossRef]
  71. Santi, I.; Carrari, E.; De Frenne, P.; Valerio, M.; Gasperini, C.; Cabrucci, M.; Selvi, F. Impact of Coppicing on Microclimate and Understorey Vegetation Diversity in an Ancient Mediterranean Oak Forest. Sci. Total Environ. 2024, 918, 170531. [Google Scholar] [CrossRef]
  72. JASP Team. JASP [Computer Software], Version 0.19.1. 2024. Available online: https://jasp-stats.org (accessed on 22 February 2025).
  73. StatSoft, Inc. STATISTICA [Computer Software], Version 8.0; StatSoft, Inc.: Tulsa, OK, USA, 2007.
  74. Capitanio, R.; Carcaillet, C. Post-fire Mediterranean vegetation dynamics and diversity: A discussion of succession models. For. Ecol. Manag. 2008, 255, 431–439. [Google Scholar] [CrossRef]
  75. Calvo, L.; Santalla, S.; Marcos, E.; Valbuena, L.; Tárrega, R.; Luis, E. Regeneration after wildfire in communities dominated by Pinus pinaster, an obligate seeder, and in others dominated by Quercus pyrenaica, a typical resprouter. For. Ecol. Manag. 2003, 184, 209–223. [Google Scholar] [CrossRef]
  76. Malkinson, D.; Wittenberg, L.; Beeri, O.; Barzilai, R. Effects of repeated fires on the structure, composition, and dynamics of Mediterranean maquis: Short- and long-term perspectives. Ecosystems 2011, 14, 478–488. [Google Scholar] [CrossRef]
  77. Schaffhauser, A.; Curt, T.; Tatoni, T. Fire-vegetation interplay in a mosaic structure of Quercus suber woodlands and Mediterranean maquis under recurrent fires. For. Ecol. Manag. 2011, 262, 730–738. [Google Scholar] [CrossRef]
  78. Schaffhauser, A.; Curt, T.; Véla, E.; Tatoni, T. Recurrent fires and environment shape the vegetation in Quercus suber L. woodlands and maquis. Comptes Rendus Biol. 2012, 335, 424–434. [Google Scholar] [CrossRef]
  79. Tessler, N.; Wittenberg, L.; Greenbaum, N. Vegetation cover and species richness after recurrent forest fires in the Eastern Mediterranean ecosystem of Mount Carmel, Israel. Sci. Total Environ. 2016, 572, 1395–1402. [Google Scholar] [CrossRef]
  80. Bates, J.D.; Davies, K.W.; Bournoville, J.; Boyd, C.; O’Connor, R.; Svejcar, T.J. Herbaceous biomass response to prescribed fire in juniper-encroached sagebrush steppe. Rangel. Ecol. Manag. 2019, 72, 28–35. [Google Scholar] [CrossRef]
  81. Bashirzadeh, M.; Abedi, M.; Shefferson, R.P.; Farzam, M. Post-Fire Recovery of Plant Biodiversity Changes Depending on Time Intervals since Last Fire in Semiarid Shrublands. Fire 2023, 6, 103. [Google Scholar] [CrossRef]
  82. Hanes, T.L. Succession after fire in Chaparral of southern California. Ecol. Monogr. 1971, 41, 27–52. [Google Scholar] [CrossRef]
  83. Lavorel, S. Ecological diversity and resilience of Mediterranean vegetation to disturbance. Divers. Distrib. 1999, 5, 3–13. [Google Scholar] [CrossRef]
  84. Pausas, J.G.; Vallejo, V.R. The role of fire in European Mediterranean ecosystems. In Remote Sensing of Large Wildfire in the European Mediterranean Basin; Chuvieco, E., Ed.; Springer: Berlin/Heidelberg, Germany, 1999. [Google Scholar]
  85. Buhk, C.; Gotzenberger, L.; Wesche, K.; Gomez, P.S.; Hensen, I. Post-fire regeneration in a Mediterranean pine forest with historically low fire frequency. Acta Oecol. 2006, 30, 288–298. [Google Scholar] [CrossRef]
  86. Castillo, M.S.; Plaza, V.Á.; Garfias, S.R. A recent review of fire behavior and fire effects on native vegetation in Central Chile. Glob. Ecol. Conserv. 2020, 24, e01210. [Google Scholar] [CrossRef]
  87. Trabaud, L.; Lepart, J. Diversity and stability in garrigue ecosystems after fire. Vegetatio 1980, 43, 49–57. [Google Scholar] [CrossRef]
  88. Trabaud, L. Dynamics after fire of sclerophyllous plant communities in the mediterranean basin. Ecol. Mediterr. 1987, 13, 25–37. [Google Scholar] [CrossRef]
  89. Thompson, J.D. Plant Evolution in the Mediterranean, Insights for Conservation, 2nd ed.; Oxford University Press: Oxford, UK, 2020; pp. 1–352. [Google Scholar]
  90. Keeley, J.E. Fire management impacts on invasive plant species in the western United States. Conserv. Biol. 2006, 20, 375–384. [Google Scholar] [CrossRef] [PubMed]
  91. Nunes, L.J.R.; Raposo, M.A.M.; Meireles, C.I.R.; Gomes, C.J.P.; Ribeiro, N.M.A. Fire as a selection agent for the dissemination of invasive species: Case study on the evolution of forest coverage. Environments 2020, 7, 57. [Google Scholar] [CrossRef]
  92. Grupenhoff, A.R.; Safford, H.D. High fire frequency in California chaparral reduces postfire shrub regeneration and native plant diversity. Ecosphere 2024, 15, e70128. [Google Scholar] [CrossRef]
  93. Shakesby, R.A.; Doerr, S.H. Wildfire as a hydrological and geomorphological agent. Earth Sci. Rev. 2006, 74, 269–307. [Google Scholar] [CrossRef]
  94. Zavala, L.M.; de Celis, R.; López, A.J. How wildfires affect soil properties. A brief review. Cuad. Investig. Geogr. 2014, 40, 311–331. [Google Scholar] [CrossRef]
  95. Wagenbrenner, J.W.; Ebel, B.A.; Bladon, K.D.; Kinoshita, A.M. Post-wildfire hydrologic recovery in Mediterranean climates: A systematic review and case study to identify current knowledge and opportunities. J. Hydrol. 2021, 602, 126772. [Google Scholar] [CrossRef]
  96. Lucas-Borja, M.E.; Plaza-Álvarez, P.A.; Yáñez, M.D.C.; Miralles, I.; Ortega, R.; Soria, R.; Zema, D.A. Long-term evaluation of soil functionality in Mediterranean forests after a wildfire and post-fire hillslope stabilisation. For. Ecol. Manag. 2024, 555, 121715. [Google Scholar] [CrossRef]
  97. Uribe, C.; Inclán, R.; Sánchez, D.M.; Clavero, M.A.; Fernández, A.M.; Morante, R.; Cardeña, A.; Blanco, A.; Van Miegroet, H. Effect of wildfires on soil respiration in three typical Mediterranean forest ecosystems in Madrid, Spain. Plant Soil 2013, 369, 403–420. [Google Scholar] [CrossRef]
Figure 1. Location of the study areas. (A) burned area in relation to Sardinia Island (Western Mediterranean); (B) burned area in 2021; and (C) detail of the study area: the numbers indicate the investigated areas. The white triangles indicate the location of our plots (U: unburned plots, LS: low-severity fire, and HS: high-severity fire, according to dNBR severity classes) within each study area.
Fire 08 00091 g001
Figure 2. Boxplots of (A) total number of species, (B) total cover of species, and (C) total height of species in unburned (U), low-severity fire (LS), and high-severity fire (HS) plots during the years 2021, 2022, 2023, and 2024. The boxes show the interquartile range, the horizontal bars show median values, and the vertical bars show the top and bottom 25% quartiles. Statistically significant values are represented by asterisks: * = p < 0.05; ** = p < 0.01.
Fire 08 00091 g002
Figure 3. Boxplots of (A) number of structural species, (B) cover of structural species, (C) number of other species, and (D) cover of other species in unburned (U), low-severity fire (LS), and high-severity fire (HS) plots during the years 2021, 2022, 2023, and 2024. The boxes show the interquartile range, the horizontal bars show median values, and the vertical bars show the top and bottom 25% quartiles. Statistically significant values are represented by asterisks: * = p < 0.05; ** = p < 0.01.
Fire 08 00091 g003
Figure 4. Boxplots of (A) tree layer cover, (B) shrub layer cover, and (C) herbaceous layer cover in unburned (U), low-severity fire (LS), and high-severity fire (HS) plots during the years 2021, 2022, 2023, and 2024. The boxes show the interquartile range, the horizontal bars show median values, and the vertical bars show the top and bottom 25% quartiles. Statistically significant values are represented by asterisks: * = p < 0.05.
Fire 08 00091 g004
Figure 5. Boxplots of (A) tree layer height, (B) shrub layer height, and (C) herbaceous layer height in unburned (U), low-severity fire (LS), and high-severity fire (HS) plots during the years 2021, 2022, 2023, and 2024. The boxes show the interquartile range, the horizontal bars show median values, and the vertical bars show the top and bottom 25% quartiles. Statistically significant values are represented by asterisks: * = p < 0.05; ** = p < 0.01.
Fire 08 00091 g005
Figure 6. (A) Daily values of soil temperature, divided into months of the years 2022, 2023, and 2024, in burned and control areas; (B) mean daily values of soil temperature, divided into months of the years 2022, 2023, and 2024, in burned and control areas; and (C) daily soil ΔT values, divided into months of the years 2022, 2023, and 2024, in burned and control areas.
Fire 08 00091 g006
Figure 7. (A) Mean seasonal values of soil temperature for the years 2022, 2023, and 2024 in burned and control areas, and (B) seasonal soil ΔT values for the years 2022, 2023, and 2024 in burned and control areas. Statistically significant values are represented by asterisks: * = p < 0.05.
Fire 08 00091 g007
Disclaimer/Publisher’s Note: The statements, opinions and data contained in all publications are solely those of the individual author(s) and contributor(s) and not of MDPI and/or the editor(s). MDPI and/or the editor(s) disclaim responsibility for any injury to people or property resulting from any ideas, methods, instructions or products referred to in the content.

