Article

Investigating the Latency of Lightning-Caused Fires in Boreal Coniferous Forests Using Random Forest Methodology

1
Key Laboratory of Forest Protection of National Forestry and Grassland Administration, Ecology and Nature Conservation Institute, Chinese Academy of Forestry, National Forestry and Grassland Fire Monitoring, Early Warning and Prevention Engineering Technology Research Center, Beijing 100091, China
2
Institute of Electrical Engineering, Chinese Academy of Sciences, Beijing 100091, China
*
Author to whom correspondence should be addressed.
Submission received: 22 January 2025 / Revised: 15 February 2025 / Accepted: 18 February 2025 / Published: 19 February 2025

Abstract

:
This study investigates the latency of lightning-caused fires in the boreal coniferous forests of the Greater Khingan Mountains, employing advanced machine learning techniques to analyze the relationship between meteorological factors, lightning characteristics, and fire ignition and smoldering processes. Using the Random Forest Model (RFM) combined with Recursive Feature Elimination with Cross-Validation (RFECV) and SHapley Additive exPlanations (SHAP), the study identifies key factors influencing fire latency. Two methods, Min distance and Min latency, were used to determine ignition lightning, with the Min distance method proving more reliable. The results show that lightning-caused fires cluster spatially and peak temporally between May and July, aligning with lightning activity. The Fine Fuel Moisture Code (FFMC) and precipitation were identified as the most influential factors. This study underscores the importance of fuel moisture and weather conditions in determining latency of lightning-caused fire, offering valuable insights for enhancing early warning systems. Despite limitations in data resolution and the exclusion of topographic factors, this study advances our understanding of lightning-fire latency mechanisms and provides a foundation for more effective wildfire management strategies under climate change.

1. Introduction

In the context of climate change, many regions worldwide have seen a continuous rise in surface temperature and lightning occurrences. The increased frequency of droughts and lightning strikes is likely to lead to more natural ignition sources and larger combustion areas, threatening both forest ecological security and human lives and property [1,2,3,4,5,6]. Lightning-caused fires, often highly concealed and occurring in remote, inaccessible forest areas, are more difficult to monitor and suppress than conventional fires, thus posing greater potential hazards. For example, in Canada, 45% of wildfires caused by lightning account for over 80% of the total burned area [7].
Due to its unique climatic and geographical conditions, lightning has been a major ignition source in the Greater Khingan Range, with the proportion of wildfires initiated by lightning strikes once reaching as high as 38% [8,9]. In recent years, the response of lightning-caused fires in the Greater Khingan Mountains forest area to climate change has become increasingly pronounced, primarily manifested in the intensified frequency of lightning activity, the extended fire season, the increased frequency of fires, and the expansion of high-risk areas. Numerous studies have posited that the threat posed by lightning-caused fires will continue to rise in the future [10,11,12,13]. Particularly during the period from 2019 to 2021, stringent fire prevention policies that restricted anthropogenic ignition sources led to lightning becoming the predominant source of wildfires in the Greater Khingan Range, accounting for over 97% of all wildfires. Consequently, a systematic and multifaceted investigation into lightning-caused fires is both urgent and imperative.
The ignition process of lightning-caused fires follows a distinct pattern, consisting of three stages: discharge heating, thermal feedback, and sustained smoldering. This process is jointly determined by the minimum size of the combustible material, its initial temperature, and the absorbed energy [14]. However, the ignition of combustible material by lightning does not necessarily lead to a wildfire; the occurrence of a wildfire is highly contingent upon the dryness of the combustible material and the prevailing fire environment at the time [15,16].
The latency refers to the time between lightning ignition of combustible material and the detection of the resulting fire. This stage can last from 1 to 3 days [17,18,19,20], although in extreme cases, it may persist for several weeks [21,22,23]. What are the primary factors influencing the duration of the latency of lightning-caused fires? This is the question that the present study aims to address, as it will contribute to a deeper understanding of the smoldering mechanism of lightning-caused fires and the refinement of the early warning system for such wildfires. Although previous studies have explored various aspects of lightning-caused fires, there is a lack of in-depth research on the factors affecting the latency of these fires, which is a crucial gap that the current study intends to fill.

2. Materials and Methods

2.1. Overview of the Study Area

The study area encompasses the Heilongjiang region and the Greater Khingan Mountains in Inner Mongolia, with geographical coordinates ranging from 119.60° E to 127.02° E and from 47.05° N to 53.56° N. This region features a cold temperate continental monsoon climate, characterized by an annual average temperature of −2.8 °C and an annual precipitation of 450–500 mm. The average elevation is 573 m, while the highest elevation reaches 1528 m. The soil type is classified as cold temperate forest soil. The predominant forest type in the Greater Khingan Mountains forest area is mixed forests mainly composed of Larix gmelinii, with other principal tree species including Pinus sylvestris var. mongolica, Betula platyphylla, Quercus mongolica, Populus davidiana, and Salix matsudana [24]. The Greater Khingan Mountains forest area, an archetypal boreal coniferous forest with a long-standing history of lightning-caused fires, serves as a highly representative region for studying such fires. The findings derived from this area can be extrapolated to other similar boreal coniferous forest regions globally, lending significant credibility and broad applicability to the research outcomes.

2.2. Data Source

The data on lightning-caused fires in the Greater Khingan Range from 2019 to 2021, which includes details such as ignition time, geographical coordinates, and burned area, were obtained from the statistical records of the forestry and grassland fire prevention departments. The lightning data for the Greater Khingan Range from 2019 to 2021, encompassing the time of lightning occurrence, geographical coordinates, lightning intensity (KA), and lightning type, were sourced from the Institute of Electrical Engineering, Chinese Academy of Sciences. The daily meteorological data from the national meteorological station in the Greater Khingan Range for the period 2019 to 2021, including Tem (Temperature) (°C), Hum (Humidity) (%), Ws (Wind speed) (m/s), and Pre (Precipitation) (mm), were retrieved from the National Meteorological Science Data Center/China Meteorological Data Network (https://data.cma.cn/, accessed on 17 February 2025).

2.3. Data Preprocessing

2.3.1. Ignition Lightning Determination Method

The spatial distance between lightning strikes and fire ignition points was calculated using the Point Distance tool in ArcGIS Pro 3.0.2, and the latency period was determined based on the time difference between lightning occurrence and fire detection. The selection criteria for ignition lightning were based on the following rules: within a 10 km radius centered on the wildfire ignition point, and the lightning must occur within 90 days before the wildfire, with the lightning type being cloud-to-ground. The selection of ignition lightning distance threshold refers to the previous study [25], 10 km is a conservative enough distance to include any spatial error; The time threshold was determined from the analysis of the original data, and we found that within 10 km of all lightning-caused fires in the study area, the cloud-to-ground lightning that occurred in the same year was, at most, 89.8 days earlier than the lightning-caused fire. In fact, all cloud-to-ground lightning events that occurred within 10 km of the lightning-caused fires were selected.
On this basis, two methods were used to determine the ignition lightning: (1) The minimum distance method: Select the lightning that is closest to the wildfire ignition point within the range. (2) The minimum latency method [25]: Select the lightning with the shortest latency within the range.

2.3.2. Meteorological Data

Daily meteorological data were obtained from the nearest national meteorological station. Meteorological data were categorized into three time periods: (1) Fire day (the day the fire was detected); (2) Light day (the day the lightning occurred); (3) Period daily average (if the latency is less than 1 day, the meteorological data for all three categories are equal). Since the ignition lightning determined by the two methods differ, the meteorological data and the calculated FWI indices for Light day and Period daily average will also vary.

2.4. Research Method

2.4.1. FWI (Fire Weather Index)

The forest fire danger rating system is the foundation of modern forest fire management systems. Fire danger rating systems produce quantitative and/or qualitative fire potential indicators, widely used in forest fire management activities to guide actions for wildfires and prescribed burns. The Canadian Forest Fire Weather Index (FWI) system is one of the most developed and widely used systems in the world [26]. The FWI system is based on daily observations of four weather factors (temperature, relative humidity, wind speed, and precipitation) at 12:00, generating multiple indices that assess fire danger in mature pine forests [27]. It has been applied and validated in the forest fire danger calculations in the Greater Khingan Range [28].
Based on the processed meteorological data, seven FWI indices were calculated using the cffdrs package in R 4.4.1. These include:
  • FFMC (Fine Fuel Moisture Code): Measures the moisture level of surface fine fuels (such as dead grass, needles, etc.).
  • DMC (Duff Moisture Code): Measures the moisture level of the duff layer (the organic matter layer in forests).
  • DC (Drought Code): Measures the impact of long-term drought on the deep organic matter layer.
  • ISI (Initial Spread Index): Measures the rate of fire spread without wind influence.
  • BUI (Buildup Index): Measures the accumulation and drying degree of fuels.
  • FWI (Fire Weather Index): Provides a comprehensive evaluation of the fire weather danger level.
  • DSR (Daily Severity Rating): Assesses the potential severity of fires.
The Fire Weather Index (FWI) was incorporated as a key predictor in the lightning-caused fire latency prediction model due to its superior ability to comprehensively characterize fire risk conditions compared to raw meteorological variables. The FWI system integrates multiple meteorological factors and fuel moisture parameters into a unified framework, providing a holistic assessment of fire ignition and spread potential. Importantly, the FWI calculation accounts for the temporal lag effects of meteorological conditions, enabling it to capture the dynamic evolution of fire risk more effectively than instantaneous meteorological measurements.
The standardized nature of the FWI enhances its interpretability and cross-regional comparability, offering clearer mechanistic insights into fire dynamics than isolated meteorological variables. However, while the FWI provides a more interpretable and actionable metric for fire risk prediction, raw meteorological data remain indispensable for describing the fundamental physical processes driving fire behavior. Thus, the integration of both FWI and raw meteorological data offers a complementary approach, leveraging the strengths of each to enhance the accuracy and robustness of fire prediction models.

2.4.2. Person Correlation Coefficient

In this study, the selected factors affecting the latency include the following 36 indicators: Distance (Dist, m) between lightning and wildfire ignition; Intensity (KA) of lightning; Polarity; the meteorological date and FWI of Fire day, Light day, and Period daily average, including Tem, Hum, Ws, Pre, FFMC, DMC, DC, ISI, BUI, FWI, and DSR. The Pearson correlation coefficient was used to assess the relationship between latency and influencing factors. Since polarity (Polarity) is a binary variable, the point-biserial correlation was used to calculate its correlation with latency.

2.4.3. RFM (Random Forest Model)

The Random Forest Model (RFM), renowned for its robustness and versatility, is widely used in data science and machine learning. It improves model accuracy and robustness by constructing multiple decision trees and combining their predictive results, capable of handling both classification and regression tasks. Its advantages include the effective handling of datasets with a large number of features, higher accuracy compared to single decision trees, and the ability to prevent overfitting. Additionally, it can quantify the contribution of features to predictive outcomes through feature importance scores [29]. Before using RFM to analyze the relationship between the influencing factors and latency, data cleaning was performed. The mean of all numeric columns is used to fill the missing values in the respective columns. And removing outliers using the IQR (Interquartile Range) method to enhance accuracy of RFM, specifically, the first quartile (Q1) and the third quartile (Q3) are calculated, and then IQR = Q3 − Q1. Outliers are defined as all data points that are less than Q1 − 1.5 *IQR or greater than Q3 + 1.5 *IQR. Clean the data based on the IQR rules for all numeric columns, removing any rows that contain outliers.

2.4.4. RFECV (Recursive Feature Elimination with Cross-Validation)

RFECV is an ensemble method for feature selection that combines Recursive Feature Elimination (RFE) with Cross-Validation (CV) to select the optimal number of features. It requires the selection of a model and a feature evaluator, starting with all features and recursively removing the least important ones. After each round of recursive feature elimination, cross-validation is performed on the remaining feature set to assess model performance. The optimal number of features is selected based on cross-validation scores, and the final model is trained using the retained optimal features [30]. In this study, 10-fold cross-validation was used to evaluate model performance. The dataset was divided into 10 subsets of approximately equal size, with 9 subsets used for training and the remaining 1 subset used for validation, repeated 10 times. The model evaluation metrics were Root Mean Square Error (RMSE) and R-squared (R2), with the former measuring the average error between predicted and actual values, and the latter assessing the model’s explanatory power for the target variable.
In this study, recursive feature elimination with cross-validation (RFECV) was prioritized over alternative feature selection methodologies (such as Filter, Embedded, or Wrapper approaches) primarily due to the following scientific rationale and alignment with research objectives:
  • Comprehensive Interaction Assessment: RFECV is capable of capturing high-order interactions among features. It achieves this by iteratively eliminating features that make the least contribution to the model, thereby progressively refining the feature subset. In contrast, the Filter method merely evaluates the linear correlation between individual variables and the target variable, and is unable to handle nonlinear relationships effectively.
  • Model-Adaptability and Feature Subset Compatibility: RFECV relies on the weights of the base model as the basis for feature elimination. This ensures the compatibility of the selected feature subset with the final predictive model, thus avoiding the suboptimal feature subsets that may arise from the assumptions inherent in Embedded models.
  • Robust Generalization Performance Evaluation: RFECV assesses the generalization performance of feature subsets at each recursive step through cross-validation. This significantly mitigates the impact of random fluctuations. In comparison, the Wrapper method is more prone to falling into local optimality due to the absence of cross–validation, which can lead to less reliable feature selection results.
  • Interpretability and Feature Importance Classification: RFECV provides a clear sequence of feature elimination and supports the classification of factor importance. Moreover, the output feature subset maintains consistency with the physical meaning of the original variables, which represents a distinct advantage over black–box dimensionality reduction techniques such as Principal Component Analysis (PCA).
In summary, RFECV was chosen as the feature selection method due to its strengths in dynamically evaluating feature interactions, ensuring model adaptability and stability, and its high compatibility with the research objectives (such as interpretability and nonlinear relationship modeling) as well as the characteristics of the data (high–dimensional and involving multi–factor interactions).

2.4.5. SHAP (Shapley Additive Explanations)

SHAP is a method for explaining the predictions of machine learning models. Based on the Shapley values from game theory, it provides a fair and consistent way to allocate the contribution of each feature to the prediction results. The calculation process involves generating all possible feature combinations (subsets) and computing the model’s predictions for each combination. The Shapley values are then calculated based on the contribution of each feature across all combinations. These values measure the average contribution of each feature to the prediction results across different combinations, avoiding inaccuracies due to interdependencies among features, and offering advantages such as fairness, stability, and high interpretability [31]. In this study, SHAP was used to explain the impact of influencing factors on the target variable in the model.

2.4.6. Data Analysis and Mapping

The analysis and mapping of wildfire, lightning, meteorological data, and FWI were completed using Origin 2024, while the machine learning part was conducted using Python 3.10.

3. Results

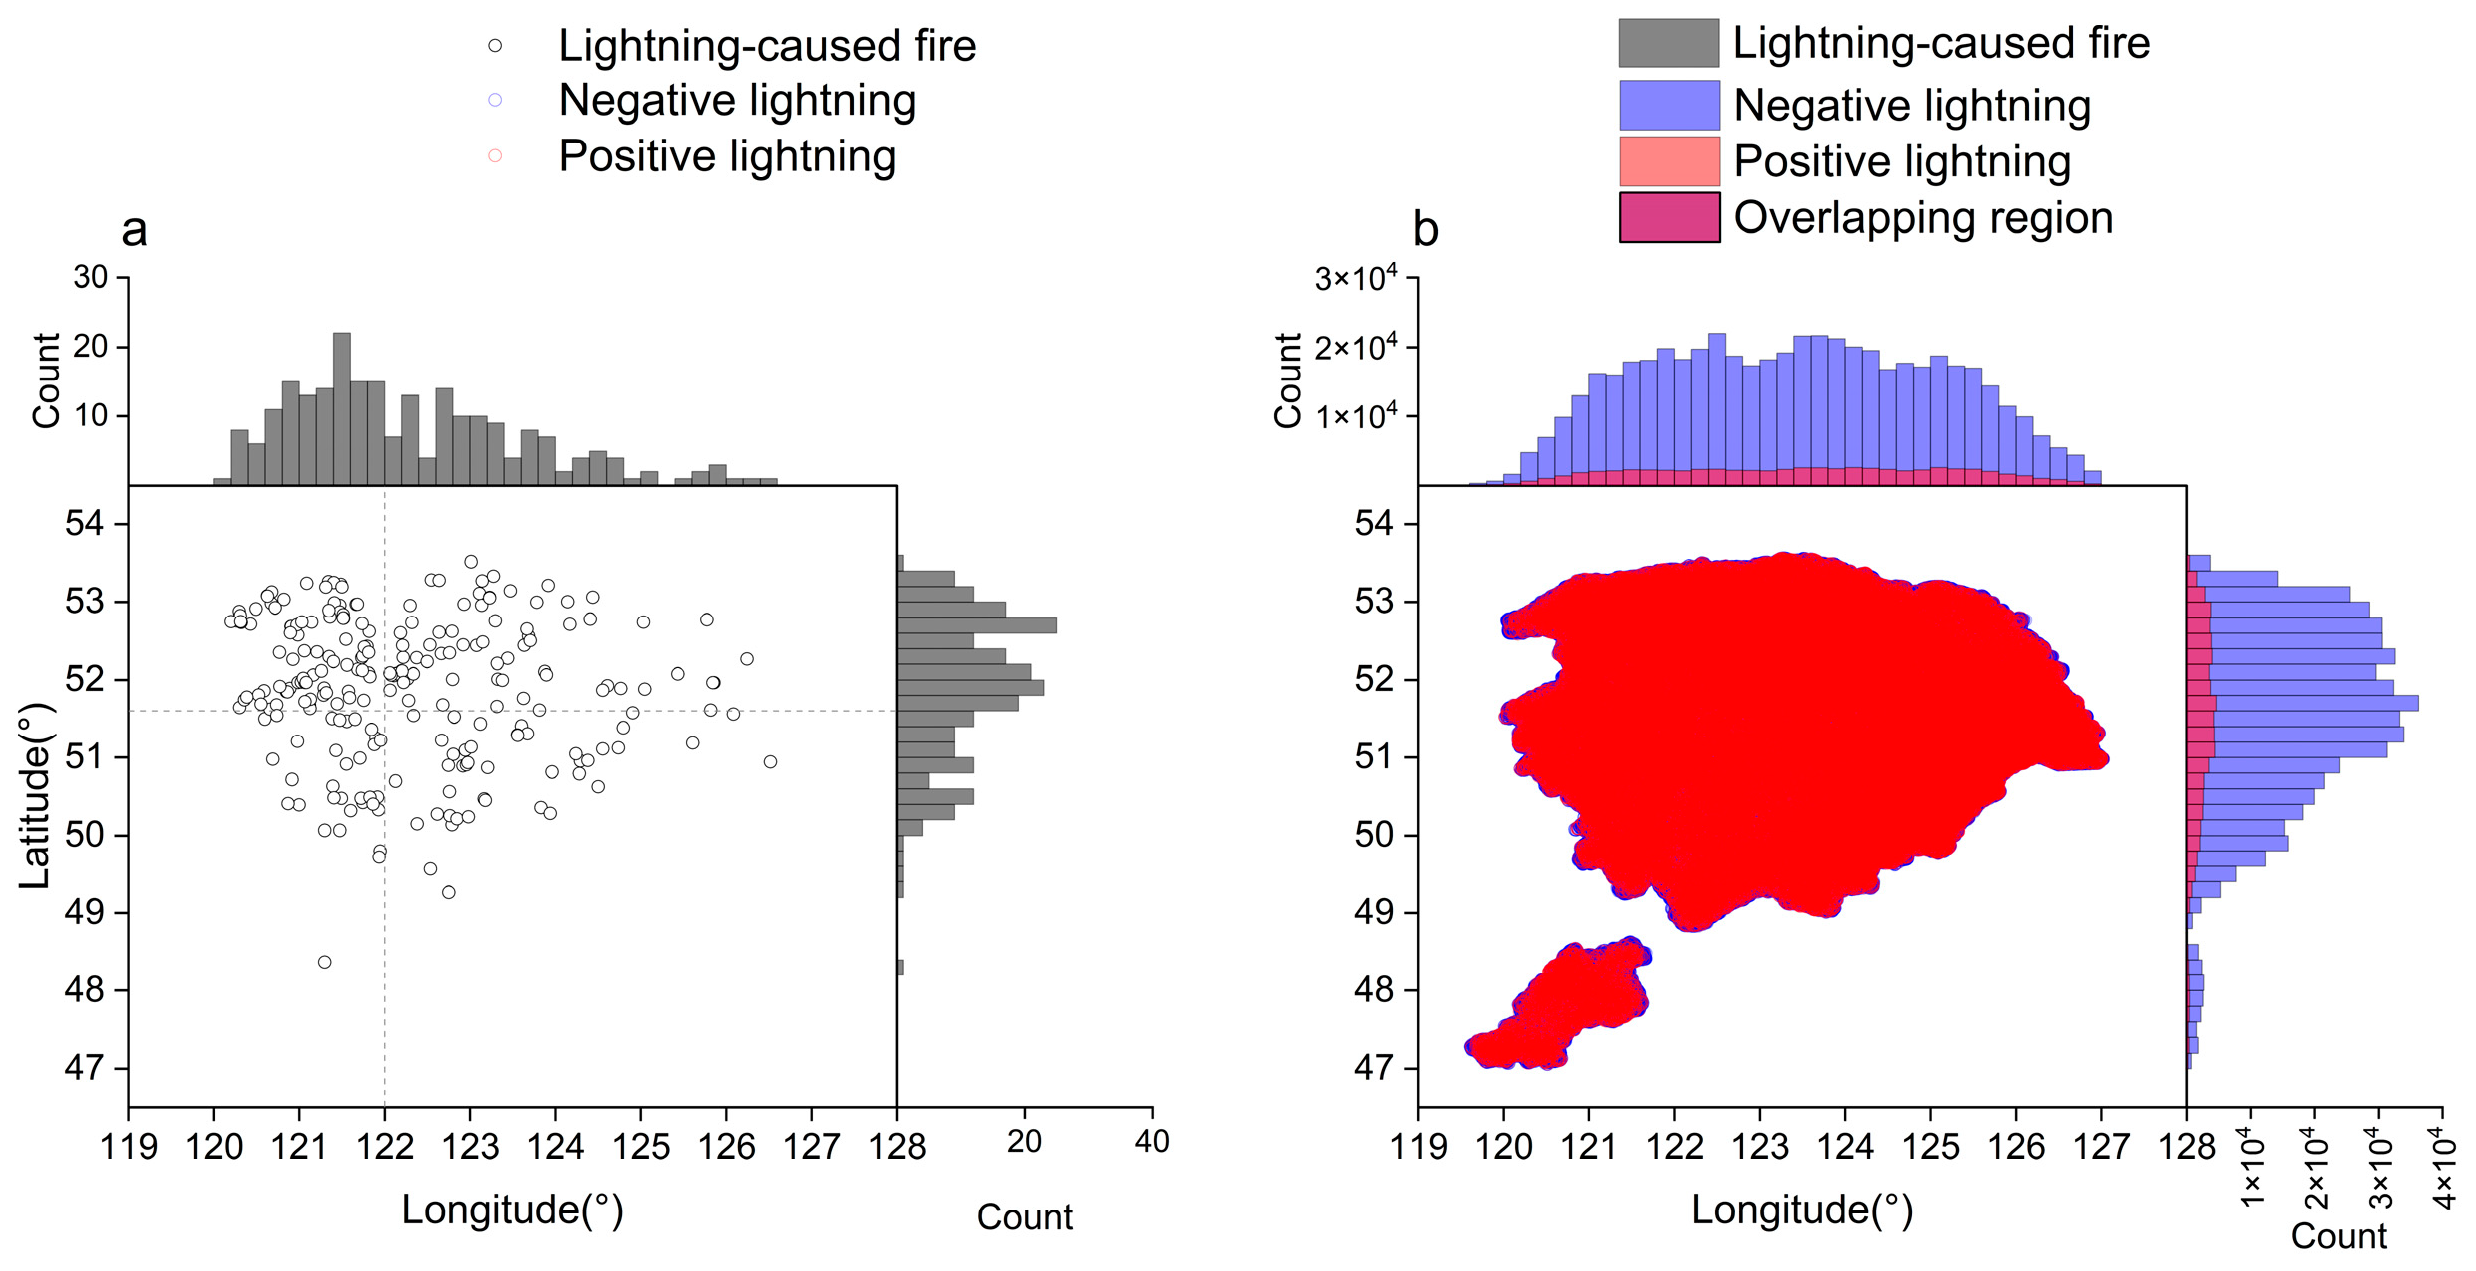
3.1. Lightning and Lightning-Caused Fire Characteristics

A total of 233 lightning-caused fires were recorded in the Greater Khingan Mountains over the three-year study period. The highest number of incidents occurred in 2020, followed by 2019, while 2021 saw a two-order-of-magnitude decrease compared to the previous two years. Generally, lightning-caused fires predominantly occur between May and July, with July accounting for the majority at 65.7%. Diurnally, these fires are most frequent between 6:00 and 21:00, with a peak period from 10:00 to 19:00, and the highest incidence between 14:00 and 15:00 (Figure 1a). In the Greater Khingan Mountains, the incidence of lightning-caused fires exhibited a marked increase during the transition from late spring to mid-summer, with July being the peak month. Daytime lightning-caused fires activity exhibits a temporal pattern, showing a higher frequency from forenoon to evening. Notably, the afternoon period represents the most concentrated phase of fire activity.
During the same three-year period, the region experienced 588,439 cloud-to-ground lightning strikes, of which 521,561 were negative (88.6%) and 66,878 were positive (11.4%). Lightning activity spans from May to October, with the most active period occurring from June to August, peaking in July. Diurnal lightning activity exhibits a distinct pattern, with a complete trend curve—rising, peaking, and then declining—observed between 10:00 and 24:00, reaching its zenith between 14:00 and 15:00. The temporal distribution of lightning-caused fires aligns closely with that of lightning strikes, though not entirely congruently. For instance, in 2019, while July recorded the highest number of lightning strikes, June saw the most lightning-caused fires (Figure 1b). In the Greater Khingan Mountains, lightning activity is observed throughout the spring, summer, and autumn seasons. However, the most active period coincides with the peak fire incidence period, which spans from June to August, with activity reaching its zenith in July. Diurnal lightning activity exhibits a distinct fluctuation pattern, gradually increasing from forenoon through the afternoon to the evening, and then progressively weakening.
Spatially, lightning-caused fires exhibit clustering, with higher concentrations observed north of 51.6° N and west of 122°E (Figure 2a). This spatial distribution markedly differs from that of lightning strikes, as regions with high lightning activity do not necessarily correspond to areas with frequent lightning-caused fires (Figure 2b). This discrepancy arises because lightning is only one of several factors contributing to fire ignition, with weather conditions and vegetation also playing crucial roles. For instance, the ignition of lightning-caused fires generally commences with decayed wood and small combustibles. These fires are more often observed in areas characterized by high soil moisture content, elevated terrain, and sparse forest stands, such as valley meadows, mountainous forest regions, and logging clearings. The season marked by active thunderstorms, high temperatures, and a propensity for droughts is the period of elevated risk for lightning-caused fires [8,32]. Regardless of polarity, the majority of lightning strikes exhibit intensities between 10 and 20 kA. For strikes exceeding 20 kA, a clear negative correlation is observed between the number of strikes and their intensity (Figure 3).

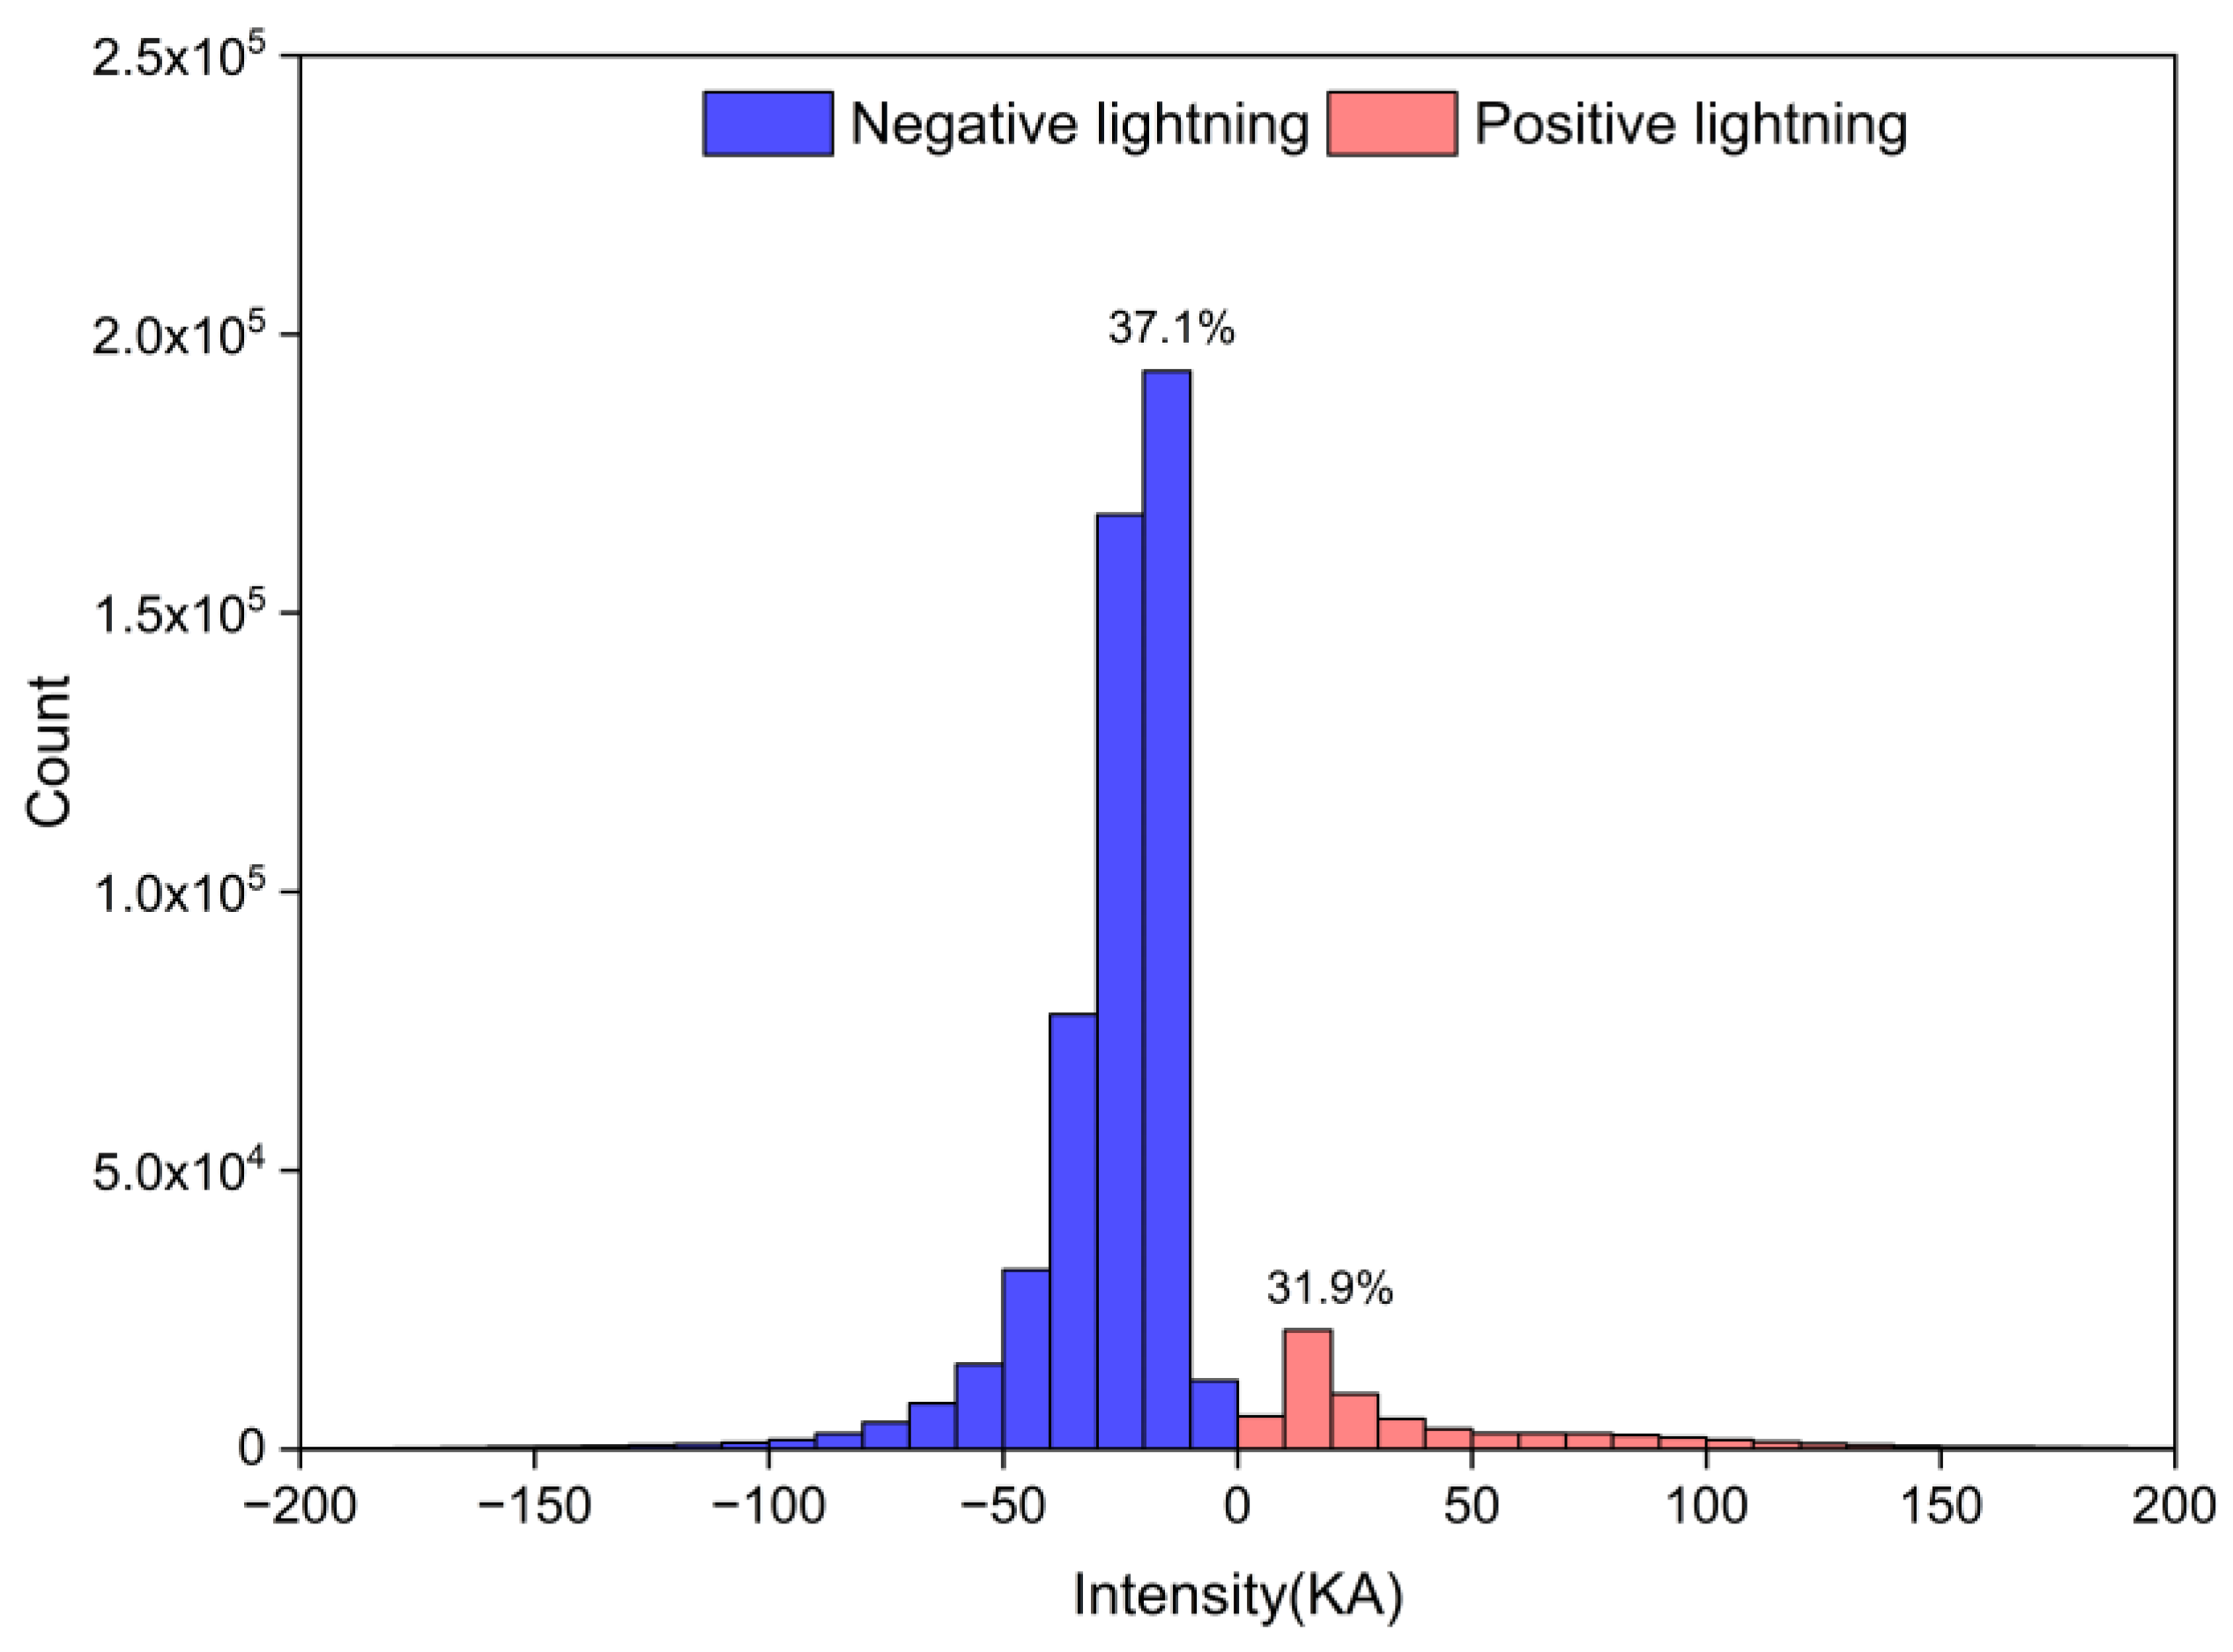
3.2. Characteristics of Ignition Lightning

Using both the Min distance and Min latency methods, corresponding ignition lightning strikes were selected for 232 lightning-caused fires, revealing differences in their lightning intensity characteristics. In the Min distance method, negative accounted for 88.4% of the total, with a maximum intensity of 148.3 kA, while positive constituted 11.6%, with a maximum intensity of 211.5 kA. In contrast, under the Min latency method, the proportion of negative decreased to 78.4%, with a maximum intensity of 154.4 kA, whereas the proportion of positive increased to 21.6%, with a maximum intensity of 109.5 kA (Figure 4).
In the Min distance method, all selected lightning strikes were located within 4 km of the lightning-caused fires. Although some lightning strikes with exceptionally long latency (exceeding 70 days) were selected, their proportion was minimal. The majority of lightning strikes (45.7%) had latency of less than 1 days. On the other hand, in the Min latency method, all selected lightning strikes had latency of no more than 10 days, 72% of the them had a latency of less than 1 day. And a significant number of lightning strikes located at greater distances from the lightning-caused fires were chosen, with 88.8% of the lightning strikes being more than 4 km away from the fires (Figure 5). In both methods, a subset of lightning strikes exhibited the dual characteristics of being both close in distance and having short latency. These lightning strikes may provide more definitive insights for influencing factor analysis and modeling.
Overall, the Min distance method emphasizes the spatial correlation between lightning strikes and fire locations, ensuring a high degree of spatial association by selecting the lightning event closest to the fire. In contrast, the Min latency method prioritizes the temporal relationship, focusing on the lightning strike with the shortest time difference from the actual fire occurrence, and giving priority to those lightning strikes that may be the direct cause of the fire over a larger spatial scale.

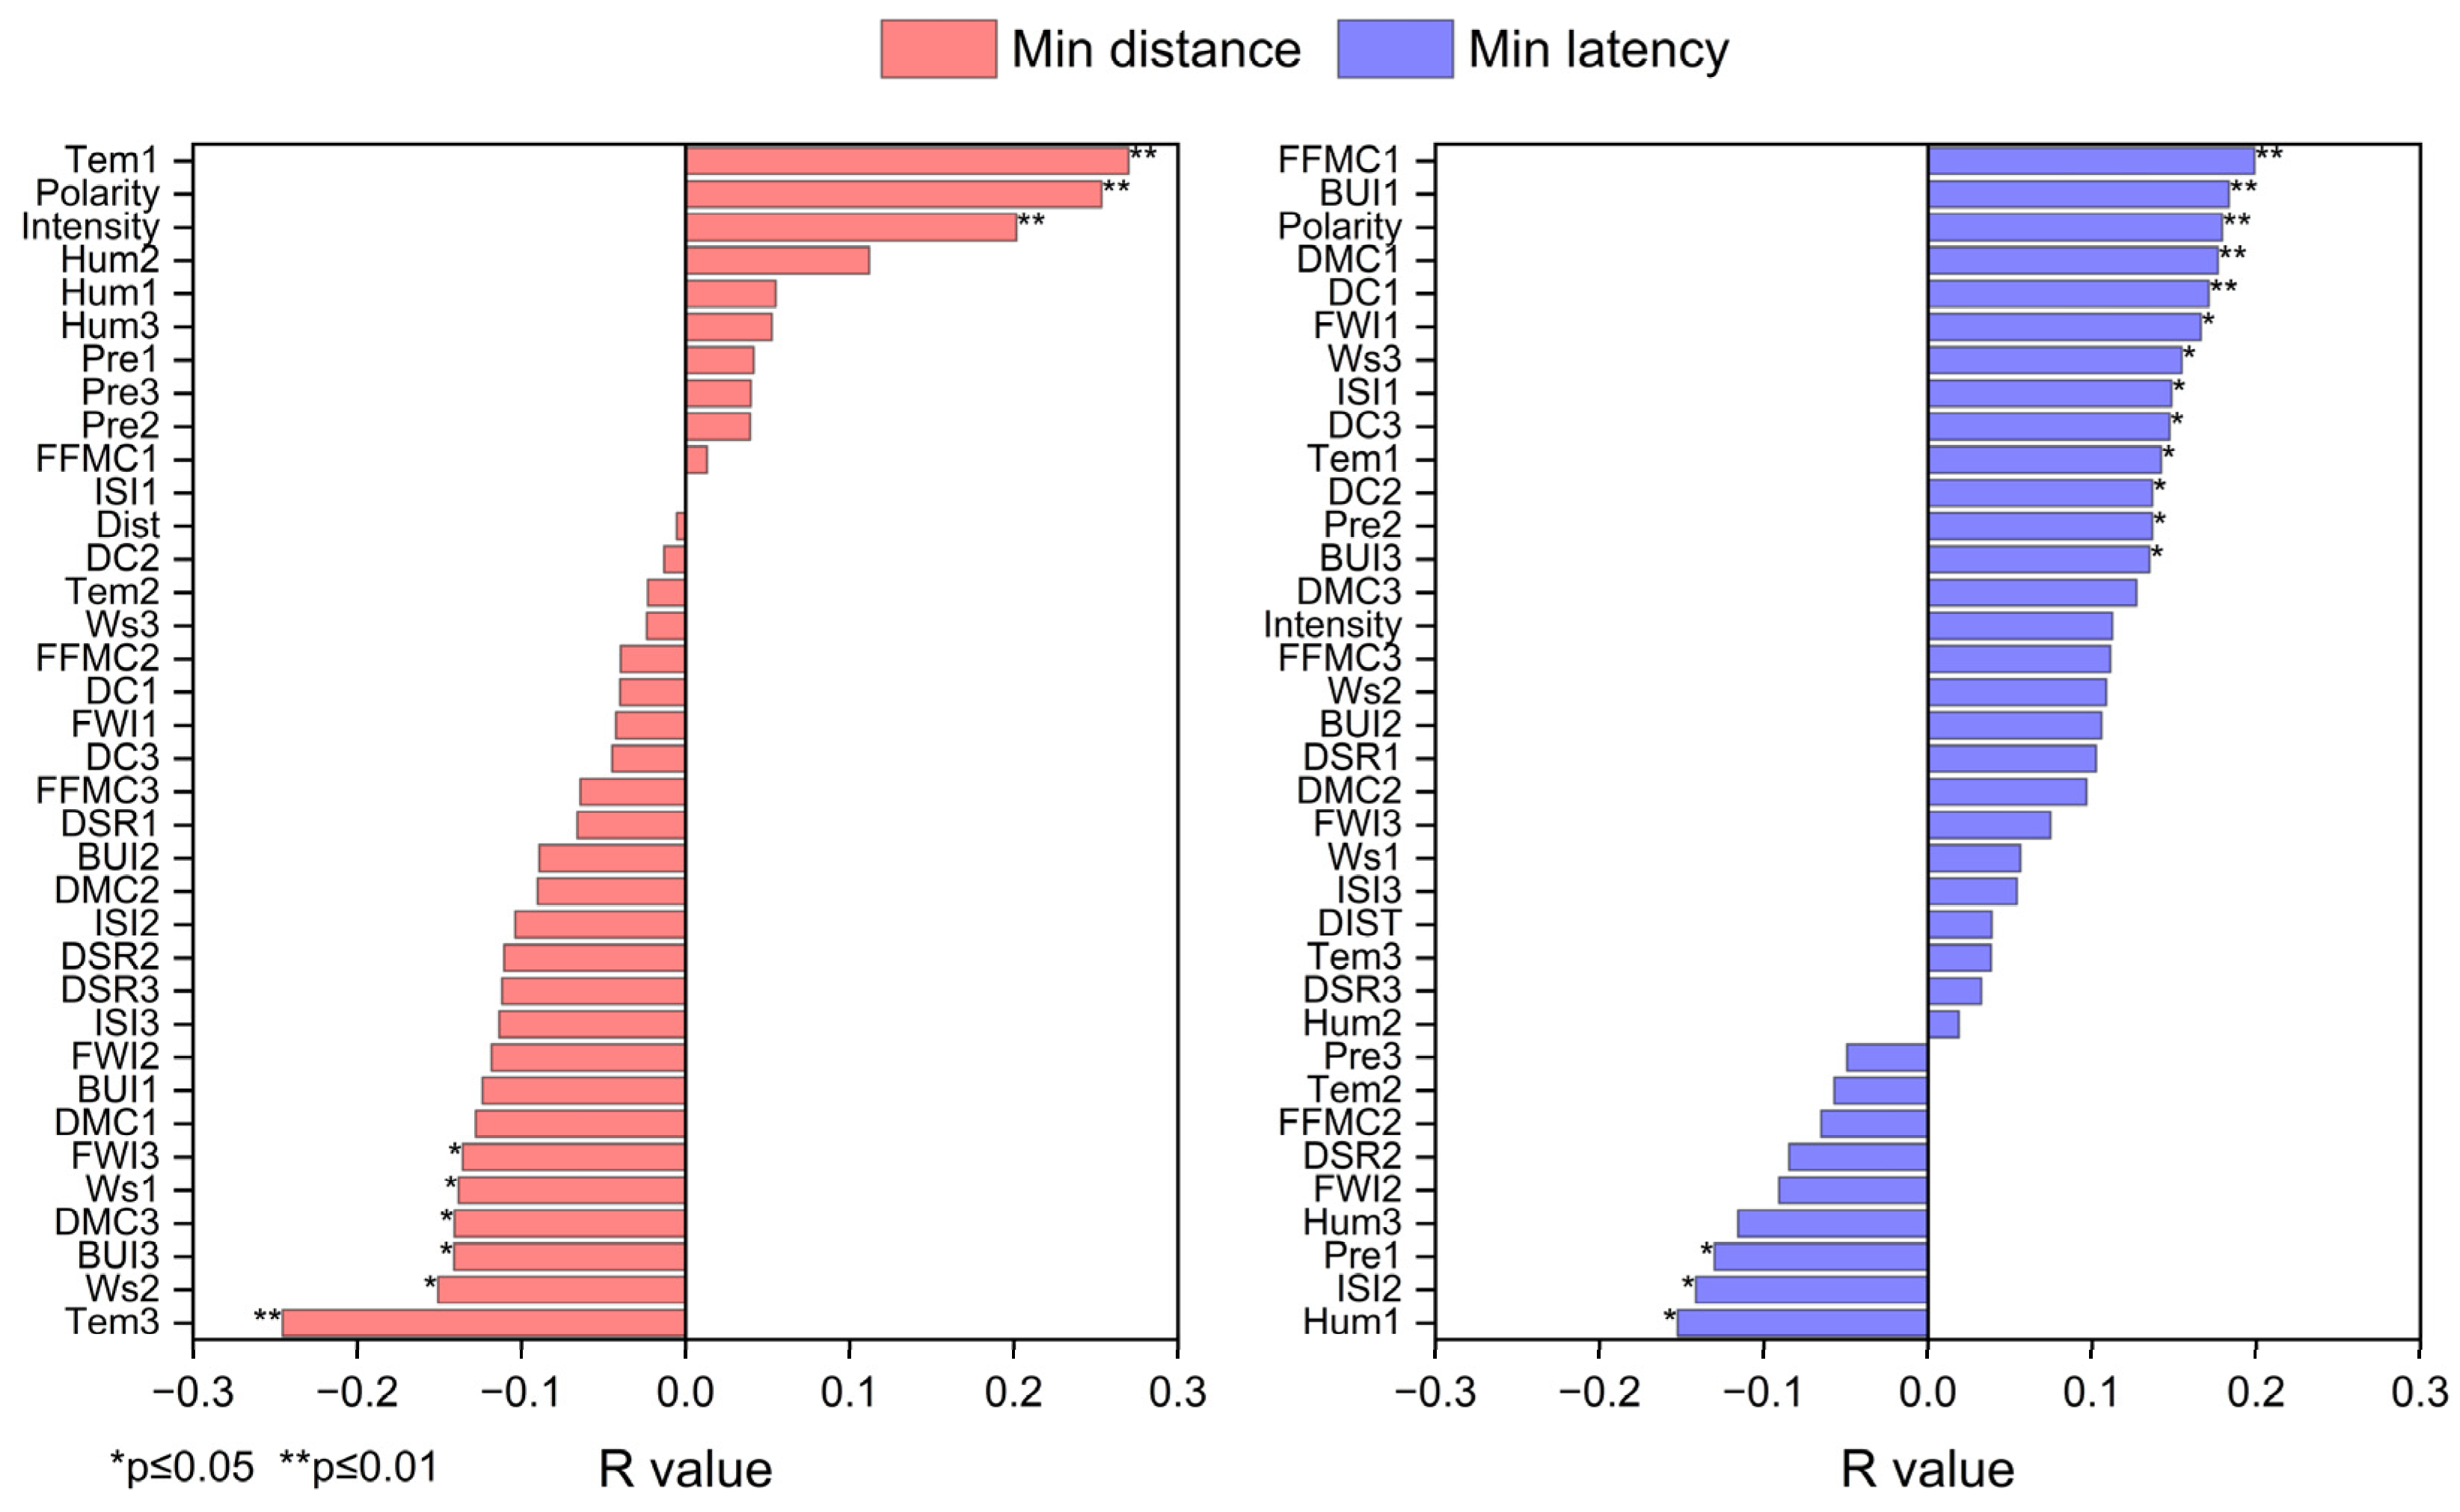
3.3. Correlation Analysis of Influencing Factors and Latency

Due to the differences in the selected lightning strikes, the Meteorological and FWI factors between the two methods exhibit variations, primarily reflected in Light day and Period daily average. In the Min distance method, the differences in Fire day, Light day, and Period daily average are more pronounced (Figure 6a), allowing for a clearer distinction of their impacts. In contrast, in the Min latency method, a greater number of lightning strikes with latency of less than 1 day are selected. For these samples, the Meteorological and FWI factors on Fire day, Light day, and Period daily fail to demonstrate differences, as they share identical values (Figure 6b).
The linear correlation between the 36 influencing factors and latency is generally weak (Figure 7). In the Min distance method, there are 3 significant positive correlations: Tem1, Polarity, and Intensity; and 6 significant negative correlations: Tem3, Ws2, BUI3, DMC3, Ws1, and FWI3. In the Min latency method, there are 13 significant positive correlations: FFMC1, BUI1, Polarity, DMC1, FWI1, Ws3, ISI1, DC3, Tem1, DC2, Pre2, and BUI3; and 3 significant negative correlations: Hum1, ISI2, and Pre1.

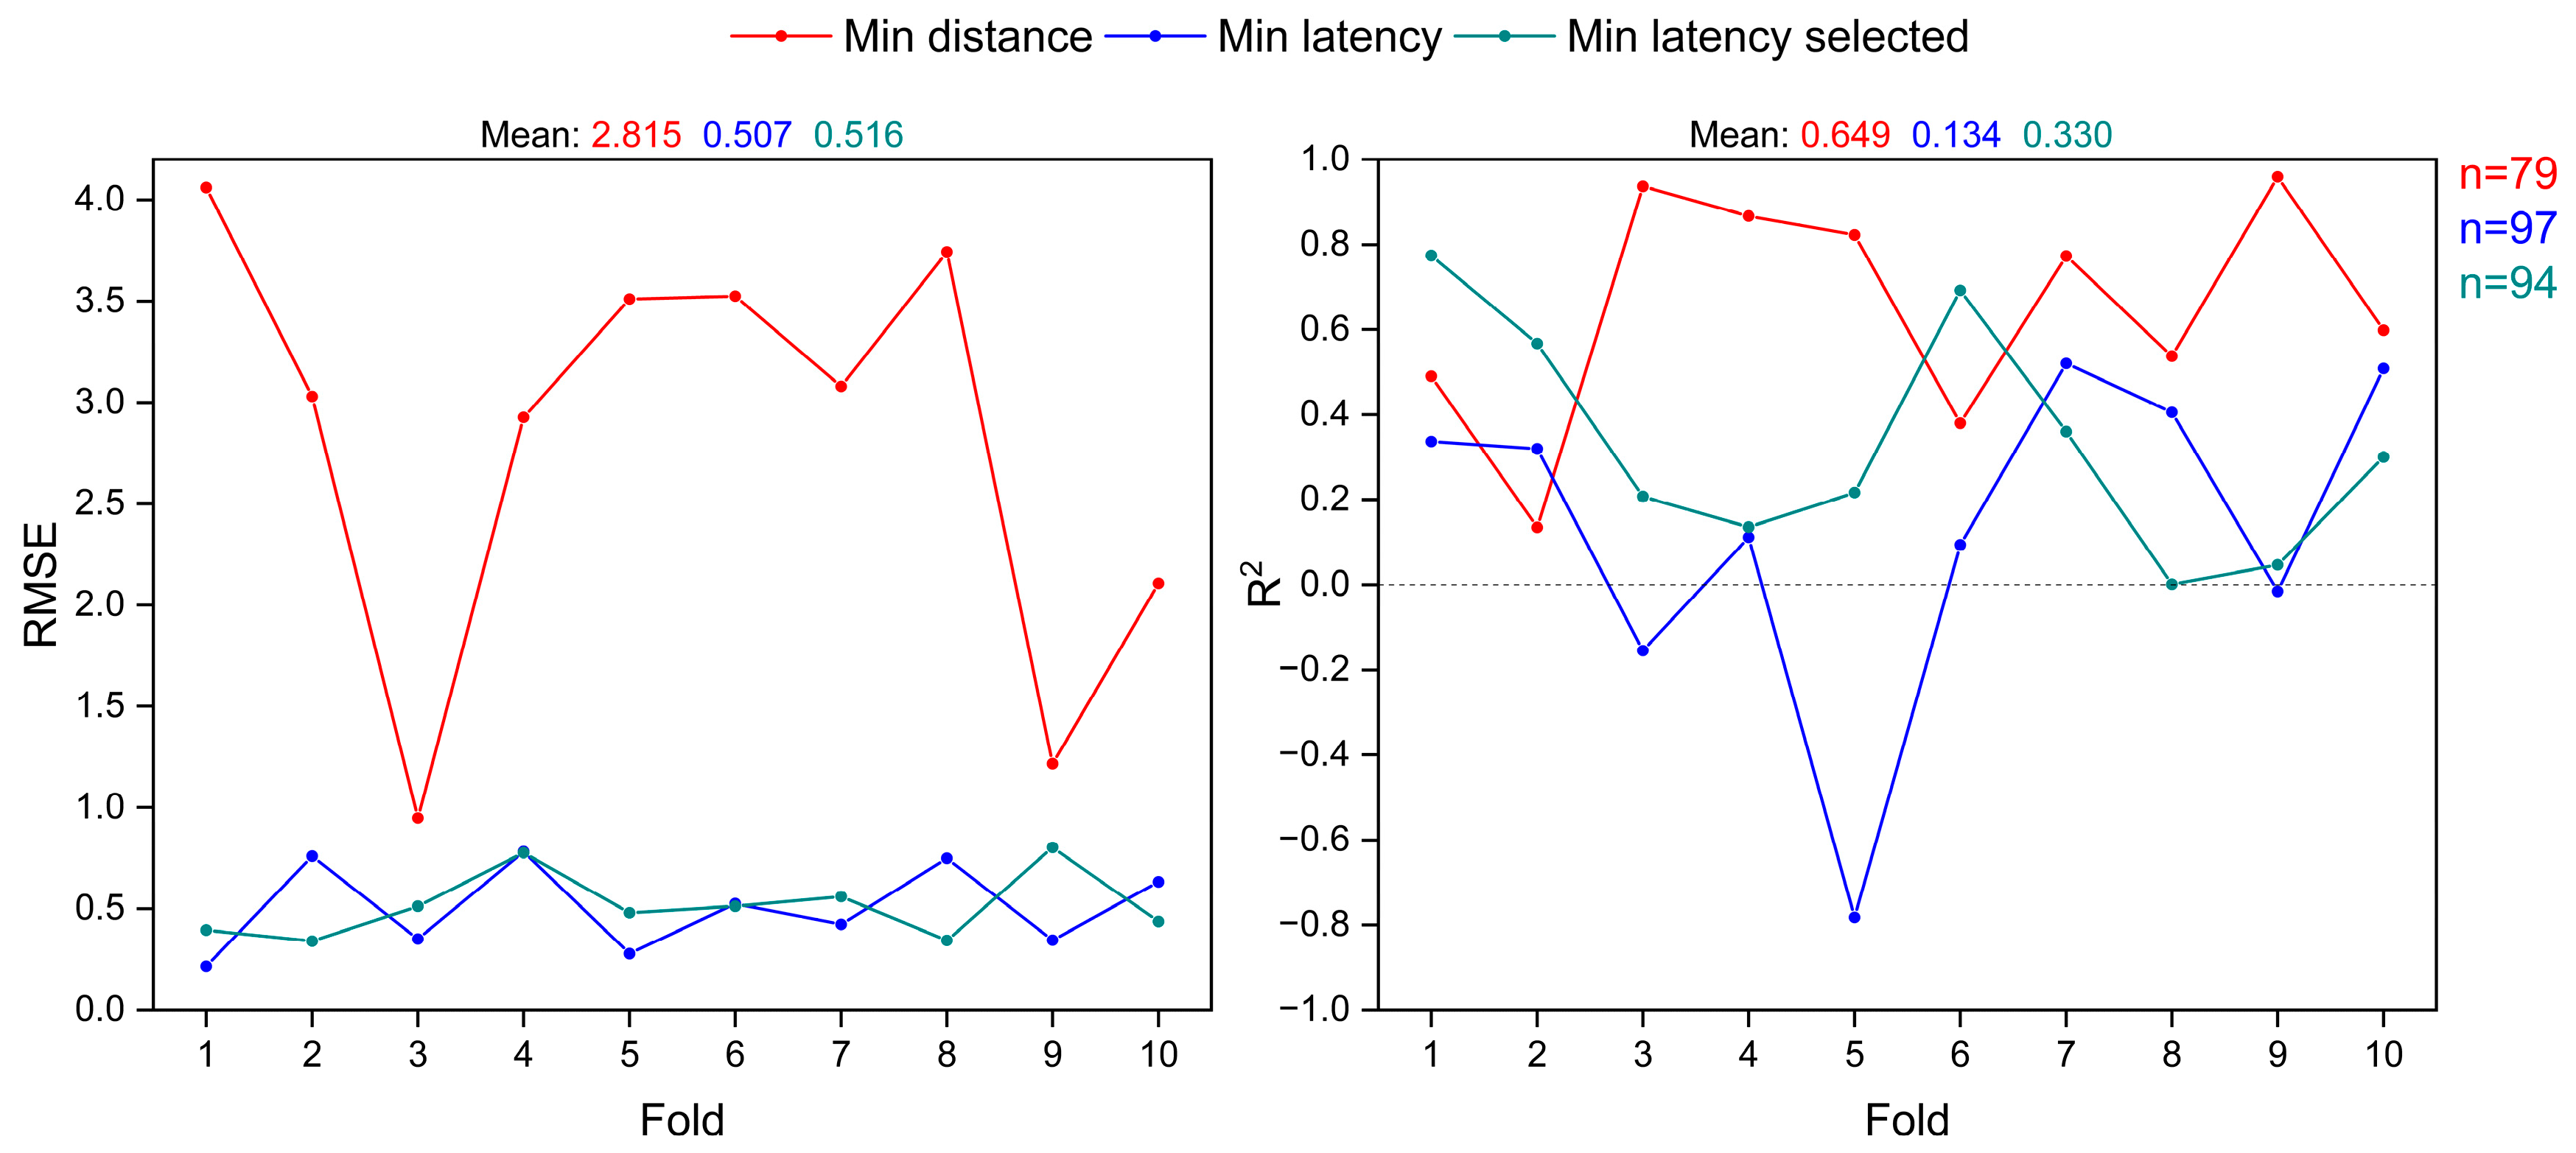
3.4. RFM Evaluation and Feature Interpretation

Through data cleaning, a subset of more reasonable data was selected for model training and validation. Combining RFE (Recursive Feature Elimination) and 10-fold cross-validation, the RFM (Random Forest Model) ultimately retained 5 optimal features (Figure 8). The RMSE and R2 scores for each fold of the cross-validation are shown in Figure 9. We found that in the Min latency method, removing 3 ignition lightning strikes with distances less than 3000 m significantly improved model performance, with the average R2 increasing from 0.123 to 0.330. Although the R2 values remain relatively low, we included Min latency selected as a comparative case.
In the Min distance method, the RFM model achieved a maximum R2 of 0.959, a minimum of 0.135, and an average of 0.65, demonstrating a significantly better explanation of the target feature latency compared to both Min latency and Min latency selected. The model with the second cross-validation (CV) fold exhibited the poorest predictive performance (R2 = 0.135). This may be attributed to errors caused by data limitations. Specifically, a portion of data used for training and validation might have poor quality, which could have hindered the model’s ability to accurately capture the underlying patterns and relationships. The concentration of samples that matched lightning-caused fires and non-ignition lightning could have introduced biases or inconsistencies into the training process, leading to errors in the model’s predictions. Due to the relatively low latency values of a considerable number of lightning strikes in Min latency and Min latency selected, the RMSE of the RFM model was also lower than that of Min distance. However, this does not necessarily indicate lower prediction errors.
In the Min distance method, the 5 optimal features, ranked by importance, are FFMC1, Pre3, FFMC3, BUI3, and FWI3 (Figure 8). Among these, FFMC1 has both positive and negative influence on the model results, with the positive influence being more pronounced overall. Pre3 exhibited a clear positive influence on the model results, meaning that higher values predicted longer latency (Figure 10a). Conversely, FFMC3 and BUI3 showed a significant negative influence, while FWI3 had both positive and negative effects. The positive contribution of the FFMC index on the Fire day to the latency of lightning-caused fires in most samples is somewhat counterintuitive. This is likely due to the fact that lightning-caused fires with longer latency tend to ignite on days with higher FFMC, indicating the limitations of using a single-time-point FWI to predict the latency of lightning-caused fires. In contrast, the indices representing the average fire weather characteristics during the latency of lightning-caused fires, namely Pr3, BUI3, and FFMC3, exhibit very clear patterns of influence on the latency. During the latency of lightning–caused fires, an increase in average precipitation (Pre) significantly prolongs the latency, while more dry fine fuels (FFMC) and deep fuels (BUI) significantly shorten the latency. In the Min latency method, only one optimal feature (FFMC3) overlapped with Min distance, but its influence was not clearly defined (Figure 10). Ws3 and DMC1 had a positive influence, while DMC2 and BUI2 had a negative influence (Figure 10). In the Min latency selected method, compared to Min latency, the third most important feature (Ws3) was replaced by BUI1, which had the lowest importance and exhibited a positive influence on the model results.
Due to the different methods used to measure feature importance, the ranking of feature importance in the Min latency method differs between RFM and SHAP. However, in the Min distance method, the feature importance rankings from both RFM and SHAP are consistent. This indicates that in the Min distance method, regardless of whether the importance is evaluated from the perspective of reducing impurity (RFM) or the average contribution to the predicted value (SHAP), the influence of these features on the target variable is consistent and significant. This strong predictive capability of the features further validates the effectiveness of the Min distance method. The ignition lightning selected through this method exhibits a more direct and significant relationship between the features and the target variable.

4. Discussion

This study investigates the characteristics of cloud-to-ground lightning and lightning-ignited fires in the Greater Khingan Mountains from 2019 to 2021. Two methodologies, namely the Min distance and Min latency approaches, were employed to identify the ignition lightning for each fire event and calculate the corresponding latency. The RFM, integrated with RFECV, was utilized to analyze the influence of meteorological and FWI factors on latency across three temporal categories: Fire Day, Light Day, and Period Daily Average. Furthermore, SHAP were applied to evaluate the contribution of optimal features to the model outcomes. The innovation of this research lies in the application of machine learning techniques to conduct an in-depth analysis of lightning-fire latency and its influencing factors, identifying the most impactful variables. This approach contributes to elucidating the underlying mechanisms of smoldering phenomena in lightning fires and enhances the early warning and prediction systems for such events.
The occurrence of lightning-ignited fires is intrinsically linked to lightning activity. Although thunderstorms are typically accompanied by precipitation, cloud-to-ground lightning strikes may occur with minimal or no rainfall, leading to the ignition of dry surface fuels in forests. This meteorological condition is referred to as a dry thunderstorm [19]. The presence of a latency, combined with the stochastic nature of lightning strike locations and the potential for multiple concurrent ignitions, renders lightning fires more hazardous than conventional wildfires [23]. Once surface fuels begin to burn, the subsequent fire behavior is determined by the prevailing fire environment, including factors such as air temperature, fuel size and spatial arrangement, and wind speed. If the conditions do not meet the threshold for sustained flaming combustion but are insufficient for complete extinguishment, the fire may enter a smoldering phase. This latent state can persist until favorable conditions, such as high temperatures, low humidity, or strong winds, reignite the flames, leading to rapid spread and loss of control. Meteorological factors primarily influence the latency by modulating fuel moisture content and combustion rates. High temperatures, low humidity, and strong winds tend to shorten the latency, whereas low temperatures and precipitation can extend it [33,34]. In this study, the FWI, calculated from meteorological data, outperformed raw meteorological variables in predicting lightning-fire latency, likely due to its comprehensive consideration of long-term drought, high temperatures, and moisture content across different fuel types, which have more direct impacts on latency.
Determining the ignition lightning for each lightning fire is a critical yet challenging task in latency research. It requires identifying lightning strike evidence at the fire site and matching it with corresponding cloud-to-ground lightning data from detection instruments. In this study, only seven lightning fires could be definitively matched with their ignition lightning, while the majority could not be confirmed with certainty. Therefore, additional methods were necessary to enhance the accuracy of ignition lightning selection. The Min distance method proved to be more reliable for this purpose, consistent with the findings of previous [25]. In this method, the FWI during the Period Daily Average was more influential than on Fire Day or Light Day, as the latency is a temporal process rather than a discrete event, with meteorological conditions throughout the period determining its duration. Additionally, the Fine Fuel Moisture Code (FFMC) on Fire Day was the most significant factor, as the dryness of fine fuels largely influences whether a lightning fire transitions from smoldering to flaming, thereby ending the latency. This indicates that the model results from the Min distance method have strong physical interpretability. In addition, The RFM show different influencing factors in the two methods, possibly because the Minimum Latency Method overlooks lightning strikes with longer latency periods, leading to a higher likelihood of misclassifying non-causal lightning events as ignition lightning.
The lack of high-resolution meteorological data limited this study to weather station records, potentially misrepresenting conditions at ignition points. Moreover, the daily resolution of meteorological data could not capture the intra-day variations during the latency. For instance, meteorological factors exhibit significant diurnal variations, which is crucial for exploring their impact on the latency of ignition lightning and lightning-caused fire on the same day. However, the temporal resolution of the meteorological data in this study is limited to a daily scale. As a result, for those samples with a latency of less than one day, the values of meteorological factors and the FWI are completely identical across three different time periods, namely the Fire day, the Light day, and the Period daily average. This has a detrimental impact on the model prediction effect of the minimum incubation method. Given that the latency of the vast majority of samples in this method is less than one day, this may be the direct reason for the poor performance of its model evaluation indicators.
The latitude and longitude coordinates and occurrence times of lightning fires were recorded by forestry personnel, introducing potential human errors in matching fires with ignition lightning and calculating latency. For instance, if a lightning strike is recorded later than it actually occurred, it may result in a lightning strike after lightning-caused fire being incorrectly selected as the ignition lightning in the Min latency method. Alternatively, an excessively long calculated latency of a lightning-caused fire can adversely impact the model’s predictive accuracy. Moreover, errors in the recording of latitude and longitude coordinates of lightning-caused fires may lead to the actual ignition lightning being overlooked in the Min distance method. Even after data cleaning, some fires were still matched with false ignition lightning. Owing to limitations in data quality, resulting in low correlation coefficients (<0.3) between latency and influencing factors, and suboptimal performance of the RFM.
Furthermore, while this study focused on meteorological factors as the primary influencers of lightning-fire latency, it overlooked the roles of fuel types and topography. Smoldering is more likely to occur in coarse fuels and humus, with varying combustion rates across different fuel types. The rate of smoldering is influenced by the size of the fuel. For instance, coarse fuel, characterized by low porosity and a small specific surface area, has a slower smoldering propagation rate and a longer fire latency compared to smaller fuel. This is due to the limitation of the oxygen diffusion rate within the fuel [35].
Topographic elements, including elevation, slope, and aspect, have a combined impact on fuel moisture, temperature, and wind patterns, thus influencing the latency of lightning-caused fires. High-elevation areas usually feature lower temperatures, higher wind speeds, and are predominantly covered by flammable coniferous forests. On steep slopes, gravity-induced faster moisture loss results in drier fuels. South-facing slopes, receiving more solar radiation, experience higher temperatures and drier conditions, while windward slopes are subjected to stronger winds that speed up fuel drying. In general, steep, south-facing slopes at high elevations tend to significantly shorten the latency, whereas gentle, north-facing slopes at low elevations are likely to lengthen it [36,37,38].
Despite significant progress in the quantitative analysis of lightning-fire latency, this study has several limitations. First, the spatial and temporal resolution of meteorological data was insufficient, affecting model prediction accuracy. Second, the influence of topography and fuel on latency was not fully considered. Future research could improve in the following areas: (1) Data Enhancement: Acquire higher-resolution meteorological data to more accurately reflect environmental conditions at fire locations. (2) Multi-Factor Integration: Incorporate topography (e.g., slope, elevation, aspect) and fuel characteristics (e.g., fuel type, load) into the analytical framework to develop a more comprehensive research model.

5. Conclusions

The spatiotemporal distribution patterns of lightning-caused fires reveal their complex interactions with lightning activity, meteorological conditions, and vegetation characteristics. While lightning activity serves as a critical driver for the ignition of such fires, its spatial distribution does not fully align with fire occurrences, underscoring the pivotal role of localized environmental factors in the formation of lightning-caused fires. These findings provide a significant theoretical foundation for further elucidating the ignition mechanisms of lightning-caused fires and optimizing early warning systems.
This study proposes a strategy for selecting ignition lightning based on the Min distance and Min latency methods, with comparative analysis validating the superiority of the Min distance method in identifying ignition lightning. Particularly in the absence of high-precision ignition lightning data, this method enhances the accuracy and reliability of the research. Furthermore, SHAP analysis revealed the nonlinear contributions of various influencing factors to latency, providing a paradigm for the application of machine learning models in lightning-fire research. This study is the first to systematically elucidate the mechanisms influencing lightning-fire latency in boreal coniferous forests, filling a gap in the quantitative research on smoldering processes in lightning fires. It found that lightning-fire latency is significantly correlated with lightning characteristics (intensity, polarity) and is primarily influenced by meteorological conditions (wind speed, precipitation) and fuel moisture (FFMC, DMC, BUI). These findings deepen the understanding of smoldering mechanisms in lightning fires and provide a theoretical foundation for early warning and prevention strategies. Regrettably, the absence of high-resolution meteorological data, coupled with the omission of terrain and fuel types as influencing factors, has impeded the ability to provide a more precise and in-depth elucidation of the mechanism underlying the latency of lightning-caused fires. This constitutes a limitation of the present study.

Author Contributions

Conceptualization, M.W.; methodology, M.W., L.S. (Liqing Si); software, W.L. (Wei Li); validation, W.L. (Wei Li), W.L. (Weike Li); formal analysis, W.L. (Wei Li); investigation, W.L. (Weike Li), F.Z.; resources, J.S., S.Y., Y.W., F.Z.; data curation, W.L. (Wei Li); writing—original draft preparation, W.L. (Wei Li); writing—review and editing, W.L. (Wei Li); visualization, W.L. (Wei Li); supervision, M.W.; project administration, L.S. (Lifu Shu); funding acquisition, L.S. (Lifu Shu). All authors have read and agreed to the published version of the manuscript.

Funding

This research was funded by National Key R&D Program of China, grant number [2023YFD2202005] and [2023YFD2202001]. And The APC was funded by [2023YFD2202005].

Institutional Review Board Statement

Not applicable.

Informed Consent Statement

Not applicable.

Data Availability Statement

The data presented in this study are available on request from the corresponding author due to confidentiality requirements for research project.

Acknowledgments

The authors would like to express their sincere gratitude to all those who have contributed to the completion of this paper. We are particularly grateful to the Ecology and Nature Conservation Institute, Chinese Academy of Forestry, and the Institute of Electrical Engineering, Chinese Academy of Sciences for their technical and institutional support.

Conflicts of Interest

The authors declare no conflict of interest.

References

  1. Price, C.; Rind, D. Probable implications of global climate change on global lightning distributions and frequencies. J. Geophys. Res. Atmos. 1994, 99, 10823–10831. [Google Scholar]
  2. Reeve, N.; Toumi, R. Lightning activity as an indicator of climate change. Q. J. R. Meteorol. Soc. 1999, 125, 893–903. [Google Scholar] [CrossRef]
  3. Wotton, B.M.; Martell, D.L.; Logan, K.A. Climate change and people-caused forest fire occurrence in Ontario. Clim. Change 2003, 60, 275–295. [Google Scholar] [CrossRef]
  4. Krause, A.; Kloster, S.; Wilkenskjeld, S. The sensitivity of global wildfires to simulated past, present, and future lightning frequency. J. Geophys. Res. Biogeosci. 2014, 119, 312–322. [Google Scholar] [CrossRef]
  5. Fill, J.M.; Davis, C.N.; Crandall, R.M. Climate change lengthens southeastern USA lightning-ignited fire seasons. Glob. Chang. Biol. 2019, 25, 3562–3569. [Google Scholar] [CrossRef]
  6. Coogan, S.C.P.; Cai, X.; Jain, P.; Flannigan, M.D. Seasonality and trends in human- and lightning-caused wildfires ≥ 2 ha in Canada, 1959–2018. Int. J. Wildland Fire 2020, 29, 473–485. [Google Scholar] [CrossRef]
  7. Wang, Y.; Anderson, K.R. An evaluation of spatial and temporal patterns of lightning- and human-caused forest fires in Alberta, Canada, 1980–2007. Int. J. Wildland Fire 2010, 19, 1059–1072. [Google Scholar] [CrossRef]
  8. Shu, L.F.; Wang, M.Y.; Tian, X.R.; Li, Z.Q.; Xiao, Y.J. Fire environment mechanism of ground fire formation in Daxing’an Mountains. J. Nat. Disast. 2003, 12, 62–67. [Google Scholar]
  9. Tian, X.; Zhao, F.; Shu, L.; Wang, M. Distribution characteristics and the influence factors of forest fires in China. For. Ecol. Manag. 2013, 310, 460–467. [Google Scholar] [CrossRef]
  10. Flannigan, M.; Stocks, B.; Turetsky, M.; Wotton, M. Impacts of climate change on fire activity and fire management in the circumboreal forest. Glob. Change Biol. 2009, 15, 549–560. [Google Scholar] [CrossRef]
  11. Zhao, F.; Shu, L.; Di, X.; Tian, X.; Wang, M. Changes in the occurring date of forest fires in the Inner Mongolia Daxing’anling forest region under global warming. Sci. Silvae Sin. 2009, 45, 166–172. [Google Scholar]
  12. Tian, X.; Dai, X.; Wang, M.; Zhao, F.; Shu, L. Forest fire risk assessment for China under different climate scenarios. Chin. J. Appl. Ecol. 2016, 27, 769–776. [Google Scholar]
  13. Gao, C.; An, R.; Wang, W.; Shi, C.; Wang, M.; Liu, K.; Wu, X.; Wu, G.; Shu, L. Asymmetrical lightning fire season expansion in the boreal forest of Northeast China. Forests 2021, 12, 1023. [Google Scholar] [CrossRef]
  14. Zhang, H.; Guo, P.; Chen, H.; Liu, N.; Qiao, Y.; Xu, M.; Zhang, L. Lightning-induced smoldering ignition of peat: Simulation experiments by a lightning arc with long continuing current. Proc. Combust. Inst. 2023, 39, 4185–4193. [Google Scholar] [CrossRef]
  15. Liu, Z.; Yang, J.; Chang, Y.; Weisberg, P.J.; He, H.S. Spatial patterns and drivers of fire occurrence and its future trend under climate change in a boreal forest of Northeast China. Glob. Change Biol. 2012, 18, 2041–2056. [Google Scholar] [CrossRef]
  16. Ying, L.; Han, J.; Du, Y.; Shen, Z. Forest fire characteristics in China: Spatial patterns and determinants with thresholds. Forest Ecol. Manag. 2018, 424, 345–354. [Google Scholar] [CrossRef]
  17. Nash, C.H.; Johnson, E.A. Synoptic climatology of lightning-caused forest fires in subalpine and boreal forests. Can. J. For. Res. 1996, 26, 1859–1874. [Google Scholar] [CrossRef]
  18. Anderson, K. A model to predict lightning-caused fire occurrences. Int. J. Wildland Fire 2002, 11, 163–172. [Google Scholar] [CrossRef]
  19. Pineda, N.; Rigo, T. The rainfall factor in lightning-ignited wildfires in Catalonia. Agric. For. Meteorol. 2017, 239, 249–263. [Google Scholar] [CrossRef]
  20. Schultz, C.J.; Nauslar, N.J.; Wachter, J.B.; Hain, C.R.; Bell, J.R. Spatial, temporal, and lightning characteristics of lightning in reported lightning-initiated wildfire events. Fire 2019, 2, 18. [Google Scholar] [CrossRef]
  21. Wotton, B.M.; Martell, D.L. A lightning fire occurrence model for Ontario. Can. J. For. Res. 2005, 35, 1389–1401. [Google Scholar] [CrossRef]
  22. Duncan, B.W.; Adrian, F.W.; Stolen, E.D. Isolating the lightning ignition regime from a contemporary background fire regime in east-central Florida, USA. Can. J. For. Res. 2010, 40, 286–297. [Google Scholar] [CrossRef]
  23. Dowdy, A.J.; Mills, G.A. Characteristics of lightning-attributed wildland fires in south-east Australia. Int. J. Wildland Fire 2012, 21, 521–524. [Google Scholar] [CrossRef]
  24. Tian, X.-R.; Shu, L.-F.; Zhao, F.-J.; Wang, M.-Y.; McRae, D.J. Future impacts of climate change on forest fire danger in northeastern China. J. For. Res. 2011, 22, 437. [Google Scholar] [CrossRef]
  25. Moris, J.V.; Conedera, M.; Nisi, L.; Bernardi, M.; Cesti, G.; Pezzatti, G.B. Lightning-caused fires in the Alps: Identifying the igniting strokes. Agric. For. Meteorol. 2020, 290, 107990. [Google Scholar] [CrossRef]
  26. Taylor, S.W.; Alexander, M.E. Science, technology, and human factors in fire danger rating: The Canadian experience. Int. J. Wildland Fire 2006, 15, 121–133. [Google Scholar] [CrossRef]
  27. Turner, J.A.; Lawson, B.D. Weather in the Canadian Forest Fire Danger Rating System: A User Guide to National Standards and Practices; Information Report BC-X-177; Fisheries and Environment Canada, Canadian Forest Service, Pacific Forest Research Centre: Victoria, BC, Canada, 1978. [Google Scholar]
  28. Tian, X.R.; McRae, D.J.; Jin, J.Z. Changes of forest fire danger and the evaluation of the FWI System application in the Daxing’anling region. Sci. Silvae Sin. 2010, 46, 127–132. [Google Scholar]
  29. Breiman, L. Random forests. Mach. Learn. 2001, 45, 5–32. [Google Scholar] [CrossRef]
  30. Misra, P.; Yadav, A.S. Improving the classification accuracy using recursive feature elimination with cross-validation. Int. J. Emerg. Technol. 2020, 11, 659–665. [Google Scholar]
  31. Mangalathu, S.; Hwang, S.H.; Jeon, J.S. Failure mode and effects analysis of RC members based on machine-learning-based SHapley Additive exPlanations (SHAP) approach. Eng. Struct. 2020, 219, 110927. [Google Scholar] [CrossRef]
  32. Taylor, A.R. Tree-Bole Ignition in Superimposed Lightning Scars; American Academic Press: New York, NY, USA, 1969. [Google Scholar]
  33. Flannigan, M.D.; Wotton, B.M. Lightning-ignited forest fires in northwestern Ontario. Can. J. For. Res. 1991, 21, 277–283. [Google Scholar] [CrossRef]
  34. Nieto, H.; Aguado, I.; García, M. Lightning-caused fires in Central Spain: Development of a probability model of occurrence for two Spanish regions. Agric. For. Meteorol. 2012, 162-163, 35–43. [Google Scholar] [CrossRef]
  35. Huang, X.; Rein, G. Upward-and-downward spread of smoldering peat fire. Proc. Combust. Inst. 2019, 37, 4025–4033. [Google Scholar] [CrossRef]
  36. Abatzoglou, J.T.; Williams, A.P.; Barbero, R. Global emergence of anthropogenic climate change in fire weather indices. Geophys. Res. Lett. 2019, 46, 326–336. [Google Scholar] [CrossRef]
  37. Williams, A.P.; Abatzoglou, J.T.; Gershunov, A.; Guzman-Morales, J.; Bishop, D.A.; Balch, J.K.; Lettenmaier, D.P. Observed impacts of anthropogenic climate change on wildfire in California. Earth’s Future 2019, 7, 892–910. [Google Scholar] [CrossRef]
  38. Duane, A.; Castellnou, M.; Brotons, L. Towards a comprehensive look at global drivers of novel extreme wildfire events. Clim. Chang. 2021, 165, 43. [Google Scholar] [CrossRef]
Figure 1. Temporal distribution of lightning and lightning-caused fire in 2019–2021. (a) Lightning-caused fire, (b) Negative lightning and Positive lightning.
Fire 08 00084 g001
Figure 2. Spatial distribution of lightning and lightning-caused fire in 2019–2021. (a) Lightning-caused fire, (b) Negative lightning and Positive lightning.
Fire 08 00084 g002
Figure 3. Lightning intensity characteristics in 2019–2021.
Fire 08 00084 g003
Figure 4. Intensity characteristics of ignition lightning.
Fire 08 00084 g004
Figure 5. The temporal and spatial distance between ignition lightning and lightning-caused fire.
Fire 08 00084 g005
Figure 6. Meteorological and FWI factors in (a) Min distance and (b) Min latency(Normalization).
Fire 08 00084 g006
Figure 7. Correlation coefficient between latency and influencing factors (1 Fire day; 2 Light day; 3 Period daily average).
Fire 08 00084 g007
Figure 8. RMSE and R square of RFM after RFECV.
Fire 08 00084 g008
Figure 9. Importance of optimal features selected by RFECV in RFM.
Fire 08 00084 g009
Figure 10. SHAP values for optimal features selected by RFECV in RFM (a) Min distance. (b) Min latency. (c) Min latency selected.
Fire 08 00084 g010
Disclaimer/Publisher’s Note: The statements, opinions and data contained in all publications are solely those of the individual author(s) and contributor(s) and not of MDPI and/or the editor(s). MDPI and/or the editor(s) disclaim responsibility for any injury to people or property resulting from any ideas, methods, instructions or products referred to in the content.

