Abstract
Current coal mine fire risk assessments often rely on static models and isolated factors, failing to capture the complex, dynamic interactions that lead to fires. To address this gap, we propose a comprehensive framework—termed INK-FBSD—integrating Interpretive Structural Modeling (ISM), the NK model, fuzzy Bayesian network analysis, and System Dynamics (SD) simulation. Using ISM, we identified and hierarchically structured 31 risk factors across human, equipment, environment, management, and fire protection domains, revealing that a robust mine safety accountability system is a pivotal root factor. The NK model quantifies how accident likelihood escalates as more factors interact—for example, four-factor couplings (e.g., equipment–environment–management–fire protection) yield significantly higher risk indices (T ≈ 0.34) than two-factor scenarios. The fuzzy Bayesian analysis estimates an overall 46% probability of a fire accident under current conditions, and diagnostic inference pinpoints excessive coal dust accumulation and neglected fire prevention as top contributors when an incident occurs (posterior probabilities 83% and 78%, respectively). Finally, SD simulations show how key risk factors (such as equipment failure and maintenance delays) can rapidly elevate to severe risk levels within 9–15 months without intervention, underscoring the need for continuous monitoring and proactive control. In summary, the INK-FBSD approach provides a multidimensional understanding of coal mine fire mechanisms and delivers practical guidance for safety management by prioritizing critical risk factors, anticipating high-risk coupling pathways, and informing more effective fire prevention and emergency response strategies.
1. Introduction
The multiple risk factors of coal mine fires and the serious consequences of such accidents have long been a critical concern for both the coal industry and society at large [1]. With the increasing depth of mining and the growing complexity of geological and operational conditions, the risks and losses associated with mine fires have risen steadily. Statistics show that fatalities caused by external fire accidents account for nearly 65% of all coal mine disaster deaths. In recent years, several severe fire accidents have occurred in China [2]. For example, the Caojiawa Gold Mine fire in Yantai resulted in six deaths and direct economic losses of 13.76 million CNY, while the 2021 fire at Chongqing Nengtouyu New Energy Co., Ltd. caused 16 deaths, 42 injuries, and 250 million CNY in losses. These incidents underscore the urgent need to clarify the genesis and causal mechanisms of coal mine fires—ranging from electrical faults, frictional heating, and gas or dust ignition to coal spontaneous combustion and poor ventilation—and to strengthen fire-risk assessment and early warning for safer mine operations [3]. It is thus of great significance to systematically identify and classify fire-related risk factors, and to build an integrated indicator system to support prevention, control, and safety management [4].
Existing studies on coal mine fires can be broadly categorized into three domains. The first focuses on identifying and predicting ignition causes, such as electrical short circuits, belt friction, and spontaneous heating of coal. For example, Dey et al. developed a hybrid CNN-LSTM and IoT-based coal mine hazards monitoring and prediction system to assess the likelihood of ignition-inducing factors [5]. The second line of research examines fire accident characteristics and causation patterns. Jafari et al. conducted reliability evaluations of fire alarm systems using dynamic Bayesian networks and fuzzy fault tree analysis [6], while Yazdi and Kabir proposed a fuzzy Bayesian network approach for risk analysis in process industries [7]. The third research area emphasizes fire monitoring and early-warning technologies. D’Angelo et al. introduced fault detection in dynamic systems using a fuzzy/Bayesian network formulation [8], and Kumari et al. applied UMAP- and LSTM-based fire status and explosibility prediction for sealed-off areas in underground coal mines [9]. While these contributions offer valuable tools for fire prevention, most rely on static or isolated models and seldom address the interactive coupling and evolution of risk factors. The mechanisms governing fire-risk escalation—especially under uncertain or dynamic conditions—remain underexplored, leaving a gap in integrated risk assessment and proactive mitigation strategies [5,10].
The research of the above scholars does provide useful insights into the prevention, monitoring and response of coal mine fires, but there are also some shortcomings. The current research on coal mine fires mainly focuses on the analysis of known factors and inherent patterns, and less on novel theoretical constructions or exploratory practical methods. The research under this static model tends to focus on existing data and statistical analysis, and often lacks an in-depth understanding of the mechanism of fire occurrence. This research trend may lead to limitations in coal mine fire prevention and response strategies, because of the lack of comprehensive understanding of potential risks and the development of effective means of response. Therefore, it is necessary to change the paradigm of coal mine fire research and adopt more dynamic and multidimensional research methods to deepen the understanding of the mechanism of fire occurrence and improve the effect of prevention and response.
Secondly, the current coal mine fire research mainly uses isolated models for analysis. This trend makes the research process more inclined to simplification and standardization, which limits the comprehensive understanding of the complexity of coal mine fires. Current research methods often rely too much on a few models, which are usually based on previous research conclusions or inherent theoretical assumptions. The application of a single model leads to the neglect of potential factors and complex correlations, which limits the depth and breadth of coal mine fire research. In order to better understand the occurrence mechanism of coal mine fires, it is necessary to adopt more diversified and comprehensive research methods to cover a wider range of variables and factors to improve the complexity and adaptability of the model, so as to more accurately reflect a real fire situation.
Although previous studies have contributed valuable insights into coal mine fire prevention, they tend to remain static, fragmented, or overly dependent on single-source modeling. Few approaches integrate structural diagnosis, probabilistic reasoning, and dynamic simulation into a unified framework. In addition, the mechanisms underlying fire risk evolution and risk coupling chains remain insufficiently explored. This study addresses these gaps by proposing an integrated modeling framework—INK-FBSD—which systematically identifies risk sources, quantifies inter-factor coupling, handles uncertainty, and simulates dynamic fire risk trajectories. This enables both in-depth causal understanding and practical early-warning support.
However, despite these valuable efforts, there remains a lack of an integrative and dynamic analytical paradigm that can simultaneously describe the structural hierarchy, probabilistic uncertainty, and temporal evolution of coal-mine fire risks. As underground mining systems become increasingly automated and data-intensive, the traditional static risk-assessment frameworks cannot capture the nonlinear interactions and feedback mechanisms that govern fire evolution. A comprehensive approach that bridges qualitative reasoning and quantitative simulation is therefore essential to transform fragmented insights into a unified, decision-oriented model. Such a framework can not only identify latent coupling chains among multiple risk domains but also support predictive and adaptive fire-safety management under changing operational conditions.
Therefore, this study aims to construct a layered coal mine fire risk indicator system and integrate four modeling techniques to address the limitations of existing research. This study considers both extrinsic ignition sources—such as electrical faults, mechanical friction, and gas or dust ignition—and intrinsic causes including coal spontaneous combustion and oxidation, thereby ensuring a comprehensive representation of all major fire-causing mechanisms in underground mines. Specifically, ISM is used to identify hierarchical relationships among risk factors [11]; the NK model is applied to reveal how inter-factor coupling leads to severe fire outcomes [12]; the fuzzy Bayesian network combines uncertainty quantification with fuzzy logic to assess ambiguous influencing factors [13]; and system dynamics enables simulation of risk evolution over time under different scenarios [14]. Together, these methods form a hybrid framework—INK-FBSD—which enables multidimensional risk identification, causal analysis, and dynamic prevention strategy design.
2. Materials and Methods
In this study, we have devised a comprehensive framework, termed the INK-FBSD Model, to delve into the intricate causes of coal mine fires, as delineated in Figure 1. This innovative model seamlessly integrates four distinct yet complementary methodologies: Interpretive Structural Modeling (ISM), represented by the ‘I’ in INK, for unraveling the hierarchical and interdependent relationships among the various factors; Network Science principles, particularly the NK model, embodied by the ‘NK’ in INK, to capture the modularity and evolvability of the complex system; Fuzzy Bayesian Methods, abbreviated as ‘FB’, for incorporating uncertainty and probabilistic reasoning into our analysis; and System Dynamics (SD), which provides a dynamic perspective on how the system evolves over time. The INK-FBSD Model thus represents a novel synthesis of these techniques, enabling us to gain a deeper understanding of the multifaceted and interconnected causes of coal mine fires.
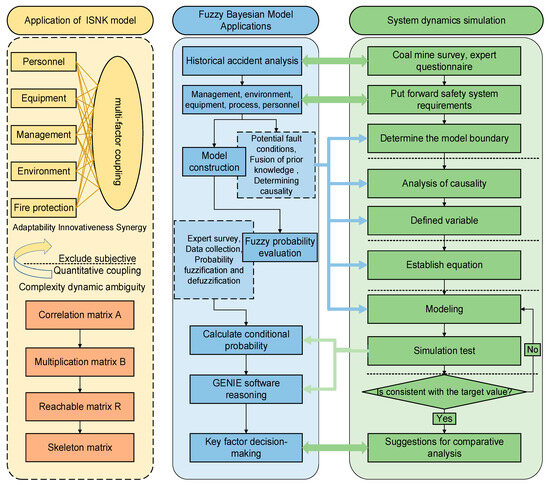
Figure 1.
Multi-aspect risk analysis based on ISM–NK–SD and fuzzy Bayesian model.
ISM (Interpretative Structural Modeling) is the abbreviation of Interpretative Structural Modeling. It was developed in 1973 by Professor J. Warefel in the United States to analyze issues related to complex socio-economic systems [15]. Its characteristic is that the complex system is decomposed into a number of subsystem elements. With the help of people ‘s practical experience and knowledge and computer, a multi-level hierarchical structure model is finally formed, so that the status and relationship between the elements within the system are clear at a glance. Numerous practical applications have shown that the ISM method is not only suitable for analyzing social and economic problems but also useful for understanding various problems with complex interrelationships, indicating that it has a wide range of applications [16].
The ISM model uses a directed graph to represent the relationships between factors, from which an adjacency matrix is obtained. After a series of operations, a reachability matrix is derived and then decomposed to reveal the hierarchical classification of each element. The mechanism is shown in Figure 2.
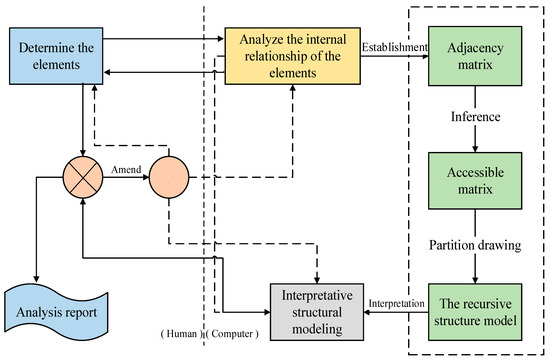
Figure 2.
Workflow of the ISM method for deriving the hierarchical structure of coal mine fire risk factors.
The NK model is a complex system research model that is widely used in the fields of evolutionary biology and organization theory. Proposed by Stuart Coughlan, this model aims to explain the complexity of biological evolution and genetic systems. The system consists of N elements, and each element has K interacting neighbors. The state of the element depends on the state of itself and its neighbors. The key features of the NK model are the parameters N and K, which represent the number of elements in the system and the number of neighbors of each element, respectively. These parameters determine the complexity of the system and the possibility of evolution [11]. It is often used to study the dynamic behaviors in complex systems, such as natural selection, decision-making process and network dynamics. By simulating the NK model under different parameters, researchers can deeply understand the interaction between various factors in complex systems and explore the evolution path and stability of the system.
The risk factors in a coal mine fire include personnel (M1), equipment (M2), environment (M3), management (M4), and firefighting (M5). Based on statistics from coal mine fire accidents, the number of fires caused by each coupling of personnel, equipment, environment, management, and firefighting factors was determined for each case. From the occurrence counts of each coupling scenario, one can calculate the coupling frequency of the five risk factors, and subsequently determine the probability of these risk factors coupling (see Figure 3). The N-K model calculates a coupling value Y for each scenario using the coupling probabilities of the various risk factors, representing the magnitude of the risk [17]. Because the risk from a single-factor coupling is relatively small (within a controllable range), the calculation formula for coal mine fire risk coupling is as follows:
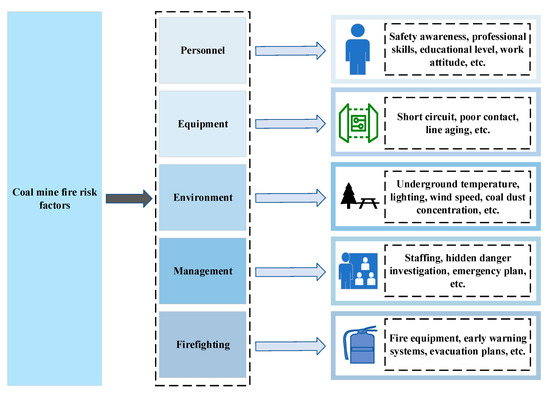
Figure 3.
Coupling relationships among personnel, equipment, environment, management, and fire-protection factors in coal mine fires.
Fuzzy Bayesian network is a theoretical method that combines fuzzy set theory and Bayesian network to analyze accidents. In simple terms, it is to be able to accurately and quantitatively analyze the fuzzy node variables in the Bayesian network model [8]. The fuzzy set theory is introduced in the process of determining the parameters of the node variables, so as to optimize the accuracy and application scope of Bayesian network analysis accidents. Bayesian network is a theoretical method that can quantitatively analyze and deal with uncertain scenarios, which is consistent with the characteristics of influencing factors of coal mine fire accidents [18]. Therefore, it is feasible to use Bayesian network to analyze coal mine fire accidents. In order to improve the scientificity of Bayesian model parameters and reduce the relative error between data, fuzzy set theory is introduced into model parameters to form a theoretical method of fuzzy Bayesian network [6]. According to the logical relationship between the various influencing factors of the accident, the fuzzy Bayesian network model of coal mine fire accident is established by representing the nodes and directed edges in the Bayesian network structure.
The simulation research of an SD system is mainly based on the System Dynamics (SD) method [19], which is a quantitative method for studying complex systems founded by Jay W. Forrester of Massachusetts Institute of Technology in 1956. It is based on feedback control theory, with the help of digital computer simulation technology, to study the dynamic behavior of complex systems such as natural, social and economic systems. The main purpose of SD system simulation research is to establish a simulation model that can describe the system structure or behavior process and has a certain logical relationship or mathematical equation based on the analysis of the nature of each element of the system and its interrelationship according to the purpose of system analysis [14]. Based on this, experiments or quantitative analysis are carried out to obtain various information needed for correct decision-making. The Vensim PLE software (version 8.2.4) was used to simulate the coal mine fire. First, the causal relationship diagram is constructed from the risk factors. On this basis, the flow stock model diagram is added to construct the equation to simulate the coal mine fire risk.
To ensure these modeling techniques operate cohesively, the INK-FBSD framework couples them sequentially. Specifically, ISM first maps the hierarchical relationships among risk factors. The NK model then quantifies the coupling intensities between factors, producing numerical indices of interaction strength. These indices serve as probabilistic inputs to the fuzzy Bayesian network, which estimates the overall likelihood of fire occurrence and identifies critical influencing factors. Finally, the key risk variables and their associated probabilities feed into the system dynamics simulation to project how fire risk evolves over time under different management scenarios.
In our setting, short-horizon forecasting serves only as a bridge between observed precursors and the two modeling layers already described. The near-term evolution of the existing risk factors is treated as input evidence for the fuzzy Bayesian network, which yields the probability of ignition or escalation within a finite future window and the corresponding early-warning state. The same forecasts are passed to the system dynamics model in Vensim PLE, where they are propagated through the established causal-loop and stock-and-flow structure to assess how the system enters or leaves high-risk states under alternative management actions. In this way, forecasting does not introduce new variables; it provides time-aware values for the existing nodes and flows, converting leading signals into graded, decision-oriented risk estimates within the current framework.
3. Results
3.1. ISM-Based Coal Mine Fire Risk Factor Discrimination and Hierarchy Research
To ensure scientific rigor and practical relevance, the selection of 54 fire-risk indicators was based on a combination of literature review, expert consultation, and accident case analysis. First, we reviewed recent national standards related to coal mine fire safety [20,21]. These documents provided the baseline set of potential indicators. Second, through interviews with 12 experienced safety engineers and fire-control experts from major coal mines in Shandong and Henan provinces, we refined and classified the indicators into five causal domains: personnel, equipment, environment, management, and fire protection. Third, representative accident reports from 2010–2023 were analyzed to verify the frequency and relevance of each factor. Indicators with low occurrence or indirect relevance were excluded. Each indicator is defined explicitly in Table 1. The selected 54 indicators therefore reflect both theoretical comprehensiveness and engineering applicability, capturing the intrinsic and extrinsic mechanisms of coal-mine fire formation.

Table 1.
Coal mine fire risk factor index.
To maintain flexibility and adaptability, these 54 indicators are regarded as a baseline set rather than a closed list. When new data or emerging risk dimensions are identified, additional indicators can be incorporated by reconstructing the ISM adjacency and reachability matrices, recalibrating the NK model coupling coefficients, and updating the fuzzy Bayesian network accordingly. This modular expansion enables the INK-FBSD framework to dynamically reflect evolving system complexity while preserving methodological consistency.
Based on their roles in fire causation, these indicators were classified into five domains: human, equipment, environment, management, and fire protection [19]. This structure was further validated using Interpretive Structural Modeling (ISM), confirming logical interdependencies among the factors. While the indicators are grouped by source domain, they collectively encompass both intrinsic fire causes—such as coal spontaneous combustion and oxidation—and extrinsic ignition factors including mechanical sparks and electrical failures. The final index system, summarized in Table 1, forms the foundation for subsequent modeling and analysis.
Let the set of system structure sets be , then ; denote the set of binary relations by denote the set of binary relations, then
Create an adjacency matrix . So when
Then the adjacency matrix is established from the original data , as shown in Figure 4.
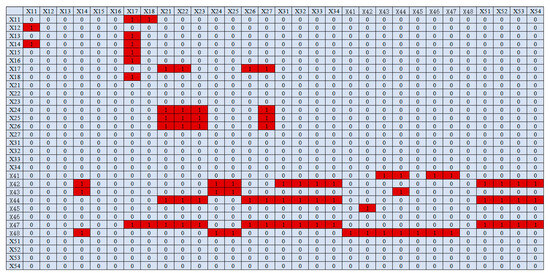
Figure 4.
Adjacency matrix of risk factors indicating direct influence relationships among the 54 coal mine fire indicators.
The adjacency matrix is transformed into a reachable matrix, and the degree of reachability of each node through a long path is explained in the form of a matrix [22]. In the reachability matrix, the number 1 indicates that there is a reachable long path between the two elements, and the number 0 indicates that there is no path between the two elements anyway, as shown in Figure 5.
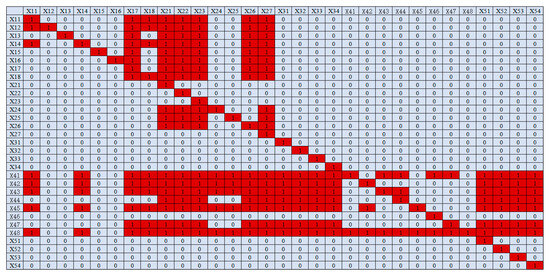
Figure 5.
Reachability matrix derived from the adjacency matrix and used to determine the hierarchical levels in the ISM model.
The analysis of the reachability matrix reveals that high-risk couplings occur primarily between environmental and management factors, indicating that inadequate ventilation and weak management oversight together contribute significantly to elevated fire risk. This interaction underscores the importance of integrated prevention measures that simultaneously address environmental and organizational dimensions. After the reachable matrix R is obtained, the elements of behavior 1 in the matrix are set into a set R, which is called the reachable set R. The set of elements listed as 1 in the matrix is called the set Q, which is called the first set Q to determine the elements of each level of the system according to Formula. The process is as follows, as shown in Table 2.
Table 2.
Reduce the matrix display hierarchy.
The number representation elements of the reachable set and the antecedent set, such as the number 5 representing X11, X12, X13, …, which shows the fifth element in X54. When the elements of the intersection are the same as the elements of the corresponding reachable set, the elements represented by the numbers are the elements under the level, and the rows corresponding to the elements of the determined level are deleted. The remaining rows are the same as the elements of the determined level, and the elements are deleted to obtain the table of elements that determine the next level. The determination of the elements of this level is the same as that described above. By analogy, the elements of each level can be determined as shown in Table 3.
Table 3.
Level of risk factors.
The hierarchical levels presented in Table 3 were determined based on the reachability matrix, where higher-level factors represent systemic and indirect causes that influence multiple lower-level variables, while lower-level factors directly affect the occurrence of fire events.
Through the systematic analysis of the main risk factors of coal mine fire, these factors are dynamically interrelated. By identifying the key factors, the prevention and control measures of coal mine fire are strengthened. The above table describes the main responsibility framework for mine safety, namely X48, which constitutes the most basic and critical element. Intermediate elements, including mine safety, are the direct causes and inducing factors of such accidents. Management system X41, underground technology management staffing X45, and a series of other factors from miner literacy X12 to improper installation X26, are affected by both basic elements and overall system elements. This hierarchical structure helps to understand complex interdependence.
Within this structure, human and equipment-related variables act as essential transmission channels between management control and on-site fire risk. For instance, miners’ work ethics (X13) represents the extent to which individual behavioral norms align with safety culture—covering rule compliance, hazard reporting, and operational discipline. A decline in work ethics can disrupt the implementation of management measures and amplify the effect of environmental and equipment defects, thereby accelerating risk accumulation. Conversely, a strong ethical and safety culture can effectively buffer these interactions and improve system resilience.
On the technical side, pipeline aging (X23) and coal-dust concentration (X33) are key environmental–equipment coupling indicators. Aging ventilation and drainage pipelines reduce air-flow stability and sealing performance, leading to heat accumulation and gas leakage. When coupled with excessive coal-dust deposition, these conditions significantly increase the probability of ignition and secondary combustion. These mechanisms highlight how latent defects in physical infrastructure can evolve into direct fire triggers under specific coupling conditions.
Therefore, the combined influence of behavioral, mechanical, and environmental factors—represented by indicators X13, X23, and X33—illustrates the multi-path propagation of coal mine fire risk and reinforces the need for integrated prevention strategies that simultaneously address human, technical, and environmental dimensions.
3.2. Coupled Analysis of Coal Mine Fire Risk Factors Based on the N-K Model
Coal mine fires include personnel factor X1, equipment factor X2, environmental factor X3, management factor X4 and fire protection factor X5. Through the statistics of coal mine fire accidents, the number of coal mine fires caused by the coupling of risk factors of personnel, equipment, environment, management and fire protection can be obtained, respectively. Through the number of occurrences in various coupling forms, the frequency of coupling of five risk factors can be obtained, and then the probability of coupling of these risk factors can be obtained. The N-K model calculates the coupling value Y under various types through the probability of coupling of various risk factors to represent the size of the risk [23]. Because the risk of single factor coupling is relatively small, in the controllable range of coal mine fire risk, the calculation formula of coal mine fire risk coupling is as follows:
Through the statistical analysis of coal mine fire accidents, a total of 32 accidents causing casualties were identified. These accidents were caused by human error, equipment failure, environmental factors, management issues, and the complex interactions of various factors (including fire-related challenges) [24]. The causes of coal mine fire accidents can be classified according to intertwined factors such as personnel, equipment, environmental conditions, management practices, and firefighting work. The incidence of coal mine fires in different coupling forms is listed and the frequency is calculated accordingly as shown in Table 4.
Table 4.
Frequency of risk factor coupling times.
The factor coupling analysis results are presented in Table 5, Table 6 and Table 7. T-values were calculated for the different coupling types of risk for each of the following factors, as shown in Table 8.
Table 5.
Probability of Single-Factor Change Risk.
Table 6.
Probability of Risk of Two-Factor Change.
Table 7.
Probability of Risk of Multi-factor Change.
Table 8.
Coupled Risk Values by Item.
As can be seen from the calculations, as shown in Figure 6:
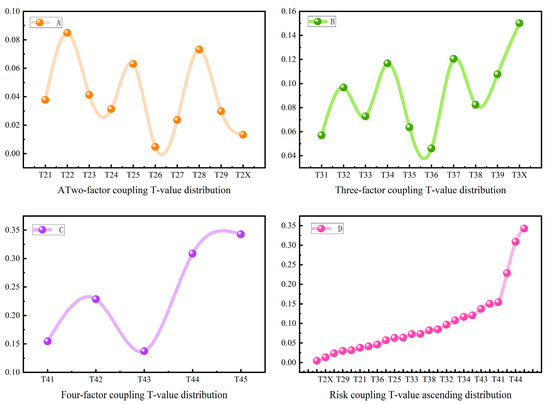
Figure 6.
Trends in comprehensive fire risk levels under different multi-factor coupling scenarios.
T45 > T44 > T5 > T42 > T41 > T3X > T43 > T37 > T34 > T39 > T32 > T22 > T38 > T28 > T33 > T35 > T25 > T31 > T36 > T23 > T21 > T24 > T29 > T27 > T2X > T26
Find the average value of two-factor coupling, three-factor coupling, and multi-factor coupling: T2 = 0.040286, T3 = 0.091577, and T4 = 0.2342778, which leads to T5 > T4 > T3 > T2.
Analysis of calculation results
(1) The greater the number of risk factors involved in a coupling, the higher the probability of a coal mine fire accident and the greater the overall risk. Among them, the risk value of all factors is the largest, followed by four-factor coupling, three-factor coupling and two-factor coupling. Notably, the risk value of certain two-factor couplings can be slightly higher than that of some three-factor couplings, but overall the more risk factors that are coupled, the greater the risk.
(2) In two-factor couplings, the interaction between human factors and environmental factors is the most dangerous, posing the greatest risk. This indicates that in fire accidents, unsafe human behaviors and uncontrollable environmental factors are the main causes of coal mine fire incidents.
(3) For three-factor couplings, the combination of environmental, management, and process factors produces the highest risk. The next highest risk comes from the coupling of equipment, environmental, and management factors, followed by the coupling of human, environmental, and management factors. This pattern demonstrates that environmental factors are an extremely important contributor in coal mine fires. Therefore, enterprises should pay more attention to the impact of environmental factors and implement prevention and control measures to avoid the adverse consequences caused by these factors.
(4) In four-factor couplings, the combination of equipment, environmental, management, and process factors yields the highest risk, followed by the combination of human, environmental, management, and process factors. This outcome indicates that in multi-factor couplings, environmental, management, and process factors play a relatively large role. Therefore, when devising prevention and control measures, more attention should be paid to these three factors.
3.3. Steps in Analyzing Fuzzy Bayesian Network Models
Coal mine fire accidents are caused by a complex combination of factors, including personnel, management, equipment, fire protection, and environment. This section will analyze each of these factors in detail as shown in Table 9.
Table 9.
Hierarchy of causal factors.
The influencing factors identified in the previous section were modeled to determine the accidental fuzzy Bayesian network structure based on their interrelationships as shown in Figure 7 [7].
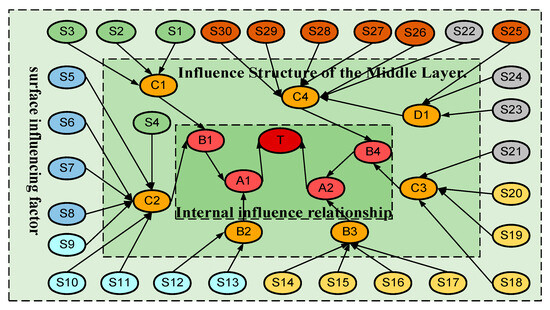
Figure 7.
Fuzzy Bayesian network structure model of coal mine fire accidents showing causal links among ignition sources, environmental conditions, and management failures.
Five relevant expert scholars are invited to judge each evidence node in the model, and the expert judgment results are displayed in the form of heat map and box plot, as shown in Figure 8 and Figure 9. Some arrows in this network denote indirect causal pathways rather than direct cause–effect links. For instance, the arrow from node B2 (insufficient ventilation capacity) to A1 (coal seam fire) should not be interpreted to mean that poor ventilation alone can ignite coal. Instead, it indicates that inadequate ventilation contributes to heat accumulation and the buildup of combustible gases and dust, which, when combined with other risk factors, can lead to spontaneous combustion.
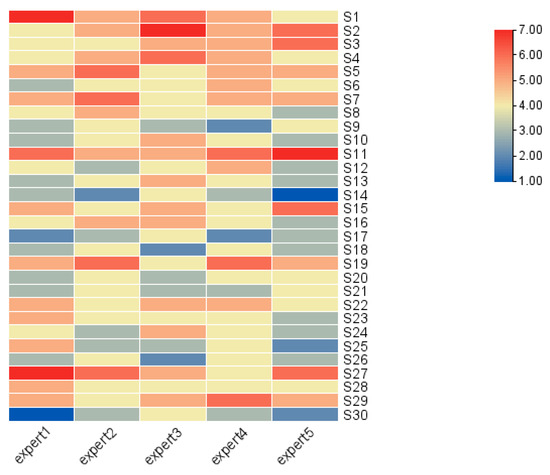
Figure 8.
Heat map of expert scoring for each risk factor based on fuzzy evaluation values.
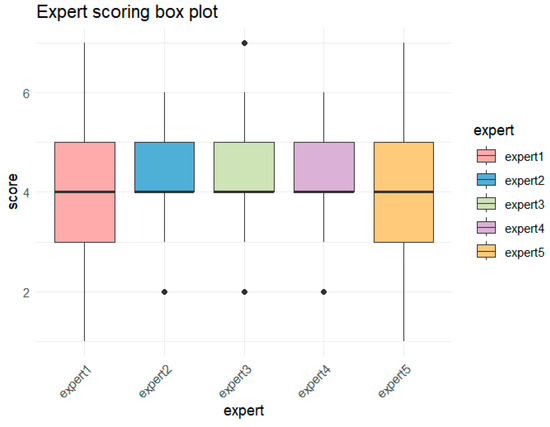
Figure 9.
Box plots showing the distribution and dispersion of expert scoring for coal mine fire risk factors.
According to the correspondence between triangular fuzzy numbers and natural language variables [25], the experts’ linguistic evaluations were converted into triangular fuzzy numbers, and the statistical results of these evaluations are shown in Table 10.
Table 10.
Triangular fuzzy evaluation statistical table.
To minimize subjective error in the expert evaluations, the evaluation data are averaged. Then, the conditional probabilities of the evidence nodes in the accident fuzzy Bayesian network model were defuzzified and normalized, as shown in Table 11 [7].
Table 11.
Meaning results and conditional probability.
The conditional probability of each evidence node calculated in the previous section is input into GeNIe 3.0 software, which specifically analyzes the Bayesian network structure [22], and then the software is used for reasoning and calculation. Finally, the risk level of coal mine fire accidents is obtained as shown in Figure 10.
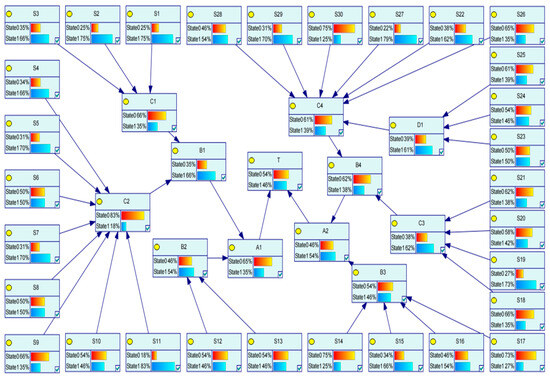
Figure 10.
Causal reasoning results of the fuzzy Bayesian network showing posterior probabilities of coal mine fire occurrence and key contributing factors.
The analysis results show that the probability of coal mine fire accidents is 46%. This result once again verifies that fire accidents are common accidents in the working process of the coal mine industry, and warns the management personnel of the coal industry to pay attention to and establish perfect fire emergency response measures.
In this part, the posterior probability of each evidence node is obtained by reverse reasoning of the fuzzy Bayesian network structure model through GeNIe software, so as to determine the main causes or main influencing factors of the accident. The reverse reasoning of fuzzy Bayesian network model is to use GeNIe software to set the state ‘state1’ of the target node of rock burst disaster accident to 100%, so as to obtain the posterior probability of the evidence node.
When the accident occurs, the possibility of excessive accumulation of coal dust (S11) is the highest, with a probability of 83%. Secondly, the probability of fire prevention neglect (S27) caused by fluke psychology is 78%.
3.4. System Dynamics Simulation
System dynamics reflects the feedback effects among influencing factors. Based on the relationships among these factors, a causal loop diagram is established (Figure 10 [26]) consisting of multiple orthogonal factors that describe the causal links leading to specific system behaviors. The causal relationship is represented by a directed arrow, and the cause points to the result. Each causal relationship can be positive or negative. The positive feedback loop, represented by ‘+’, indicates that the system elements increase with the increase in influence. On the basis of the causality diagram, the level variables, rate variables and constants are introduced to establish the stock flow diagram, and then the coal mine fire accident is simulated.
Stock and flow charts are tools used to analyze the interactions of variables and their dynamic evolution within the system. These diagrams consist of cumulative indices, dynamic (rate) indices, auxiliary indices, and their functional relationships [27]. The cumulative index reflects the system’s state of accumulation, while the dynamic change index reveals changes in flow within the system. Constants are key factors that shape the system’s framework. This graphic design is rooted in theoretical assumptions and causal chain analysis, which helps researchers explore the deep structure of causal links within the system and provide a basis for the formation of more effective strategies and measures. These variables detail the safety status of the human, management, environment, equipment, and process subsystems, as well as the logical and dynamic interactions among their indicator variables. Through a questionnaire survey, the influence relationships among the 31 risk factors were determined, enabling the use of Vensim software to establish the causal relationships among those risk factors, as shown in Figure 11. Based on the causal relationships identified in Figure 11, the stock-and-flow structure of the system dynamics model for simulating coal mine fire risk over time is constructed, as shown in Figure 12.
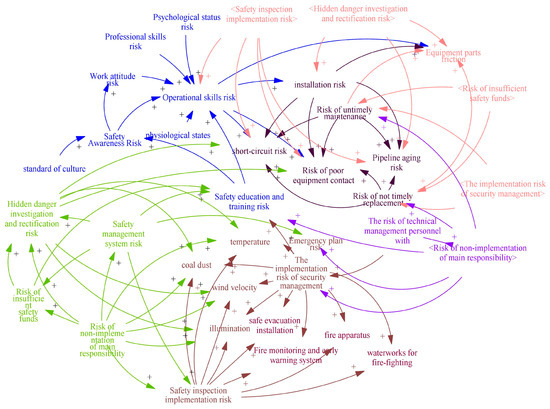
Figure 11.
Causal-loop diagram of the system dynamics model depicting feedback among safety investment, risk evolution, and emergency response capability.
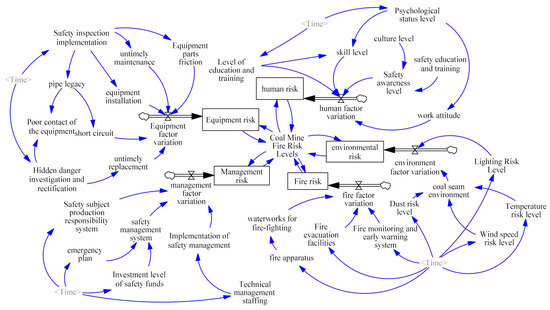
Figure 12.
Stock-and-flow structure of the system dynamics model for simulating coal mine fire risk over time.
Coal mine fire simulation modeling equations established.
where i = 1, 2, 3, 4, 5; j = 1, 2, 3, 4, 5, 6, 7, 8; m = 1, 2, 3, 4, 5, 6, 7;
is the secondary risk factor weight; and is the primary risk weight.
is a secondary risk factor level variable; is a primary risk factor level variable; is a causal level variable for ; and is a coal mine fire risk level variable.
is a secondary risk factor rate variable; is a primary risk factor rate variable; and is a coal mine fire risk rate variable.
Other variables are initial values or constants. The simulation period for the coal mine fire model was set to 24 months, with a time step of 1 month, to simulate the changing trend of coal mine fire risk. By substituting the variable values into the SD model and running the simulation, we obtained the results shown in Figure 13.
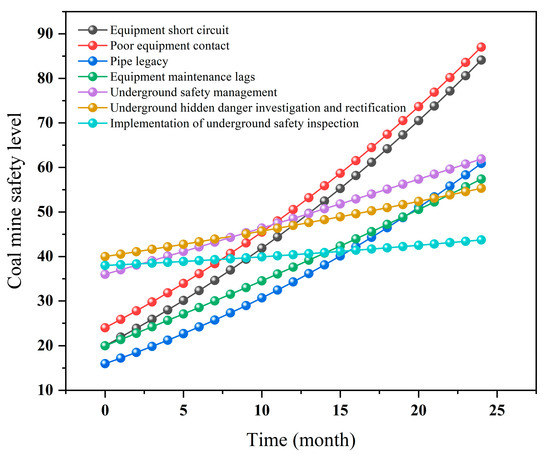
Figure 13.
Simulation results of coal mine fire risk changes over time under the current safety management and control measures.
The simulation reveals that the seven risk factors, such as equipment short circuit, poor contact, pipeline aging, maintenance lag, underground safety management, hidden danger investigation and rectification, and safety inspection execution, are on the rise, and all progress to the severe risk level. The causal analysis points out the main influencing factors and suggests control measures. The short-circuit risk of equipment deteriorated from moderate to severe within 9 months. The contributing factors include improper equipment installation, lagging maintenance, delayed replacement, poor safety inspection implementation, and insufficient hidden-danger rectification. The control measures are to strengthen equipment inspection, timely maintenance and replacement. The risks associated with poor equipment contact, pipeline aging, and delayed maintenance also show the same upward trend, reaching a severe level in the 8th, 15th, and 15th months, respectively. The contributing factors and control measures for these risks are similar, emphasizing timely maintenance and replacement as well as strengthened hidden-danger investigations. The implementation risk of underground safety management rose to a severe level at around the fourth month. The contributing factors were a lack of technical management personnel and a failure to implement the primary safety responsibility system. Control measures include assigning sufficient technical management personnel and enforcing the safety production responsibility system. The control measures include the allocation of technical management personnel and the implementation of safety production responsibility. The risk of underground hidden hazard investigation and rectification was initially moderate, then rose sharply to severe after approximately 1 month. The causal analysis shows that the main risks stem from an imperfect safety management system and insufficient safety investment. In order to control this risk, it is necessary to improve the safety management system and increase investment in safety measures to maintain a low-risk state. The implementation risk of underground safety inspections shows a slow upward trend: it begins at a moderate risk level and gradually becomes severe by around the 10th month. The key risk factor is a failure to implement the primary safety responsibility, and that responsibility needs to be strengthened.
4. Discussion
By constructing a hierarchical analysis framework based on Interpretive Structural Modeling (ISM), this study deeply analyzes the internal logic and hierarchical relationships of coal mine fire risk factors. The analysis results show that the main safety production responsibility system is the key factor in the ISM hierarchy, and that the coupling risk values for environmental, management, and fire factors are higher. In addition, this study combines the N-K model with a fuzzy Bayesian network approach to integrate qualitative and quantitative risk analysis, which significantly improves the accuracy and general applicability of the risk assessment. The analysis indicates that the coupling of four risk factors in a coal mine fire accident is the most likely scenario, and its consequences are the most severe. Therefore, the simultaneous presence of all four risk factors should be avoided, and, in particular, the coupling of equipment, environment, management, and fire protection factors must be prevented. Finally, this study uses system dynamics (SD) simulation technology to model the risk factors of coal mine fires, further revealing the dynamic changes and interaction mechanisms of these factors. Through simulation, we can intuitively observe the changing trend of each risk factor over time, and provide dynamic decision support for coal mine management to prevent fires. The application of SD simulation technology not only emphasizes the relevance and dynamic interactions among risk factors, but also highlights the importance of continuous monitoring and dynamic assessment in risk management.
Although this study has made a series of important achievements in coal mine fire risk assessment and management, there are still some limitations and future research directions. In terms of limitations, first, although this study identified key underlying risk factors with the ISM model, the model’s structure and parameter settings may be influenced by subjective factors, which could affect the accuracy of the results. Secondly, although the application of the N-K model and the fuzzy Bayesian network improves the accuracy and generality of risk analysis, the model’s complexity and computational cost may limit its practical adoption. In addition, although system dynamics simulation can simulate the dynamic change process of risk factors, the reliability of the results often depends on the rationality of the model and the accuracy of the data. In future research, the scope of risk-factor identification could be further expanded. For example, more factors related to coal mine fire risk (such as geological conditions and climate change) could be considered to enable a more comprehensive risk evaluation. In addition, differences among various coal mine types and regions can be studied in depth, and a more targeted risk identification model can be developed.
Coal-mine fires can generally be divided into open fires—triggered by external ignition sources such as mechanical friction, electrical faults, or open flames—and closed fires, which arise from internal mechanisms such as coal spontaneous combustion and oxidation in sealed or poorly ventilated areas. In the present study, this distinction is reflected implicitly through the factor domains: open-fire mechanisms are represented under the equipment and fire-protection categories, while closed-fire mechanisms are captured under the environmental domain. This comprehensive structure ensures that both intrinsic and extrinsic fire causes are adequately considered.
Furthermore, the indicators used in this study have been systematically organized according to both fire type and causal domain. Following the classical distinction between open fires (initiated by external ignition sources such as electrical faults or mechanical friction) and closed fires (driven by spontaneous combustion and oxidation within confined spaces), the indicators are grouped into five major domains—personnel, equipment, environment, management, and fire protection. This classification ensures that causal factors are consistently mapped to their corresponding fire mechanisms. The resulting structured database supports a multidimensional approach to fire-risk assessment, allowing dynamic simulation of ignition and propagation processes in Vensim_PLE, and thus provides a clearer theoretical foundation for system dynamics-based risk management.
The computed 46% probability of fire occurrence was derived from the fuzzy Bayesian network based on representative data from three deep coal mines in Shandong and Henan provinces. These mines operate at depths of 800–1200 m and exhibit high dust accumulation, aging electrical systems, and complex ventilation conditions. The probability represents the aggregated likelihood of fire under comparable conditions, serving as a relative indicator of risk intensity rather than a deterministic prediction. In the context of risk management, a probability level of approximately 46% signifies a moderate-to-high risk category that warrants strengthened preventive inspection and control measures.
The findings of this study offer several actionable implications for enhancing fire safety management in underground coal mines. First, the strong influence of the “safety accountability system” identified by the ISM and NK models suggests the importance of institutionalized responsibility frameworks and regular compliance audits. Second, SD simulations show that equipment degradation and delayed maintenance can trigger high-risk fire states within 9–15 months, underscoring the need for routine inspections and real-time monitoring, particularly in conveyor belts and ventilation systems. Third, the fuzzy Bayesian analysis indicates that excessive coal dust and ineffective fire prevention are top contributing factors in fire scenarios. Therefore, management efforts should include intensive training on dust control, strict enforcement of housekeeping protocols, and early-warning systems equipped with temperature and smoke sensors. Finally, adaptive scheduling of inspections and safety drills based on risk forecasts can provide dynamic support for risk mitigation. These recommendations align with the risk evolution logic embedded in the INK-FBSD model and serve as targeted interventions to break the critical coupling chains identified in this study.
It is also important to note that spontaneous combustion of coal remains a critical ignition source in underground mines. Our results highlight that coal dust accumulation and inadequate sealing or ventilation can serve as primary triggers. Therefore, proactive sealing of mined-out areas, temperature monitoring systems, and enhanced training on spontaneous combustion recognition are vital components of comprehensive fire prevention strategies.
Furthermore, although the INK-FBSD framework was developed based on coal-mine fire data, its modular structure and multi-level modeling logic enable it to be generalized to other high-risk industrial scenarios where combustible dusts and complex coupling mechanisms exist. For instance, petrochemical plants, tunnel construction projects, and grain storage facilities exhibit similar multi-factor interactions among equipment, environmental, and management elements. By redefining domain-specific indicators and recalibrating the coupling and probability matrices, the proposed framework can serve as a general methodological reference for dynamic risk assessment and multi-hazard prevention. This scalability and adaptability demonstrate that the INK-FBSD approach is not limited to coal-mine fire prevention but can provide theoretical and practical guidance for safety management across various industrial systems.
5. Conclusions
This study proposes a dynamic and multidimensional fire risk assessment framework (INK-FBSD) that integrates interpretive structural modeling, the NK model, fuzzy Bayesian networks and system dynamics simulation to analyze coal mine fire risk. By systematically identifying hierarchical relationships among risk factors, quantifying inter-factor coupling, performing probabilistic inference and simulating risk evolution over time, the framework provides a holistic understanding of how coal mine fires originate and propagate. The results highlight several key insights.
(1) The main mine safety responsibility system constitutes the foundational element that influences intermediate and direct risk factors; maintaining a robust accountability system is thus essential for fire prevention.
(2) Risk increases sharply as more factors are coupled, with environmental, management and firefighting factors playing dominant roles. Unsafe human behavior and adverse environmental conditions emerge as the most hazardous two-factor combination, underscoring the need for continuous safety education and environmental control.
(3) Fuzzy Bayesian inference suggests an approximate 46% probability of fire under current conditions—calculated using representative deep-mine data—and identifies excessive coal dust accumulation and negligence due to complacency as the principal drivers.
(4) System dynamics simulations reveal that risk indices can rise to severe levels within 9–15 months in the absence of intervention, reinforcing the importance of proactive monitoring and maintenance.
Although developed in the context of coal mining, the INK-FBSD framework is modular and extensible. Additional indicators can be incorporated by reconstructing the structural and coupling matrices and re-parametrizing the probabilistic and dynamic models. The approach is therefore adaptable to other industrial settings involving combustible dusts and confined spaces, such as petrochemical plants, tunnels or grain storage facilities. By offering quantitative early-warning insights, the framework supports targeted preventive measures and informed decision-making for safer operations.
Author Contributions
S.T.: Methodology, Formal analysis, Validation, Supervision, and Funding acquisition; J.S.: Investigation, Data curation, Visualization, Writing—original draft, Writing—review and editing, and Funding acquisition; Z.Z.: Data curation, Visualization, Formal analysis, and Writing—review and editing; Z.Q.: Conceptualization, Methodology, Writing—review and editing, and Supervision; All authors have read and agreed to the published version of the manuscript.
Funding
This research was supported by the Natural Science Foundation of Shandong Province [ZR2024MG039]: Research on Risk Sensing and Early Warning Decision-Making of Major Coal Mine Disasters Based on Multimodal Big Data and Research Startup Program of Shandong Technology and Business University [BS2025114].
Institutional Review Board Statement
Not applicable.
Informed Consent Statement
Informed consent was obtained from all subjects involved in the study.
Data Availability Statement
The original contributions presented in this study are included in the article. Further inquiries can be directed to the corresponding author.
Conflicts of Interest
The authors declare no conflicts of interest. The funders had no role in the design of the study; in the collection, analyses, or interpretation of data; in the writing of the manuscript; or in the decision to publish the results.
References
- Chu, C.; Muradian, N. Safety and Environmental Implications of Coal Mining. Int. J. Environ. Pollut. 2016, 59, 250–268. [Google Scholar] [CrossRef]
- Zhu, Y.; Wang, D.; Shao, Z.; Xu, C.; Zhu, X.; Qi, X.; Liu, F. A Statistical Analysis of Coal Mine Fires and Explosions in China. Process Saf. Environ. Prot. 2019, 121, 357–366. [Google Scholar] [CrossRef]
- Tong, R.; Yang, Y.; Ma, X.; Zhang, Y.; Li, S.; Yang, H. Risk Assessment of Miners’ Unsafe Behaviors: A Case Study of Gas Explosion Accidents in Coal Mine, China. Int. J. Environ. Res. Public Health 2019, 16, 1765. [Google Scholar] [CrossRef]
- Li, S.; You, M.; Li, D.; Liu, J. Identifying Coal Mine Safety Production Risk Factors by Employing Text Mining and Bayesian Network Techniques. Process Saf. Environ. Prot. 2022, 162, 1067–1081. [Google Scholar] [CrossRef]
- Dey, P.; Chaulya, S.; Kumar, S. Hybrid CNN–LSTM and IoT-Based Coal Mine Hazards Monitoring and Prediction System. Process Saf. Environ. Prot. 2021, 152, 249–263. [Google Scholar] [CrossRef]
- Jafari, M.J.; Pouyakian, M.; Hanifi, S.M. Reliability Evaluation of Fire Alarm Systems Using Dynamic Bayesian Networks and Fuzzy Fault Tree Analysis. J. Loss Prev. Process Ind. 2020, 67, 104229. [Google Scholar] [CrossRef]
- Yazdi, M.; Kabir, S. A Fuzzy Bayesian Network Approach for Risk Analysis in Process Industries. Process Saf. Environ. Prot. 2017, 111, 507–519. [Google Scholar] [CrossRef]
- D’Angelo, M.F.; Palhares, R.M.; Cosme, L.B.; Aguiar, L.A.; Fonseca, F.S.; Caminhas, W.M. Fault Detection in Dynamic Systems by a Fuzzy/Bayesian Network Formulation. Appl. Soft Comput. 2014, 21, 647–653. [Google Scholar] [CrossRef]
- Kumari, K.; Dey, P.; Kumar, C.; Pandit, D.; Mishra, S.; Kisku, V.; Chaulya, S.; Ray, S.; Prasad, G. UMAP and LSTM Based Fire Status and Explosibility Prediction for Sealed-Off Area in Underground Coal Mine. Process Saf. Environ. Prot. 2020, 146, 837–852. [Google Scholar] [CrossRef]
- Tripathi, A.; Khan, M.M.; Pain, A.; Rai, N.; Iqbal, M.A. Compressive Strength of Thermally Treated Barakar Sandstone in Jharia Coal Mine Fire Region: Interplay of Strength, Strain Rate, and Temperature. Eng. Fract. Mech. 2025, 319, 111002. [Google Scholar] [CrossRef]
- Ganco, M. NK Model as a Representation of Innovative Search. Res. Policy 2017, 46, 1783–1800. [Google Scholar] [CrossRef]
- Wu, C.; Zhou, L.; Jin, J.; Ning, S.; Zhang, Z.; Bai, L. Regional Water Resource Carrying Capacity Evaluation Based on Multidimensional Precondition Cloud and Risk Matrix Coupling Model. Sci. Total Environ. 2019, 710, 136324. [Google Scholar] [CrossRef]
- Tahir, M.; Aslam, M.; Hussain, Z.; Khan, A.A. On the 3-Component Mixture of Exponential, Rayleigh and Burr Type-XII Distributions: A Simulation Study in Bayesian Framework. Chiang Mai J. Sci. 2018, 45, 1161–1180. [Google Scholar]
- Tako, A.A.; Robinson, S. The Application of Discrete Event Simulation and System Dynamics in the Logistics and Supply Chain Context. Decis. Support Syst. 2011, 52, 802–815. [Google Scholar] [CrossRef]
- Watson, R.H. Interpretive Structural Modeling—A Useful Tool for Technology Assessment. Technol. Forecast. Soc. Change 1978, 11, 165–185. [Google Scholar] [CrossRef]
- Zhang, X.W.; Xie, W.J. The Application of ISM Model in Risk Structure Analysis. Commer. Res. 2002, 2, 3. [Google Scholar] [CrossRef]
- Wu, B.-J.; Jin, L.-H.; Zheng, X.-Z.; Chen, S. Coupling Analysis of Crane Accident Risks Based on Bayesian Network and the NK Model. Sci. Rep. 2024, 14, 1133. [Google Scholar] [CrossRef]
- Li, M.; Wang, H.; Wang, D.; Shao, Z.; He, S. Risk Assessment of Gas Explosion in Coal Mines Based on Fuzzy AHP and Bayesian Network. Process Saf. Environ. Prot. 2020, 135, 207–218. [Google Scholar] [CrossRef]
- Randers, J. Elements of the System Dynamics Method. J. Oper. Res. Soc. 1997, 48, 1144–1145. [Google Scholar] [CrossRef]
- GB/T 50448-2015; Technical Code for Application of Cementitious Grout. China Architecture & Building Press: Beijing, China, 2015.
- MT/T 850-2000; Specification for Grouting Materials for Coal Mine Engineering. China Coal Industry Publishing House: Beijing, China, 2000.
- Kenett, R.S. Bayesian Networks: Theory, Applications and Sensitivity Issues. Encycl. Semant. Comput. Robot. Intell. 2017, 1, 1630014. [Google Scholar] [CrossRef]
- Qiao, W. Analysis and Measurement of Multifactor Risk in Underground Coal Mine Accidents Based on Coupling Theory. Reliab. Eng. Syst. Saf. 2021, 208, 107433. [Google Scholar] [CrossRef]
- Zhang, J.; Fu, J.; Hao, H.; Fu, G.; Nie, F.; Zhang, W. Root Causes of Coal Mine Accidents: Characteristics of Safety Culture Deficiencies Based on Accident Statistics. Process Saf. Environ. Prot. 2020, 136, 78–91. [Google Scholar] [CrossRef]
- Wang, J.; Ding, D.; Liu, O.; Li, M. A Synthetic Method for Knowledge Management Performance Evaluation Based on Triangular Fuzzy Number and Group Support Systems. Appl. Soft Comput. 2015, 39, 11–20. [Google Scholar] [CrossRef]
- Li, Q.; Zhang, L.; Zhang, L.; Jha, S. Exploring Multi-Level Motivations Towards Green Design Practices: A System Dynamics Approach. Sustain. Cities Soc. 2021, 64, 102490. [Google Scholar] [CrossRef]
- Groesser, S.N.; Schaffernicht, M. Mental Models of Dynamic Systems: Taking Stock and Looking Ahead. Syst. Dyn. Rev. 2012, 28, 46–68. [Google Scholar] [CrossRef]
Disclaimer/Publisher’s Note: The statements, opinions and data contained in all publications are solely those of the individual author(s) and contributor(s) and not of MDPI and/or the editor(s). MDPI and/or the editor(s) disclaim responsibility for any injury to people or property resulting from any ideas, methods, instructions or products referred to in the content. |
© 2025 by the authors. Licensee MDPI, Basel, Switzerland. This article is an open access article distributed under the terms and conditions of the Creative Commons Attribution (CC BY) license (https://creativecommons.org/licenses/by/4.0/).