Article

Closed-Loop Multimodal Framework for Early Warning and Emergency Response for Overcharge-Induced Thermal Runaway in LFP Batteries

1
Graduate Schools, China People’s Police University, Langfang 065000, China
2
College of Computer Science and Technology, Zhejiang University, Hangzhou 310027, China
3
College of Education and Social Services, University of Vermont, Burlington, VT 05405, USA
4
School of Rescue and Command, China People’s Police University, Langfang 065000, China
5
Emergency Rescue Technology Key Laboratory of Hebei Province, Langfang 065000, China
*
Author to whom correspondence should be addressed.
Fire 2025, 8(11), 437; https://doi.org/10.3390/fire8110437
Submission received: 13 October 2025 / Revised: 6 November 2025 / Accepted: 6 November 2025 / Published: 7 November 2025

Abstract

The increasing prevalence of lithium-ion batteries in energy storage and electric transportation has led to a rise in overcharge-induced thermal runaway (TR) incidents. Particularly, the TR of Lithium Iron Phosphate (LFP) batteries demonstrates distinct evolutionary stages and multimodal hazard signals. This study investigated the TR process of LFP batteries under various charging rates through five sets of gradient C-rate experiments, collecting multimodal data (temperature, voltage, gas, sound, and deformation). Drawing on the collected data, this study proposes a three-stage evolution model that systematically identifies key characteristic signals and tracks their progression pattern through each stage of TR. Subsequently, fusion-based models (for both single- and multi-rate scenarios) and a time-series-based LSTM model were developed to evaluate their classification accuracy and feature importance in the classification of TR stages. Results indicate that the fusion-based models offer greater generalization, while the LSTM model excels at modeling time-dependent dynamics. These models demonstrate complementary strengths, providing a comprehensive toolkit for risk assessment. Furthermore, for the severe TR stage, this study proposes an innovative three-dimensional dynamic emergency decision matrix comprising a toxicity index (TI), flammability index (FI), and visibility (V) to provide quantitative guidance for rescue operations in the post-accident phase. Ultimately, this study establishes a comprehensive, closed-loop framework for LFP battery safety, extending from multimodal signal acquisition and intelligent early warning to quantified emergency response. This framework provides both a robust theoretical basis and practical tools for managing TR risk throughout the entire battery lifecycle.

1. Introduction

Driven by the global pursuit of clean energy and sustainable development, Lithium-ion Batteries (LIBs) have emerged as a cornerstone of modern energy storage systems, prized for their high energy density, long lifespan, and portable design. They are widely used in electric vehicles, electric bicycles and stationary energy storage systems [1,2]. Among them, the LFP batteries have attracted considerable attention in high-power and large-capacity applications due to their excellent thermal stability and safety [3].
However, LIBs often face extreme operational conditions, such as thermal, electrical, and mechanical abuse [4,5], which can easily trigger TR events, potentially leading to fire, explosions, and even casualties [6,7]. Among the various triggering factors, TR induced by overcharge is notable for its distinct stage characteristics and a certain degree of predictability [8,9]. During the overcharging process, the heat inside the battery gradually accumulates, causing the decomposition of organic electrolytes and gas release, which in turn initiates a chain reaction [10]. Compared to mechanical abuse, such as puncture and extrusion [11], TR induced by overcharging typically progresses more slowly, follows a clearer reaction pathway, and is accompanied by physical signals that can be used for early detection. In contrast, thermal abuse often originates from the propagation of heat from a single-cell TR to adjacent cells within a battery module [12], making early warning more challenging. Therefore, the overcharge-to-thermal-runaway process provides an ideal experimental model for research and early warning of TR.
In recent years, overcharging-induced TR has attracted widespread attention as a major cause of lithium-ion battery accidents. Related research has primarily focused on three key areas: phenomenological characteristics, underlying mechanisms, and early warning and monitoring strategies [13].
First, in terms of phenomenological and characteristic research, Wilson [14] analyzed the internal heat distribution of LiCoO2 batteries under overcharging and short-circuit conditions in the early stage; Wang [15] demonstrated that high C rate will lead to more violent gas eruption and higher explosion risk; Meng [16] investigated the influence of ambient temperature on TR behavior; Jia [17] reported that the toxicity of gas under overcharge conditions lasted up to 1211 s, which was significantly higher than that under heating conditions; Kang [18] pointed out that batteries with larger capacities tend to exhibit more destructive TR behavior; Yang [19] and Larsson [20], respectively, studied the flammability and toxicity of gases generated during TR; Deng [21] systematically discussed the combustion characteristics and dangers of LFP batteries under various TR-triggering conditions.
Secondly, in the area of mechanistic and theoretical studies, Aiello [22] examined the propagation path of TR in soft-pack batteries from the perspective of mechanical constraints; Santhanagopalan [23] developed an electrochemical model to analyze internal short-circuit behavior; Ouyang [24] summarized the evolution mechanism of LIB TR and proposed intervention strategies; Feng [25] proposed a three-level protection strategy for electric vehicle batteries, which significantly enhanced the system safety.
Third, in terms of early warning and monitoring methods, Shah [26] proposed to distinguish overheating state based on heat generation rate and temperature rise gradient, offering a thermal-source-based approach to predicting TR; Kong [27] used CFD and heat transfer simulation to reveal the relationship between the SOC (State of Charge) state of the battery cell and the jet flame, and predicted the start time of TR; Feng presented a coupled electrochemical-TR model [2] and an automatic identification method of thermophysical parameters based on optimization algorithm [12] to predict TR behavior; Cui [28] proposed an early warning mechanism based on gas production behavior, and introduced TRD (Thermal Runaway Degree) to quantify the severity of TR; Jin [10] developed an H2 gas capture method that provided an effective warning 639 s prior to the onset of TR in experiments. Furthermore, the combination of multi-physics simulation and deep learning has emerged as a promising avenue. For instance, Li [29] proposed an integration framework based on CFD and deep learning (CNN-LSTM) for early TR detection in battery packs, achieving high accuracy. Similarly, Pang [30] developed reliable, multi-physics data from 3D models for training deep learning prognostics models, emphasizing the importance of high-fidelity data for hot spot prediction.
Additionally, the integration of artificial intelligence has significantly enriched the methods for TR early warning, with the combination of machine learning and data-driven approaches leading to new breakthroughs in TR prediction [31]. Jia [32] proposed a fast classification model based on single-cycle voltage-temperature data to achieve efficient TR state identification; Zhu [33] used ResNet-CNN combined with transfer learning to accurately identify internal short circuits; Das Goswami [34] combined deep learning with multi-physics models to establish a high-precision TR prediction framework, successfully forecasting the conditions under which cylindrical cells undergo TR. These results show that the fusion of multimodal data and intelligent algorithms can significantly improve the accuracy, timeliness and adaptability of early warning systems, validating the great potential of combining multimodal information with AI techniques.
Although the aforementioned studies have laid a solid foundation for understanding the mechanisms of TR and for developing early warning methods, several challenges remain in the context of systematic research tailored to real-world engineering applications: (1) Existing early warning methods often rely on single-modal signals, leading to poor robustness under complex operating conditions and a lack of feature redundancy design. (2) For the overcharge-to-thermal-runaway process, intervention and processing at different time points may lead to varying types of damage and risks. Current approaches to precise early warning and real-time monitoring primarily focus on identifying critical points during the TR phase, with limited attention to the early stages of overcharging, where accurate forecasting is still lacking. (3) Once TR enters the irreversible stage, the high-concentration release of toxic gases such as CO and HF will significantly threaten the safety of personnel, and the visibility will drop sharply to below 0.5m due to smoke obstruction. For assessing such hazardous scenarios, traditional manual interpretation-based responses are evidently incompatible with the characteristics of lithium battery fires—namely, rapid onset and difficulty to extinguish. The traditional manual judgment and conventional response process fail to match the characteristics of battery fires, which are high temperature, high toxicity, and rapid development, and lack real-time data to assist subsequent emergency command and decision-making
Therefore, there is an urgent need for a systematic framework that integrates real-time multimodal data collection, stage-wise identification, intelligent early warning, and emergency response decision support to achieve closed-loop management from pre-incident detection to the rescue phase.
This study focuses on the overcharge-TR behavior of LFP batteries under different charging rates, and constructs a three-stage TR evolution model: Stage I (from the onset of overcharging to the activation of the safety valve), Stage II (from safety valve activation to voltage rebound) and Stage III (from sharp fluctuations in voltage and temperature to thermal stabilization). Based on five sets of C-rate gradient experiments, the system collects multi-modal data including voltage, temperature, gas emission, deformation and acoustic signals, extracting key indicators at each stage to assess their hazard potential.
Leveraging the staged TR model and multimodal data, we build a fusion early warning model based on traditional machine learning and an LSTM model based on deep learning. A multi-level TR state recognition network was constructed to enable automatic stage classification and precise early warning throughout the entire TR process. At the same time, for high-risk emergency scenarios following severe TR in Stage III, we propose a Multi-Dimensional Dynamic Emergency Decision Matrix. This framework integrates key parameters, including Toxicity Index (TI), Flammability Index (FI) and smoke visibility into the response framework to support the tiered formulation of rescue strategies and improve the accuracy, safety and intelligence of emergency management during critical incidents.
The objective of this research is to establish a comprehensive technical closed-loop system by integrating mechanism modeling, signal recognition, intelligent early warning, and emergency response. This study proposes a comprehensive framework that aims to support both theoretical understanding and practical implementation of safety management across the full lifecycle of lithium-ion batteries.
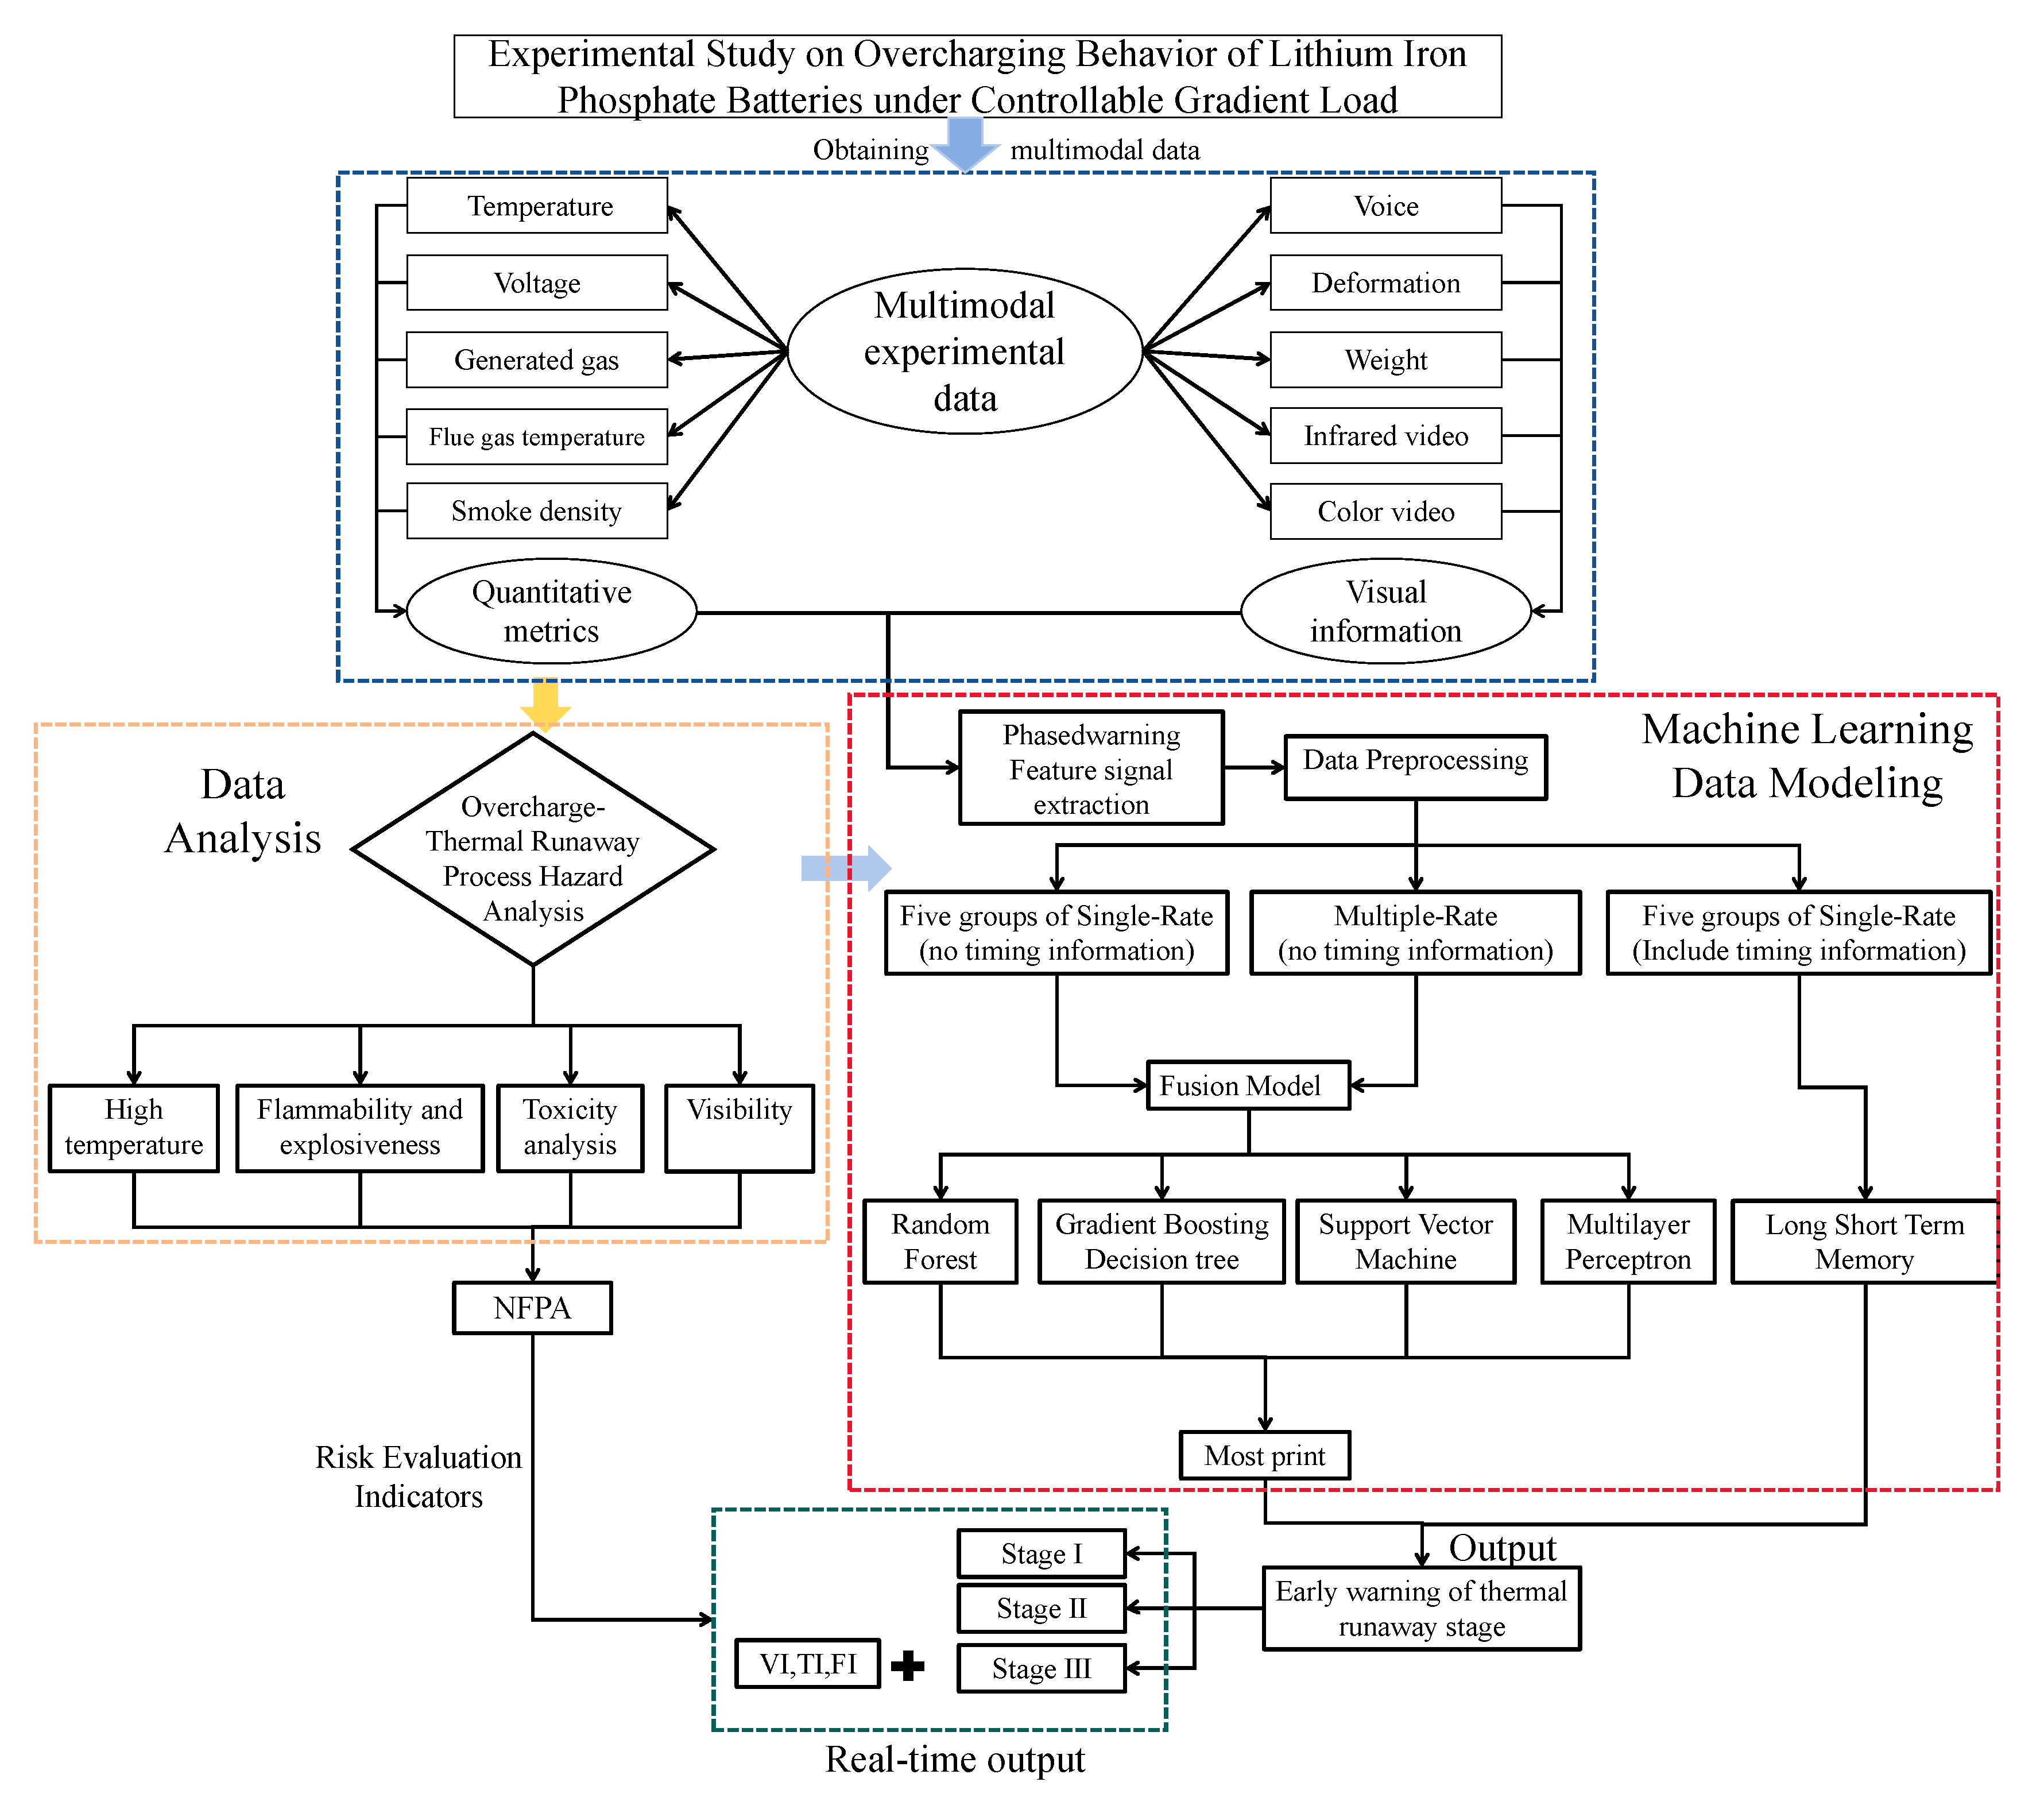
The research framework of this paper is shown in the Figure 1 below.

2. Experimental Setup

This section details the experimental preparations, including the pre-test preparation of battery samples, the design and construction of the experimental platform, and the configuration of the five-group experimental matrix.

2.1. Battery Sample Preparation

Commercial prismatic LiFePO4/graphite batteries were used in this study. Based on the limited information from the manufacturer, it was assumed that the electrolyte primarily contained lithium hexafluorophosphate (LiPF6) as the lithium salt and ethylene carbonate (EC) as the main solvent. Detailed battery specifications are listed in Table 1. To ensure experimental stability and repeatability, each battery underwent three charge–discharge cycles prior to testing. This pre-conditioning involved a constant current (CC) discharge followed by a constant current-constant voltage (CC-CV) charge. In the CC mode, the battery was discharged at 0.5 C to a cut-off voltage of 2.5 V. It was then charged in CC–CV mode at a constant current of 0.5 C (12.5 A) to a voltage of 3.65 V. The charging continued until the current dropped below 0.5 A and was held for an additional 30 s.

2.2. Preparation for Overcharge Experiment

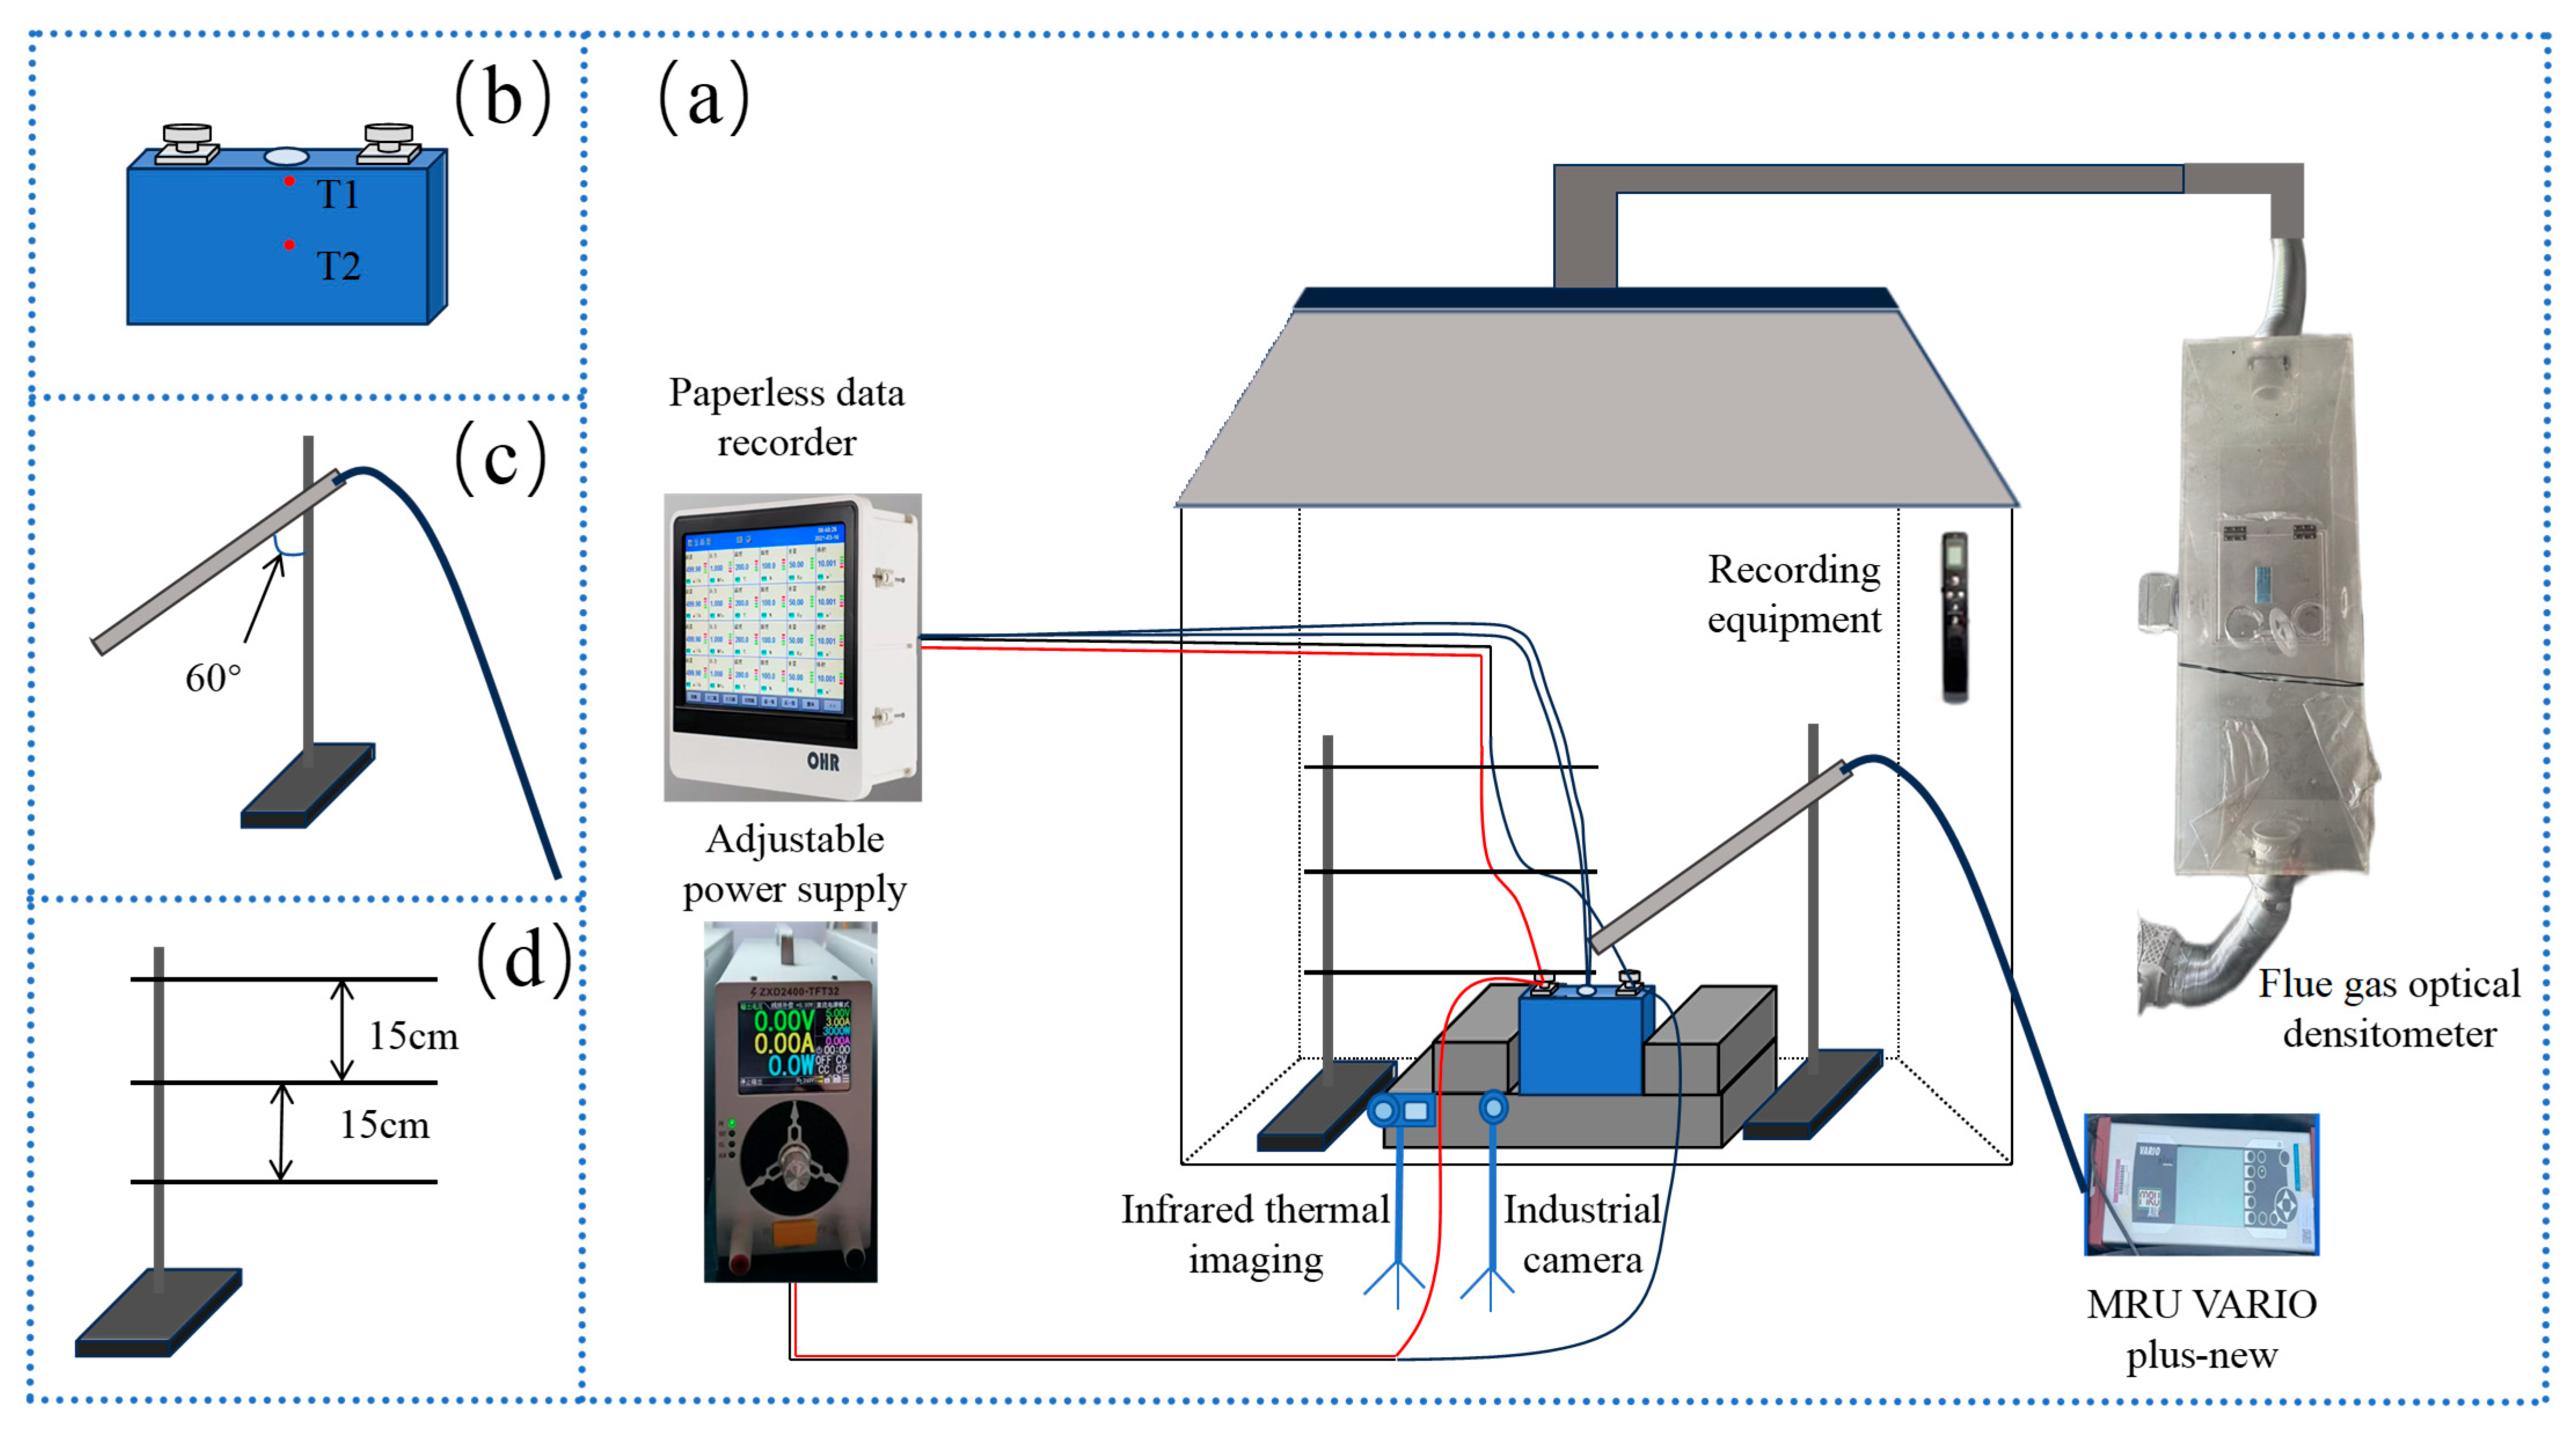
The overcharge experiments were conducted on the platform depicted in Figure 2a. Each battery was clamped using a fixture inside a thermostatic chamber, which was preheated to 35 °C for one hour before each test. Throughout the overcharge test, the ZTE 2400 (ZXD2400-TFT32-Produced by ZTE Corporation in Foshan, China) adjustable power supply was used for constant current charging at different rates with an accuracy of 0.01 V and 0.01 A. Two K-type thermocouples with a diameter of 1 mm were attached to the battery surface: one located under the safety valve and the other at the center of the battery surface, as shown in (Figure 2b), and their average value is calculated (as shown in Equation (1)). Three thermocouples spaced 15 cm apart were arranged 1 cm above the battery (Figure 2d) to record the temperature of the gases during TR. The temperature measurement range of the thermocouple is −200 °C–1300 °C with an accuracy of 0.1 °C. To ensure time sequence consistency of all data streams, the above temperature and voltage signals are collected by the Hongrun K728 (Produced by Hongrun Company in Fujian, China) paperless recorder at a collecting frequency of 1 s. The received voltage and temperature signals are recorded with a precision of 0.01 V and 0.1 °C, respectively. For signals with inherent physical latency, such as gas analyzer and camera data, temporal alignment was performed during the data preprocessing stage using synchronous core physical events (e.g., the safety valve opening sound or voltage drop) as common time anchors.
A gas sampling probe was positioned 5 cm above the battery (Figure 2c) to collect gases generated during the overcharge experiment for compositional analysis by an MRU flue gas analyzer. A recording device is placed in the thermostatic chamber to capture sound signals occurring during the overcharge process.
The experimental phenomena were captured by an industrial camera with a resolution of 1920 × 1080/30 fps. Infrared thermal imaging was recorded by Hikvision P20MAX V2 (Produced by Hikvision in Shenzhen, China). The mass loss during the experiment was measured by weighing the battery on an electronic balance with a maximum capacity of 2 kg and an accuracy of 0.1 g before and after each experiment.
T = T 1 + T 2 2

2.3. Experimental Procedure

To investigate the TR behavior of LFP batteries under different charging rates, a test matrix was designed, as detailed in Table 2. This matrix outlines the five experimental conditions used to collect multimodal signals during the TR process. To ensure the experimental stability and repeatability of the observed TR evolution, all five C-rate conditions were repeated at least twice, and the reported data are representative of the consistent phenomena observed across these trials.
According to the experimental procedure, the thermostatic chamber was turned on one hour prior to the test, with the temperature set to 35 °C. After connecting the battery sample to the data acquisition devices, it was placed inside the chamber. The overcharge power supply parameters were set according to the requirements of each test group (Table 2). The experiment was initiated once the temperature difference between the battery surface and the chamber environment was less than 1 °C and remained stable for at least 30 s.
The TR time (tr) is defined as shown in Equation (2) [35]:
t r = t n   w h e n   T n + 1 T n 2   ° C   a n d   V m V m + 1 10   V n > m
where tᵣ is the time of TR onset; m and n are time indices in seconds with a 1 s interval between m and m + 1, as well as n and n + 1; Tₙ is the average surface temperature at time n; and Vₘ is the voltage at time m.

3. Results and Discussion

3.1. Experimental Data Analysis

This section analyzes the multimodal data collected during the overcharge experiments, including voltage, temperature, the composition of generated gases, the toxicity and flammability of the gases, and various physical signals. Based on the evolution of these characteristic signals, the overcharge-induced TR process is divided into three distinct stages. This staged analysis provides a foundational dataset for integrating machine learning algorithms to enable early warning of TR stages and provides essential data support for constructing a decision-making matrix for emergency response actions.

3.1.1. Voltage and Temperature

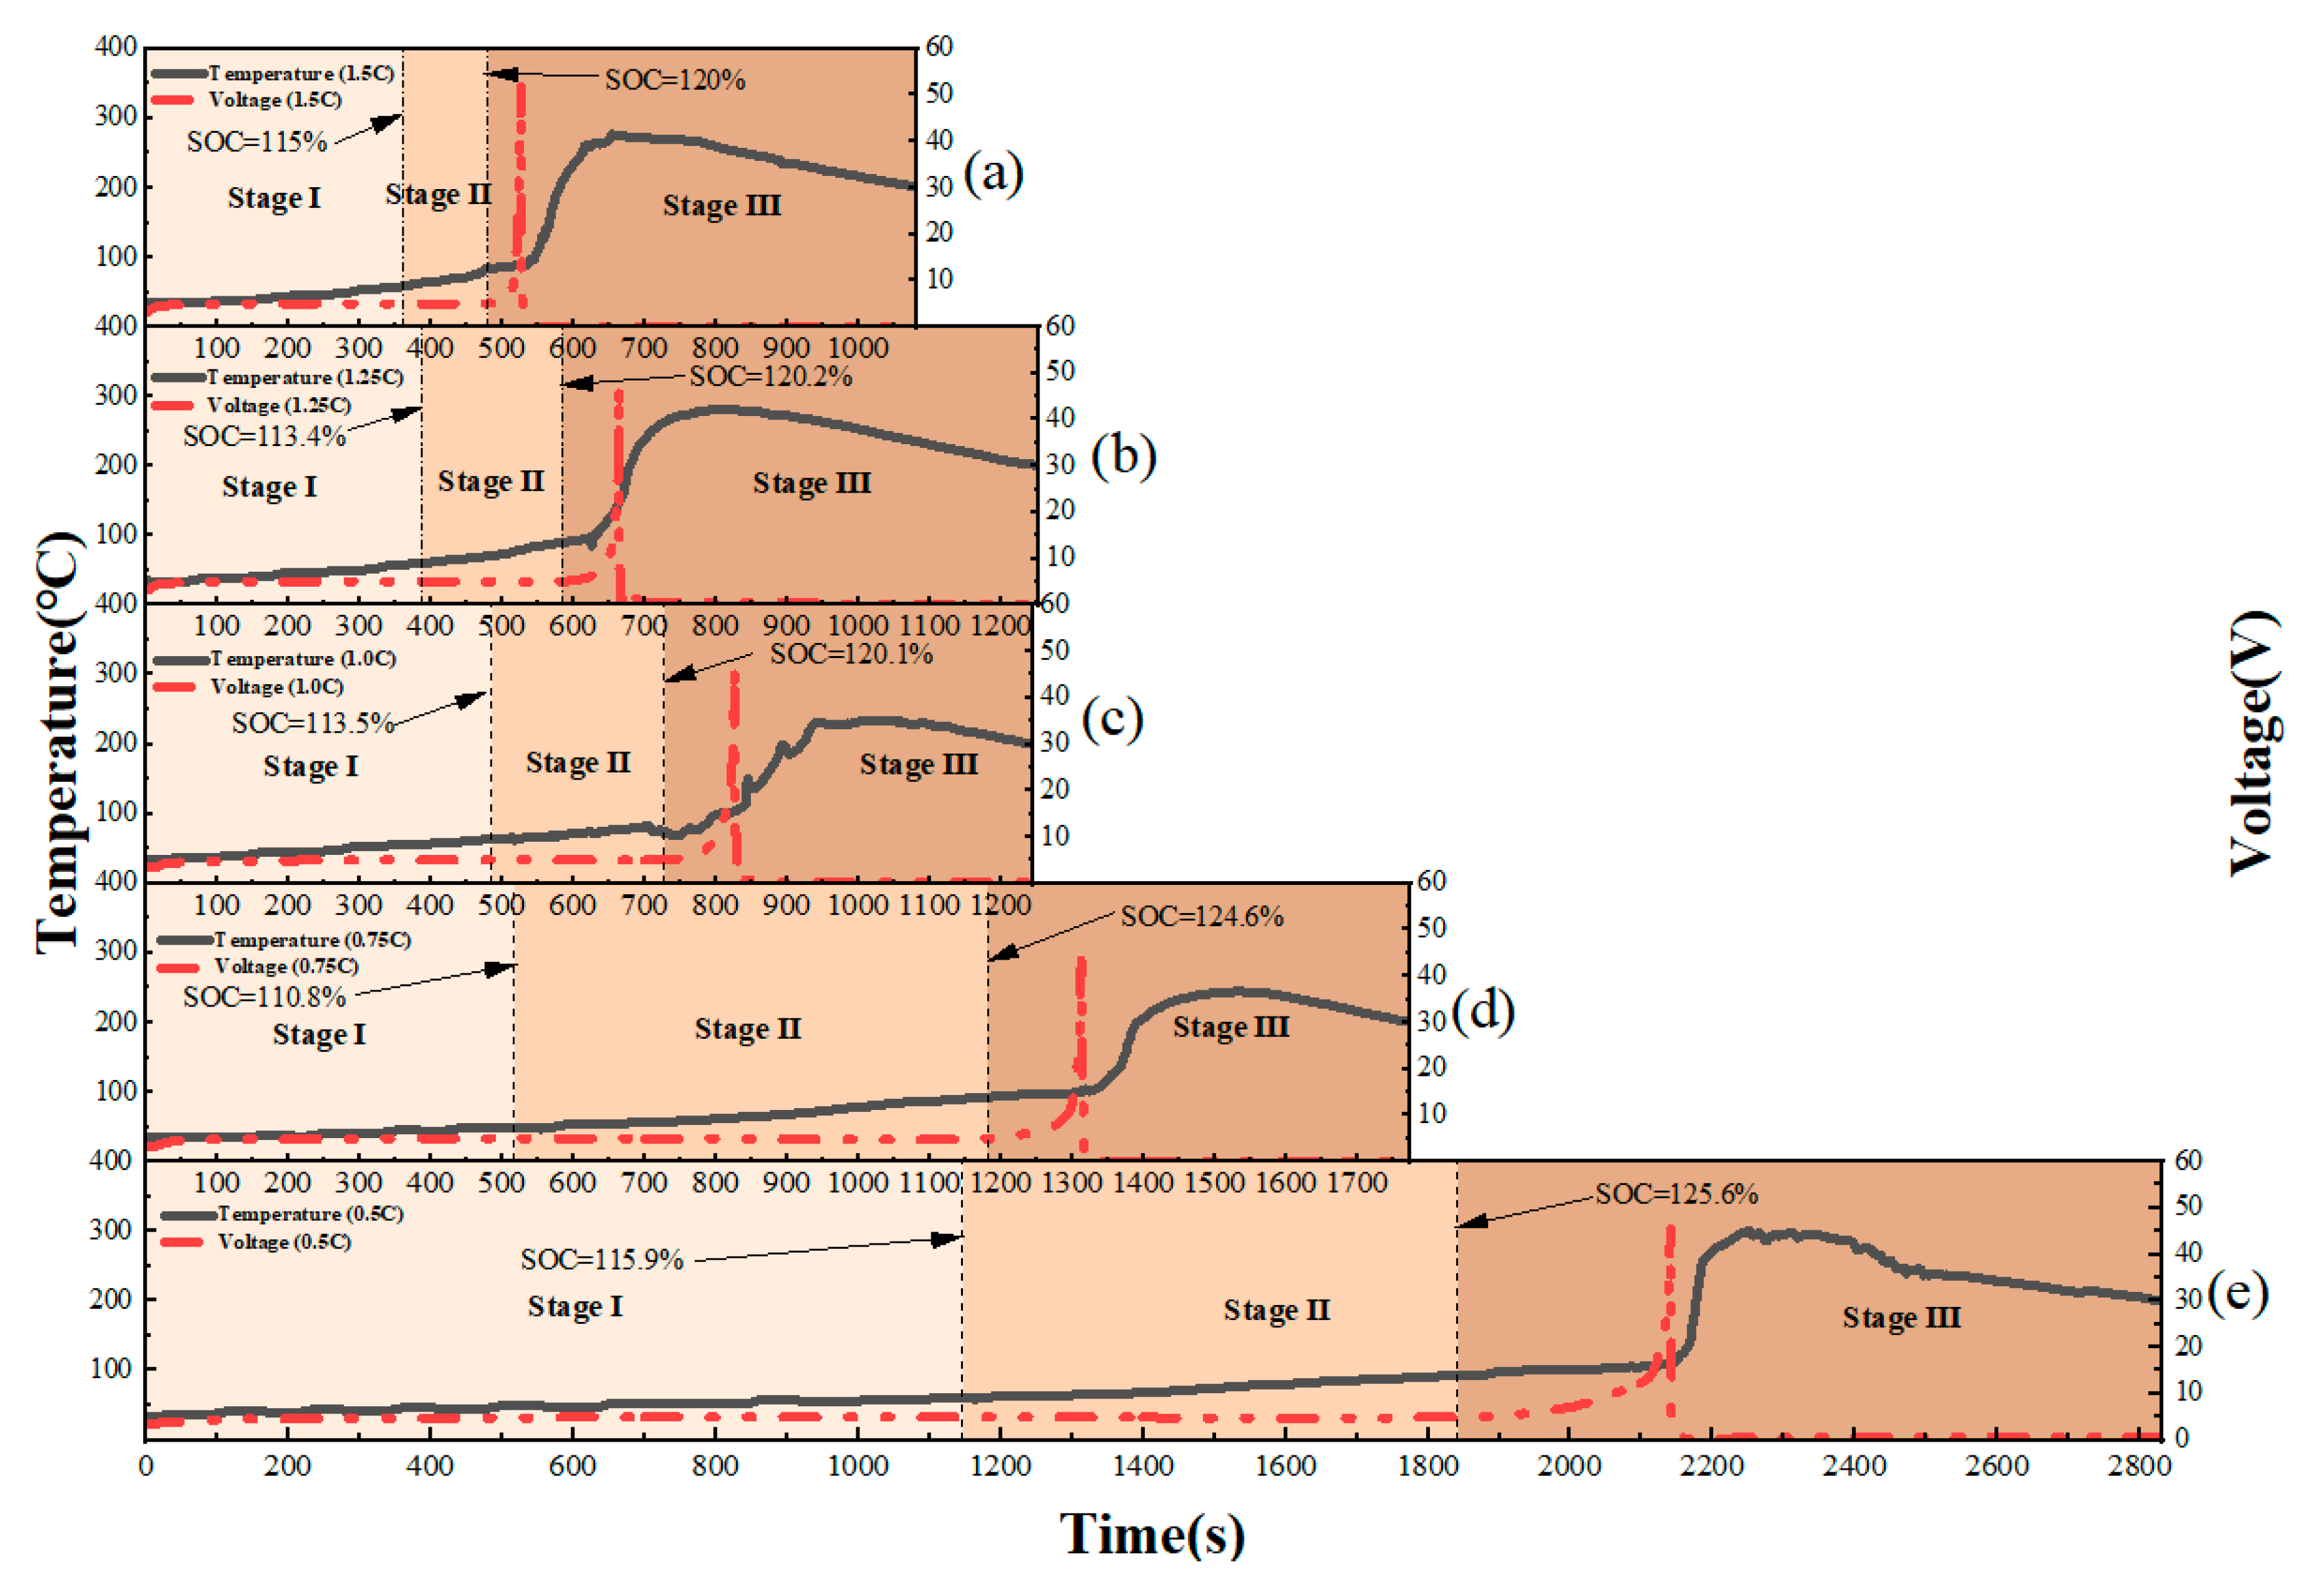
It is crucial to note that under normal charging conditions (terminated at 100% SOC) or during the stable rest phase, the battery exhibits stable temperature, voltage, and a complete absence of the characteristic gas emission or deformation signals described below. The distinct signal deviations detailed in the following stages are therefore exclusively attributed to the overcharge-induced thermal runaway process. As demonstrated in Figure 3, the temperature and voltage variations across the five test matrices are shown on a shared timeline, with Figure 3a–e corresponding to C-rates from 1.5 C to 0.5 C, respectively. As illustrated in the figure, the progression toward TR becomes slower as the overcharge rate decreases. All five test groups exhibited the same general TR pattern, with temperature and voltage showing synchronized rise-and-fall trends at different time points.
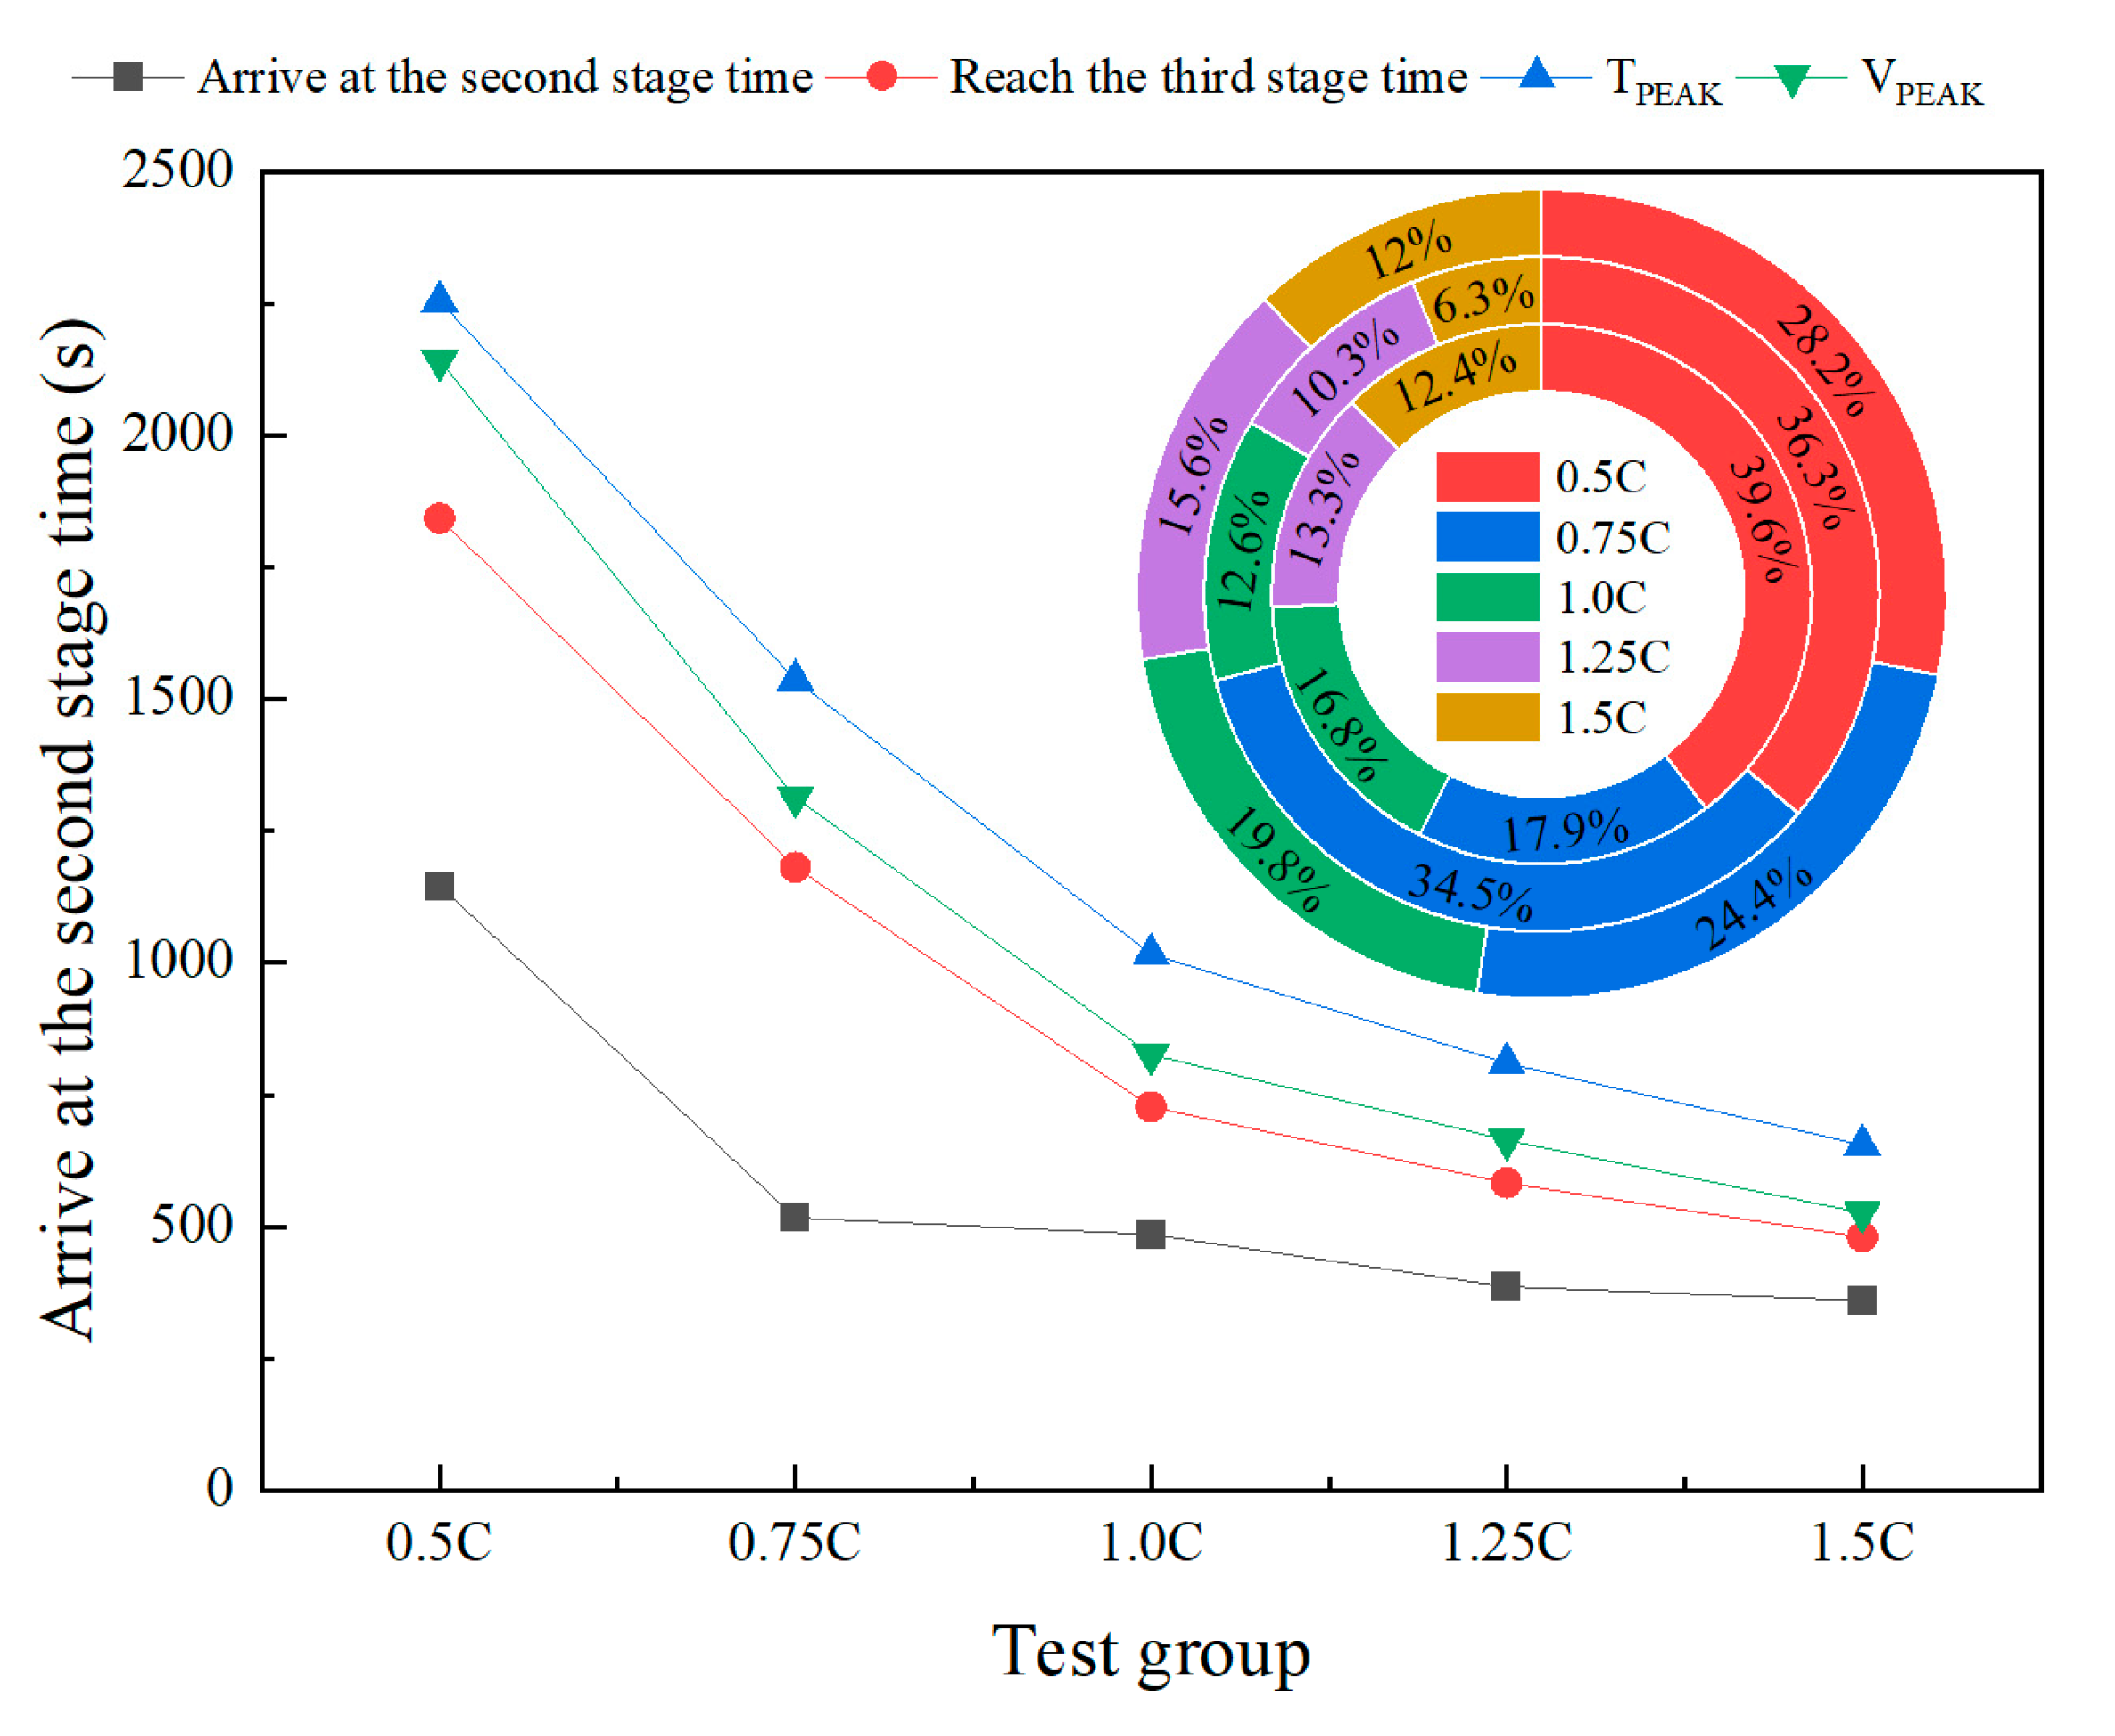
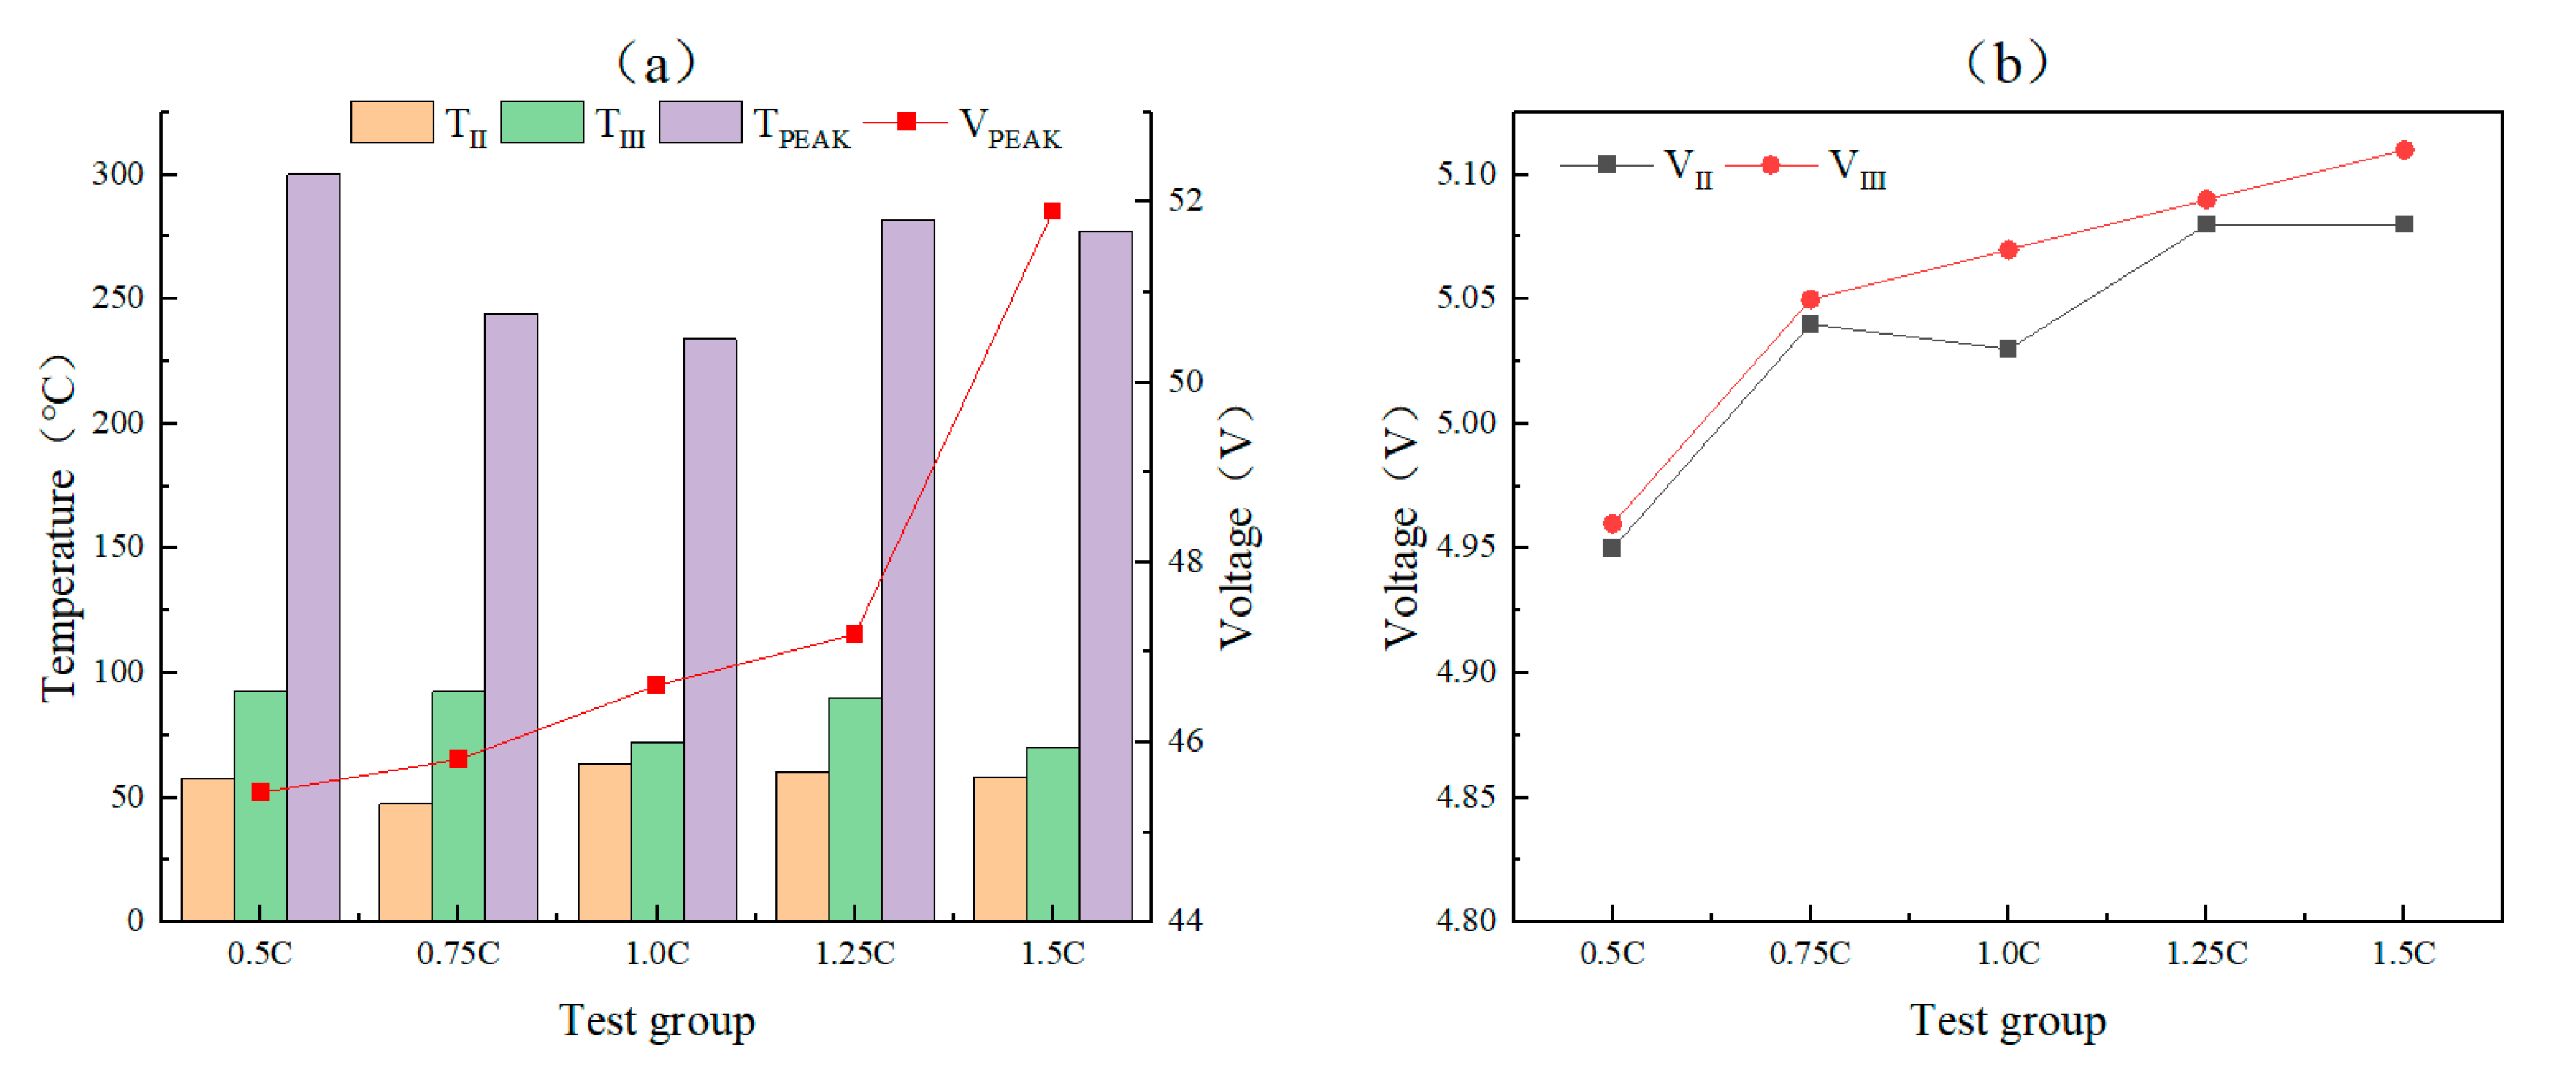
The entire overcharge-to-thermal-runaway process is demarcated into three stages: Stage I, from the start of overcharge to the opening of the safety valve; Stage II, from the safety valve opening to the recovery of voltage(voltage recovery is defined as exceeding the highest value of the voltage plateau [36,37]); and Stage III, from the sharp voltage/temperature rise to the final cooling. Since there is a lag in the dissipation of smoke after TR, in order to achieve time consistency of multimodal data, the end point of the third stage is defined as the battery cooling to 200 °C. That is, Stage Ⅲ is divided into two parts: TR caused by voltage and temperature rise, and slow heat dissipation and cooling after reaching the peak temperature. The occurrence time of each key event in the overcharge-TR process and the proportional duration ratio of the same stage in the five groups of tests are marked in Figure 4. In Figure 4, Stage Ⅲ only shows the temperature rise stage. The key events include the boundaries between stages and the peak temperature (TPEAK) and peak voltage (VPEAK). For each key event that appears in each TR stage, the temperature and voltage are recorded in Figure 5. Where T, T and VⅡ, V represent the temperature and voltage of the stage boundary points, respectively. Since the changes in V and V are relatively smaller than the temperature variations, they are shown separately in Figure 5b.
Stage Ⅰ: As overcharging begins, the battery voltage quickly exceeds the charge cutoff voltage and reaches the platform voltage in a short time, as the negative electrode approaches the lithium intercalation limit. The platform voltage is generated due to the disproportionation reaction [38]. Subsequently, the reaction between the lithium plating layer and the electrolyte results in a voltage drop. These reactions also generate gas, leading to swelling of the battery cell [39]. When the internal pressure exceeds the safety valve’s tolerance limit, the safety valve opens and releases gas and marking the transition to Stage II. In Figure 5, the voltage range of the Stage Ⅰ cutoff point of the five test groups is 4.95–5.05 V, the corresponding temperature range is 47.6–63.65 °C, and the SOC is between 110.8 and 115.9%. The primary contributors to the temperature rise are Joule heat and oxidative decomposition of the electrolyte [40].
Stage II commences with the opening of the safety valve and subsequent gas leakage. At this stage, the voltage shows a slow decline, while the temperature gradually increases. The gas produced by the internal reaction begins to escape, and the battery no longer deforms in this stage. When the positive electrode is over-de-lithiated and the SEI film becomes thicker, the internal resistance of the battery increases [41], accompanied by a corresponding increase in battery voltage. When the voltage exceeds the highest value of the platform phase, the battery enters the third stage. In Figure 5, the voltage range of the Stage Ⅱ transition point of the five test groups is 4.96–5.11 V, the temperature range is 70.35–92.6 °C, and the SOC is between 120% and 125.6%.
Stage III begins as the battery enters a deep overcharge state, and the voltage shows a sharp rise. The higher charging rate not only results in elevated platform voltage but also leads to a higher peak voltage, as shown in Figure 5. When the separator melts, direct contact between the positive and negative electrodes causes a sudden drop in voltage and release of a large amount of heat, triggering a chain reaction within the cell. At this time, the heat generated by the short circuit further increases the temperature, accelerating the internal reaction. This process releases a significant amount of heat and produces a large volume of smoke.
Figure 4 illustrates the temporal dynamics of the TR process, revealing a clear inverse relationship between the charging rate and the duration of each stage. By examining the proportion of time spent in each stage across different test groups in Figure 4, it can be seen that the duration of Stage Ⅰ of the 0.5 C group and the 1.5 C group accounted for 39.6% and 12.4%, respectively, and the duration of Stage Ⅱ was 6.3% and 36.3%, respectively. Comparing the duration of Stage Ⅰ of the two groups, it can be found that the duration of the 0.5 C group is about 3.19 times that of the 1.5 C group, with a difference of 27.2%. Similarly, the Stage II duration of the 0.5 C group is about 5.76 times that of the 1.5 C group, with a difference of 30%. Further comparison of Stage I and Stage II time proportions across the remaining groups indicates that as the charging rate increases, the difference in duration between Stage I and Stage II also increases. This suggest that when the charging rate is higher, the heat generated by internal chemical reactions begins to dominate earlier in the process, overtaking Joule heating as the primary source of heat generation.
In contrast, the influence of the charging rate on the duration of Stage III is less pronounced. The difference in duration between the 0.5 C and 1.5 C groups is only 16.2%. Although the high charging rate leads to a decrease in the proportion of Stage Ⅲ duration, the time from the beginning of Stage Ⅲ to the voltage peak increases with the decrease in the charging rate, that is, the high charging rate group undergoes voltage surge, short circuit and voltage drop within a shorter time frame, as shown in Figure 4.

3.1.2. Gas Production

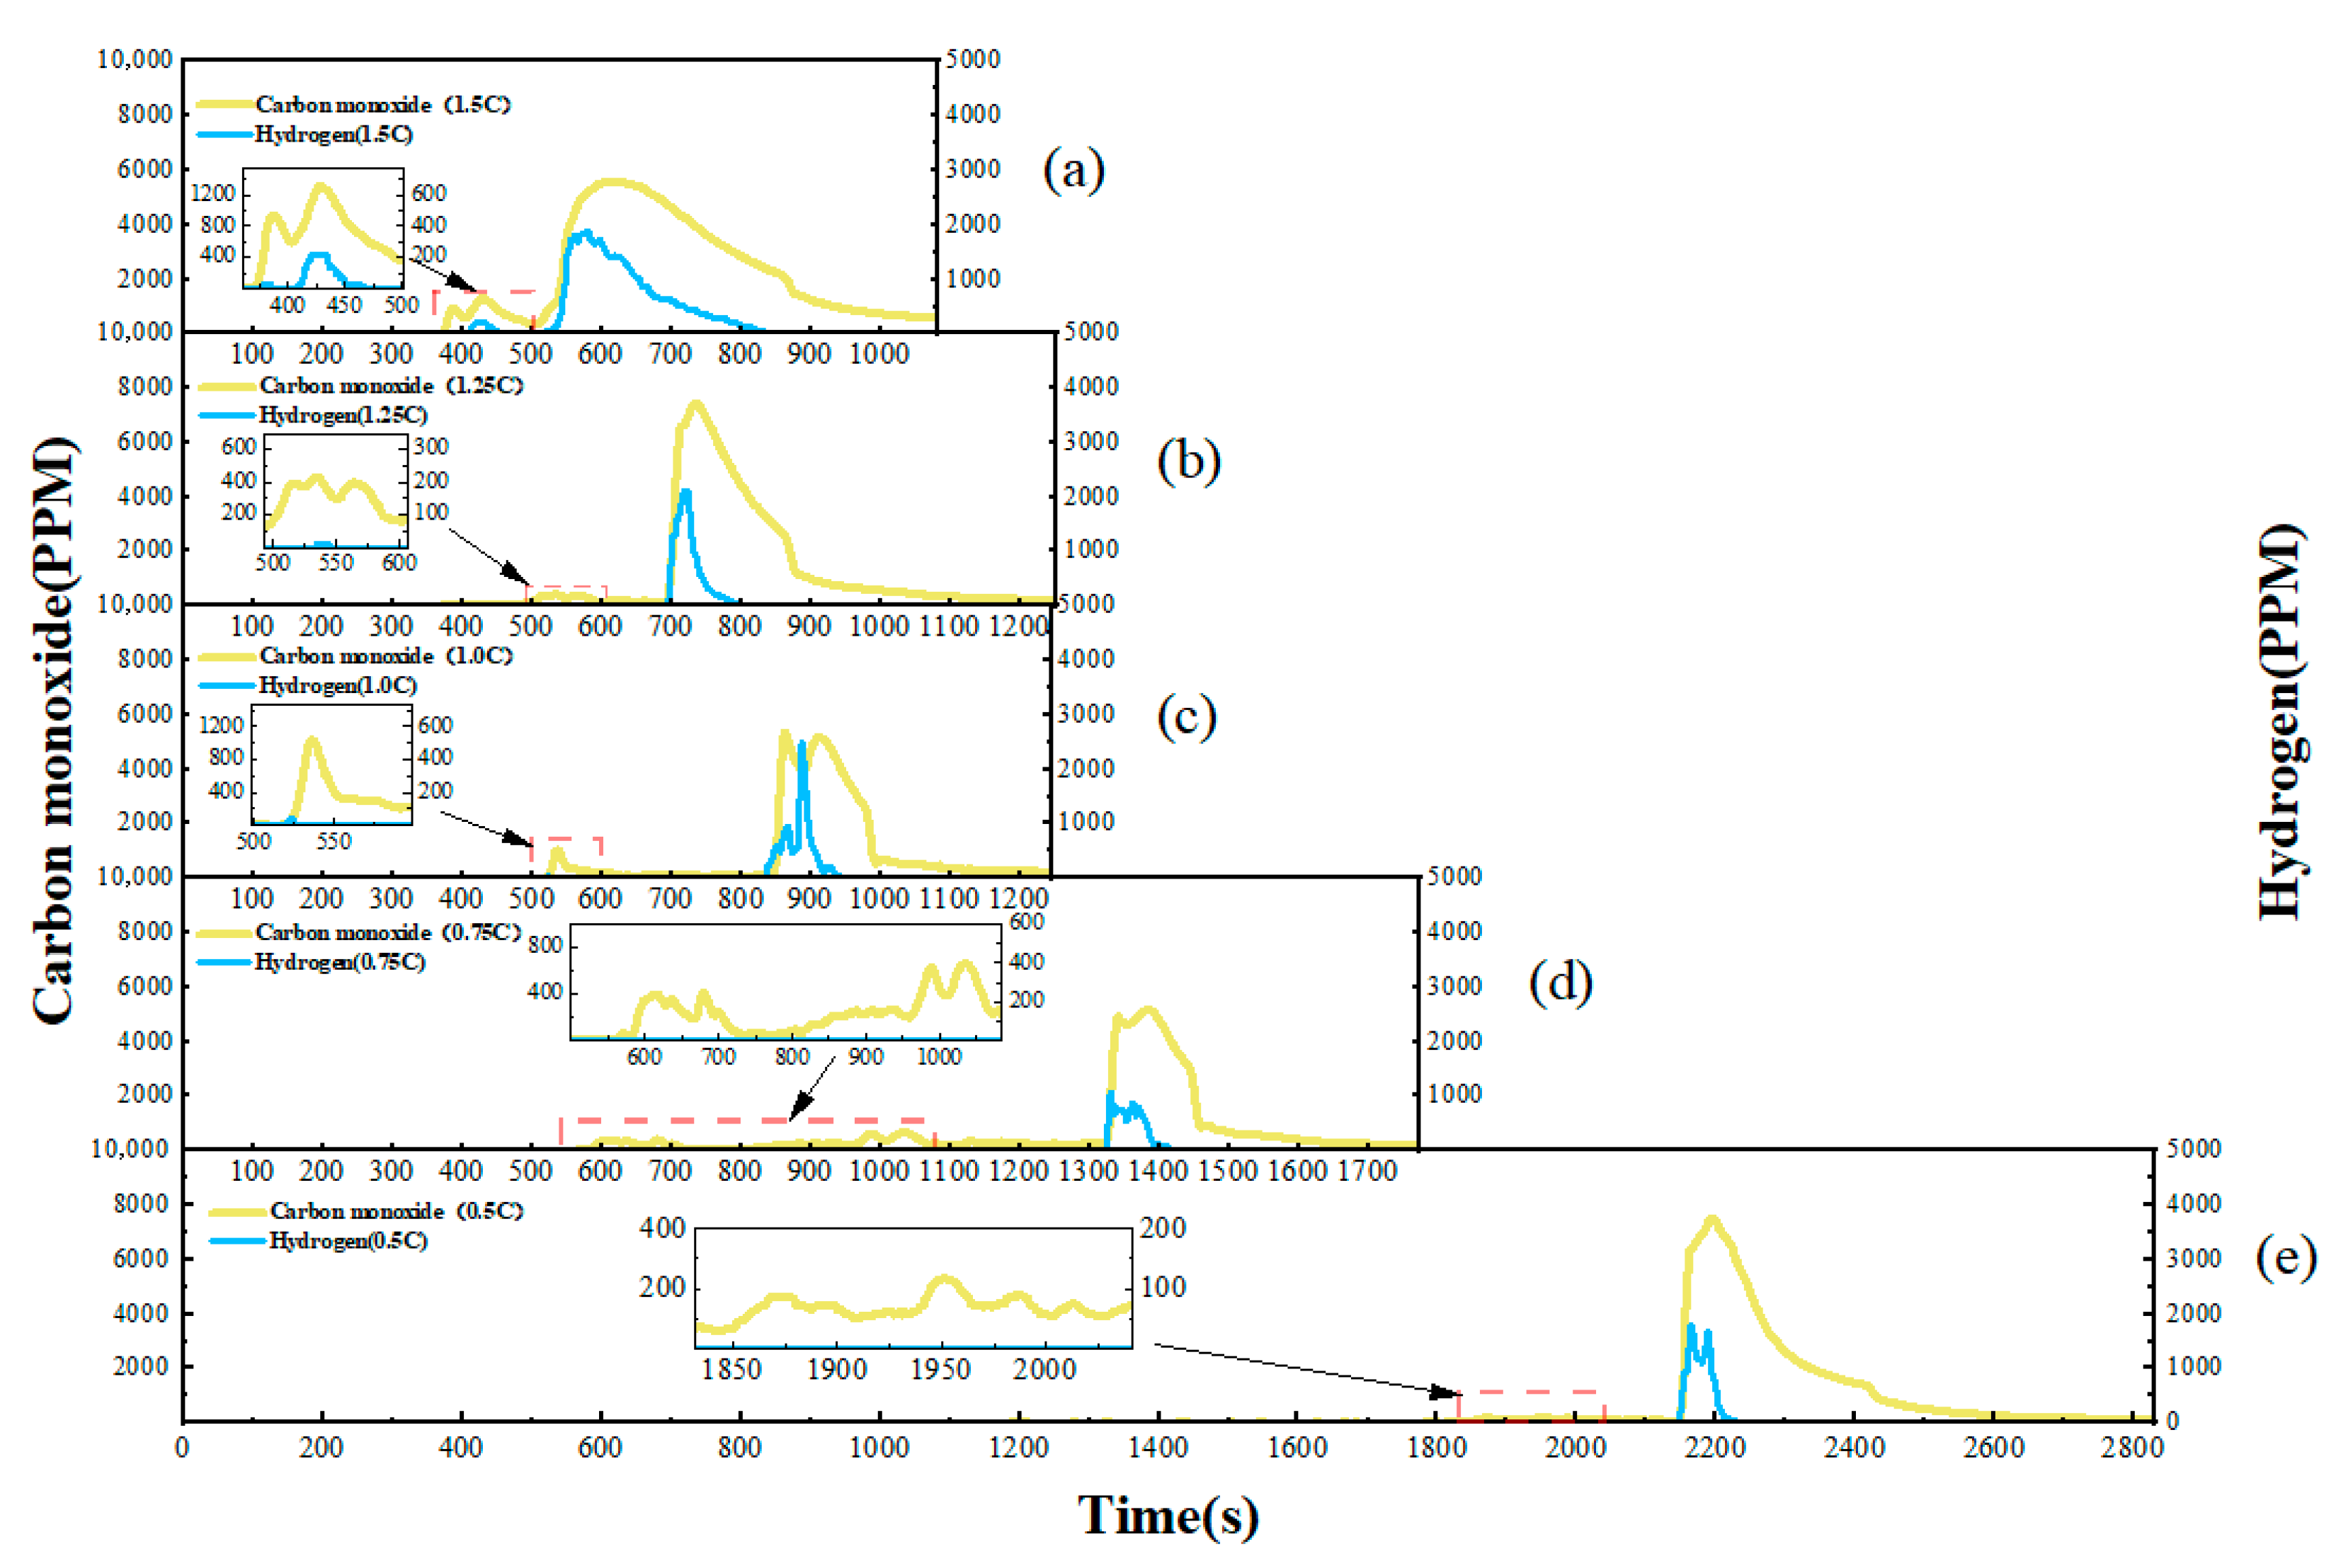
LFP batteries typically do not produce flames during TR but instead release a large volume of smoke. Therefore, real-time monitoring of smoke concentration and gas composition is critical for ensuring personnel safety and guiding emergency response decisions. Figure 6 presents the concentration profiles of carbon monoxide (CO) and hydrogen (H2), the primary gases generated during the overcharge-induced TR process. Their evolution is temporally correlated with the voltage and temperature data shown in Figure 3. It can be observed that both gases exhibit two distinct fluctuations during the TR process. Higher charging rates lead to an earlier onset of gas release, meaning that lower C-rates result in lower initial gas concentrations but longer monitoring durations in the early stages of overcharge–TR. The first fluctuation occurs after the opening of the safety valve (Stage II), while the second fluctuation appears during the intense TR of Stage III. A critical distinction was observed between the two gases: Among all five groups, CO was consistently detected in both fluctuation phases, whereas H2 only showed two distinct fluctuations in one test. Furthermore, the concentration of H2 was consistently lower than that of CO. This suggests that CO is more reliably detectable than H2 and may serve as a more effective early warning indicator for TR events.
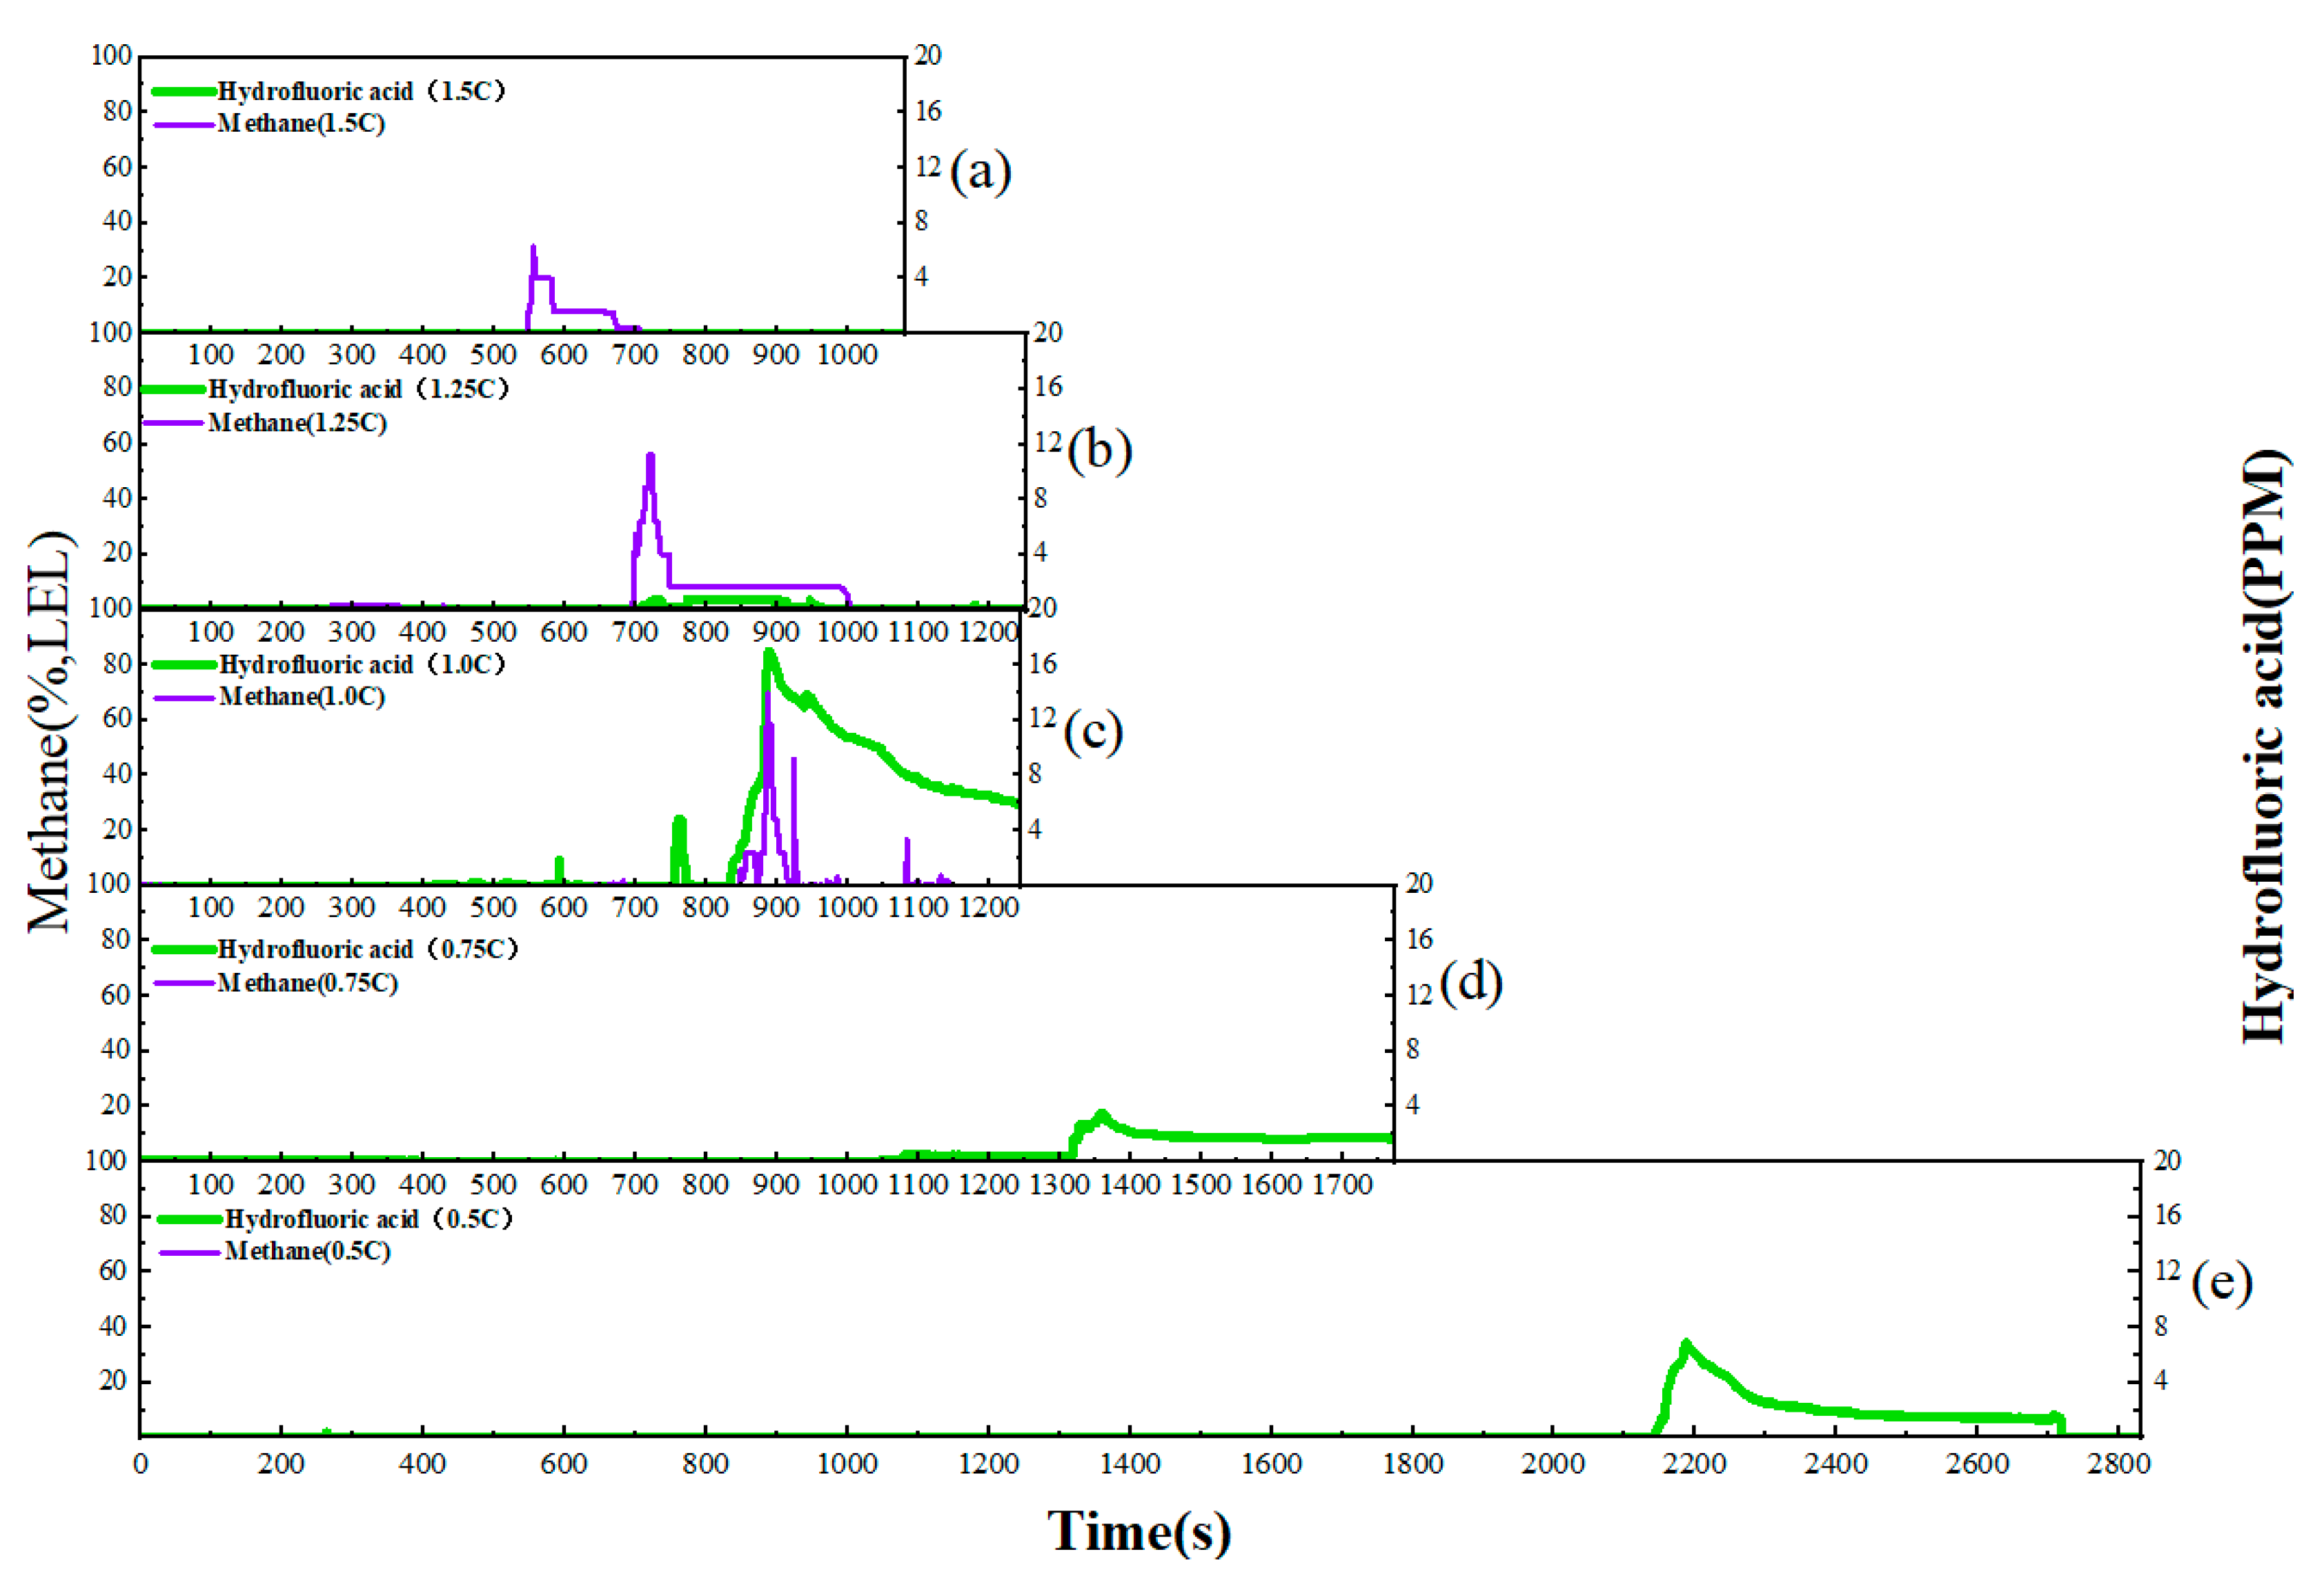
Figure 7 displays the measured concentrations of methane (CH4) and hydrogen fluoride (HF). The concentration of CH4 is presented as a percentage of its Lower Explosive Limit (%LEL), corresponding to a volume percentage range of 0–5%. Unlike CO, significant concentrations of CH4 and HF were detected simultaneously in only two of the five test groups. This inconsistent and delayed detection makes both CH4 and HF less suitable as early warning signals for TR.
Due to the toxicity, flammability/explosiveness, and asphyxiation risk associated with the four key gases, it is important to consider their threat to both rescue personnel and trapped individuals. The international standard (ISO 13571) [42] toxic gas model FED (Fractional Effective Dose) is used to evaluate the hazardousness of smoke at different charging rates, including CO and HF. The detailed formula is shown in Equation (3).
Based on the time-resolved concentration of CO and HF, the FED index was calculated for each C-rate. The resulting FED values were: 0.792 (1.5 C), 0.524 (1.25 C), 0.467 (1.0 C), 0.443 (0.75 C), and 0.617 (0.5 C). When FED ≥ 1, it means that the actual cumulative dose of exposure reaches or exceeds the median lethal dose, and 50% of the animals exposed to the gas mixture would suffer fatal harm [43]. This suggests that if two or more cells undergo overcharge-induced TR, the resulting toxic gas concentrations could pose a serious life-threatening risk to both rescue personnel and trapped individuals.
F E D = t 1 t n C i Δ t L C 50 , i = t 1 t n φ 1 2,100,000 + φ 2 30,000 Δ t
Ci is the concentration of gas i, LC50,i is the median lethal concentration of the gas, t is the exposure time, and Δt = 1 s. The threshold is considered hazardous when FED ≥ 1. φ 1 is the CO concentration, φ 2 is the HF concentration. The CO cumulative dose limit is 35,000 ppm·min equivalent to 2,100,000 ppm·s. In the FED model, HF is typically treated with an individual threshold, and in this study, the cumulative dose limit for HF is set to 30,000 ppm·s.
The flammability hazard of the vented gas mixture was analyzed using Le Chatelier’s principle. Given that, in real-world scenarios, the gas release during TR is extremely brief and individual cells are typically housed in well-sealed battery enclosures, temporal alignment of the three combustible gases is not considered. Instead, the peak concentrations of the three primary flammable gases (CH4, CO, H2) from each test are used for the calculation. The detailed formula is as follows: Equations (4)–(8).
C 1 = 5 % × C H 4 % L E L 100 , C 2 = C O p p m 10,000 , C 3 = H 2 p p m 10,000
C t o t a l = C 1 + C 2 + C 3
y 1 = C 1 C t o t a l , y 2 = C 2 C t o t a l , y 3 = C 3 C t o t a l
L E L m i x = 1 y 1 L E L 1 + y 2 L E L 2 + y 3 L E L 3
U E L m i x = 1 y 1 U E L 1 + y 2 U E L 2 + y 3 U E L 3
where Cᵢ is the concentration of an individual flammable gas component i; Ctotal is the total concentration of the flammable gas mixture; yᵢ is the volume fraction of each component in the gas mixture; LELmix and UELmix are the lower explosion limit and upper explosion limit of the mixed gas, respectively. If the condition LELmix ≤ Ctotal ≤ UELmix is satisfied, the gas mixture is considered to pose an explosion risk. The explosion limits (LEL/UEL) of the three gases are listed in Table 3.
The concentrations of mixed flammable gases in five test groups and their corresponding explosion limits are shown in Table 4. Although CH4 is difficult to detect reliably, it can be seen from the three test groups of 1.0 C–1.5 C that the explosion limit of mixed combustible gases falls approximately between 5% and 20%. A single LFP battery undergoing TR does not pose an explosion risk. However, if two or more cells enter TR within a confined space, the risk of explosion should be taken into account.

3.1.3. Smoke Visibility and Jet Temperature

Beyond gas toxicity and flammability, gas generation characteristics is another critical aspect of TR, impacting both rescue safety and evacuation. Smoke generation serves not only as a visual indicator of TR but also directly affects visibility and thermal conditions for rescue personnel. Real-time monitoring of smoke visibility helps identify the optimal rescue window, ensuring that the smoke produced during TR does not obscure rescue visibility or block evacuation routes. Additionally, smoke temperature data can help minimize injury risk by guiding safe entry timing for first responders. In the field of fire safety and optical sensing, the light transmittance (P) and extinction coefficient (µ)are key parameters for evaluating smoke concentration and visibility. These parameters can be derived based on the Beer–Lambert Law, as shown in Equations (9) and (10).
P = I I 0 = e μ L
μ = 1 L ln I I 0
where I is the light intensity after passing through the smoke, I0 is the incident light intensity, and L is the optical path length of 0.66 m. Visibility V is usually estimated using the extinction coefficient µ.
V = K μ
K is a constant usually taken as 8 (and 3 for reflective signs). Since the charging rate has little effect on the smoke visibility and smoke temperature during TR, only the smoke transmittance and extinction coefficient of the 1.5 C group are selected as Figure 8a, and the smoke temperature of the 0.5 C test group is Figure 8b.
The standard light extinction coefficient commonly used in building fires is 0.5 m−1, it means that the visibility is 6–16 m. Figure 8a reveals that during severe TR, visibility remains below 1 m for approximately 150 s. This extremely low visibility in the initial phase of the event severely hampers rescue efforts and suggests that initial response should prioritize remote cooling over direct entry. Figure 8b records the temperature of the high-temperature gas jet when severe TR occurs. No temperature signal was detected at 20 cm and 35 cm above the safety valve in the early stage, which shows that in Stage Ⅰ and Stage Ⅱ of overcharge-TR, although there is gas ejection from the safety valve, the temperature and pressure of the ejected gas are low. When severe TR occurs, the gas temperature near the battery safety valve is almost as the high as the battery itself, and the gas temperature at 20 cm and 35 cm reaches about 90 °C and 60 °C, respectively. For rescue personnel, in addition to taking good respiratory protection, they should also pay attention to avoid being burned by high-temperature gas when moving combustible materials.

3.1.4. Physical Signals

(1)
Internal Pressure, Deformation, and Mass Change
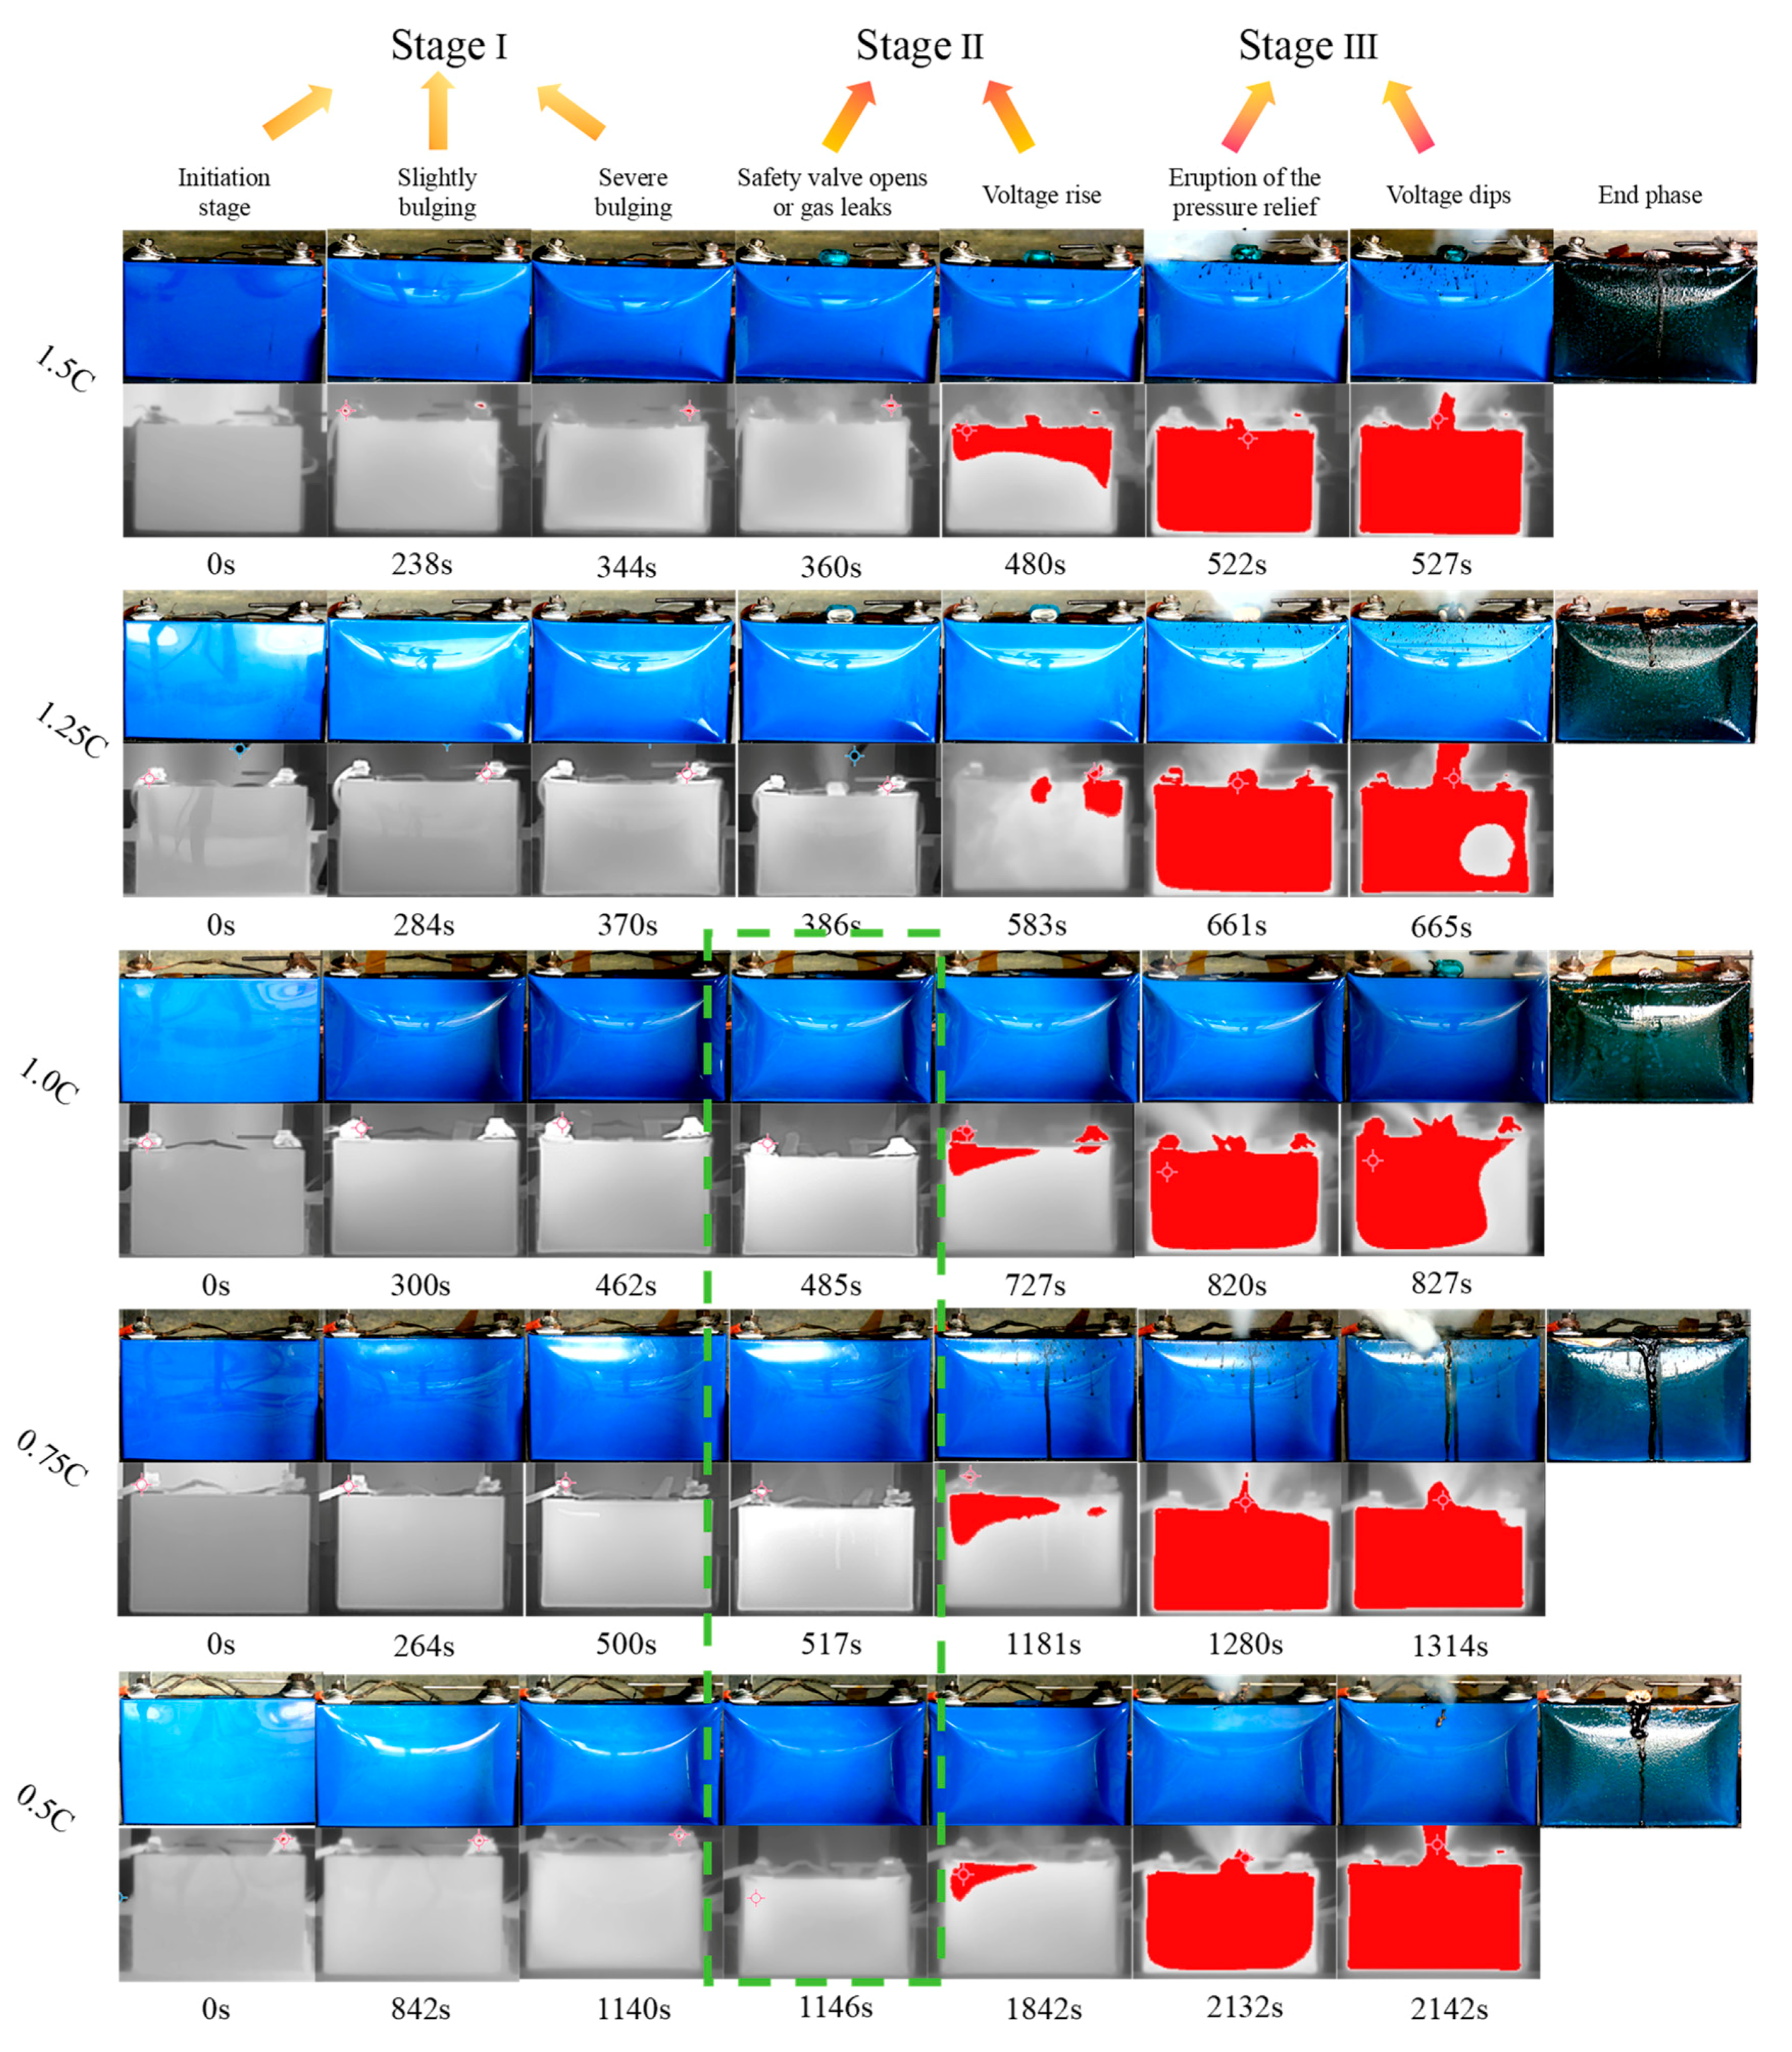
Significant physical deformation is a key characteristic of Stage I during the overcharge process. This deformation is primarily driven by a rapid buildup of internal pressure, resulting from gas generation and temperature rise, which ultimately exceeds the mechanical tolerance of the battery’s aluminum casing. Figure 9 shows infrared thermal imaging (the ice-fire false color scale is used only to indicate the transfer and concentration of internal hotspots and is therefore not accompanied by a color bar) and the visual deformation characteristics observed during the TR process for each test group. These include: slight and severe deformation, safety valve activation or gas leakage, voltage recovery, safety valve eruption, and sudden voltage drop.
Deformation typically occurs during Stage I of overcharge-induced TR. It results from the increased internal pressure caused by gas generation and temperature rise from internal reactions, which exceeds the mechanical limits of the aluminum casing. The changes in mass and thickness of five groups of battery samples before and after the experiment were recorded in Table 5. The results show that the battery under different charging rates has minimal difference in deformation (thickness change) and mass loss, indicating that: (1) The charging rate does not substantially change the reaction path and final runaway result of the battery, but mainly affects the time process of its TR; (2) Significant deformation occurs under all tested charging rates, appearing earlier at higher rates, and may serve as an early physical indicator of Stage I.
Considering that some batteries do not have built-in pressure sensors, the amount of deformation can be used to represent the internal pressure changes during Stage I. When the internal pressure approaches the safety valve’s limit, the battery is at risk of the safety valve popping open. This paper estimates the internal pressure change based on the deformation of the battery casing. According to the material mechanics theory, the battery deformation and internal air pressure change can be correlated and modeled through Equations (12) and (13), thereby indirectly obtaining the pressure change trend of the battery in Stage Ⅰ, providing a reference for assessing the risk of safety valve activation.
L = P i n t e r n a l · r 2 E · d
P i n t e r n a l = L · E · d r 2
ΔL is the battery deformation, Pinternal is the internal pressure of the battery, r is the battery radius, E is the elastic modulus of the casing material, and t is the casing thickness.
Further observation confirms that deformation ceases upon entering Stage II and the subsequent release of pressure via the safety valve, indicating that deformation primarily occurs during Stage I. Therefore, the visible deformation of the battery can be utilized not only as a crucial early warning indicator for Stage I but also as a means to estimate the internal pressure level, providing a practical basis for non-invasive safety monitoring.
(2)
Acoustic Signals
In response to the internal pressure buildup during the early stages of overcharge, the safety valve exhibits two distinct pressure relief mechanisms, each generating a unique acoustic signature. These mechanisms are: (i) the valve pops open, causing a sudden release of gas; or (ii) the valve ruptures, allowing gas to escape through the crack. Both mechanisms serve to equalize the internal and external pressure of the battery. In Figure 9, the green-shaded area represents the rupture group.
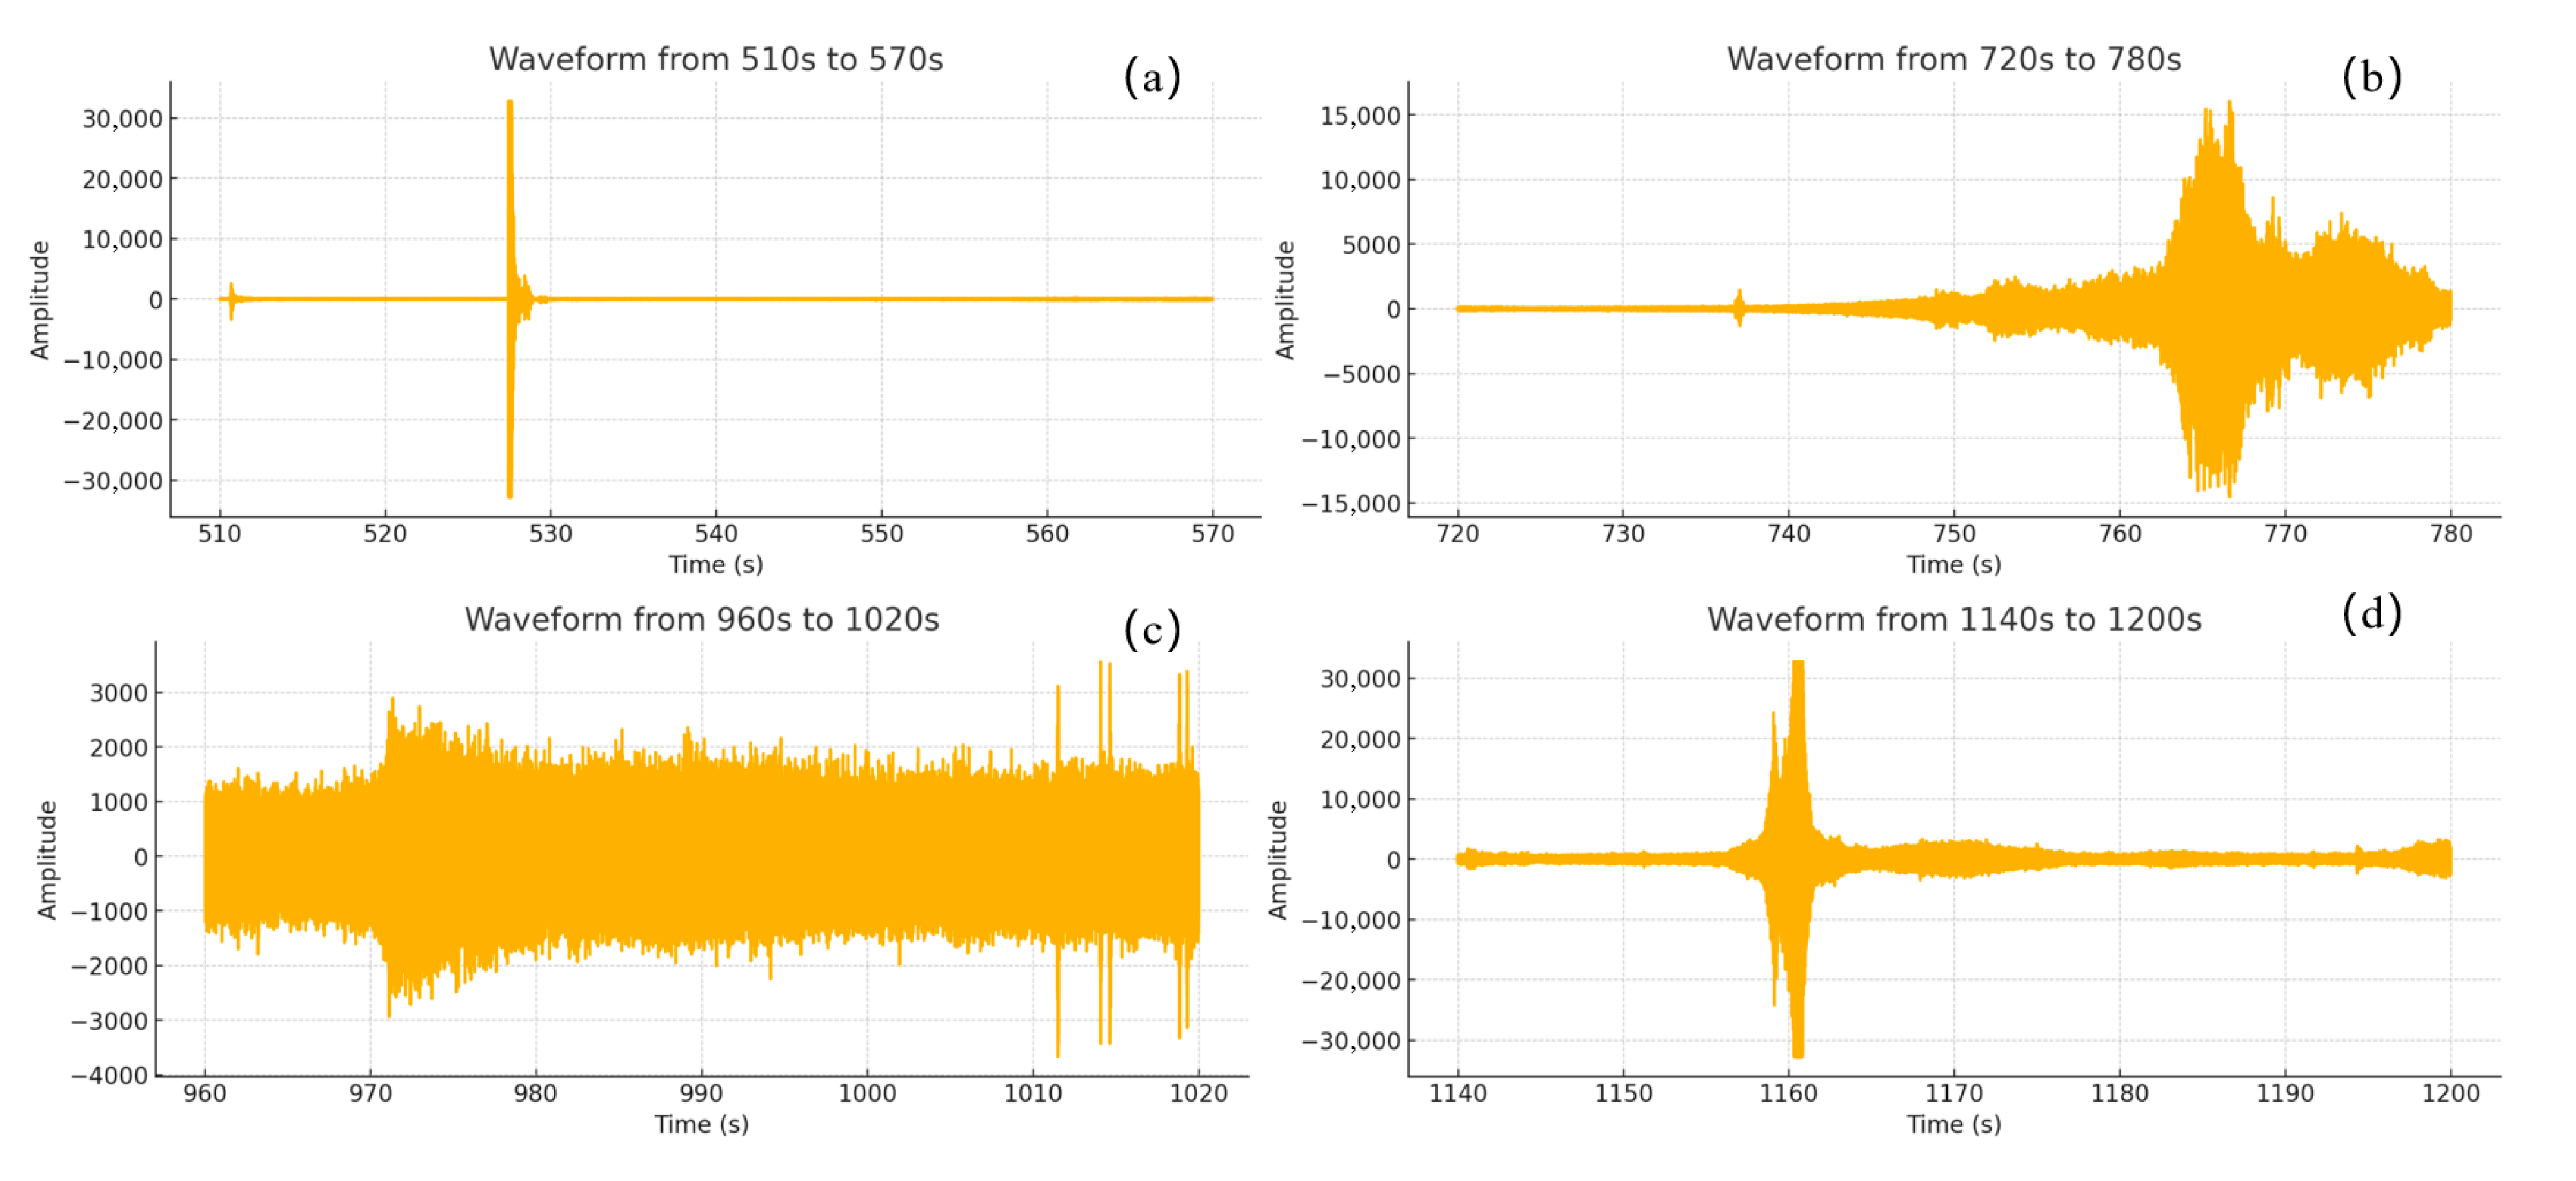
The acoustic signatures corresponding to these two mechanisms are presented in Figure 10. Figure 10a,b correspond to the safety valve pop-open group, while Figure 10c,d correspond to the safety valve rupture group:
In the pop-open group, two types of acoustic signals are observed during the TR process. The first occurs at the boundary between Stage I and Stage II, representing the sound of the safety valve popping open. This signal is characterized by a loud, brief noise with a large amplitude and short duration, as shown in (Figure 10a). This sound marks the onset of Stage II. The second type occurs in Stage III and features two major fluctuations. The first fluctuation corresponds to the ejection of gas from internal reactions. The second, larger fluctuation occurs when the battery short-circuits, leading to a rapid temperature rise and more intense reactions, generating additional gas that is violently expelled. These two acoustic events signal the progression of the chain reaction within Stage III.
In contrast, no explosive sound is produced at the stage boundary in the safety valve rupture group. Instead, as shown in Figure 10c, a sharp, continuous hissing noise was generated as high-velocity gas jet escapes through the crack. When entering Stage III, the severe TR can still cause the safety valve to pop open, accompanied by gas ejection. The resulting acoustic signature (Figure 10d) is a hybrid of the two modes: it begins with the hissing characteristic of the rupture (similar to Figure 10c) and is followed by the two large fluctuations characteristic of a Stage III ejection event (similar to Figure 10b).

3.1.5. Summary

This section has presented a systematic analysis of the multimodal data (voltage, temperature, gas, deformation, and sound) from overcharge-induced TR experiments on LFP batteries across five distinct C-rates. The main conclusions are as follows:
(1) Establishment of a Three-Stage Evolution Model: Based on the typical variation patterns of voltage and temperature, the complex overcharge-induced TR process was successfully demarcated into three distinct stages: Stage I (from the onset of overcharging to safety valve activation), Stage II (from safety valve activation to voltage recovery), and Stage III (intense reaction through to cooling. This model provides a structured framework for subsequent feature identification and early warning strategies.
(2) Clarification of the Core Impact of C-Rate: Experiments show that the increasing the charging rate will significantly shorten the overall time of TR, especially the incubation period of Stage I. Additionally, higher charging rate leads to more intense gas release, thereby increases the toxicity index (FED) and the explosion risk, revealing the direct impact of charging rate on the severity of battery incidents.
(3) Identification of Key Stage-Specific Warning Signals: In addition to the temperature and voltage signals throughout the whole process, this study found that there is a unique combination of characteristic signals in each stage, as shown in Table 6. Among them, battery deformation is the iconic physical signal of Stage I; the sound of the safety valve opening or rupturing marks the onset of Stage II; and the two step rise in CO concentration correspond to the initiation of Stage II and Stage III, making it valuable early warning indicators.
In summary, multimodal signals show highly regular and recognizable characteristics across different stages of TR. These quantitative and reliable experimental data not only deepen the understanding of the TR mechanism of LFP batteries, but also lay a solid foundation for the construction of intelligent early warning and emergency decision-making models based on machine learning.

3.2. Multi-Stage TR Early Warning and Emergency Response Model Based on Machine Learning

This section details the development of an end-to-end, closed-loop management framework for the overcharge-induced TR process in LFP batteries. The framework comprises four core modules: data preprocessing, model training, early warning identification, and emergency response decision-making. Based on three types of data patterns, two distinct modeling approaches were developed to address different application scenarios: (1) a fusion-based ensemble model for robust multi-rate warning, and (2) a time-series-based LSTM model for high-precision single-rate identification. This dual-model approach achieved >95% accuracy for “multi-rate full coverage” scenarios and >99% accuracy for “high-precision single-rate” scenarios. Beyond phased risk warnings, the framework incorporates a three-dimensional emergency decision matrix for Stage III, which integrates toxicity index (TI), flammability index (FI), and visibility (V). This matrix, developed with reference to NFPA standards, provides quantitative, real-time guidance for deploying appropriate rescue strategies. By monitoring the real-time data and outputting the real-time hazard index, the model assists emergency responders in accurately and rapidly assessing the severity of incidents and formulating appropriate rescue plans.

3.2.1. Multimodal Data Preprocessing and Modeling Methods

(1)
Data Preprocessing
Two types of datasets, consisting of three distinct groups, were constructed from the multimodal experimental data to investigate the overcharge-to-thermal-runaway process: The first type includes non-temporal multimodal training sets, comprising five complete datasets for single C-rates and one fused dataset for multiple C-rates. The second type contains LSTM training sets with temporal features, providing time-segmented representations of complete data at individual C-rates.
These datasets were used to develop both fusion-based and LSTM-based early warning models. For the single C-rate datasets, five early warning models (spanning 0.5 C to 1.5 C) were built using the fusion model for the non-temporal datasets, while the temporal single C-rate datasets were used to construct five corresponding models under the LSTM approach. For the fused dataset, a multi-C-rate early warning model was developed using the fusion model. These models enable stage-wise identification and risk prediction of TR events.
(2)
Modeling Method
Modeling Method The selection of five C-rate groups is justified by the nature of the data: each experiment generates a high-frequency, long-duration time-series dataset, resulting in thousands of individual, stage-classified data points per C-rate. This rich temporal data, especially when aggregated into the Multi-C-rate fused dataset, provides sufficient feature diversity and volume for robust training of both traditional ML (Fusion) and deep learning (LSTM) models.
The fusion model is an ensemble method integrating four base learners: Random Forest (RF), Gradient Boosting Decision tree (GBDT), Support Vector Machine (SVM) and Multilayer Perceptron (MLP). By training the TR warning based on multimodal signals for the single C-rate dataset and the multi-C-rate fusion dataset, the model employs a majority voting strategy to aggregate the predictions from the base learners when outputting the final classification. That is, for any input sample X, let yi be the predicted category of the i-th model, and the final output category is:
y ^ = mode y 1 , y 2 , y 3 , y 4
The LSTM model adopts a two-layer stacking architecture, with an input dimensionalit of 8 dimensions (excluding time), each layer contains 64 hidden units, followed by a fully connected classification layer. During training, cross entropy is used as the loss function during training, and the Adam optimizer is employed with an initial learning rate of 1 × 10⁻³. The model is trained for a total of 20 epochs. While taking into account the depth of time series modeling and training efficiency, this structure can better adapt to the nonlinear and multi-stage evolution characteristics of the battery TR process. For the Fusion-based ensemble model, all base learners (RF, GBDT, SVM, MLP) were trained using a 5-fold cross-validation strategy on the entire dataset to ensure generalization. Specifically, the Random Forest (RF) and Gradient Boosting Decision Tree (GBDT) models were optimized for maximum depth and number of estimators; the Support Vector Machine (SVM) used a Radial Basis Function (RBF) kernel with optimized C and Gamma parameters; and the Multilayer Perceptron (MLP) was configured with a two-layer hidden architecture and trained using the Adam optimizer with cross-entropy loss.
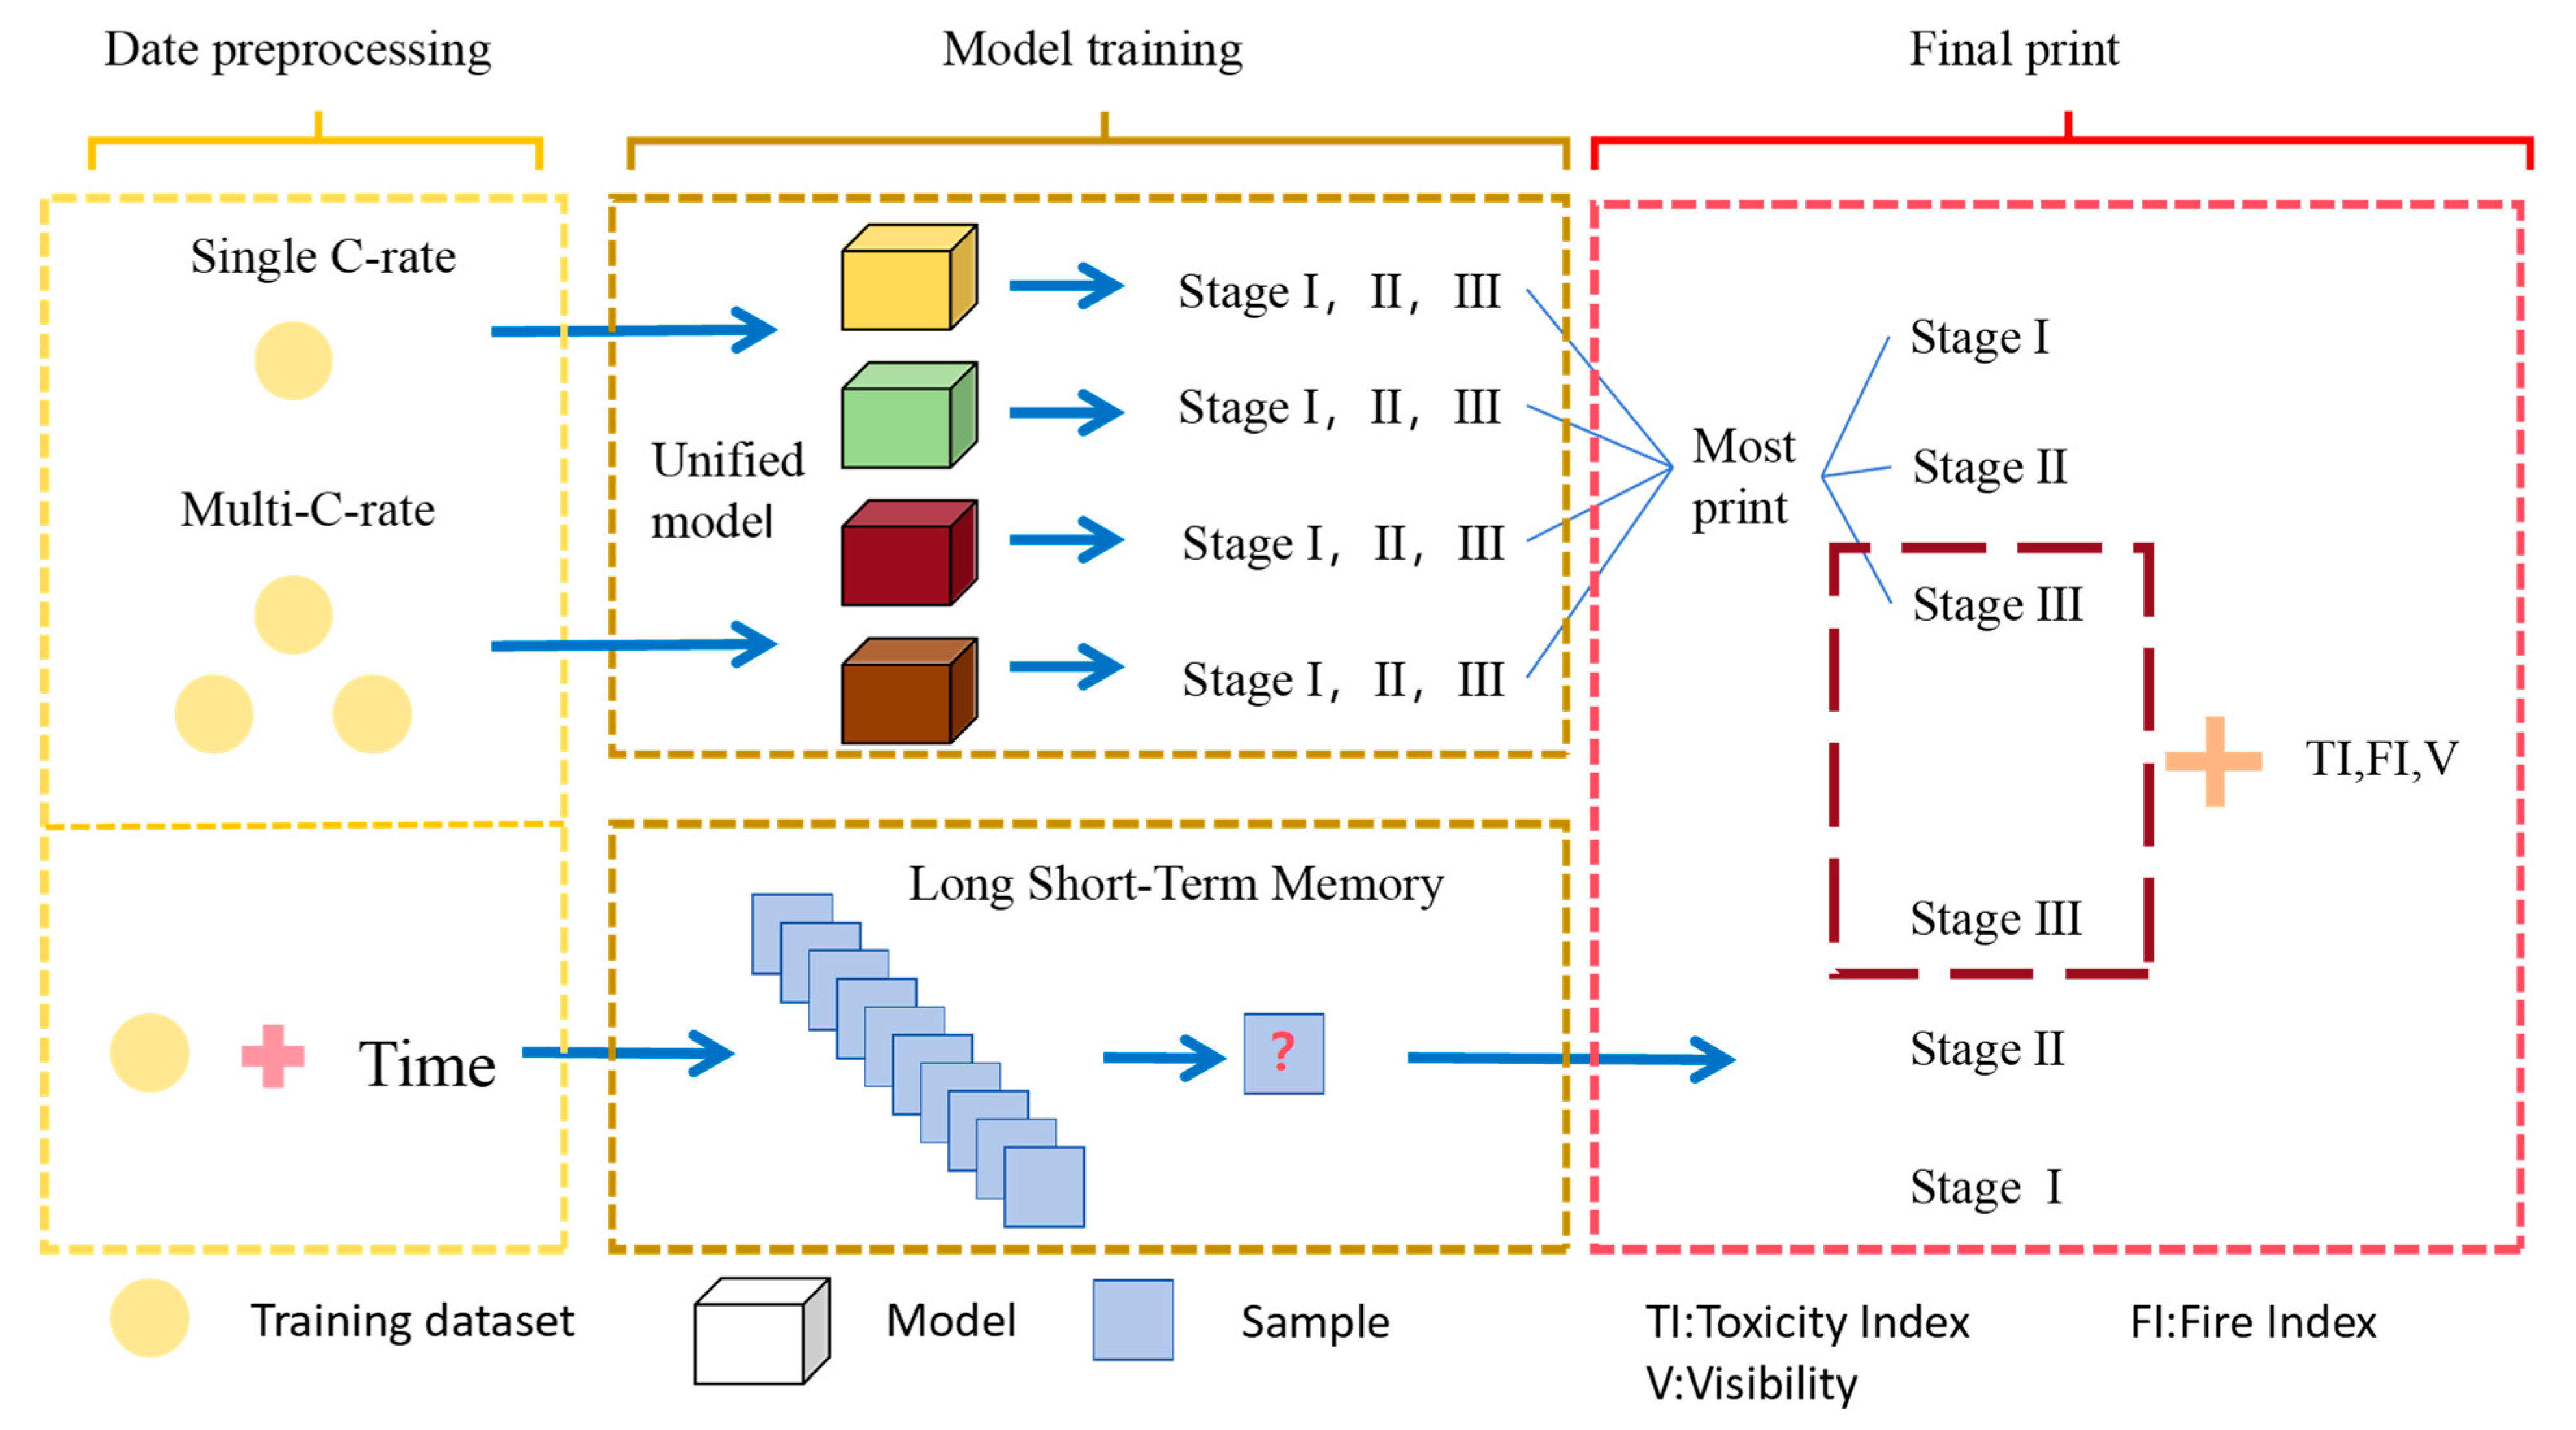
In both models, beyond early-stage warnings, once the prediction reaches Stage III, subsequent outputs include risk index calculations based on gas-related features. The model diagram is shown in Figure 11.

3.2.2. Feature Importance Analysis

(1)
Single-Rate Fusion Models
A separate fusion-based warning model was trained for each of the five single C-rate datasets. Each model utilizes eight characteristic signals as input. The feature importance for each of the eight input features was quantified using the Gini Importance metric, which is derived from the Random Forest algorithm within our ensemble model. The calculation is based on Equations (14)–(16):
G i n i t = 1 k = 1 K p k 2
G i n i = G i n i t N L N t · G i n i t L + N R N t · G i n i t R
I m p o r t a n c e f = i = 1 T t T i f G i n i t j = 1 M i = 1 T t T i j G i n i t
Equation (14) defines the Gini impurity for a given node t, where pₖ is the proportion of samples belonging to class k at that node, and K is the total number of classes.
Equation (15) calculates the impurity reduction (ΔGini) achieved by splitting node t using a specific feature. Here, Nₜ denotes the total number of samples at node t, while Nₗ and Nᵣ are the number of samples in the left (tₗ) and right (tᵣ) child nodes after the split, respectively.
Finally, Equation (16) calculates the overall importance of a feature f. It is the total impurity reduction brought by feature f, averaged over all T trees in the Random Forest, and then normalized by the sum of importances of all M features.
The resulting feature importance values for each of the five single-rate fusion models are presented in. Feature importance rankings across the five single-C-rate fusion early-warning models. Table 7 and Figure 12.
(2)
Multiple-Rate Fusion Model
The feature importance analysis for the multi-rate fusion model, which integrates data from all C-rates, is shown in Figure 13. Consistent with the single-rate models, temperature and CO concentration emerge as the most dominant predictive features. In contrast, gases such as HF and CH4 exhibit generally lower importance values, indicating their limited detectability and early-warning utility under the present experimental conditions. This result further validates the strategy of prioritizing CO as a primary early-warning indicator.
(3)
LSTM Model
A static feature importance analysis, such as Gini Importance, is not performed for the LSTM model. This is because LSTM models operate on a sliding time window, where feature weights are dynamically adjusted based on temporal context and are inherently stage sensitive. Unlike the static feature ranking in tree-based models, the contribution of each indicator in an LSTM evolves continuously and non-stably across the time-series dimension. Therefore, a static analysis would not accurately represent the model’s dynamic decision-making process.

3.2.3. Model Performance Evaluation

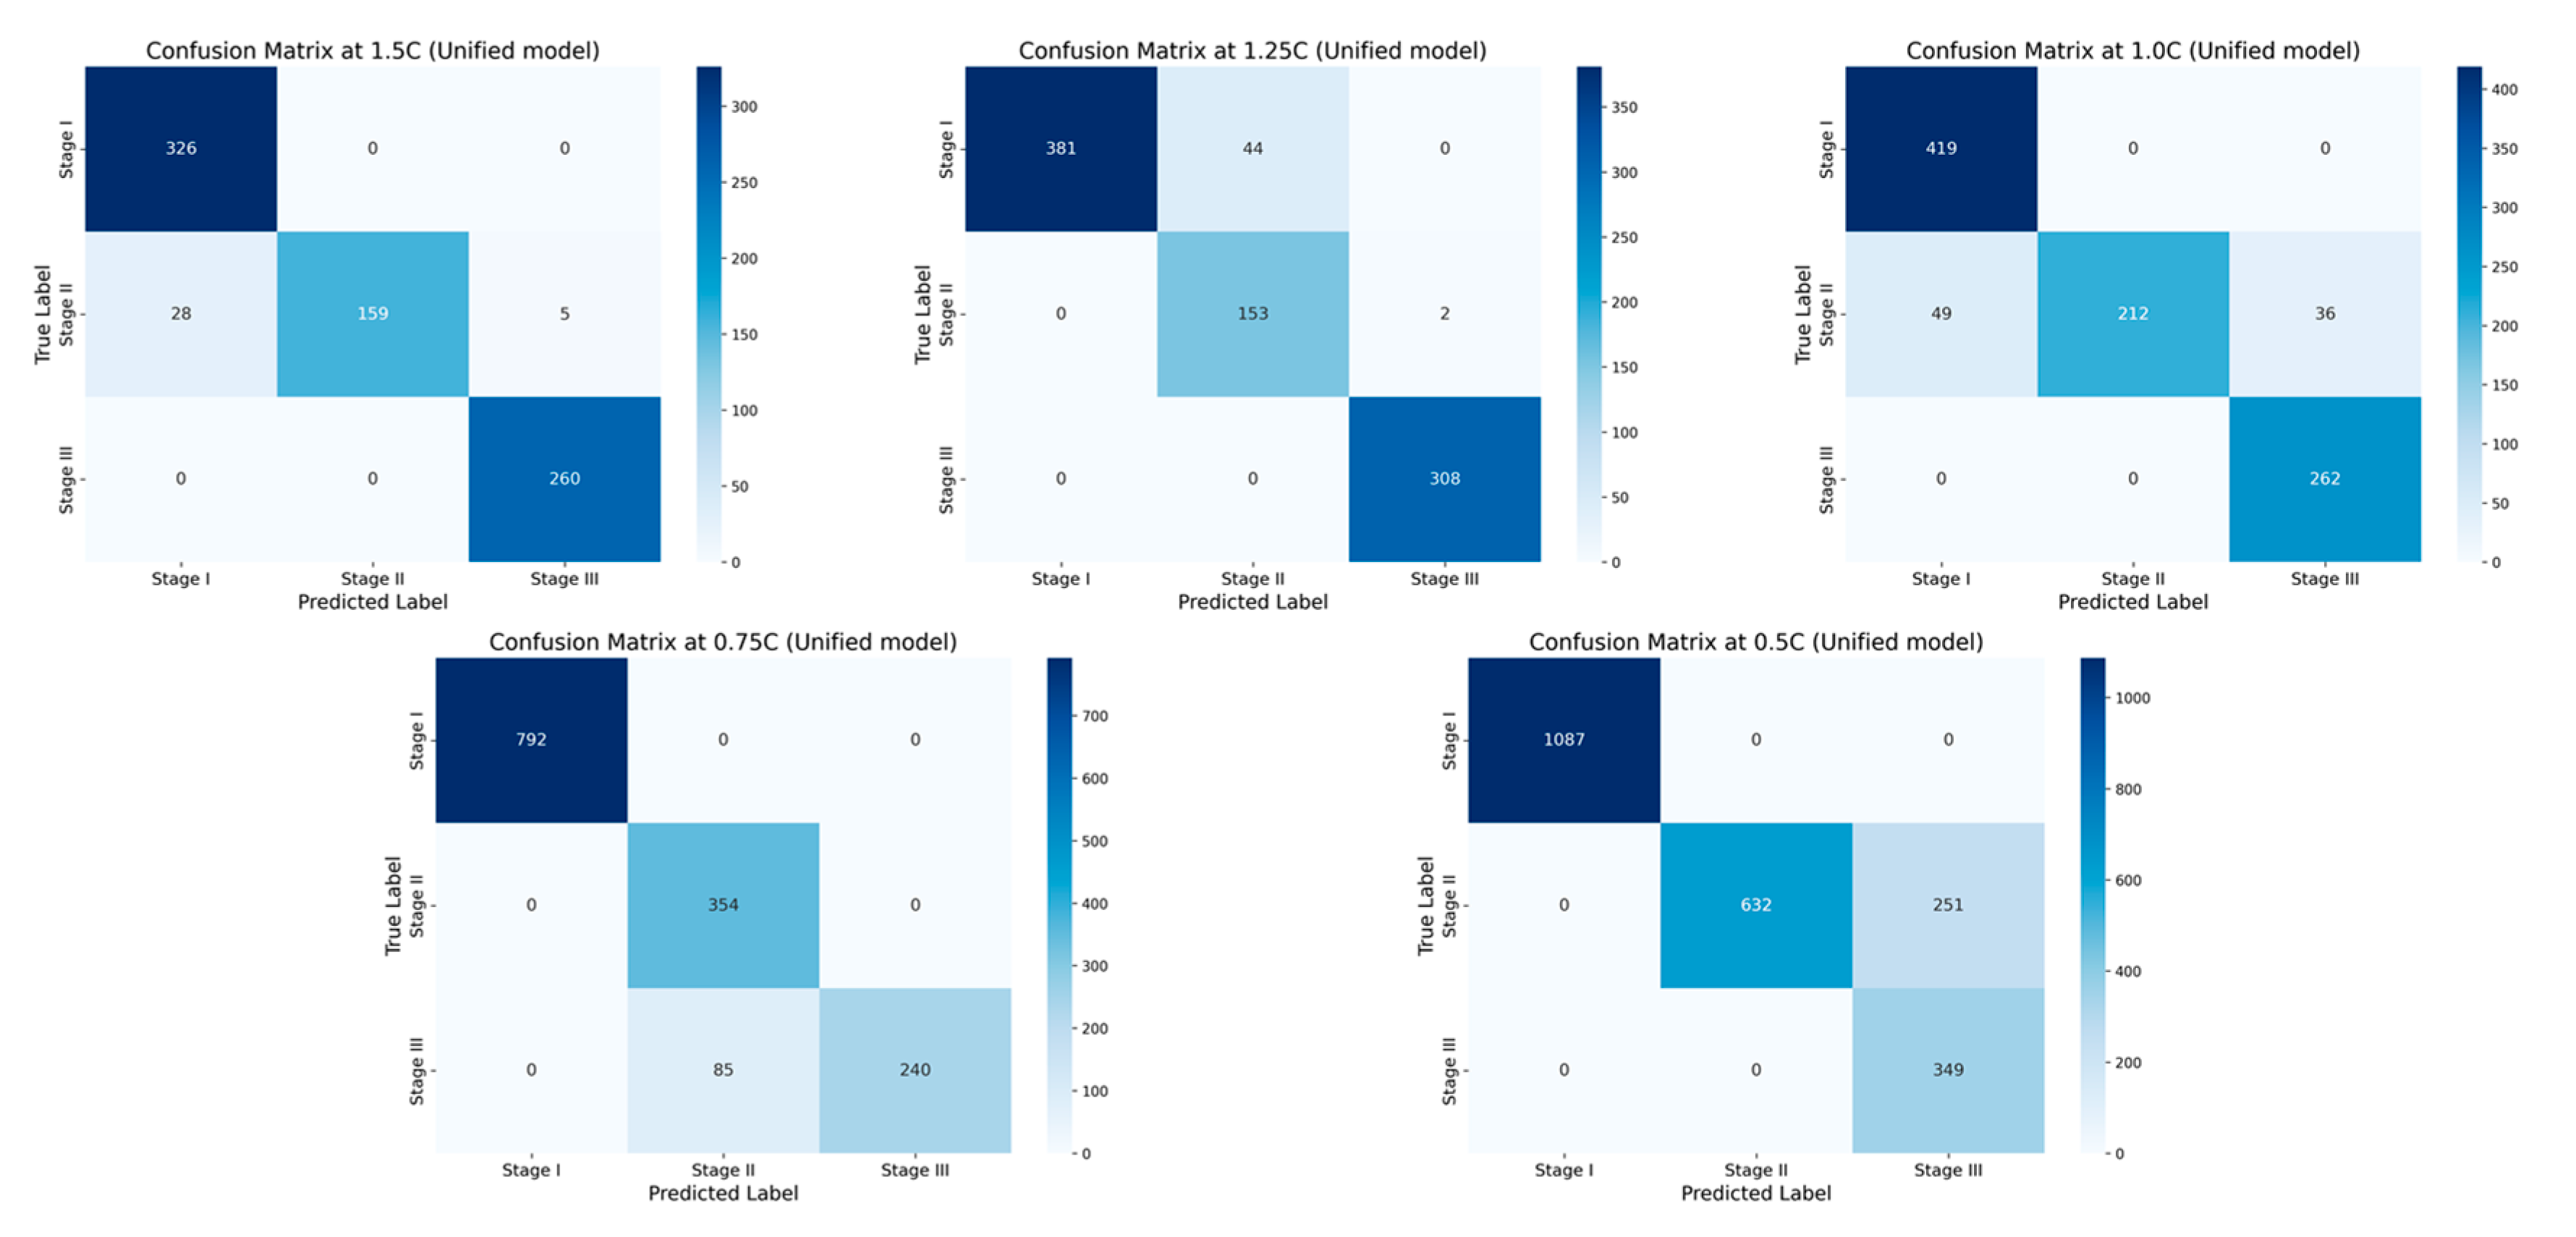
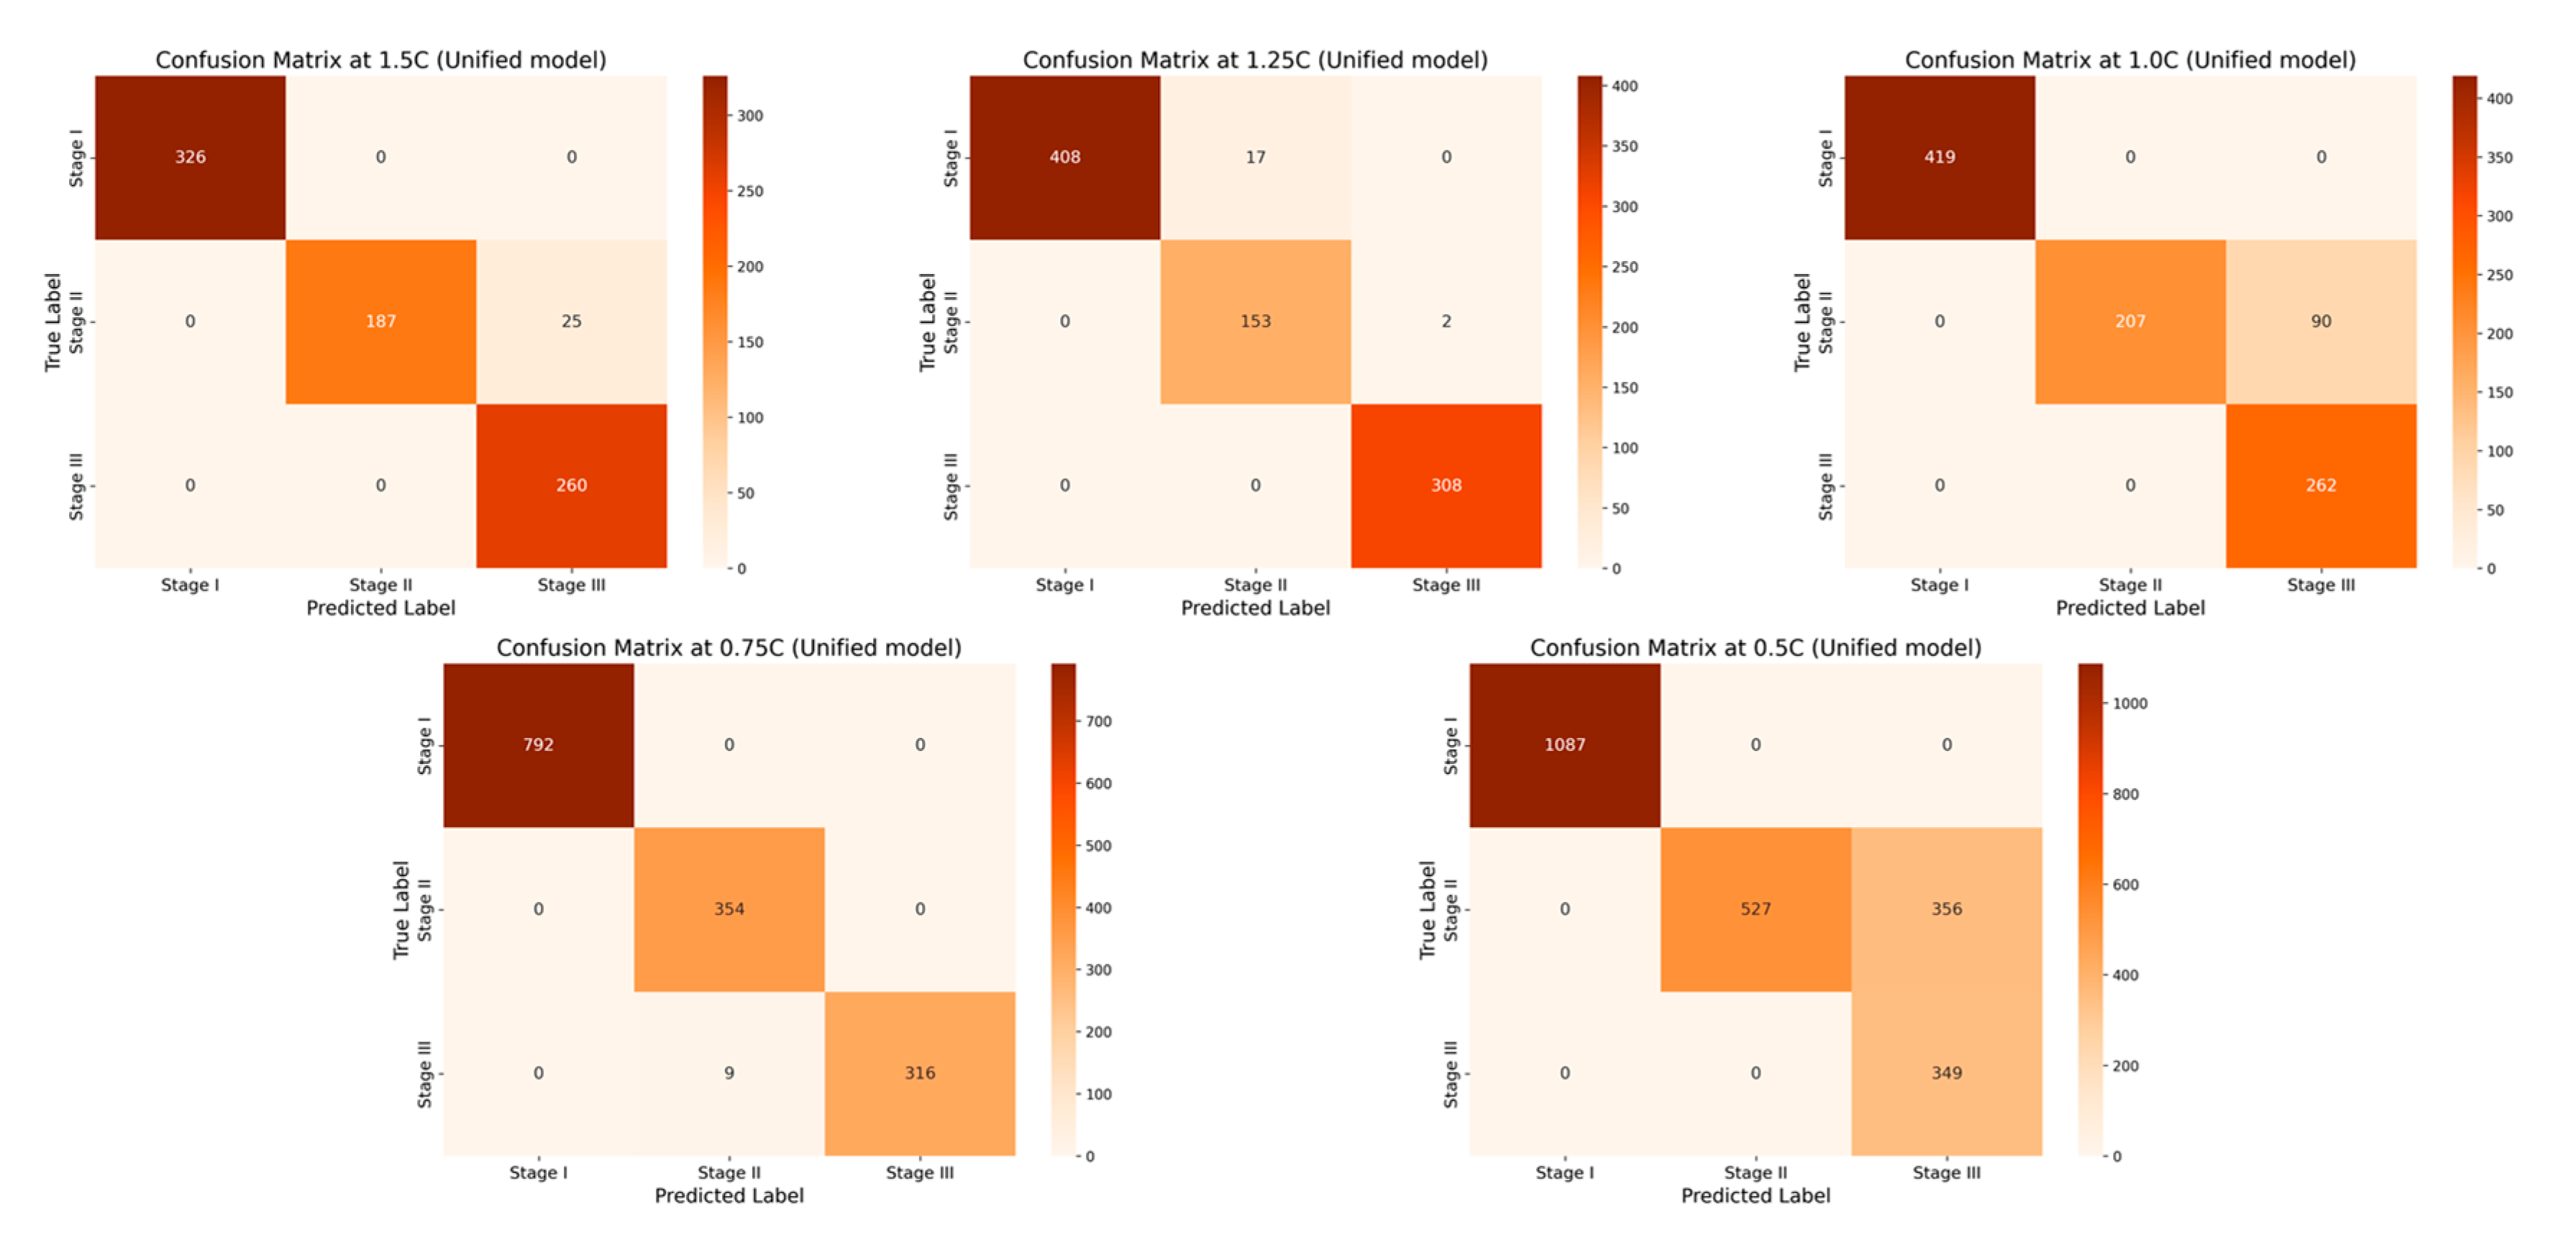
The performance of the three developed models (single-C-rate fusion, multi-C-rate fusion, and LSTM) was evaluated using five independent test datasets. These test datasets comprise the complete data from a separate set of five experiments conducted under the same conditions as the training set. All five datasets are independent from the datasets used in the previous analysis and were not included in the training sets to ensure an unbiased assessment of generalization capability. The classification performance is visualized through the confusion matrices presented in Figure 14, Figure 15 and Figure 16.
To systematically evaluate the performance of the developed models on the multimodal feature recognition the stage-wise classification task, this section presents a quantitative analysis based on confusion matrices and overall accuracy, calculated using Equation (17).
The classification results, summarized in Table 8, demonstrate that all three models achieve high performance across the various C-rate conditions. However, each model exhibits distinct strengths and weaknesses:
The Multi-Rate Fusion Model excels in scenarios with drastic evolution, achieving over 99% accuracy for the 1.5 C and 0.75 C groups. This highlights its strong signal integration capabilities. However, its performance drops to 84.65% at 0.5 C, suggesting that its generalization ability is limited by the feature distribution heterogeneity under low-rate conditions.
The Single-Rate Fusion Models, in contrast, maintain stable and reliable performance (>90% accuracy, except for 89% at 0.5 C) across all C-rate groups. This reflects their adaptability and robustness in scenarios with well-defined, static feature distributions.
The LSTM Model consistently achieves over 95% accuracy across all test sets. This underscores its superior capability in modeling time-series dynamics and capturing cross-stage features, making it particularly suitable for continuous monitoring tasks that require tracking the evolution of TR signals.
In summary, the three models offer a complementary suite of tools suitable for different deployment scenarios. The fusion models are well-suited for engineering applications where feature dimensions are clear and working conditions can be pre-classified. The LSTM model, with its high temporal accuracy, is ideal for complex temporal evolutions and safety monitoring environments that demand high dynamic responsiveness. A combined approach, leveraging the strengths of both, can enable a comprehensive and robust early warning system for the entire TR process.
A C C = T P + T N T P + T N + F P + F N
TP + TN is the correct number of all nodes predicted by the model, and TP + TN + FP + FN is the number of predicted nodes.

3.2.4. Multi-Indicator Emergency Decision-Making for Severe TR

After completing the multi-stage identification and early warning modeling of the entire TR process, it is imperative to introduce systematic emergency response strategies for managing the immediate, high-risk hazards of Stage III, including intense heat generation, toxic gas release, and smoke obscuration. To bridge the gap from warning to action, this section introduces a three-dimensional emergency decision-making matrix. As shown in Table 9, this matrix incorporates three core hazard indicators: Toxicity Index (TI), Flammability Index (FI), and Visibility (V). It maps quantitative hazard levels to three-tiered response strategies: “Internal Attack,” “Collaborative Operation,” and “External Suppression.” This provides first responders with a clear, data-driven guide for selecting appropriate intervention tactics, thereby enhancing the safety and scientific rigor of the response.
TI (Toxicity Index): Quantifies the hazard level based on the concentrations of CO and HF relative to their respective IDLH (Immediately Dangerous to Life or Health) limits, as specified in NFPA 704 (National Fire Protection Association). FI (Flammability Index): Assesses the flammability risk by determining if the gas mixture concentration falls within its Lower and Upper Explosive Limits (LEL–UEL). Visibility(V): Reflects the degree of visual obstruction caused by smoke, estimated in real-time from the light extinction coefficient.
The calculation of visibility, toxicity index and flammability index are as shown in Equations (11), (18) and (19)
T I = C H F 30 + C C O 1200
F I = max H 2 4 % , C H 4 5 % , C O 12 %
In Equations (18) and (19), the numerators represent the real-time measured gas concentrations (in ppm). The denominators for the TI calculation are the IDLH values specified in NFPA 704 [44], while the denominators for the FI calculation are the respective LEL values for each gas. The visibility thresholds in Table 9 are adapted from NFPA 170 [45] recommendations.
This decision matrix is designed for real-time integration into the early warning system. Upon detection of Stage III, the system can automatically process sensor data, evaluate the TI, FI, and visibility indices, and dynamically output a recommended response level. This automated approach provides a quantitative basis for command and dispatch. Compared with traditional manual judgments, this approach significantly improves response speed and environmental adaptability, making it especially suitable for enclosed or semi-enclosed spaces such as tunnels and battery compartments.
In summary, the TR stage not only requires model-based identification of staged conditions, but also a structured emergency decision-making system to complete the subsequent response protocols. This approach extends the capability from “intelligent identification” to “intelligent response”, thereby realizing a closed-loop control mechanism within the risk management process.

3.2.5. Summary

This section detailed the development of a machine learning-based framework for TR early warning and emergency response, built upon multimodal experimental data. Specifically:
(1) Through the fusion model without time series and the LSTM model based on time series, the static classification and dynamic evolution trend of the TR stage are accurately predicted. The former is suitable for deployment scenarios with clear feature differences, while the latter is suitable for continuous monitoring needs with complex time series changes.
(2) In the model performance evaluation, both the fusion model and the LSTM model achieved accuracies exceeding 95% across multiple C-rate groups, demonstrating excellent robustness and generalization capabilities, and verifying the complementarity of multi-C-rate data fusion and time series modeling.
(3) Combining the key hazardous characteristics (toxicity, explosion, and visibility) of the severe TR stage, a three-dimensional emergency response decision matrix was constructed, and an intelligent response mechanism centering core indicators was proposed. This mechanism provides standardized, quantitative support for subsequent incident management.
Overall, this section advances from early warning modeling to rescue response, implementing comprehensive multi-stage control over the entire overcharge-induced TR process in LFP batteries via an integrated framework encompassing static identification, dynamic prediction, and real-time decision-making. This framework establishes a safety prevention and control strategy with high engineering adaptability, underscoring its substantial practical significance and strong potential for broad implementation.

4. Conclusions

This study focused on the TR behavior of LFP batteries induced by overcharging at different charging rates. Through comprehensive experimental observation, signal feature analysis, intelligent identification modeling and emergency response strategy construction, the following conclusions and innovative contributions have been achieved:
1. A three-stage TR evolution model was constructed based on C-rate conditions. By integrating experimental results, the process was clearly divided into Stage I (from the onset of overcharging to the activation of the safety valve), Stage II (from safety valve activation to voltage rebound) and Stage III (from sharp fluctuations in voltage and temperature to thermal stabilization). This provides a structured framework for stage-specific signal identification and mechanisti analysis throughout the entire TR process.
2. The study reveals the synergistic effects of charge rate on gas generation behavior and thermal response characteristics. Multimodal data show that with increased of charging rate, gas release is advanced and the FED index increases. The coordinated interactions among individual cells in a closed environment pose tangible risks of toxicity and explosion, which be incorporated into the safety assessment framework for battery packs.
3. A fusion-based early warning model strategy is proposed integrating four types of traditional base learners (random forest, support vector machine, neural network and boosting tree). Compared to individual models, this fusion strategy shows stronger adaptability and robustness under various working conditions and complex scenarios. The prediction results of each base learner are integrated through the majority voting mechanism, the model outputs the class label with the highest proportion, thereby enhancing overall recognition stability and generalization capability. The experimental results show that the accuracy of the single-rate fusion model in all test groups is more than 90%, while the accuracy of the multi-rate fusion model reaches an optimal accuracy of 99.39%, which verifies the engineering practicality and model reliability of fusion modeling in complex and variable TR scenarios.
4. LSTM was introduced for time-series modeling. This approach addresses the limitations of traditional models in capturing continuous signal dynamics. The model achieves over 95% accuracy across various C-rates, making it suitable for real-time continuous monitoring and early warning deployment. At the same time, the high generalization ability and computational efficiency of the fusion model (especially the multi-rate) complement LSTM’s superior temporal precision and early warning potential.
5. An innovative multidimensional emergency decision matrix was constructed based on three core dimensions: Toxicity Index, Flammability Index, and visibility. This matrix implements a dynamic, graded response mechanism to establish a closed-loop rescue strategy encompassing detection, assessment, and response during TR incidents, thereby enhancing the scientific basis and safety of emergency management.
6. A closed-loop system linking early warning modeling to response decision-making was realized through the coordinated integration of multimodal perception, staged modeling, and emergency response. This approach bridges the entire process from pre-incident warning to post-incident emergency management. It overcomes the limitations of traditional single-point identification and static thresholds, and having good engineering practicality and promotion prospects.
Innovation and Contribution: The study’s most significant contribution is the establishment of a comprehensive, closed-loop safety management framework that advances the state-of-the-art in three key aspects: (1) utilizing a complementary dual-model strategy (Fusion for robustness, LSTM for temporal precision) to achieve high accuracy across variable C-rates; (2) identifying multimodal, stage-specific warning signals, moving beyond single-modal thresholds; and (3) pioneering a Multi-Dimensional Dynamic Emergency Decision Matrix (TI, FI, V) for quantified, action-oriented rescue response, bridging the gap from warning to action.
Limitations and Future Work: While the framework demonstrates strong performance and robustness within the experimental scope, the study has three primary limitations that define the direction for future research. Firstly, the experiments were conducted only at a single ambient temperature of 35 °C and focused on the maximum initial SOC (100%). Future work is required to validate the framework’s generalizability by conducting comprehensive comparative experiments across a range of lower and higher ambient temperatures (e.g., 25 °C, 45 °C) and various initial SOC levels (e.g., 50%, 80%). Secondly, this study was limited to overcharge-induced TR and did not explore other abuse scenarios (e.g., external heating or crushing). Finally, the current study focused exclusively on single-cell TR. Future efforts will extend the framework to the battery pack level, incorporating cell-to-cell TR propagation dynamics and scale-up effects to develop a truly robust system for real-world engineering applications.
Author Contributions

J.T.: Writing—review and editing, Writing—original draft, Visualization, Validation, Supervision, Software, Project administration, Methodology, Investigation, Data curation, Conceptualization. W.Q.: Software, Methodology. J.W.: Writing—review& editing. J.S.: Supervision, Resources, Funding acquisition. All authors have read and agreed to the published version of the manuscript.

Funding

This research was funded by the Science Research Project of Hebei Education Department (Grant No. QN2025154).

Data Availability Statement

The original contributions presented in the study are included in the article, further inquiries can be directed to the corresponding author.

Acknowledgments

The authors gratefully acknowledge that this research was funded by the Science Research Project of Hebei Education Department (Grant No. QN2025154).

Conflicts of Interest

The authors declare no conflict of interest.

References

  1. Abada, S.; Marlair, G.; Lecocq, A.; Petit, M.; Sauvant-Moynot, V.; Huet, F. Safety Focused Modeling of Lithium-Ion Batteries: A Review. J. Power Sources 2016, 306, 178–192. [Google Scholar] [CrossRef]
  2. Feng, X.; He, X.; Ouyang, M.; Wang, L.; Lu, L.; Ren, D.; Shriram, S. A Coupled Electrochemical-Thermal Failure Model for Predicting the Thermal Runaway Behavior of Lithium-Ion Batteries. J. Electrochem. Soc. 2018, 165, A3748. [Google Scholar] [CrossRef]
  3. Zhang, Y.; Cheng, S.; Mei, W.; Jiang, L.; Jia, Z.; Cheng, Z.; Sun, J.; Wang, Q. Understanding of Thermal Runaway Mechanism of LiFePO4 Battery In-Depth by Three-Level Analysis. Appl. Energy 2023, 336, 120695. [Google Scholar] [CrossRef]
  4. Wang, Q.; Jiang, B.; Li, B.; Yan, Y. A Critical Review of Thermal Management Models and Solutions of Lithium-Ion Batteries for the Development of Pure Electric Vehicles. Renew. Sustain. Energy Rev. 2016, 64, 106–128. [Google Scholar] [CrossRef]
  5. Schipper, F.; Erickson, E.M.; Erk, C.; Shin, J.-Y.; Chesneau, F.F.; Aurbach, D. Review—Recent Advances and Remaining Challenges for Lithium Ion Battery Cathodes. J. Electrochem. Soc. 2016, 164, A6220. [Google Scholar] [CrossRef]
  6. Wu, T.; Chen, H.; Wang, Q.; Sun, J. Comparison Analysis on the Thermal Runaway of Lithium-Ion Battery under Two Heating Modes. J. Hazard. Mater. 2018, 344, 733–741. [Google Scholar] [CrossRef]
  7. Huang, P.; Ping, P.; Li, K.; Chen, H.; Wang, Q.; Wen, J.; Sun, J. Experimental and Modeling Analysis of Thermal Runaway Propagation over the Large Format Energy Storage Battery Module with Li4Ti5O12 Anode. Appl. Energy 2016, 183, 659–673. [Google Scholar] [CrossRef]
  8. Spotnitz, R.; Franklin, J. Abuse Behavior of High-Power, Lithium-Ion Cells. J. Power Sources 2003, 113, 81–100. [Google Scholar] [CrossRef]
  9. Larsson, F.; Mellander, B.-E. Abuse by External Heating, Overcharge and Short Circuiting of Commercial Lithium-Ion Battery Cells. J. Electrochem. Soc. 2014, 161, A1611. [Google Scholar] [CrossRef]
  10. Jin, Y.; Zheng, Z.; Wei, D.; Jiang, X.; Lu, H.; Sun, L.; Tao, F.; Guo, D.; Liu, Y.; Gao, J.; et al. Detection of Micro-Scale Li Dendrite via H2 Gas Capture for Early Safety Warning. Joule 2020, 4, 1714–1729. [Google Scholar] [CrossRef]
  11. Ding, S.; Dong, C.; Zhao, T.; Koh, L.; Bai, X.; Luo, J. A Meta-Learning Based Multimodal Neural Network for Multistep Ahead Battery Thermal Runaway Forecasting. IEEE Trans. Ind. Inform. 2020, 17, 4503–4511. [Google Scholar] [CrossRef]
  12. Feng, X.; Wong, S.K.; Chen, T.; Ouyang, M. An Automatic Identification Method of Thermal Physical Parameter for Lithium-Ion Batteries Suffering from Thermal Runaway. J. Energy Storage 2024, 83, 110358. [Google Scholar] [CrossRef]
  13. Chen, Y.; Kang, Y.; Zhao, Y.; Wang, L.; Liu, J.; Li, Y.; Liang, Z.; He, X.; Li, X.; Tavajohi, N.; et al. A Review of Lithium-Ion Battery Safety Concerns: The Issues, Strategies, and Testing Standards. J. Energy Chem. 2021, 59, 83–99. [Google Scholar] [CrossRef]
  14. Leising, R.A.; Palazzo, M.J.; Takeuchi, E.S.; Takeuchi, K.J. Abuse Testing of Lithium-Ion Batteries: Characterization of the Overcharge Reaction of LiCoO2/Graphite Cells. J. Electrochem. Soc. 2001, 148, A838. [Google Scholar] [CrossRef]
  15. Wang, K.; Wu, D.; Chang, C.; Zhang, J.; Ouyang, D.; Qian, X. Charging Rate Effect on Overcharge-Induced Thermal Runaway Characteristics and Gas Venting Behaviors for Commercial Lithium Iron Phosphate Batteries. J. Clean. Prod. 2023, 434, 139992. [Google Scholar] [CrossRef]
  16. Meng, D.; Wang, X.; Chen, M.; Wang, J. Effects of Environmental Temperature on the Thermal Runaway of Lithium-Ion Batteries during Charging Process. J. Loss Prev. Process Ind. 2023, 83, 105084. [Google Scholar] [CrossRef]
  17. Jia, Z.; Wang, S.; Qin, P.; Li, C.; Song, L.; Cheng, Z.; Jin, K.; Sun, J.; Wang, Q. Comparative Investigation of the Thermal Runaway and Gas Venting Behaviors of Large-Format LiFePO4 Batteries Caused by Overcharging and Overheating. J. Energy Storage 2023, 61, 106791. [Google Scholar] [CrossRef]
  18. Kang, R.; Jia, C.; Zhao, J.; Zhao, L.; Zhang, J. Effects of Capacity on the Thermal Runaway and Gas Venting Behaviors of Large-Format Lithium Iron Phosphate Batteries Induced by Overcharge. J. Energy Storage 2024, 87, 111523. [Google Scholar] [CrossRef]
  19. Yang, X.; Wang, H.; Li, M.; Li, Y.; Li, C.; Zhang, Y.; Chen, S.; Shen, H.; Qian, F.; Feng, X.; et al. Experimental Study on Thermal Runaway Behavior of Lithium-Ion Battery and Analysis of Combustible Limit of Gas Production. Batteries 2022, 8, 250. [Google Scholar] [CrossRef]
  20. Larsson, F.; Andersson, P.; Blomqvist, P.; Mellander, B.-E. Toxic Fluoride Gas Emissions from Lithium-Ion Battery Fires. Sci. Rep. 2017, 7, 10018. [Google Scholar] [CrossRef]
  21. Jie, D.; Chen, B.; Lu, J.; Zhou, T.; Wu, C. Thermal Runaway and Combustion Characteristics, Risk and Hazard Evaluation of Lithium-iron Phosphate Battery under Different Thermal Runaway Triggering Modes. Appl. Energy 2024, 368, 123451. [Google Scholar] [CrossRef]
  22. Aiello, L.; Hanzu, I.; Gstrein, G.; Ewert, E.; Ellersdorfer, C.; Sinz, W. Analysis and Investigation of Thermal Runaway Propagation for a Mechanically Constrained Lithium-Ion Pouch Cell Module. Batteries 2021, 7, 49. [Google Scholar] [CrossRef]
  23. Santhanagopalan, S.; Ramadass, P.; Zhang, J. Analysis of Internal Short-Circuit in a Lithium Ion Cell. J. Power Sources 2009, 194, 550–557. [Google Scholar] [CrossRef]
  24. Ouyang, D.; Chung, Y.-H.; Liu, J.; Bai, J.; Zhou, Y.; Chen, S.; Wang, Z.; Shu, C.-M. Characteristics and Mechanisms of as Well as Evaluation Methods and Countermeasures for Thermal Runaway Propagation in Lithium-Ion Batteries. Prog. Energy Combust. Sci. 2025, 108, 101209. [Google Scholar] [CrossRef]
  25. Feng, X.; Ouyang, M.; Liu, X.; Lu, L.; Xia, Y.; He, X. Thermal Runaway Mechanism of Lithium Ion Battery for Electric Vehicles: A Review. Energy Storage Mater. 2018, 10, 246–267. [Google Scholar] [CrossRef]
  26. Shah, K.; Chalise, D.; Jain, A. Experimental and Theoretical Analysis of a Method to Predict Thermal Runaway in Li-Ion Cells. J. Power Sources 2016, 330, 167–174. [Google Scholar] [CrossRef]
  27. Kong, D.; Wang, G.; Ping, P.; Wen, J.X. A Coupled Conjugate Heat Transfer and CFD Model for the Thermal Runaway Evolution and Jet Fire of 18650 Lithium-Ion Battery under Thermal Abuse. eTransportation 2022, 12, 100157. [Google Scholar] [CrossRef]
  28. Cui, Y.; Shi, D.; Wang, Z.; Mou, L.; Ou, M.; Fan, T.; Bi, S.; Zhang, X.; Yu, Z.; Fang, Y. Thermal Runaway Early Warning and Risk Estimation Based on Gas Production Characteristics of Different Types of Lithium-Ion Batteries. Batteries 2023, 9, 438. [Google Scholar] [CrossRef]
  29. Li, A.; Abpeikar, S.; Wang, M.; Frankcombe, T.; Ghodrat, M. An integration framework based on deep learning and CFD for early detection of lithium-ion battery thermal runaway. Appl. Therm. Eng. 2025, 274, 126460. [Google Scholar] [CrossRef]
  30. Pang, Y.; Wang, Y.; Niu, Z. Deep learning from three-dimensional lithium-ion battery multiphysics model part I: Data development. Energy AI 2024, 18, 100428. [Google Scholar] [CrossRef]
  31. Das Goswami, B.R.; Abdisobbouhi, Y.; Du, H.; Mashayek, F.; Kingston, T.A.; Yurkiv, V. Advancing Battery Safety: Integrating Multiphysics and Machine Learning for Thermal Runaway Prediction in Lithium-Ion Battery Module. J. Power Sources 2024, 614, 235015. [Google Scholar] [CrossRef]
  32. Jia, Y.; Li, J.; Yao, W.; Li, Y.; Xu, J. Precise and Fast Safety Risk Classification of Lithium-Ion Batteries Based on Machine Learning Methodology. J. Power Sources 2022, 548, 232064. [Google Scholar] [CrossRef]
  33. Zhu, G.; Sun, T.; Xu, Y.; Zheng, Y.; Zhou, L. Identification of Internal Short-Circuit Faults in Lithium-Ion Batteries Based on a Multi-Machine Learning Fusion. Batteries 2023, 9, 154. [Google Scholar] [CrossRef]
  34. Das Goswami, B.R.; Mastrogiorgio, M.; Ragone, M.; Jabbari, V.; Shahbazian-Yassar, R.; Mashayek, F.; Yurkiv, V. A Combined Multiphysics Modeling and Deep Learning Framework to Predict Thermal Runaway in Cylindrical Li-Ion Batteries. J. Power Sources 2024, 595, 234065. [Google Scholar] [CrossRef]
  35. Tian, J.; Wang, Z.; Kong, L.; Xu, F.; Dong, X.; Shen, J. Investigating the Thermal Runaway Characteristics of the Prismatic Lithium Iron Phosphate Battery Under a Coupled Charge Rate and Ambient Temperature. Batteries 2025, 11, 253. [Google Scholar] [CrossRef]
  36. Wang, Z.; Yuan, J.; Zhu, X.; Wang, H.; Huang, L.; Wang, Y.; Xu, S. Overcharge-to-Thermal-Runaway Behavior and Safety Assessment of Commercial Lithium-Ion Cells with Different Cathode Materials: A Comparison Study. J. Energy Chem. 2021, 55, 484–498. [Google Scholar] [CrossRef]
  37. Ouyang, D.; Wang, K.; Gao, T.; Wang, Z. Investigation on Safety Characteristics of High-Nickel Lithium-Ion Cells with Anode Partially Doped by Silicon Oxide. J. Loss Prev. Process Ind. 2022, 80, 104924. [Google Scholar] [CrossRef]
  38. Zhu, X.; Wang, Z.; Wang, Y.; Wang, H.; Wang, C.; Tong, L.; Yi, M. Overcharge Investigation of Large Format Lithium-Ion Pouch Cells with Li(Ni0.6Co0.2Mn0.2)O2 Cathode for Electric Vehicles: Thermal Runaway Features and Safety Management Method. Energy 2019, 169, 868–880. [Google Scholar] [CrossRef]
  39. Gachot, G.; Ribière, P.; Mathiron, D.; Grugeon, S.; Armand, M.; Leriche, J.-B.; Pilard, S.; Laruelle, S. Gas Chromatography/Mass Spectrometry As a Suitable Tool for the Li-Ion Battery Electrolyte Degradation Mechanisms Study. Anal. Chem. 2011, 83, 478–485. [Google Scholar] [CrossRef]
  40. Chen, S.; Wang, Z.; Yan, W. Identification and Characteristic Analysis of Powder Ejected from a Lithium Ion Battery during Thermal Runaway at Elevated Temperatures. J. Hazard. Mater. 2020, 400, 123169. [Google Scholar] [CrossRef]
  41. Ouyang, M.; Ren, D.; Lu, L.; Li, J.; Feng, X.; Han, X.; Liu, G. Overcharge-Induced Capacity Fading Analysis for Large Format Lithium-Ion Batteries with LiyNi1/3Co1/3Mn1/3O2 + LiyMn2O4 Composite Cathode. J. Power Sources 2015, 279, 626–635. [Google Scholar] [CrossRef]
  42. ISO 13571:2012; Life-Threatening Components of Fire—Guidelines for the Estimation of Time to Compromised Tenability in Fires. International Organization for Standardization: Geneva, Switzerland, 2012.
  43. Peng, Y.; Yang, L.; Ju, X.; Liao, B.; Ye, K.; Li, L.; Cao, B.; Ni, Y. A Comprehensive Investigation on the Thermal and Toxic Hazards of Large Format Lithium-Ion Batteries with LiFePO4 Cathode. J. Hazard. Mater. 2020, 381, 120916. [Google Scholar] [CrossRef] [PubMed]
  44. National Fire Protection Association. NFPA 704: Standard System for the Identification of the Hazards of Materials for Emergency Response; National Fire Protection Association: Quincy, MA, USA, 2022. [Google Scholar]
  45. National Fire Protection Association. NFPA 170: Standard for Fire Safety and Emergency Symbols; National Fire Protection Association: Quincy, MA, USA, 2024. [Google Scholar]
Figure 1. Technology Roadmap.
Fire 08 00437 g001
Figure 2. (a) Schematic diagram of the overcharge experimental platform; (b) Placement of thermocouples on the battery surface; (c) Positioning angle of the gas sampling probe; (d) Arrangement of thermocouples above the battery for flue gas temperature measurement.
Fire 08 00437 g002
Figure 3. Temperature-voltage plots over time for five test groups. (a) 1.5 C; (b) 1.25 C; (c) 1.0 C; (d) 0.75 C; (e) 0.5 C.
Fire 08 00437 g003
Figure 4. The proportion of the occurrence time of each key event relative to the duration of the corresponding phase in each test group.
Fire 08 00437 g004
Figure 5. The temperature and voltage at each key event: (a) Specific values for each key node in the five sets of experiments; (b) Voltage at the boundary points of each stage of TR.
Fire 08 00437 g005
Figure 6. Temporal evolution of carbon monoxide and hydrogen concentrations during overcharge-induced TR. (a) 1.5 C; (b) 1.25 C; (c) 1.0 C; (d) 0.75C; (e) 0.5 C.
Fire 08 00437 g006
Figure 7. Methane and hydrogen fluoride concentration profiles over time. (a) 1.5 C; (b) 1.25 C; (c) 1.0 C; (d) 0.75 C; (e) 0.5 C.
Fire 08 00437 g007
Figure 8. Smoke characteristics observed during TR; (a) Profiles of smoke transmittance and extinction coefficient; (b) Temperature of the ejected gas jet at various heights (5 cm, 20 cm, and 35 cm) above the safety valve.
Fire 08 00437 g008
Figure 9. Key events and visual features in the process of overcharge-TR.
Fire 08 00437 g009
Figure 10. Acoustic signals recorded during different stages of the TR process.(a,b) Pop-open group; (c,d) Rupture group.
Fire 08 00437 g010
Figure 11. Model Diagram.
Fire 08 00437 g011
Figure 12. Feature importance rankings across the five single-C-rate fusion early-warning models.
Fire 08 00437 g012
Figure 13. Feature importance for the multi-rate fusion model.
Fire 08 00437 g013
Figure 14. Single-C-rate fusion model confusion matrix.
Fire 08 00437 g014
Figure 15. Multi-C-rate fusion model confusion matrix.
Fire 08 00437 g015
Figure 16. LSTM confusion matrix.
Fire 08 00437 g016
Table 1. Specifications of the LFP Battery.
ParameterValue
Positive electrodeLiFePO4
Negative electrodeGraphite
Dimensions (length × width × height)148 mm × 26 mm × 94 mm
Capacity32 Ah
Weight730 g
Nominal voltage3.20 V
Operating voltage range2.5–3.65 V
Charging temperature range0–55 °C
Discharging temperature range−20–55 °C
Internal resistance (1 kHz)≤1.5 mΩ
Specific heat830 J/(kg·K)
Table 2. Matrices of Test Conditions.
Condition AbbreviationC-Rate (C)Initial State of Charge(SOC)
100%–1.5. C-48 A-35 °C1.5 C-48 A100%
100%-1.25 C-40 A-35 °C1.25 C-40 A100%
100%-1.0 C-32 A-35 °C1.0 C-32 A100%
100%-0.75 C-24 A-35 °C0.75 C-24 A100%
100%-0.5 C-16 A-35 °C0.5 C-16 A100%
Table 3. The explosion limits of three flammable gases.
GasLEL (Lower Explosion Limit/Volume Percentage)UEL (Upper Explosion Limit/Volume Percentage)
CH45%15%
CO12.5%74%
H24%75%
Table 4. Mixed flammable gas concentrations and explosive limits for each test group.
C1,2,3y1,2,3CtotalLELmixUELmix
1.5 C/CH41.58%0.682.33%5.71%20.14%
1.5 C/CO0.56%0.24
1.5 C/H20.19%0.08
1.25 C/CH42.8%0.753.75%6.49%18.74
1.25 C/CO0.74%0.2
1.25 C/H20.21%0.05
1.0 C/CH43.49%0.824.27%5.3%17.52%
1.0 C/CO0.53%0.12
1.0 C/H20.25%0.06
0.75 C/CH4000.63%9.18%74.17%
0.75 C/CO0.52%0.83
0.75 C/H20.11%0.17
0.5 C/CH4000.93%8.9%74.19%
0.5 C/CO0.75%0.81
0.5 C/H20.18%0.19
Table 5. Mass and thickness changes in battery samples before and after the experiment.
Weight of Battery Samples After the ExperimentWeight Changes Before and After the ExperimentThickness of Battery Samples After the ExperimentThickness Changes Before and After the Experiment
1.5 C594.02 g135.98 g4.11 cm1.51 cm
1.25 C592.75 g137.25 g4.20 cm1.60 cm
1.0 C593.08 g136. 92 g4.38 cm1.78 cm
0.75 C592.82 g137.18 g4.08 cm1.48 cm
0.5 C593.58 g136.42 g4.12 cm1.52 cm
Table 6. Characteristic signals corresponding in each stage of the TR process.
StageTemperatureVoltageDeformationSoundGas
Slowly risingSlightly dropping after reaching the voltage platformStarting from voltage drop, ending with safety valve openingNoneNone
Slowly risingSlightly droppingNoneSound of safety valve popping at the beginning; explosion during the processCO detected in all samples; H2 detected in some
Sudden riseSudden drop after sudden riseNoneTwo distinct acoustic bursts during severe TRCO and H2 detected in all samples; CH4 and HF detected in some
Table 7. Quantitative feature importance values for.each characteristic signal in the five single-C-rate fusion models.
TemperatureVoltageCOH2HFCH4Sound SignalDeformation
0.5 C0.43470.15100.21380.01200.020200.02560.1428
0.75 C0.33380.11290.24570.04380.150800.01560.0975
1.0 C0.33350.19110.24280.04160.08050.01140.01910.0799
1.25 C0.38680.17630.28440.01610.01340.04790.00600.0692
1.5 C0.34200.16180.27210.114900.02050.00890.0798
Table 8. Accuracy of three models in five test sets.
Single-C-Rate
(Unified Model)
Multi-C-Rate
(Unified Model)
LSTM
1.5 C0.95760.99360.9727
1.25 C0.94820.97860.9545
1.0 C0.91310.90800.9525
0.75 C0.94220.99390.9692
0.5 C0.89180.84650.9758
Table 9. Multi-indicator decision-making matrix.
Toxicity IndexFlammability IndexVisibilityDisposal Strategy
0.0–0.30.0–0.4≥3 m Inside Attack by Personnel
0.0–0.60.4–0.71.5 m–3 m Collaborative Operation
0.6–1.00.7–1.0<1.5 m External Suppression
Disclaimer/Publisher’s Note: The statements, opinions and data contained in all publications are solely those of the individual author(s) and contributor(s) and not of MDPI and/or the editor(s). MDPI and/or the editor(s) disclaim responsibility for any injury to people or property resulting from any ideas, methods, instructions or products referred to in the content.