Article

Pilot Ignition of Ammonia Spray Using Dimethyl Ether Spray at Elevated Temperature: A Numerical Study

School of Energy and Power Engineering, Jiangsu University, Zhenjiang 212013, China
*
Author to whom correspondence should be addressed.
Fire 2025, 8(11), 436; https://doi.org/10.3390/fire8110436
Submission received: 29 September 2025 / Revised: 1 November 2025 / Accepted: 6 November 2025 / Published: 7 November 2025

Abstract

Ammonia (NH3) is a promising zero-carbon fuel to eliminate carbon footprint while the high autoignition temperature and low combustion rate of NH3 remain challenging for practical implementation. Using dimethyl ether (DME) as pilot ignition fuel can substantially promote the reactivity of NH3, thus paving the way for a widespread application of NH3. In this study, the ignition process and nitrogen oxides (NOx) emissions of the NH3 liquid spray ignited by liquid DME spray were numerically investigated using Converge software. The ambient temperatures (Tamb) ranging from 900 K to 1100 K were used to mimic the in-cylinder temperature typically encountered in turbocharger engines. The effect of ammonia energy ratio (AER) and fuel injection timing was examined as well. It is found that only half of NH3 is consumed at Tamb = 900 K while 97.4% of NH3 is burned at Tamb = 1100 K. Nitric oxide (NO) and nitrogen dioxide (NO2) formation also have strong correlation with Tamb and NO2 is usually formed around the periphery of NO through these two channels HO2 + NO = NO2 + OH and NO + O(+M) = NO2(+M). Extremely high nitrous oxide (N2O, formed by NH + NO = H + N2O) and carbon monoxide (CO) are produced with the presence of abundant unburned NH3 at Tamb = 900 K. Additionally, increasing AER from 60% to 90% results in slightly declined combustion efficiency of NH3 from 98.7% to 94%. NO emission has a non-monotonical relationship with AER owing to the ‘trade-off’ relationship between HNO concentration and radical pool at varying AERs. A higher AER of 95% leads to failed ignition of NH3. Advancing DME injection not only increases combustion efficiency, but also reduces NOx and CO emissions.

1. Introduction

Ammonia has been widely considered as a promising zero-carbon fuel to replace traditional hydrocarbon fuels in combustion engines to tackle carbon emissions [1,2,3]. It can be synthesized from renewable hydrogen (H2) [4,5] and easily liquefied at room temperature with compression pressure of ~10 bar, which remarkably reduces its storage and transportation cost compared to hydrogen [6]. However, using NH3 alone in conventional engines [7,8] remains challenging because of its high ignition energy [9] and slow flame speed [10]. The ignition temperature of NH3 is approximately 400 K higher than diesel [11], which necessitates the usage of reactive additives as pilot ignition fuel. Following this strategy, Reiter and Kong [12,13] modified a diesel engine to supply NH3 through the intake manifold while directly injecting diesel or biodiesel into the cylinder as a pilot fuel, achieving a maximum ammonia energy ratio (AER) of approximately 60%. Soot emissions could be remarkably reduced with high AER; however, high unburned ammonia concentrations were observed due to poor combustion efficiency in low ammonia flame temperatures. According to the lower heating values of these two fuels, AER is defined using the following equation:
A E R = m N H 3 · L H V N H 3 m N H 3 · L H V N H 3 + m D M E · L H V D M E × 100 %
where m N H 3 and m D M E represent the injection masses of NH3 and DME, respectively. L H V N H 3 and L H V D M E denote their lower heating values. Here, the combustion efficiency of NH3 is defined as the ratio of burned NH3 to total NH3 injected into the combustion chamber. Wang et al. [14] explored the reduction in greenhouse gas and unburned ammonia by manipulating the pilot diesel injection strategy with a maximum AER of ~80%. Zhang et al. [15] applied NH3/diesel high-pressure dual-fuel direct injection (HPDI) method in a two-stroke low speed engine and achieved acceptable NOx emission using reasonable arrangement of injection times of diesel and ammonia. It has been recognized that dual-fuel high-pressure direct injection has superior performance compared to port injection ammonia engines in emission control and maintaining power performance owing to higher charge efficiency and flexible fuel injection strategy [15,16]. Li et al. [17] reported that the dual-fuel high-pressure direct injection strategy increased the AER by 17% compared to the low-pressure injection mode; meanwhile, unburned ammonia and NOx were substantially reduced. Liu et al. [18] reported that increasing the diesel injection pressure from 80 MPa to 120 MPa leads to improved combustion efficiency to 82.64% in the ammonia/diesel dual-fuel engine.
Aiming at accelerating the ignition of ammonia, DME is an attractive candidate, having a higher cetane number (~55) and less tendency of soot formation compared to diesel. DME can also be synthesized from renewable energy sources [19] and has been widely used as a solvent [20], suggesting that its storage and transportation technologies are as mature as those for ammonia. Our previous measurements [9] show that 5% DME addition can lower the autoignition temperature of NH3 by ~250 K. As a result, using DME as pilot fuel and simultaneously adopting HPDI method can pave the way for the application of ammonia in CI engine with high efficiency and low emissions.
Gross et al. [21] used direct injection of premixed liquid NH3/DME fuel in compression ignition engines and discovered low soot emissions but increased carbon monoxide (CO) and unburned hydrocarbons (UHCs) compared to pure DME engines due to the lower flame temperature of NH3. AER was set lower than 40%, which is far from the goal of using ammonia as primary fuel. Ryu et al. [22] suggested that 60% DME addition is necessary to achieve a stable combustion using the same fuel injection strategy. They also pointed out that the combustion of high concentration of ammonia exhibits HCCI characteristics and deteriorated engine performance was reported at a higher AER [22]. According to these studies, direct injection of premixed NH3/DME liquid is not a promising method in CI engines due to a limited AER and difficulties of flexible fuel injection control, which is extremely important to match engine load. In our previous study, the NH3/DME dual-fuel direct injection (HPDI) method was applied in a constant volume combustion chamber (CVCC) and the ignition process of NH3 spray, ignited by pilot DME spray, was examined at a high AER (up to 80%) [23]. It was found that the heat absorption of NH3 spray evaporation plays a significant role; thus, properly adjusting NH3/DME injection timing to allow for mature flame kernel formation of DME spray is a key factor affecting the ignition of NH3 spray. The maximum combustion efficiency of NH3 was obtained at ~93% [20], which remains challenging for unburned NH3 emissions. The ambient temperature was set at 900 K in [20], which might be a barrier to achieving higher combustion efficiency and AER. Furthermore, turbocharged engines enable higher compression ratios and elevated ambient temperatures at top dead center. As a result, investigating the pilot ignition process of NH3 spray using DME spray towards higher temperatures can help to bridge the gap.
In this study, the ignition process and NOx emissions of NH3 spray ignited by DME spray were investigated through CFD simulation using Converge 2.4 software. To accelerate the simulation, a compact NH3/DME mechanism is used in the simulation, which is reduced from a full NH3/DME mechanism developed in our previous study [24]. The reduced mechanism is validated against the measured ignition delay times (IDTs) [9] and laminar burning velocities (LBVs) [9]. The performance of predicting NO using the reduced mechanism was verified against the measured NO concentration from the jet stirred reactor (JSR) measurements [25]. The effect of ambient temperature, the AER and injection timing of NH3 and DME spray were studied to optimize the ignition process and mitigate NOx emissions. The constant-pressure assumption was intentionally chosen to isolate and clarify the chemical and physical mechanisms governing DME-assisted NH3 ignition under a well-controlled environment, avoiding the additional complexities associated with dynamically varying pressure and piston motion.

2. Numerical Approach

2.1. Schematic and Simulation Schemes

The schematic of the NH3/DME dual-fuel high-pressure injection model in a constant volume combustion chamber (CVCC) is shown in Figure 1. The distance between two injectors is set at 7 cm and the angle ( θ ) between two sprays is set at 120°. The start of injection (SOI) of NH3 is set at time = 0 ms. The physical properties of NH3 and DME are presented in Table 1. The simulation schemes are summarized in Table 2. The commercial software Converge was used to run CFD simulations. The computational domain was defined as a rectangular box with dimensions of 48 mm × 48 mm × 97 mm. Mesh independent analysis has been performed in our previous study [23], and a base grid size of 4 mm was proved to maintain simulation accuracy with high computational efficiency.

2.2. Mechanism Reduction and Validation

An accurate NH3/DME combustion mechanism was proposed in our previous study [24], which was validated rigorously against the measured IDTs, LBVs and NO concentrations. This mechanism is reduced using the DRGEP method [27,28] in the Chemkin Pro 19.2 software and a few key reactions are updated to achieve better prediction in this study. In particular, the interaction between DME and amine radical, CH3OCH3 + NH2 = CH3OCH2 + NH3, is very important for IDT prediction. The A-factor of the Arrhenius equation was reduced by a factor of 2.5 and the activation energy was increased by 2 kcal/mol from the calculated ab initio rate constant in our previous study [9] to achieve better agreement between calculated and measured IDTs. In this reduced mechanism, the rate constant was changed back to the original calculated values, which are fairly accurate. Eventually, a reduced NH3/DME mechanism is obtained with 94 species and 562 reactions and further used for CFD simulation.
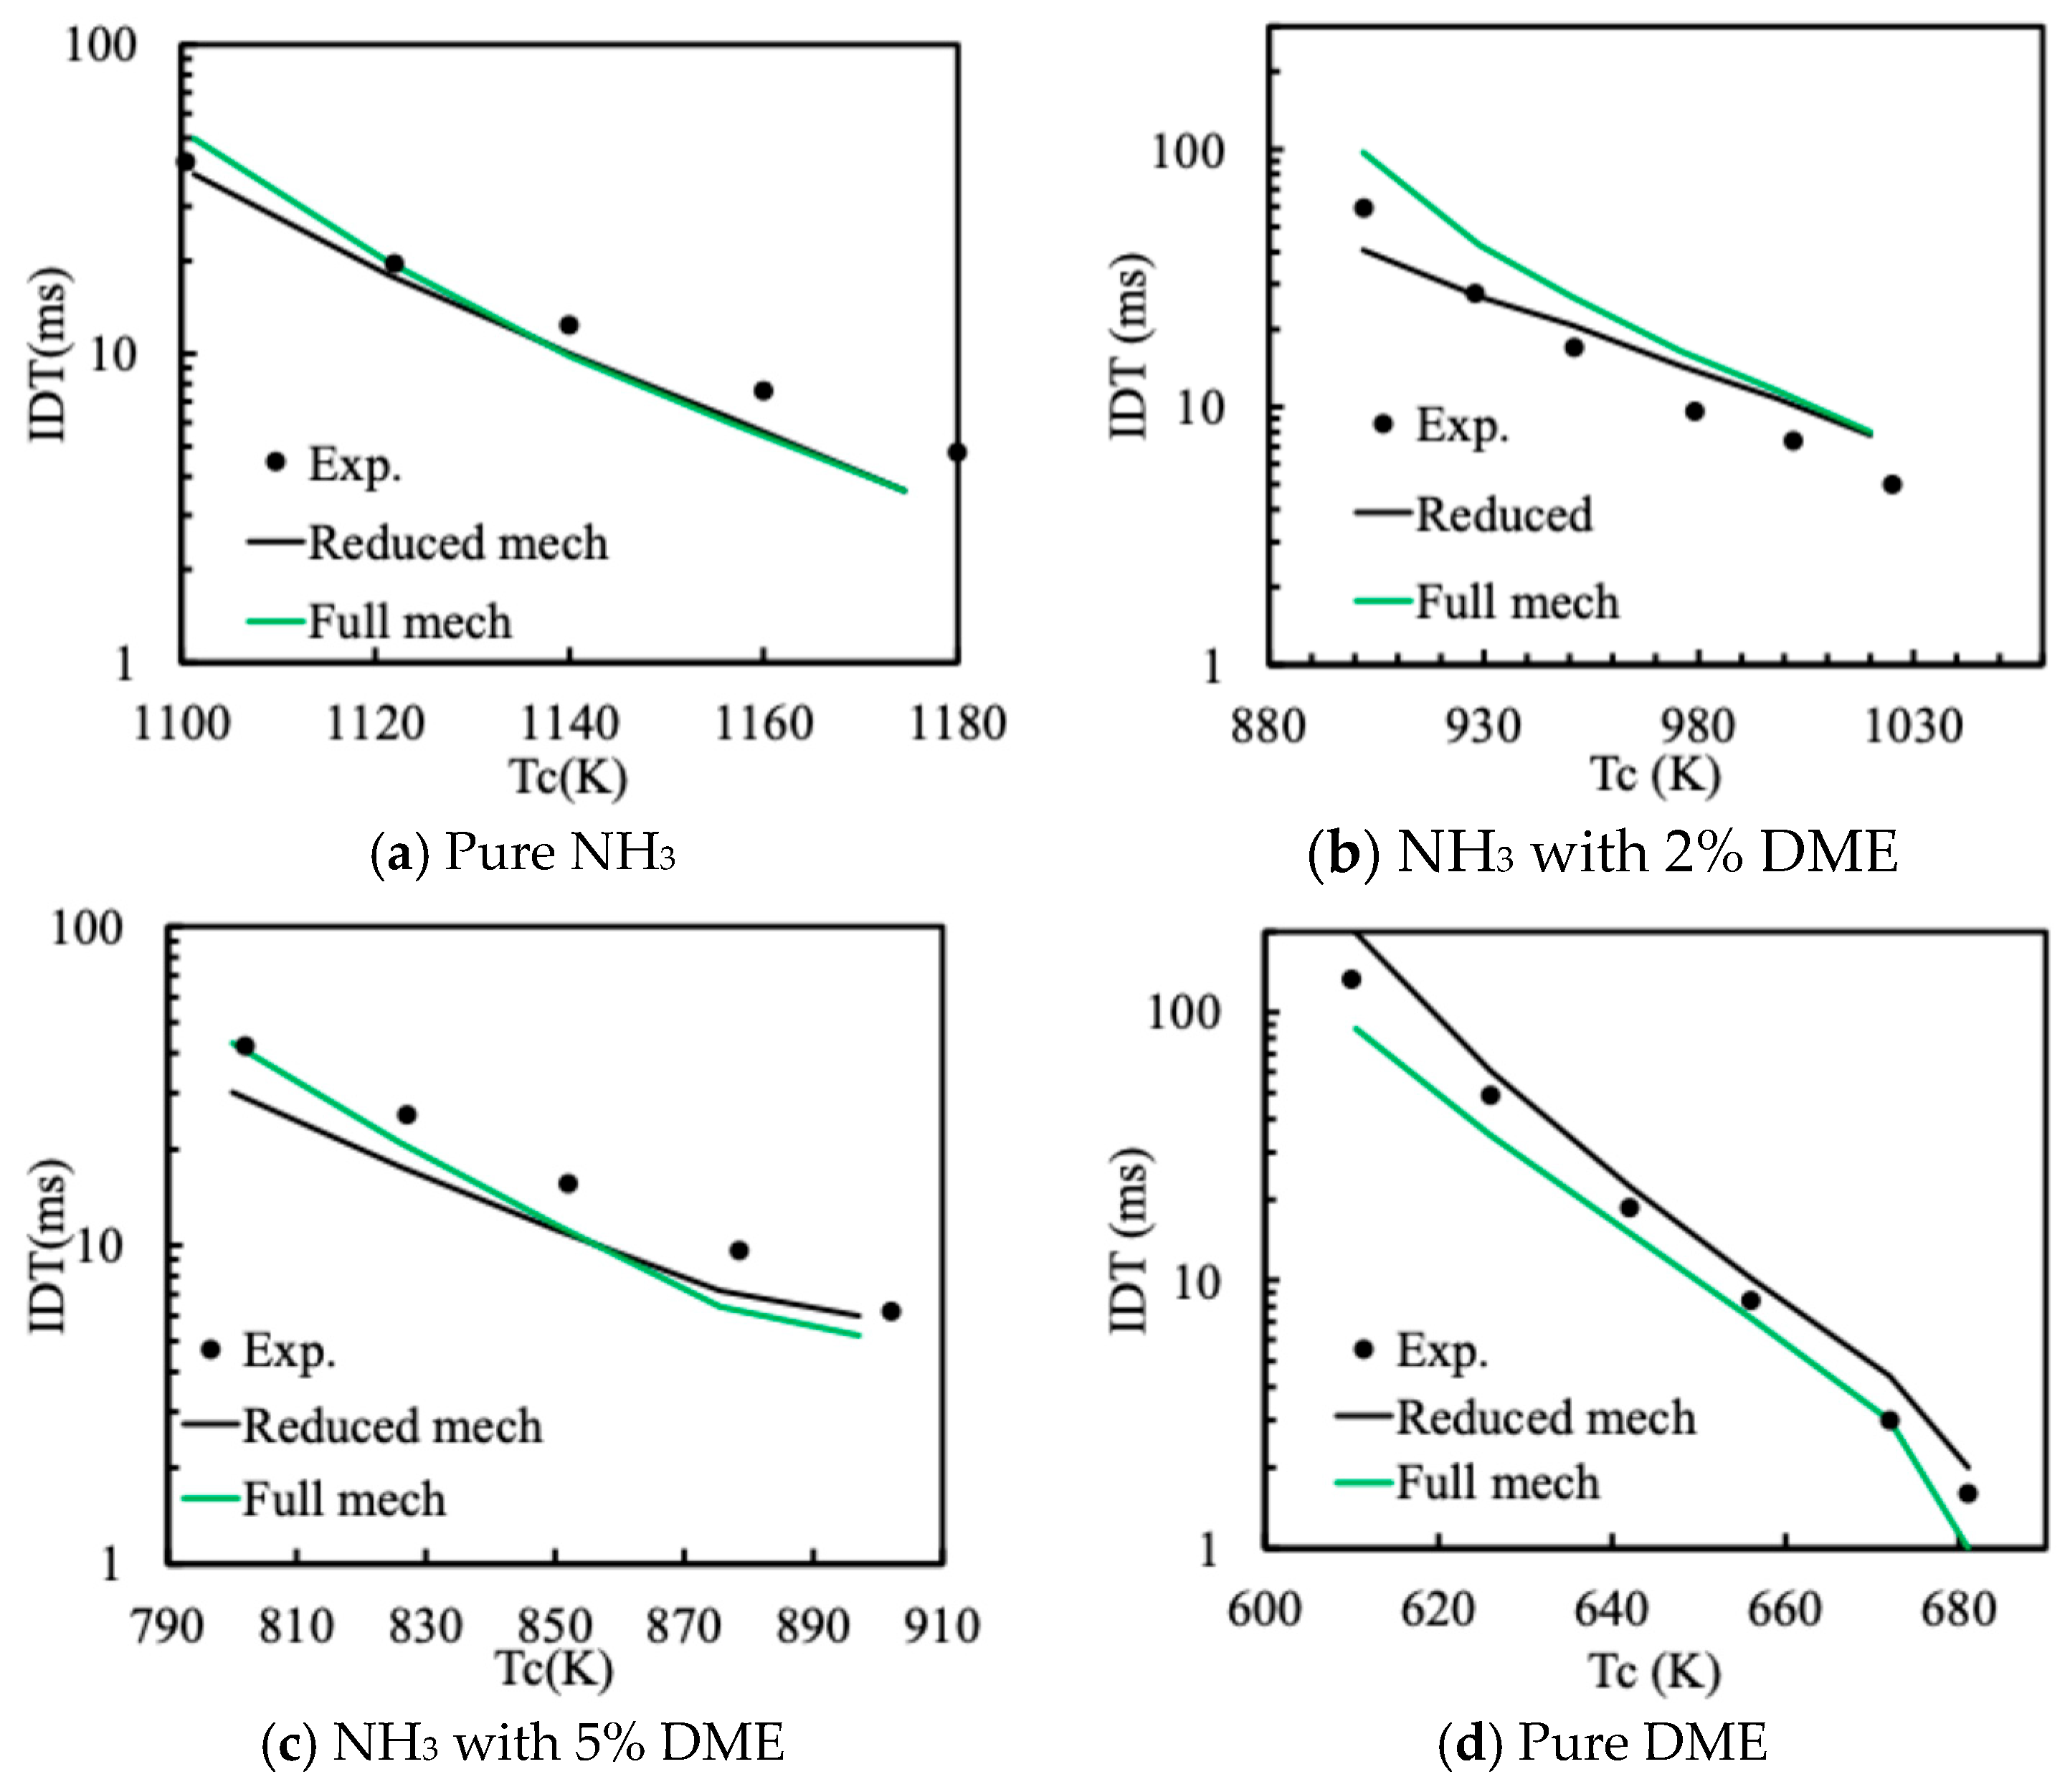
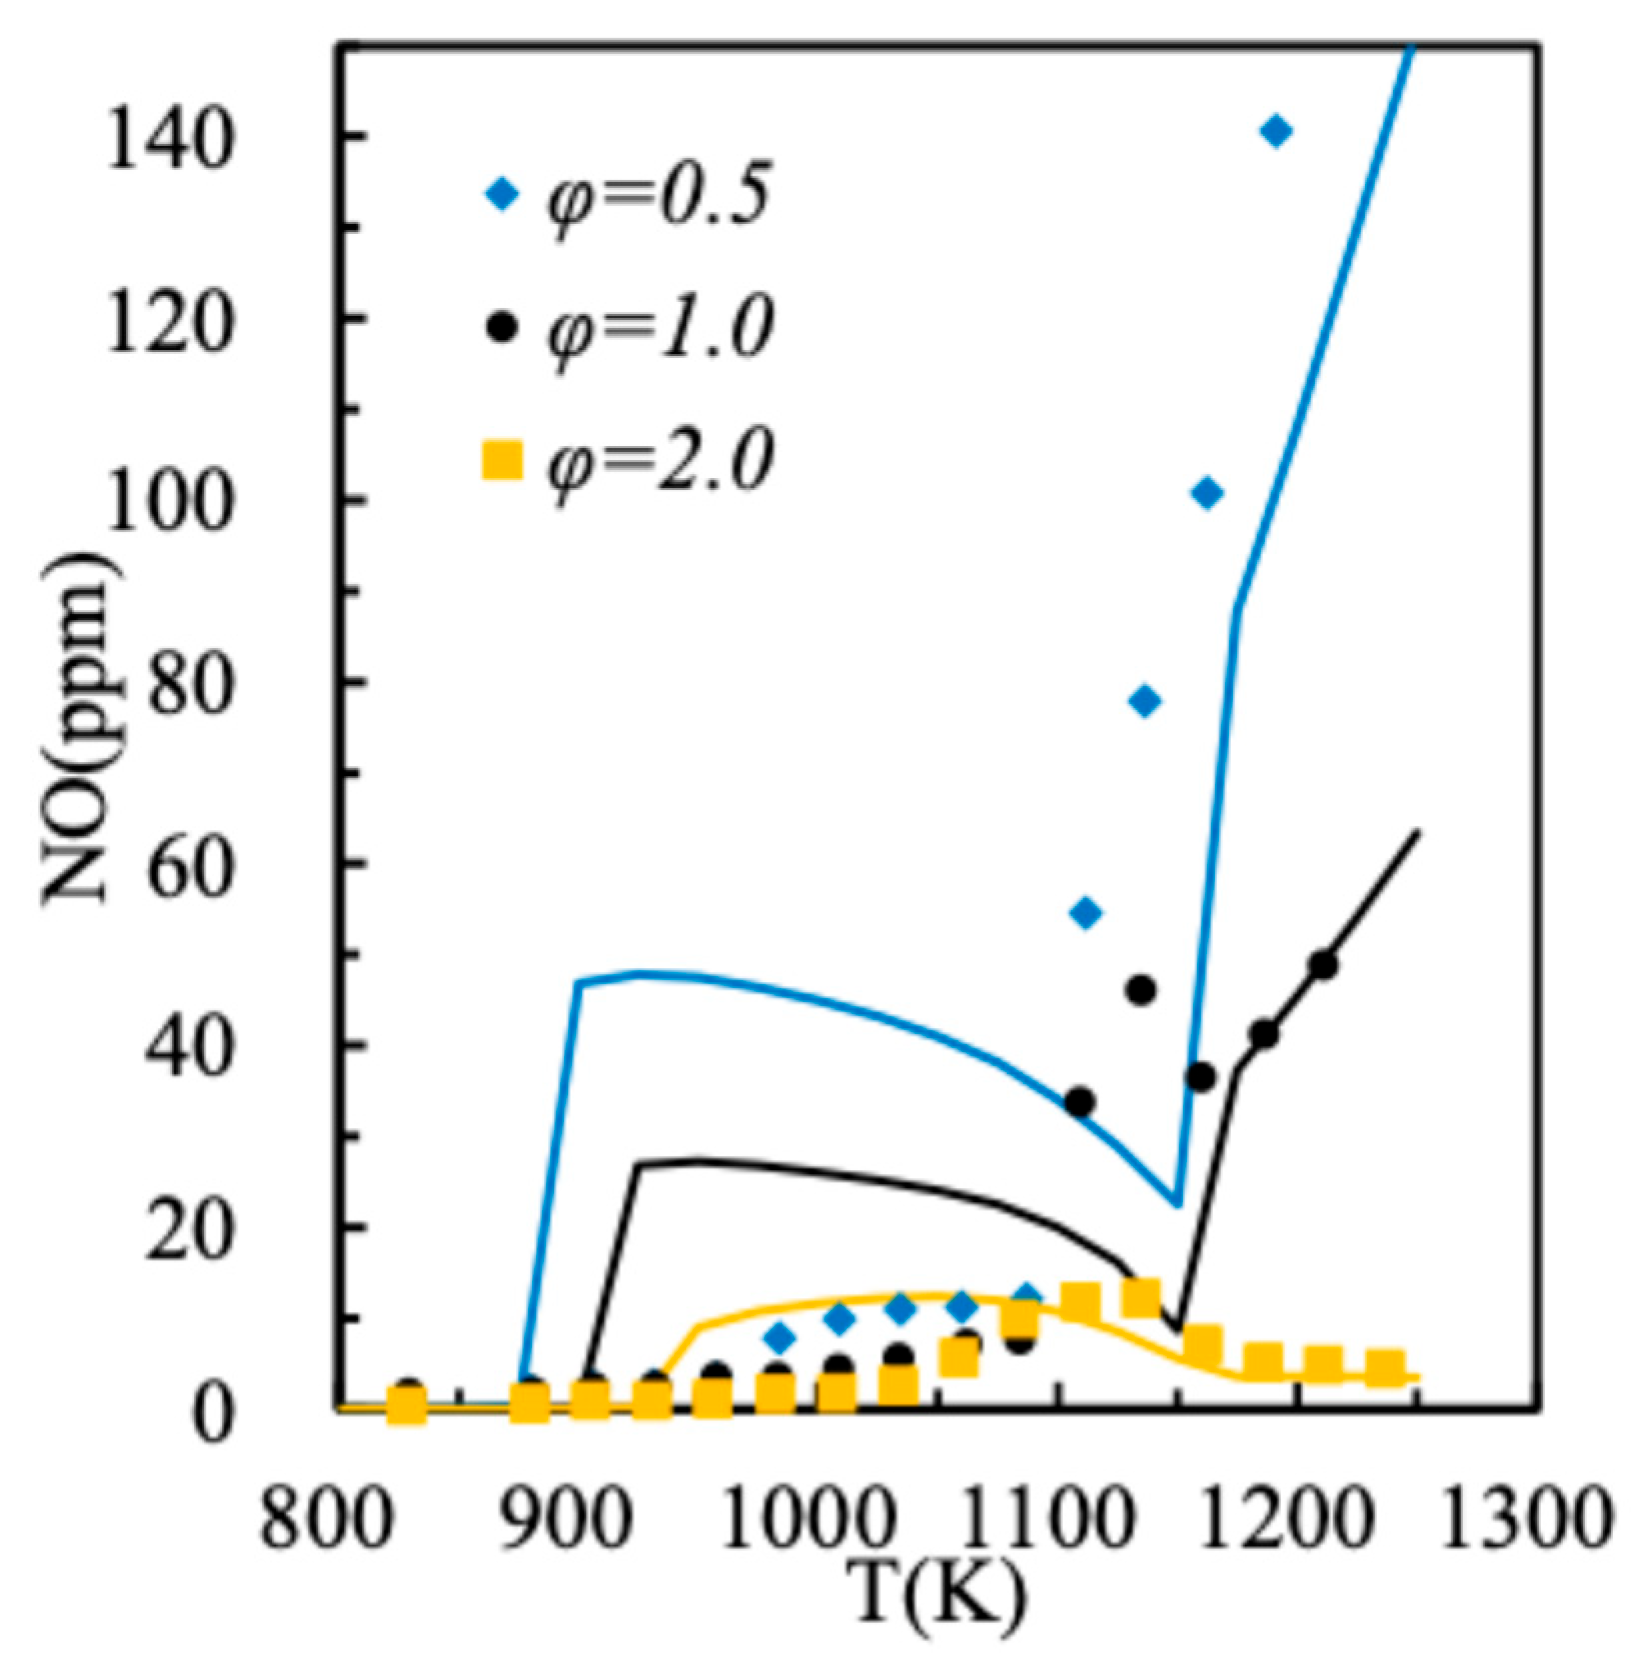
The measured and calculated LBVs of NH3, with 20% DME addition as a function of φ using different O2 content at 298 K/1 bar and 373 K/473 K/5 bar using an air oxidizer, are shown in Figure 2. Clearly, the reduced mechanism accurately predicts the measured LBVs and shows even better performance when compared to the original full mechanism under some conditions. More validations are provided in the Supplementary Material. The measured and calculated IDTs at φ = 1.0 and compression pressure (Pc) of 60 bar are shown in Figure 3. The reduced mechanism reproduces the measured IDTs well at condition studies. More validations at φ = 0.5 and 2.0 are provided in the Supplementary Material as well. The measured NO concentration in a jet stirred reactor (JSR) from Yin et al. [25] was used for mechanism validation. The calculated NO concentration of NH3 with 50% DME, using the reduced mechanism from this study and measured NO as a function of temperature, is shown in Figure 4. The reduced mechanism accurately predicts the measured NO concentrations well, although slight underprediction is observed at around 1150 K, φ = 1.0.

2.3. Spray Model Verification

The accuracy of spray ignition modeling heavily depends on the accuracy of physicochemical models of NH3 and DME. The Kelvin–Helmholtz and Rayleigh–Taylor (KH-RT) model [29] was employed to simulate droplet breakup and atomization processes [30]. The KH (Kelvin–Helmholtz) component primarily describes the primary and secondary droplet breakup induced by the instability of cylindrical liquid jets and viscous effects. In this model, the breakup time (τKH) and the droplet radius after breakup (rKH) are defined as follows:
τ K H = 3.726 B 1 r 0 Λ K H Ω K H ,   r K H = B 0 Λ K H  
where r0 means the initial droplet radius, ΛKH denotes the wavelength of the perturbation wave and ΩKH represents the maximum growth rate of the perturbation wave. The RT (Rayleigh–Taylor) model describes droplet breakup induced by the effect of drag forces, proposing that RT wave instability induces liquid breakup at a specific distance from the nozzle. The breakup time (τRT) and droplet radius after breakup (rRT) are expressed as follows:
τ R T = C τ Ω R T ,   r R T = C R T Λ R T Ω R T  
where ΛRT denotes the wavelength of the most unstable perturbation wave and ΩRT represents its frequency. Because liquid ammonia (NH3) and dimethyl ether (DME) differ notably in physical properties such as viscosity and density, separate parameter settings are required for each in the KH–RT spray breakup model.
In addition to the KH-RT model, the Redlich–Kwong equation [31] was employed to characterize gas states, while the Reynolds-Averaged Navier–Stokes (RANS) RNG k-ε model [29] was used to describe the complex turbulent flow within the combustion chamber. The method proposed by O’Rourke and Amsden was used to model droplet collisions and wall interactions [32]. The No Time Counter (NTC) method and Frossling correlation [33] were used to simulate droplet collisions and evaporation, respectively. The SAGE model [34] was used to compute the reaction rate coupling the reduced mechanism. Detailed spray model validations of NH3 and DME were performed in our previous study [23], which show good agreement between the simulations and experiments from the literature. As a result, the same spray models are used in this study, and the detailed coefficients of spray models are presented in Table 3.

3. Results and Discussion

3.1. Effect of Ambient Temperature on the Ignition Process

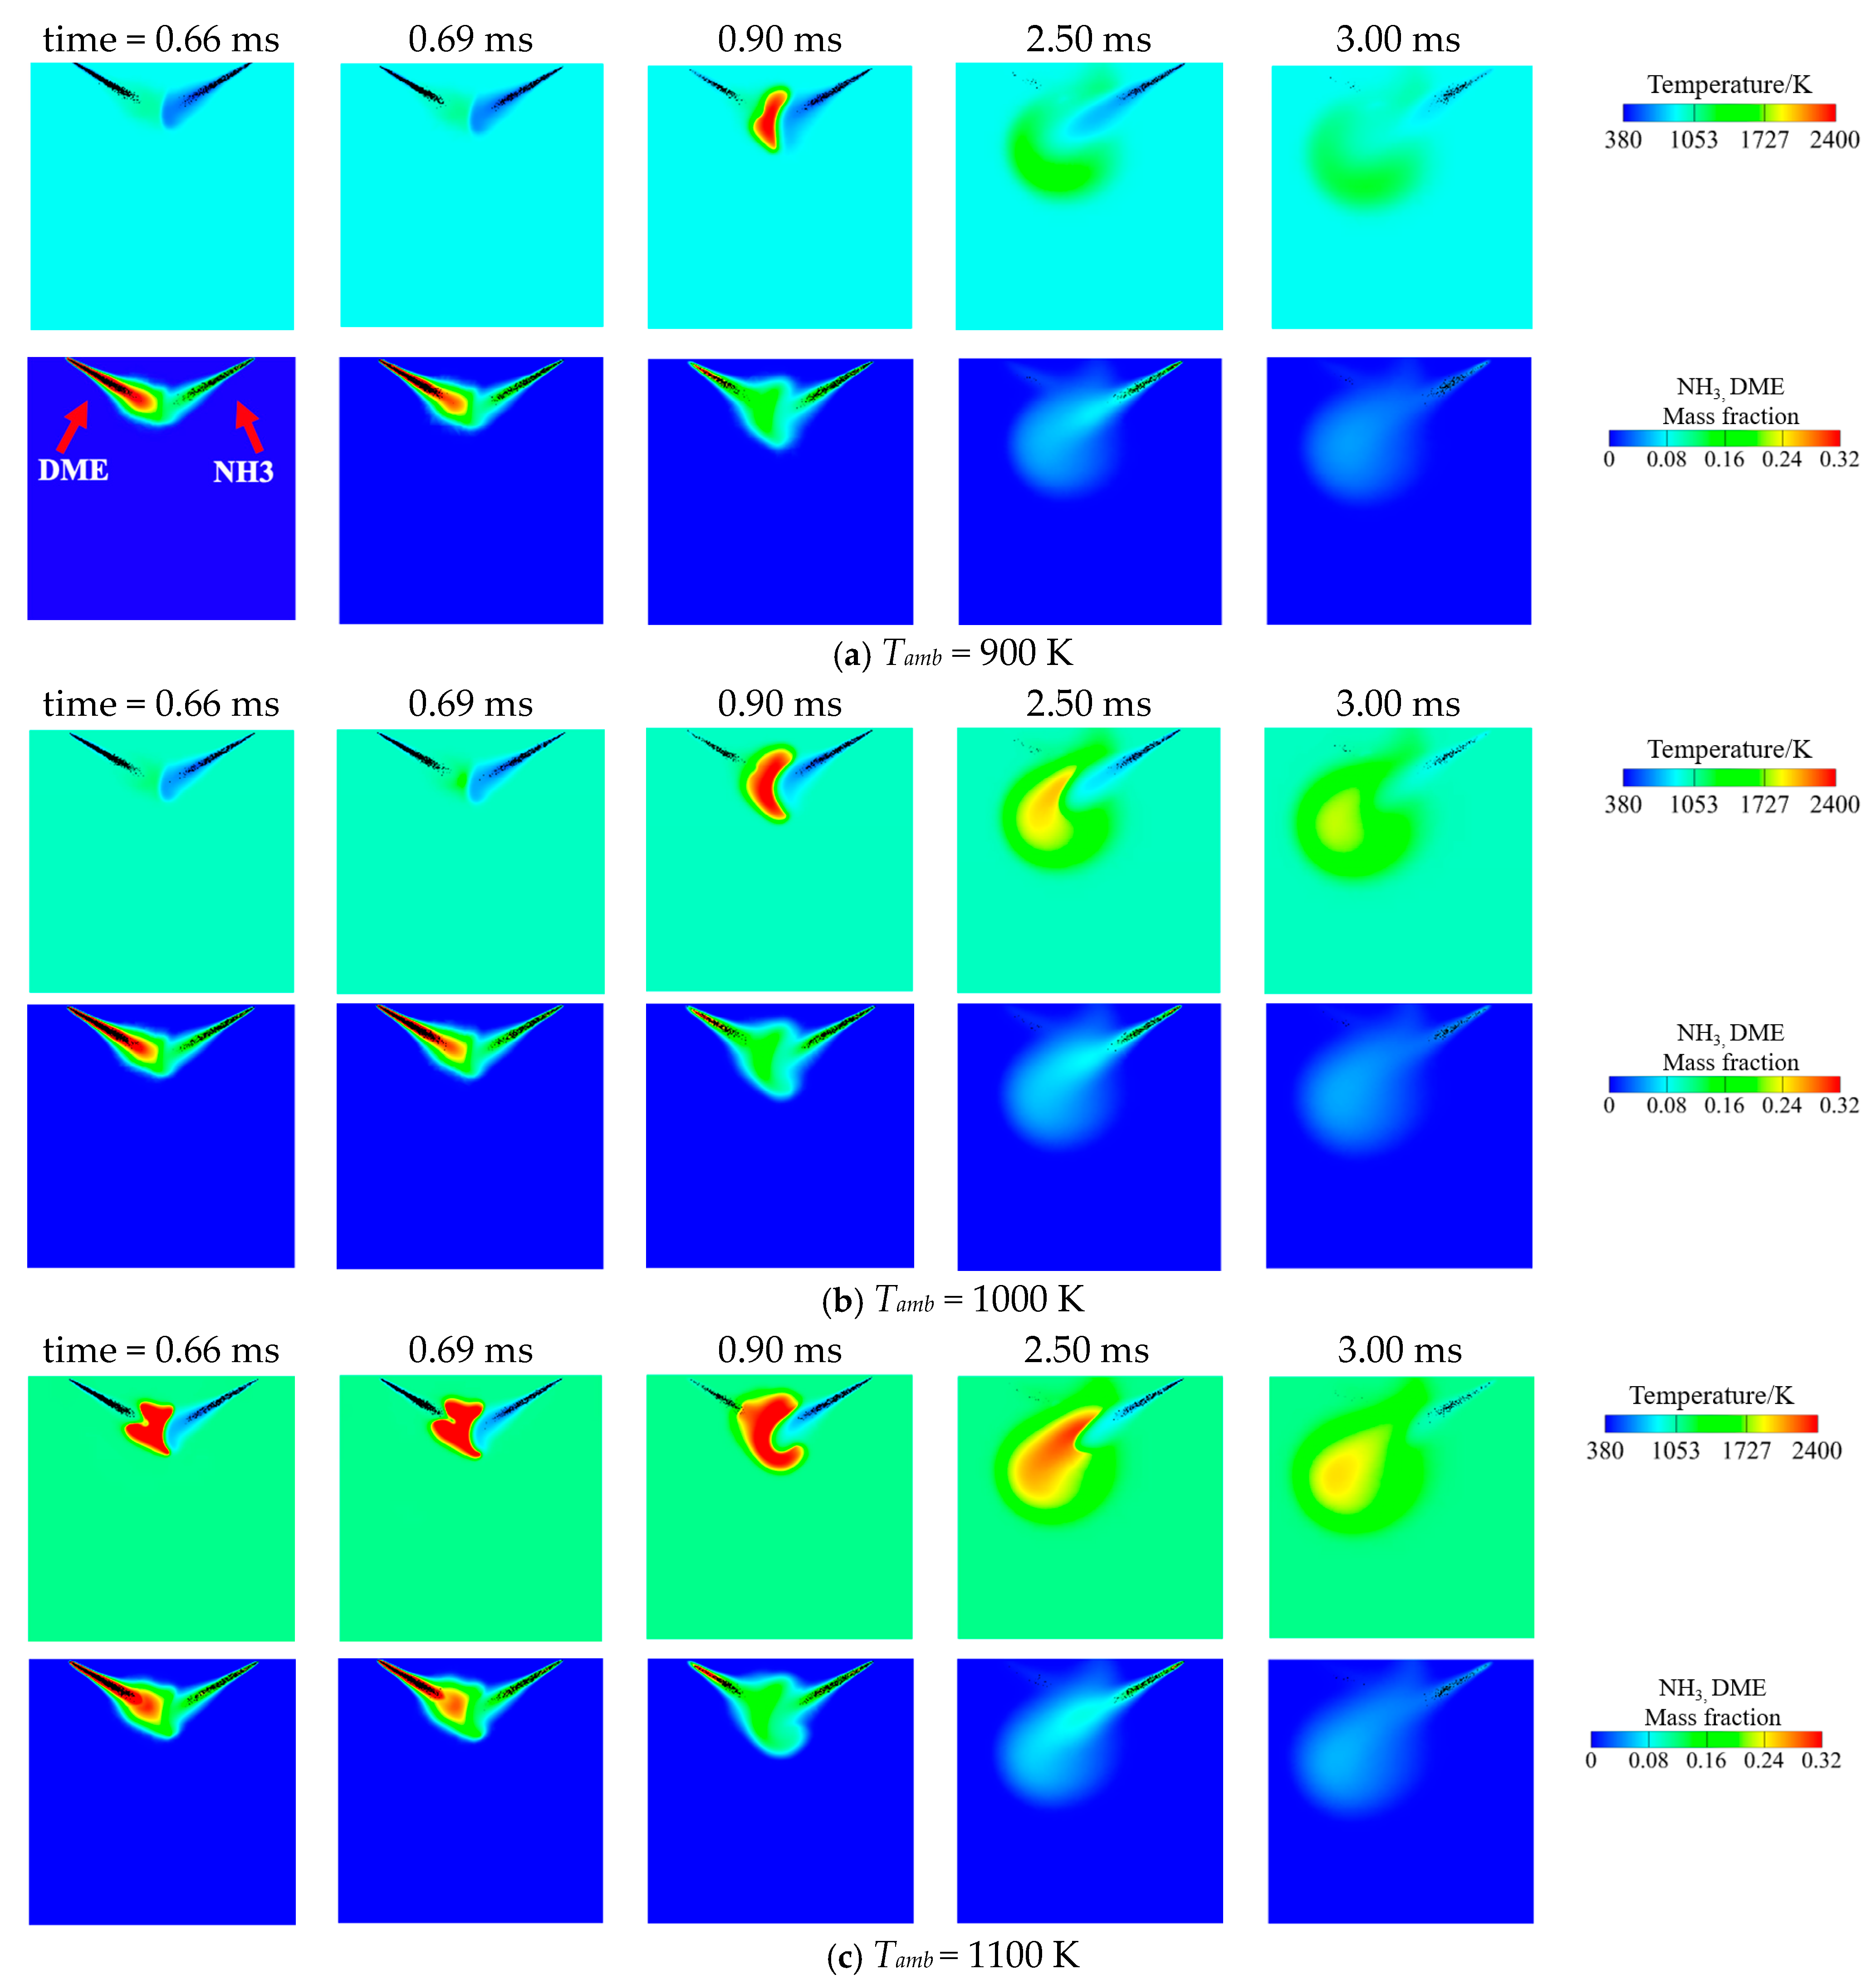
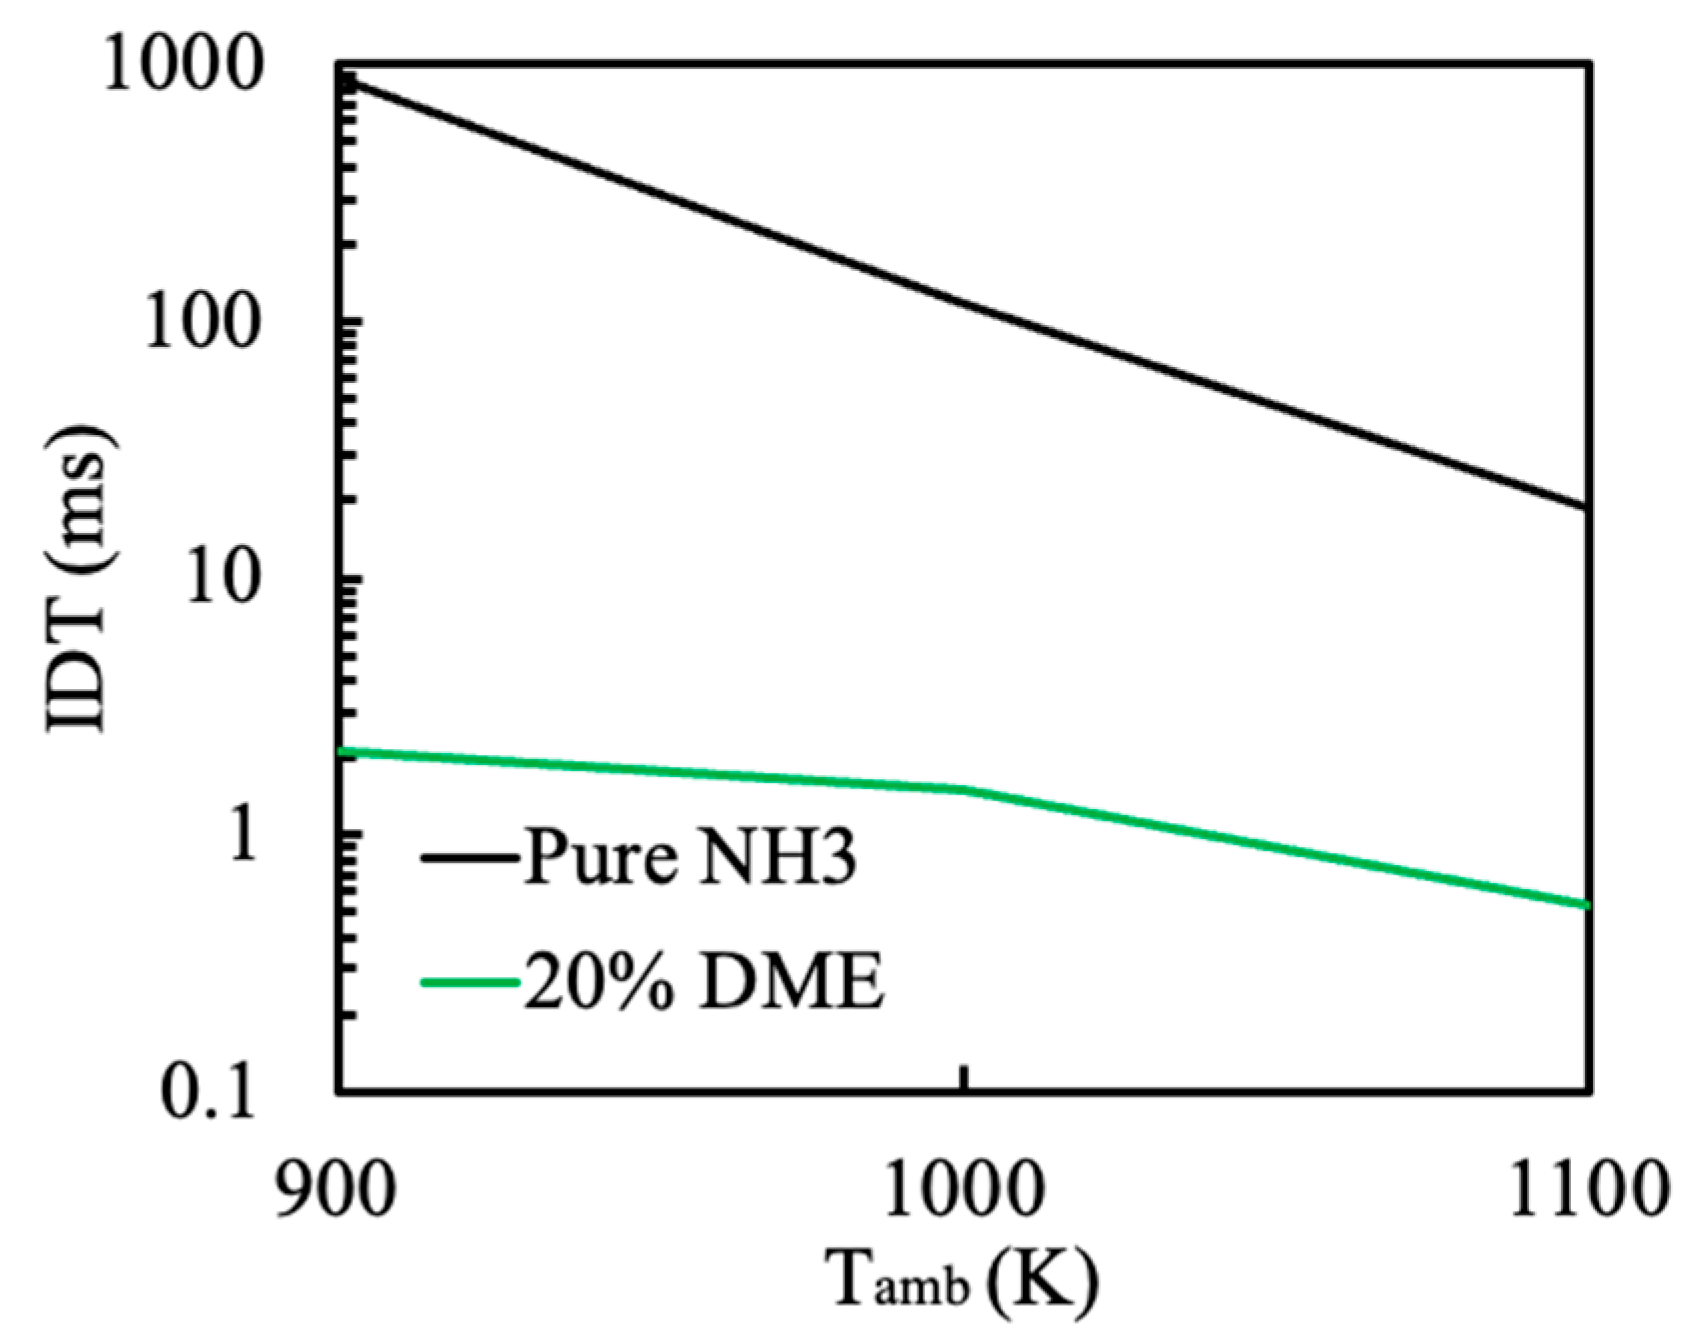
The ambient temperature is the initial temperature inside the combustion chamber before fuel injection, which has a profound effect on the ignition process. The calculated temperature contour and mass fractions of NH3 and DME at different ambient temperatures are shown in Figure 5. The DME and NH3 sprays are injected simultaneously and AER is set at 80%. The dark particles represent fuel droplets which are not evaporated due to either low temperatures or short evaporation time. As can be observed, the tip of the DME spray ignites at time = 0.9 ms and the flame front starts to ignite the ammonia spray at the head of the NH3 spray. Considering the significant cooling effect of NH3 evaporation, the temperature of NH3 vapors remain lower than the ambient temperature even after coming into contact with the flame front of DME spray at time = 0.9 ms. The NH3 flame grows to ~1700 K after DME is totally burned at time = 2.5 ms and remarkably cold NH3 spray and droplets are surrounded by NH3 flames, which are continuously consumed at time = 3.0 ms. When the ambient temperature is increased to 1000 K, the flame kernel area of DME spray is larger than that at Tamb = 900 K and time = 0.9 ms, which results in higher heat transfer to heat up NH3 spray. Furthermore, the reactivity of NH3 is increased at higher ambient temperatures; as a result, the flame kernel temperature of NH3 spray is much higher that at Tamb = 1000 K and time = 2.5 ms. Increasing the ambient temperature to 1100 K leads to a dramatic acceleration of DME autoignition and NH3 combustion. Specifically, DME autoignition is accelerated and stable flame kernel of DME sprays is observed at 0.66 ms as shown in Figure 5c. The flame kernel area is twice as large than it was at Tamb = 900 K and time = 0.9 ms, which wraps up the cold NH3 spray facilitating heat transfer from DME flame to cold NH3 spray. Consequently, much higher NH3 flame temperature is observed in Figure 5c. Focusing on the DME and NH3 mass fractions at these three different ambient temperatures, the evaporations of DME and NH3 are both slightly prompted at higher Tamb. However, compared to more pronounced changes in flame kernels area and temperatures, it can be found that increased ambient temperatures enhance autoignition of NH3/DME sprays primarily via enhanced fuel reactivity rather than faster evaporation rate. The calculated IDTs of pure NH3 and NH3 with 20% DME at 3.8 MPa are shown in Figure 6. Clearly, increasing temperature from 900 K to 1100 K leads to ~2 orders of magnitude decrease in IDT of pure NH3. The IDTs of NH3 with 20% DME are reduced from 2.1 ms to 0.53 ms, which is in line with the accelerated autoignition observed in Figure 5.
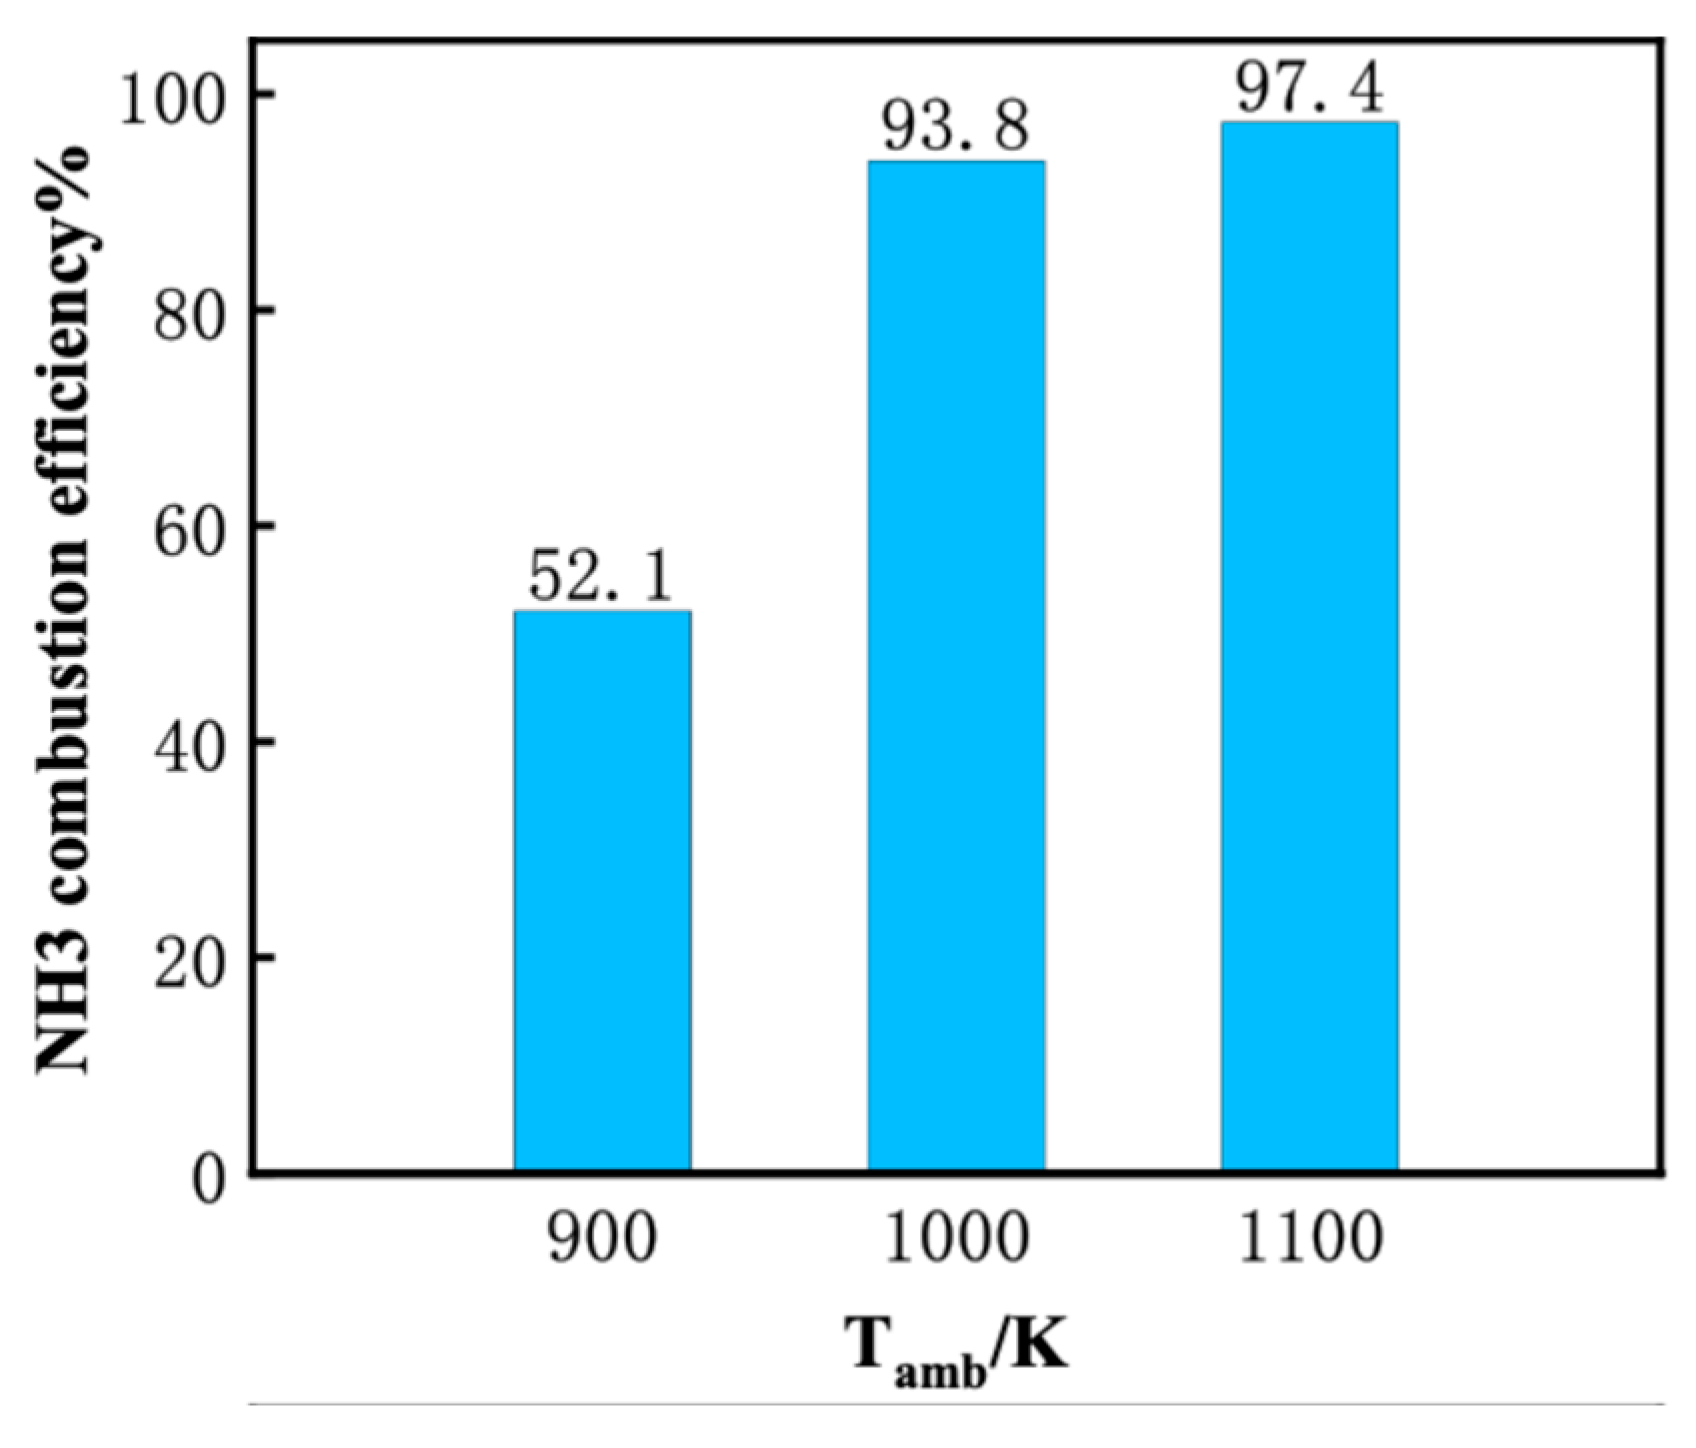
The higher ambient temperature not only accelerates the autoignition process, but also improves the combustion efficiency. As shown in Figure 7, the combustion efficiency of NH3 at Tamb = 900 K is 52.1%, which indicates that only half of NH3 is burned at the end. The combustion efficiency of NH3 is increased to 93.8% and 97.4%, respectively, when Tamb is increased to 1000 K and 1100 K. Considering the significant heat absorption of NH3 evaporation and low reactivity, using DME as pilot fuel and enhancing the ambient temperature simultaneously are realistic solutions to promote both NH3 autoignition and combustion efficiency.
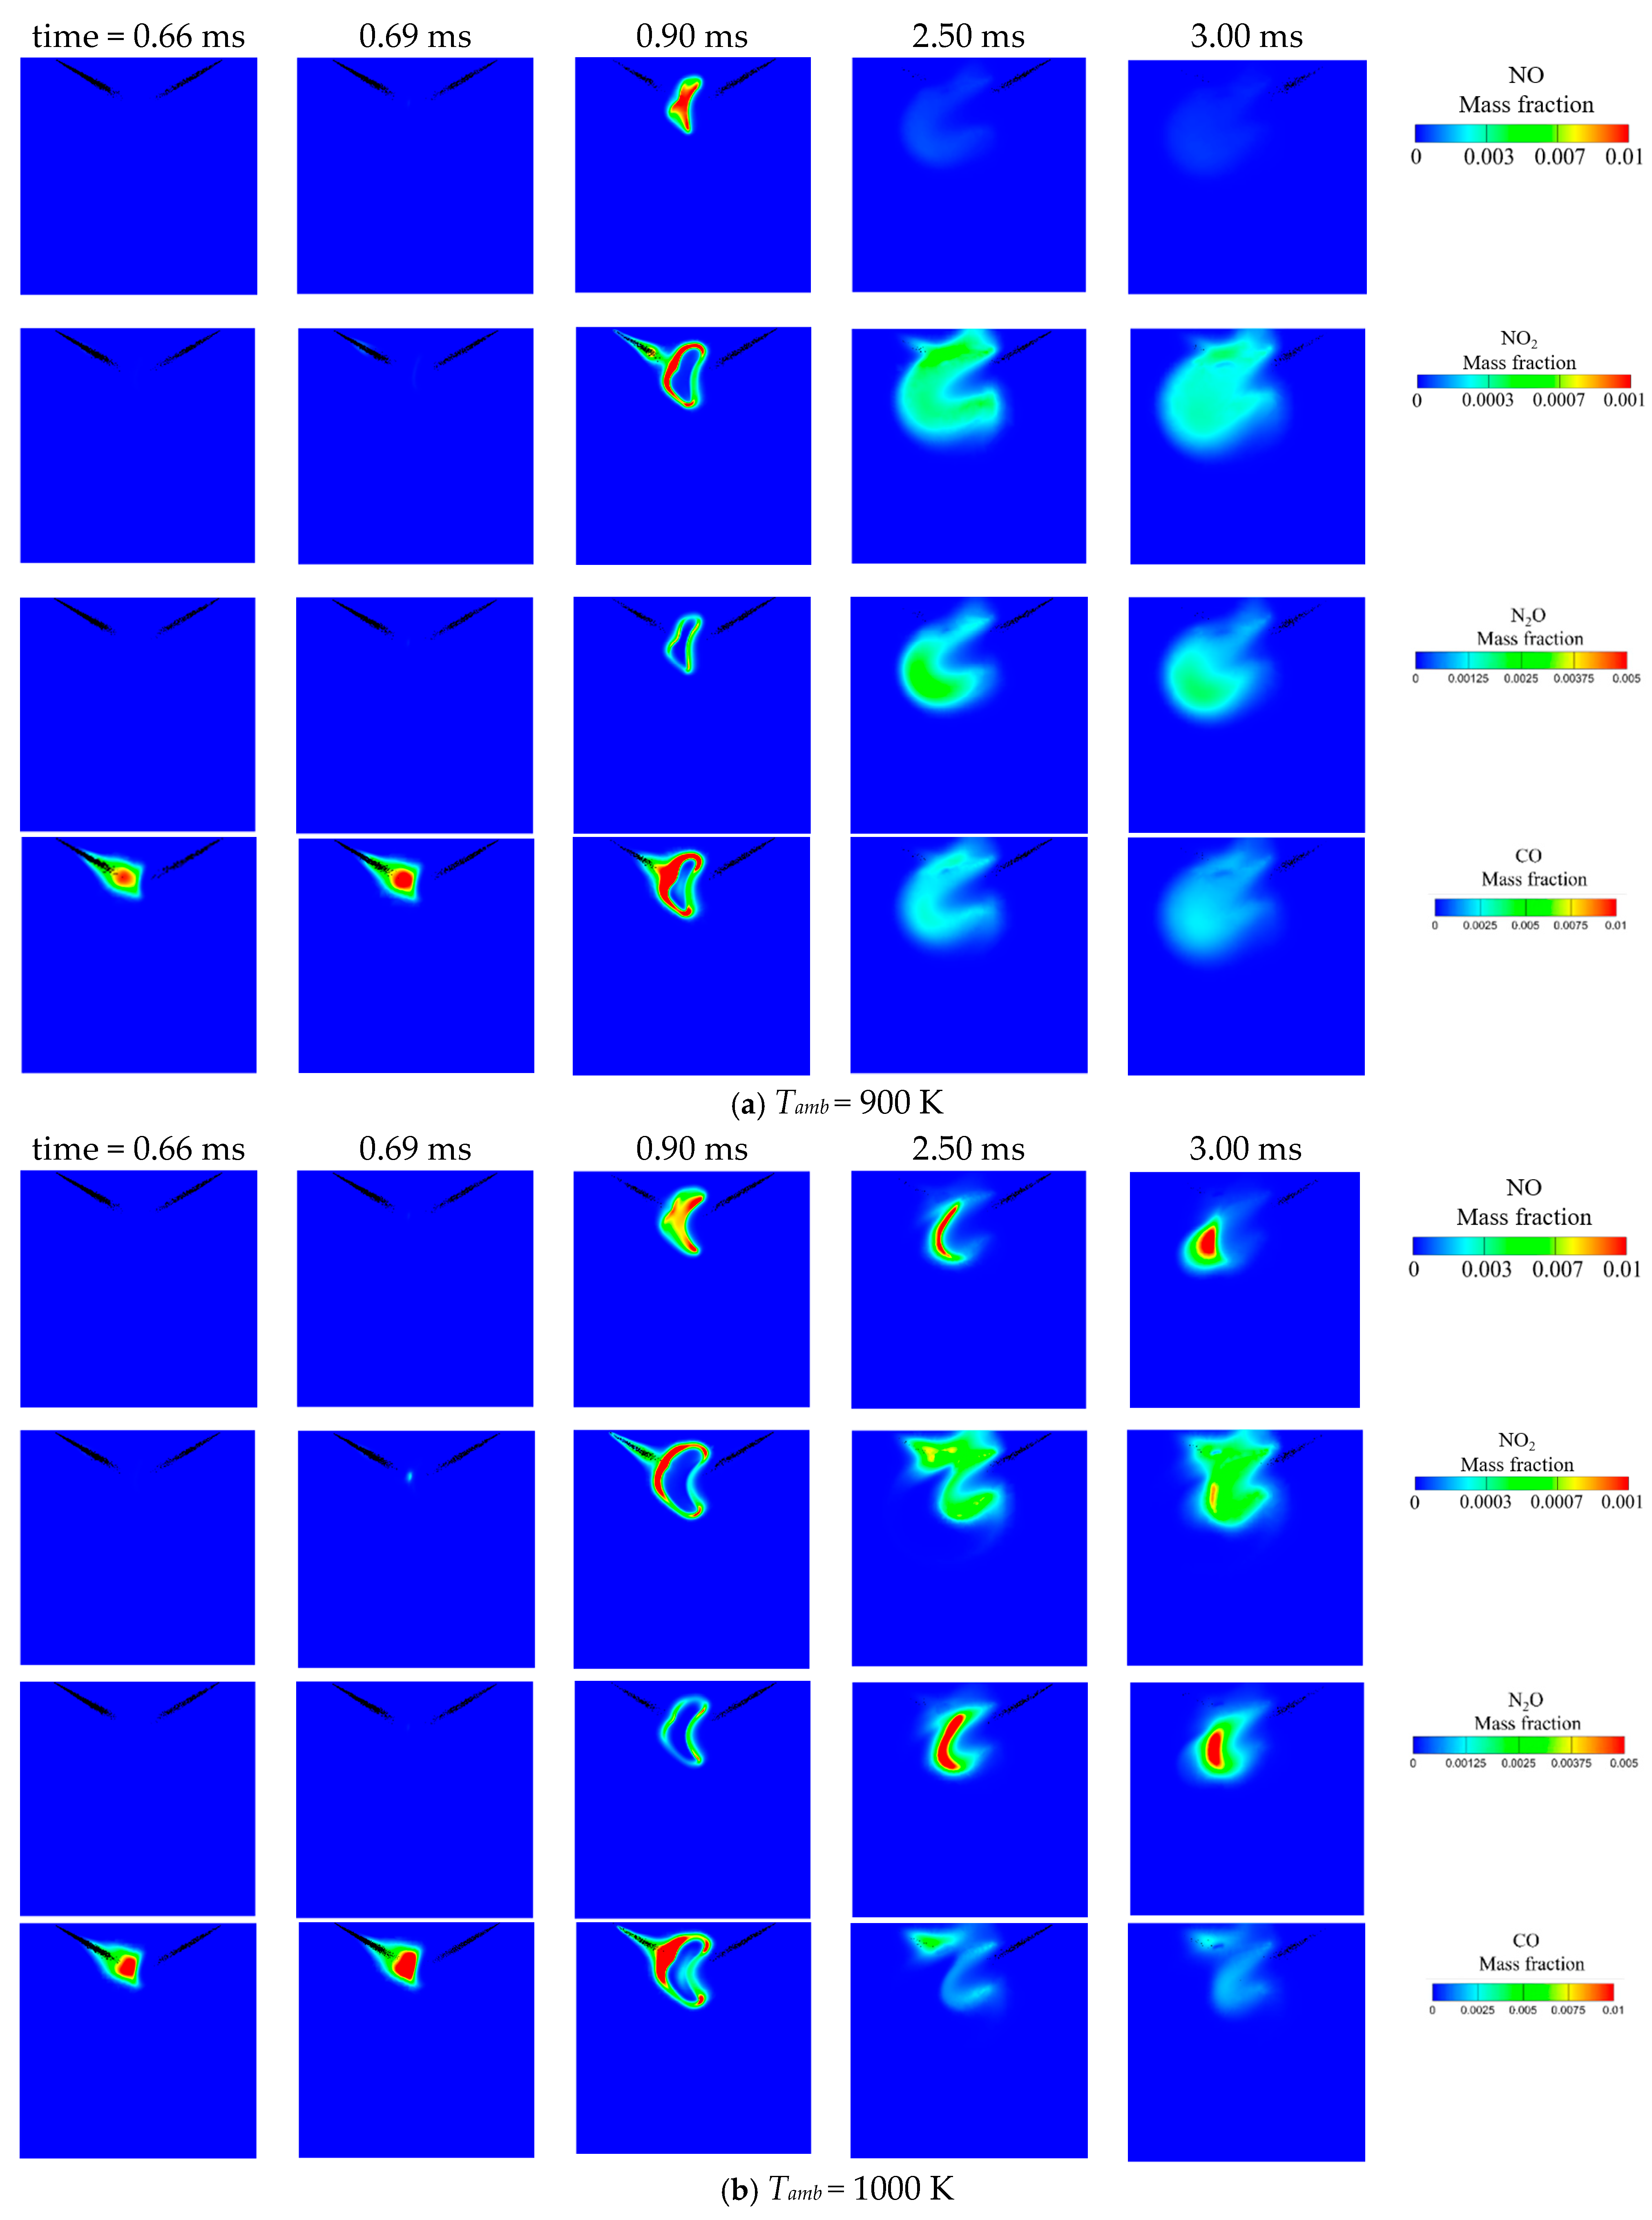
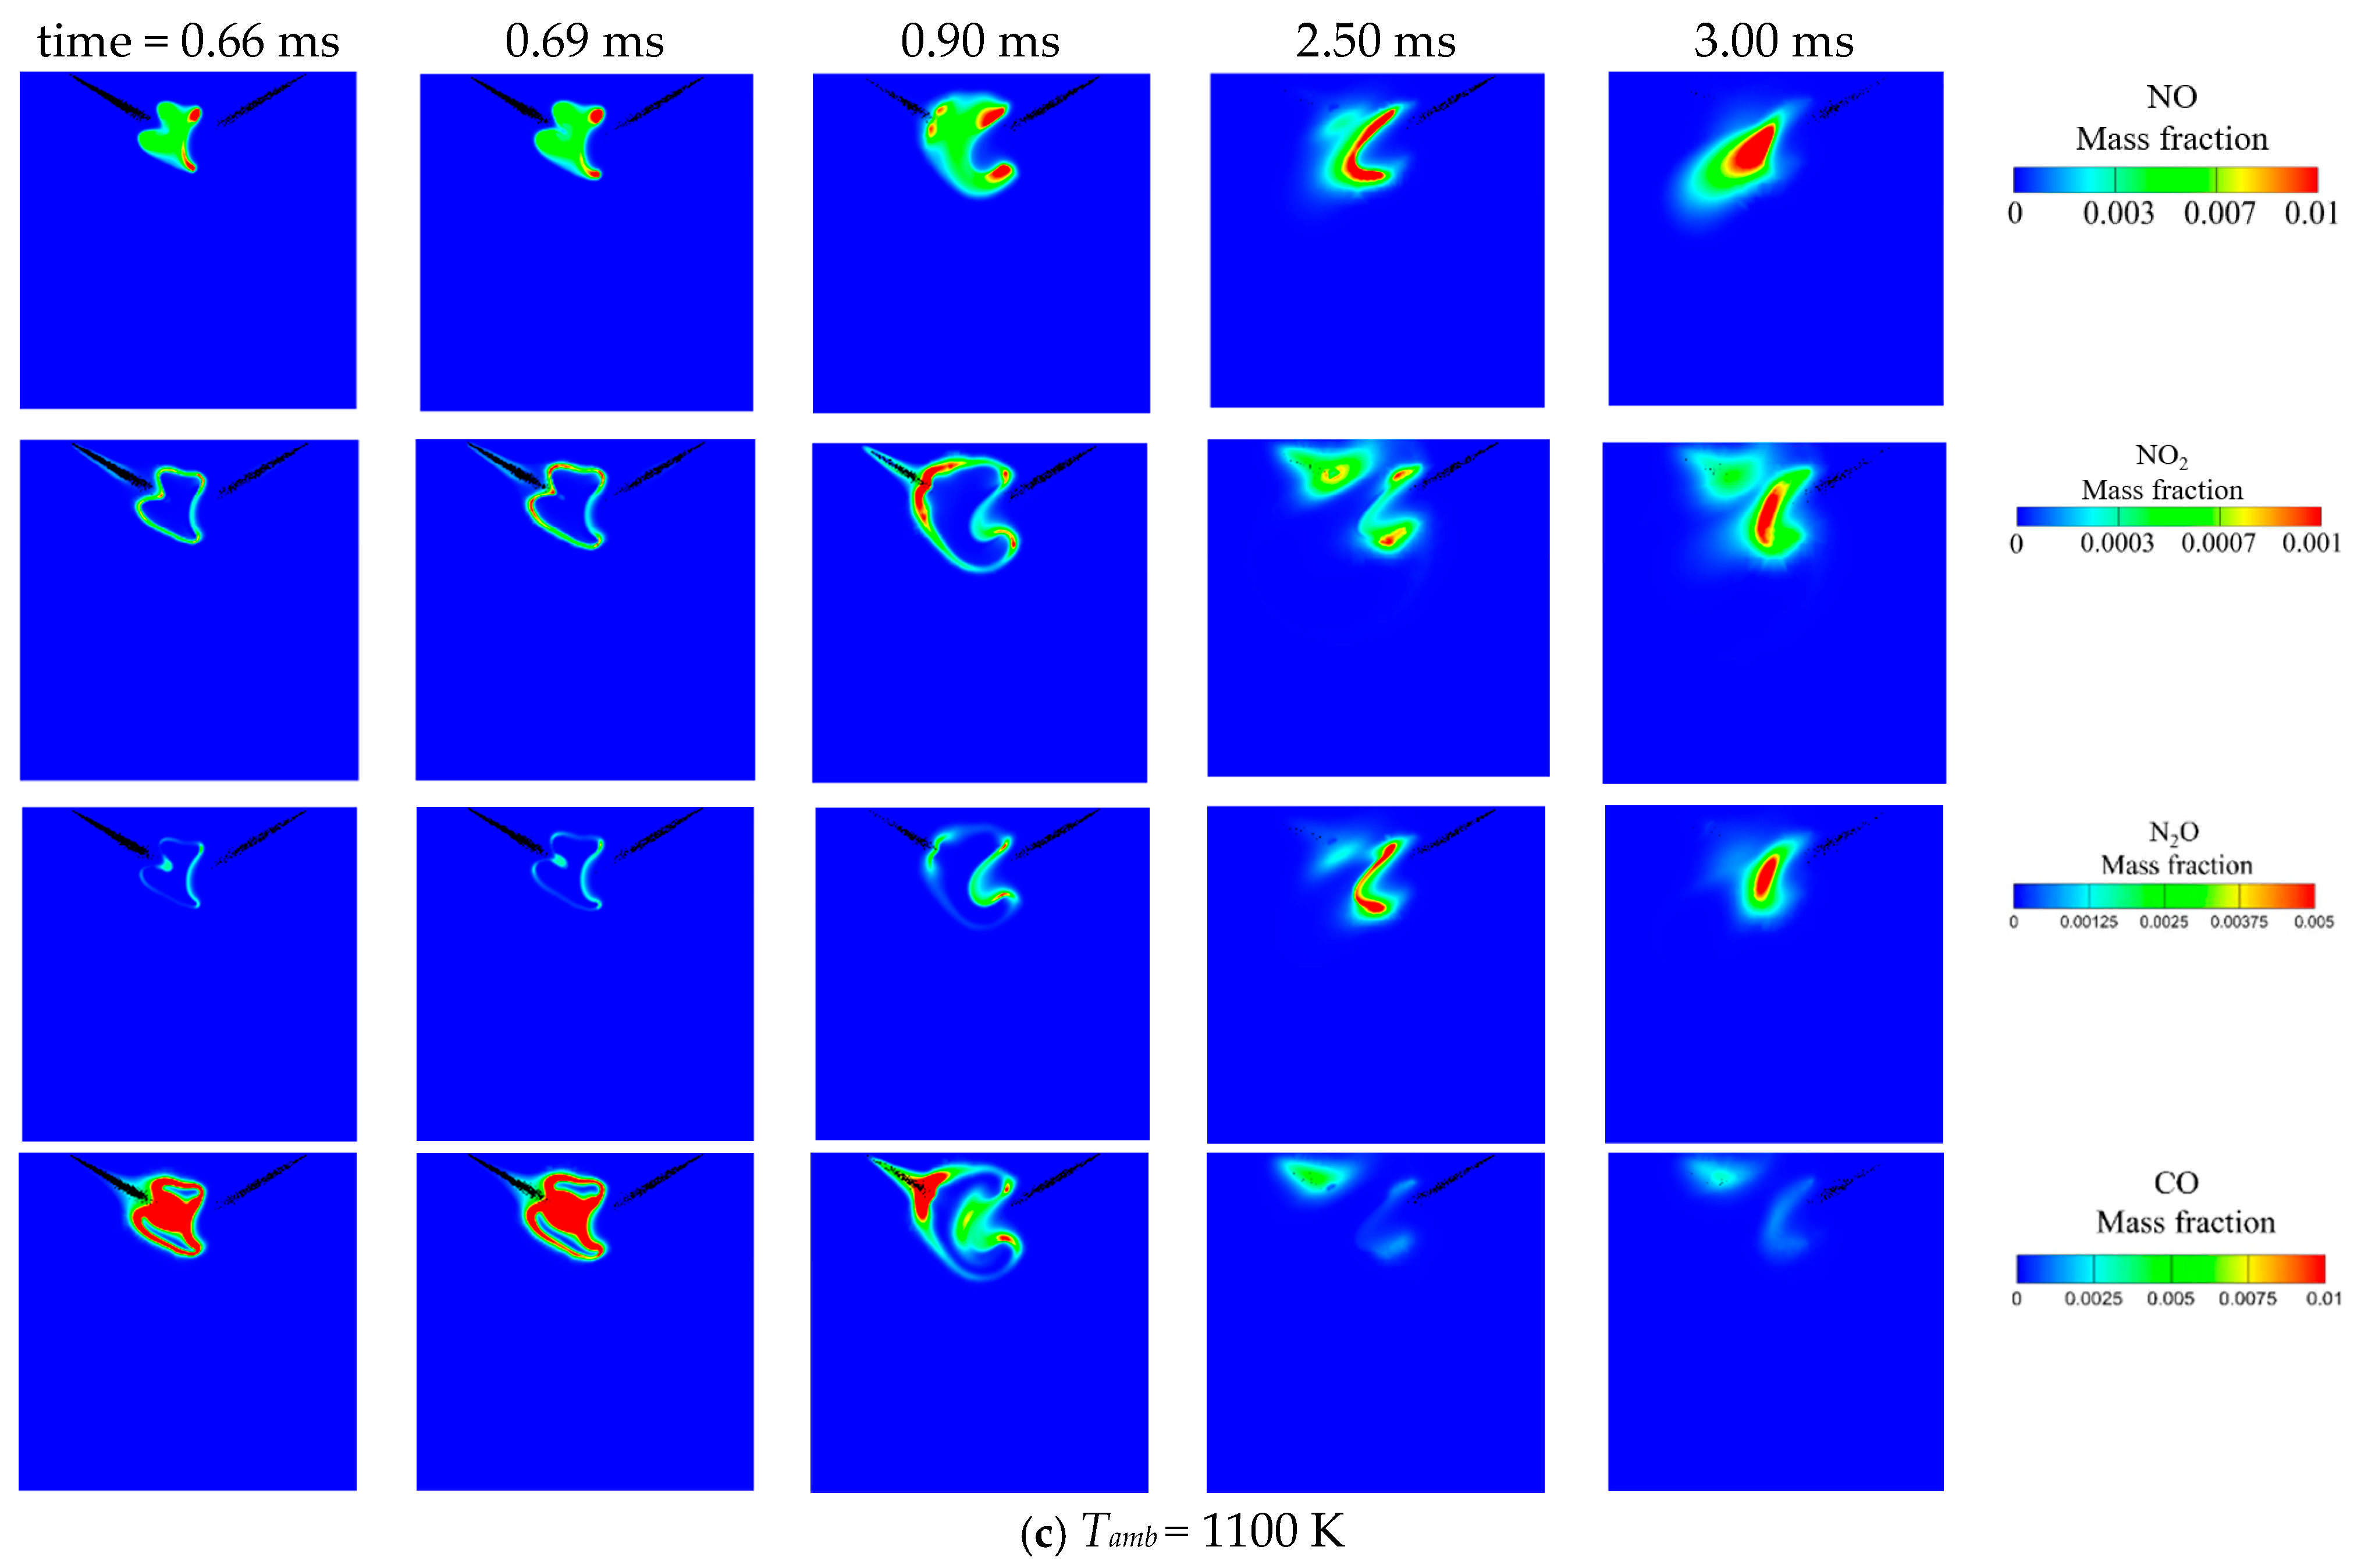
To further understand the pollution formation during the ignition and flame propagation process, the NO, NO2, N2O and CO mass fractions at the same condition as that in Figure 5 are presented in Figure 8. The NO formation location strongly overlaps with the flame front where high flame temperature and OH concentration at the flame front facilitate the NO formation compared to the flame contour and NO mass fraction at time = 0.9 ms and Tamb = 900 K in Figure 5 and Figure 8. That is because NO formation is prompted at high flame temperatures; such strong correlations between NO and temperature have been discussed in a previous study [35]. NO mass fraction after 0.9 ms is dramatically reduced in Figure 8a; it can be attributed to the lower flame temperature (see Figure 5a) and combustion efficiency of NH3 at Tamb = 900 K, as shown in Figure 7. Nearly half of NH3 is not burned and generates de-NOx agent NH2 radicals. The abundant NH2 radical consumes NO via
NH2 + NO = N2 + H2O (R1).
R1 is a famous selective non-catalyst reduction (SNCR) reaction, which works efficiently at the temperature range of 1150~1350 K. The flame temperature at time = 2.5 and 3.0 ms in Figure 5a is close to this temperature range and thus benefits the NO reduction through R1.
NO2 is primarily formed around the periphery of NO, and the concentration is nearly one magnitude lower than NO. The NO2 is mainly generated from NO via
HO2 + NO = NO2 + OH (R2)
NO + O(+M) = NO2(+M) (R3).
The forward direction of R3 favors low temperature, which is why NO2 is formed at medium-flame temperatures or a post-flame zone in a practical combustion device. Additionally, R3 is a pressure-dependent reaction, which becomes very important at a high ambient pressure of 3.8 MPa. However, due to the presence of DME and its oxidation product, CH2O and CH3, the produced NO2 is partially consumed by these species via
CH2O + NO2 = HCO + HONO (R4)
CH3 + NO2 = CH3O + NO (R5)
NH2 and HNO play an important role in converting NO2 back to NO, via
NH2 + NO2 = H2NO + NO (R6)
HNO + NO2 = HONO + NO (R7).
In conclusion, NO formation and NO2 formation is strongly correlated to high-flame temperature and medium-flame temperature, respectively. The competition and conversion chemistry between NO and NO2 is responsible for the distinct boundary between NO and NO2 observed in Figure 8a.
N2O exists in the interlayer between NO and NO2 at time = 0.9 ms and Tamb = 900 K as shown in Figure 8a. N2O formation depends on concentration of NH and NO, i.e.,
NH + NO = H + N2O (R8).
Meanwhile, a NH radical is formed through a sequence of consecutive reactions of NH3, i.e., NH3 → NH2 → NH, which is abundant in the intermediate flame temperature at time = 0.9 ms. Both R2 and R8 favor intermediate flame temperature; however, the HO2 is usually produced in more O2 enriched condition. As a result, NO2 is produced in a region further outward than N2O.
The produced N2O can be destroyed by
H + N2O = N2 + OH (R9)
and thermal decomposition as follows:
N2O(+M) = N2 + O(+M) (R10)
The reactions between N2O and O/OH radicals also consume N2O whereas the rates of these reactions are much lower than those of R8–R10.
Similar distinct boundary between NO, NO2 and N2O can also be observed at Tamb = 1000 K and 1100 K at time = 0.9 ms as shown in Figure 8b,c. However, at time = 2.5 ms and 3 ms, Tamb = 1000 K, and a significant amount of NO is formed at the head of NH3 diffusion flame compared to that at Tamb = 900 K, because the flame temperatures at time = 2.5 ms and 3.0 ms are much higher and NO formation is prompted at a higher temperature via the following key steps:
HNO(+M) = H+ NO(+M) (R11)
HNO + H = H2 + NO (R12)
HNO + OH = H2O + NO (R13) and
NH + O = H + NO (R14).
Moreover, the higher flame temperature also enhances the thermal NO formation through
N + O2 = O + NO (R15) and
N + OH = H + NO (R16).
These two thermal NO formation channels compete with NO consumption reaction,
N + NO = N2 + O (R17).
NO2 and N2O formation are both enhanced as well at Tamb = 1000 K and 1100 K due to increased NO formation, which further facilitates NO2 and N2O formation channels, i.e., R2 and R8.
In the DME-assisted NH3 jet flame, CO is mainly generated from the partial oxidation of DME and accumulates in the intermediate-temperature zone ahead of the main reaction front. The CO concentration at Tamb = 900 K is much higher than that at Tamb = 1000 K and 1100 K because the intermediate flame temperature hinders the further oxidation of CO to CO2.
The net NO, NO2, N2O and CO emission profile as a function of time is presented in Figure 9. At Tamb = 900 K, the NO is formed quickly at the ignition moment and then decreases due to the de-NOx reaction R1 at low NH3 combustion efficiency. It is partially converted to NO2 at the post-flame zone, which is in line with the NO and NO2 contour in Figure 8. At Tamb = 1000 K and 1100 K, the NO emissions also increase sharply then decrease before time = 2.5 ms; however, a slight increase is found after that moment. This is because, unlike the low NH3 combustion efficiency (~52.1%) at Tamb = 900 K, the NH3 diffusion flame becomes self-sustained after time = 2.5 ms at Tamb = 1000 K and 1100 K. It can be regarded as a second stage of combustion of NH3, which further increases NO by burning more NH3. Consequently, the total NO emission is increased from 0.18 mg to 0.3 mg and 0.35 mg, respectively, when Tamb is increased from 900 K to 1000 K and 1100 K. Similarly, the two-stage NO2 formation at Tamb = 1000 K and 1100 K can also be attributed to the two-stage combustion of NH3. NO2 emission exhibits similar trends to those of NO with increased ambient temperature. However, an opposite trend is observed for N2O, i.e., increasing Tamb leads to a sharp reduction in N2O. Such a phenomenon can be anticipated because the destruction reaction of N2O, i.e., R9 and R10, are both promoted at higher temperatures. The formed one is promoted due to increased H concentration and the later one is enhanced in a way that it is a decomposition reaction. At Tamb = 900 K, due to low ammonia combustion efficiency, intermediate flame temperature leads to very high CO emissions, which are almost five times higher than NO. Similarly to N2O, higher Tamb results in higher flame temperatures, thus promoting CO oxidation to CO2 at Tamb = 1000 K and 1100 K.

3.2. Effect of AER at Tamb = 1100 K

The aforementioned combustion efficiency of NH3 at Tamb = 1100 K reaches 97.4% in Figure 7, which implies that using the elevated ambient temperature is beneficial for reducing unburned NH3. As a result, the autoignition process at Tamb = 1100 K is calculated at different AERs, as shown in Figure 10. The SOI of DME and SOI of NH3 occur at the same time. At AER = 60%, 40% DME is used as pilot ignition fuel, which hinders the evaporation rate of DME. Thus, the autoignition zone of DME spray is smaller at 0.66 ms compared to that at AER = 80% (see Figure 5c) and AER = 90%, as shown in Figure 10b. However, given enough time for DME evaporation, the flame kernel of DME at 0.9 ms becomes the largest and thus transfers more heat and reactive radicals (H, O and OH) to NH3 spray. Moreover, due to reduced NH3 amounts, the cooling effect of NH3 evaporation is reduced at a higher AER, facilitating NH3 combustion. The NO formation again shows a strong correlation with flame temperature. However, the highest temperature is observed at time = 0.9 ms in Figure 10a, generated by the DME flame, and the highest NO formation is observed at time = 2.5 ms, generated by the NH3 flame. Such a phenomenon indicates that NO formation is not only dominated by temperature, but that the presence of NH3 and its subsequent oxidation products also plays a critical role. Increasing AER from 60% to 80% and 90% leads to less DME injection, which benefits DME evaporation and leads to advanced DME autoignition and a larger flame kernel at 0.66 ms, as shown in Figure 5c and Figure 10b. However, increased AER deteriorates the ignition of NH3. For instance, the NH3 spray penetrates the flame zone at time = 2.5 ms in Figure 10b and more NH3 liquid still can be observed at time = 3 ms. For all three different AERs, the NO2 is always formed around the periphery of NO. For instance, at AER = 90% and time = 3 ms, NO2 can be found upstream of NH3 spray and DME spray, where the flame temperature is lower than the flame front due to the cooling effect of NH3 evaporation. N2O is again formed in the interlayer between NO and NO2 as shown in Figure 10.
The combustion efficiency of NH3 at three different AERs is shown in Figure 11. The combustion efficiency of NH3 decreases from 98.3% to 97% and 94%, respectively, when AER is increased from 60% to 80% and 90%. For practical engines with higher AER, such decreases of NH3 combustion efficiency seem to be acceptable and other strategies can be utilized to compensate for such slight decreases in NH3 combustion efficiency. Further increasing AER to 95% leads to a failed ignition in the present configuration.
The net NO, NO2, N2O and CO emissions as a function of time are depicted in Figure 12. For all three cases, NO emissions present similar profiles to those in Figure 9. For AER = 90%, significant two-stage formation can be observed due to two-stage combustion of NH3, i.e., the first stage NH3 combustion induced by pilot DME and the second stage NH3 combustion due to ammonia’s own diffusion flame. Such two-stage formation of NO is not significant at lower AER. Generally, the highest NO emission is found at AER = 60%, followed by AER = 90% and AER = 80%. Such a non-monotonical relationship between NO formation and AER has been discussed in our previous study [24]. The radical pool (H, O and OH) increases almost linearly with higher DME fraction [24]; however, HNO is one of the most important NO formation precursors, which generates NO by decomposition or reacting with the radicals, H and OH, through R11, R12 and R13. HNO has a non-monotonical relationship with a growing DME fraction [24]. Thus, the ‘trade-off’ between HNO concentration and the radical pool concentration induced by DME addition is responsible for the non-monotonical relationship between NO formation and AER in Figure 12. Such a ‘trade-off’ relationship can be affirmed by the HNO spatial distribution shown in Figure 10c, where the highest HNO concentration is observed at AER = 80% rather than AER= 60% or 90%. The emissions of NO2 and CO vary little at different AERs because flame temperatures are high enough to promote the consumption of these two species as discussed in Section 3.2. However, N2O at AER = 90% is nearly two and three times higher than those at AER= 80% and 60%, respectively, which can be attributed to the increased NH concentration at higher AER.

3.3. Effect of DME Injection Timing at Tamb = 1100 K and AER = 80%

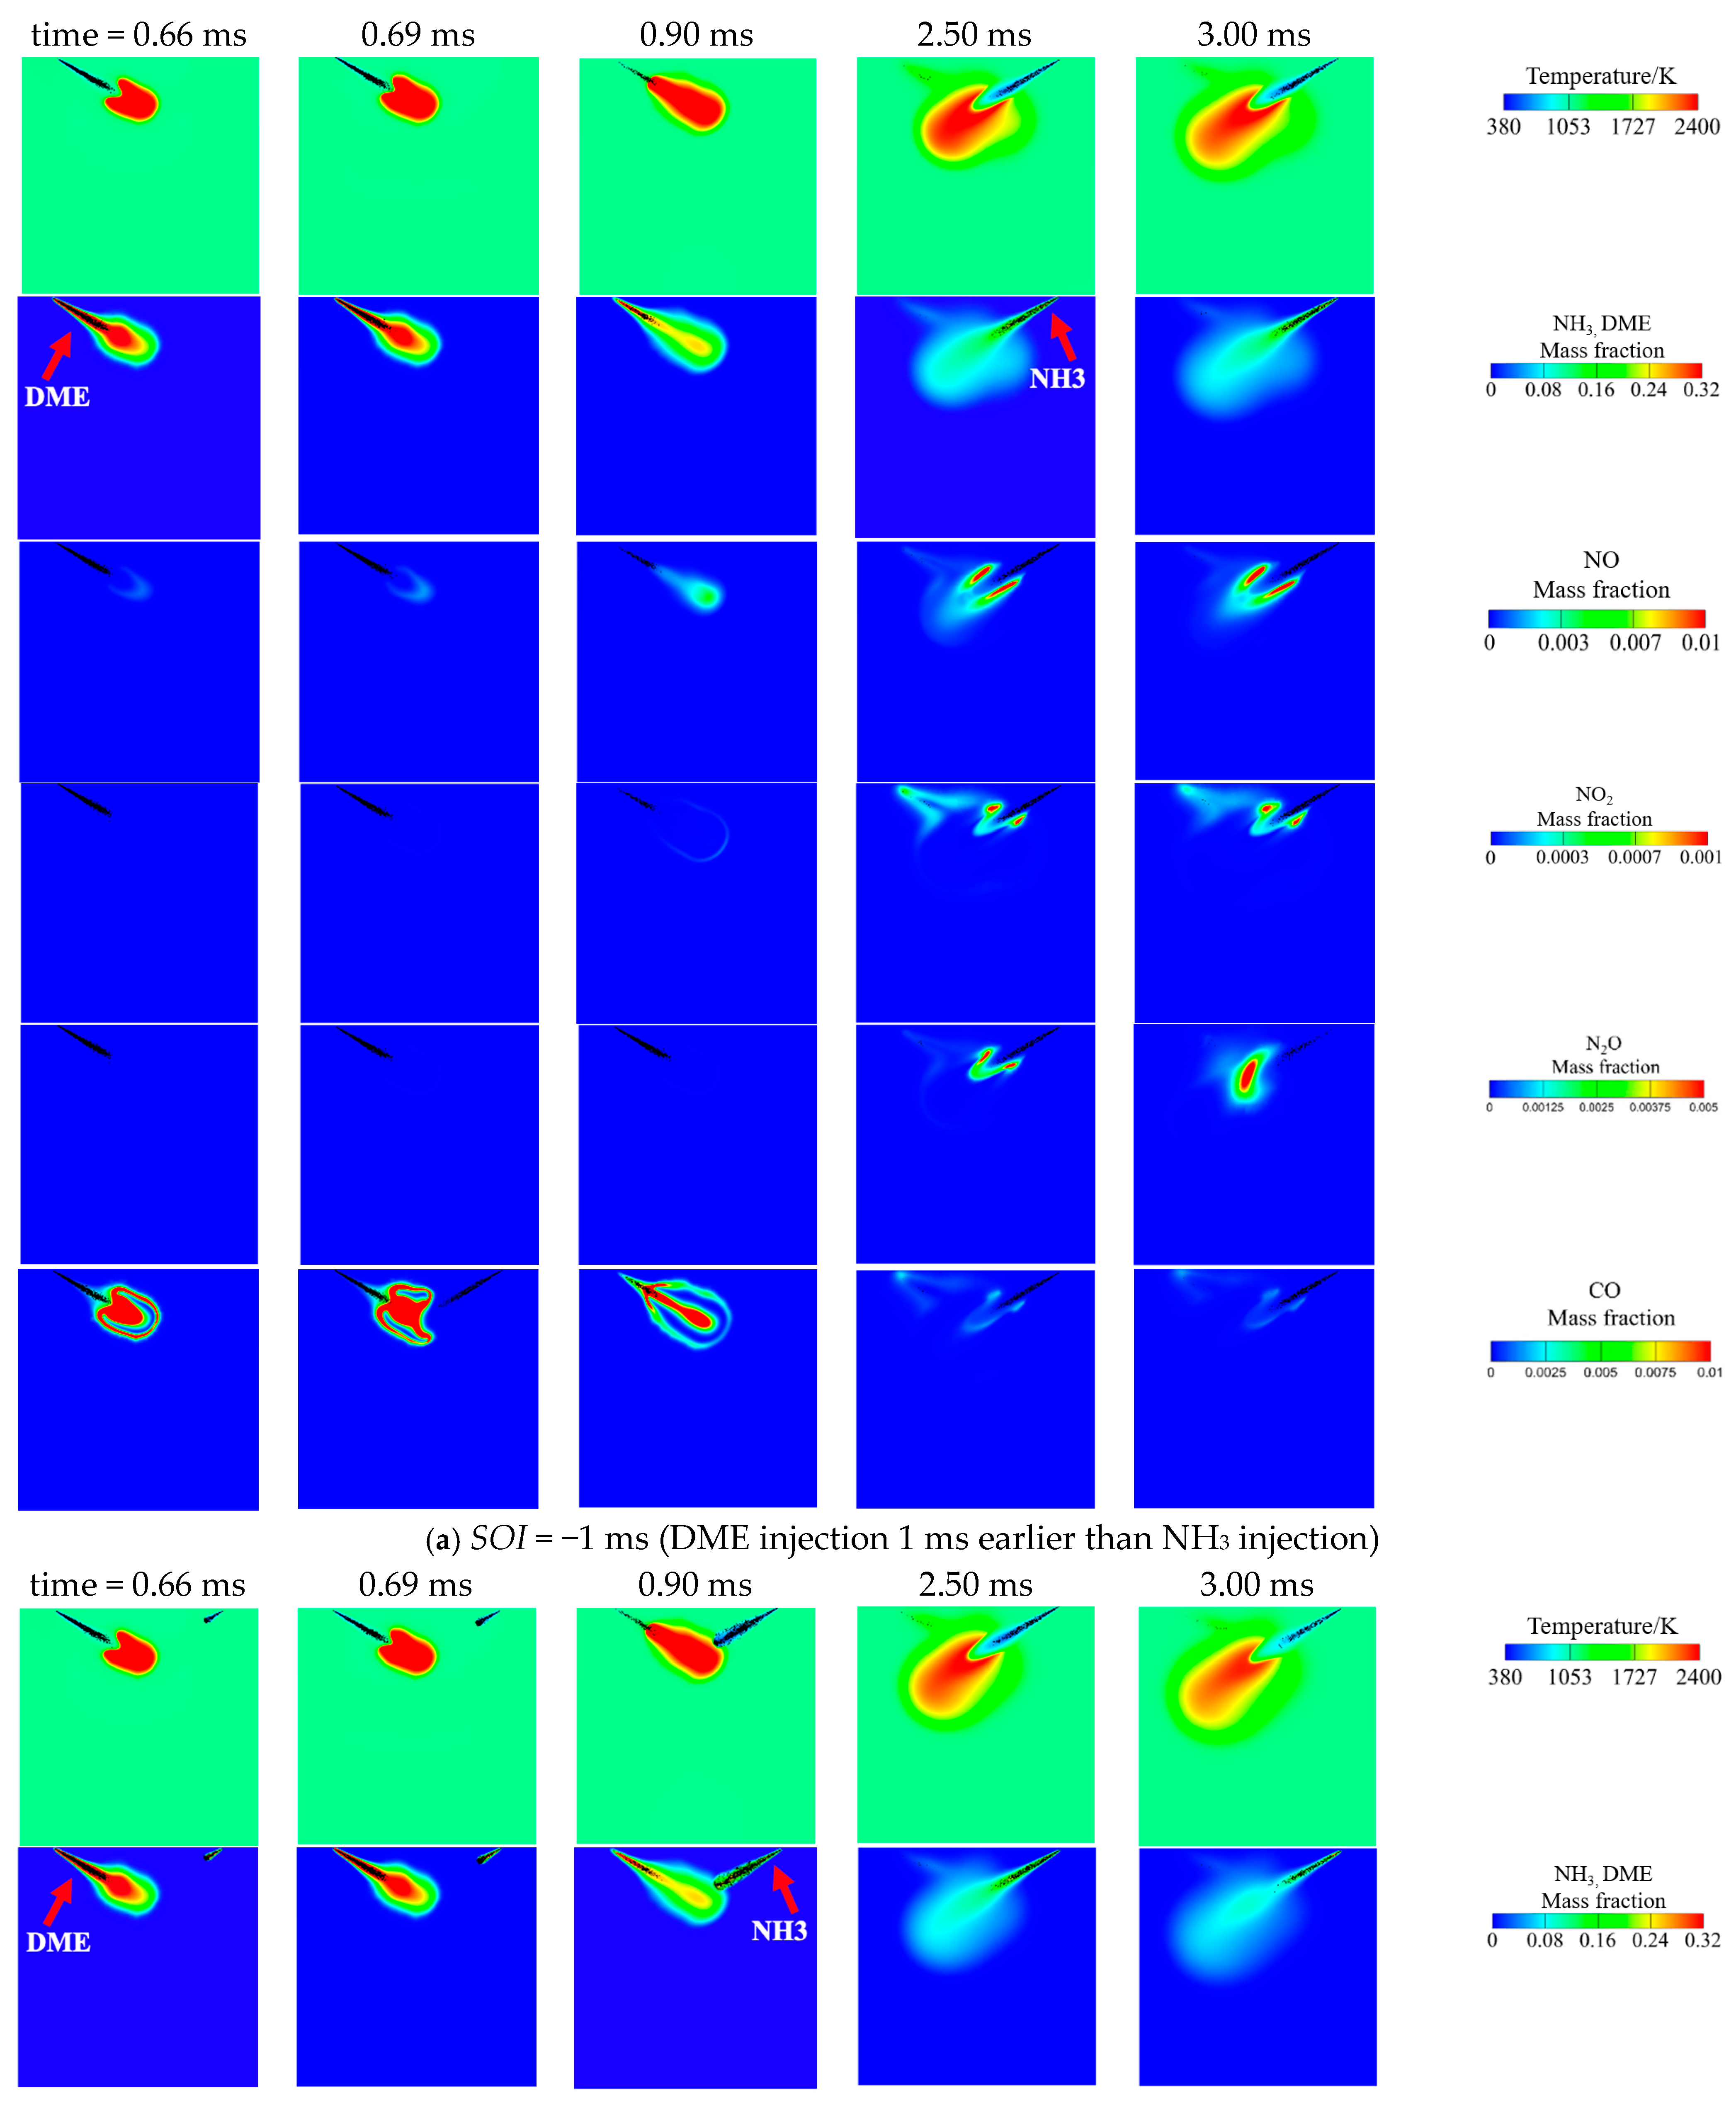
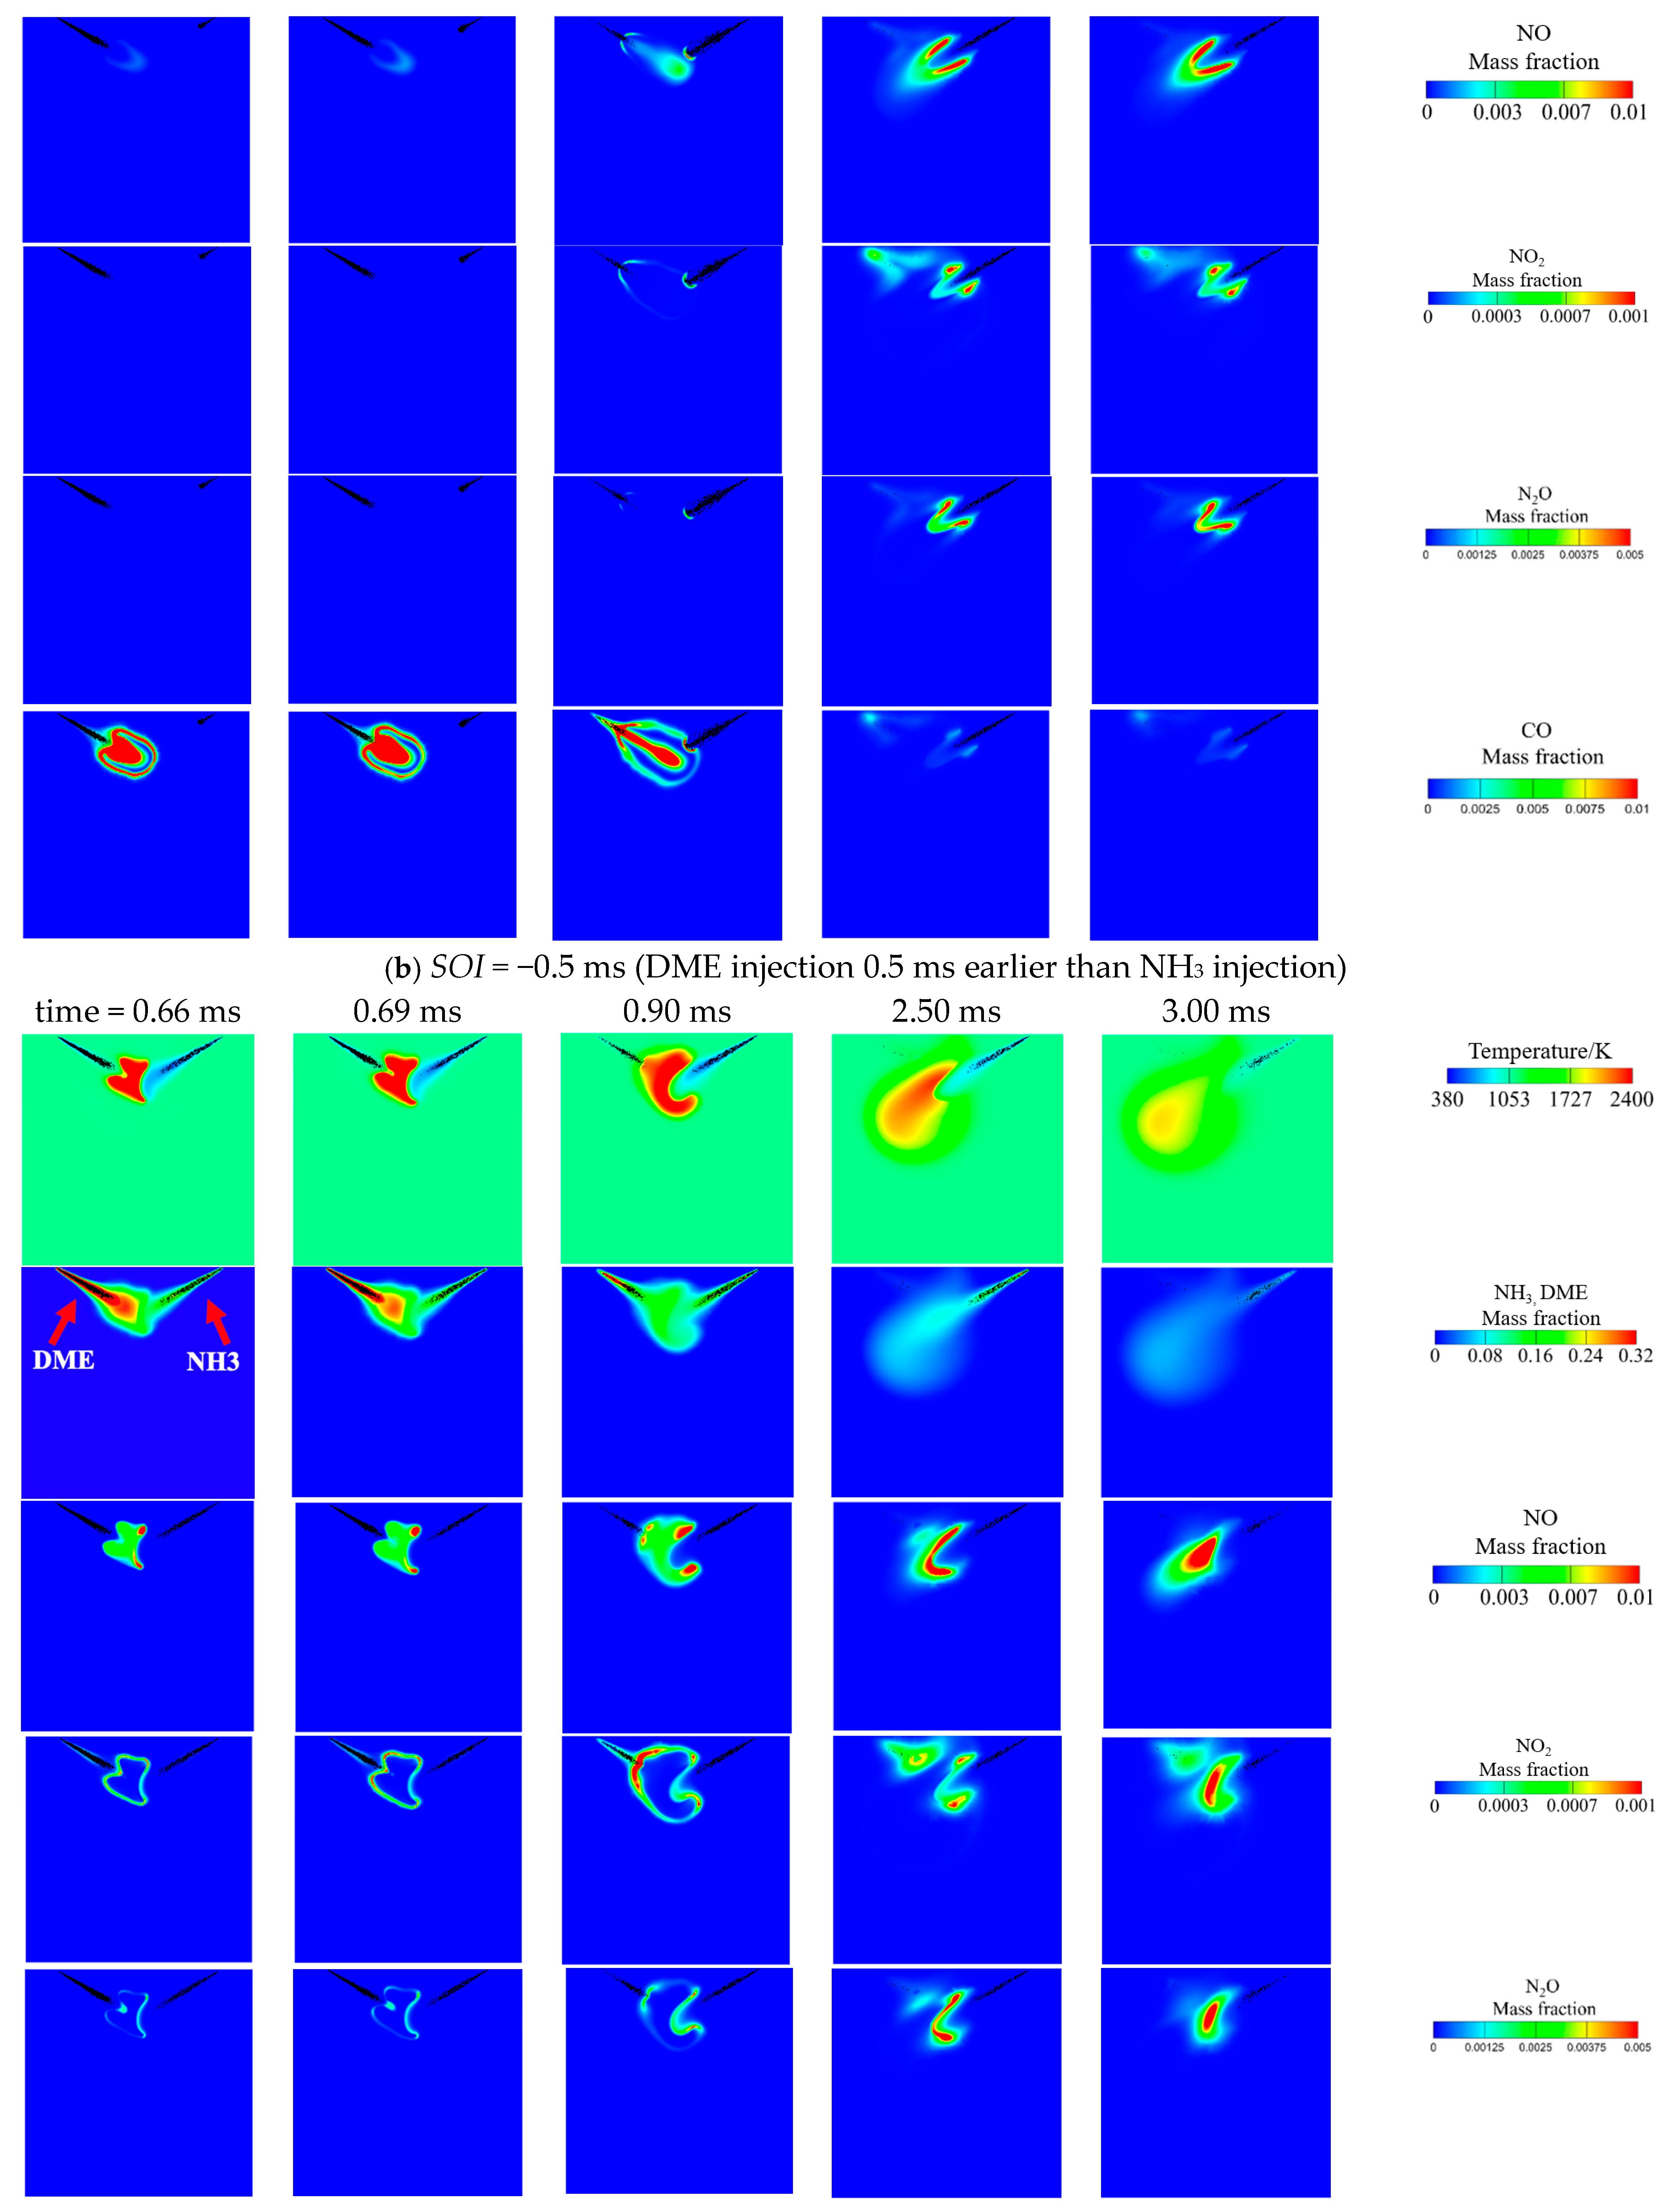
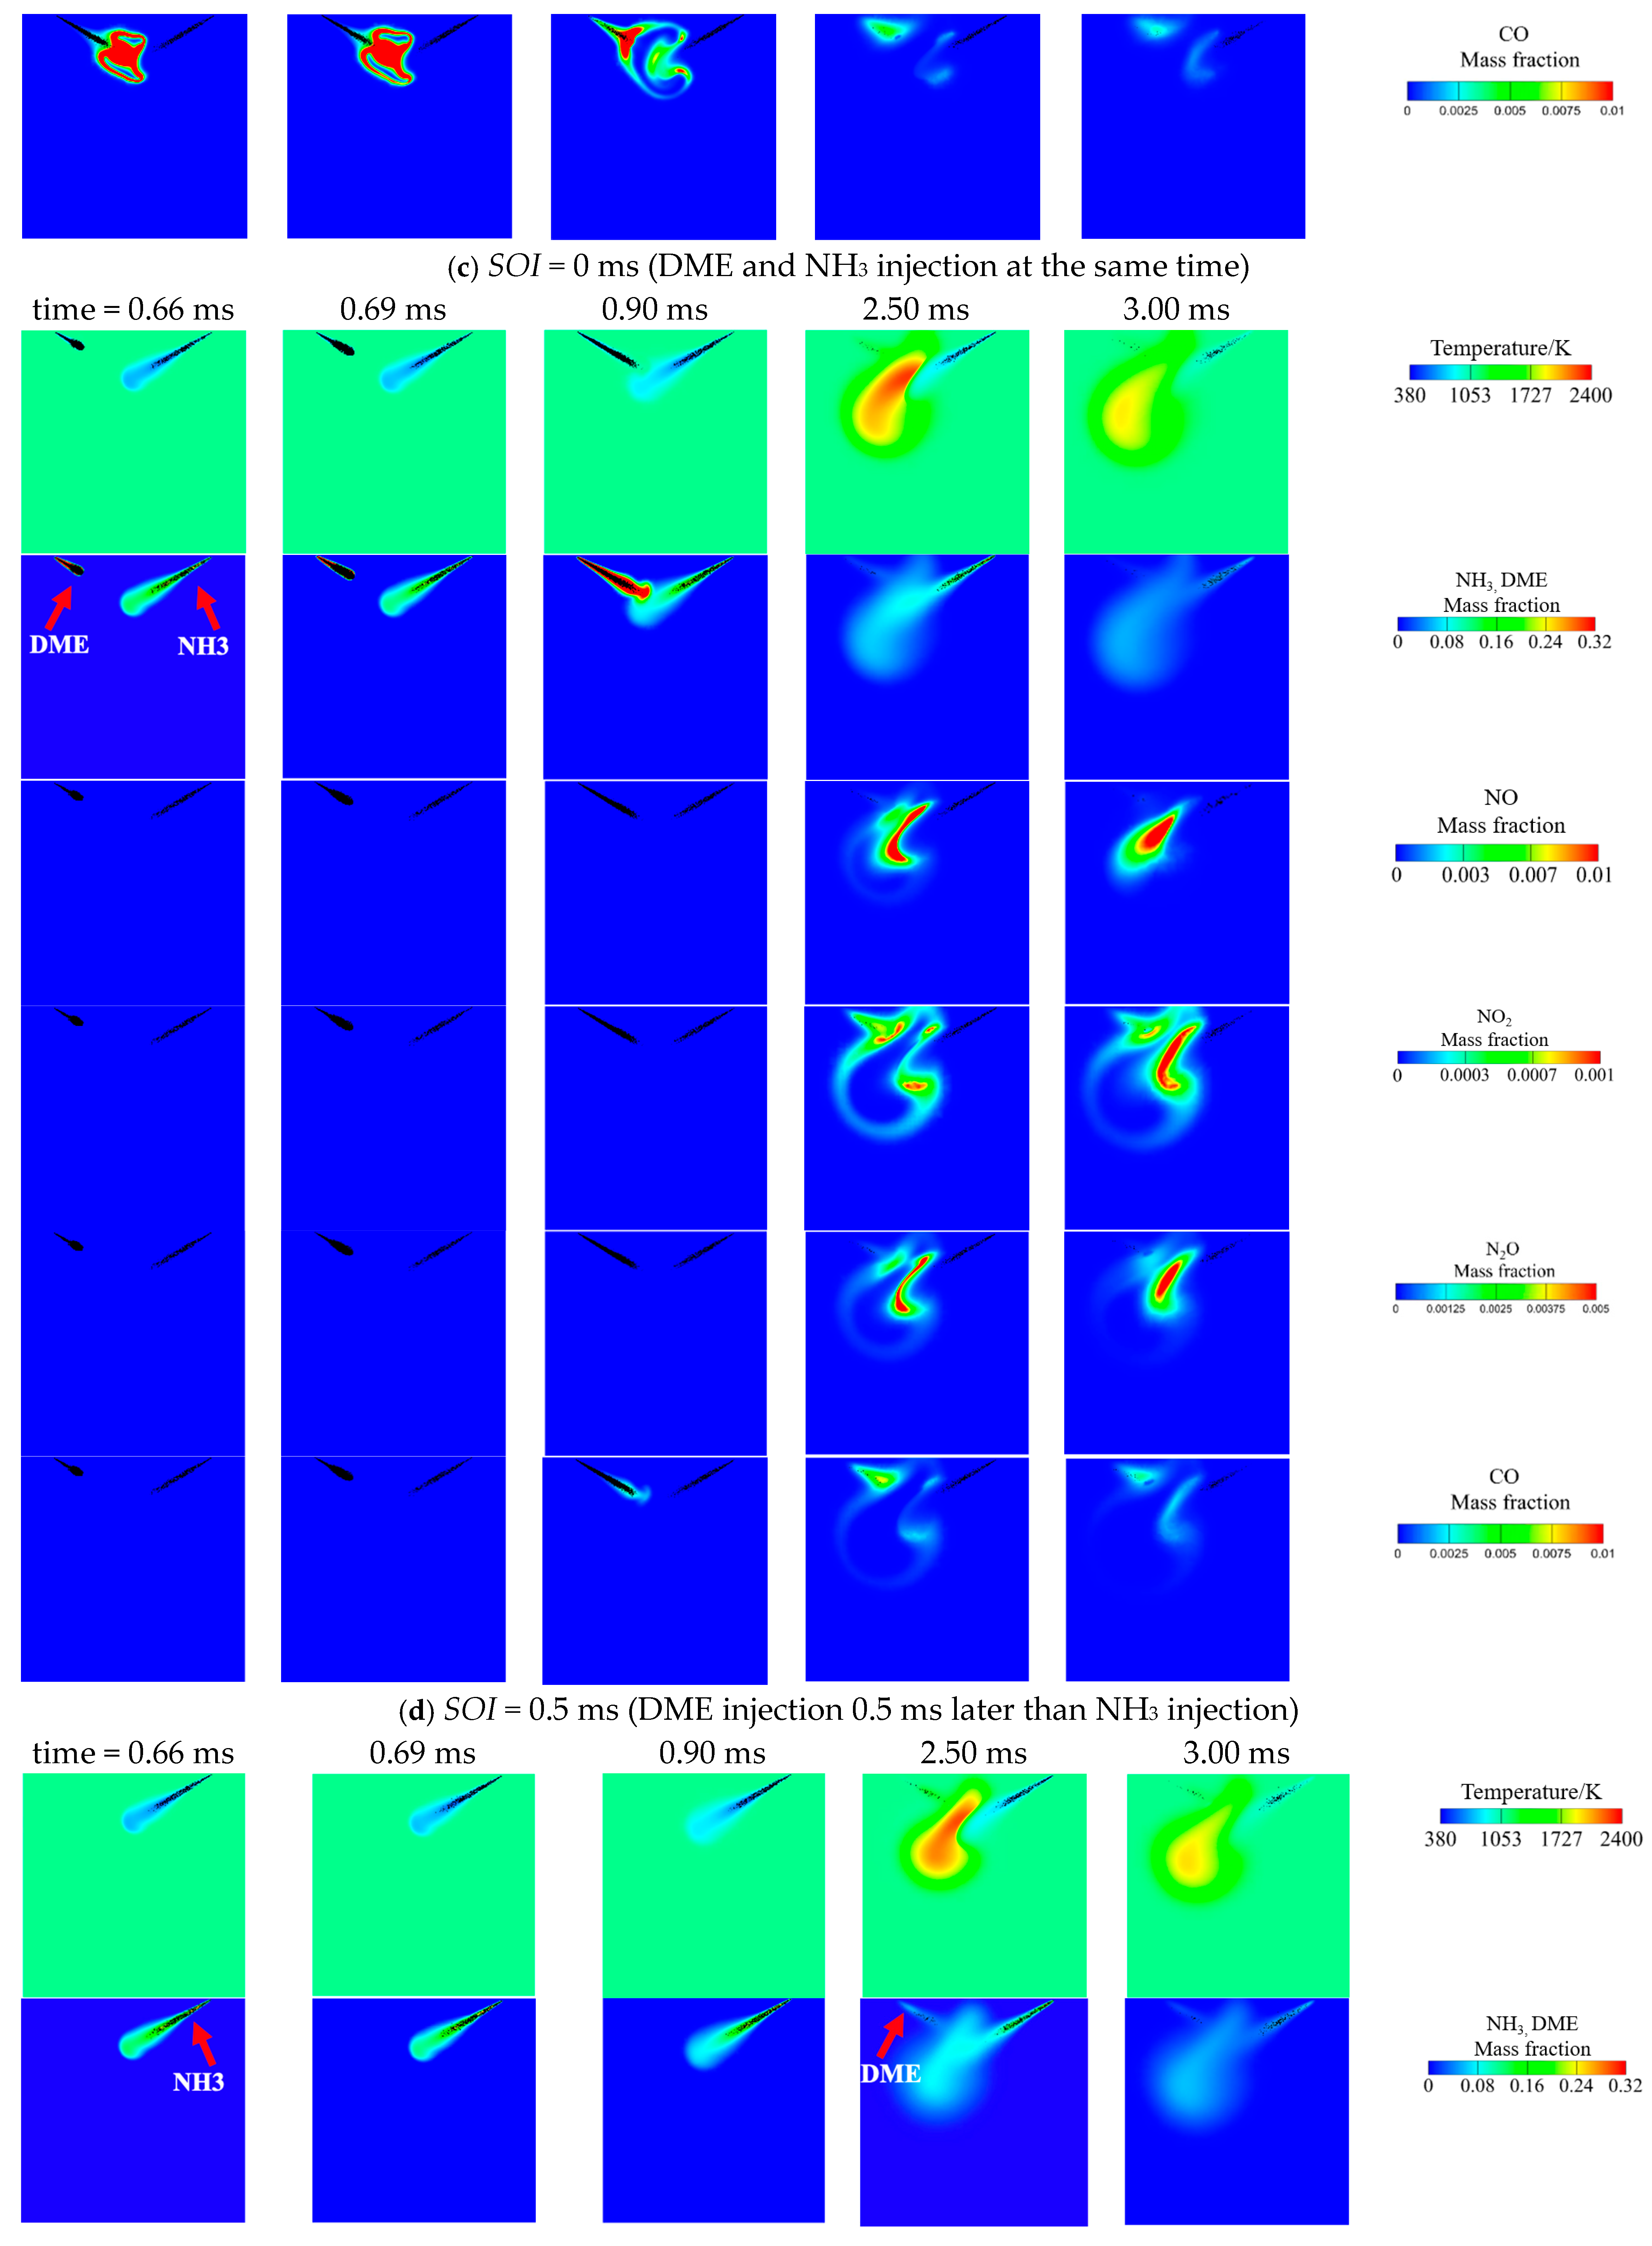
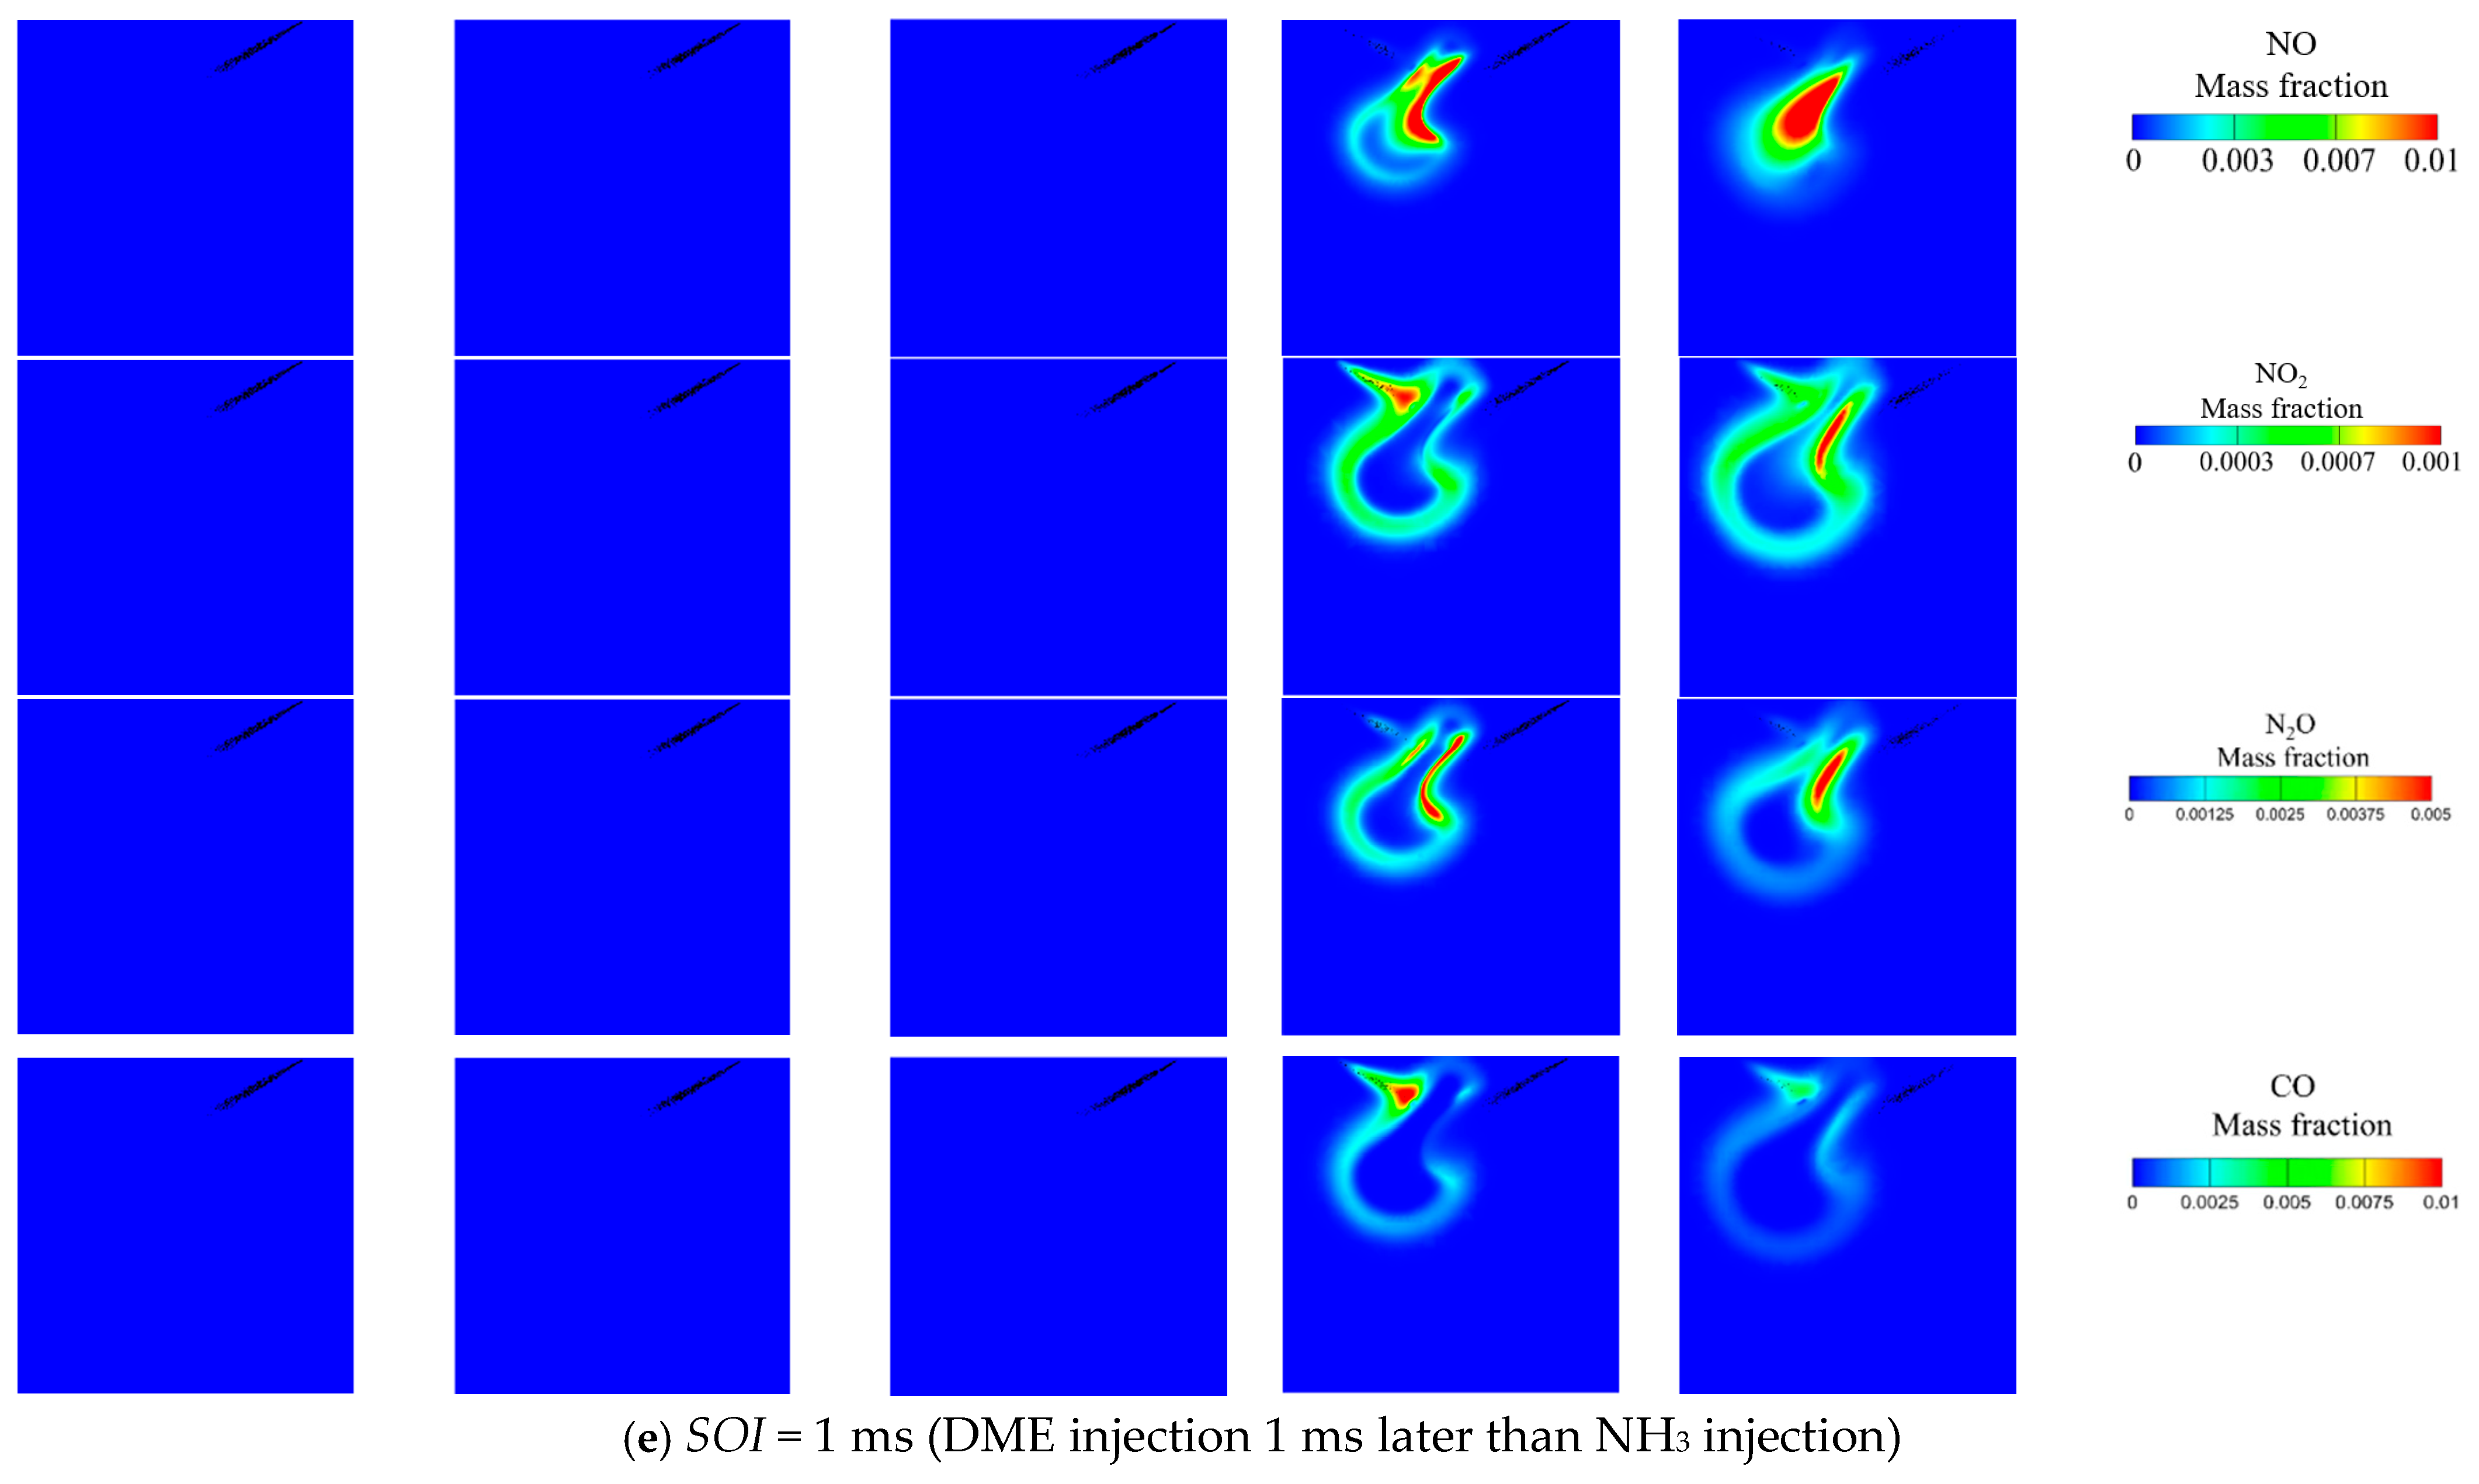
The autoignition process of NH3/DME spray with varying injection strategies at Tamb = 1100 K and AER= 80% is shown in Figure 13. Compared to the case of simultaneous SOI of NH3 and DME shown in Figure 13c, when SOI of DME is 1 ms and 0.5 ms earlier, it can be observed that DME autoignition is less affected by the cooling effect of NH3 spray; thus, more heat and radicals are generated at the early stage. Consequently, higher flame temperatures are achieved at time = 0.9 ms in Figure 13a,b. Such a hot atmosphere is beneficial for NH3 combustion; for instance, more intensified NH3 diffusion flames are observed at 2.5 ms in Figure 13a,b than that in Figure 13c. When SOI of DME is postponed after SOI of NH3 by 0.5 ms and 1 ms, NH3 sprays have more time to evaporate before contacting DME spray and the autoignition of DME is inhibited by the heat absorption of NH3 spray. As a result, advancing DME injection time leads to a more intensified NH3 diffusion flame, which is favored from the perspective of enhancing the autoignition of NH3 spray. Regarding NO and NO2 formation, pure DME combustion also generates NO and NO2 at the head of DME diffusion flame at time = 0.9 ms as shown in Figure 13a,b. The NOx is produced via thermal NOx as explained previously. NO2 is found to be significant at the upstream of DME diffusion at time = 2.5 ms shown in Figure 13a,b, and it can be attributed to the produced HO2 radicals from the DME promoting reaction
HO2 + NO = NO2 + OH (R2).
The NO formation is intensified when SOI of DME is postponed, albeit NH3 diffusion flame temperature is lowered simultaneously. It seems to contradict the observations in Figure 9 that higher ambient temperatures lead to higher flame temperature at fixed AER and SOI. It is necessary to point out that NO formation is not only dependent on flame temperature, but it also heavily depends on the equivalence ratio. Advanced SOI of DME results in more and faster consumption of O2 which substantially reduces the O2 concentration for NH3 diffusion flame. Richer NH3 flames have higher NH2 concentration which reacts with NO through
NH2 + NO = N2 + H2O (R1).
Much less NO formation in richer NH3 flames have also been reported in [36] and discussed in Section 3.1.
In terms of N2O, it is not observed at SOI = −1 ms and −0.5 ms, though NO and NO2 are produced at times before 2.5 ms, as shown in Figure 13a,b,d,e. As explained previously, NH3 flame should exist to produce NH, which is necessary to react with NO to generate N2O via R8. Similarly to Figure 8, N2O is generally formed in the interlayer between NO and NO2. The majority of CO is generated at the core and periphery of DME jet before time = 0.9 ms and almost disappears at the end of combustion due to less interference by NH3 jet as shown in Figure 13a,b. Delaying the SOI of DME leads to more unburned CO at the end of combustion, owing to lowered flame temperature and lower O2 concentration which prohibit further oxidation of CO.
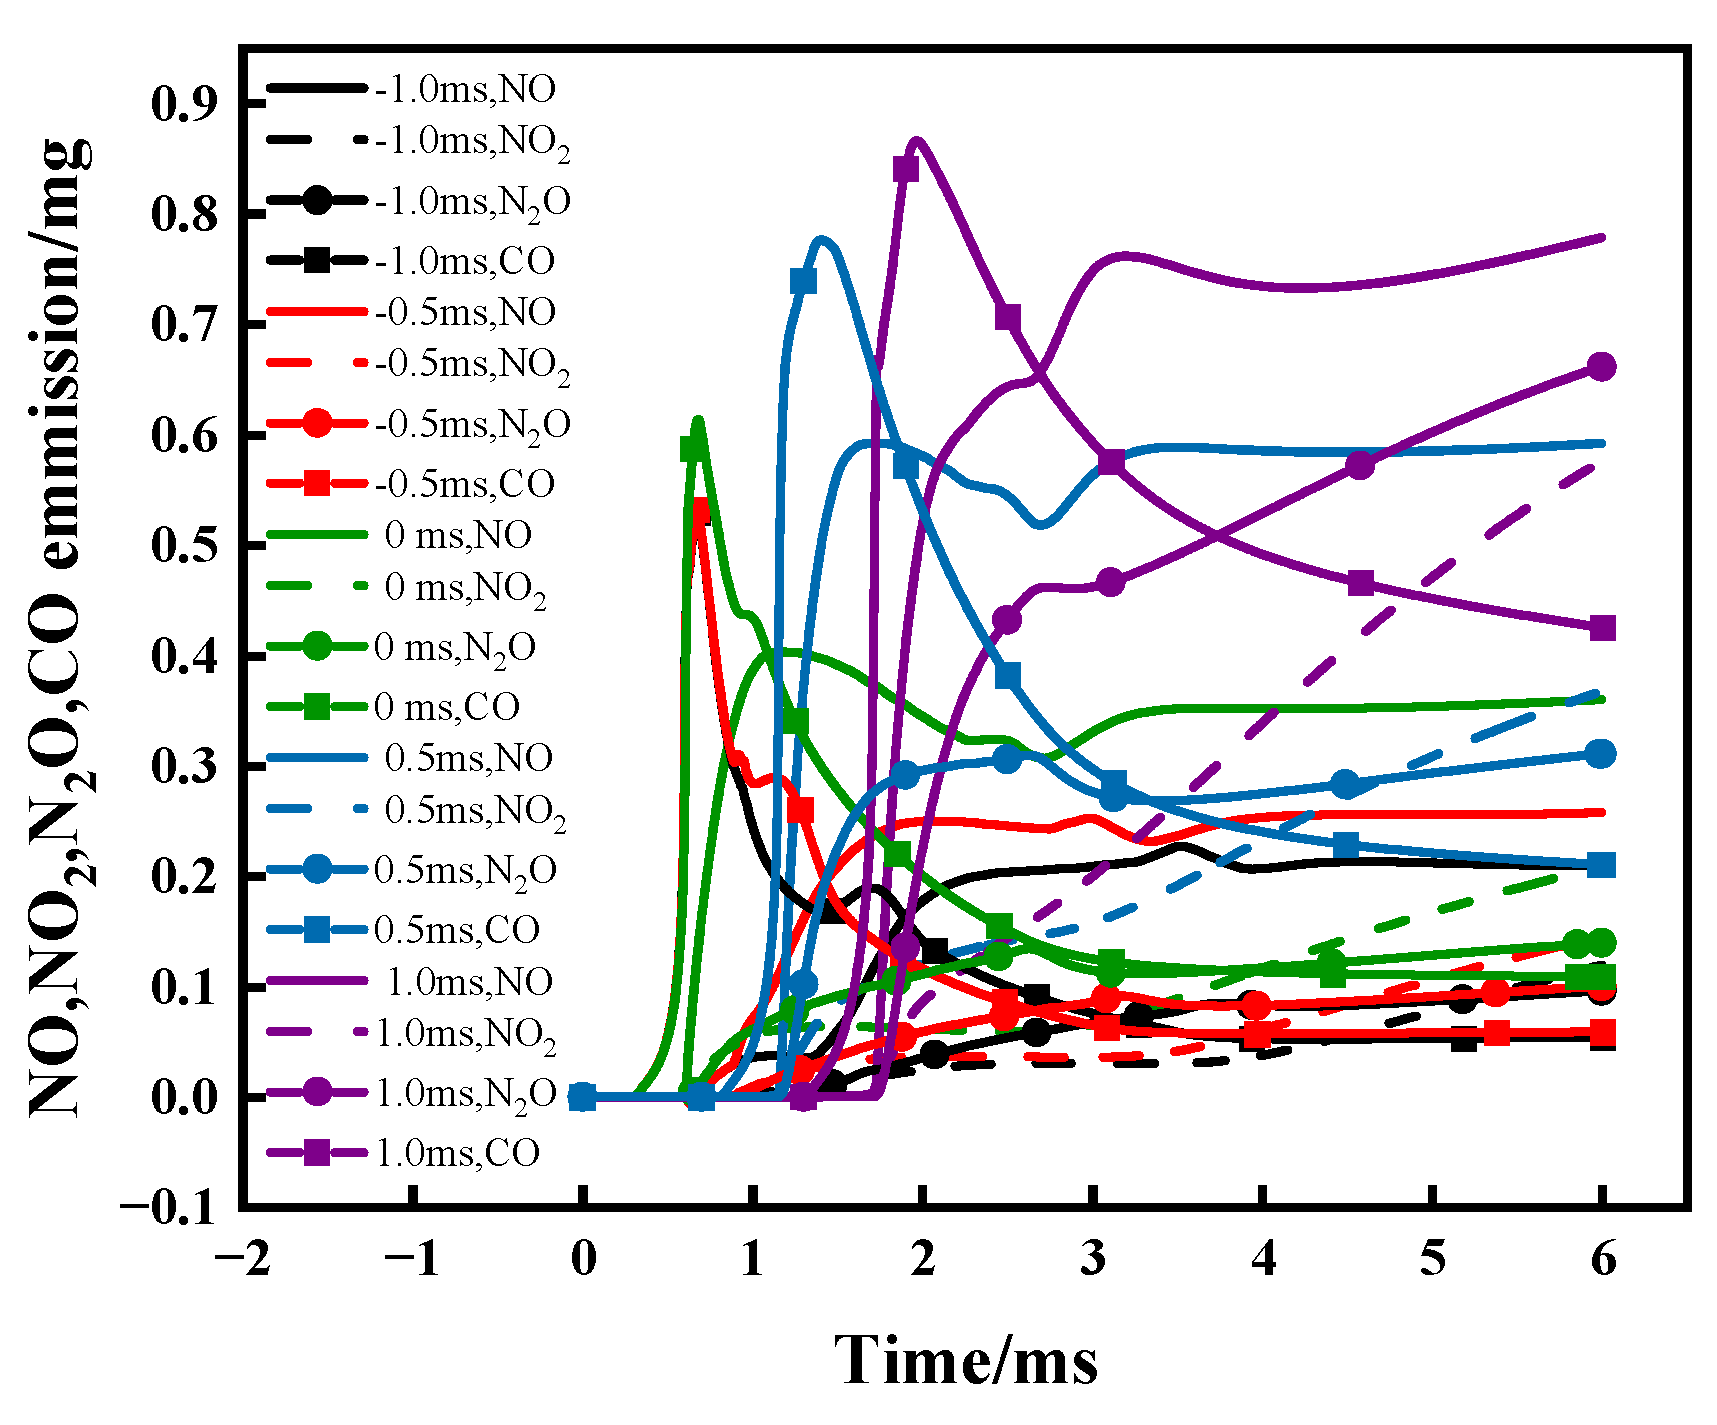
Net NO, NO2, N2O and CO emissions as a function of time is calculated accordingly at different SOIs of DME. As shown in Figure 14, the NO emission at SOI = −1 ms shows an obvious two-stage formation; the first stage is produced by thermal NO from DME flame and the second stage is generated by NH3 diffusion flame. The net NO emissions at the combustion end are generally reduced by advancing DME injection due to an O2-deficient environment caused by faster DME combustion, which is in line with the discovery in Figure 13. The NO2 emission is also reduced by advancing DME injection. At SOI = 0.5 ms and 1 ms, the NO2 emission rate is much higher than other cases. It can be attributed to intermediate flame temperatures benefiting NO2 formation as discussed in Section 3.1. Advancing SOI of DME substantially reduces the N2O and CO emissions as well, which can be attributed to the increased flame temperature at earlier DME injection as depicted in the temperature contour in Figure 13. When DME is injected first, the ignition occurs earlier, forming hot atmosphere to benefit NH3 combustion. Higher flame temperature facilitates complete oxidation of CO while suppressing N2O pathways. Conversely, when NH3 is injected earlier than DME, the subsequent DME injection leads to a staged combustion process where NH3 undergoes low-temperature oxidation first, forming NH and HNO intermediates, followed by delayed high-temperature oxidation of DME. This results in a prolonged low temperature, which promotes the formation and accumulation of N2O and CO.
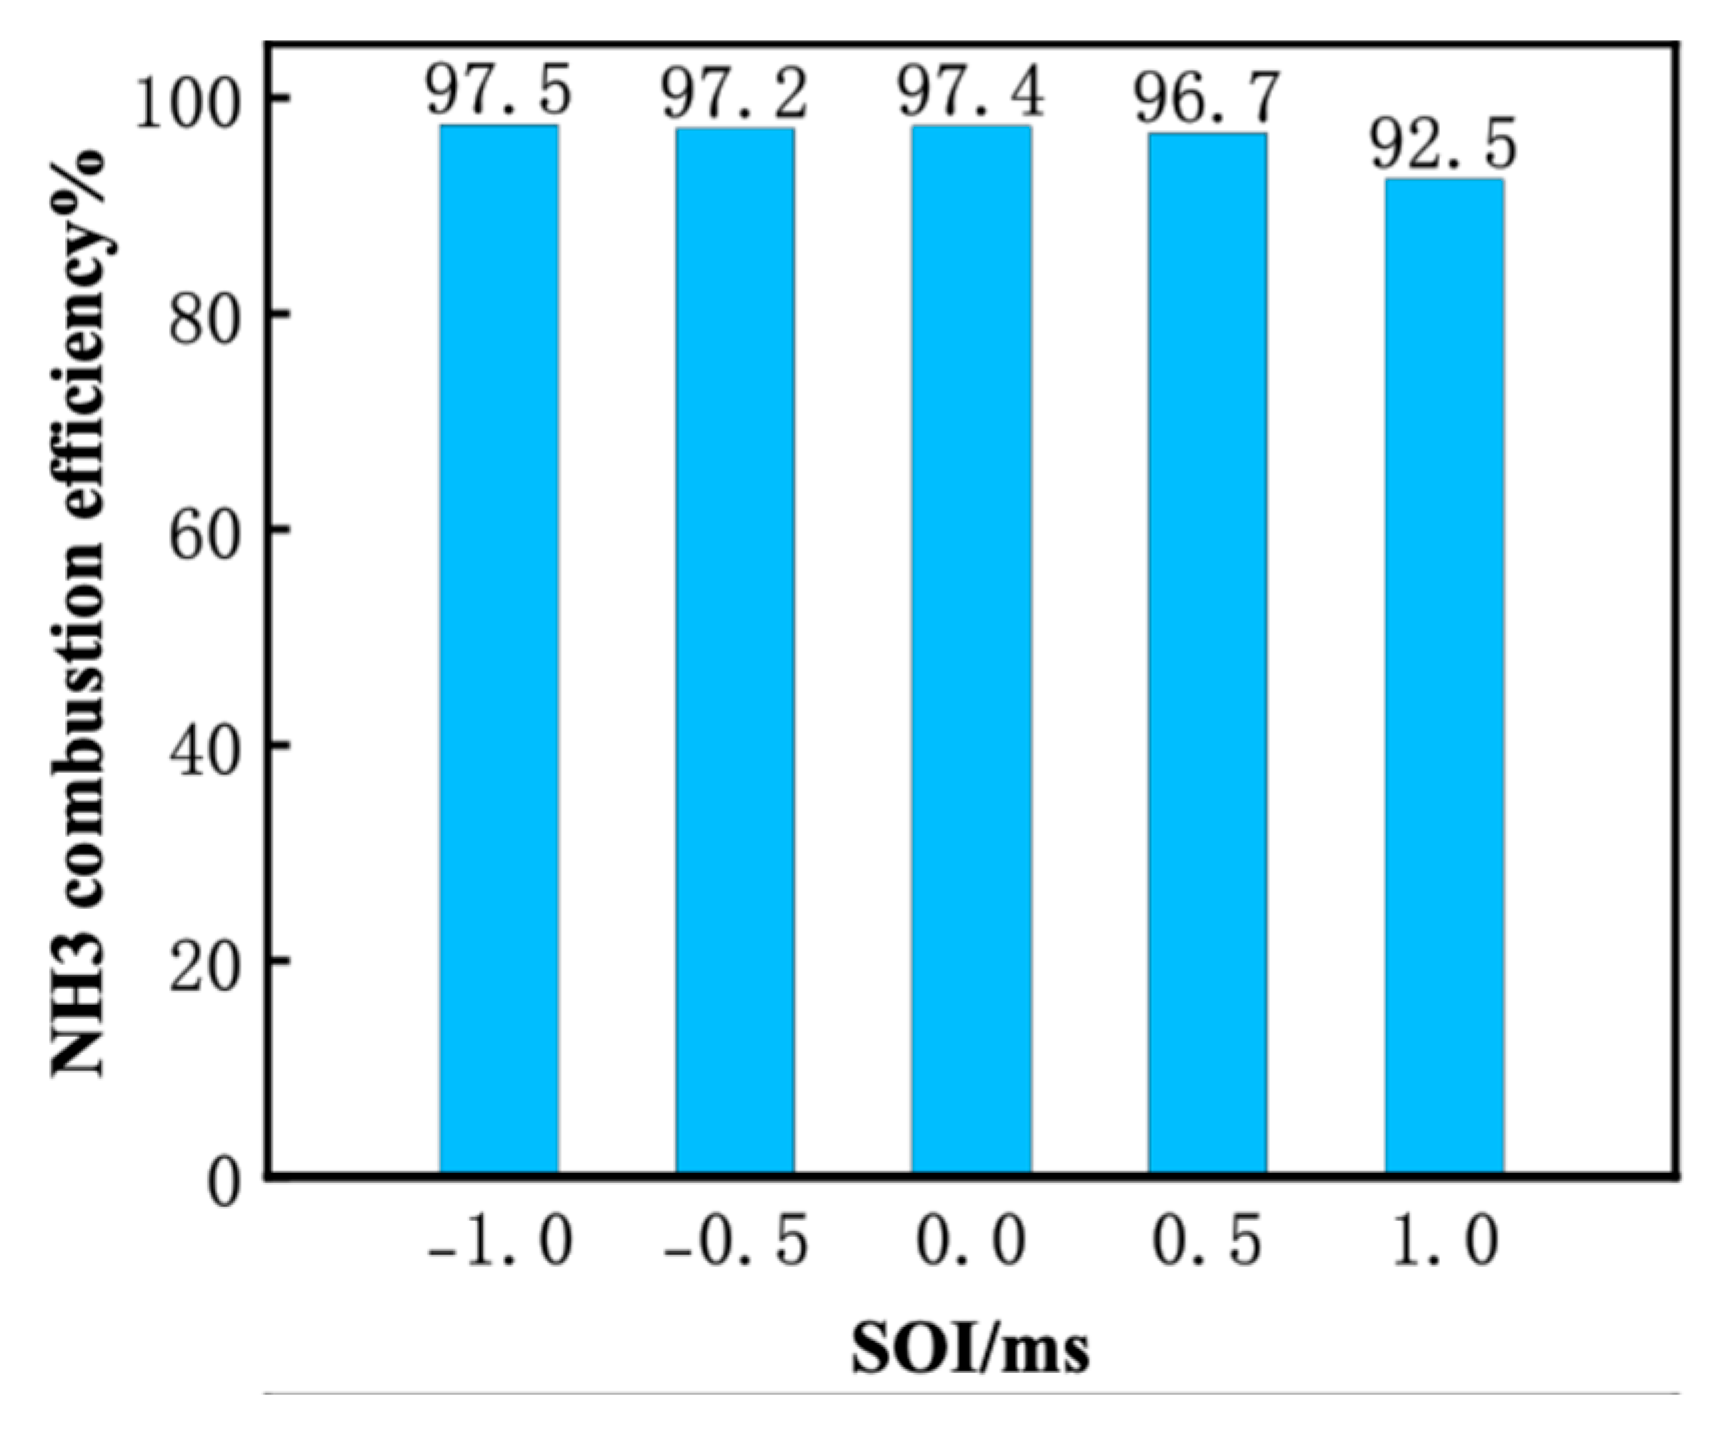
The effect of SOIs of DME on combustion efficiency is presented in Figure 15. Clearly, a slight increase of NH3 combustion efficiency from 96.7% to 97.5% is achieved when SOI of DME is advanced from time = 0.5 ms to −1 ms. Delaying DME injection by 1 ms shows 4% decrease. It can be anticipated that further delaying DME injection could lead to lower combustion efficiency, and even failed ignition.

4. Conclusions

This study conducted a numerical investigation of NH3 spray ignition by DME spray in a constant volume chamber. A new reduced reaction mechanism (94 species and 562 reactions) was developed and validated for CFD simulations. The effects of ambient temperature, AER and SOI of DME were investigated. The main findings are as follows:
  • Increasing the ambient temperature from 900 K to 1100 K significantly accelerates the autoignition of both DME and NH3, reducing IDT by two orders of magnitude. Consequently, NH3 combustion efficiency increases from 52.1% to 97.4%. N2O and CO are significantly reduced at higher ambient temperature owing to higher flame temperature. However, a substantial increase in NO and NO2 emission is observed. NO formation has a strong correlation with flame temperature. NO2 is usually formed around the periphery of NO because the two primary NO2 formation channels HO2 + NO = NO2 + OH (R2) and NO + O(+M) = NO2(+M) (R3) favor intermediate flame temperature.
  • Raising the AER from 60% to 90% results in a slight decline in combustion efficiency of NH3 from 98.7% to 94% due to enhanced evaporative cooling and reduced pilot fuel energy. NO emission has a non-monotonical relationship with AER, which can be attributed to the ‘trade-off’ relationship between NO formation precursor (HNO) and the radical pool at varying AERs. N2O formation is promoted due to increased NH concentration at high AER.
  • Advancing DME injection not only benefits combustion efficiency but also reduces NO, NO2, N2O and CO emissions. The reduced NO can be attributed to increased equivalence ratio caused by faster DME combustion, thus facilitating de-NOx reactions (NH2 + NO = N2 + H2O). Meanwhile, reduced NO2, N2O and CO are caused by increased flame temperature with earlier DME injection.
Generally, this study offers insight into the autoignition process and NOx formation of NH3/DME dual-fuel direction injection combustion, which helps to bridge the gap between fundamental ammonia combustion theory and practical combustion system design. More calculations at a wider range of conditions will be performed in our future work to further optimize the ignition process and reduce NOx emissions.

Supplementary Materials

The following supporting information can be downloaded at: https://www.mdpi.com/article/10.3390/fire8110436/s1, Figure S1: Measured (from Dai et al. [9]) and calculated IDTs using the full mechanism [24] (dashed lines) from and reduced mechanism (solid lines) from this study at φ = 0.5, Pc = 60 bar. Figure S2: Measured (from Dai et al. [9]) and calculated IDTs using the full mechanism [24] (dashed lines) from and reduced mechanism (solid lines) from this study at φ = 2.0, Pc = 60 bar. Figure S3: Measured LBVs and calculated LBVs of NH3 with 20% DME at 298 K/1 bar with varying O2 content.

Author Contributions

Conceptualization, C.Z. and L.D.; methodology, C.Z. and Q.W.; software, C.Z. and L.D.; validation, C.Z. and L.D.; formal analysis, C.Z.; writing—original draft preparation, C.Z.; writing—review and editing, L.D. and Q.W.; supervision, Q.W.; funding acquisition, L.D. and Q.W. All authors have read and agreed to the published version of the manuscript.

Funding

This research was funded by the National Natural Science Foundation of China (Grant NO. 52206149 and 52576121).

Data Availability Statement

The data that support the findings of this study are available from the corresponding author upon reasonable request.

Conflicts of Interest

The authors declare no conflicts of interest.

Nomenclature

NH3ammonia
DMEdimethyl ether
H2hydrogen
AERammonia energy ratio
NOxnitrogen oxides
NOnitric oxide
NO2nitrogen dioxide
N2Onitrous oxide
RANSReynolds-Averaged Navier–Stokes
COcarbon monoxide
UHCunburned hydrocarbons
LBVlaminar burning velocity
CO2carbon dioxide
IDTignition delay time
JSRjet stirred reactor
SOIstart of injection
HPDIhigh-pressure dual-fuel direct injection
CVCCconstant volume combustion chamber
KHRTKelvin–Helmholtz Rayleigh–Taylor

References

  1. Nazir, M.J.; Li, G.; Nazir, M.M.; Zulfiqar, F.; Siddique, K.H.; Iqbal, B.; Du, D. Harnessing soil carbon sequestration to address climate change challenges in agriculture. Soil Tillage Res. 2024, 237, 105959. [Google Scholar] [CrossRef]
  2. Sun, J.; Zhai, N.; Miao, J.; Sun, H. Can Green Finance Effectively Promote the Carbon Emission Reduction in “Local-Neighborhood” Areas?—Empirical Evidence from China. Agriculture 2022, 12, 1550. [Google Scholar] [CrossRef]
  3. Kobayashi, H.; Hayakawa, A.; Somarathne, K.K.A.; Okafor, E.C. Science and technology of ammonia combustion. Proc. Combust. Inst. 2019, 37, 1. [Google Scholar] [CrossRef]
  4. Liang, J.; Li, H.; Chen, L.; Ren, M.; Fakayode, O.A.; Han, J.; Zhou, C. Efficient hydrogen evolution reaction performance using lignin-assisted chestnut shell carbon-loaded molybdenum disulfide. Ind. Crops Prod. 2023, 193, 116214. [Google Scholar] [CrossRef]
  5. Pan, S.; Zabed, H.M.; Wei, Y.; Qi, X. Technoeconomic and environmental perspectives of biofuel production from sugarcane bagasse: Current status, challenges and future outlook. Ind. Crops Prod. 2022, 188, 115684. [Google Scholar] [CrossRef]
  6. Thomas, G.; Parks, G. Potential Roles of Ammonia in a Hydrogen Economy; U.S. Department of Energy: Washington, DC, USA, 2006.
  7. Kroch, E. Ammonia—A Fuel for Motor Buses. J. Inst. Pet. 1945, 31, 213. [Google Scholar]
  8. Seaman, R.; Huson, G. The choice of NH3 to fuel the X-15 Rocket plane, NH3 Association. In Proceedings of the 8th NH3 Fuel Association Conference, Boston, MA, USA, 19 September 2011. [Google Scholar]
  9. Dai, L.; Hashemi, H.; Glarborg, P.; Gersen, S.; Marshall, P.; Mokhov, A.; Levinsky, H. Ignition delay times of NH3/DME blends at high pressure and low DME fraction: RCM experiments and simulations. Combust. Flame 2021, 227, 120. [Google Scholar] [CrossRef]
  10. Okafor, E.C.; Naito, Y.; Colson, S.; Ichikawa, A.; Kudo, T.; Hayakawa, A.; Kobayashi, H. Experimental and numerical study of the laminar burning velocity of CH4–NH3–air premixed flames. Combust. Flame 2018, 187, 185. [Google Scholar] [CrossRef]
  11. Takizawa, K.; Takahashi, A.; Tokuhashi, K.; Kondo, S.; Sekiya, A. Burning velocity measurements of nitrogen-containing compounds. J. Hazard. Mater. 2008, 155, 144. [Google Scholar] [CrossRef]
  12. Reiter, A.J.; Kong, S.C. Demonstration of compression-ignition engine combustion using ammonia in reducing greenhouse gas emissions. Energy Fuels 2008, 22, 2963. [Google Scholar] [CrossRef]
  13. Reiter, A.J.; Kong, S.C. Combustion and emissions characteristics of compression-ignition engine using dual ammonia-diesel fuel. Fuel 2011, 90, 87. [Google Scholar] [CrossRef]
  14. Wang, X.; Li, T.; Zhou, X.; Huang, S.; Chen, R.; Yi, P.; Lv, Y.; Wang, Y.; Rao, H.; Liu, Y.; et al. Reductions in GHG and unburned ammonia of the pilot diesel-ignited ammonia engines by diesel injection strategies. Appl. Therm. Eng. 2025, 260, 124967. [Google Scholar] [CrossRef]
  15. Zhang, Z.; Long, W.; Dong, P.; Tian, H.; Tian, J.; Li, B.; Wang, Y. Performance characteristics of a two-stroke low speed engine applying ammonia/diesel dual direct injection strategy. Fuel 2023, 332, 126086. [Google Scholar] [CrossRef]
  16. Bjørgen, K.O.P.; Emberson, D.R.; Løvås, T. Combustion of liquid ammonia and diesel in a compression ignition engine operated in high-pressure dual fuel mode. Fuel 2024, 360, 130269. [Google Scholar] [CrossRef]
  17. Li, T.; Zhou, X.; Wang, N.; Wang, X.; Chen, R.; Li, S.; Yi, P. A comparison between low- and high-pressure injection dual-fuel modes of diesel-pilot-ignition ammonia combustion engines. J. Energy Inst. 2022, 102, 362. [Google Scholar] [CrossRef]
  18. Liu, X.; Wang, Q.; Zhong, W.; Jiang, P.; Xu, M.; Guo, B. An optical investigation of the effects of diesel injection pressure and intake air temperature in an ammonia-diesel dual-fuel engine under low-load conditions. Appl. Therm. Eng. 2025, 261, 125174. [Google Scholar] [CrossRef]
  19. Azizi, Z.; Rezaeimanesh, M.; Tohidian, T.; Rahimpour, M.R. Dimethyl ether: A review of technologies and production challenges. Chem. Eng. Process. Process Intensif. 2014, 82, 150. [Google Scholar] [CrossRef]
  20. Li, Y.; Obadi, M.; Qi, Y.; Shi, J.; Liu, S.; Sun, J.; Chen, Z.; Xu, B. Extraction of Oat Lipids and Phospholipids Using Subcritical Propane and Dimethyl Ether: Experimental Data and Modeling. Eur. J. Lipid Sci. Technol. 2021, 123, 2000092. [Google Scholar] [CrossRef]
  21. Gross, C.W.; Kong, S.-C. Performance characteristics of a compression-ignition engine using direct-injection ammonia–DME mixtures. Fuel 2013, 103, 1069. [Google Scholar] [CrossRef]
  22. Ryu, K.; Zacharakis-Jutz, G.E.; Kong, S.-C. Performance characteristics of compression-ignition engine using high concentration of ammonia mixed with dimethyl ether. Appl. Energy 2014, 113, 488. [Google Scholar] [CrossRef]
  23. Leng, Y.; Dai, L.; Wang, Q.; Lu, J.; Yu, O.; Simms, N.J. Numerical Study on the Combustion and Emissions Characteristics of Liquid Ammonia Spray Ignited by Dimethyl Ether Spray. Fire 2024, 8, 14. [Google Scholar] [CrossRef]
  24. Zhang, C.; Dai, L.; Wang, Y.; Qu, X.; Chen, X.; Wang, Q. Experimental and kinetic study on O2 reduced and enriched premixed ammonia/DME flames. J. Energy Inst. 2025, 123, 102276. [Google Scholar] [CrossRef]
  25. Yin, G.; Xiao, B.; Zhao, H.; Zhan, H.; Hu, E.; Huang, Z. Jet-stirred reactor measurements and chemical kinetic study of ammonia with dimethyl ether. Fuel 2023, 341, 127542. [Google Scholar] [CrossRef]
  26. Park, S.H.; Lee, C.S. Applicability of dimethyl ether (DME) in a compression ignition engine as an alternative fuel. Energy Convers. Manag. 2014, 86, 848. [Google Scholar] [CrossRef]
  27. Lu, T.; Law, C.K. A directed relation graph method for mechanism reduction. Proc. Combust. Inst. 2005, 30, 1. [Google Scholar] [CrossRef]
  28. Niemeyer, K.E.; Sung, C.-J. On the importance of graph search algorithms for DRGEP-based mechanism reduction methods. Combust. Flame 2011, 158, 1439. [Google Scholar] [CrossRef]
  29. Han, Z.; Reitz, R.D. Turbulence Modeling of Internal Combustion Engines Using RNG κ-ε Models. Combust. Sci. Technol. 1995, 106, 267. [Google Scholar] [CrossRef]
  30. He, C.; Zhang, P.; Law, C.K. Dynamics of binary droplet collisions. Prog. Energy Combust. Sci. 2025, 111, 101252. [Google Scholar] [CrossRef]
  31. Krishnamoorthy, V.; Dhanasekaran, R.; Rana, D.; Saravanan, S.; Rajesh Kumar, B. A comparative assessment of ternary blends of three bio-alcohols with waste cooking oil and diesel for optimum emissions and performance in a CI engine using response surface methodology. Energy Convers. Manag. 2018, 156, 337. [Google Scholar] [CrossRef]
  32. O’ROurke, P.J.; Amsden, A.A. A Spray/Wall Interaction Submodel for the KIVA-3 Wall Film Model. SAE Trans. 2000, 109, 281. [Google Scholar]
  33. Schmidt, D.P.; Rutland, C.J. A New Droplet Collision Algorithm. J. Comput. Phys. 2000, 164, 62. [Google Scholar] [CrossRef]
  34. Hiroyasu, H.; Kadota, T. Models for Combustion and Formation of Nitric Oxide and Soot in Direct Injection Diesel Engines. SAE Pap. 1976, 85, 513–526. [Google Scholar] [CrossRef]
  35. Dai, L.; Ma, W.; Wang, Q.; Maas, U.; Yu, C. Numerical investigation of the effect of H2 and O2 addition on laminar counterflow flames of ammonia: A comparative study. Fuel 2025, 399, 135452. [Google Scholar] [CrossRef]
  36. Nakamura, H.; Shindo, M. Effects of radiation heat loss on laminar premixed ammonia/air flames. Proc. Combust. Inst. 2019, 37, 2. [Google Scholar] [CrossRef]
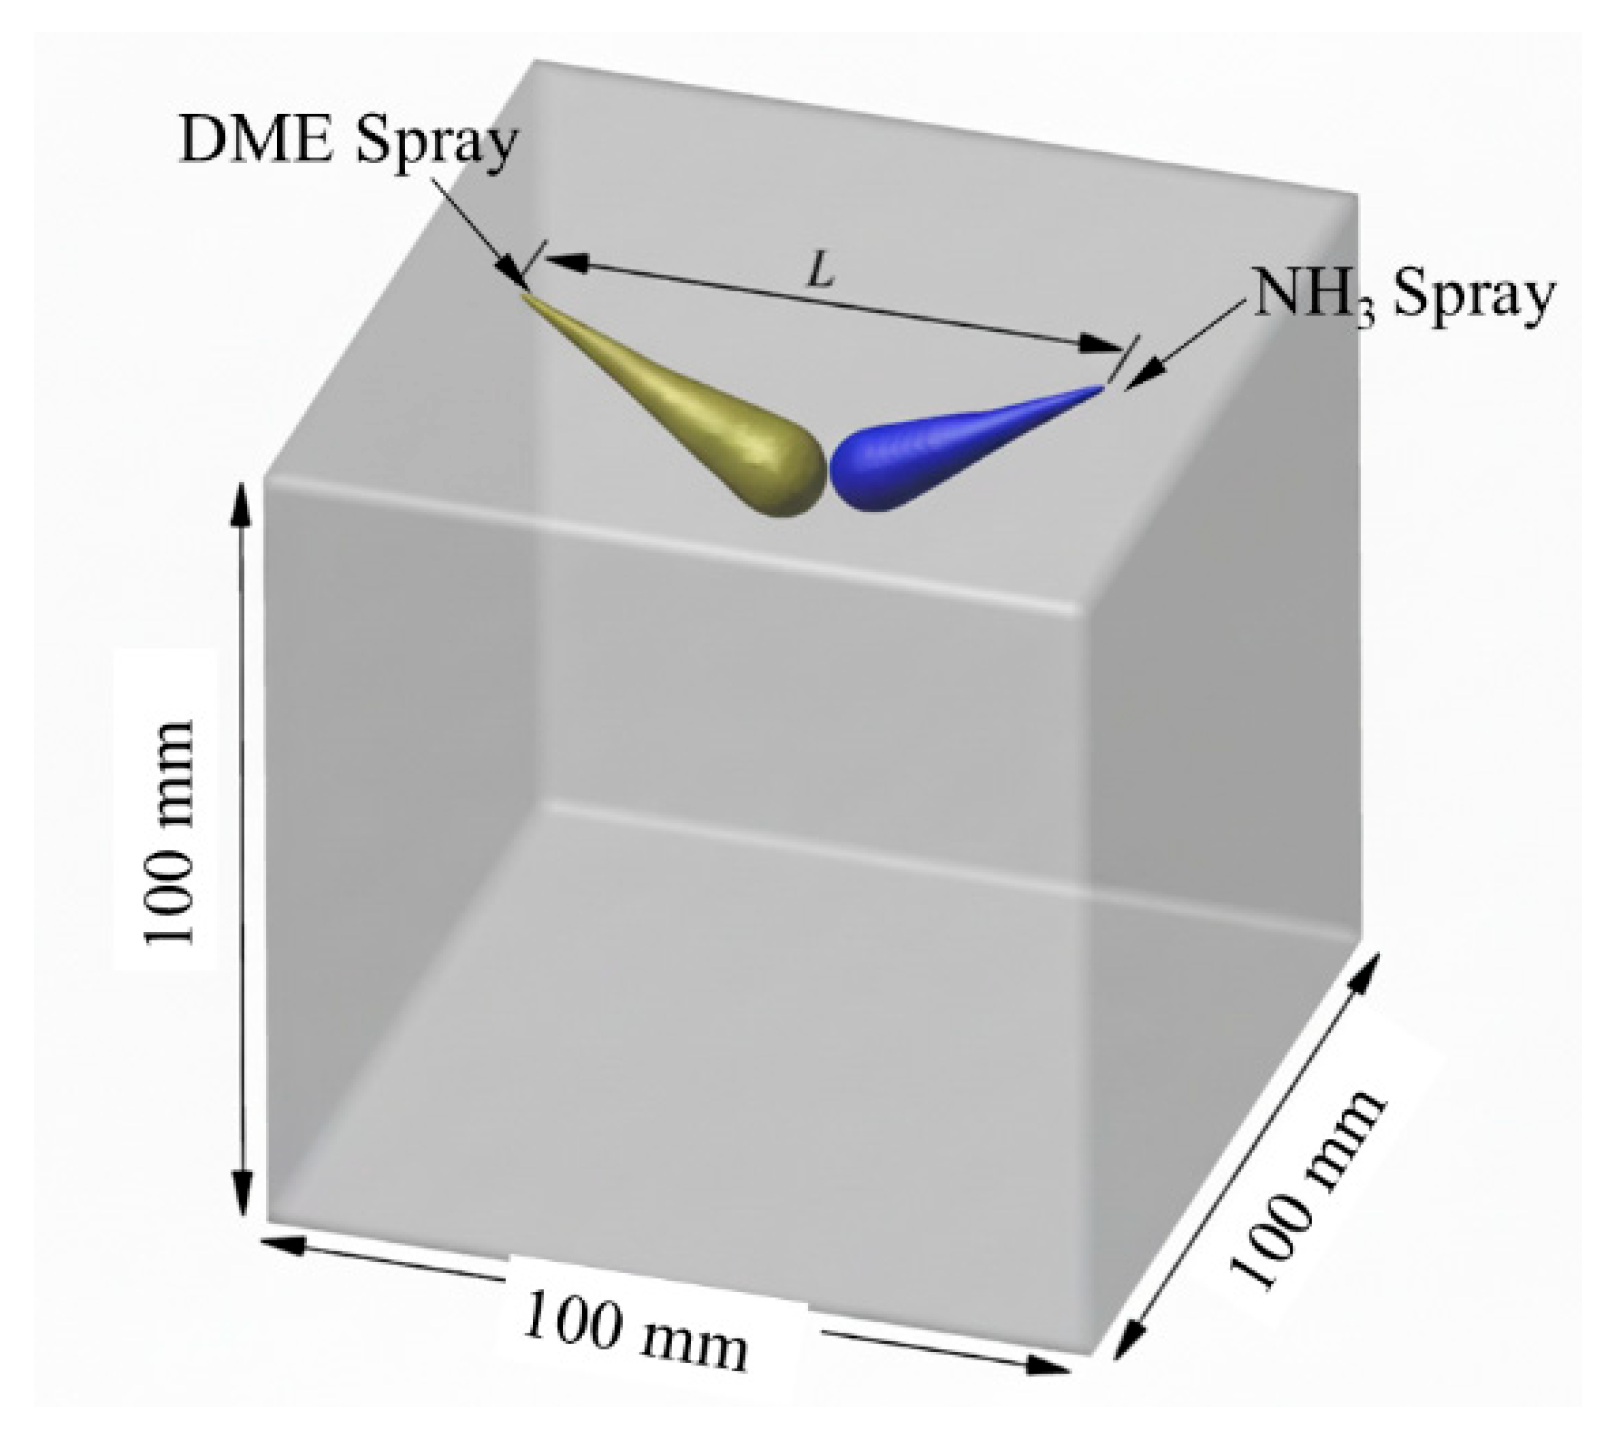
Figure 1. Geometric model and cross-sectional visualization of fuel spray.
Fire 08 00436 g001
Figure 2. Measured LBVs (dots) and calculated LBVs of NH3 with 20% DME at 298 K/1 bar with varying O2 content (a) and 373 K/473 K/5 bar (b) using air oxidizer using the full mechanism [9] (dashed lines) from and reduced mechanism (solid lines) from this study.
Fire 08 00436 g002
Figure 3. Measured (from Dai et al. [9]) and calculated IDTs using the full mechanism [9] (dashed lines) from and reduced mechanism (solid lines) from this study at φ = 1.0, Pc = 60 bar for pure NH3 (a), NH3 with 2% DME (b), NH3 with 5% DME (c) and pure DME (d).
Fire 08 00436 g003
Figure 4. Measured NO concentration (symbols) from [25] and simulated (lines) NO mole fraction profiles of NH3 with 50% DME using the mechanism from this study under different equivalence ratios at 1 atm.
Fire 08 00436 g004
Figure 5. Temperature contour and DME/NH3 distribution at AER = 80% and ambient temperature of 900 K (a), 1000 K (b) and 1100 K (c).
Fire 08 00436 g005
Figure 6. Calculated IDTs of pure NH3 and NH3 with 20% DME at 3.8 MPa using 0-D homogeneous ignition model.
Fire 08 00436 g006
Figure 7. Ammonia combustion efficiency at AER = 80% and ambient temperature of 900 K, 1000 K and 1100 K.
Fire 08 00436 g007
Figure 8. NO, NO2, N2O and CO mass fractions at AER = 80% and ambient temperature of 900 K (a), 1000 K (b) and 1100 K (c).
Fire 08 00436 g008aFire 08 00436 g008b
Figure 9. Net NO, NO2, N2O and CO emission as a function of time at AER = 80% and ambient temperature of 900 K, 1000 K and 1100 K.
Fire 08 00436 g009
Figure 10. Flame temperature, DME, NH3, NO, NO2, N2O and CO distribution at Tamb = 1100 K and (a) AER = 60%, (b) AER = 90% and (c) HNO distribution with AER = 60% (upper), 80% (middle) and 90% (bottom).
Fire 08 00436 g010aFire 08 00436 g010b
Figure 11. Ammonia combustion efficiency at Tamb = 1100 K and AER of 60%, 80% and 90%.
Fire 08 00436 g011
Figure 12. Net NO, NO2, N2O and CO emission as a function of time at Tamb = 1100 K with varying AERs.
Fire 08 00436 g012
Figure 13. Flame temperature, DME, NH3, NO, NO2, N2O and CO distribution with varying SOI of DME at Tamb = 1100 K and AER = 80%.
Fire 08 00436 g013aFire 08 00436 g013bFire 08 00436 g013cFire 08 00436 g013d
Figure 14. Net NO, NO2, N2O and CO emission as a function of time at Tamb = 1100 K and AER = 80% with varying SOI of DME.
Fire 08 00436 g014
Figure 15. Ammonia combustion efficiency at Tamb = 1100 K and AER of 80% at different SOIs of DME.
Fire 08 00436 g015
Table 1. Comparison of properties between liquid ammonia [17], DME [26] and diesel [27].
ParameterAmmoniaDMEDiesel
Boiling point/K239.8358450–643 K
Autoignition temperature/K924623226–233
Octane number130--
Cetane number-55–6040–55
Lower heating value/(MJ/kg) 18.828.4343.5
Latent heat of vaporization/(KJ/kg)1.37460270
Laminar burning velocity/(m/s)0.070.54-
Table 2. Combustion chamber parameters and simulation schemes.
ParameterValue
Chamber size/mm100 × 100 × 100
Ambient temperature/K900, 1000, 1100
Ambient gasAir
Injector distance/cm7.0
DME injection pressure/MPa75
Ammonia Nozzle diameter/mm0.22
DME Nozzle diameter/mm0.18
Ammonia injection mass/mg18.15
DME injection mass/mg3
Nozzle angle/°120
NH3 injection pressure/MPa75
AER/%60, 80, 90, 95
SOI of DME/ms−1, 0.5, 0, 0.5, 1
Ambient pressure/MPa3.8
Table 3. Parameter settings for DME and liquid ammonia KH-RT models.
ParameterValue
B1 of DME11
B1 of NH38
B00.61
Cτ1
CRT0.1
Disclaimer/Publisher’s Note: The statements, opinions and data contained in all publications are solely those of the individual author(s) and contributor(s) and not of MDPI and/or the editor(s). MDPI and/or the editor(s) disclaim responsibility for any injury to people or property resulting from any ideas, methods, instructions or products referred to in the content.