5.2.1. Spectral Signature
Sensitivity analysis of the ISODATA clustering outputs was conducted to determine the most stable and spectrally distinct configuration for both pre- and post-fire classifications. For both pre- and post-fire, the ISODATA classification model selected after sensitivity analysis had the final clustering parameters as follows:
Number of clusters: 20
Minimum class size: 30 pixels
Maximum allowable standard deviation within class: 0.05
Merge distance threshold: 0.03 (Euclidean distance)
For the pre-fire classification, the between-class spectral variance was 0.0006, and no class exceeded a within-class spectral variance of 0.0002. These clustering settings resulted in compact, well-separated classes suitable for ecological interpretation and temporal change detection.
The ISODATA classification produced five distinct classes in pre-fire and post-fire images. The classes were matched with each other by calculating Euclidean distance which are illustrated in
Table 8.
The Euclidean distance analysis was conducted to assess the similarity between pre-fire and post-fire classes. The results revealed that four post-fire classes exhibited strong spectral similarity to pre-fire counterparts, indicating potential persistence or partial recovery of certain vegetation types. Conversely, Class A in the post-fire classification appeared as a newly emerged spectral group, distinct from any pre-fire class. This suggests the emergence of a novel surface condition or vegetation type, likely attributable to fire-induced ecological transformation.
The specific class correspondences derived from the Euclidean distance matrix are detailed in
Table 9, which outlines the optimal pairings between pre-fire and post-fire classes based on minimum spectral distance.
The pre-fire classes were named and guided by the 2016 LANDFIRE EVT vegetation dataset. The resulting five pre-fire classes were mapped to vegetation types, as summarized in
Table 10.
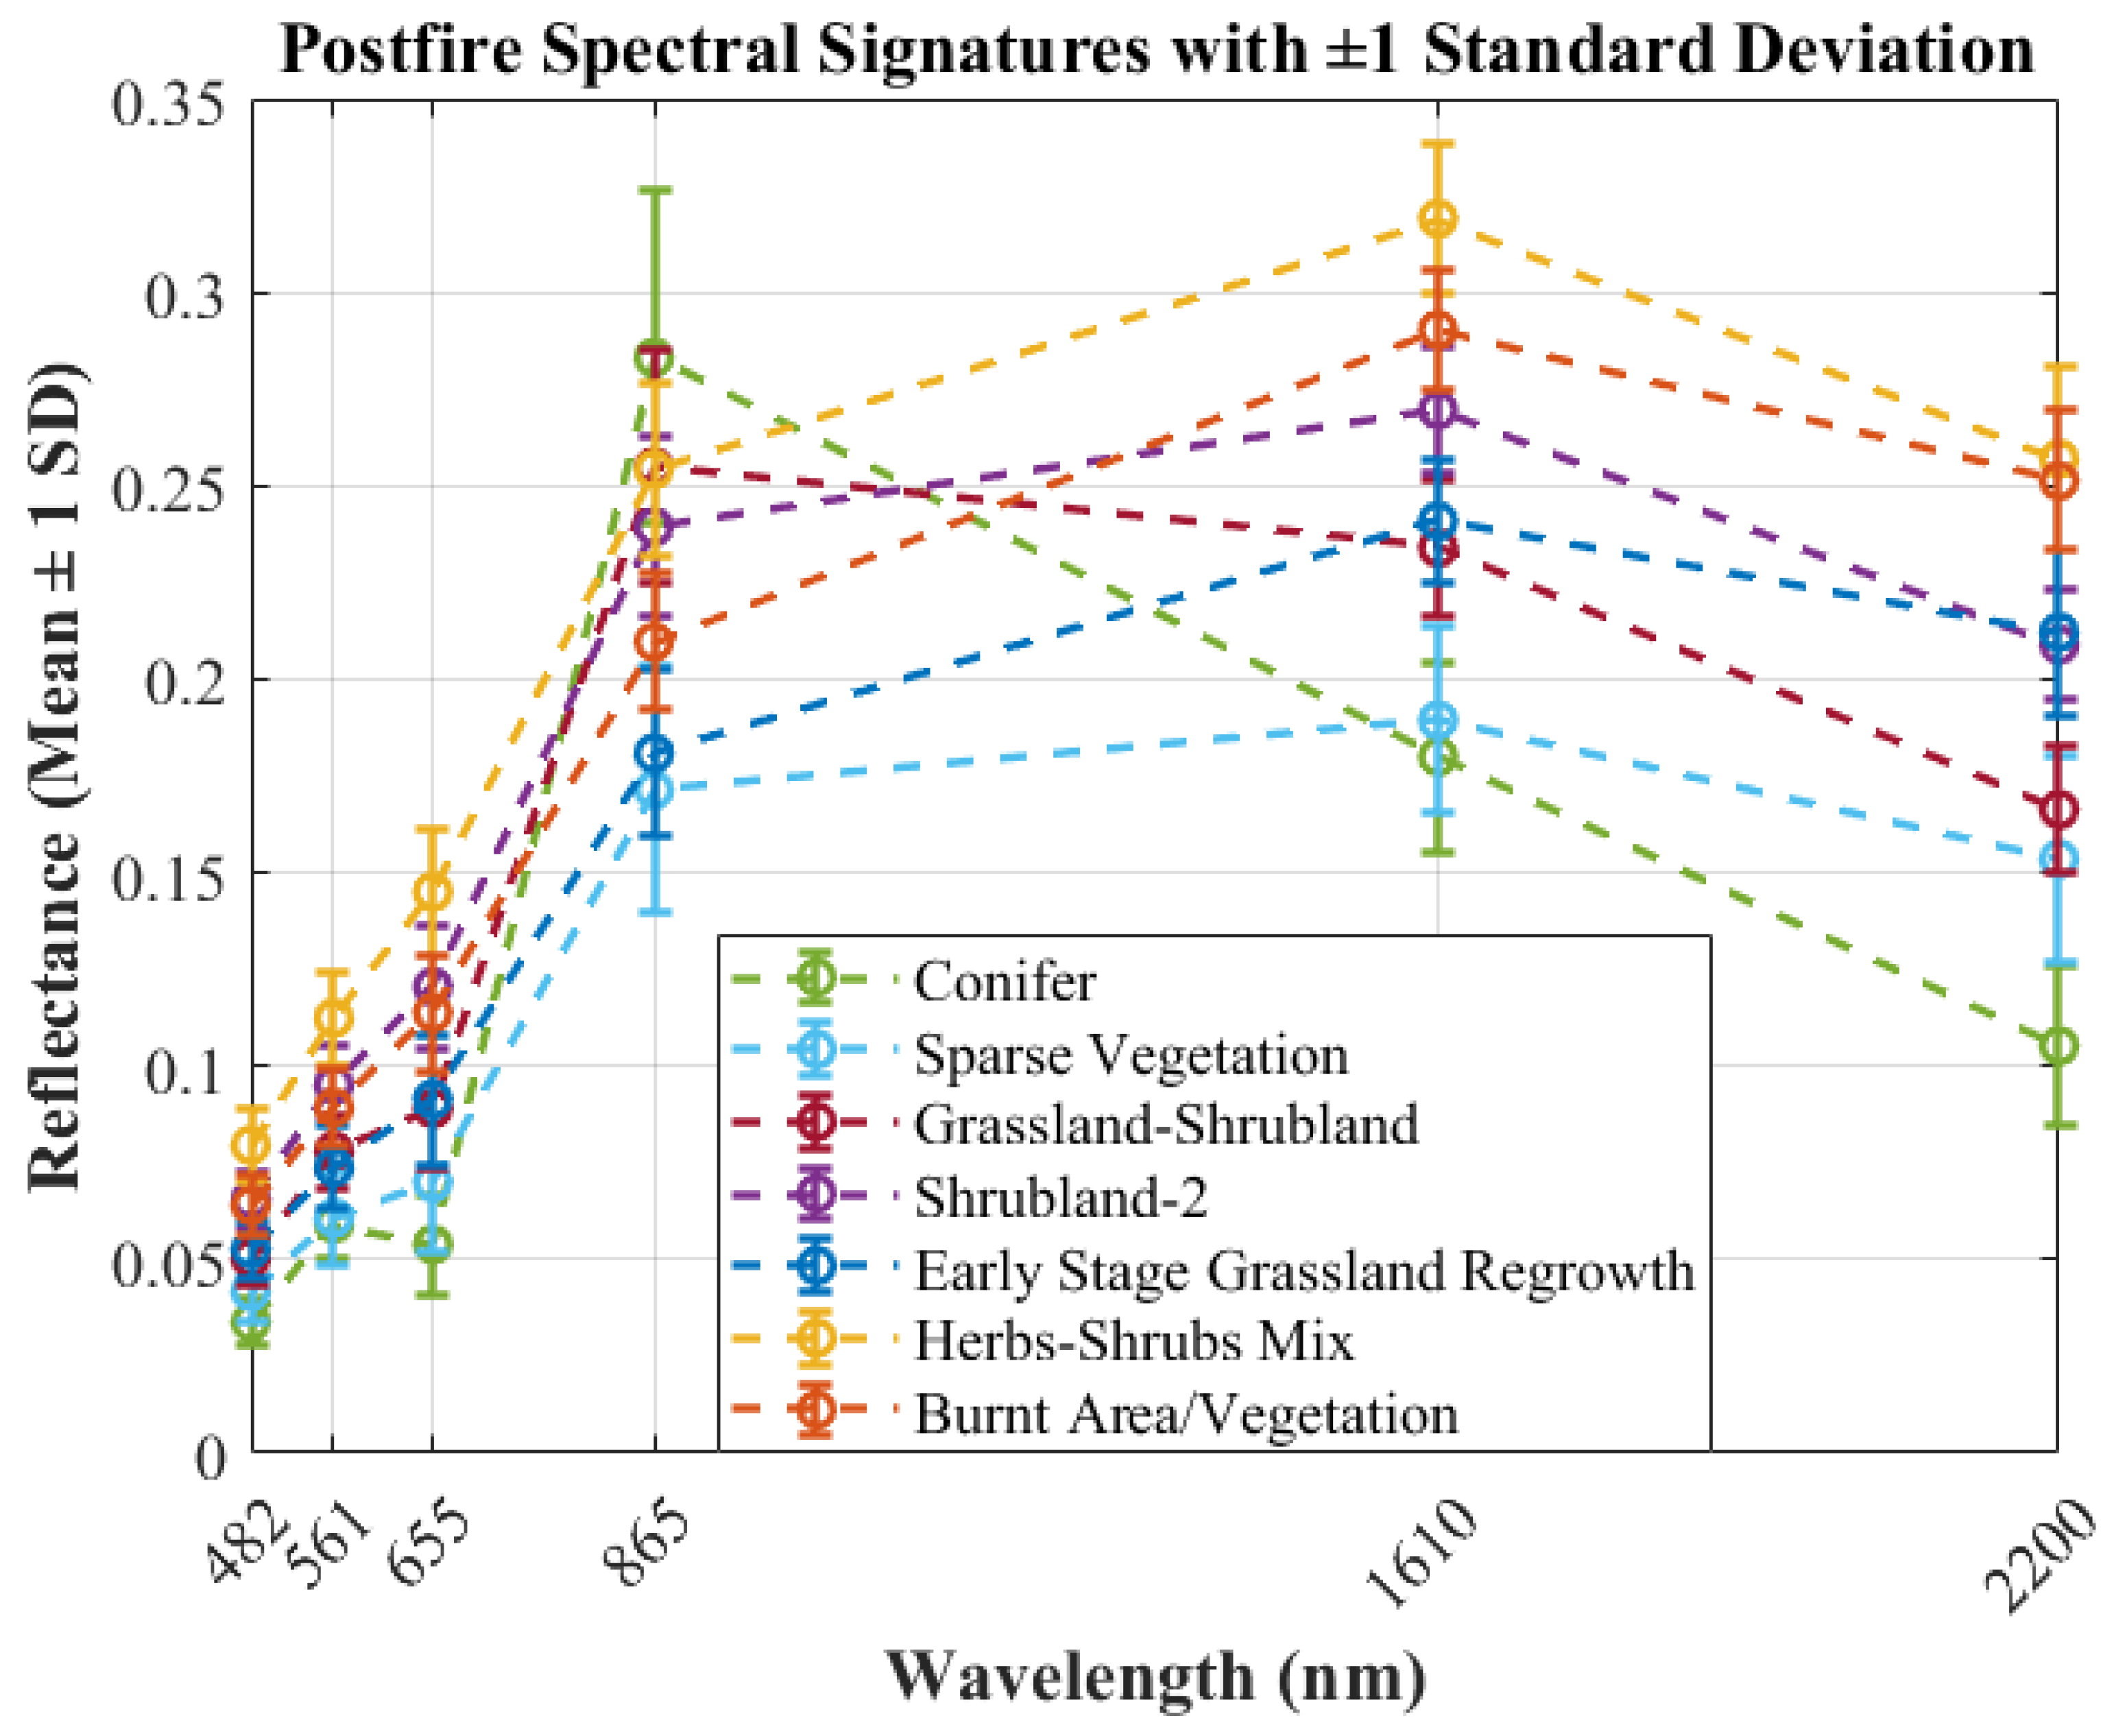
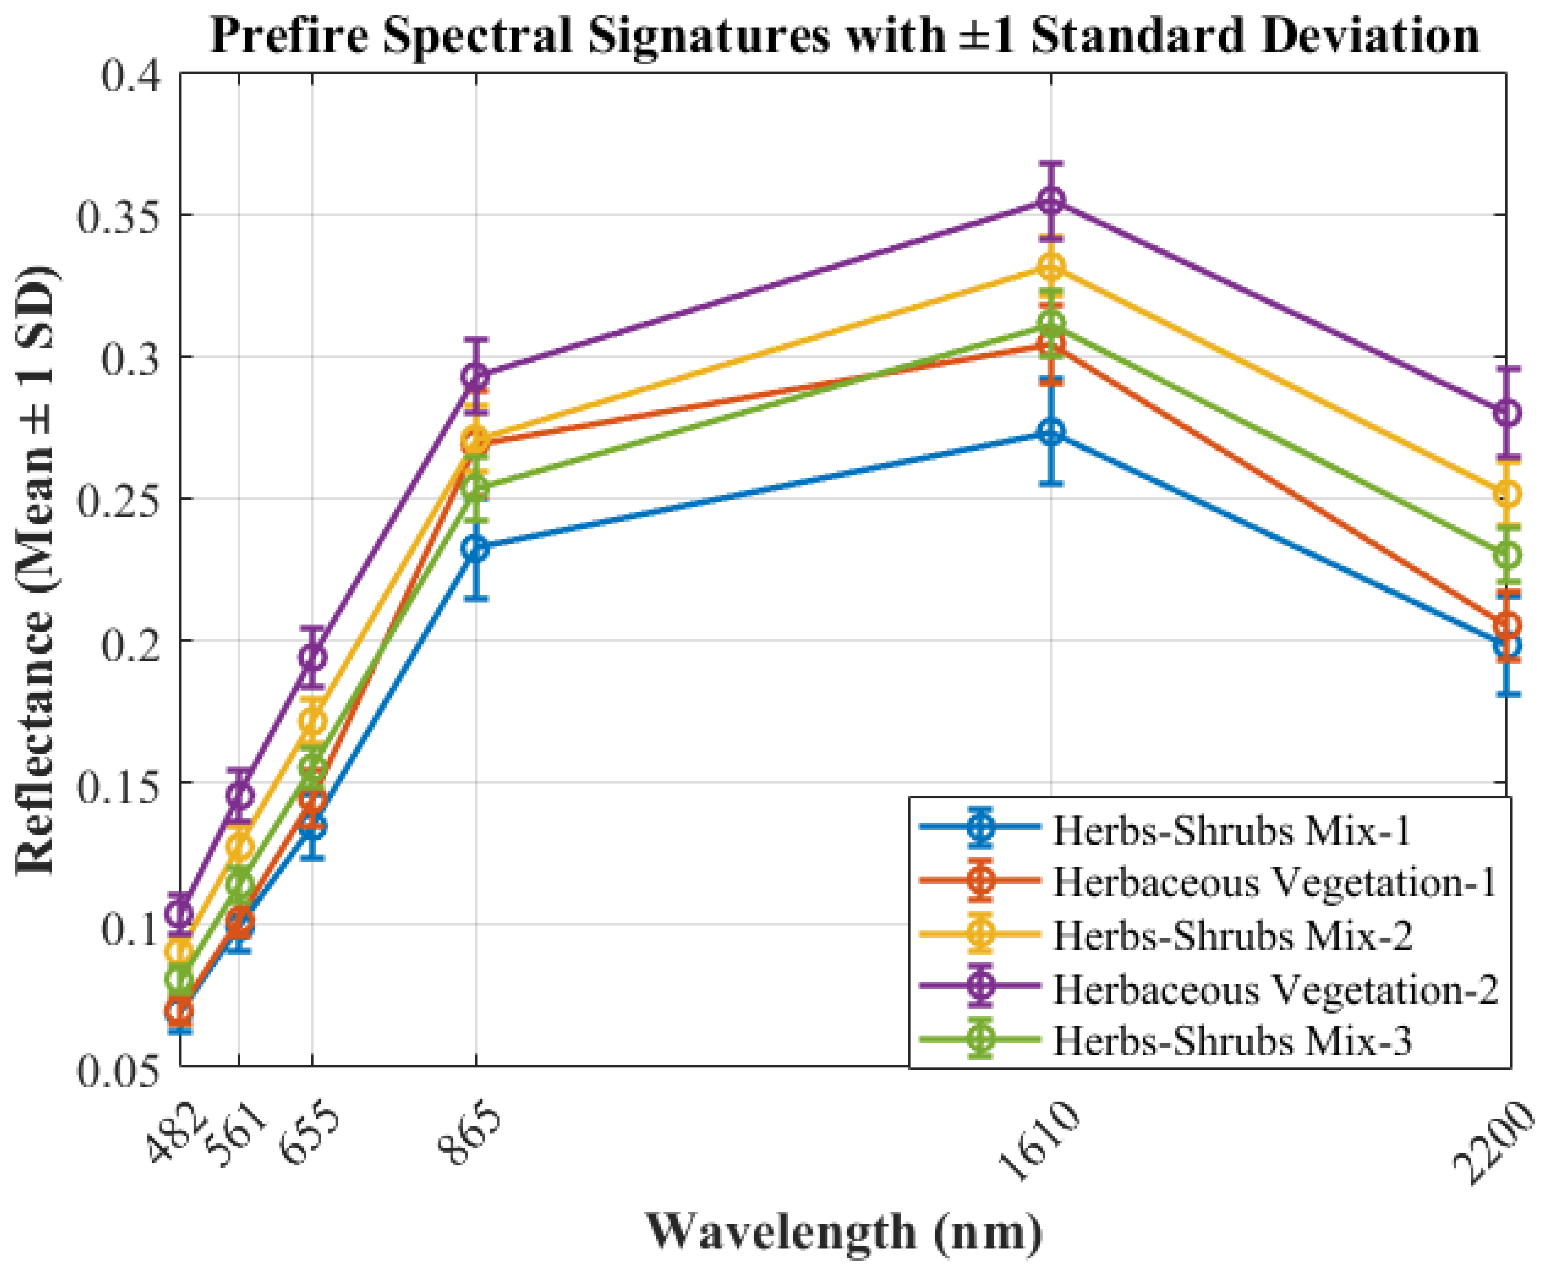
The mean spectral signatures of these classes are illustrated in
Figure 7 and
Figure 8, corresponding to pre-fire and post-fire conditions, respectively. The pre-fire spectral profiles exhibited distinct patterns across the six Landsat bands. Herbaceous Vegetation-2 consistently showed the highest reflectance across all wavelengths, peaking near 0.36 at 1610 nm (SWIR1). This suggests a class dominated by mature vegetation. Herbs-Shrubs Mix-2 and Herbs-Shrubs Mix-3 followed with moderate to high reflectance, particularly in the NIR and SWIR1 bands (>0.30), indicating healthy vegetation cover with moderate canopy density. In contrast, Herbs-Shrubs Mix-1 had the lowest reflectance, with a peak around 0.27 at SWIR1 and reduced values in NIR and SWIR2 bands, possibly representing sparse vegetation, patchy grasslands, or soil-influenced pixels.
The ±1σ analysis of pre-fire (
Figure 7 and
Table 11) shows that although Herbaceous Vegetation-2 overlaps partially with Herbs-Shrubs Mix-2 and Herbs-Shrubs Mix-3 in the visible bands, it maintains a distinct separation in the NIR and SWIR1 bands. This clear separation, especially in SWIR1, ensures reliable classification of Herbaceous Vegetation-2 despite moderate overlap elsewhere. Similarly, Herbs-Shrubs Mix-1, although overlapping in visible bands with Herbaceous Vegetation-1 and Herbs-Shrubs Mix-3, retains distinctiveness in SWIR2, which can serve as a key differentiator.
A moderate overlap was noted between Herbaceous Vegetation-1 and Herbs-Shrubs Mix-1 across most bands, but their NIR and SWIR1 ranges remained partially distinct, offering a narrow but usable window for class separation. Overall, despite overlaps in the visible spectrum, all classes displayed at least one band, typically NIR or SWIR1, where clear separation was evident, minimizing the risk of misclassification.
In the post-fire spectral profiles, Sparse Vegetation (formerly referred to as Class A) appeared as a new class not observed in the pre-fire landscape. This class exhibited moderate reflectance across all bands, following a typical vegetation spectral pattern with a rise in the NIR and a peak at SWIR1 (1610 nm), though with slightly lower magnitude compared to other vegetated classes. Reflectance values in the NIR and SWIR2 bands suggested low canopy density or reduced biomass. Given the ecological context of the area, which is dominated by herbaceous plants and shrubs, Sparse Vegetation class likely represents the naturally sparse vegetation cover or early-stage regrowth, consisting of recovering herbs and low shrubs that have started to recolonize the fire-affected terrain. The pre-fire Classes 1 and 2 transitioned into post-fire Class C, which was named Herbs-Shrubs Combined.
The ±1σ ranges of post-fire (
Figure 8 and
Table 12) show that Sparse Vegetation overlaps with Herbaceous Vegetation-1 and Herbs-Shrubs Mix-2 in the visible and NIR bands. However, it remains clearly distinct in SWIR1, ensuring reliable classification despite initial overlap.
Herbaceous Vegetation-2 maintained the highest reflectance. With values exceeding 0.35 in SWIR1, it did not overlap with Sparse Vegetation or Herbs-Shrubs Mix-3, confirming strong separability. Herbs-Shrubs Combined and Herbs-Shrubs Mix-3 showed moderate overlap in NIR and SWIR bands, but Herbs-Shrubs Mix-3 maintained a slightly elevated SWIR2, which provides a subtle yet useful separation marker.
Notably, increases in reflectance were observed for post-fire Herbaceous Vegetation-2, particularly in NIR and SWIR1, indicating possible vegetation regrowth or improved surface exposure. This upward trend post-fire may reflect early successional vegetation colonization in partially affected zones. The overlap analysis supports that while many classes show significant convergence in the visible and NIR regions, all retain at least one distinct band (usually SWIR1 or SWIR2) where separation is assured, mitigating the risk of confusion by the classifier.
5.2.2. Vegetation Classification
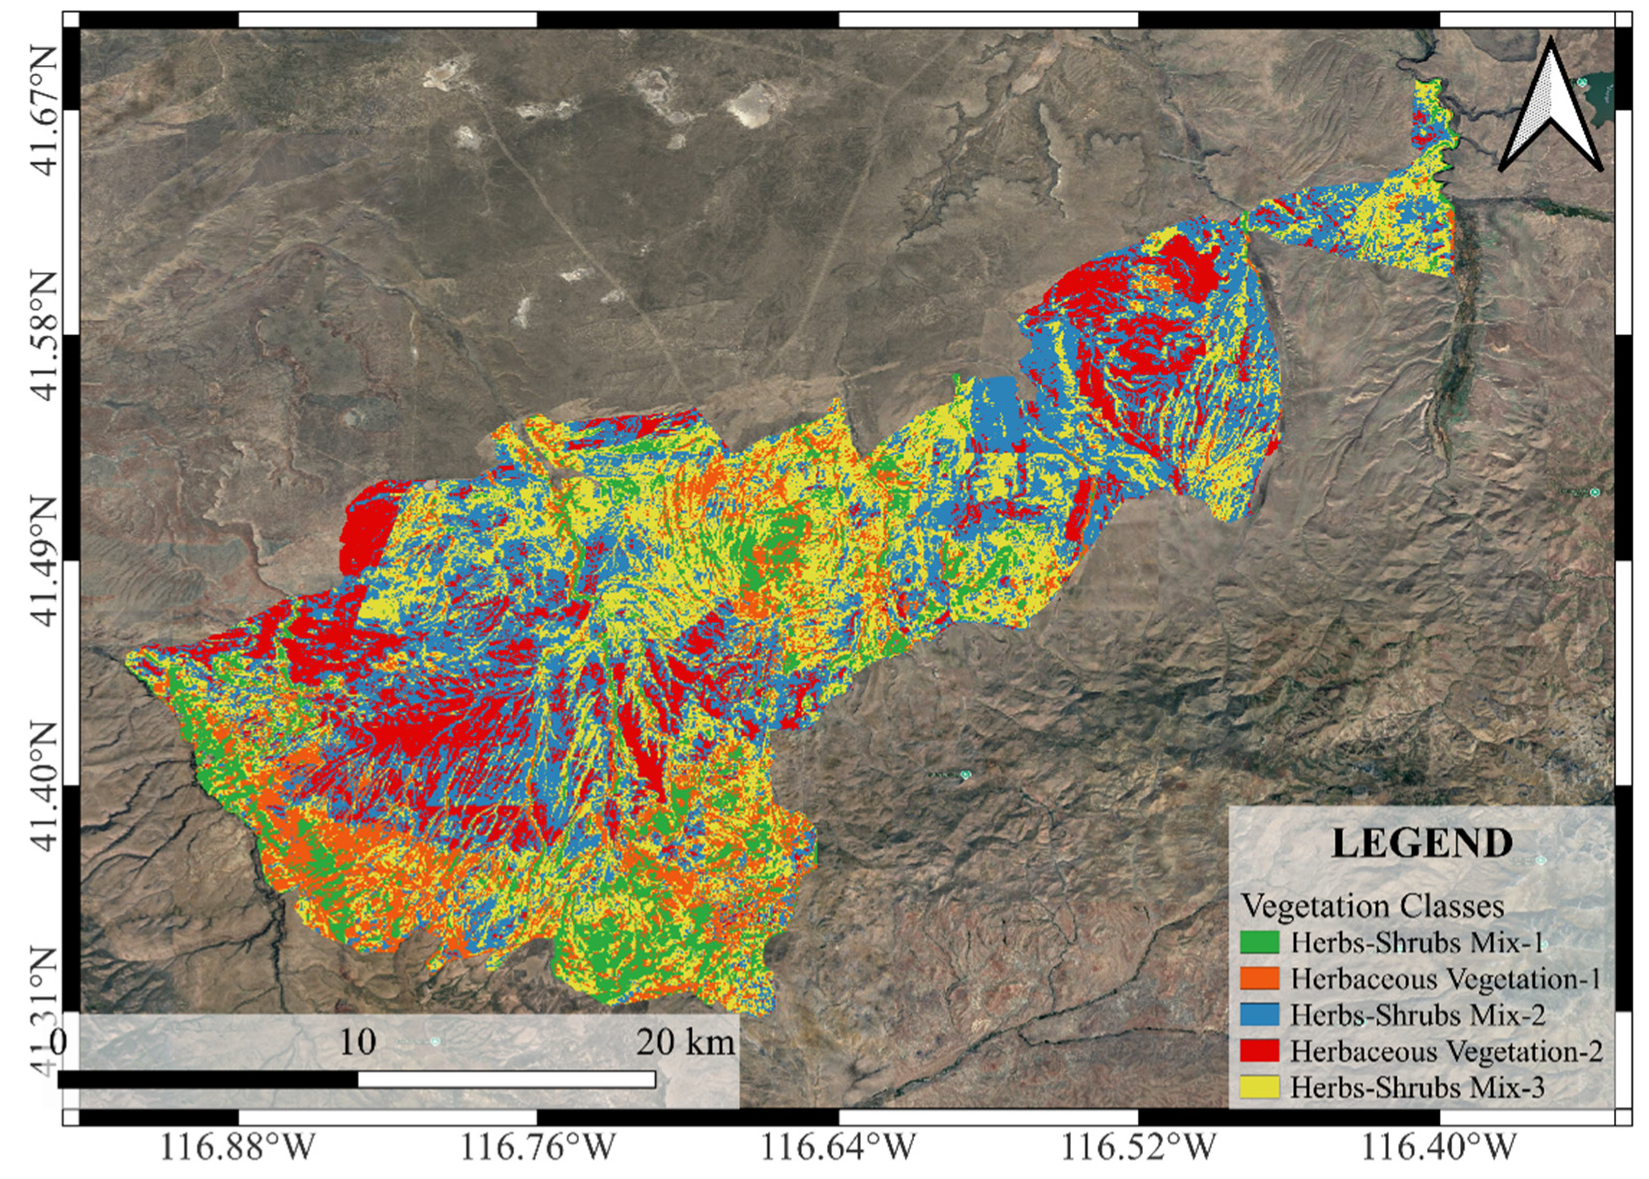
The spatial distribution of classes exhibited notable shifts between the pre-fire and post-fire periods for the Snowstorm Fire. In the pre-fire image, Herbs-Shrubs Mix-2 accounted for the largest area, comprising 32.85% of the landscape. This was followed by Herbs-Shrubs Mix-3 (28.33%), Herbaceous Vegetation-2 (15.51%), and Herbaceous Vegetation-1 (12.93%), while Herbs-Shrubs Mix-1 covered 10.37% of the area.
Following the fire, Herbs-Shrubs Mix-2 increased to become the most dominant class, occupying 34.54% of the landscape. Herbs-Shrubs Mix-3 also expanded slightly to 27.40% and Herbaceous Vegetation-2 grew to 18.96%. In contrast, Herbs-Shrubs Mix-1 and Herbaceous Vegetation-1 were substantially reduced in area. Additionally, two new post-fire classes emerged: Sparse Vegetation, which covered 4.72%, and Herbs-Shrubs Combined, representing 14.38% of the post-fire landscape.
Spatially, transitions were concentrated in the central and northern portions of the burn area, where patches of Herbs-Shrubs Mix-1 and Herbaceous Vegetation-1 were largely replaced by Herbs-Shrubs Combined and Sparse Vegetation. Southern portions of the fire also showed notable conversions from Herbaceous Vegetation-2 into Herbs-Shrubs Mix-2 and Herbs-Shrubs Mix-3.
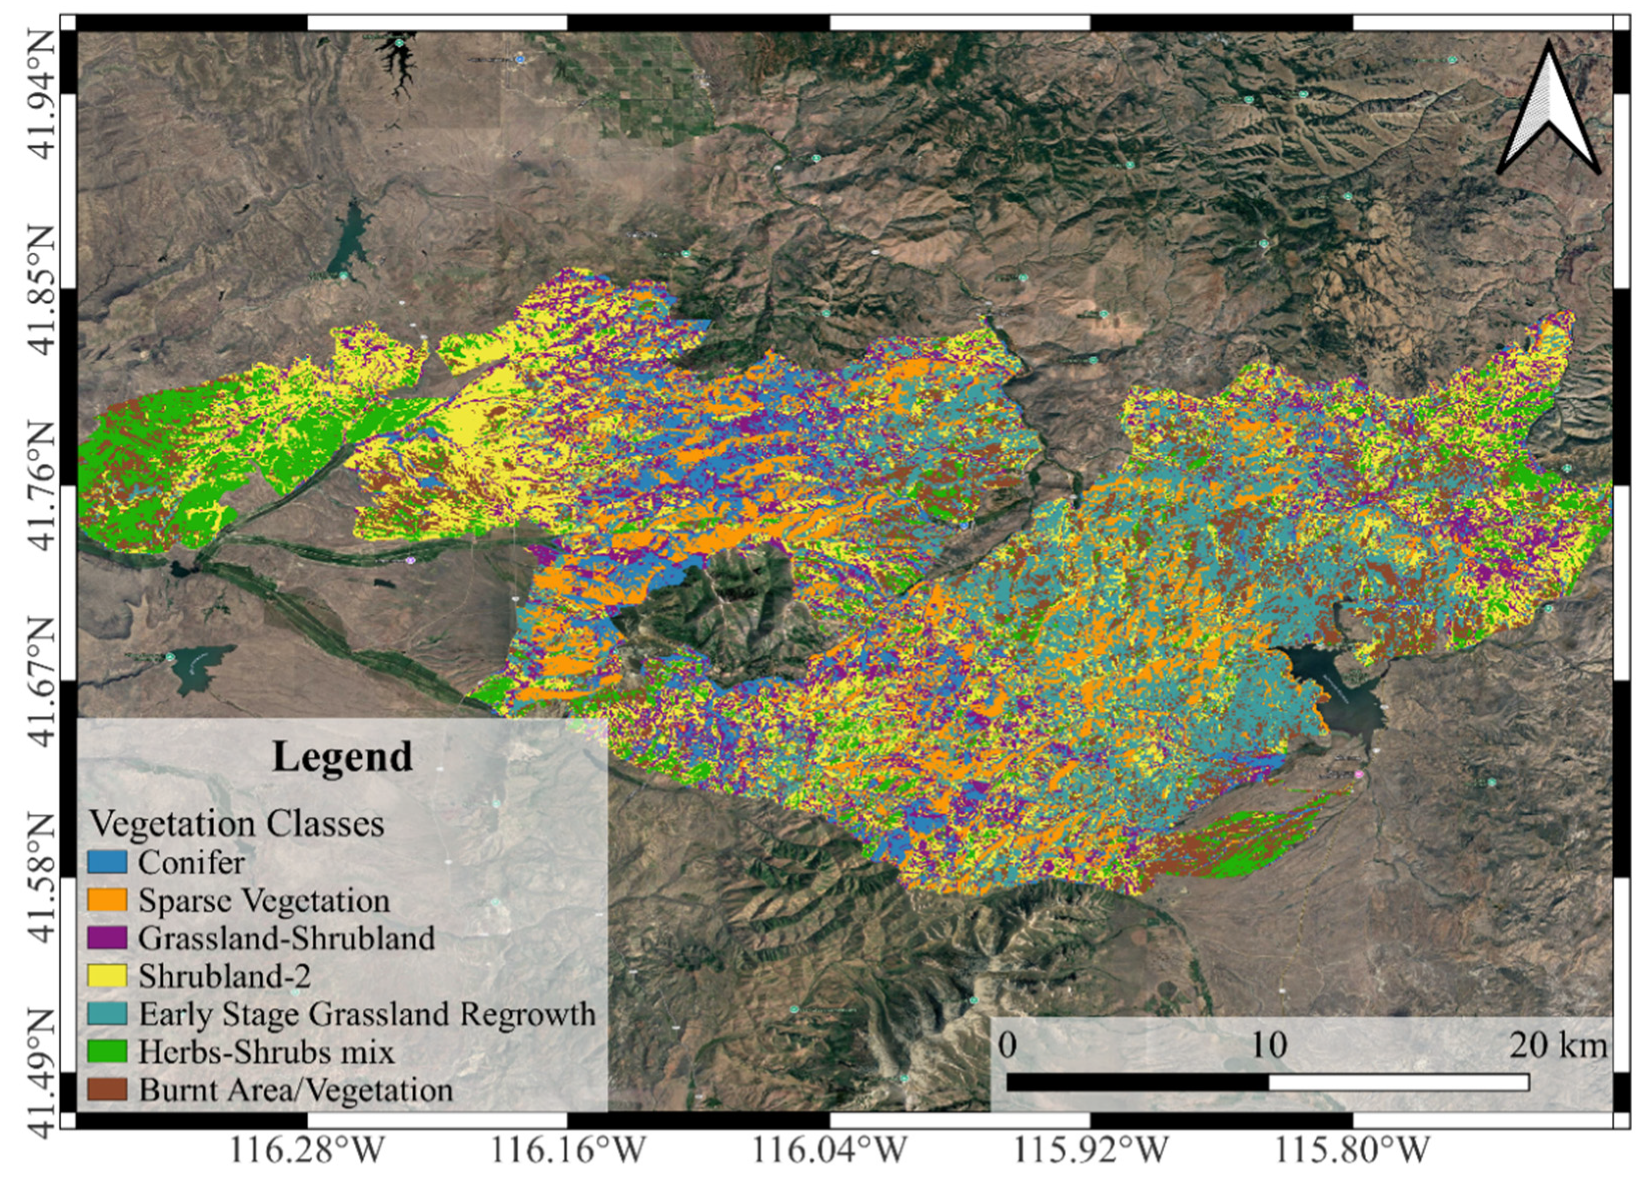
Figure 9 and
Figure 10 show the spatial distribution of pre-fire and post-fire classes.
5.2.3. Accuracy Assessment
To evaluate the reliability of the unsupervised classification, confusion matrices were constructed for both the pre-fire and post-fire ISODATA outputs by comparing each classified pixel with the corresponding vegetation type from the LANDFIRE Existing Vegetation Type (EVT) product. Given that multiple ISODATA classes often corresponded to a single ecological class, and that many-to-one relationships are not compatible with confusion matrix structures, the LANDFIRE vegetation categories were aggregated into broader ecological groups. Two generalized classes, namely Herbaceous System and Grassland–Shrubland Mosaic, were used to enable consistent alignment between the unsupervised spectral classes and mapped vegetation types.
For the pre-fire classification, the confusion matrix showed an overall accuracy of 70.91%. The Grassland–Shrubland Mosaic class exhibited strong agreement between the classified output and reference data, with a producer accuracy of 0.7875 and user accuracy of 0.8608. In contrast, the Herbaceous System class showed lower agreement, with a producer accuracy of 0.2429 and user accuracy of 0.1613, indicating notable misclassification in this category.
Similarly, the post-fire classification resulted in an overall accuracy of 70.18%, suggesting consistent performance across time periods. The Grassland–Shrubland Mosaic class maintained high producer and user accuracies of 0.7885 and 0.8461, respectively. The Herbaceous System class again showed limited accuracy, with a producer accuracy of 0.2454 and user accuracy of 0.1808.
These results indicate that the classification process was more effective at capturing the spectral patterns associated with the dominant Grassland–Shrubland mosaic, while herbaceous-dominated areas were more likely to be misclassified. This discrepancy may reflect spectral overlaps, spatial intermixing of vegetation types, or post-fire substrate effects such as ash and bare soil, which can obscure vegetation signals. The use of generalized vegetation categories introduces some simplification but was necessary to ensure compatibility between the unsupervised classification and available reference data.
5.2.4. Class Stability and Change Detection
The change detection matrix revealed major class redistributions. Of the 6490.81 ha originally classified as Herbs-Shrubs Mix-1, 2081.44 ha transitioned into sparse vegetation, while 2891.34 ha transitioned into Herbs-Shrubs Combined and 1080 ha into Herbs-Shrubs Mix-3. Herbaceous Vegetation-1 (8094.43 ha) had significant transitions to Herbs-Shrubs Combined (3768.67 ha), Herbs-Shrubs Mix-3 (2876.31 ha), and Herbs-Shrubs Mix-2 (589.32 ha). Most Herbs-Shrubs Mix-2 (20,543.5 ha) remained stable in post-fire (10,714 ha), while the remainder transitioned into Herbs-Shrubs Mix-3 (4335.57 ha), and Herbaceous Vegetation-2 (5099.58 ha), with only 27.36 ha converted to Sparse Vegetation. Herbaceous Vegetation-2 (9697.5 ha) 4820.32 ha remained, with notable shifts into Herbs-Shrubs Mix-2 (4243.95 ha) and Herbs-Shrubs Mix-3 (581.85 ha). Herbs-Shrubs Mix-3 (17,720.2 ha) persisted as 8260.75 ha and contributed 1929.69 ha to Herbs-Shrubs Combined and 5834.79 ha to Herbaceous Vegetation-2. The change detection matrix is shown in
Table 13.
Stability analysis revealed relatively high persistence among all five pre-fire vegetation classes. Herbs-Shrubs Mix-2 exhibited the highest stability, with 52.2% of its original pixels retaining the same classification post-fire. This was followed by Herbaceous Vegetation-2 (49.6%), Herbs-Shrubs Mix-3 (46.6%), and Herbaceous Vegetation-1 (46.5%). Herbs-Shrubs Mix-1 also showed relatively strong persistence with a stability value of 44.6%. The stability Matrix is shown in
Table 14.
These results highlight significant vegetation reorganization across the Snowstorm Fire landscape, with dominant pre-fire classes largely transitioning into Herbs-Shrubs Mix-2, Herbs-Shrubs Mix-3, and the newly formed Herbs-Shrubs Combined. The emergence of Sparse Vegetation also points to possible areas of reduced vegetation cover post-fire.
